banana import export global stats
TRANSCRIPT

8102019 Banana Import Export Global Stats
httpslidepdfcomreaderfullbanana-import-export-global-stats 139
BANANA MARKET REVIEW
and
BANANA
STATISTICS20129830852013
Intergovernmental Group on Bananas
and Tropical Fruits
8102019 Banana Import Export Global Stats
httpslidepdfcomreaderfullbanana-import-export-global-stats 239
Banana Market Review
and
Banana Statistics 2012-2013
Market and Policy Analyses of Raw Materials
Horticulture and Tropical (RAMHOT) Products Team
FOOD AND AGRICULURE ORGANIZAION OF HE UNIED NAIONSRome 2014
8102019 Banana Import Export Global Stats
httpslidepdfcomreaderfullbanana-import-export-global-stats 339
Te designations employed and the presentation of material in this informationproduct do not imply the expression of any opinion whatsoever on the part of theFood and Agriculture Organization of the United Nations (FAO) concerning thelegal or development status of any country territory city or area or of its authoritiesor concerning the delimitation of its frontiers or boundaries Te mention of specificcompanies or products of manufacturers whether or not these have been patenteddoes not imply that these have been endorsed or recommended by FAO in preference toothers of a similar nature that are not mentioned
Te views expressed in this information product are those of the author(s) and do notnecessarily reflect the views or policies of FAO
FAO encourages the use reproduction and dissemination of material in this informationproduct Except where otherwise indicated material may be copied downloaded andprinted for private study research and teaching purposes or for use in non-commercialproducts or services provided that appropriate acknowledgement of FAO as the sourceand copyright holder is given and that FAOrsquos endorsement of usersrsquo views products orservices is not implied in any way
All requests for translation and adaptation rights and for resale and other commercialuse rights should be made via wwwfaoorgcontact-uslicence-request or addressed to
copyrightfaoorg
FAO information products are available on the FAO website (wwwfaoorgpublications)and can be purchased through publications-salesfaoorg
copy FAO 2014
Cover photographscopyFAOSimon MainacopyFAOAntonello Proto
8102019 Banana Import Export Global Stats
httpslidepdfcomreaderfullbanana-import-export-global-stats 439iii
Contents
FOREWORD iv
BANANA MARKE REVIEW 20129830852013 1 - 10
1 Developments in banana trade Exports Imports
2 Banana prices Import prices
Wholesale and retail prices
3 Policy developments
4 Current situation and short-term outlook
SAISICAL ABLES 11 - 33
able 1 - World gross exports by country able 2 - World net imports by country able 3 - EC otal supply of bananas and per capita supply able 4 - Per capita net imports by country able 5 - Exports by countries of destinationable 6 - Gross Imports by countries of originable 7 - Import prices in selected countries monthly able 8 - Wholesalersrsquo selling prices in selected countries monthly able 9 - Retail prices in selected countries monthly
8102019 Banana Import Export Global Stats
httpslidepdfcomreaderfullbanana-import-export-global-stats 539iv
foreword
Tis report is issued on an annual basis to Members and Observers o the Sub-Group onBananas o the Intergovernmental Group on Bananas and ropical Fruits
It is prepared by the Market and Policy Analyses of Raw Materials Horticulture andTropical (RAMHOT) Products Team rade and Market Division FAO Rome and thetables contained bring together the inormation available to FAO supplemented by dataobtained rom other sources in particular with regard to preliminary estimates
Te Market and Policy Analyses of Raw Materials Horticulture and Tropical (RAMHOT)Products Team provides economic data and analyses on major agricultural raw materialsand horticultural and tropical products Commodities covered under the eam includebananas and tropical fruits citrus fruits cotton hides and skins jute kenaf and alliedfibres sugar and tea Te eam also undertakes market reviews outlook appraisals and
projections and provides assistance to developing countries in designing and implementingnational policies or those agricultural commodities which enter into international trade
Te report is available at the ollowing FAO websitehttpwwwaoorgeconomicestest-commoditiesbananasen
8102019 Banana Import Export Global Stats
httpslidepdfcomreaderfullbanana-import-export-global-stats 6391
Banana market review 2012-2013
1 Developments in banana trade
Exports
In 20121 the volume o global gross banana exports reached a record high o 165million tonnes 11 million tonnes (or 73 percent) above 2011 level Te increase isprimarily explained by the growth o exports rom Latin America and the Caribbeanrom 125 to 130 million tonnes despite the poor perormance o Ecuador InEcuador the largest banana exporter in the world banana exports shrank as floodingdamaged the crop reducing the output by 416 000 tonnes or 56 percent relativeto 2011 Te resulting 410 000 tonnes decline in shipments rom Ecuador was morethan offset by vigorous exports rom other countries in particular those in CentralAmerica
Data or 2012 show a remarkable shif rom exports originating in South America towards greater exports rom Central America and Mexico While exports romSouth America declined by 64 percent relative to 2011 Central America and Mexicoexpanded their combined export volumes by 221 percent possibly in anticipation otrade preerences or Central American bananas in the European market as part othe Association Agreement As a result the average share o South America in global
banana exports has declined rom 502 percent in 2007-2011 to 436 percent in 2012while the share o Central America and Mexico increased rom 294 percent to 334percent
Costa Ricarsquos export quantity reached 21 million tonnes in 2012 126 000 tonneshigher than in 2011 overtaking Colombia as the second most important exporterin Latin America In 2012 banana exports rom Colombia dropped by 42 percentrom 191 in 2011 to 183 million tonnes mainly due to the spread o Moko diseaseGuatemalarsquos exports have also surpassed those o Colombia standing at 19 milliontonnes in 2012 - an increase o 232 percent (362 000 tonnes) compared to 2011In Honduras export volumes marked an astonishing 75 percent growth between2011 and 2012 reaching a record 901 000 tonnes in 2012 or double the 2003 exportsMexico also registered an important increase in shipments rom 178 000 tonnes in2011 to 308 000 tonnes in 2012 Peru is another dynamic exporter which had almostno exports prior to 2000 and reached 124 000 tonnes in 2012 or 138 percent aboveshipments made in 2011 most o which were air trade and organic bananas grownby smallholder associations
In the Caribbean exports continued to be dominated by the Dominican Republicwhich apart rom Belize is the only country among the Caribbean ACP countries
1 Provisional data received rom the countries and complemented with UN Comtrade data
8102019 Banana Import Export Global Stats
httpslidepdfcomreaderfullbanana-import-export-global-stats 7392
where bananas continue to be a major export despite the preerence erosion in theEuropean Union (EU) market thanks to the strong ocus on organic and air tradebananas Nevertheless ollowing a period o dynamic growth rom 2000 to 2011 in2012 Dominican banana exports declined by 22 percent to 297 000 tonnes OtherCaribbean countries have maintained very low volumes o exports continuing the
declining trend o recent years Jamaicarsquos exports have virtually disappeared since2008 and all production is now directed to the domestic market Exports rom otherCaribbean countries excluding Dominican Republic have also registered a steadydecline as a result o a combination o preerence erosion on exports to the EU andclimatic disasters that have severely undermined production Te combined exportsrom the Caribbean other than Dominican Republic plummeted rom 88 000 tonnesin 2009 to 21 000 tonnes in 2011 In 2012 a slight recovery is estimated to take placereflecting primarily an expansion in exports rom Saint Lucia rom 6 200 tonnes to12 100 tonnes
Exports rom Asia showed a remarkable recovery Afer substantial declines in
exports between 2006 and 2010 which were driven by shrinking exports rom thePhilippines the volume o exports rom the region rose 256 percent in 2011 and 271percent in 2012 reaching almost 282 million tonnes well above the previous recordo 24 million tonnes in 2006 Because o this recovery the Philippines returned tobeing the second largest exporter o bananas in the world afer Ecuador With theremarkable growth rates in both 2011 and 2012 the Philippines reached the peak oits export perormance in 2012 at 26 million tonnes corresponding to 939 percento all exports rom Asia
Africarsquos exports which accounted or 39 percent o global banana shipments grewby 24 percent in 2012 as exports reached 649 000 tonnes Cocircte drsquoIvoire the largestexporter in the region shipped 339 000 tonnes o bananas in 2012 or 60 percent morethan in 2011 while exports rom Cameroon the second largest Arican exporterdeclined by 10 per cent to 246 000 tonnes
Figure 1 Banana exports by region 2008-2012 million tonnes
120 123 118 125 130
23 19
18
222806 06
06
06
06
00
20
40
60
80
100
120
140
160
180
2008 2009 2010 2011 2012
Africa
Asia
Latin America
and Caribbean
8102019 Banana Import Export Global Stats
httpslidepdfcomreaderfullbanana-import-export-global-stats 8393
Imports
Te United States and EC-27 each imported approximately 27 percent o all bananastraded internationally in 2012 while other importers operated at a much smallerscale Afer a record high o almost 131 million tonnes o bananas imported by Russia
in 2011 when purchases grew by 224 percent those in 2012 declined by 41 percentto approximately 126 million tonnes A similar situation is observed in China Afera rapid expansion o banana imports over the past our years they declined rom therecord high o 910 000 tonnes in 2011 to 716 000 tonnes in 2012 corresponding to a213 percent drop mostly due to the increase in domestic production Japanrsquos importsregistered a moderate growth o 21 percent and reached almost 11 million tonnesin 2012
Figure 2 Distribution of global imports by market 2012 (thousand tonnes and share inglobal imports)
Weak demand in the EU was the main eature o the banana market in 2012 Accordingto the provisional data in 2012 EC-27 banana imports declined to approximately 449million tonnes (115 000 tonnes less than in 2011) the lowest level since 2006 Most
o the EUrsquos banana suppliers were affected by the decline but Ecuador Costa Ricaand the Dominican Republic registered largest decreases in export quantities In partthis drop was driven by an increase in bananas produced in the EU rom 612 000tonnes to 649 000 tonnes However the decline also reflected a drop in per capitaconsumption rom 104 kg in 2011 to 102 kg in 20122 Furthermore the appreciationo the United States (US) dollar constrained the demand or ldquodollar bananasrdquo Amongthe major exporters to the EU market only Peru Belize and Ghana increased theirexports to the region
2 Fruirop No 210 April 2013 CIRAD
4488 27
4350 27
1254 8
1086 7
716 4
934 6
668 4
2757 17EC-27
United States
Russian Fed
Japan
China
Other Asia
Latin America
Other
8102019 Banana Import Export Global Stats
httpslidepdfcomreaderfullbanana-import-export-global-stats 9394
Figure 3 Change in EUrsquos banana imports from 2011 to 2012 by origin
-200
-100
00
100
200
300
400
500
-800
-600
-400
-200
00
200
400
1000 tonnes (left axis) (right axis)
European bananas are mostly grown on the Canary Islands (Spain) where productionincreased by 24 000 tonnes in 2012 and Guadeloupe and Martinique (France) wherethe total production increased by 9 000 tonnes Minor quantities are also producedin Cyprus Greece and Portugal Bananas grown within the EU accounted or about126 percent o total EU consumption in 2012 At the same time the share o most-avoured-nation (MFN) bananas consumed in the EU was 683 percent whileconsumption o bananas imported rom the Arican Caribbean and Pacific Group oStates (ACP) accounted or 191 percent3
US imports on the contrary showed dynamic growth in 2012 increasing or thethird consecutive year Import volumes increased by 227 000 tonnes or 55 percentrelative to 2011 reflecting strong US demand or bananas Since domestic bananaproduction in the US is negligible net imports provide a good approximation ortotal per capita consumption which increased rom 116 kg in 2010 to 132 kg in2011 and urther to 138 in 20124 As a result imports registered a record 435 milliontonnes o bananas nearly as much as the EC-27 US imports rom Ecuador showeda considerable decline o 18 percent or 159 000 tonnes compared to 2011 reflectingprimarily lower output o bananas in Ecuador Tis decline was more than offset by
vigorous imports rom other sources and especially imports rom Central Americaand Mexico which increased by 326 000 tonnes Tis was consistent with the overallperormance o these exporters Mexicorsquos exports o bananas to the US registered aparticularly strong growth rate at 50 percent corresponding to an additional 75 000tonnes compared to 2011 Imports rom Colombia and Honduras also demonstrateda large increase
3 Bananas other than plaintains - Fact sheet European Commission Directorate-General or Agriculture andRural Development September 2013 (eceuropaeuagriculturebananasfact-sheet_enpdf )
4 A smaller increase is also observed in per capita consumption o citrus ruits (source httpwwwasusdagovpsdonline)
8102019 Banana Import Export Global Stats
httpslidepdfcomreaderfullbanana-import-export-global-stats 10395
2 Banana prices
Import pricesEUrsquos average import price in 2012 increased rom 604 eurostonne in 2011 to 623eurostonne fluctuating mildly between 600 and 650 eurostonne throughout theyear Te increase however was driven mainly by a stronger US dollar against theeuro while the demand remained sluggish In US dollar terms the EU import priceactually decreased rom USD 840 to USD 801 per tonne
Figure 4 Average annual import prices in EC-27 Japan and United States 2008-2012USDtonne
00
2000
4000
6000
8000
10000
12000
EC-27 United States Japan China
2008
2009
2010
2011
2012
In the US on the other hand the strong demand put upward pressure on importprices and they reached a record USD 984tonne on average in 2012 or 17 percentabove last yearrsquos the level Prices were particularly high during February March andApril 2012 exceeding USD 1 000tonne Import prices in Japan declined rom anaverage o 67 250 yentonne in 2011 to 63 983 yentonne in 2012 corresponding to a49 percent decline In dollar terms the reduction has been similar and the averageprice stood at USD 802tonne almost identical to the EU import price A strongseasonal variation also observed in previous years marked the prices in Japan during
2012 prices in April and May were almost one-third higher than those in Januaryand February In contrast import prices in China expressed in US dollars tend toincrease in the second hal o the year Between 2011 and 2012 the average annualimport price in China showed a remarkable improvement rom USD 490 to USD 599per tonne
8102019 Banana Import Export Global Stats
httpslidepdfcomreaderfullbanana-import-export-global-stats 11396
Figure 5 Monthly import prices in selected countries 2012
Wholesale and retail prices
US retail prices remained practically flat throughout 2012 at approximately USD 133kg although varied substantially during the first hal o 2012 peaking in March-April On average wholesale prices increased by 65 percent in 2012 compared to2011 while retail prices actually decreased 13 percent Tis apparent contradictioncould be explained by the act that supermarkets spread temporary losses rom higherwholesale prices across other products that they sell while maintaining the prices obananas or their consumers low which is a common marketing strategy
During 2012 wholesale and retail prices in France increased by 112 and 26 percentrespectively relative to 2011 with little fluctuation throughout the year Te averagewholesale price was 099 euroskg while the retail price was 174 euroskg In Japanwhere marketing margins are very high the decline in import prices in the second halo the year was only partially transmitted to wholesale and retail prices Compared
to 2011 average wholesale prices in Japan declined by 52 percent while retail pricesdeclined 81 percent Wholesale and retail prices in China also experienced a slumpdespite the increase in import prices by 79 and 45 percent respectively Domesticprices seemed to fluctuate in a similar manner throughout the year with a substantialdecline during the first hal o the year and partial recuperation in the second
40
45
50
55
60
65
70
75
Jan Feb Mar Apr May Jun Jul Aug S ep Oct Nov Dec
Japan 1000 yentonne
500
550
600
650
700
Jan Feb Mar Apr May Jun Jul Aug Sep Oct Nov Dec
EC-27 Eurotonne
800
900
1000
1100
1200
Jan Feb Mar Apr May Jun Jul Aug Sep Oct Nov Dec
United States USDtonne
500
550
600
650
700
Jan Feb Mar Apr May Jun Jul Aug Sep Oct Nov Dec
China US$tonne
8102019 Banana Import Export Global Stats
httpslidepdfcomreaderfullbanana-import-export-global-stats 12397
Figure 6 Monthly wholesale and retail prices in selected importing countries 2012
3 Policy developments
Te banana trade disputes between the EU and the Latin American banana producingcountries officially ended in 2012 Te longest series o disputes in the history othe World rade Organization (WO) dating back to 1992 was concluded on 8November 2012 by the signing o the Geneva Agreement on rade in Bananas which
was negotiated in 2009 between the EU and Latin American banana producers Atthe core o the agreement was the adoption o new commitments on MFN tariffs onbananas by the EU As the first step in 2009 the EU reduced its import tariff rom 176to 148 eurostonne Te maximum tariff rates are then set to decline reaching 114eurostonne in 2017 at the earliest or 2019 at the latest (see able 1)
Table 1 EUrsquos MFN tariff reduction schedule under the banana agreement
ariff rateseurotonne
15 December 2009ndash31 December 2010 148 eurotonne1 January 2011 143 eurotonne
1 January 2012 136 eurotonne
1 January 2013 132 eurotonne
1 January 2014 127 eurotonne
1 January 2015 122 eurotonne
1 January 2016 117 eurotonne
1 January 2017 114 eurotonne
3
35
4
45
5
55
6
65
Jan Feb Mar Apr May Jun Jul Aug Sep Oct Nov Dec
China RMBkg
Who lesale Retail
080
090
100
110
120
130
140
150
160
Jan Feb Mar Apr May Jun Jul Aug Sep Oct Nov Dec
United States USDkg
80
100
120
140
160
180
200
220
240
Jan Feb Mar Apr May Jun Jul Aug S ep Oc t Nov Dec
Japan Yenkg
W ho les al e Retail
060
080
100
120
140
160
180
200
220
Jan Feb Mar Apr May Jun Jul Aug Sep Oct Nov Dec
France Eurokg
W ho les al e Retai l
8102019 Banana Import Export Global Stats
httpslidepdfcomreaderfullbanana-import-export-global-stats 13398
In return or MFN tariff reduction by the EU the US and Latin American countriesagreed to cease all legal disputes against the EU at the WO and not demand anyadditional cuts or bananas in the Doha Round negotiations on agriculture At theaverage import price o 623 eurostonne in 2012 the MFN tariff o 136 eurostonnewas equivalent to 218 percent ad-valorem duty
Compared to the MFN tariff EU duties on bananas rom Colombia Peru and CentralAmerican countries have been reduced as part o the trade deals in the AssociationAgreements that these countries have signed with the EU Since 1 August 2013the ree trade provisions o the Agreements are applied to imports rom ColombiaHonduras Nicaragua and Panama while preerential trade arrangements betweenthe EU and Peru have been in orce since March 2013 Under these arrangementsthe preerential tariff or these countries was set at 124 eurostonne in 2013 and willbe gradually reduced to 75 eurostonne by 2020 Te same provisions would apply toCosta Rica Guatemala and El Salvador in the coming months Mexico is benefitingrom an import quota o 2 000 tonnes with an intra-quota duty o 70 eurostonne
ACP banana suppliers who have an Economic Partnership Agreement (EPA) withthe EU benefit rom duty and quota ree access to the EU market All current bananasuppliers in the ACP5 have concluded negotiations on either a ull or interim EPAand are thereore exempt rom any import duties on bananas However apart romsome o the Arican exporters ACP producers do not have the economies o scaleto compete with banana suppliers rom South and Central America Te situationis exacerbated by the lack o strategic partnerships along the value chain (in theexporter wholesaler and retailer segments) except or the Windward Islands whichmarket their bananas through their own distribution company
Te gradual reduction in the MFN tariff and preerential duties on bananas romLatin American countries entails preerence erosion or the ACP countries So arit appears that the implications or ACP banana exports to the EU have been rathersubdued with the exception o some o the Caribbean countries where preerenceerosion contributed to a decline already underway No sizable expansion o exportsrom Latin America to the EU has been registered afer the agreement on bananas wasreached Te EUrsquos imports rom the majority o Latin American countries decreasedin 2012 due to weak demand Among the ACP countries the perormance has beenmixed While countries like Belize managed to substantially expand their exports tothe EU others like Cameroon have seen their export share decrease Moreover some
ACP countries like Cocircte drsquoIvoire managed to diversiy their exports destinationswith significant growth in exports accounted or by the expansion in shipments todestination outside the EU
However preerence erosion remains a cause o concern or many ACP countrieso help them adjust to the new trade regime by either boosting the competitivenesso their banana sector or diversiying into other productive activities the EU isproviding financial support to these countries through the Banana AccompanyingMeasures (BAM) In total 190 million euros were allocated Tese support measures
5 Belize Cameroon Ivory Coast Dominica Dominican Republic Ghana Grenada Jamaica Saint LuciaSaint Vincent and the Grenadines and Suriname
8102019 Banana Import Export Global Stats
httpslidepdfcomreaderfullbanana-import-export-global-stats 14399
were proposed by the European Commission in March 2010 However the processo adopting BAM as a legal instrument has been protracted as the Council and theEuropean Parliament (EP) engaged in a series o extended debates on the proposalAn agreement was finally reached at the end o 2011 providing long awaited legalbasis or the BAM However the calls or project proposals to be supported with
BAM have only been launched in 2013
Te beneficiary countries are those which exported more than 10 000 tonnes per yearon average over the past decade Cameroon Cocircte drsquoIvoire and Ghana in Arica andBelize Dominica Dominican Republic Jamaica Saint Lucia Saint Vincent and theGrenadines and Suriname in the Caribbean
Table 2 BAM allocation by country euro million
Min Max
Belize 205 230
Cameroon 440 490
Cote drsquoIvoire 405 450
Dominica 140 155
Dominican R 150 165
Ghana 65 75
Jamaica 45 50
St Lucia 95 105
St Vincent amp the G 90 100
Suriname 85 95
Source Programming Guidelines Banana Accompanying Measures (BAM) 2012-2013 January 2012
4 Current situation and short-term outlook
Global supplies o bananas in 2013 could be severely affected by difficult cropprospects in Ecuador and the Philippines In Ecuador output projections indicatea urther decline in 2013 as the area under cultivation has shrunk Governmentestimates show planted area ell rom 200 000 hectares in January 2012 to 171 000hectares in February 2013 Tis decline in part reflects the pessimistic outlook o
Ecuadorian producers since their bananas will struggle to remain competitive in theEuropean market where practically all other exporters will be paying a preerentialtariff while Ecuador continues to pay an MFN duty rate In the Philippines weatherconditions have negatively affected banana production About one quarter o thebanana crop in the Philippines was destroyed by yphoon Bopha in December 2012 6Shipments o bananas rom Central America and Colombia on the other hand willremain solid aided by the entry into orce o the preerential duty rates charged onexports to the EU Exports rom Colombia are expected to recover once the campaignto eradicate Moko is successully completed
6 The devastating typhoon Haiyan that swept the Philippines in early November 2013 largely spared thePhilippines major banana producing region
8102019 Banana Import Export Global Stats
httpslidepdfcomreaderfullbanana-import-export-global-stats 153910
Te demand or bananas in both the EU and Russia seem to recover in 2013 as importsare showing promising signs During the first 9 months o 2013 import quantities inthe EU and Russia increased by 56 and 57 percent relative to the same period in2012 respectively 7 US imports are also likely to grow in 2013 as monthly importshave been consistently above those o 2012 in both value and volume Overall during
the first three quarters o 2013 the volume o US imports increased 46 percent
In 2013 the import prices in the US seemed to have stabilized at a somewhat lowerlevel compared to the record prices in 2012 Te average US import price during thefirst 6 months o 2013 stood at USD 923tonne or 74 percent lower than during thesame period in 2012 Tis is still well above the average import prices prevalent inthe EU although some countries like France are showing a tendency towards higherprices in 2013 Overall prices in the EU are expected to remain firm and close to the2012 level
Te ACP countries will continue to enjoy preerential access to the EU market
although the preerential margin vis-agrave-vis the major exporters such as Colombiaand Costa Rica will be shrinking over time as the ree trade agreements with thesecountries enter into orce Unless Ecuador enters into new negotiations with theEU it will continue paying higher tariffs than its major competitors underminingEcuadorrsquos export opportunities While the gap between the MFN tariff and thepreerential tariff o Colombia or example was not that high in 2013 (132 eurostonne versus 124 eurostonne) the difference will increase substantially by 2020unless a new reduction on the MFN tariff is achieved as part o multilateral tradetalks on agriculture At current import prices in the EU by 2020 Ecuador wouldbe paying 18 percent in ad-valorem tariff equivalent while the preerential rate orColombia Peru and Central America would be 12 percent
7 Based on GTA data
8102019 Banana Import Export Global Stats
httpslidepdfcomreaderfullbanana-import-export-global-stats 1639
STATISTICAL TABLES
8102019 Banana Import Export Global Stats
httpslidepdfcomreaderfullbanana-import-export-global-stats 17391212
Table 1 - World gross exports by country Tableau 1 - Exportations brutes mondiales par paysCuadro 1 - Exportaciones brutas mundiales por paiacutes
2000 2001 2002 2003 2004 2005 2006 2007 2008 2009 2010 2011 2012
(prel)
( thousand tonnes milliers de tonnes miles de toneladas )
Latin America amp Caribbean 9 7239 9 4433 9 9331 10 4715 10 4367 10 6201 11 2608 12 1333 11 9550 12 3458 11 7717 12 5270 13 0280
Central and South America 9 4791 9 1823 9 6743 10 2260 10 2225 10 3715 10 9502 11 8437 11 6878 11 9762 11 3922 12 2020 12 7054
Belize 658 501 430 749 805 763 730 611 827 818 792 837 993
Bolivia 94 129 165 284 427 536 762 795 858 894 884 983 727
Brazil 718 1051 2410 2208 1881 2122 1943 1857 1309 1439 1395 1101 957
Colombia 1 6802 1 5163 1 5704 1 4232 1 4709 1 6215 1 6974 1 7492 1 7983 2 1018 1 8026 1 9153 1 8349
Costa Rica 1 8833 1 7393 1 6226 1 9013 1 7925 1 6145 1 9611 2 1592 1 8726 1 5875 1 8209 1 9022 2 0286
Ecuador 3 9395 3 9904 4 1992 4 6712 4 5370 4 6539 4 7978 5 0571 5 1328 5 4731 4 9450 5 3919 4 9821
Guatemala 8013 8738 9717 9333 1 0138 1 0463 9826 1 3304 1 3547 1 4064 1 3691 1 5588 1 9208
Honduras 3753 4318 4414 4434 5277 5011 5162 5701 6057 5197 5124 5166 9014
Mexico 455 374 358 399 416 702 666 416 749 1401 1741 1776 3075
Nicaragua 455 441 408 409 449 455 377 389 378 347 200 82 93
Panama 4893 3211 4185 4102 3980 3483 4311 4386 3666 2572 2724 2669 2450
Peru 09 80 191 181 273 429 571 655 782 833 894 1088 1238
Suriname 354 287 280 01 214 396 474 562 654 570 791 629 831
Venezuela 361 233 265 203 360 456 117 106 14 01 01 08 12
Caribbean 2448 2609 2589 2455 2142 2487 3105 2896 2673 3696 3795 3250 3226 Dominican Republic 802 1302 1147 1267 1020 1671 2056 2120 1919 2818 3404 3038 2972
Jamaica 420 431 399 418 287 116 319 174 00 00 00 00 00
Others 1226 877 1042 771 835 700 731 602 754 877 391 212 254
Asia 17038 16896 17853 19443 19047 21693 24103 23121 23057 18574 17649 22174 28179
China 502 392 397 530 416 388 228 209 151 132 86 102 79
Malaysia 311 302 279 246 211 338 268 271 301 200 214 229 183
Pakistan 21 14 37 72 60 85 109 79 130 867 577 588 588
Philippines 1 5994 1 6007 1 6850 1 8294 1 7973 2 0243 2 3115 2 2177 2 1926 1 6641 1 5901 2 0555 2 6461
Tailand 58 55 52 63 177 418 203 214 228 256 228 252 276
Vietnam 45 42 146 126 72 39 21 16 26 17 35 32 32 Others 107 84 92 111 138 181 159 154 296 462 608 417 560
India 86 81 87 109 126 144 115 130 276 458 608 399 545
Africa 4941 4889 5329 5651 5568 5045 6057 5801 6114 5682 6435 6337 6488
Cameroon 2382 2541 2588 3137 2949 2655 2566 2323 2687 2555 2328 2490 2465
Cocircte drsquoIvoire 2173 2244 2560 2424 2524 2344 2864 2908 2643 2570 3356 3201 3394
Ethiopia 05 03 09 13 29 00 05 26 20 28 36 41 41
Others 93 48 107 77 65 46 621 544 764 528 714 606 588
Ghana 39 33 30 13 19 19 575 521 698 476 675 579 561
Oceania 03 01 01 01 01 01 01 01 01 01 01 01 01
WORLD 11 9221 11 6218 12 2514 12 9810 12 8982 13 2940 14 2768 15 0255 14 8723 14 7714 14 1802 15 3783 16 4948
8102019 Banana Import Export Global Stats
httpslidepdfcomreaderfullbanana-import-export-global-stats 18391313
Table 2 - World net imports by country Tableau 2 - Importations nettes mondiales par paysCuadro 2 - Importaciones netas mundiales por paiacutes
2000 2001 2002 2003 2004 2005 2006 2007 2008 2009 2010 2011 2012
(prel)
( thousand tonnes milliers de tonnes miles de toneladas )
DEVELOPING COUNTRIES 2 2705 1 9519 1 9760 2 3592 2 5037 2 7438 2 9908 3 0399 3 3967 3 3997 3 8240 4 1996 3 7561
Latin America amp Caribbean 6360 6031 5006 5591 5626 6007 5629 5986 6226 6143 6412 6814 6678
Argentina 3400 3301 2295 2864 3033 3022 2957 3189 3468 3441 3511 3949 3766
Chile 1926 1475 1491 1578 1597 1953 1689 1782 1750 1793 1757 1844 1906
El Salvador 590 612 614 566 515 531 491 538 527 435 487 448 498
Uruguay 330 489 438 411 437 476 451 422 431 416 506 515 447
Others 115 154 167 171 43 25 41 54 50 58 152 59 62
Asia 1 5762 1 1937 1 2007 1 5193 1 6148 1 9356 2 2266 2 1834 2 5295 2 5112 2 8624 3 1575 2 7362
China 6423 4676 4013 4811 4373 4142 4467 3873 4210 5536 7408 9095 7158
Iran 2000 756 1507 2710 2709 4509 3728 4477 7516 7128 6395 5909 3555
Jordan 53 29 22 15 21 63 93 202 330 256 396 483 498
Korea Rep 1842 1945 1872 2200 2083 2533 2797 3077 2581 2570 3379 3527 3680 Kuwait 233 238 255 261 302 305 676 889 961 929 911 1305 1398
Saudi Arabia 1869 1810 1765 1994 2115 2332 2351 2481 2567 2524 3074 3062 3062
Singapore 423 398 376 352 350 357 365 371 384 397 393 416 446
Syria 687 530 478 704 939 1116 3227 1927 2196 1837 2323 2722 2934
urkey 1242 416 646 919 1102 1510 1686 2243 2191 1824 2007 2346 2251
United Arab Emirates 685 796 683 707 1576 1748 2105 1229 1267 845 933 1287 1297
Others 305 343 391 520 578 742 771 1066 1094 1265 1403 1423 1084
Africa 582 1551 2748 2808 3263 2074 2013 2580 2446 2741 3203 3607 3521
Algeria 00 854 2315 2233 2046 1571 1472 1626 1639 1796 2079 2453 2310
Egypt 53 59 26 12 11 28 61 47 30 25 101 256 284
Morocco 00 28 14 11 22 49 54 172 187 267 281 246 282
Senegal 71 105 121 123 141 150 157 166 169 168 165 143 156
unisia 155 110 163 138 543 208 203 410 335 371 187 413 413
Others 303 394 109 291 500 68 67 158 86 115 391 95 76
DEVELOPED COUNTRIES 9 8804 9 6173 9 8594 10 1348 10 2763 10 3758 10 8862 11 4379 11 7050 11 0187 11 5162 12 3829 12 4955
EC ( 27 ) 3 8901 3 7718 3 8868 4 0230 4 0010 3 9230 4 3653 4 6824 4 8773 4 5370 4 5087 4 6030 4 4876
Other Europe 8126 9415 1 0599 1 1827 1 3155 1 4812 1 5319 1 6675 1 7004 1 5876 1 6729 1 9533 1 9018
Albania 178 85 187 227 172 168 168 202 174 172 175 174 174
Belarus 311 173 161 209 235 287 294 332 417 367 445 401 594
Bosnia Herzgovina 05 06 03 414 462 449 378 383 408 371 370 380 380
Croatia 419 432 451 506 508 540 515 548 570 521 494 487 463
Iceland 35 37 40 41 46 47 54 55 56 57 57 59 61
Macedonia Former YR 51 20 78 153 208 176 151 161 154 167 181 191 191
Moldova Rep 16 17 15 31 49 70 77 112 129 117 105 122 112 Norway 599 609 598 634 662 732 746 785 835 812 785 782 769
Russian Fed 4995 6067 6408 7870 8427 8528 8835 9597 9885 9694 1 0686 1 3076 1 2536
Serbia Montenegro 198 679 1134 151 975 578
Serbia 558 657 689 431 419 515 454
Montenegro 83 85 84 85 66 74 74
Switzerland 723 734 743 722 735 742 741 782 821 808 799 794 786
Ukraine 595 555 791 870 676 2494 2720 2975 2781 2273 2148 2478 2426
North America 4 0289 3 8387 3 9072 3 8738 3 8649 3 8223 3 8516 4 0151 3 9309 3 5429 4 1075 4 6293 4 8768
Canada 3984 4049 4170 4228 4406 4490 4567 4718 4776 4819 4961 5066 5270
United States 3 6304 3 4338 3 4902 3 4511 3 4242 3 3733 3 3950 3 5433 3 4534 3 0610 3 6114 4 1227 4 3497
Others 1 1488 1 0653 1 0054 1 0552 1 0949 1 1493 1 1374 1 0730 1 1963 1 3512 1 2271 1 1973 1 2294
Japan 1 0787 9906 9363 9866 1 0260 1 0669 1 0436 9706 1 0927 1 2526 1 1091 1 0641 1 0864 New Zealand 676 722 673 672 661 775 809 805 800 763 813 809 807
South Arica 26 26 18 14 28 50 129 219 236 222 367 523 623
WORLD 12 1508 11 5692 11 8354 12 4940 12 7800 13 1196 13 8770 14 4778 15 1017 14 4183 15 3401 16 5824 16 2516
8102019 Banana Import Export Global Stats
httpslidepdfcomreaderfullbanana-import-export-global-stats 19391414
Table 3 - EC Total supply of bananas and per capita supply Tableau 3 - CE Offre totale de banane et offre par habitantCuadro 3 - CE Oferta total de banano y oferta por habitante
2000 2001 2002 2003 2004 2005 2006 2007 2008 2009 2010 2011 2012
( thousand tons milliers de tonnes miles de toneladas )
France 3589 3228 3589 3292 3053 2805 2686 1673 1716 2358 2420 2425 2517
Guadeloupe 876 890 951 855 591 542 478 380 467 556 426 615 669
Martinique 2713 2337 2639 2437 2462 2262 2208 293 1249 1802 1994 1810 1848
Spain 3976 4209 4073 4009 4184 3450 3482 3614 3713 3520 3970 3465 3710
Greece 33 29 24 27 29 29 29 29 27 26 19 20 22
Cyprus 85 98 105 112 105 58 65 60 42 32 50 56 57
Portugal 225 207 219 214 212 142 153 172 178 145 137 153 177
Production 7907 7771 8011 7654 7582 6484 6416 5547 5676 6080 6595 6118 6485
Net Imports
EC (27) 3 8901 3 7718 3 8868 4 0310 4 0125 3 9230 4 3676 4 6824 4 8738 4 5372 4 5086 4 6030 4 4899
Supply 4 6807 4 5489 4 6880 4 7965 4 7707 4 5714 5 0092 5 2371 5 4414 5 1453 5 1682 5 2149 5 1383
Per capita supply 1231 1191 968 986 977 931 1016 1058 1095 1031 1032 1038 1021
Source EC Commission
8102019 Banana Import Export Global Stats
httpslidepdfcomreaderfullbanana-import-export-global-stats 20391515
Table 4 - Per capita net imports by country Tableau 4 - Importations nettes par habitant par paysCuadro 4 - Importaciones netas por habitante por paiacutes
2000 2001 2002 2003 2004 2005 2006 2007 2008 2009 2010 2011 2012
(prel)
( kg per capita kg par habitant kg por habitante )
DEVELOPING COUNTRIES 127 108 108 128 135 147 158 160 177 175 196 213 185
Latin America amp Caribbean 932 875 719 796 793 839 779 821 847 828 856 902 876
Argentina 921 885 610 754 791 781 758 810 873 859 869 969 916
Chile 1249 945 945 989 990 1198 1026 1071 1042 1058 1027 1068 1094
El Salvador 994 1026 1026 942 854 878 808 882 860 705 786 719 795
Uruguay 994 1472 1317 1237 1316 1432 1356 1266 1288 1240 1501 1523 1319
Others 174 228 243 246 061 035 055 073 066 076 195 074 077
Asia 100 075 075 094 099 118 135 131 151 148 168 184 154
China 051 037 032 038 034 032 034 030 032 042 056 068 052
Iran 306 114 224 398 393 647 528 627 1040 975 865 790 470
Jordan 109 059 044 029 040 118 169 356 564 426 641 762 771
Korea Rep 401 421 403 472 445 538 592 648 541 536 701 729 757 Kuwait 1203 1183 1231 1227 1378 1345 2877 3630 3771 3511 3328 4631 4834
Saudi Arabia 933 875 822 893 911 970 948 973 981 941 1120 1090 1067
Singapore 1078 999 931 861 841 838 828 809 804 802 774 802 848
Syria 430 322 282 403 522 604 1706 997 1115 916 1138 1311 1389
urkey 195 064 099 139 164 222 244 320 309 254 276 319 302
United Arab Emirates 2258 2529 2099 2078 4309 4295 4514 2273 2041 1218 1242 1631 1600
Others 031 034 038 051 056 070 072 097 098 111 121 120 090
Africa 039 103 180 181 207 129 124 156 146 161 185 205 197
Algeria 000 276 736 700 632 478 441 480 476 514 586 682 633
Egypt 008 009 004 002 002 004 008 006 004 003 013 031 034
Morocco 000 010 005 004 007 016 017 056 060 084 088 076 086
Senegal 075 108 120 120 133 138 141 145 144 138 133 112 119
unisia 164 116 169 142 553 210 202 405 327 358 178 390 386
Others 1726 2207 601 1590 2699 360 352 821 439 579 1947 470 368
DEVELOPED COUNTRIES 813 789 805 825 833 837 875 916 933 875 911 976 981
EC ( 27 ) 808 781 802 826 818 799 885 946 981 909 901 917 891
Other Europe 331 385 435 488 545 616 639 696 711 665 702 821 800
Albania 581 275 605 731 549 535 533 636 547 540 547 541 539
Belarus 309 173 161 210 238 292 301 341 431 381 463 419 623
Bosnia Herzgovina 014 016 007 1093 1223 1188 999 1014 1081 986 983 1013 1015
Croatia 929 964 1009 1135 1142 1215 1161 1237 1291 1182 1121 1107 1055
Iceland 1246 1286 1401 1414 1573 1591 1778 1803 1785 1818 1797 1818 1855
Macedonia Former YR 254 101 383 755 1021 863 738 786 751 812 878 925 923
Moldova Rep 040 042 037 079 128 185 207 306 354 326 295 344 318
Norway 1334 1350 1319 1390 1444 1584 1599 1662 1748 1681 1607 1588 1550
Russian Fed 340 415 440 543 584 593 616 670 690 678 747 915 878
Serbia Montenegro 184 634 1066 143 926 552
Serbia 568 668 700 437 425 522 461
Montenegro 1318 1356 1338 1343 1040 1172 1170
Switzerland 1009 1019 1024 988 999 1001 992 1040 1085 1060 1042 1031 1016
Ukraine 122 115 165 183 143 532 584 643 605 497 473 548 540
North America 1287 1213 1222 1200 1186 1161 1159 1198 1162 1038 1193 1332 1392
Canada 1299 1308 1333 1338 1379 1391 1400 1431 1433 1431 1458 1475 1520
United States 1285 1203 1210 1185 1164 1136 1133 1172 1132 995 1164 1317 1377
Others 659 608 571 597 616 645 635 597 664 748 678 660 677
Japan 858 787 743 782 812 844 825 767 864 990 876 841 859
New Zealand 1753 1847 1700 1670 1619 1874 1932 1901 1869 1766 1862 1832 1809
South Arica 006 006 004 003 006 010 027 045 048 045 073 104 123
WORLD 404 382 388 407 413 422 443 459 475 451 477 512 492
8102019 Banana Import Export Global Stats
httpslidepdfcomreaderfullbanana-import-export-global-stats 21391616
Table 5 - Exports by countries of destination 1
Tableau 5 - Exportations par pays de destination 1
Cuadro 5 - Exportaciones por paiacuteses de destino 1
2002 2003 2004 2005 2006 2007 2008 2009 2010 2011 2012
(prel)
( thousand tonnes milliers de tonnes miles de toneladas )
BELIZE
O
United Kingdom 430 749 805 763 730 609 821 798 788 711 990
Others 06 20 04 126 03
TOTAL 430 749 805 763 730 611 827 818 792 837 993
BRAZIL
O
Argentina 1631 1297 914 979 561 583 339 522 385 231 354
Italy 208 234 171 191 128 86 70
Uruguay 395 401 423 478 429 393 388 364 372 338 350
United Kingdom 301 259 306 361 546 400 165 190 120 140 147
Others 84 251 30 69 236 290 290 276 448 392 107
TOTAL 2410 2208 1881 2121 1943 1857 1309 1439 1395 1101 957
COLOMBIA
O
Belgium-Lux 5669 4763 5707 6246 6048 5023 6122 5194 4162 5093 5397
United States 5682 4869 4634 5259 4802 4767 4884 6765 5478 4767 3173
UK 264 2563 2740 4468
Italy 1226 1193 1120 1006 721 991 1147 1801 2122 2236 2425
Russian Federation 147 177 501 311 184 215 52 04 35 China 191 - - - - - -
Saudi Arabia 05 66 27 - - - -
Germany 2064 1929 1351 1615 2086 3698 2882 2909 2181 3560 1532
Others 720 1235 1369 1778 3133 2798 2948 4032 1516 723 1355
TOTAL 1 5704 1 4232 1 4709 1 6215 1 6974 1 7492 1 7983 2 1018 1 8026 1 9153 1 8349
COSTA RICA
O
North America 8093 9276 8548 7911 9505 1 0382 8557 6569 8553 8832 8723
Europe 8133 9733 9376 8073 9462 9541 9112 8135 8654 8553 9960
Russian Federation 154 693 303 439 438 1546
Others 00 04 01 161 490 1670 364 868 563 1199 57TOTAL 1 6226 1 9013 1 7925 1 6145 1 9611 2 1592 1 8726 1 5875 1 8209 1 9022 2 0286
COcircTE DrsquoIVOIRE
O
France 1740 1288 1201 1432 1238 998 813 1333 871 494 707
UK 64 198 228 306 420 402 418 510 887 892 921
Germany 01 - 168 207 194
Italy 09 - 03 - 03
Belgium - Luxembourg 917 422 950 1218 1077 375 857 1130 1029
Senegal 140 131 144 149 200 213 214 179 239 167 210
Others 616 805 34 35 55 78 110 173 331 311 331
TOTAL 2560 2422 2524 2344 2864 2908 2643 2570 3356 3201 3394
8102019 Banana Import Export Global Stats
httpslidepdfcomreaderfullbanana-import-export-global-stats 22391717
Table 5 - Exports by countries of destination 1
Tableau 5 - Exportations par pays de destination 1
Cuadro 5 - Exportaciones por paiacuteses de destino 1
2002 2003 2004 2005 2006 2007 2008 2009 2010 2011 2012
(prel)
( thousand tonnes milliers de tonnes miles de toneladas )
DOMINICA
O
United Kingdom 164 134 133 118 118 72 105 364 39 41 23
Others 10 - 00 28 23 23 24 17 01 00 00 00
TOTAL 175 134 161 141 141 96 122 365 39 41 23
DOMINICAN REPUBLIC
O
Belgium-Lux 290 472 215 213 262 298 376 619 731 490 591
Italy 79 53 62 71 107 57 14 04 03 60 21United Kingdom 562 604 627 1271 1274 1585 1316 1669 2051 1 803 1 773
United States 34 26 41 33 72 17 04 20 02 05 09
Others 182 112 75 84 341 163 209 507 618 680 579
TOTAL 1147 1267 1020 1671 2056 2120 1919 2818 3404 3038 2972
ECUADOR
O
United States 1 1284 9382 9246 9562 9425 7297 8805 1 1445 1 0001 8942 7256
Italy 9337 1 1752 1 1745 1 1317 9455 9163 9439 1 0043 8401 7337 5906
Germany 5018 5232 4691 5200 4247 3202 5324 5250 4473 5740 4132
Belgium-Lux 2036 2140 2205 1686 2004 2633 3904 3189 3472 3187 2852
Russian Federation 8742 9766 1 0310 1 1439 9893 9103 1 3947 1 3151 1 0624 1 2140 1 1401Argentina 394 1095 1419 1227 1053 1120 2156 1955 1813 326 421
Chile 1678 2195 1847 1840 1893 1421 1857 1977 2076 3992 3955
Japan 1708 1552 1330 982 923 446 532 664 447 354 357
New Zealand 619 397 418 384 310 239 303 322 313 235 225
Poland 410 48 - 67 - 42 225 172 266 207
China 168 108 39 04 45 10 19 102 451
Iran - - - 39 - - - 10 21 24
Others 597 3201 2004 2823 8706 1 5943 4217 3088 1 2900 6805 1 6756
TOTAL 4 1992 4 6712 4 5370 4 6539 4 7978 5 0571 5 1328 5 4731 4 9450 5 3919 4 9821
GRENADA
OUnited Kingdom 06 04 04 03 02 05
TOTAL 06 04 04 - 03 02 05
GUATEMALA
O
United States 8259 9251 8617 8894 9216 6001 1 2215 1 3638 1 2652 1 3384 1 5841
United Kingdom - - - 04 10 10 51 15 11 16 28
Italy - - - 03 46 04 - 01 23 416 152
El Salvador 31 28 315 493 416 213 952 243 875 733 825
Others 1427 54 1206 1070 138 7076 329 167 130 1039 2362
TOTAL 9717 9333 1 0138 1 0463 9826 1 3304 1 3547 1 4064 1 3691 1 5588 1 9208
8102019 Banana Import Export Global Stats
httpslidepdfcomreaderfullbanana-import-export-global-stats 23391818
Table 5 - Exports by countries of destination 1
Tableau 5 - Exportations par pays de destination 1
Cuadro 5 - Exportaciones por paiacuteses de destino 1
2002 2003 2004 2005 2006 2007 2008 2009 2010 2011 2012
(prel)
( thousand tonnes milliers de tonnes miles de toneladas )
HONDURAS
O
United States 3913 3915 4984 4535 4569 4586 5656 4829 4560 4598 8022
Belgium-Lux 155 84 183 226 212 215 122 73 154 155 270
Germany
Italy 09
United Kingdom 13 46 07 26 26 45
Others 324 436 110 250 381 900 233 288 384 387 676
TOTAL 4414 4434 5277 5011 5162 5701 6057 5197 5124 5166 9014
JAMAICA
O
United Kingdom 399 418 287 116 319 174 00 00 00 00 00
Others 00 - 00 00 00 00 00 00 00 00 00 00
TOTAL 399 418 287 116 319 174 00 00 00 00 00
MEXICO
O
United States 334 277 363 379 429 367 593 1238 1552 1635 2499
Japan 54 47 37 30 29
Spain 01 56 64 70 54
Russian Fed 01 23 09 01 01Others 24 122 53 323 237 49 100 36 78 40 492
TOTAL 358 399 416 702 666 416 749 1401 1741 1776 3075
PANAMA
O
Germany 162 131 166 22 118 01 46 - 28 05 29
United States - - 06 59 175 136 266 47 281 340 150
Belgium-Lux 1201 888 739 578 765 716 91 30 78 00 00
Portugal 1056 1031 817 430 415 438 101 65 113 196 160
Sweden 1743 1785 2093 1922 2129 2331 2315 1385 1855 1530 1391
Italy - - 66 116 160 88 490 57 49 179 123
Others 22 267 93 356 549 676 358 989 320 419 596TOTAL 4185 4102 3980 3483 4311 4386 3666 2572 2724 2669 2450
PHILIPPINES
O
Japan 8477 8840 9152 9182 9095 9142 1 1065 9138 7921 8922 1 0848
Iran 93 304 1699 2234 3727 4287 4013 2506 2196 1497 990
Saudi Arabia 507 01 102 187 65 217 120 95 78 1161
China 3788 4156 3309 3512 3815 2034 1815 983 1658 4034 4220
China Hong Kong SAR 04 243 201 199 152 190 383 223 75 198 903
Korea Rep o 1519 1588 1386 2341 2649 2756 1866 1321 1133 1979 2655
United Arab Emirates 2092 2002 1576 1799 2075 1672 711 572 789 1016 2628
Others 370 1161 650 874 1415 2031 1857 1778 2034 2831 3056
TOTAL 1 6850 1 8294 1 7973 2 0243 2 3115 2 2177 2 1926 1 6641 1 5901 2 0555 2 6461
8102019 Banana Import Export Global Stats
httpslidepdfcomreaderfullbanana-import-export-global-stats 24391919
Table 5 - Exports by countries of destination 1
Tableau 5 - Exportations par pays de destination 1
Cuadro 5 - Exportaciones por paiacuteses de destino 1
2002 2003 2004 2005 2006 2007 2008 2009 2010 2011 2012
(prel)
( thousand tonnes milliers de tonnes miles de toneladas )
PERU
O
United States 112 135 122 231 264 179 239 198 198 235 278
Belgium 39 22 61 92 100 48 72 38 71 55 72
Netherlands 03 02 47 59 115 277 320 432 457 609 659
Germany 33 - 04 04 44 67 57 34 59 32 55
Japan 01 34 42 44 79 73 101 79 88 118
Others 04 20 04 01 04 05 22 30 30 69 57
TOTAL 191 181 273 429 571 655 782 833 894 1088 1238
SAINT LUCIA
O
United Kingdom 493 348 417 300 341 239 393 332 232 61 120
Others 00 00 14 07 08 17 19 00 00 01 01
TOTAL 493 348 431 307 349 256 412 332 232 62 121
STVINCENT amp GRENADINES
O
United Kingdom 344 285 240 204 180 182 114 75 41 08 07
Others 25 00 00 48 58 66 100 106 81 102 103
TOTAL 369 285 240 252 238 248 214 181 121 110 110
SURINAME
O
United Kingdom 280 - 47 98 11
France 62 257 454 562 654 570
Others 00 104 40 09 - 00 - 00 00 791 629 831
TOTAL 280 01 214 396 474 562 654 570 791 629 831
1 As declared by exporting countries1 Comme declareacute par les pays exportateurs1 De acuerdo a lo declarado por los paiacuteses exportadores
8102019 Banana Import Export Global Stats
httpslidepdfcomreaderfullbanana-import-export-global-stats 25392020
Table 6 - Gross Imports by countries of origin 1
Tableau 6 - Importations brutes par pays drsquoorigine 1
Cuadro 6 - Importaciones brutas por paiacuteses de origen 1
2002 2003 2004 2005 2006 2007 2008 2009 2010 2011 2012
(prel)
( thousand tonnes milliers de tonnes miles de toneladas )
ARGENTINA
FROM
Ecuador 471 1168 1600 1415 1658 1840 2149 1973 2127 2397 2245
Brazil 1648 1293 903 981 561 583 338 523 386 232 394
Bolivia 146 249 407 557 641 647 706 780 753 994 873
Others 31 153 123 70 97 119 275 165 245 326 254
TOTAL 2295 2864 3033 3022 2957 3189 3468 3441 3511 3949 3766
CANADAFROM
Costa Rica 881 1196 1061 927 881 1253 1154 710 1058 1178 1159
Ecuador 1282 1048 821 780 942 1003 1210 1642 1472 1104 1392
Colombia 1202 1149 1297 1637 1741 1379 1218 1289 1145 963 1298
Honduras 310 287 353 206 101 235 292 175 295 274 275
Mexico 111 102 47 10 20 15 28 16 14 20 20
Guatemala 310 429 782 855 794 754 814 931 897 1475 1055
Panama 01 00 - 19 53 39 29 25 37 10 30
Dominican Rep 02 01 07 01 06 04 01 02 01 01 02
Others 75 17 56 55 42 36 31 31 41 41 39TOTAL 4174 4228 4423 4490 4580 4718 4776 4820 4961 5066 5270
CHILE
FROM
Ecuador 1472 1569 1585 1670 1630 1698 1659 1730 1738 1766 1825
Others 19 20 18 283 59 84 91 63 19 78 81
TOTAL 1491 1589 1602 1953 1689 1782 1750 1793 1757 1844 1906
CHINA
FROM
Philippines 2665 3111 2858 3038 3434 3038 3178 3521 4367 6939 4964
Ecuador 284 285 241 154 42 30 70 22 89 477
Tailand 06 18 57 96 138 152 176 104 163 225
Myanmar 01 01 44 943 1770 549 445
Vietnam 424 798 652 268 292 100 217 192 315 393 93
Others 98 00 01 00 152 02 03 11 74 55 142
TOTAL 3478 4212 3809 3557 3878 3319 3623 4913 6652 8187 6346
8102019 Banana Import Export Global Stats
httpslidepdfcomreaderfullbanana-import-export-global-stats 26392121
Table 6 - Gross Imports by countries of origin 1
Tableau 6 - Importations brutes par pays drsquoorigine 1
Cuadro 6 - Importaciones brutas por paiacuteses de origen 1
2002 2003 2004 2005 2006 2007 2008 2009 2010 2011 2012
(prel)
( thousand tonnes milliers de tonnes miles de toneladas )
EC (27) 2
FROM
Ecuador 1 1570 1 1488 1 1208 1 2392 1 1993 1 1858 1 3306 1 3431 1 2242 1 3412 1 3074
Colombia 7680 7992 7665 8824 9514 1 1561 1 2782 1 2408 1 1610 1 1366 1 1344
Costa Rica 7463 8020 8564 6345 8340 9714 8951 7572 7765 8450 7702
Panama 3962 3815 3708 2816 3130 3541 2946 1851 1844 1597 1436
Cote drsquoIvoire 2167 2074 2108 1838 2218 1894 2166 2292 2443 2241 2249
Cameroon 2365 2985 2612 2529 2527 2218 2795 2497 2430 2352 2139
Dominican Rep 973 1119 1013 1447 1768 2064 1705 2283 3037 3269 2946
Peru 68 57 96 115 227 336 389 441 516 658 814
Belize 387 738 803 742 732 624 821 798 788 711 993
Ghana 33 09 18 42 223 341 460 365 524 472 507
Saint Lucia 493 325 429 282 367 305 385 333 232 62 121
Jamaica 406 418 287 117 319 184 - - - -
Honduras 345 252 212 231 218 316 240 85 152 175 57
Saint Vincent amp the Grenadines 325 209 240 159 172 138 90 75 41 08 07
Guatemala 10 69 22 30 307 188 143 49 33 30 46
Dominica 175 105 122 128 133 73 103 369 37 41 23
Others 569 682 1007 1244 1549 1563 1593 611 1469 1272 1483
TOTAL 3 8991 4 0358 4 0112 3 9281 4 3737 4 6917 4 8873 4 5459 4 5161 4 6114 4 49412 Source European Community
JAPAN
FROM
Philippines 7435 7956 8696 9445 9106 8790 1 0193 1 1591 1 0355 1 0044 1 0267
Ecuador 1570 1456 1227 911 1013 521 462 618 461 343 359
China 251 335 182 151 159 189 90 88 95 84 84
Indonesia - - - - - - - - - - -
Others 106 120 154 162 158 207 182 229 180 170 154
TOTAL 9363 9866 1 0260 1 0669 1 0436 9706 1 0927 1 2526 1 1091 1 0641 1 0864
NEW ZEALAND
FROM
Ecuador 562 308 291 354 326 308 273 258 288 250 279
Philippines 110 360 356 419 481 493 526 500 524 556 526
Panama - - 14 01 01
Others 01 03 01 00 00 04 00 04 01 02 03
TOTAL 673 672 661 775 809 805 800 763 813 809 807
8102019 Banana Import Export Global Stats
httpslidepdfcomreaderfullbanana-import-export-global-stats 27392222
Table 6 - Gross Imports by countries of origin 1
Tableau 6 - Importations brutes par pays drsquoorigine 1
Cuadro 6 - Importaciones brutas por paiacuteses de origen 1
2002 2003 2004 2005 2006 2007 2008 2009 2010 2011 2012
(prel)
( thousand tonnes milliers de tonnes miles de toneladas )
NORWAY
FROM
Panama 07 28 34 54 68 77 108 92 100 97 95
Costa Rica 260 307 339 425 382 373 343 239 244 261 256
Ecuador 52 67 88 95 175 160 183 300 276 329 324
Colombia 276 223 187 136 79 152 181 162 148 77 75
Others 04 10 14 22 41 21 20 19 18 18 18
TOTAL 598 634 662 732 746 785 835 812 785 782 769
ROMANIA
FROM
Ecuador 547 341 973 1272 1357
Colombia 60 19 39 29 39
Costa Rica 12 17 52 101 55
Honduras 28 28 40
Others 19 52 05 01 53
TOTAL 639 429 1097 1432 1543
RUSSIAN FEDERATION
FROM
Ecuador 5922 7233 7892 7911 7976 9202 9030 9112 9766 1 1999 1 1530
Costa Rica 09 175 10 155 275 21 659 326 482 386 446
China 65 54 41 26 15 30
Colombia 157 212 393 280 205 219 02 52 95 182 123
Vietnam 13 13 12 03 03 08 04
Philippines 139 208 232 212 304 251 315 245 298 355 335
Others 259 180 30 92 194 27 05 25 16 139 72
TOTAL 6500 8021 8569 8649 8954 9787 1 0068 9809 1 0686 1 3076 1 2536
SWITZERLAND
FROM
Costa Rica 383 367 294 278 240 264 184 172 161 156 154
Panama 70 40 40 65 98 125 204 155 165 118 117
Colombia 131 126 175 133 129 87 96 131 132 185 183
Ecuador 55 74 136 180 207 239 250 250 234 224 222
Honduras 01 06 06 01 - -
Others 104 109 84 85 67 68 87 100 106 111 110
TOTAL 743 722 735 742 741 782 821 808 799 794 786
8102019 Banana Import Export Global Stats
httpslidepdfcomreaderfullbanana-import-export-global-stats 28392323
Table 6 - Gross Imports by countries of origin 1
Tableau 6 - Importations brutes par pays drsquoorigine 1
Cuadro 6 - Importaciones brutas por paiacuteses de origen 1
2002 2003 2004 2005 2006 2007 2008 2009 2010 2011 2012
(prel)
( thousand tonnes milliers de tonnes miles de toneladas )
SLOVAKIA
FROM
Ecuador 58 63 15
Costa Rica 135 195 77
Colombia 163 161 60
Panama 119 89 35
Others 12 25 312
TOTAL 487 533 499
TUNISIAFROM
Cameroon 05 - 02 - - 01 05 - - -
Cocircte DrsquoIvoire - - 07 21 38 51 01 - -
Colombia 24 - 30 11 02 46 11 - - 03
Costa Rica - - 10 06 - - 01 18 53 44
Ecuador 133 138 491 169 161 289 313 349 134 366
Others 00 00 03 02 01 23 05 04 00 - 00
TOTAL 163 138 543 208 203 410 335 371 187 413
UNITED STATESFROM
Costa Rica 9015 9761 8653 8227 9274 1 0369 8744 5629 8536 8445 8482
Ecuador 1 0218 9725 9189 9043 9943 9292 8303 9576 9798 8790 7197
Honduras 4492 4321 5079 4530 4229 4827 5056 3887 4357 4452 5357
Guatemala 9252 9341 1 0208 1 0293 9129 1 0934 1 1887 1 1122 1 1515 1 3335 1 4586
Colombia 5064 4693 4646 5137 4738 3772 4508 4216 4609 3845 4402
Mexico 423 352 336 338 386 315 663 1052 1455 1486 2233
Panama 03 02 06 20 75 05 80 54 290 278 592
Nicaragua 297 416 415 381 305 328 311 249 360 356 363
Peru 232 138 124 223 251 178 225 197 201 232 259
Venezuela 37 19 20 07 03 - - - - - -
Dominican Rep 36 21 52 44 62 17 01 10 01 07 27
Others 01 02 00 00 - 00 00 00 00 26 01 - 00
TOTAL 3 9070 3 8792 3 8728 3 8244 3 8395 4 0038 3 9779 3 5992 4 1149 4 1227 4 3497
URUGUAY
FROM
Brazil 408 402 430 457 424 384 382 321 436 390 292
Ecuador 28 01 03 16 19 35 48 42 65 115 142
Others 02 07 04 00 04 01 - 00 53 05 09 14
TOTAL 438 411 437 473 446 420 430 416 506 515 4471 Figures may differ rom those shown in able 3 (a) which exclude re-exports1 Les chiffres dans ce tableau peuvent differer des chiffres du ableau 3 (a) qui ne comprennent pas les reacuteexportations1 Las ciras pueden dierir de las del Cuadro 3 (a) las cuales excluyen las reexportaciones
8102019 Banana Import Export Global Stats
httpslidepdfcomreaderfullbanana-import-export-global-stats 29392424
Table 7 - Import prices in selected countries monthly Tableau 7 - Prix agrave lrsquoimportation mensuels dans certains paysCuadro 7 - Precios mensuales de importacioacuten en algunos paiacuteses
FRANCE
2001 2002 2003 2004 2005 2006 2007 2008 2009 2010 2011 2012 2013
( Euro tonnes )
January 572 547 620 474 623 630 620 - 658 524 794 678 770
February 636 723 628 500 753 770 700 780 720 623 923 820 820
March 865 733 698 640 798 690 700 843 962 720 755 820 770
April 795 608 600 603 810 640 698 820 878 680 760 808 763
May 652 546 528 568 860 608 633 593 715 686 680 730 710
June 580 478 476 615 888 585 594 588 668 755 513 695 688
July 565 340 360 485 498 380 565 605 528 624 440 590 660
August 550 488 298 480 664 510 608 658 490 610 483 600 660
September 615 537 460 430 753 510 338 650 563 590 573 690 660
October 530 407 383 383 673 490 - 583 538 505 586 706 618
November 410 320 410 553 723 590 - 568 527 550 605 665 623
December 460 580 490 660 716 620 - 610 545 700 580 682 660
YEAR 603 525 496 533 730 585 606 663 649 631 641 707 700
USD ton 539 494 560 661 907 734 829 972 902 835 891 908 957
JAPAN2001 2002 2003 2004 2005 2006 2007 2008 2009 2010 2011 2012 2013
( Yen tonnes )
January 44 700 54 800 54700 52700 54900 46400 57700 55300 68100 55000 53000 52100 67800
February 49 100 66 000 60000 56600 56600 58200 64200 58400 69900 61900 56500 56900 71200
March 50 700 71 600 62700 65900 64600 58200 66400 63800 72600 68800 64500 65200 77100
April 54 000 83 200 66800 76400 66800 62900 79300 79100 82100 78300 74100 72200 82100
May 60 500 84 400 72800 70200 61600 64600 78700 82600 88300 77800 78500 72300 92500
June 54 400 80 100 68800 70900 65700 63600 73100 80800 88100 74700 75800 71100 89600
July 53 800 78 700 66400 64300 61900 63600 65000 83500 85500 71700 86200 69600 86600
August 56 500 64 000 68300 52800 60400 61200 64100 84300 81200 69400 72600 66400
September 60 600 65 900 69200 56500 60900 64600 72000 90900 74300 68500 68200 62000
October 53 500 63 700 58200 55100 57000 65100 65700 85600 64200 60900 61600 61000
November 48 700 54 400 51600 55600 49500 60600 59000 80400 58100 48500 60600 59100
December 48 900 50 800 49100 56100 47900 55300 56500 67100 52100 52100 55400 59900
YEAR 52 950 68 133 62 383 61 092 58 983 60 358 66 808 75 983 73 708 65 633 67 250 63 983 80986
USD kg 436 543 538 565 535 519 567 735 788 748 843 802 829
8102019 Banana Import Export Global Stats
httpslidepdfcomreaderfullbanana-import-export-global-stats 30392525
Table 7 - Import prices in selected countries monthly Tableau 7 - Prix agrave lrsquoimportation mensuels dans certains paysCuadro 7 - Precios mensuales de importacioacuten en algunos paiacuteses
UNITED STATES
2001 2002 2003 2004 2005 2006 2007 2008 2009 2010 2011 2012 2013
( USD tonnes )
January 535 427 561 427 589 686 639 689 820 785 892 945 929
February 687 517 462 496 891 854 655 792 944 720 1 002 1 068 923
March 541 572 486 513 792 825 648 1027 909 838 996 1 144 937
April 551 544 384 529 593 730 648 967 890 825 1 027 1 030 903
May 637 626 296 556 618 926 689 923 830 799 1 011 953 909
June 610 648 308 604 486 655 779 868 854 962 976 954 910
July 698 537 296 61 401 560 734 722 827 985 961 965 923
August 683 420 286 548 405 542 697 799 834 899 951 951 940
September 572 486 312 539 594 544 665 803 818 880 947 965 937
October 484 544 328 496 630 549 659 807 810 916 954 956 931
November 496 396 408 492 589 598 651 903 834 908 956 934 923
December 506 625 370 496 646 658 648 830 796 900 942 944 923
YEAR 583 529 375 480 603 677 676 844 847 868 968 984 924
EUROPEAN UNION
2001 2002 2003 2004 2005 2006 2007 2008 2009 2010 2011 2012 2013
( Euro tonnes )
January 590 590 590 590 610 580 600 600 570 630 610 610
February 610 590 600 610 600 590 560 610 580 640 620 620
March 630 610 640 660 600 590 620 660 600 630 630 620
April 640 620 620 630 610 580 640 660 620 620 640
May 620 590 640 640 590 590 610 630 610 610 630
June 600 590 640 680 570 580 590 630 640 600 630
July 560 560 620 610 550 570 590 600 630 590 620
August 600 540 600 610 530 550 580 590 600 570 630
September 610 570 600 630 550 570 610 570 600 580 620
October 580 580 590 620 550 580 600 570 600 590 610November 560 560 600 640 580 580 590 580 600 580 620
December 590 580 620 630 570 560 600 550 610 610 620
YEAR 599 582 613 629 576 577 599 604 605 604 623 617
USD ton 564 656 762 782 722 789 878 839 801 840 801 843
8102019 Banana Import Export Global Stats
httpslidepdfcomreaderfullbanana-import-export-global-stats 31392626
Table 7 - Import prices in selected countries monthly Tableau 7 - Prix agrave lrsquoimportation mensuels dans certains paysCuadro 7 - Precios mensuales de importacioacuten en algunos paiacuteses
HUNGARY
2001 2002 2003 2004 2005 2006 2007 2008 2009 2010 2011 2012 2013
( Forint tonnes )
January 40 000 74 000 115 000 105 000 62 000 181 000 181 000 186 000 188 000 158000 210000 197000
February 39 000 76 000 119 000 109 000 171 000 189 000 189 000 210 000 221 000 172000 213000 236000
March 39 000 83 000 122 000 105 000 179 000 185 000 178 000 226 000 268 000 195000 197000 224000
April 40 000 105 000 137 000 112 000 164 000 190 000 174 000 200 000 241 000 180000 198000 225000
May 39 000 112 000 104 000 176 000 180 000 176 000 160 000 160 000 205 000 200000 185000 211000
June 37 000 108 000 108 000 157 000 184 000 177 000 151 000 149 000 207 000 220000 157000 202000
July 47 000 76 000 105 000 137 000 136 000 129 000 138 000 142 000 186 000 174000 141000 172000
August 45 000 81 000 90 000 104 000 140 000 148 000 151 000 161 000 179 000 160000 150000 187000
September 46 000 104 000 76 000 123 000 152 000 147 000 178 000 165 000 162 000 161000 162000 207000
October 47 000 93 000 98 000 159 000 149 000 145 000 159 000 160 000 151 000 173000 167000 196000
November 61 000 86 000 88 000 242 000 164 000 175 000 160 000 164 000 154 000 176000 165000 192000
December 76 000 92 000 96 000 245 000 163 000 167 000 174 000 181 000 155 000 204000 174000 208000
YEAR 46 333 90 833 104 833 147 833 153 667 167 417 166 083 175 333 193 083 181 083 176 583 204 750
USD ton 162 352 467 729 770 796 904 1 019 954 871 878 910
THE PEOPLErsquoS REPUBLIC OF CHINA (MAILAND)2001 2002 2003 2004 2005 2006 2007 2008 2009 2010 2011 2012 2013
( USD tonnes )
January 250 227 284 295 308 317 377 412 389 491 574
February 243 212 250 297 290 312 374 407 340 428 538
March 196 197 209 274 234 312 332 274 361 403 522
April 207 212 179 267 285 331 332 312 403 428 523
May 205 191 199 274 250 332 405 377 406 437 534
June 218 188 241 271 303 336 409 399 428 484 574
July 228 191 244 267 325 339 41 411 426 526 646
August 195 173 247 240 319 325 381 379 406 528 672
September 202 244 270 276 317 326 394 432 460 534 677
October 213 233 295 290 329 342 375 408 472 501 650
November 220 251 272 292 328 353 403 424 462 541 658
December 215 266 279 296 326 371 398 281 258 577 616
YEAR 216 215 247 278 301 333 352 376 401 490 599
Source United States official dataJapan Monthly Bulletin o Banana Statistics Japan Banana Importersrsquo AssociationFrance Marcheacutes Europeacuteens des Fruits et Leacutegumes Revue drsquoInormation Economique
8102019 Banana Import Export Global Stats
httpslidepdfcomreaderfullbanana-import-export-global-stats 32392727
Table 8 - Wholesalersrsquo selling prices in selected countries monthly Tableau 8 - Prix de vente en gros mensuels dans certains paysCuadro 8 - Precios mensuales de venta al por mayor en algunos paiacuteses
JAPAN
2001 2002 2003 2004 2005 2006 2007 2008 2009 2010 2011 2012 2013
( Yen kgs )
January 81 117 107 106 103 96 120 129 160 126 121 121 139
February 98 135 133 109 115 122 142 145 157 144 129 124 150
March 101 146 130 139 132 120 157 155 151 146 140 130 161
April 123 155 133 149 123 117 167 159 162 142 148 135 172
May 128 154 144 140 119 126 163 154 165 140 145 135 169
June 103 153 131 138 122 122 145 153 160 142 140 133 161
July 112 148 128 119 115 115 135 152 149 141 133 130 153August 106 116 125 101 112 115 134 150 140 135 122 125
September 113 130 126 108 115 128 138 158 137 129 125 119
October 101 128 117 113 107 134 132 178 130 120 133 118
November 102 102 98 113 98 123 128 164 122 101 131 116
December 97 95 98 109 80 111 125 151 116 101 122 121
YEAR 105 132 123 120 112 119 141 154 146 131 132 126 158
USD kg 087 105 106 111 101 102 119 149 156 149 166 157 162
UNITED STATES
2001 2002 2003 2004 2005 2006 2007 2008 2009 2010 2011 2012 2013
( USD kgs )
January 062 064 064 060 059 069 080 075 118 092 101 095 099
February 072 060 064 064 064 101 080 099 112 099 112 117 099
March 077 066 070 055 082 102 079 136 110 101 108 141 101
April 074 067 067 058 069 090 074 133 109 101 105 121 101
May 085 068 062 059 073 104 082 128 105 099 103 106 095
June 070 072 059 066 074 088 084 106 104 106 105 097 094
July 083 065 061 056 058 065 078 096 101 118 096 096 094
August 081 061 058 048 049 061 074 093 101 099 095 096 094
September 080 061 057 047 061 067 082 094 099 088 092 105 094
October 067 056 056 048 066 069 079 096 094 099 091 104 092
November 058 054 055 046 061 065 072 093 091 094 092 099 090
December 063 061 057 055 073 072 069 093 090 096 096 097 088
YEAR 073 063 061 055 066 079 078 104 103 099 100 106 095
8102019 Banana Import Export Global Stats
httpslidepdfcomreaderfullbanana-import-export-global-stats 33392828
Table 8 - Wholesalersrsquo selling prices in selected countries monthly Tableau 8 - Prix de vente en gros mensuels dans certains paysCuadro 8 - Precios mensuales de venta al por mayor en algunos paiacuteses
FRANCE
2001 2002 2003 2004 2005 2006 2007 2008 2009 2010 2011 2012 2013
( Euro kg )
January 084 079 093 081 100 098 090 090 085 079 101 087 104
February 093 095 097 082 112 107 097 105 094 083 122 104 107
March 115 107 103 097 120 103 099 113 122 093 106 105 105
April 115 103 094 093 114 094 097 104 110 094 095 105 105
May 099 090 079 093 112 091 090 081 096 093 091 105 101
June 086 078 080 094 126 094 086 081 091 096 079 105 097
July 092 069 063 082 089 071 078 081 080 085 074 092 090August 081 073 059 074 098 068 081 085 075 080 074 091 092
September 086 080 078 077 106 073 094 084 079 081 080 100 095
October 081 068 076 075 097 074 082 079 081 074 081 102 093
November 075 062 074 085 097 086 075 077 076 079 083 095 092
December 074 082 076 105 102 090 085 081 083 092 081 095
YEAR 090 082 081 086 106 087 088 088 089 086 089 099 098
USD kg 081 077 091 107 132 109 120 130 124 114 124 127 134
EUROPEAN UNION
2001 2002 2003 2004 2005 2006 2007 2008 2009 2010 2011 2012 2013
( Euro kg )
January 094 095 089 097 101 101 102 101 094 113 101 110
February 102 099 091 107 104 104 117 106 094 122 113 108
March 112 105 096 111 102 104 128 125 106 113 117 105
April 114 105 096 111 098 103 122 124 110 111 116 107
May 106 093 093 118 095 100 103 112 111 111 113 108
June 095 091 094 125 094 098 096 112 114 100 110 110
July 078 074 084 099 080 094 094 100 104 091 101
August 088 074 075 097 078 093 093 095 097 090 102
September 093 080 078 107 081 101 091 096 099 092 109
October 084 081 079 103 079 100 095 096 094 094 108
November 077 081 083 104 083 093 096 093 096 094 105
December 085 086 098 104 089 098 097 095 104 095 103
YEAR 094 089 088 107 090 099 103 105 102 102 108 108
USD kg 088 100 109 133 113 136 151 145 135 142 139 148
8102019 Banana Import Export Global Stats
httpslidepdfcomreaderfullbanana-import-export-global-stats 34392929
Table 8 - Wholesalersrsquo selling prices in selected countries monthly Tableau 8 - Prix de vente en gros mensuels dans certains paysCuadro 8 - Precios mensuales de venta al por mayor en algunos paiacuteses
THE PEOPLErsquoS REPUBLIC OF CHINA (MAILAND)
2001 2002 2003 2004 2005 2006 2007 2008 2009 2010 2011 2012 2013
( RMB kg )
January 294 305 333 282 309 310 357 351 304 433 494 385
February 376 319 316 292 324 345 375 343 346 475 508 431
March 369 288 319 275 342 380 366 345 356 511 486 451
April 370 285 342 276 368 334 383 391 407 611 465 478
May 301 278 355 274 386 289 371 457 456 566 432 526
June 264 260 338 272 386 257 356 444 483 415 414 527July 228 249 292 265 339 228 313 408 435 336 379
August 224 249 277 265 270 239 313 383 397 344 373
September 240 273 268 315 324 276 341 356 397 401 378
October 232 270 259 314 285 304 345 329 369 443 397
November 218 290 271 306 276 294 372 300 370 495 386
December 235 311 272 304 291 314 342 288 398 497 380
YEAR 279 281 304 287 325 298 353 366 393 461 424 466
USD kg 034 034 037 035 041 039 051 054 058 071 067 077
URUGUAY
2001 2002 2003 2004 2005 2006 2007 2008 2009 2010 2011 2012 2013
( Pesos uruguayos kg )
January 947 1041 981 1134 1384 1708 1799 1792 2014 1888
February 715 861 886 1160 1309 1603 1766 1605 1803 2102
March 892 937 859 1185 1394 1634 1812 187 1777 2174
April 1064 1025 925 1393 1433 1625 1927 1809 1802 2609
May 920 825 873 1111 1285 1519 1825 169 1744 2057
June 833 843 735 1157 1225 1545 1784 1758 174 2069
July 875 888 730 1267 1588 1874 176 1752 2195
August 837 974 893 1221 1414 1659 1969 182 1814 2092
September 891 887 1041 1256 1531 1607 1928 1844 1843 1909
October 1128 843 1248 1594 1545 1795 1963 1891 1867 1992
November 1107 812 1260 1478 1647 2068 1916 1944 1837 1915
December 860 925 1232 1397 2088 2001 1750 2174 1957
YEAR 922 905 972 1279 1478 1696 1859 1830 1829 2091
USD kg 033 032 040 053 063 081 082 091 095 103
8102019 Banana Import Export Global Stats
httpslidepdfcomreaderfullbanana-import-export-global-stats 35393030
Table 8 - Wholesalersrsquo selling prices in selected countries monthly Tableau 8 - Prix de vente en gros mensuels dans certains paysCuadro 8 - Precios mensuales de venta al por mayor en algunos paiacuteses
UNITED KINGDOM2001 2002 2003 2004 2005 2006 2007 2008 2009 2010 2011 2012 2013
( pence kg )
January 370 570 570 530 630 690 610 720 700 550 950 767 787
February 600 650 600 460 790 670 610 900 730 590 1020 877 778
March 760 720 700 550 690 560 570 850 1090 730 730 975 704
April 750 670 600 530 750 550 590 760 990 770 800 803 773
May 700 630 540 540 910 640 580 680 880 830 820 779 790
June 660 530 520 610 870 660 560 600 930 940 620 772 710
July 600 430 390 530 590 490 520 630 670 790 570 734 714
August 550 490 450 460 690 500 570 660 640 750 590 699
September 590 520 490 530 770 530 650 670 660 740 650 776
October 500 480 440 460 680 530 570 580 650 600 600 655
November 480 400 430 530 680 480 520 610 550 630 590 632
December 470 540 380 650 600 540 530 620 560 690 630 651
YEAR 586 553 509 532 721 570 573 690 754 718 714 760 751
USD kg 084 083 083 097 131 105 115 127 117 111 114 120 121
BANANA ORGANIC
USA
2008 2009 2010 2 011 2012 2013
( USD kg )
January 112 138 131 127 134 136
February 112 138 127 140 138 132
March 154 138 128 142 138 125
April 160 138 127 129 141 127
May 147 138 135 141 135
June 152 138 138 140 138
July 137 138 134 138 138
August 136 134 138 138 131
September 138 125 142 136 135
October 138 129 138 135 138
November 138 134 123 136 135
December 134 131 127 134 137
YEAR 138 135 132 136 136 131
SourceUnited States USDA C amp MS Fruit and Vegetable Division Market News daily reports
Japan Monthy Bulletin o Banana Statistics Japan Banana Importersrsquo Association
8102019 Banana Import Export Global Stats
httpslidepdfcomreaderfullbanana-import-export-global-stats 36393131
Table 9 - Retail prices in selected countries monthly Tableau 9 - Prix mensuels au detail dans certains paysCuadro 9 - Precios mensuales al por menor en algunos paiacuteses
FRANCE
2001 2002 2003 2004 2005 2006 2007 2008 2009 2010 2011 2012 2013
( Euro kg )
January 150 151 162 150 163 173 160 165 160 156 170 162 175
February 157 164 167 152 178 176 163 172 164 156 185 170 182
March 169 181 171 156 182 177 166 179 175 164 188 177 181
April 185 182 174 162 185 172 168 188 190 169 180 184 184
May 180 177 162 158 193 169 168 176 179 167 178 180 181
June 171 171 162 161 203 169 165 169 174 173 173 178 184
July 174 148 151 158 187 163 163 169 168 173 167 178 184
August 162 145 144 147 165 154 157 168 158 166 160 172 180
September 161 155 143 138 172 152 163 165 155 162 157 170 176
October 158 144 143 143 169 147 166 163 157 159 158 172 175
November 151 139 140 140 168 154 160 158 154 157 162 175 175
December 145 141 147 161 174 157 163 158 153 163 161 175 176
YEAR 164 158 156 152 178 164 164 169 166 164 170 174 179
USD kg 146 149 176 189 222 205 224 248 230 217 236 224 245
HUNGARY2001 2002 2003 2004 2005 2006 2007 2008 2009 2010 2011 2012 2013
( Forint kg )
January 251 263 293 251 309 345 329 338 348 323 374 358 399
February 239 263 283 249 313 339 334 348 364 323 421 407 407
March 246 280 283 261 340 339 326 392 421 338 427 425 408
April 284 312 286 276 343 345 338 410 468 357 396 424 404
May 247 302 270 289 347 345 336 361 431 349 392 419
June 221 288 264 310 376 356 319 332 406 371 364 398
July 257 247 248 303 343 340 314 311 389 377 319 372
August 239 248 249 281 317 327 316 313 351 362 297 361
September 252 272 252 258 324 328 329 319 340 361 306 381
October 244 253 250 258 325 302 338 318 331 326 324 395
November 229 233 234 254 345 316 326 303 320 330 343 394
December 245 252 232 294 339 320 320 307 309 350 343 376
YEAR 246 268 262 274 335 334 327 338 373 347 359 393 405
USD ton 086 104 117 135 168 159 178 196 184 167 178 174 188
8102019 Banana Import Export Global Stats
httpslidepdfcomreaderfullbanana-import-export-global-stats 37393232
Table 9 - Retail prices in selected countries monthly Tableau 9 - Prix mensuels au detail dans certains paysCuadro 9 - Precios mensuales al por menor en algunos paiacuteses
UNITED STATES
2001 2002 2003 2004 2005 2006 2007 2008 2009 2010 2011 2012 2013
( USD kg )
January 108 112 116 113 107 108 111 115 139 129 131 133 134
February 116 111 112 111 111 112 112 119 141 129 138 133 135
March 114 114 113 110 112 112 112 132 140 127 137 134 134
April 112 111 113 111 111 112 114 138 139 128 137 133 132
May 112 114 111 108 110 113 111 139 137 126 136 132 133
June 112 113 115 110 109 113 113 140 139 127 135 133 133
July 113 114 113 112 109 112 112 138 136 129 135 133 133
August 108 110 113 112 107 108 112 140 135 127 134 131 131
September 108 110 109 108 107 106 111 139 133 126 134 132 132
October 109 111 108 107 108 108 112 138 132 128 134 133 129
November 106 111 110 103 106 108 114 138 124 128 132 132 129
December 107 111 111 104 106 110 116 136 126 129 132 134 131
YEAR 110 112 112 109 109 110 113 134 135 128 135 133 132
JAPAN
2001 2002 2003 2004 2005 2006 2007 2008 2009 2010 2011 2012 2013
( Yen kg )
January 218 225 235 232 243 222 236 217 224 225 221 207
February 224 239 241 249 239 230 236 226 235 228 220 201
March 237 260 243 248 242 240 238 229 238 232 225 207
April 237 257 241 257 238 251 244 226 255 229 227 211
May 262 262 242 260 245 250 240 226 252 236 218 205
June 282 258 229 262 250 253 240 231 248 227 216 200
July 278 254 229 262 252 246 229 232 240 226 220 200
August 308 246 219 261 241 229 232 232 241 222 210 202
September 295 257 229 257 240 230 232 231 239 230 215 205
October 279 259 230 259 239 235 227 228 238 219 225 194November 255 260 223 245 231 231 222 221 236 218 216 193
December 233 241 220 237 220 230 219 221 233 218 193
YEAR 259 252 232 252 240 237 233 227 240 226 219 202
USD kg 213 201 200 233 218 204 198 219 256 257 275 253
8102019 Banana Import Export Global Stats
httpslidepdfcomreaderfullbanana-import-export-global-stats 38393333
Table 9 - Retail prices in selected countries monthly Tableau 9 - Prix mensuels au detail dans certains paysCuadro 9 - Precios mensuales al por menor en algunos paiacuteses
THE PEOPLErsquoS REPUBLIC OF CHINA (MAILAND)
2001 2002 2003 2004 2005 2006 2007 2008 2009 2010 2011 2012 2013
( RMB kg )
January 325 350 385 335 345 365 415 410 365 495 55
February 410 375 395 350 365 395 435 415 420 545 595
March 420 335 365 345 385 425 450 425 435 58 58
April 435 340 375 350 410 435 460 465 490 67 54
May 395 365 385 365 425 325 455 510 530 63 53
June 320 380 365 370 430 290 425 490 565 5 51
July 295 305 365 360 370 260 400 485 587 46 48
August 285 315 345 365 325 280 410 465 490 45 45
September 290 335 350 385 390 285 425 430 510 49 485
October 310 355 368 390 335 360 438 425 480 53 52
November 305 376 370 375 315 340 465 390 450 575 49
December 310 395 375 380 320 375 350 385 470 59 495
YEAR 342 352 370 364 368 345 427 441 483 543 519
USD kg 041 043 045 044 046 045 061 065 071 084 082
8102019 Banana Import Export Global Stats
httpslidepdfcomreaderfullbanana-import-export-global-stats 3939

8102019 Banana Import Export Global Stats
httpslidepdfcomreaderfullbanana-import-export-global-stats 339
Te designations employed and the presentation of material in this informationproduct do not imply the expression of any opinion whatsoever on the part of theFood and Agriculture Organization of the United Nations (FAO) concerning thelegal or development status of any country territory city or area or of its authoritiesor concerning the delimitation of its frontiers or boundaries Te mention of specificcompanies or products of manufacturers whether or not these have been patenteddoes not imply that these have been endorsed or recommended by FAO in preference toothers of a similar nature that are not mentioned
Te views expressed in this information product are those of the author(s) and do notnecessarily reflect the views or policies of FAO
FAO encourages the use reproduction and dissemination of material in this informationproduct Except where otherwise indicated material may be copied downloaded andprinted for private study research and teaching purposes or for use in non-commercialproducts or services provided that appropriate acknowledgement of FAO as the sourceand copyright holder is given and that FAOrsquos endorsement of usersrsquo views products orservices is not implied in any way
All requests for translation and adaptation rights and for resale and other commercialuse rights should be made via wwwfaoorgcontact-uslicence-request or addressed to
copyrightfaoorg
FAO information products are available on the FAO website (wwwfaoorgpublications)and can be purchased through publications-salesfaoorg
copy FAO 2014
Cover photographscopyFAOSimon MainacopyFAOAntonello Proto
8102019 Banana Import Export Global Stats
httpslidepdfcomreaderfullbanana-import-export-global-stats 439iii
Contents
FOREWORD iv
BANANA MARKE REVIEW 20129830852013 1 - 10
1 Developments in banana trade Exports Imports
2 Banana prices Import prices
Wholesale and retail prices
3 Policy developments
4 Current situation and short-term outlook
SAISICAL ABLES 11 - 33
able 1 - World gross exports by country able 2 - World net imports by country able 3 - EC otal supply of bananas and per capita supply able 4 - Per capita net imports by country able 5 - Exports by countries of destinationable 6 - Gross Imports by countries of originable 7 - Import prices in selected countries monthly able 8 - Wholesalersrsquo selling prices in selected countries monthly able 9 - Retail prices in selected countries monthly
8102019 Banana Import Export Global Stats
httpslidepdfcomreaderfullbanana-import-export-global-stats 539iv
foreword
Tis report is issued on an annual basis to Members and Observers o the Sub-Group onBananas o the Intergovernmental Group on Bananas and ropical Fruits
It is prepared by the Market and Policy Analyses of Raw Materials Horticulture andTropical (RAMHOT) Products Team rade and Market Division FAO Rome and thetables contained bring together the inormation available to FAO supplemented by dataobtained rom other sources in particular with regard to preliminary estimates
Te Market and Policy Analyses of Raw Materials Horticulture and Tropical (RAMHOT)Products Team provides economic data and analyses on major agricultural raw materialsand horticultural and tropical products Commodities covered under the eam includebananas and tropical fruits citrus fruits cotton hides and skins jute kenaf and alliedfibres sugar and tea Te eam also undertakes market reviews outlook appraisals and
projections and provides assistance to developing countries in designing and implementingnational policies or those agricultural commodities which enter into international trade
Te report is available at the ollowing FAO websitehttpwwwaoorgeconomicestest-commoditiesbananasen
8102019 Banana Import Export Global Stats
httpslidepdfcomreaderfullbanana-import-export-global-stats 6391
Banana market review 2012-2013
1 Developments in banana trade
Exports
In 20121 the volume o global gross banana exports reached a record high o 165million tonnes 11 million tonnes (or 73 percent) above 2011 level Te increase isprimarily explained by the growth o exports rom Latin America and the Caribbeanrom 125 to 130 million tonnes despite the poor perormance o Ecuador InEcuador the largest banana exporter in the world banana exports shrank as floodingdamaged the crop reducing the output by 416 000 tonnes or 56 percent relativeto 2011 Te resulting 410 000 tonnes decline in shipments rom Ecuador was morethan offset by vigorous exports rom other countries in particular those in CentralAmerica
Data or 2012 show a remarkable shif rom exports originating in South America towards greater exports rom Central America and Mexico While exports romSouth America declined by 64 percent relative to 2011 Central America and Mexicoexpanded their combined export volumes by 221 percent possibly in anticipation otrade preerences or Central American bananas in the European market as part othe Association Agreement As a result the average share o South America in global
banana exports has declined rom 502 percent in 2007-2011 to 436 percent in 2012while the share o Central America and Mexico increased rom 294 percent to 334percent
Costa Ricarsquos export quantity reached 21 million tonnes in 2012 126 000 tonneshigher than in 2011 overtaking Colombia as the second most important exporterin Latin America In 2012 banana exports rom Colombia dropped by 42 percentrom 191 in 2011 to 183 million tonnes mainly due to the spread o Moko diseaseGuatemalarsquos exports have also surpassed those o Colombia standing at 19 milliontonnes in 2012 - an increase o 232 percent (362 000 tonnes) compared to 2011In Honduras export volumes marked an astonishing 75 percent growth between2011 and 2012 reaching a record 901 000 tonnes in 2012 or double the 2003 exportsMexico also registered an important increase in shipments rom 178 000 tonnes in2011 to 308 000 tonnes in 2012 Peru is another dynamic exporter which had almostno exports prior to 2000 and reached 124 000 tonnes in 2012 or 138 percent aboveshipments made in 2011 most o which were air trade and organic bananas grownby smallholder associations
In the Caribbean exports continued to be dominated by the Dominican Republicwhich apart rom Belize is the only country among the Caribbean ACP countries
1 Provisional data received rom the countries and complemented with UN Comtrade data
8102019 Banana Import Export Global Stats
httpslidepdfcomreaderfullbanana-import-export-global-stats 7392
where bananas continue to be a major export despite the preerence erosion in theEuropean Union (EU) market thanks to the strong ocus on organic and air tradebananas Nevertheless ollowing a period o dynamic growth rom 2000 to 2011 in2012 Dominican banana exports declined by 22 percent to 297 000 tonnes OtherCaribbean countries have maintained very low volumes o exports continuing the
declining trend o recent years Jamaicarsquos exports have virtually disappeared since2008 and all production is now directed to the domestic market Exports rom otherCaribbean countries excluding Dominican Republic have also registered a steadydecline as a result o a combination o preerence erosion on exports to the EU andclimatic disasters that have severely undermined production Te combined exportsrom the Caribbean other than Dominican Republic plummeted rom 88 000 tonnesin 2009 to 21 000 tonnes in 2011 In 2012 a slight recovery is estimated to take placereflecting primarily an expansion in exports rom Saint Lucia rom 6 200 tonnes to12 100 tonnes
Exports rom Asia showed a remarkable recovery Afer substantial declines in
exports between 2006 and 2010 which were driven by shrinking exports rom thePhilippines the volume o exports rom the region rose 256 percent in 2011 and 271percent in 2012 reaching almost 282 million tonnes well above the previous recordo 24 million tonnes in 2006 Because o this recovery the Philippines returned tobeing the second largest exporter o bananas in the world afer Ecuador With theremarkable growth rates in both 2011 and 2012 the Philippines reached the peak oits export perormance in 2012 at 26 million tonnes corresponding to 939 percento all exports rom Asia
Africarsquos exports which accounted or 39 percent o global banana shipments grewby 24 percent in 2012 as exports reached 649 000 tonnes Cocircte drsquoIvoire the largestexporter in the region shipped 339 000 tonnes o bananas in 2012 or 60 percent morethan in 2011 while exports rom Cameroon the second largest Arican exporterdeclined by 10 per cent to 246 000 tonnes
Figure 1 Banana exports by region 2008-2012 million tonnes
120 123 118 125 130
23 19
18
222806 06
06
06
06
00
20
40
60
80
100
120
140
160
180
2008 2009 2010 2011 2012
Africa
Asia
Latin America
and Caribbean
8102019 Banana Import Export Global Stats
httpslidepdfcomreaderfullbanana-import-export-global-stats 8393
Imports
Te United States and EC-27 each imported approximately 27 percent o all bananastraded internationally in 2012 while other importers operated at a much smallerscale Afer a record high o almost 131 million tonnes o bananas imported by Russia
in 2011 when purchases grew by 224 percent those in 2012 declined by 41 percentto approximately 126 million tonnes A similar situation is observed in China Afera rapid expansion o banana imports over the past our years they declined rom therecord high o 910 000 tonnes in 2011 to 716 000 tonnes in 2012 corresponding to a213 percent drop mostly due to the increase in domestic production Japanrsquos importsregistered a moderate growth o 21 percent and reached almost 11 million tonnesin 2012
Figure 2 Distribution of global imports by market 2012 (thousand tonnes and share inglobal imports)
Weak demand in the EU was the main eature o the banana market in 2012 Accordingto the provisional data in 2012 EC-27 banana imports declined to approximately 449million tonnes (115 000 tonnes less than in 2011) the lowest level since 2006 Most
o the EUrsquos banana suppliers were affected by the decline but Ecuador Costa Ricaand the Dominican Republic registered largest decreases in export quantities In partthis drop was driven by an increase in bananas produced in the EU rom 612 000tonnes to 649 000 tonnes However the decline also reflected a drop in per capitaconsumption rom 104 kg in 2011 to 102 kg in 20122 Furthermore the appreciationo the United States (US) dollar constrained the demand or ldquodollar bananasrdquo Amongthe major exporters to the EU market only Peru Belize and Ghana increased theirexports to the region
2 Fruirop No 210 April 2013 CIRAD
4488 27
4350 27
1254 8
1086 7
716 4
934 6
668 4
2757 17EC-27
United States
Russian Fed
Japan
China
Other Asia
Latin America
Other
8102019 Banana Import Export Global Stats
httpslidepdfcomreaderfullbanana-import-export-global-stats 9394
Figure 3 Change in EUrsquos banana imports from 2011 to 2012 by origin
-200
-100
00
100
200
300
400
500
-800
-600
-400
-200
00
200
400
1000 tonnes (left axis) (right axis)
European bananas are mostly grown on the Canary Islands (Spain) where productionincreased by 24 000 tonnes in 2012 and Guadeloupe and Martinique (France) wherethe total production increased by 9 000 tonnes Minor quantities are also producedin Cyprus Greece and Portugal Bananas grown within the EU accounted or about126 percent o total EU consumption in 2012 At the same time the share o most-avoured-nation (MFN) bananas consumed in the EU was 683 percent whileconsumption o bananas imported rom the Arican Caribbean and Pacific Group oStates (ACP) accounted or 191 percent3
US imports on the contrary showed dynamic growth in 2012 increasing or thethird consecutive year Import volumes increased by 227 000 tonnes or 55 percentrelative to 2011 reflecting strong US demand or bananas Since domestic bananaproduction in the US is negligible net imports provide a good approximation ortotal per capita consumption which increased rom 116 kg in 2010 to 132 kg in2011 and urther to 138 in 20124 As a result imports registered a record 435 milliontonnes o bananas nearly as much as the EC-27 US imports rom Ecuador showeda considerable decline o 18 percent or 159 000 tonnes compared to 2011 reflectingprimarily lower output o bananas in Ecuador Tis decline was more than offset by
vigorous imports rom other sources and especially imports rom Central Americaand Mexico which increased by 326 000 tonnes Tis was consistent with the overallperormance o these exporters Mexicorsquos exports o bananas to the US registered aparticularly strong growth rate at 50 percent corresponding to an additional 75 000tonnes compared to 2011 Imports rom Colombia and Honduras also demonstrateda large increase
3 Bananas other than plaintains - Fact sheet European Commission Directorate-General or Agriculture andRural Development September 2013 (eceuropaeuagriculturebananasfact-sheet_enpdf )
4 A smaller increase is also observed in per capita consumption o citrus ruits (source httpwwwasusdagovpsdonline)
8102019 Banana Import Export Global Stats
httpslidepdfcomreaderfullbanana-import-export-global-stats 10395
2 Banana prices
Import pricesEUrsquos average import price in 2012 increased rom 604 eurostonne in 2011 to 623eurostonne fluctuating mildly between 600 and 650 eurostonne throughout theyear Te increase however was driven mainly by a stronger US dollar against theeuro while the demand remained sluggish In US dollar terms the EU import priceactually decreased rom USD 840 to USD 801 per tonne
Figure 4 Average annual import prices in EC-27 Japan and United States 2008-2012USDtonne
00
2000
4000
6000
8000
10000
12000
EC-27 United States Japan China
2008
2009
2010
2011
2012
In the US on the other hand the strong demand put upward pressure on importprices and they reached a record USD 984tonne on average in 2012 or 17 percentabove last yearrsquos the level Prices were particularly high during February March andApril 2012 exceeding USD 1 000tonne Import prices in Japan declined rom anaverage o 67 250 yentonne in 2011 to 63 983 yentonne in 2012 corresponding to a49 percent decline In dollar terms the reduction has been similar and the averageprice stood at USD 802tonne almost identical to the EU import price A strongseasonal variation also observed in previous years marked the prices in Japan during
2012 prices in April and May were almost one-third higher than those in Januaryand February In contrast import prices in China expressed in US dollars tend toincrease in the second hal o the year Between 2011 and 2012 the average annualimport price in China showed a remarkable improvement rom USD 490 to USD 599per tonne
8102019 Banana Import Export Global Stats
httpslidepdfcomreaderfullbanana-import-export-global-stats 11396
Figure 5 Monthly import prices in selected countries 2012
Wholesale and retail prices
US retail prices remained practically flat throughout 2012 at approximately USD 133kg although varied substantially during the first hal o 2012 peaking in March-April On average wholesale prices increased by 65 percent in 2012 compared to2011 while retail prices actually decreased 13 percent Tis apparent contradictioncould be explained by the act that supermarkets spread temporary losses rom higherwholesale prices across other products that they sell while maintaining the prices obananas or their consumers low which is a common marketing strategy
During 2012 wholesale and retail prices in France increased by 112 and 26 percentrespectively relative to 2011 with little fluctuation throughout the year Te averagewholesale price was 099 euroskg while the retail price was 174 euroskg In Japanwhere marketing margins are very high the decline in import prices in the second halo the year was only partially transmitted to wholesale and retail prices Compared
to 2011 average wholesale prices in Japan declined by 52 percent while retail pricesdeclined 81 percent Wholesale and retail prices in China also experienced a slumpdespite the increase in import prices by 79 and 45 percent respectively Domesticprices seemed to fluctuate in a similar manner throughout the year with a substantialdecline during the first hal o the year and partial recuperation in the second
40
45
50
55
60
65
70
75
Jan Feb Mar Apr May Jun Jul Aug S ep Oct Nov Dec
Japan 1000 yentonne
500
550
600
650
700
Jan Feb Mar Apr May Jun Jul Aug Sep Oct Nov Dec
EC-27 Eurotonne
800
900
1000
1100
1200
Jan Feb Mar Apr May Jun Jul Aug Sep Oct Nov Dec
United States USDtonne
500
550
600
650
700
Jan Feb Mar Apr May Jun Jul Aug Sep Oct Nov Dec
China US$tonne
8102019 Banana Import Export Global Stats
httpslidepdfcomreaderfullbanana-import-export-global-stats 12397
Figure 6 Monthly wholesale and retail prices in selected importing countries 2012
3 Policy developments
Te banana trade disputes between the EU and the Latin American banana producingcountries officially ended in 2012 Te longest series o disputes in the history othe World rade Organization (WO) dating back to 1992 was concluded on 8November 2012 by the signing o the Geneva Agreement on rade in Bananas which
was negotiated in 2009 between the EU and Latin American banana producers Atthe core o the agreement was the adoption o new commitments on MFN tariffs onbananas by the EU As the first step in 2009 the EU reduced its import tariff rom 176to 148 eurostonne Te maximum tariff rates are then set to decline reaching 114eurostonne in 2017 at the earliest or 2019 at the latest (see able 1)
Table 1 EUrsquos MFN tariff reduction schedule under the banana agreement
ariff rateseurotonne
15 December 2009ndash31 December 2010 148 eurotonne1 January 2011 143 eurotonne
1 January 2012 136 eurotonne
1 January 2013 132 eurotonne
1 January 2014 127 eurotonne
1 January 2015 122 eurotonne
1 January 2016 117 eurotonne
1 January 2017 114 eurotonne
3
35
4
45
5
55
6
65
Jan Feb Mar Apr May Jun Jul Aug Sep Oct Nov Dec
China RMBkg
Who lesale Retail
080
090
100
110
120
130
140
150
160
Jan Feb Mar Apr May Jun Jul Aug Sep Oct Nov Dec
United States USDkg
80
100
120
140
160
180
200
220
240
Jan Feb Mar Apr May Jun Jul Aug S ep Oc t Nov Dec
Japan Yenkg
W ho les al e Retail
060
080
100
120
140
160
180
200
220
Jan Feb Mar Apr May Jun Jul Aug Sep Oct Nov Dec
France Eurokg
W ho les al e Retai l
8102019 Banana Import Export Global Stats
httpslidepdfcomreaderfullbanana-import-export-global-stats 13398
In return or MFN tariff reduction by the EU the US and Latin American countriesagreed to cease all legal disputes against the EU at the WO and not demand anyadditional cuts or bananas in the Doha Round negotiations on agriculture At theaverage import price o 623 eurostonne in 2012 the MFN tariff o 136 eurostonnewas equivalent to 218 percent ad-valorem duty
Compared to the MFN tariff EU duties on bananas rom Colombia Peru and CentralAmerican countries have been reduced as part o the trade deals in the AssociationAgreements that these countries have signed with the EU Since 1 August 2013the ree trade provisions o the Agreements are applied to imports rom ColombiaHonduras Nicaragua and Panama while preerential trade arrangements betweenthe EU and Peru have been in orce since March 2013 Under these arrangementsthe preerential tariff or these countries was set at 124 eurostonne in 2013 and willbe gradually reduced to 75 eurostonne by 2020 Te same provisions would apply toCosta Rica Guatemala and El Salvador in the coming months Mexico is benefitingrom an import quota o 2 000 tonnes with an intra-quota duty o 70 eurostonne
ACP banana suppliers who have an Economic Partnership Agreement (EPA) withthe EU benefit rom duty and quota ree access to the EU market All current bananasuppliers in the ACP5 have concluded negotiations on either a ull or interim EPAand are thereore exempt rom any import duties on bananas However apart romsome o the Arican exporters ACP producers do not have the economies o scaleto compete with banana suppliers rom South and Central America Te situationis exacerbated by the lack o strategic partnerships along the value chain (in theexporter wholesaler and retailer segments) except or the Windward Islands whichmarket their bananas through their own distribution company
Te gradual reduction in the MFN tariff and preerential duties on bananas romLatin American countries entails preerence erosion or the ACP countries So arit appears that the implications or ACP banana exports to the EU have been rathersubdued with the exception o some o the Caribbean countries where preerenceerosion contributed to a decline already underway No sizable expansion o exportsrom Latin America to the EU has been registered afer the agreement on bananas wasreached Te EUrsquos imports rom the majority o Latin American countries decreasedin 2012 due to weak demand Among the ACP countries the perormance has beenmixed While countries like Belize managed to substantially expand their exports tothe EU others like Cameroon have seen their export share decrease Moreover some
ACP countries like Cocircte drsquoIvoire managed to diversiy their exports destinationswith significant growth in exports accounted or by the expansion in shipments todestination outside the EU
However preerence erosion remains a cause o concern or many ACP countrieso help them adjust to the new trade regime by either boosting the competitivenesso their banana sector or diversiying into other productive activities the EU isproviding financial support to these countries through the Banana AccompanyingMeasures (BAM) In total 190 million euros were allocated Tese support measures
5 Belize Cameroon Ivory Coast Dominica Dominican Republic Ghana Grenada Jamaica Saint LuciaSaint Vincent and the Grenadines and Suriname
8102019 Banana Import Export Global Stats
httpslidepdfcomreaderfullbanana-import-export-global-stats 14399
were proposed by the European Commission in March 2010 However the processo adopting BAM as a legal instrument has been protracted as the Council and theEuropean Parliament (EP) engaged in a series o extended debates on the proposalAn agreement was finally reached at the end o 2011 providing long awaited legalbasis or the BAM However the calls or project proposals to be supported with
BAM have only been launched in 2013
Te beneficiary countries are those which exported more than 10 000 tonnes per yearon average over the past decade Cameroon Cocircte drsquoIvoire and Ghana in Arica andBelize Dominica Dominican Republic Jamaica Saint Lucia Saint Vincent and theGrenadines and Suriname in the Caribbean
Table 2 BAM allocation by country euro million
Min Max
Belize 205 230
Cameroon 440 490
Cote drsquoIvoire 405 450
Dominica 140 155
Dominican R 150 165
Ghana 65 75
Jamaica 45 50
St Lucia 95 105
St Vincent amp the G 90 100
Suriname 85 95
Source Programming Guidelines Banana Accompanying Measures (BAM) 2012-2013 January 2012
4 Current situation and short-term outlook
Global supplies o bananas in 2013 could be severely affected by difficult cropprospects in Ecuador and the Philippines In Ecuador output projections indicatea urther decline in 2013 as the area under cultivation has shrunk Governmentestimates show planted area ell rom 200 000 hectares in January 2012 to 171 000hectares in February 2013 Tis decline in part reflects the pessimistic outlook o
Ecuadorian producers since their bananas will struggle to remain competitive in theEuropean market where practically all other exporters will be paying a preerentialtariff while Ecuador continues to pay an MFN duty rate In the Philippines weatherconditions have negatively affected banana production About one quarter o thebanana crop in the Philippines was destroyed by yphoon Bopha in December 2012 6Shipments o bananas rom Central America and Colombia on the other hand willremain solid aided by the entry into orce o the preerential duty rates charged onexports to the EU Exports rom Colombia are expected to recover once the campaignto eradicate Moko is successully completed
6 The devastating typhoon Haiyan that swept the Philippines in early November 2013 largely spared thePhilippines major banana producing region
8102019 Banana Import Export Global Stats
httpslidepdfcomreaderfullbanana-import-export-global-stats 153910
Te demand or bananas in both the EU and Russia seem to recover in 2013 as importsare showing promising signs During the first 9 months o 2013 import quantities inthe EU and Russia increased by 56 and 57 percent relative to the same period in2012 respectively 7 US imports are also likely to grow in 2013 as monthly importshave been consistently above those o 2012 in both value and volume Overall during
the first three quarters o 2013 the volume o US imports increased 46 percent
In 2013 the import prices in the US seemed to have stabilized at a somewhat lowerlevel compared to the record prices in 2012 Te average US import price during thefirst 6 months o 2013 stood at USD 923tonne or 74 percent lower than during thesame period in 2012 Tis is still well above the average import prices prevalent inthe EU although some countries like France are showing a tendency towards higherprices in 2013 Overall prices in the EU are expected to remain firm and close to the2012 level
Te ACP countries will continue to enjoy preerential access to the EU market
although the preerential margin vis-agrave-vis the major exporters such as Colombiaand Costa Rica will be shrinking over time as the ree trade agreements with thesecountries enter into orce Unless Ecuador enters into new negotiations with theEU it will continue paying higher tariffs than its major competitors underminingEcuadorrsquos export opportunities While the gap between the MFN tariff and thepreerential tariff o Colombia or example was not that high in 2013 (132 eurostonne versus 124 eurostonne) the difference will increase substantially by 2020unless a new reduction on the MFN tariff is achieved as part o multilateral tradetalks on agriculture At current import prices in the EU by 2020 Ecuador wouldbe paying 18 percent in ad-valorem tariff equivalent while the preerential rate orColombia Peru and Central America would be 12 percent
7 Based on GTA data
8102019 Banana Import Export Global Stats
httpslidepdfcomreaderfullbanana-import-export-global-stats 1639
STATISTICAL TABLES
8102019 Banana Import Export Global Stats
httpslidepdfcomreaderfullbanana-import-export-global-stats 17391212
Table 1 - World gross exports by country Tableau 1 - Exportations brutes mondiales par paysCuadro 1 - Exportaciones brutas mundiales por paiacutes
2000 2001 2002 2003 2004 2005 2006 2007 2008 2009 2010 2011 2012
(prel)
( thousand tonnes milliers de tonnes miles de toneladas )
Latin America amp Caribbean 9 7239 9 4433 9 9331 10 4715 10 4367 10 6201 11 2608 12 1333 11 9550 12 3458 11 7717 12 5270 13 0280
Central and South America 9 4791 9 1823 9 6743 10 2260 10 2225 10 3715 10 9502 11 8437 11 6878 11 9762 11 3922 12 2020 12 7054
Belize 658 501 430 749 805 763 730 611 827 818 792 837 993
Bolivia 94 129 165 284 427 536 762 795 858 894 884 983 727
Brazil 718 1051 2410 2208 1881 2122 1943 1857 1309 1439 1395 1101 957
Colombia 1 6802 1 5163 1 5704 1 4232 1 4709 1 6215 1 6974 1 7492 1 7983 2 1018 1 8026 1 9153 1 8349
Costa Rica 1 8833 1 7393 1 6226 1 9013 1 7925 1 6145 1 9611 2 1592 1 8726 1 5875 1 8209 1 9022 2 0286
Ecuador 3 9395 3 9904 4 1992 4 6712 4 5370 4 6539 4 7978 5 0571 5 1328 5 4731 4 9450 5 3919 4 9821
Guatemala 8013 8738 9717 9333 1 0138 1 0463 9826 1 3304 1 3547 1 4064 1 3691 1 5588 1 9208
Honduras 3753 4318 4414 4434 5277 5011 5162 5701 6057 5197 5124 5166 9014
Mexico 455 374 358 399 416 702 666 416 749 1401 1741 1776 3075
Nicaragua 455 441 408 409 449 455 377 389 378 347 200 82 93
Panama 4893 3211 4185 4102 3980 3483 4311 4386 3666 2572 2724 2669 2450
Peru 09 80 191 181 273 429 571 655 782 833 894 1088 1238
Suriname 354 287 280 01 214 396 474 562 654 570 791 629 831
Venezuela 361 233 265 203 360 456 117 106 14 01 01 08 12
Caribbean 2448 2609 2589 2455 2142 2487 3105 2896 2673 3696 3795 3250 3226 Dominican Republic 802 1302 1147 1267 1020 1671 2056 2120 1919 2818 3404 3038 2972
Jamaica 420 431 399 418 287 116 319 174 00 00 00 00 00
Others 1226 877 1042 771 835 700 731 602 754 877 391 212 254
Asia 17038 16896 17853 19443 19047 21693 24103 23121 23057 18574 17649 22174 28179
China 502 392 397 530 416 388 228 209 151 132 86 102 79
Malaysia 311 302 279 246 211 338 268 271 301 200 214 229 183
Pakistan 21 14 37 72 60 85 109 79 130 867 577 588 588
Philippines 1 5994 1 6007 1 6850 1 8294 1 7973 2 0243 2 3115 2 2177 2 1926 1 6641 1 5901 2 0555 2 6461
Tailand 58 55 52 63 177 418 203 214 228 256 228 252 276
Vietnam 45 42 146 126 72 39 21 16 26 17 35 32 32 Others 107 84 92 111 138 181 159 154 296 462 608 417 560
India 86 81 87 109 126 144 115 130 276 458 608 399 545
Africa 4941 4889 5329 5651 5568 5045 6057 5801 6114 5682 6435 6337 6488
Cameroon 2382 2541 2588 3137 2949 2655 2566 2323 2687 2555 2328 2490 2465
Cocircte drsquoIvoire 2173 2244 2560 2424 2524 2344 2864 2908 2643 2570 3356 3201 3394
Ethiopia 05 03 09 13 29 00 05 26 20 28 36 41 41
Others 93 48 107 77 65 46 621 544 764 528 714 606 588
Ghana 39 33 30 13 19 19 575 521 698 476 675 579 561
Oceania 03 01 01 01 01 01 01 01 01 01 01 01 01
WORLD 11 9221 11 6218 12 2514 12 9810 12 8982 13 2940 14 2768 15 0255 14 8723 14 7714 14 1802 15 3783 16 4948
8102019 Banana Import Export Global Stats
httpslidepdfcomreaderfullbanana-import-export-global-stats 18391313
Table 2 - World net imports by country Tableau 2 - Importations nettes mondiales par paysCuadro 2 - Importaciones netas mundiales por paiacutes
2000 2001 2002 2003 2004 2005 2006 2007 2008 2009 2010 2011 2012
(prel)
( thousand tonnes milliers de tonnes miles de toneladas )
DEVELOPING COUNTRIES 2 2705 1 9519 1 9760 2 3592 2 5037 2 7438 2 9908 3 0399 3 3967 3 3997 3 8240 4 1996 3 7561
Latin America amp Caribbean 6360 6031 5006 5591 5626 6007 5629 5986 6226 6143 6412 6814 6678
Argentina 3400 3301 2295 2864 3033 3022 2957 3189 3468 3441 3511 3949 3766
Chile 1926 1475 1491 1578 1597 1953 1689 1782 1750 1793 1757 1844 1906
El Salvador 590 612 614 566 515 531 491 538 527 435 487 448 498
Uruguay 330 489 438 411 437 476 451 422 431 416 506 515 447
Others 115 154 167 171 43 25 41 54 50 58 152 59 62
Asia 1 5762 1 1937 1 2007 1 5193 1 6148 1 9356 2 2266 2 1834 2 5295 2 5112 2 8624 3 1575 2 7362
China 6423 4676 4013 4811 4373 4142 4467 3873 4210 5536 7408 9095 7158
Iran 2000 756 1507 2710 2709 4509 3728 4477 7516 7128 6395 5909 3555
Jordan 53 29 22 15 21 63 93 202 330 256 396 483 498
Korea Rep 1842 1945 1872 2200 2083 2533 2797 3077 2581 2570 3379 3527 3680 Kuwait 233 238 255 261 302 305 676 889 961 929 911 1305 1398
Saudi Arabia 1869 1810 1765 1994 2115 2332 2351 2481 2567 2524 3074 3062 3062
Singapore 423 398 376 352 350 357 365 371 384 397 393 416 446
Syria 687 530 478 704 939 1116 3227 1927 2196 1837 2323 2722 2934
urkey 1242 416 646 919 1102 1510 1686 2243 2191 1824 2007 2346 2251
United Arab Emirates 685 796 683 707 1576 1748 2105 1229 1267 845 933 1287 1297
Others 305 343 391 520 578 742 771 1066 1094 1265 1403 1423 1084
Africa 582 1551 2748 2808 3263 2074 2013 2580 2446 2741 3203 3607 3521
Algeria 00 854 2315 2233 2046 1571 1472 1626 1639 1796 2079 2453 2310
Egypt 53 59 26 12 11 28 61 47 30 25 101 256 284
Morocco 00 28 14 11 22 49 54 172 187 267 281 246 282
Senegal 71 105 121 123 141 150 157 166 169 168 165 143 156
unisia 155 110 163 138 543 208 203 410 335 371 187 413 413
Others 303 394 109 291 500 68 67 158 86 115 391 95 76
DEVELOPED COUNTRIES 9 8804 9 6173 9 8594 10 1348 10 2763 10 3758 10 8862 11 4379 11 7050 11 0187 11 5162 12 3829 12 4955
EC ( 27 ) 3 8901 3 7718 3 8868 4 0230 4 0010 3 9230 4 3653 4 6824 4 8773 4 5370 4 5087 4 6030 4 4876
Other Europe 8126 9415 1 0599 1 1827 1 3155 1 4812 1 5319 1 6675 1 7004 1 5876 1 6729 1 9533 1 9018
Albania 178 85 187 227 172 168 168 202 174 172 175 174 174
Belarus 311 173 161 209 235 287 294 332 417 367 445 401 594
Bosnia Herzgovina 05 06 03 414 462 449 378 383 408 371 370 380 380
Croatia 419 432 451 506 508 540 515 548 570 521 494 487 463
Iceland 35 37 40 41 46 47 54 55 56 57 57 59 61
Macedonia Former YR 51 20 78 153 208 176 151 161 154 167 181 191 191
Moldova Rep 16 17 15 31 49 70 77 112 129 117 105 122 112 Norway 599 609 598 634 662 732 746 785 835 812 785 782 769
Russian Fed 4995 6067 6408 7870 8427 8528 8835 9597 9885 9694 1 0686 1 3076 1 2536
Serbia Montenegro 198 679 1134 151 975 578
Serbia 558 657 689 431 419 515 454
Montenegro 83 85 84 85 66 74 74
Switzerland 723 734 743 722 735 742 741 782 821 808 799 794 786
Ukraine 595 555 791 870 676 2494 2720 2975 2781 2273 2148 2478 2426
North America 4 0289 3 8387 3 9072 3 8738 3 8649 3 8223 3 8516 4 0151 3 9309 3 5429 4 1075 4 6293 4 8768
Canada 3984 4049 4170 4228 4406 4490 4567 4718 4776 4819 4961 5066 5270
United States 3 6304 3 4338 3 4902 3 4511 3 4242 3 3733 3 3950 3 5433 3 4534 3 0610 3 6114 4 1227 4 3497
Others 1 1488 1 0653 1 0054 1 0552 1 0949 1 1493 1 1374 1 0730 1 1963 1 3512 1 2271 1 1973 1 2294
Japan 1 0787 9906 9363 9866 1 0260 1 0669 1 0436 9706 1 0927 1 2526 1 1091 1 0641 1 0864 New Zealand 676 722 673 672 661 775 809 805 800 763 813 809 807
South Arica 26 26 18 14 28 50 129 219 236 222 367 523 623
WORLD 12 1508 11 5692 11 8354 12 4940 12 7800 13 1196 13 8770 14 4778 15 1017 14 4183 15 3401 16 5824 16 2516
8102019 Banana Import Export Global Stats
httpslidepdfcomreaderfullbanana-import-export-global-stats 19391414
Table 3 - EC Total supply of bananas and per capita supply Tableau 3 - CE Offre totale de banane et offre par habitantCuadro 3 - CE Oferta total de banano y oferta por habitante
2000 2001 2002 2003 2004 2005 2006 2007 2008 2009 2010 2011 2012
( thousand tons milliers de tonnes miles de toneladas )
France 3589 3228 3589 3292 3053 2805 2686 1673 1716 2358 2420 2425 2517
Guadeloupe 876 890 951 855 591 542 478 380 467 556 426 615 669
Martinique 2713 2337 2639 2437 2462 2262 2208 293 1249 1802 1994 1810 1848
Spain 3976 4209 4073 4009 4184 3450 3482 3614 3713 3520 3970 3465 3710
Greece 33 29 24 27 29 29 29 29 27 26 19 20 22
Cyprus 85 98 105 112 105 58 65 60 42 32 50 56 57
Portugal 225 207 219 214 212 142 153 172 178 145 137 153 177
Production 7907 7771 8011 7654 7582 6484 6416 5547 5676 6080 6595 6118 6485
Net Imports
EC (27) 3 8901 3 7718 3 8868 4 0310 4 0125 3 9230 4 3676 4 6824 4 8738 4 5372 4 5086 4 6030 4 4899
Supply 4 6807 4 5489 4 6880 4 7965 4 7707 4 5714 5 0092 5 2371 5 4414 5 1453 5 1682 5 2149 5 1383
Per capita supply 1231 1191 968 986 977 931 1016 1058 1095 1031 1032 1038 1021
Source EC Commission
8102019 Banana Import Export Global Stats
httpslidepdfcomreaderfullbanana-import-export-global-stats 20391515
Table 4 - Per capita net imports by country Tableau 4 - Importations nettes par habitant par paysCuadro 4 - Importaciones netas por habitante por paiacutes
2000 2001 2002 2003 2004 2005 2006 2007 2008 2009 2010 2011 2012
(prel)
( kg per capita kg par habitant kg por habitante )
DEVELOPING COUNTRIES 127 108 108 128 135 147 158 160 177 175 196 213 185
Latin America amp Caribbean 932 875 719 796 793 839 779 821 847 828 856 902 876
Argentina 921 885 610 754 791 781 758 810 873 859 869 969 916
Chile 1249 945 945 989 990 1198 1026 1071 1042 1058 1027 1068 1094
El Salvador 994 1026 1026 942 854 878 808 882 860 705 786 719 795
Uruguay 994 1472 1317 1237 1316 1432 1356 1266 1288 1240 1501 1523 1319
Others 174 228 243 246 061 035 055 073 066 076 195 074 077
Asia 100 075 075 094 099 118 135 131 151 148 168 184 154
China 051 037 032 038 034 032 034 030 032 042 056 068 052
Iran 306 114 224 398 393 647 528 627 1040 975 865 790 470
Jordan 109 059 044 029 040 118 169 356 564 426 641 762 771
Korea Rep 401 421 403 472 445 538 592 648 541 536 701 729 757 Kuwait 1203 1183 1231 1227 1378 1345 2877 3630 3771 3511 3328 4631 4834
Saudi Arabia 933 875 822 893 911 970 948 973 981 941 1120 1090 1067
Singapore 1078 999 931 861 841 838 828 809 804 802 774 802 848
Syria 430 322 282 403 522 604 1706 997 1115 916 1138 1311 1389
urkey 195 064 099 139 164 222 244 320 309 254 276 319 302
United Arab Emirates 2258 2529 2099 2078 4309 4295 4514 2273 2041 1218 1242 1631 1600
Others 031 034 038 051 056 070 072 097 098 111 121 120 090
Africa 039 103 180 181 207 129 124 156 146 161 185 205 197
Algeria 000 276 736 700 632 478 441 480 476 514 586 682 633
Egypt 008 009 004 002 002 004 008 006 004 003 013 031 034
Morocco 000 010 005 004 007 016 017 056 060 084 088 076 086
Senegal 075 108 120 120 133 138 141 145 144 138 133 112 119
unisia 164 116 169 142 553 210 202 405 327 358 178 390 386
Others 1726 2207 601 1590 2699 360 352 821 439 579 1947 470 368
DEVELOPED COUNTRIES 813 789 805 825 833 837 875 916 933 875 911 976 981
EC ( 27 ) 808 781 802 826 818 799 885 946 981 909 901 917 891
Other Europe 331 385 435 488 545 616 639 696 711 665 702 821 800
Albania 581 275 605 731 549 535 533 636 547 540 547 541 539
Belarus 309 173 161 210 238 292 301 341 431 381 463 419 623
Bosnia Herzgovina 014 016 007 1093 1223 1188 999 1014 1081 986 983 1013 1015
Croatia 929 964 1009 1135 1142 1215 1161 1237 1291 1182 1121 1107 1055
Iceland 1246 1286 1401 1414 1573 1591 1778 1803 1785 1818 1797 1818 1855
Macedonia Former YR 254 101 383 755 1021 863 738 786 751 812 878 925 923
Moldova Rep 040 042 037 079 128 185 207 306 354 326 295 344 318
Norway 1334 1350 1319 1390 1444 1584 1599 1662 1748 1681 1607 1588 1550
Russian Fed 340 415 440 543 584 593 616 670 690 678 747 915 878
Serbia Montenegro 184 634 1066 143 926 552
Serbia 568 668 700 437 425 522 461
Montenegro 1318 1356 1338 1343 1040 1172 1170
Switzerland 1009 1019 1024 988 999 1001 992 1040 1085 1060 1042 1031 1016
Ukraine 122 115 165 183 143 532 584 643 605 497 473 548 540
North America 1287 1213 1222 1200 1186 1161 1159 1198 1162 1038 1193 1332 1392
Canada 1299 1308 1333 1338 1379 1391 1400 1431 1433 1431 1458 1475 1520
United States 1285 1203 1210 1185 1164 1136 1133 1172 1132 995 1164 1317 1377
Others 659 608 571 597 616 645 635 597 664 748 678 660 677
Japan 858 787 743 782 812 844 825 767 864 990 876 841 859
New Zealand 1753 1847 1700 1670 1619 1874 1932 1901 1869 1766 1862 1832 1809
South Arica 006 006 004 003 006 010 027 045 048 045 073 104 123
WORLD 404 382 388 407 413 422 443 459 475 451 477 512 492
8102019 Banana Import Export Global Stats
httpslidepdfcomreaderfullbanana-import-export-global-stats 21391616
Table 5 - Exports by countries of destination 1
Tableau 5 - Exportations par pays de destination 1
Cuadro 5 - Exportaciones por paiacuteses de destino 1
2002 2003 2004 2005 2006 2007 2008 2009 2010 2011 2012
(prel)
( thousand tonnes milliers de tonnes miles de toneladas )
BELIZE
O
United Kingdom 430 749 805 763 730 609 821 798 788 711 990
Others 06 20 04 126 03
TOTAL 430 749 805 763 730 611 827 818 792 837 993
BRAZIL
O
Argentina 1631 1297 914 979 561 583 339 522 385 231 354
Italy 208 234 171 191 128 86 70
Uruguay 395 401 423 478 429 393 388 364 372 338 350
United Kingdom 301 259 306 361 546 400 165 190 120 140 147
Others 84 251 30 69 236 290 290 276 448 392 107
TOTAL 2410 2208 1881 2121 1943 1857 1309 1439 1395 1101 957
COLOMBIA
O
Belgium-Lux 5669 4763 5707 6246 6048 5023 6122 5194 4162 5093 5397
United States 5682 4869 4634 5259 4802 4767 4884 6765 5478 4767 3173
UK 264 2563 2740 4468
Italy 1226 1193 1120 1006 721 991 1147 1801 2122 2236 2425
Russian Federation 147 177 501 311 184 215 52 04 35 China 191 - - - - - -
Saudi Arabia 05 66 27 - - - -
Germany 2064 1929 1351 1615 2086 3698 2882 2909 2181 3560 1532
Others 720 1235 1369 1778 3133 2798 2948 4032 1516 723 1355
TOTAL 1 5704 1 4232 1 4709 1 6215 1 6974 1 7492 1 7983 2 1018 1 8026 1 9153 1 8349
COSTA RICA
O
North America 8093 9276 8548 7911 9505 1 0382 8557 6569 8553 8832 8723
Europe 8133 9733 9376 8073 9462 9541 9112 8135 8654 8553 9960
Russian Federation 154 693 303 439 438 1546
Others 00 04 01 161 490 1670 364 868 563 1199 57TOTAL 1 6226 1 9013 1 7925 1 6145 1 9611 2 1592 1 8726 1 5875 1 8209 1 9022 2 0286
COcircTE DrsquoIVOIRE
O
France 1740 1288 1201 1432 1238 998 813 1333 871 494 707
UK 64 198 228 306 420 402 418 510 887 892 921
Germany 01 - 168 207 194
Italy 09 - 03 - 03
Belgium - Luxembourg 917 422 950 1218 1077 375 857 1130 1029
Senegal 140 131 144 149 200 213 214 179 239 167 210
Others 616 805 34 35 55 78 110 173 331 311 331
TOTAL 2560 2422 2524 2344 2864 2908 2643 2570 3356 3201 3394
8102019 Banana Import Export Global Stats
httpslidepdfcomreaderfullbanana-import-export-global-stats 22391717
Table 5 - Exports by countries of destination 1
Tableau 5 - Exportations par pays de destination 1
Cuadro 5 - Exportaciones por paiacuteses de destino 1
2002 2003 2004 2005 2006 2007 2008 2009 2010 2011 2012
(prel)
( thousand tonnes milliers de tonnes miles de toneladas )
DOMINICA
O
United Kingdom 164 134 133 118 118 72 105 364 39 41 23
Others 10 - 00 28 23 23 24 17 01 00 00 00
TOTAL 175 134 161 141 141 96 122 365 39 41 23
DOMINICAN REPUBLIC
O
Belgium-Lux 290 472 215 213 262 298 376 619 731 490 591
Italy 79 53 62 71 107 57 14 04 03 60 21United Kingdom 562 604 627 1271 1274 1585 1316 1669 2051 1 803 1 773
United States 34 26 41 33 72 17 04 20 02 05 09
Others 182 112 75 84 341 163 209 507 618 680 579
TOTAL 1147 1267 1020 1671 2056 2120 1919 2818 3404 3038 2972
ECUADOR
O
United States 1 1284 9382 9246 9562 9425 7297 8805 1 1445 1 0001 8942 7256
Italy 9337 1 1752 1 1745 1 1317 9455 9163 9439 1 0043 8401 7337 5906
Germany 5018 5232 4691 5200 4247 3202 5324 5250 4473 5740 4132
Belgium-Lux 2036 2140 2205 1686 2004 2633 3904 3189 3472 3187 2852
Russian Federation 8742 9766 1 0310 1 1439 9893 9103 1 3947 1 3151 1 0624 1 2140 1 1401Argentina 394 1095 1419 1227 1053 1120 2156 1955 1813 326 421
Chile 1678 2195 1847 1840 1893 1421 1857 1977 2076 3992 3955
Japan 1708 1552 1330 982 923 446 532 664 447 354 357
New Zealand 619 397 418 384 310 239 303 322 313 235 225
Poland 410 48 - 67 - 42 225 172 266 207
China 168 108 39 04 45 10 19 102 451
Iran - - - 39 - - - 10 21 24
Others 597 3201 2004 2823 8706 1 5943 4217 3088 1 2900 6805 1 6756
TOTAL 4 1992 4 6712 4 5370 4 6539 4 7978 5 0571 5 1328 5 4731 4 9450 5 3919 4 9821
GRENADA
OUnited Kingdom 06 04 04 03 02 05
TOTAL 06 04 04 - 03 02 05
GUATEMALA
O
United States 8259 9251 8617 8894 9216 6001 1 2215 1 3638 1 2652 1 3384 1 5841
United Kingdom - - - 04 10 10 51 15 11 16 28
Italy - - - 03 46 04 - 01 23 416 152
El Salvador 31 28 315 493 416 213 952 243 875 733 825
Others 1427 54 1206 1070 138 7076 329 167 130 1039 2362
TOTAL 9717 9333 1 0138 1 0463 9826 1 3304 1 3547 1 4064 1 3691 1 5588 1 9208
8102019 Banana Import Export Global Stats
httpslidepdfcomreaderfullbanana-import-export-global-stats 23391818
Table 5 - Exports by countries of destination 1
Tableau 5 - Exportations par pays de destination 1
Cuadro 5 - Exportaciones por paiacuteses de destino 1
2002 2003 2004 2005 2006 2007 2008 2009 2010 2011 2012
(prel)
( thousand tonnes milliers de tonnes miles de toneladas )
HONDURAS
O
United States 3913 3915 4984 4535 4569 4586 5656 4829 4560 4598 8022
Belgium-Lux 155 84 183 226 212 215 122 73 154 155 270
Germany
Italy 09
United Kingdom 13 46 07 26 26 45
Others 324 436 110 250 381 900 233 288 384 387 676
TOTAL 4414 4434 5277 5011 5162 5701 6057 5197 5124 5166 9014
JAMAICA
O
United Kingdom 399 418 287 116 319 174 00 00 00 00 00
Others 00 - 00 00 00 00 00 00 00 00 00 00
TOTAL 399 418 287 116 319 174 00 00 00 00 00
MEXICO
O
United States 334 277 363 379 429 367 593 1238 1552 1635 2499
Japan 54 47 37 30 29
Spain 01 56 64 70 54
Russian Fed 01 23 09 01 01Others 24 122 53 323 237 49 100 36 78 40 492
TOTAL 358 399 416 702 666 416 749 1401 1741 1776 3075
PANAMA
O
Germany 162 131 166 22 118 01 46 - 28 05 29
United States - - 06 59 175 136 266 47 281 340 150
Belgium-Lux 1201 888 739 578 765 716 91 30 78 00 00
Portugal 1056 1031 817 430 415 438 101 65 113 196 160
Sweden 1743 1785 2093 1922 2129 2331 2315 1385 1855 1530 1391
Italy - - 66 116 160 88 490 57 49 179 123
Others 22 267 93 356 549 676 358 989 320 419 596TOTAL 4185 4102 3980 3483 4311 4386 3666 2572 2724 2669 2450
PHILIPPINES
O
Japan 8477 8840 9152 9182 9095 9142 1 1065 9138 7921 8922 1 0848
Iran 93 304 1699 2234 3727 4287 4013 2506 2196 1497 990
Saudi Arabia 507 01 102 187 65 217 120 95 78 1161
China 3788 4156 3309 3512 3815 2034 1815 983 1658 4034 4220
China Hong Kong SAR 04 243 201 199 152 190 383 223 75 198 903
Korea Rep o 1519 1588 1386 2341 2649 2756 1866 1321 1133 1979 2655
United Arab Emirates 2092 2002 1576 1799 2075 1672 711 572 789 1016 2628
Others 370 1161 650 874 1415 2031 1857 1778 2034 2831 3056
TOTAL 1 6850 1 8294 1 7973 2 0243 2 3115 2 2177 2 1926 1 6641 1 5901 2 0555 2 6461
8102019 Banana Import Export Global Stats
httpslidepdfcomreaderfullbanana-import-export-global-stats 24391919
Table 5 - Exports by countries of destination 1
Tableau 5 - Exportations par pays de destination 1
Cuadro 5 - Exportaciones por paiacuteses de destino 1
2002 2003 2004 2005 2006 2007 2008 2009 2010 2011 2012
(prel)
( thousand tonnes milliers de tonnes miles de toneladas )
PERU
O
United States 112 135 122 231 264 179 239 198 198 235 278
Belgium 39 22 61 92 100 48 72 38 71 55 72
Netherlands 03 02 47 59 115 277 320 432 457 609 659
Germany 33 - 04 04 44 67 57 34 59 32 55
Japan 01 34 42 44 79 73 101 79 88 118
Others 04 20 04 01 04 05 22 30 30 69 57
TOTAL 191 181 273 429 571 655 782 833 894 1088 1238
SAINT LUCIA
O
United Kingdom 493 348 417 300 341 239 393 332 232 61 120
Others 00 00 14 07 08 17 19 00 00 01 01
TOTAL 493 348 431 307 349 256 412 332 232 62 121
STVINCENT amp GRENADINES
O
United Kingdom 344 285 240 204 180 182 114 75 41 08 07
Others 25 00 00 48 58 66 100 106 81 102 103
TOTAL 369 285 240 252 238 248 214 181 121 110 110
SURINAME
O
United Kingdom 280 - 47 98 11
France 62 257 454 562 654 570
Others 00 104 40 09 - 00 - 00 00 791 629 831
TOTAL 280 01 214 396 474 562 654 570 791 629 831
1 As declared by exporting countries1 Comme declareacute par les pays exportateurs1 De acuerdo a lo declarado por los paiacuteses exportadores
8102019 Banana Import Export Global Stats
httpslidepdfcomreaderfullbanana-import-export-global-stats 25392020
Table 6 - Gross Imports by countries of origin 1
Tableau 6 - Importations brutes par pays drsquoorigine 1
Cuadro 6 - Importaciones brutas por paiacuteses de origen 1
2002 2003 2004 2005 2006 2007 2008 2009 2010 2011 2012
(prel)
( thousand tonnes milliers de tonnes miles de toneladas )
ARGENTINA
FROM
Ecuador 471 1168 1600 1415 1658 1840 2149 1973 2127 2397 2245
Brazil 1648 1293 903 981 561 583 338 523 386 232 394
Bolivia 146 249 407 557 641 647 706 780 753 994 873
Others 31 153 123 70 97 119 275 165 245 326 254
TOTAL 2295 2864 3033 3022 2957 3189 3468 3441 3511 3949 3766
CANADAFROM
Costa Rica 881 1196 1061 927 881 1253 1154 710 1058 1178 1159
Ecuador 1282 1048 821 780 942 1003 1210 1642 1472 1104 1392
Colombia 1202 1149 1297 1637 1741 1379 1218 1289 1145 963 1298
Honduras 310 287 353 206 101 235 292 175 295 274 275
Mexico 111 102 47 10 20 15 28 16 14 20 20
Guatemala 310 429 782 855 794 754 814 931 897 1475 1055
Panama 01 00 - 19 53 39 29 25 37 10 30
Dominican Rep 02 01 07 01 06 04 01 02 01 01 02
Others 75 17 56 55 42 36 31 31 41 41 39TOTAL 4174 4228 4423 4490 4580 4718 4776 4820 4961 5066 5270
CHILE
FROM
Ecuador 1472 1569 1585 1670 1630 1698 1659 1730 1738 1766 1825
Others 19 20 18 283 59 84 91 63 19 78 81
TOTAL 1491 1589 1602 1953 1689 1782 1750 1793 1757 1844 1906
CHINA
FROM
Philippines 2665 3111 2858 3038 3434 3038 3178 3521 4367 6939 4964
Ecuador 284 285 241 154 42 30 70 22 89 477
Tailand 06 18 57 96 138 152 176 104 163 225
Myanmar 01 01 44 943 1770 549 445
Vietnam 424 798 652 268 292 100 217 192 315 393 93
Others 98 00 01 00 152 02 03 11 74 55 142
TOTAL 3478 4212 3809 3557 3878 3319 3623 4913 6652 8187 6346
8102019 Banana Import Export Global Stats
httpslidepdfcomreaderfullbanana-import-export-global-stats 26392121
Table 6 - Gross Imports by countries of origin 1
Tableau 6 - Importations brutes par pays drsquoorigine 1
Cuadro 6 - Importaciones brutas por paiacuteses de origen 1
2002 2003 2004 2005 2006 2007 2008 2009 2010 2011 2012
(prel)
( thousand tonnes milliers de tonnes miles de toneladas )
EC (27) 2
FROM
Ecuador 1 1570 1 1488 1 1208 1 2392 1 1993 1 1858 1 3306 1 3431 1 2242 1 3412 1 3074
Colombia 7680 7992 7665 8824 9514 1 1561 1 2782 1 2408 1 1610 1 1366 1 1344
Costa Rica 7463 8020 8564 6345 8340 9714 8951 7572 7765 8450 7702
Panama 3962 3815 3708 2816 3130 3541 2946 1851 1844 1597 1436
Cote drsquoIvoire 2167 2074 2108 1838 2218 1894 2166 2292 2443 2241 2249
Cameroon 2365 2985 2612 2529 2527 2218 2795 2497 2430 2352 2139
Dominican Rep 973 1119 1013 1447 1768 2064 1705 2283 3037 3269 2946
Peru 68 57 96 115 227 336 389 441 516 658 814
Belize 387 738 803 742 732 624 821 798 788 711 993
Ghana 33 09 18 42 223 341 460 365 524 472 507
Saint Lucia 493 325 429 282 367 305 385 333 232 62 121
Jamaica 406 418 287 117 319 184 - - - -
Honduras 345 252 212 231 218 316 240 85 152 175 57
Saint Vincent amp the Grenadines 325 209 240 159 172 138 90 75 41 08 07
Guatemala 10 69 22 30 307 188 143 49 33 30 46
Dominica 175 105 122 128 133 73 103 369 37 41 23
Others 569 682 1007 1244 1549 1563 1593 611 1469 1272 1483
TOTAL 3 8991 4 0358 4 0112 3 9281 4 3737 4 6917 4 8873 4 5459 4 5161 4 6114 4 49412 Source European Community
JAPAN
FROM
Philippines 7435 7956 8696 9445 9106 8790 1 0193 1 1591 1 0355 1 0044 1 0267
Ecuador 1570 1456 1227 911 1013 521 462 618 461 343 359
China 251 335 182 151 159 189 90 88 95 84 84
Indonesia - - - - - - - - - - -
Others 106 120 154 162 158 207 182 229 180 170 154
TOTAL 9363 9866 1 0260 1 0669 1 0436 9706 1 0927 1 2526 1 1091 1 0641 1 0864
NEW ZEALAND
FROM
Ecuador 562 308 291 354 326 308 273 258 288 250 279
Philippines 110 360 356 419 481 493 526 500 524 556 526
Panama - - 14 01 01
Others 01 03 01 00 00 04 00 04 01 02 03
TOTAL 673 672 661 775 809 805 800 763 813 809 807
8102019 Banana Import Export Global Stats
httpslidepdfcomreaderfullbanana-import-export-global-stats 27392222
Table 6 - Gross Imports by countries of origin 1
Tableau 6 - Importations brutes par pays drsquoorigine 1
Cuadro 6 - Importaciones brutas por paiacuteses de origen 1
2002 2003 2004 2005 2006 2007 2008 2009 2010 2011 2012
(prel)
( thousand tonnes milliers de tonnes miles de toneladas )
NORWAY
FROM
Panama 07 28 34 54 68 77 108 92 100 97 95
Costa Rica 260 307 339 425 382 373 343 239 244 261 256
Ecuador 52 67 88 95 175 160 183 300 276 329 324
Colombia 276 223 187 136 79 152 181 162 148 77 75
Others 04 10 14 22 41 21 20 19 18 18 18
TOTAL 598 634 662 732 746 785 835 812 785 782 769
ROMANIA
FROM
Ecuador 547 341 973 1272 1357
Colombia 60 19 39 29 39
Costa Rica 12 17 52 101 55
Honduras 28 28 40
Others 19 52 05 01 53
TOTAL 639 429 1097 1432 1543
RUSSIAN FEDERATION
FROM
Ecuador 5922 7233 7892 7911 7976 9202 9030 9112 9766 1 1999 1 1530
Costa Rica 09 175 10 155 275 21 659 326 482 386 446
China 65 54 41 26 15 30
Colombia 157 212 393 280 205 219 02 52 95 182 123
Vietnam 13 13 12 03 03 08 04
Philippines 139 208 232 212 304 251 315 245 298 355 335
Others 259 180 30 92 194 27 05 25 16 139 72
TOTAL 6500 8021 8569 8649 8954 9787 1 0068 9809 1 0686 1 3076 1 2536
SWITZERLAND
FROM
Costa Rica 383 367 294 278 240 264 184 172 161 156 154
Panama 70 40 40 65 98 125 204 155 165 118 117
Colombia 131 126 175 133 129 87 96 131 132 185 183
Ecuador 55 74 136 180 207 239 250 250 234 224 222
Honduras 01 06 06 01 - -
Others 104 109 84 85 67 68 87 100 106 111 110
TOTAL 743 722 735 742 741 782 821 808 799 794 786
8102019 Banana Import Export Global Stats
httpslidepdfcomreaderfullbanana-import-export-global-stats 28392323
Table 6 - Gross Imports by countries of origin 1
Tableau 6 - Importations brutes par pays drsquoorigine 1
Cuadro 6 - Importaciones brutas por paiacuteses de origen 1
2002 2003 2004 2005 2006 2007 2008 2009 2010 2011 2012
(prel)
( thousand tonnes milliers de tonnes miles de toneladas )
SLOVAKIA
FROM
Ecuador 58 63 15
Costa Rica 135 195 77
Colombia 163 161 60
Panama 119 89 35
Others 12 25 312
TOTAL 487 533 499
TUNISIAFROM
Cameroon 05 - 02 - - 01 05 - - -
Cocircte DrsquoIvoire - - 07 21 38 51 01 - -
Colombia 24 - 30 11 02 46 11 - - 03
Costa Rica - - 10 06 - - 01 18 53 44
Ecuador 133 138 491 169 161 289 313 349 134 366
Others 00 00 03 02 01 23 05 04 00 - 00
TOTAL 163 138 543 208 203 410 335 371 187 413
UNITED STATESFROM
Costa Rica 9015 9761 8653 8227 9274 1 0369 8744 5629 8536 8445 8482
Ecuador 1 0218 9725 9189 9043 9943 9292 8303 9576 9798 8790 7197
Honduras 4492 4321 5079 4530 4229 4827 5056 3887 4357 4452 5357
Guatemala 9252 9341 1 0208 1 0293 9129 1 0934 1 1887 1 1122 1 1515 1 3335 1 4586
Colombia 5064 4693 4646 5137 4738 3772 4508 4216 4609 3845 4402
Mexico 423 352 336 338 386 315 663 1052 1455 1486 2233
Panama 03 02 06 20 75 05 80 54 290 278 592
Nicaragua 297 416 415 381 305 328 311 249 360 356 363
Peru 232 138 124 223 251 178 225 197 201 232 259
Venezuela 37 19 20 07 03 - - - - - -
Dominican Rep 36 21 52 44 62 17 01 10 01 07 27
Others 01 02 00 00 - 00 00 00 00 26 01 - 00
TOTAL 3 9070 3 8792 3 8728 3 8244 3 8395 4 0038 3 9779 3 5992 4 1149 4 1227 4 3497
URUGUAY
FROM
Brazil 408 402 430 457 424 384 382 321 436 390 292
Ecuador 28 01 03 16 19 35 48 42 65 115 142
Others 02 07 04 00 04 01 - 00 53 05 09 14
TOTAL 438 411 437 473 446 420 430 416 506 515 4471 Figures may differ rom those shown in able 3 (a) which exclude re-exports1 Les chiffres dans ce tableau peuvent differer des chiffres du ableau 3 (a) qui ne comprennent pas les reacuteexportations1 Las ciras pueden dierir de las del Cuadro 3 (a) las cuales excluyen las reexportaciones
8102019 Banana Import Export Global Stats
httpslidepdfcomreaderfullbanana-import-export-global-stats 29392424
Table 7 - Import prices in selected countries monthly Tableau 7 - Prix agrave lrsquoimportation mensuels dans certains paysCuadro 7 - Precios mensuales de importacioacuten en algunos paiacuteses
FRANCE
2001 2002 2003 2004 2005 2006 2007 2008 2009 2010 2011 2012 2013
( Euro tonnes )
January 572 547 620 474 623 630 620 - 658 524 794 678 770
February 636 723 628 500 753 770 700 780 720 623 923 820 820
March 865 733 698 640 798 690 700 843 962 720 755 820 770
April 795 608 600 603 810 640 698 820 878 680 760 808 763
May 652 546 528 568 860 608 633 593 715 686 680 730 710
June 580 478 476 615 888 585 594 588 668 755 513 695 688
July 565 340 360 485 498 380 565 605 528 624 440 590 660
August 550 488 298 480 664 510 608 658 490 610 483 600 660
September 615 537 460 430 753 510 338 650 563 590 573 690 660
October 530 407 383 383 673 490 - 583 538 505 586 706 618
November 410 320 410 553 723 590 - 568 527 550 605 665 623
December 460 580 490 660 716 620 - 610 545 700 580 682 660
YEAR 603 525 496 533 730 585 606 663 649 631 641 707 700
USD ton 539 494 560 661 907 734 829 972 902 835 891 908 957
JAPAN2001 2002 2003 2004 2005 2006 2007 2008 2009 2010 2011 2012 2013
( Yen tonnes )
January 44 700 54 800 54700 52700 54900 46400 57700 55300 68100 55000 53000 52100 67800
February 49 100 66 000 60000 56600 56600 58200 64200 58400 69900 61900 56500 56900 71200
March 50 700 71 600 62700 65900 64600 58200 66400 63800 72600 68800 64500 65200 77100
April 54 000 83 200 66800 76400 66800 62900 79300 79100 82100 78300 74100 72200 82100
May 60 500 84 400 72800 70200 61600 64600 78700 82600 88300 77800 78500 72300 92500
June 54 400 80 100 68800 70900 65700 63600 73100 80800 88100 74700 75800 71100 89600
July 53 800 78 700 66400 64300 61900 63600 65000 83500 85500 71700 86200 69600 86600
August 56 500 64 000 68300 52800 60400 61200 64100 84300 81200 69400 72600 66400
September 60 600 65 900 69200 56500 60900 64600 72000 90900 74300 68500 68200 62000
October 53 500 63 700 58200 55100 57000 65100 65700 85600 64200 60900 61600 61000
November 48 700 54 400 51600 55600 49500 60600 59000 80400 58100 48500 60600 59100
December 48 900 50 800 49100 56100 47900 55300 56500 67100 52100 52100 55400 59900
YEAR 52 950 68 133 62 383 61 092 58 983 60 358 66 808 75 983 73 708 65 633 67 250 63 983 80986
USD kg 436 543 538 565 535 519 567 735 788 748 843 802 829
8102019 Banana Import Export Global Stats
httpslidepdfcomreaderfullbanana-import-export-global-stats 30392525
Table 7 - Import prices in selected countries monthly Tableau 7 - Prix agrave lrsquoimportation mensuels dans certains paysCuadro 7 - Precios mensuales de importacioacuten en algunos paiacuteses
UNITED STATES
2001 2002 2003 2004 2005 2006 2007 2008 2009 2010 2011 2012 2013
( USD tonnes )
January 535 427 561 427 589 686 639 689 820 785 892 945 929
February 687 517 462 496 891 854 655 792 944 720 1 002 1 068 923
March 541 572 486 513 792 825 648 1027 909 838 996 1 144 937
April 551 544 384 529 593 730 648 967 890 825 1 027 1 030 903
May 637 626 296 556 618 926 689 923 830 799 1 011 953 909
June 610 648 308 604 486 655 779 868 854 962 976 954 910
July 698 537 296 61 401 560 734 722 827 985 961 965 923
August 683 420 286 548 405 542 697 799 834 899 951 951 940
September 572 486 312 539 594 544 665 803 818 880 947 965 937
October 484 544 328 496 630 549 659 807 810 916 954 956 931
November 496 396 408 492 589 598 651 903 834 908 956 934 923
December 506 625 370 496 646 658 648 830 796 900 942 944 923
YEAR 583 529 375 480 603 677 676 844 847 868 968 984 924
EUROPEAN UNION
2001 2002 2003 2004 2005 2006 2007 2008 2009 2010 2011 2012 2013
( Euro tonnes )
January 590 590 590 590 610 580 600 600 570 630 610 610
February 610 590 600 610 600 590 560 610 580 640 620 620
March 630 610 640 660 600 590 620 660 600 630 630 620
April 640 620 620 630 610 580 640 660 620 620 640
May 620 590 640 640 590 590 610 630 610 610 630
June 600 590 640 680 570 580 590 630 640 600 630
July 560 560 620 610 550 570 590 600 630 590 620
August 600 540 600 610 530 550 580 590 600 570 630
September 610 570 600 630 550 570 610 570 600 580 620
October 580 580 590 620 550 580 600 570 600 590 610November 560 560 600 640 580 580 590 580 600 580 620
December 590 580 620 630 570 560 600 550 610 610 620
YEAR 599 582 613 629 576 577 599 604 605 604 623 617
USD ton 564 656 762 782 722 789 878 839 801 840 801 843
8102019 Banana Import Export Global Stats
httpslidepdfcomreaderfullbanana-import-export-global-stats 31392626
Table 7 - Import prices in selected countries monthly Tableau 7 - Prix agrave lrsquoimportation mensuels dans certains paysCuadro 7 - Precios mensuales de importacioacuten en algunos paiacuteses
HUNGARY
2001 2002 2003 2004 2005 2006 2007 2008 2009 2010 2011 2012 2013
( Forint tonnes )
January 40 000 74 000 115 000 105 000 62 000 181 000 181 000 186 000 188 000 158000 210000 197000
February 39 000 76 000 119 000 109 000 171 000 189 000 189 000 210 000 221 000 172000 213000 236000
March 39 000 83 000 122 000 105 000 179 000 185 000 178 000 226 000 268 000 195000 197000 224000
April 40 000 105 000 137 000 112 000 164 000 190 000 174 000 200 000 241 000 180000 198000 225000
May 39 000 112 000 104 000 176 000 180 000 176 000 160 000 160 000 205 000 200000 185000 211000
June 37 000 108 000 108 000 157 000 184 000 177 000 151 000 149 000 207 000 220000 157000 202000
July 47 000 76 000 105 000 137 000 136 000 129 000 138 000 142 000 186 000 174000 141000 172000
August 45 000 81 000 90 000 104 000 140 000 148 000 151 000 161 000 179 000 160000 150000 187000
September 46 000 104 000 76 000 123 000 152 000 147 000 178 000 165 000 162 000 161000 162000 207000
October 47 000 93 000 98 000 159 000 149 000 145 000 159 000 160 000 151 000 173000 167000 196000
November 61 000 86 000 88 000 242 000 164 000 175 000 160 000 164 000 154 000 176000 165000 192000
December 76 000 92 000 96 000 245 000 163 000 167 000 174 000 181 000 155 000 204000 174000 208000
YEAR 46 333 90 833 104 833 147 833 153 667 167 417 166 083 175 333 193 083 181 083 176 583 204 750
USD ton 162 352 467 729 770 796 904 1 019 954 871 878 910
THE PEOPLErsquoS REPUBLIC OF CHINA (MAILAND)2001 2002 2003 2004 2005 2006 2007 2008 2009 2010 2011 2012 2013
( USD tonnes )
January 250 227 284 295 308 317 377 412 389 491 574
February 243 212 250 297 290 312 374 407 340 428 538
March 196 197 209 274 234 312 332 274 361 403 522
April 207 212 179 267 285 331 332 312 403 428 523
May 205 191 199 274 250 332 405 377 406 437 534
June 218 188 241 271 303 336 409 399 428 484 574
July 228 191 244 267 325 339 41 411 426 526 646
August 195 173 247 240 319 325 381 379 406 528 672
September 202 244 270 276 317 326 394 432 460 534 677
October 213 233 295 290 329 342 375 408 472 501 650
November 220 251 272 292 328 353 403 424 462 541 658
December 215 266 279 296 326 371 398 281 258 577 616
YEAR 216 215 247 278 301 333 352 376 401 490 599
Source United States official dataJapan Monthly Bulletin o Banana Statistics Japan Banana Importersrsquo AssociationFrance Marcheacutes Europeacuteens des Fruits et Leacutegumes Revue drsquoInormation Economique
8102019 Banana Import Export Global Stats
httpslidepdfcomreaderfullbanana-import-export-global-stats 32392727
Table 8 - Wholesalersrsquo selling prices in selected countries monthly Tableau 8 - Prix de vente en gros mensuels dans certains paysCuadro 8 - Precios mensuales de venta al por mayor en algunos paiacuteses
JAPAN
2001 2002 2003 2004 2005 2006 2007 2008 2009 2010 2011 2012 2013
( Yen kgs )
January 81 117 107 106 103 96 120 129 160 126 121 121 139
February 98 135 133 109 115 122 142 145 157 144 129 124 150
March 101 146 130 139 132 120 157 155 151 146 140 130 161
April 123 155 133 149 123 117 167 159 162 142 148 135 172
May 128 154 144 140 119 126 163 154 165 140 145 135 169
June 103 153 131 138 122 122 145 153 160 142 140 133 161
July 112 148 128 119 115 115 135 152 149 141 133 130 153August 106 116 125 101 112 115 134 150 140 135 122 125
September 113 130 126 108 115 128 138 158 137 129 125 119
October 101 128 117 113 107 134 132 178 130 120 133 118
November 102 102 98 113 98 123 128 164 122 101 131 116
December 97 95 98 109 80 111 125 151 116 101 122 121
YEAR 105 132 123 120 112 119 141 154 146 131 132 126 158
USD kg 087 105 106 111 101 102 119 149 156 149 166 157 162
UNITED STATES
2001 2002 2003 2004 2005 2006 2007 2008 2009 2010 2011 2012 2013
( USD kgs )
January 062 064 064 060 059 069 080 075 118 092 101 095 099
February 072 060 064 064 064 101 080 099 112 099 112 117 099
March 077 066 070 055 082 102 079 136 110 101 108 141 101
April 074 067 067 058 069 090 074 133 109 101 105 121 101
May 085 068 062 059 073 104 082 128 105 099 103 106 095
June 070 072 059 066 074 088 084 106 104 106 105 097 094
July 083 065 061 056 058 065 078 096 101 118 096 096 094
August 081 061 058 048 049 061 074 093 101 099 095 096 094
September 080 061 057 047 061 067 082 094 099 088 092 105 094
October 067 056 056 048 066 069 079 096 094 099 091 104 092
November 058 054 055 046 061 065 072 093 091 094 092 099 090
December 063 061 057 055 073 072 069 093 090 096 096 097 088
YEAR 073 063 061 055 066 079 078 104 103 099 100 106 095
8102019 Banana Import Export Global Stats
httpslidepdfcomreaderfullbanana-import-export-global-stats 33392828
Table 8 - Wholesalersrsquo selling prices in selected countries monthly Tableau 8 - Prix de vente en gros mensuels dans certains paysCuadro 8 - Precios mensuales de venta al por mayor en algunos paiacuteses
FRANCE
2001 2002 2003 2004 2005 2006 2007 2008 2009 2010 2011 2012 2013
( Euro kg )
January 084 079 093 081 100 098 090 090 085 079 101 087 104
February 093 095 097 082 112 107 097 105 094 083 122 104 107
March 115 107 103 097 120 103 099 113 122 093 106 105 105
April 115 103 094 093 114 094 097 104 110 094 095 105 105
May 099 090 079 093 112 091 090 081 096 093 091 105 101
June 086 078 080 094 126 094 086 081 091 096 079 105 097
July 092 069 063 082 089 071 078 081 080 085 074 092 090August 081 073 059 074 098 068 081 085 075 080 074 091 092
September 086 080 078 077 106 073 094 084 079 081 080 100 095
October 081 068 076 075 097 074 082 079 081 074 081 102 093
November 075 062 074 085 097 086 075 077 076 079 083 095 092
December 074 082 076 105 102 090 085 081 083 092 081 095
YEAR 090 082 081 086 106 087 088 088 089 086 089 099 098
USD kg 081 077 091 107 132 109 120 130 124 114 124 127 134
EUROPEAN UNION
2001 2002 2003 2004 2005 2006 2007 2008 2009 2010 2011 2012 2013
( Euro kg )
January 094 095 089 097 101 101 102 101 094 113 101 110
February 102 099 091 107 104 104 117 106 094 122 113 108
March 112 105 096 111 102 104 128 125 106 113 117 105
April 114 105 096 111 098 103 122 124 110 111 116 107
May 106 093 093 118 095 100 103 112 111 111 113 108
June 095 091 094 125 094 098 096 112 114 100 110 110
July 078 074 084 099 080 094 094 100 104 091 101
August 088 074 075 097 078 093 093 095 097 090 102
September 093 080 078 107 081 101 091 096 099 092 109
October 084 081 079 103 079 100 095 096 094 094 108
November 077 081 083 104 083 093 096 093 096 094 105
December 085 086 098 104 089 098 097 095 104 095 103
YEAR 094 089 088 107 090 099 103 105 102 102 108 108
USD kg 088 100 109 133 113 136 151 145 135 142 139 148
8102019 Banana Import Export Global Stats
httpslidepdfcomreaderfullbanana-import-export-global-stats 34392929
Table 8 - Wholesalersrsquo selling prices in selected countries monthly Tableau 8 - Prix de vente en gros mensuels dans certains paysCuadro 8 - Precios mensuales de venta al por mayor en algunos paiacuteses
THE PEOPLErsquoS REPUBLIC OF CHINA (MAILAND)
2001 2002 2003 2004 2005 2006 2007 2008 2009 2010 2011 2012 2013
( RMB kg )
January 294 305 333 282 309 310 357 351 304 433 494 385
February 376 319 316 292 324 345 375 343 346 475 508 431
March 369 288 319 275 342 380 366 345 356 511 486 451
April 370 285 342 276 368 334 383 391 407 611 465 478
May 301 278 355 274 386 289 371 457 456 566 432 526
June 264 260 338 272 386 257 356 444 483 415 414 527July 228 249 292 265 339 228 313 408 435 336 379
August 224 249 277 265 270 239 313 383 397 344 373
September 240 273 268 315 324 276 341 356 397 401 378
October 232 270 259 314 285 304 345 329 369 443 397
November 218 290 271 306 276 294 372 300 370 495 386
December 235 311 272 304 291 314 342 288 398 497 380
YEAR 279 281 304 287 325 298 353 366 393 461 424 466
USD kg 034 034 037 035 041 039 051 054 058 071 067 077
URUGUAY
2001 2002 2003 2004 2005 2006 2007 2008 2009 2010 2011 2012 2013
( Pesos uruguayos kg )
January 947 1041 981 1134 1384 1708 1799 1792 2014 1888
February 715 861 886 1160 1309 1603 1766 1605 1803 2102
March 892 937 859 1185 1394 1634 1812 187 1777 2174
April 1064 1025 925 1393 1433 1625 1927 1809 1802 2609
May 920 825 873 1111 1285 1519 1825 169 1744 2057
June 833 843 735 1157 1225 1545 1784 1758 174 2069
July 875 888 730 1267 1588 1874 176 1752 2195
August 837 974 893 1221 1414 1659 1969 182 1814 2092
September 891 887 1041 1256 1531 1607 1928 1844 1843 1909
October 1128 843 1248 1594 1545 1795 1963 1891 1867 1992
November 1107 812 1260 1478 1647 2068 1916 1944 1837 1915
December 860 925 1232 1397 2088 2001 1750 2174 1957
YEAR 922 905 972 1279 1478 1696 1859 1830 1829 2091
USD kg 033 032 040 053 063 081 082 091 095 103
8102019 Banana Import Export Global Stats
httpslidepdfcomreaderfullbanana-import-export-global-stats 35393030
Table 8 - Wholesalersrsquo selling prices in selected countries monthly Tableau 8 - Prix de vente en gros mensuels dans certains paysCuadro 8 - Precios mensuales de venta al por mayor en algunos paiacuteses
UNITED KINGDOM2001 2002 2003 2004 2005 2006 2007 2008 2009 2010 2011 2012 2013
( pence kg )
January 370 570 570 530 630 690 610 720 700 550 950 767 787
February 600 650 600 460 790 670 610 900 730 590 1020 877 778
March 760 720 700 550 690 560 570 850 1090 730 730 975 704
April 750 670 600 530 750 550 590 760 990 770 800 803 773
May 700 630 540 540 910 640 580 680 880 830 820 779 790
June 660 530 520 610 870 660 560 600 930 940 620 772 710
July 600 430 390 530 590 490 520 630 670 790 570 734 714
August 550 490 450 460 690 500 570 660 640 750 590 699
September 590 520 490 530 770 530 650 670 660 740 650 776
October 500 480 440 460 680 530 570 580 650 600 600 655
November 480 400 430 530 680 480 520 610 550 630 590 632
December 470 540 380 650 600 540 530 620 560 690 630 651
YEAR 586 553 509 532 721 570 573 690 754 718 714 760 751
USD kg 084 083 083 097 131 105 115 127 117 111 114 120 121
BANANA ORGANIC
USA
2008 2009 2010 2 011 2012 2013
( USD kg )
January 112 138 131 127 134 136
February 112 138 127 140 138 132
March 154 138 128 142 138 125
April 160 138 127 129 141 127
May 147 138 135 141 135
June 152 138 138 140 138
July 137 138 134 138 138
August 136 134 138 138 131
September 138 125 142 136 135
October 138 129 138 135 138
November 138 134 123 136 135
December 134 131 127 134 137
YEAR 138 135 132 136 136 131
SourceUnited States USDA C amp MS Fruit and Vegetable Division Market News daily reports
Japan Monthy Bulletin o Banana Statistics Japan Banana Importersrsquo Association
8102019 Banana Import Export Global Stats
httpslidepdfcomreaderfullbanana-import-export-global-stats 36393131
Table 9 - Retail prices in selected countries monthly Tableau 9 - Prix mensuels au detail dans certains paysCuadro 9 - Precios mensuales al por menor en algunos paiacuteses
FRANCE
2001 2002 2003 2004 2005 2006 2007 2008 2009 2010 2011 2012 2013
( Euro kg )
January 150 151 162 150 163 173 160 165 160 156 170 162 175
February 157 164 167 152 178 176 163 172 164 156 185 170 182
March 169 181 171 156 182 177 166 179 175 164 188 177 181
April 185 182 174 162 185 172 168 188 190 169 180 184 184
May 180 177 162 158 193 169 168 176 179 167 178 180 181
June 171 171 162 161 203 169 165 169 174 173 173 178 184
July 174 148 151 158 187 163 163 169 168 173 167 178 184
August 162 145 144 147 165 154 157 168 158 166 160 172 180
September 161 155 143 138 172 152 163 165 155 162 157 170 176
October 158 144 143 143 169 147 166 163 157 159 158 172 175
November 151 139 140 140 168 154 160 158 154 157 162 175 175
December 145 141 147 161 174 157 163 158 153 163 161 175 176
YEAR 164 158 156 152 178 164 164 169 166 164 170 174 179
USD kg 146 149 176 189 222 205 224 248 230 217 236 224 245
HUNGARY2001 2002 2003 2004 2005 2006 2007 2008 2009 2010 2011 2012 2013
( Forint kg )
January 251 263 293 251 309 345 329 338 348 323 374 358 399
February 239 263 283 249 313 339 334 348 364 323 421 407 407
March 246 280 283 261 340 339 326 392 421 338 427 425 408
April 284 312 286 276 343 345 338 410 468 357 396 424 404
May 247 302 270 289 347 345 336 361 431 349 392 419
June 221 288 264 310 376 356 319 332 406 371 364 398
July 257 247 248 303 343 340 314 311 389 377 319 372
August 239 248 249 281 317 327 316 313 351 362 297 361
September 252 272 252 258 324 328 329 319 340 361 306 381
October 244 253 250 258 325 302 338 318 331 326 324 395
November 229 233 234 254 345 316 326 303 320 330 343 394
December 245 252 232 294 339 320 320 307 309 350 343 376
YEAR 246 268 262 274 335 334 327 338 373 347 359 393 405
USD ton 086 104 117 135 168 159 178 196 184 167 178 174 188
8102019 Banana Import Export Global Stats
httpslidepdfcomreaderfullbanana-import-export-global-stats 37393232
Table 9 - Retail prices in selected countries monthly Tableau 9 - Prix mensuels au detail dans certains paysCuadro 9 - Precios mensuales al por menor en algunos paiacuteses
UNITED STATES
2001 2002 2003 2004 2005 2006 2007 2008 2009 2010 2011 2012 2013
( USD kg )
January 108 112 116 113 107 108 111 115 139 129 131 133 134
February 116 111 112 111 111 112 112 119 141 129 138 133 135
March 114 114 113 110 112 112 112 132 140 127 137 134 134
April 112 111 113 111 111 112 114 138 139 128 137 133 132
May 112 114 111 108 110 113 111 139 137 126 136 132 133
June 112 113 115 110 109 113 113 140 139 127 135 133 133
July 113 114 113 112 109 112 112 138 136 129 135 133 133
August 108 110 113 112 107 108 112 140 135 127 134 131 131
September 108 110 109 108 107 106 111 139 133 126 134 132 132
October 109 111 108 107 108 108 112 138 132 128 134 133 129
November 106 111 110 103 106 108 114 138 124 128 132 132 129
December 107 111 111 104 106 110 116 136 126 129 132 134 131
YEAR 110 112 112 109 109 110 113 134 135 128 135 133 132
JAPAN
2001 2002 2003 2004 2005 2006 2007 2008 2009 2010 2011 2012 2013
( Yen kg )
January 218 225 235 232 243 222 236 217 224 225 221 207
February 224 239 241 249 239 230 236 226 235 228 220 201
March 237 260 243 248 242 240 238 229 238 232 225 207
April 237 257 241 257 238 251 244 226 255 229 227 211
May 262 262 242 260 245 250 240 226 252 236 218 205
June 282 258 229 262 250 253 240 231 248 227 216 200
July 278 254 229 262 252 246 229 232 240 226 220 200
August 308 246 219 261 241 229 232 232 241 222 210 202
September 295 257 229 257 240 230 232 231 239 230 215 205
October 279 259 230 259 239 235 227 228 238 219 225 194November 255 260 223 245 231 231 222 221 236 218 216 193
December 233 241 220 237 220 230 219 221 233 218 193
YEAR 259 252 232 252 240 237 233 227 240 226 219 202
USD kg 213 201 200 233 218 204 198 219 256 257 275 253
8102019 Banana Import Export Global Stats
httpslidepdfcomreaderfullbanana-import-export-global-stats 38393333
Table 9 - Retail prices in selected countries monthly Tableau 9 - Prix mensuels au detail dans certains paysCuadro 9 - Precios mensuales al por menor en algunos paiacuteses
THE PEOPLErsquoS REPUBLIC OF CHINA (MAILAND)
2001 2002 2003 2004 2005 2006 2007 2008 2009 2010 2011 2012 2013
( RMB kg )
January 325 350 385 335 345 365 415 410 365 495 55
February 410 375 395 350 365 395 435 415 420 545 595
March 420 335 365 345 385 425 450 425 435 58 58
April 435 340 375 350 410 435 460 465 490 67 54
May 395 365 385 365 425 325 455 510 530 63 53
June 320 380 365 370 430 290 425 490 565 5 51
July 295 305 365 360 370 260 400 485 587 46 48
August 285 315 345 365 325 280 410 465 490 45 45
September 290 335 350 385 390 285 425 430 510 49 485
October 310 355 368 390 335 360 438 425 480 53 52
November 305 376 370 375 315 340 465 390 450 575 49
December 310 395 375 380 320 375 350 385 470 59 495
YEAR 342 352 370 364 368 345 427 441 483 543 519
USD kg 041 043 045 044 046 045 061 065 071 084 082
8102019 Banana Import Export Global Stats
httpslidepdfcomreaderfullbanana-import-export-global-stats 3939
8102019 Banana Import Export Global Stats
httpslidepdfcomreaderfullbanana-import-export-global-stats 439iii
Contents
FOREWORD iv
BANANA MARKE REVIEW 20129830852013 1 - 10
1 Developments in banana trade Exports Imports
2 Banana prices Import prices
Wholesale and retail prices
3 Policy developments
4 Current situation and short-term outlook
SAISICAL ABLES 11 - 33
able 1 - World gross exports by country able 2 - World net imports by country able 3 - EC otal supply of bananas and per capita supply able 4 - Per capita net imports by country able 5 - Exports by countries of destinationable 6 - Gross Imports by countries of originable 7 - Import prices in selected countries monthly able 8 - Wholesalersrsquo selling prices in selected countries monthly able 9 - Retail prices in selected countries monthly
8102019 Banana Import Export Global Stats
httpslidepdfcomreaderfullbanana-import-export-global-stats 539iv
foreword
Tis report is issued on an annual basis to Members and Observers o the Sub-Group onBananas o the Intergovernmental Group on Bananas and ropical Fruits
It is prepared by the Market and Policy Analyses of Raw Materials Horticulture andTropical (RAMHOT) Products Team rade and Market Division FAO Rome and thetables contained bring together the inormation available to FAO supplemented by dataobtained rom other sources in particular with regard to preliminary estimates
Te Market and Policy Analyses of Raw Materials Horticulture and Tropical (RAMHOT)Products Team provides economic data and analyses on major agricultural raw materialsand horticultural and tropical products Commodities covered under the eam includebananas and tropical fruits citrus fruits cotton hides and skins jute kenaf and alliedfibres sugar and tea Te eam also undertakes market reviews outlook appraisals and
projections and provides assistance to developing countries in designing and implementingnational policies or those agricultural commodities which enter into international trade
Te report is available at the ollowing FAO websitehttpwwwaoorgeconomicestest-commoditiesbananasen
8102019 Banana Import Export Global Stats
httpslidepdfcomreaderfullbanana-import-export-global-stats 6391
Banana market review 2012-2013
1 Developments in banana trade
Exports
In 20121 the volume o global gross banana exports reached a record high o 165million tonnes 11 million tonnes (or 73 percent) above 2011 level Te increase isprimarily explained by the growth o exports rom Latin America and the Caribbeanrom 125 to 130 million tonnes despite the poor perormance o Ecuador InEcuador the largest banana exporter in the world banana exports shrank as floodingdamaged the crop reducing the output by 416 000 tonnes or 56 percent relativeto 2011 Te resulting 410 000 tonnes decline in shipments rom Ecuador was morethan offset by vigorous exports rom other countries in particular those in CentralAmerica
Data or 2012 show a remarkable shif rom exports originating in South America towards greater exports rom Central America and Mexico While exports romSouth America declined by 64 percent relative to 2011 Central America and Mexicoexpanded their combined export volumes by 221 percent possibly in anticipation otrade preerences or Central American bananas in the European market as part othe Association Agreement As a result the average share o South America in global
banana exports has declined rom 502 percent in 2007-2011 to 436 percent in 2012while the share o Central America and Mexico increased rom 294 percent to 334percent
Costa Ricarsquos export quantity reached 21 million tonnes in 2012 126 000 tonneshigher than in 2011 overtaking Colombia as the second most important exporterin Latin America In 2012 banana exports rom Colombia dropped by 42 percentrom 191 in 2011 to 183 million tonnes mainly due to the spread o Moko diseaseGuatemalarsquos exports have also surpassed those o Colombia standing at 19 milliontonnes in 2012 - an increase o 232 percent (362 000 tonnes) compared to 2011In Honduras export volumes marked an astonishing 75 percent growth between2011 and 2012 reaching a record 901 000 tonnes in 2012 or double the 2003 exportsMexico also registered an important increase in shipments rom 178 000 tonnes in2011 to 308 000 tonnes in 2012 Peru is another dynamic exporter which had almostno exports prior to 2000 and reached 124 000 tonnes in 2012 or 138 percent aboveshipments made in 2011 most o which were air trade and organic bananas grownby smallholder associations
In the Caribbean exports continued to be dominated by the Dominican Republicwhich apart rom Belize is the only country among the Caribbean ACP countries
1 Provisional data received rom the countries and complemented with UN Comtrade data
8102019 Banana Import Export Global Stats
httpslidepdfcomreaderfullbanana-import-export-global-stats 7392
where bananas continue to be a major export despite the preerence erosion in theEuropean Union (EU) market thanks to the strong ocus on organic and air tradebananas Nevertheless ollowing a period o dynamic growth rom 2000 to 2011 in2012 Dominican banana exports declined by 22 percent to 297 000 tonnes OtherCaribbean countries have maintained very low volumes o exports continuing the
declining trend o recent years Jamaicarsquos exports have virtually disappeared since2008 and all production is now directed to the domestic market Exports rom otherCaribbean countries excluding Dominican Republic have also registered a steadydecline as a result o a combination o preerence erosion on exports to the EU andclimatic disasters that have severely undermined production Te combined exportsrom the Caribbean other than Dominican Republic plummeted rom 88 000 tonnesin 2009 to 21 000 tonnes in 2011 In 2012 a slight recovery is estimated to take placereflecting primarily an expansion in exports rom Saint Lucia rom 6 200 tonnes to12 100 tonnes
Exports rom Asia showed a remarkable recovery Afer substantial declines in
exports between 2006 and 2010 which were driven by shrinking exports rom thePhilippines the volume o exports rom the region rose 256 percent in 2011 and 271percent in 2012 reaching almost 282 million tonnes well above the previous recordo 24 million tonnes in 2006 Because o this recovery the Philippines returned tobeing the second largest exporter o bananas in the world afer Ecuador With theremarkable growth rates in both 2011 and 2012 the Philippines reached the peak oits export perormance in 2012 at 26 million tonnes corresponding to 939 percento all exports rom Asia
Africarsquos exports which accounted or 39 percent o global banana shipments grewby 24 percent in 2012 as exports reached 649 000 tonnes Cocircte drsquoIvoire the largestexporter in the region shipped 339 000 tonnes o bananas in 2012 or 60 percent morethan in 2011 while exports rom Cameroon the second largest Arican exporterdeclined by 10 per cent to 246 000 tonnes
Figure 1 Banana exports by region 2008-2012 million tonnes
120 123 118 125 130
23 19
18
222806 06
06
06
06
00
20
40
60
80
100
120
140
160
180
2008 2009 2010 2011 2012
Africa
Asia
Latin America
and Caribbean
8102019 Banana Import Export Global Stats
httpslidepdfcomreaderfullbanana-import-export-global-stats 8393
Imports
Te United States and EC-27 each imported approximately 27 percent o all bananastraded internationally in 2012 while other importers operated at a much smallerscale Afer a record high o almost 131 million tonnes o bananas imported by Russia
in 2011 when purchases grew by 224 percent those in 2012 declined by 41 percentto approximately 126 million tonnes A similar situation is observed in China Afera rapid expansion o banana imports over the past our years they declined rom therecord high o 910 000 tonnes in 2011 to 716 000 tonnes in 2012 corresponding to a213 percent drop mostly due to the increase in domestic production Japanrsquos importsregistered a moderate growth o 21 percent and reached almost 11 million tonnesin 2012
Figure 2 Distribution of global imports by market 2012 (thousand tonnes and share inglobal imports)
Weak demand in the EU was the main eature o the banana market in 2012 Accordingto the provisional data in 2012 EC-27 banana imports declined to approximately 449million tonnes (115 000 tonnes less than in 2011) the lowest level since 2006 Most
o the EUrsquos banana suppliers were affected by the decline but Ecuador Costa Ricaand the Dominican Republic registered largest decreases in export quantities In partthis drop was driven by an increase in bananas produced in the EU rom 612 000tonnes to 649 000 tonnes However the decline also reflected a drop in per capitaconsumption rom 104 kg in 2011 to 102 kg in 20122 Furthermore the appreciationo the United States (US) dollar constrained the demand or ldquodollar bananasrdquo Amongthe major exporters to the EU market only Peru Belize and Ghana increased theirexports to the region
2 Fruirop No 210 April 2013 CIRAD
4488 27
4350 27
1254 8
1086 7
716 4
934 6
668 4
2757 17EC-27
United States
Russian Fed
Japan
China
Other Asia
Latin America
Other
8102019 Banana Import Export Global Stats
httpslidepdfcomreaderfullbanana-import-export-global-stats 9394
Figure 3 Change in EUrsquos banana imports from 2011 to 2012 by origin
-200
-100
00
100
200
300
400
500
-800
-600
-400
-200
00
200
400
1000 tonnes (left axis) (right axis)
European bananas are mostly grown on the Canary Islands (Spain) where productionincreased by 24 000 tonnes in 2012 and Guadeloupe and Martinique (France) wherethe total production increased by 9 000 tonnes Minor quantities are also producedin Cyprus Greece and Portugal Bananas grown within the EU accounted or about126 percent o total EU consumption in 2012 At the same time the share o most-avoured-nation (MFN) bananas consumed in the EU was 683 percent whileconsumption o bananas imported rom the Arican Caribbean and Pacific Group oStates (ACP) accounted or 191 percent3
US imports on the contrary showed dynamic growth in 2012 increasing or thethird consecutive year Import volumes increased by 227 000 tonnes or 55 percentrelative to 2011 reflecting strong US demand or bananas Since domestic bananaproduction in the US is negligible net imports provide a good approximation ortotal per capita consumption which increased rom 116 kg in 2010 to 132 kg in2011 and urther to 138 in 20124 As a result imports registered a record 435 milliontonnes o bananas nearly as much as the EC-27 US imports rom Ecuador showeda considerable decline o 18 percent or 159 000 tonnes compared to 2011 reflectingprimarily lower output o bananas in Ecuador Tis decline was more than offset by
vigorous imports rom other sources and especially imports rom Central Americaand Mexico which increased by 326 000 tonnes Tis was consistent with the overallperormance o these exporters Mexicorsquos exports o bananas to the US registered aparticularly strong growth rate at 50 percent corresponding to an additional 75 000tonnes compared to 2011 Imports rom Colombia and Honduras also demonstrateda large increase
3 Bananas other than plaintains - Fact sheet European Commission Directorate-General or Agriculture andRural Development September 2013 (eceuropaeuagriculturebananasfact-sheet_enpdf )
4 A smaller increase is also observed in per capita consumption o citrus ruits (source httpwwwasusdagovpsdonline)
8102019 Banana Import Export Global Stats
httpslidepdfcomreaderfullbanana-import-export-global-stats 10395
2 Banana prices
Import pricesEUrsquos average import price in 2012 increased rom 604 eurostonne in 2011 to 623eurostonne fluctuating mildly between 600 and 650 eurostonne throughout theyear Te increase however was driven mainly by a stronger US dollar against theeuro while the demand remained sluggish In US dollar terms the EU import priceactually decreased rom USD 840 to USD 801 per tonne
Figure 4 Average annual import prices in EC-27 Japan and United States 2008-2012USDtonne
00
2000
4000
6000
8000
10000
12000
EC-27 United States Japan China
2008
2009
2010
2011
2012
In the US on the other hand the strong demand put upward pressure on importprices and they reached a record USD 984tonne on average in 2012 or 17 percentabove last yearrsquos the level Prices were particularly high during February March andApril 2012 exceeding USD 1 000tonne Import prices in Japan declined rom anaverage o 67 250 yentonne in 2011 to 63 983 yentonne in 2012 corresponding to a49 percent decline In dollar terms the reduction has been similar and the averageprice stood at USD 802tonne almost identical to the EU import price A strongseasonal variation also observed in previous years marked the prices in Japan during
2012 prices in April and May were almost one-third higher than those in Januaryand February In contrast import prices in China expressed in US dollars tend toincrease in the second hal o the year Between 2011 and 2012 the average annualimport price in China showed a remarkable improvement rom USD 490 to USD 599per tonne
8102019 Banana Import Export Global Stats
httpslidepdfcomreaderfullbanana-import-export-global-stats 11396
Figure 5 Monthly import prices in selected countries 2012
Wholesale and retail prices
US retail prices remained practically flat throughout 2012 at approximately USD 133kg although varied substantially during the first hal o 2012 peaking in March-April On average wholesale prices increased by 65 percent in 2012 compared to2011 while retail prices actually decreased 13 percent Tis apparent contradictioncould be explained by the act that supermarkets spread temporary losses rom higherwholesale prices across other products that they sell while maintaining the prices obananas or their consumers low which is a common marketing strategy
During 2012 wholesale and retail prices in France increased by 112 and 26 percentrespectively relative to 2011 with little fluctuation throughout the year Te averagewholesale price was 099 euroskg while the retail price was 174 euroskg In Japanwhere marketing margins are very high the decline in import prices in the second halo the year was only partially transmitted to wholesale and retail prices Compared
to 2011 average wholesale prices in Japan declined by 52 percent while retail pricesdeclined 81 percent Wholesale and retail prices in China also experienced a slumpdespite the increase in import prices by 79 and 45 percent respectively Domesticprices seemed to fluctuate in a similar manner throughout the year with a substantialdecline during the first hal o the year and partial recuperation in the second
40
45
50
55
60
65
70
75
Jan Feb Mar Apr May Jun Jul Aug S ep Oct Nov Dec
Japan 1000 yentonne
500
550
600
650
700
Jan Feb Mar Apr May Jun Jul Aug Sep Oct Nov Dec
EC-27 Eurotonne
800
900
1000
1100
1200
Jan Feb Mar Apr May Jun Jul Aug Sep Oct Nov Dec
United States USDtonne
500
550
600
650
700
Jan Feb Mar Apr May Jun Jul Aug Sep Oct Nov Dec
China US$tonne
8102019 Banana Import Export Global Stats
httpslidepdfcomreaderfullbanana-import-export-global-stats 12397
Figure 6 Monthly wholesale and retail prices in selected importing countries 2012
3 Policy developments
Te banana trade disputes between the EU and the Latin American banana producingcountries officially ended in 2012 Te longest series o disputes in the history othe World rade Organization (WO) dating back to 1992 was concluded on 8November 2012 by the signing o the Geneva Agreement on rade in Bananas which
was negotiated in 2009 between the EU and Latin American banana producers Atthe core o the agreement was the adoption o new commitments on MFN tariffs onbananas by the EU As the first step in 2009 the EU reduced its import tariff rom 176to 148 eurostonne Te maximum tariff rates are then set to decline reaching 114eurostonne in 2017 at the earliest or 2019 at the latest (see able 1)
Table 1 EUrsquos MFN tariff reduction schedule under the banana agreement
ariff rateseurotonne
15 December 2009ndash31 December 2010 148 eurotonne1 January 2011 143 eurotonne
1 January 2012 136 eurotonne
1 January 2013 132 eurotonne
1 January 2014 127 eurotonne
1 January 2015 122 eurotonne
1 January 2016 117 eurotonne
1 January 2017 114 eurotonne
3
35
4
45
5
55
6
65
Jan Feb Mar Apr May Jun Jul Aug Sep Oct Nov Dec
China RMBkg
Who lesale Retail
080
090
100
110
120
130
140
150
160
Jan Feb Mar Apr May Jun Jul Aug Sep Oct Nov Dec
United States USDkg
80
100
120
140
160
180
200
220
240
Jan Feb Mar Apr May Jun Jul Aug S ep Oc t Nov Dec
Japan Yenkg
W ho les al e Retail
060
080
100
120
140
160
180
200
220
Jan Feb Mar Apr May Jun Jul Aug Sep Oct Nov Dec
France Eurokg
W ho les al e Retai l
8102019 Banana Import Export Global Stats
httpslidepdfcomreaderfullbanana-import-export-global-stats 13398
In return or MFN tariff reduction by the EU the US and Latin American countriesagreed to cease all legal disputes against the EU at the WO and not demand anyadditional cuts or bananas in the Doha Round negotiations on agriculture At theaverage import price o 623 eurostonne in 2012 the MFN tariff o 136 eurostonnewas equivalent to 218 percent ad-valorem duty
Compared to the MFN tariff EU duties on bananas rom Colombia Peru and CentralAmerican countries have been reduced as part o the trade deals in the AssociationAgreements that these countries have signed with the EU Since 1 August 2013the ree trade provisions o the Agreements are applied to imports rom ColombiaHonduras Nicaragua and Panama while preerential trade arrangements betweenthe EU and Peru have been in orce since March 2013 Under these arrangementsthe preerential tariff or these countries was set at 124 eurostonne in 2013 and willbe gradually reduced to 75 eurostonne by 2020 Te same provisions would apply toCosta Rica Guatemala and El Salvador in the coming months Mexico is benefitingrom an import quota o 2 000 tonnes with an intra-quota duty o 70 eurostonne
ACP banana suppliers who have an Economic Partnership Agreement (EPA) withthe EU benefit rom duty and quota ree access to the EU market All current bananasuppliers in the ACP5 have concluded negotiations on either a ull or interim EPAand are thereore exempt rom any import duties on bananas However apart romsome o the Arican exporters ACP producers do not have the economies o scaleto compete with banana suppliers rom South and Central America Te situationis exacerbated by the lack o strategic partnerships along the value chain (in theexporter wholesaler and retailer segments) except or the Windward Islands whichmarket their bananas through their own distribution company
Te gradual reduction in the MFN tariff and preerential duties on bananas romLatin American countries entails preerence erosion or the ACP countries So arit appears that the implications or ACP banana exports to the EU have been rathersubdued with the exception o some o the Caribbean countries where preerenceerosion contributed to a decline already underway No sizable expansion o exportsrom Latin America to the EU has been registered afer the agreement on bananas wasreached Te EUrsquos imports rom the majority o Latin American countries decreasedin 2012 due to weak demand Among the ACP countries the perormance has beenmixed While countries like Belize managed to substantially expand their exports tothe EU others like Cameroon have seen their export share decrease Moreover some
ACP countries like Cocircte drsquoIvoire managed to diversiy their exports destinationswith significant growth in exports accounted or by the expansion in shipments todestination outside the EU
However preerence erosion remains a cause o concern or many ACP countrieso help them adjust to the new trade regime by either boosting the competitivenesso their banana sector or diversiying into other productive activities the EU isproviding financial support to these countries through the Banana AccompanyingMeasures (BAM) In total 190 million euros were allocated Tese support measures
5 Belize Cameroon Ivory Coast Dominica Dominican Republic Ghana Grenada Jamaica Saint LuciaSaint Vincent and the Grenadines and Suriname
8102019 Banana Import Export Global Stats
httpslidepdfcomreaderfullbanana-import-export-global-stats 14399
were proposed by the European Commission in March 2010 However the processo adopting BAM as a legal instrument has been protracted as the Council and theEuropean Parliament (EP) engaged in a series o extended debates on the proposalAn agreement was finally reached at the end o 2011 providing long awaited legalbasis or the BAM However the calls or project proposals to be supported with
BAM have only been launched in 2013
Te beneficiary countries are those which exported more than 10 000 tonnes per yearon average over the past decade Cameroon Cocircte drsquoIvoire and Ghana in Arica andBelize Dominica Dominican Republic Jamaica Saint Lucia Saint Vincent and theGrenadines and Suriname in the Caribbean
Table 2 BAM allocation by country euro million
Min Max
Belize 205 230
Cameroon 440 490
Cote drsquoIvoire 405 450
Dominica 140 155
Dominican R 150 165
Ghana 65 75
Jamaica 45 50
St Lucia 95 105
St Vincent amp the G 90 100
Suriname 85 95
Source Programming Guidelines Banana Accompanying Measures (BAM) 2012-2013 January 2012
4 Current situation and short-term outlook
Global supplies o bananas in 2013 could be severely affected by difficult cropprospects in Ecuador and the Philippines In Ecuador output projections indicatea urther decline in 2013 as the area under cultivation has shrunk Governmentestimates show planted area ell rom 200 000 hectares in January 2012 to 171 000hectares in February 2013 Tis decline in part reflects the pessimistic outlook o
Ecuadorian producers since their bananas will struggle to remain competitive in theEuropean market where practically all other exporters will be paying a preerentialtariff while Ecuador continues to pay an MFN duty rate In the Philippines weatherconditions have negatively affected banana production About one quarter o thebanana crop in the Philippines was destroyed by yphoon Bopha in December 2012 6Shipments o bananas rom Central America and Colombia on the other hand willremain solid aided by the entry into orce o the preerential duty rates charged onexports to the EU Exports rom Colombia are expected to recover once the campaignto eradicate Moko is successully completed
6 The devastating typhoon Haiyan that swept the Philippines in early November 2013 largely spared thePhilippines major banana producing region
8102019 Banana Import Export Global Stats
httpslidepdfcomreaderfullbanana-import-export-global-stats 153910
Te demand or bananas in both the EU and Russia seem to recover in 2013 as importsare showing promising signs During the first 9 months o 2013 import quantities inthe EU and Russia increased by 56 and 57 percent relative to the same period in2012 respectively 7 US imports are also likely to grow in 2013 as monthly importshave been consistently above those o 2012 in both value and volume Overall during
the first three quarters o 2013 the volume o US imports increased 46 percent
In 2013 the import prices in the US seemed to have stabilized at a somewhat lowerlevel compared to the record prices in 2012 Te average US import price during thefirst 6 months o 2013 stood at USD 923tonne or 74 percent lower than during thesame period in 2012 Tis is still well above the average import prices prevalent inthe EU although some countries like France are showing a tendency towards higherprices in 2013 Overall prices in the EU are expected to remain firm and close to the2012 level
Te ACP countries will continue to enjoy preerential access to the EU market
although the preerential margin vis-agrave-vis the major exporters such as Colombiaand Costa Rica will be shrinking over time as the ree trade agreements with thesecountries enter into orce Unless Ecuador enters into new negotiations with theEU it will continue paying higher tariffs than its major competitors underminingEcuadorrsquos export opportunities While the gap between the MFN tariff and thepreerential tariff o Colombia or example was not that high in 2013 (132 eurostonne versus 124 eurostonne) the difference will increase substantially by 2020unless a new reduction on the MFN tariff is achieved as part o multilateral tradetalks on agriculture At current import prices in the EU by 2020 Ecuador wouldbe paying 18 percent in ad-valorem tariff equivalent while the preerential rate orColombia Peru and Central America would be 12 percent
7 Based on GTA data
8102019 Banana Import Export Global Stats
httpslidepdfcomreaderfullbanana-import-export-global-stats 1639
STATISTICAL TABLES
8102019 Banana Import Export Global Stats
httpslidepdfcomreaderfullbanana-import-export-global-stats 17391212
Table 1 - World gross exports by country Tableau 1 - Exportations brutes mondiales par paysCuadro 1 - Exportaciones brutas mundiales por paiacutes
2000 2001 2002 2003 2004 2005 2006 2007 2008 2009 2010 2011 2012
(prel)
( thousand tonnes milliers de tonnes miles de toneladas )
Latin America amp Caribbean 9 7239 9 4433 9 9331 10 4715 10 4367 10 6201 11 2608 12 1333 11 9550 12 3458 11 7717 12 5270 13 0280
Central and South America 9 4791 9 1823 9 6743 10 2260 10 2225 10 3715 10 9502 11 8437 11 6878 11 9762 11 3922 12 2020 12 7054
Belize 658 501 430 749 805 763 730 611 827 818 792 837 993
Bolivia 94 129 165 284 427 536 762 795 858 894 884 983 727
Brazil 718 1051 2410 2208 1881 2122 1943 1857 1309 1439 1395 1101 957
Colombia 1 6802 1 5163 1 5704 1 4232 1 4709 1 6215 1 6974 1 7492 1 7983 2 1018 1 8026 1 9153 1 8349
Costa Rica 1 8833 1 7393 1 6226 1 9013 1 7925 1 6145 1 9611 2 1592 1 8726 1 5875 1 8209 1 9022 2 0286
Ecuador 3 9395 3 9904 4 1992 4 6712 4 5370 4 6539 4 7978 5 0571 5 1328 5 4731 4 9450 5 3919 4 9821
Guatemala 8013 8738 9717 9333 1 0138 1 0463 9826 1 3304 1 3547 1 4064 1 3691 1 5588 1 9208
Honduras 3753 4318 4414 4434 5277 5011 5162 5701 6057 5197 5124 5166 9014
Mexico 455 374 358 399 416 702 666 416 749 1401 1741 1776 3075
Nicaragua 455 441 408 409 449 455 377 389 378 347 200 82 93
Panama 4893 3211 4185 4102 3980 3483 4311 4386 3666 2572 2724 2669 2450
Peru 09 80 191 181 273 429 571 655 782 833 894 1088 1238
Suriname 354 287 280 01 214 396 474 562 654 570 791 629 831
Venezuela 361 233 265 203 360 456 117 106 14 01 01 08 12
Caribbean 2448 2609 2589 2455 2142 2487 3105 2896 2673 3696 3795 3250 3226 Dominican Republic 802 1302 1147 1267 1020 1671 2056 2120 1919 2818 3404 3038 2972
Jamaica 420 431 399 418 287 116 319 174 00 00 00 00 00
Others 1226 877 1042 771 835 700 731 602 754 877 391 212 254
Asia 17038 16896 17853 19443 19047 21693 24103 23121 23057 18574 17649 22174 28179
China 502 392 397 530 416 388 228 209 151 132 86 102 79
Malaysia 311 302 279 246 211 338 268 271 301 200 214 229 183
Pakistan 21 14 37 72 60 85 109 79 130 867 577 588 588
Philippines 1 5994 1 6007 1 6850 1 8294 1 7973 2 0243 2 3115 2 2177 2 1926 1 6641 1 5901 2 0555 2 6461
Tailand 58 55 52 63 177 418 203 214 228 256 228 252 276
Vietnam 45 42 146 126 72 39 21 16 26 17 35 32 32 Others 107 84 92 111 138 181 159 154 296 462 608 417 560
India 86 81 87 109 126 144 115 130 276 458 608 399 545
Africa 4941 4889 5329 5651 5568 5045 6057 5801 6114 5682 6435 6337 6488
Cameroon 2382 2541 2588 3137 2949 2655 2566 2323 2687 2555 2328 2490 2465
Cocircte drsquoIvoire 2173 2244 2560 2424 2524 2344 2864 2908 2643 2570 3356 3201 3394
Ethiopia 05 03 09 13 29 00 05 26 20 28 36 41 41
Others 93 48 107 77 65 46 621 544 764 528 714 606 588
Ghana 39 33 30 13 19 19 575 521 698 476 675 579 561
Oceania 03 01 01 01 01 01 01 01 01 01 01 01 01
WORLD 11 9221 11 6218 12 2514 12 9810 12 8982 13 2940 14 2768 15 0255 14 8723 14 7714 14 1802 15 3783 16 4948
8102019 Banana Import Export Global Stats
httpslidepdfcomreaderfullbanana-import-export-global-stats 18391313
Table 2 - World net imports by country Tableau 2 - Importations nettes mondiales par paysCuadro 2 - Importaciones netas mundiales por paiacutes
2000 2001 2002 2003 2004 2005 2006 2007 2008 2009 2010 2011 2012
(prel)
( thousand tonnes milliers de tonnes miles de toneladas )
DEVELOPING COUNTRIES 2 2705 1 9519 1 9760 2 3592 2 5037 2 7438 2 9908 3 0399 3 3967 3 3997 3 8240 4 1996 3 7561
Latin America amp Caribbean 6360 6031 5006 5591 5626 6007 5629 5986 6226 6143 6412 6814 6678
Argentina 3400 3301 2295 2864 3033 3022 2957 3189 3468 3441 3511 3949 3766
Chile 1926 1475 1491 1578 1597 1953 1689 1782 1750 1793 1757 1844 1906
El Salvador 590 612 614 566 515 531 491 538 527 435 487 448 498
Uruguay 330 489 438 411 437 476 451 422 431 416 506 515 447
Others 115 154 167 171 43 25 41 54 50 58 152 59 62
Asia 1 5762 1 1937 1 2007 1 5193 1 6148 1 9356 2 2266 2 1834 2 5295 2 5112 2 8624 3 1575 2 7362
China 6423 4676 4013 4811 4373 4142 4467 3873 4210 5536 7408 9095 7158
Iran 2000 756 1507 2710 2709 4509 3728 4477 7516 7128 6395 5909 3555
Jordan 53 29 22 15 21 63 93 202 330 256 396 483 498
Korea Rep 1842 1945 1872 2200 2083 2533 2797 3077 2581 2570 3379 3527 3680 Kuwait 233 238 255 261 302 305 676 889 961 929 911 1305 1398
Saudi Arabia 1869 1810 1765 1994 2115 2332 2351 2481 2567 2524 3074 3062 3062
Singapore 423 398 376 352 350 357 365 371 384 397 393 416 446
Syria 687 530 478 704 939 1116 3227 1927 2196 1837 2323 2722 2934
urkey 1242 416 646 919 1102 1510 1686 2243 2191 1824 2007 2346 2251
United Arab Emirates 685 796 683 707 1576 1748 2105 1229 1267 845 933 1287 1297
Others 305 343 391 520 578 742 771 1066 1094 1265 1403 1423 1084
Africa 582 1551 2748 2808 3263 2074 2013 2580 2446 2741 3203 3607 3521
Algeria 00 854 2315 2233 2046 1571 1472 1626 1639 1796 2079 2453 2310
Egypt 53 59 26 12 11 28 61 47 30 25 101 256 284
Morocco 00 28 14 11 22 49 54 172 187 267 281 246 282
Senegal 71 105 121 123 141 150 157 166 169 168 165 143 156
unisia 155 110 163 138 543 208 203 410 335 371 187 413 413
Others 303 394 109 291 500 68 67 158 86 115 391 95 76
DEVELOPED COUNTRIES 9 8804 9 6173 9 8594 10 1348 10 2763 10 3758 10 8862 11 4379 11 7050 11 0187 11 5162 12 3829 12 4955
EC ( 27 ) 3 8901 3 7718 3 8868 4 0230 4 0010 3 9230 4 3653 4 6824 4 8773 4 5370 4 5087 4 6030 4 4876
Other Europe 8126 9415 1 0599 1 1827 1 3155 1 4812 1 5319 1 6675 1 7004 1 5876 1 6729 1 9533 1 9018
Albania 178 85 187 227 172 168 168 202 174 172 175 174 174
Belarus 311 173 161 209 235 287 294 332 417 367 445 401 594
Bosnia Herzgovina 05 06 03 414 462 449 378 383 408 371 370 380 380
Croatia 419 432 451 506 508 540 515 548 570 521 494 487 463
Iceland 35 37 40 41 46 47 54 55 56 57 57 59 61
Macedonia Former YR 51 20 78 153 208 176 151 161 154 167 181 191 191
Moldova Rep 16 17 15 31 49 70 77 112 129 117 105 122 112 Norway 599 609 598 634 662 732 746 785 835 812 785 782 769
Russian Fed 4995 6067 6408 7870 8427 8528 8835 9597 9885 9694 1 0686 1 3076 1 2536
Serbia Montenegro 198 679 1134 151 975 578
Serbia 558 657 689 431 419 515 454
Montenegro 83 85 84 85 66 74 74
Switzerland 723 734 743 722 735 742 741 782 821 808 799 794 786
Ukraine 595 555 791 870 676 2494 2720 2975 2781 2273 2148 2478 2426
North America 4 0289 3 8387 3 9072 3 8738 3 8649 3 8223 3 8516 4 0151 3 9309 3 5429 4 1075 4 6293 4 8768
Canada 3984 4049 4170 4228 4406 4490 4567 4718 4776 4819 4961 5066 5270
United States 3 6304 3 4338 3 4902 3 4511 3 4242 3 3733 3 3950 3 5433 3 4534 3 0610 3 6114 4 1227 4 3497
Others 1 1488 1 0653 1 0054 1 0552 1 0949 1 1493 1 1374 1 0730 1 1963 1 3512 1 2271 1 1973 1 2294
Japan 1 0787 9906 9363 9866 1 0260 1 0669 1 0436 9706 1 0927 1 2526 1 1091 1 0641 1 0864 New Zealand 676 722 673 672 661 775 809 805 800 763 813 809 807
South Arica 26 26 18 14 28 50 129 219 236 222 367 523 623
WORLD 12 1508 11 5692 11 8354 12 4940 12 7800 13 1196 13 8770 14 4778 15 1017 14 4183 15 3401 16 5824 16 2516
8102019 Banana Import Export Global Stats
httpslidepdfcomreaderfullbanana-import-export-global-stats 19391414
Table 3 - EC Total supply of bananas and per capita supply Tableau 3 - CE Offre totale de banane et offre par habitantCuadro 3 - CE Oferta total de banano y oferta por habitante
2000 2001 2002 2003 2004 2005 2006 2007 2008 2009 2010 2011 2012
( thousand tons milliers de tonnes miles de toneladas )
France 3589 3228 3589 3292 3053 2805 2686 1673 1716 2358 2420 2425 2517
Guadeloupe 876 890 951 855 591 542 478 380 467 556 426 615 669
Martinique 2713 2337 2639 2437 2462 2262 2208 293 1249 1802 1994 1810 1848
Spain 3976 4209 4073 4009 4184 3450 3482 3614 3713 3520 3970 3465 3710
Greece 33 29 24 27 29 29 29 29 27 26 19 20 22
Cyprus 85 98 105 112 105 58 65 60 42 32 50 56 57
Portugal 225 207 219 214 212 142 153 172 178 145 137 153 177
Production 7907 7771 8011 7654 7582 6484 6416 5547 5676 6080 6595 6118 6485
Net Imports
EC (27) 3 8901 3 7718 3 8868 4 0310 4 0125 3 9230 4 3676 4 6824 4 8738 4 5372 4 5086 4 6030 4 4899
Supply 4 6807 4 5489 4 6880 4 7965 4 7707 4 5714 5 0092 5 2371 5 4414 5 1453 5 1682 5 2149 5 1383
Per capita supply 1231 1191 968 986 977 931 1016 1058 1095 1031 1032 1038 1021
Source EC Commission
8102019 Banana Import Export Global Stats
httpslidepdfcomreaderfullbanana-import-export-global-stats 20391515
Table 4 - Per capita net imports by country Tableau 4 - Importations nettes par habitant par paysCuadro 4 - Importaciones netas por habitante por paiacutes
2000 2001 2002 2003 2004 2005 2006 2007 2008 2009 2010 2011 2012
(prel)
( kg per capita kg par habitant kg por habitante )
DEVELOPING COUNTRIES 127 108 108 128 135 147 158 160 177 175 196 213 185
Latin America amp Caribbean 932 875 719 796 793 839 779 821 847 828 856 902 876
Argentina 921 885 610 754 791 781 758 810 873 859 869 969 916
Chile 1249 945 945 989 990 1198 1026 1071 1042 1058 1027 1068 1094
El Salvador 994 1026 1026 942 854 878 808 882 860 705 786 719 795
Uruguay 994 1472 1317 1237 1316 1432 1356 1266 1288 1240 1501 1523 1319
Others 174 228 243 246 061 035 055 073 066 076 195 074 077
Asia 100 075 075 094 099 118 135 131 151 148 168 184 154
China 051 037 032 038 034 032 034 030 032 042 056 068 052
Iran 306 114 224 398 393 647 528 627 1040 975 865 790 470
Jordan 109 059 044 029 040 118 169 356 564 426 641 762 771
Korea Rep 401 421 403 472 445 538 592 648 541 536 701 729 757 Kuwait 1203 1183 1231 1227 1378 1345 2877 3630 3771 3511 3328 4631 4834
Saudi Arabia 933 875 822 893 911 970 948 973 981 941 1120 1090 1067
Singapore 1078 999 931 861 841 838 828 809 804 802 774 802 848
Syria 430 322 282 403 522 604 1706 997 1115 916 1138 1311 1389
urkey 195 064 099 139 164 222 244 320 309 254 276 319 302
United Arab Emirates 2258 2529 2099 2078 4309 4295 4514 2273 2041 1218 1242 1631 1600
Others 031 034 038 051 056 070 072 097 098 111 121 120 090
Africa 039 103 180 181 207 129 124 156 146 161 185 205 197
Algeria 000 276 736 700 632 478 441 480 476 514 586 682 633
Egypt 008 009 004 002 002 004 008 006 004 003 013 031 034
Morocco 000 010 005 004 007 016 017 056 060 084 088 076 086
Senegal 075 108 120 120 133 138 141 145 144 138 133 112 119
unisia 164 116 169 142 553 210 202 405 327 358 178 390 386
Others 1726 2207 601 1590 2699 360 352 821 439 579 1947 470 368
DEVELOPED COUNTRIES 813 789 805 825 833 837 875 916 933 875 911 976 981
EC ( 27 ) 808 781 802 826 818 799 885 946 981 909 901 917 891
Other Europe 331 385 435 488 545 616 639 696 711 665 702 821 800
Albania 581 275 605 731 549 535 533 636 547 540 547 541 539
Belarus 309 173 161 210 238 292 301 341 431 381 463 419 623
Bosnia Herzgovina 014 016 007 1093 1223 1188 999 1014 1081 986 983 1013 1015
Croatia 929 964 1009 1135 1142 1215 1161 1237 1291 1182 1121 1107 1055
Iceland 1246 1286 1401 1414 1573 1591 1778 1803 1785 1818 1797 1818 1855
Macedonia Former YR 254 101 383 755 1021 863 738 786 751 812 878 925 923
Moldova Rep 040 042 037 079 128 185 207 306 354 326 295 344 318
Norway 1334 1350 1319 1390 1444 1584 1599 1662 1748 1681 1607 1588 1550
Russian Fed 340 415 440 543 584 593 616 670 690 678 747 915 878
Serbia Montenegro 184 634 1066 143 926 552
Serbia 568 668 700 437 425 522 461
Montenegro 1318 1356 1338 1343 1040 1172 1170
Switzerland 1009 1019 1024 988 999 1001 992 1040 1085 1060 1042 1031 1016
Ukraine 122 115 165 183 143 532 584 643 605 497 473 548 540
North America 1287 1213 1222 1200 1186 1161 1159 1198 1162 1038 1193 1332 1392
Canada 1299 1308 1333 1338 1379 1391 1400 1431 1433 1431 1458 1475 1520
United States 1285 1203 1210 1185 1164 1136 1133 1172 1132 995 1164 1317 1377
Others 659 608 571 597 616 645 635 597 664 748 678 660 677
Japan 858 787 743 782 812 844 825 767 864 990 876 841 859
New Zealand 1753 1847 1700 1670 1619 1874 1932 1901 1869 1766 1862 1832 1809
South Arica 006 006 004 003 006 010 027 045 048 045 073 104 123
WORLD 404 382 388 407 413 422 443 459 475 451 477 512 492
8102019 Banana Import Export Global Stats
httpslidepdfcomreaderfullbanana-import-export-global-stats 21391616
Table 5 - Exports by countries of destination 1
Tableau 5 - Exportations par pays de destination 1
Cuadro 5 - Exportaciones por paiacuteses de destino 1
2002 2003 2004 2005 2006 2007 2008 2009 2010 2011 2012
(prel)
( thousand tonnes milliers de tonnes miles de toneladas )
BELIZE
O
United Kingdom 430 749 805 763 730 609 821 798 788 711 990
Others 06 20 04 126 03
TOTAL 430 749 805 763 730 611 827 818 792 837 993
BRAZIL
O
Argentina 1631 1297 914 979 561 583 339 522 385 231 354
Italy 208 234 171 191 128 86 70
Uruguay 395 401 423 478 429 393 388 364 372 338 350
United Kingdom 301 259 306 361 546 400 165 190 120 140 147
Others 84 251 30 69 236 290 290 276 448 392 107
TOTAL 2410 2208 1881 2121 1943 1857 1309 1439 1395 1101 957
COLOMBIA
O
Belgium-Lux 5669 4763 5707 6246 6048 5023 6122 5194 4162 5093 5397
United States 5682 4869 4634 5259 4802 4767 4884 6765 5478 4767 3173
UK 264 2563 2740 4468
Italy 1226 1193 1120 1006 721 991 1147 1801 2122 2236 2425
Russian Federation 147 177 501 311 184 215 52 04 35 China 191 - - - - - -
Saudi Arabia 05 66 27 - - - -
Germany 2064 1929 1351 1615 2086 3698 2882 2909 2181 3560 1532
Others 720 1235 1369 1778 3133 2798 2948 4032 1516 723 1355
TOTAL 1 5704 1 4232 1 4709 1 6215 1 6974 1 7492 1 7983 2 1018 1 8026 1 9153 1 8349
COSTA RICA
O
North America 8093 9276 8548 7911 9505 1 0382 8557 6569 8553 8832 8723
Europe 8133 9733 9376 8073 9462 9541 9112 8135 8654 8553 9960
Russian Federation 154 693 303 439 438 1546
Others 00 04 01 161 490 1670 364 868 563 1199 57TOTAL 1 6226 1 9013 1 7925 1 6145 1 9611 2 1592 1 8726 1 5875 1 8209 1 9022 2 0286
COcircTE DrsquoIVOIRE
O
France 1740 1288 1201 1432 1238 998 813 1333 871 494 707
UK 64 198 228 306 420 402 418 510 887 892 921
Germany 01 - 168 207 194
Italy 09 - 03 - 03
Belgium - Luxembourg 917 422 950 1218 1077 375 857 1130 1029
Senegal 140 131 144 149 200 213 214 179 239 167 210
Others 616 805 34 35 55 78 110 173 331 311 331
TOTAL 2560 2422 2524 2344 2864 2908 2643 2570 3356 3201 3394
8102019 Banana Import Export Global Stats
httpslidepdfcomreaderfullbanana-import-export-global-stats 22391717
Table 5 - Exports by countries of destination 1
Tableau 5 - Exportations par pays de destination 1
Cuadro 5 - Exportaciones por paiacuteses de destino 1
2002 2003 2004 2005 2006 2007 2008 2009 2010 2011 2012
(prel)
( thousand tonnes milliers de tonnes miles de toneladas )
DOMINICA
O
United Kingdom 164 134 133 118 118 72 105 364 39 41 23
Others 10 - 00 28 23 23 24 17 01 00 00 00
TOTAL 175 134 161 141 141 96 122 365 39 41 23
DOMINICAN REPUBLIC
O
Belgium-Lux 290 472 215 213 262 298 376 619 731 490 591
Italy 79 53 62 71 107 57 14 04 03 60 21United Kingdom 562 604 627 1271 1274 1585 1316 1669 2051 1 803 1 773
United States 34 26 41 33 72 17 04 20 02 05 09
Others 182 112 75 84 341 163 209 507 618 680 579
TOTAL 1147 1267 1020 1671 2056 2120 1919 2818 3404 3038 2972
ECUADOR
O
United States 1 1284 9382 9246 9562 9425 7297 8805 1 1445 1 0001 8942 7256
Italy 9337 1 1752 1 1745 1 1317 9455 9163 9439 1 0043 8401 7337 5906
Germany 5018 5232 4691 5200 4247 3202 5324 5250 4473 5740 4132
Belgium-Lux 2036 2140 2205 1686 2004 2633 3904 3189 3472 3187 2852
Russian Federation 8742 9766 1 0310 1 1439 9893 9103 1 3947 1 3151 1 0624 1 2140 1 1401Argentina 394 1095 1419 1227 1053 1120 2156 1955 1813 326 421
Chile 1678 2195 1847 1840 1893 1421 1857 1977 2076 3992 3955
Japan 1708 1552 1330 982 923 446 532 664 447 354 357
New Zealand 619 397 418 384 310 239 303 322 313 235 225
Poland 410 48 - 67 - 42 225 172 266 207
China 168 108 39 04 45 10 19 102 451
Iran - - - 39 - - - 10 21 24
Others 597 3201 2004 2823 8706 1 5943 4217 3088 1 2900 6805 1 6756
TOTAL 4 1992 4 6712 4 5370 4 6539 4 7978 5 0571 5 1328 5 4731 4 9450 5 3919 4 9821
GRENADA
OUnited Kingdom 06 04 04 03 02 05
TOTAL 06 04 04 - 03 02 05
GUATEMALA
O
United States 8259 9251 8617 8894 9216 6001 1 2215 1 3638 1 2652 1 3384 1 5841
United Kingdom - - - 04 10 10 51 15 11 16 28
Italy - - - 03 46 04 - 01 23 416 152
El Salvador 31 28 315 493 416 213 952 243 875 733 825
Others 1427 54 1206 1070 138 7076 329 167 130 1039 2362
TOTAL 9717 9333 1 0138 1 0463 9826 1 3304 1 3547 1 4064 1 3691 1 5588 1 9208
8102019 Banana Import Export Global Stats
httpslidepdfcomreaderfullbanana-import-export-global-stats 23391818
Table 5 - Exports by countries of destination 1
Tableau 5 - Exportations par pays de destination 1
Cuadro 5 - Exportaciones por paiacuteses de destino 1
2002 2003 2004 2005 2006 2007 2008 2009 2010 2011 2012
(prel)
( thousand tonnes milliers de tonnes miles de toneladas )
HONDURAS
O
United States 3913 3915 4984 4535 4569 4586 5656 4829 4560 4598 8022
Belgium-Lux 155 84 183 226 212 215 122 73 154 155 270
Germany
Italy 09
United Kingdom 13 46 07 26 26 45
Others 324 436 110 250 381 900 233 288 384 387 676
TOTAL 4414 4434 5277 5011 5162 5701 6057 5197 5124 5166 9014
JAMAICA
O
United Kingdom 399 418 287 116 319 174 00 00 00 00 00
Others 00 - 00 00 00 00 00 00 00 00 00 00
TOTAL 399 418 287 116 319 174 00 00 00 00 00
MEXICO
O
United States 334 277 363 379 429 367 593 1238 1552 1635 2499
Japan 54 47 37 30 29
Spain 01 56 64 70 54
Russian Fed 01 23 09 01 01Others 24 122 53 323 237 49 100 36 78 40 492
TOTAL 358 399 416 702 666 416 749 1401 1741 1776 3075
PANAMA
O
Germany 162 131 166 22 118 01 46 - 28 05 29
United States - - 06 59 175 136 266 47 281 340 150
Belgium-Lux 1201 888 739 578 765 716 91 30 78 00 00
Portugal 1056 1031 817 430 415 438 101 65 113 196 160
Sweden 1743 1785 2093 1922 2129 2331 2315 1385 1855 1530 1391
Italy - - 66 116 160 88 490 57 49 179 123
Others 22 267 93 356 549 676 358 989 320 419 596TOTAL 4185 4102 3980 3483 4311 4386 3666 2572 2724 2669 2450
PHILIPPINES
O
Japan 8477 8840 9152 9182 9095 9142 1 1065 9138 7921 8922 1 0848
Iran 93 304 1699 2234 3727 4287 4013 2506 2196 1497 990
Saudi Arabia 507 01 102 187 65 217 120 95 78 1161
China 3788 4156 3309 3512 3815 2034 1815 983 1658 4034 4220
China Hong Kong SAR 04 243 201 199 152 190 383 223 75 198 903
Korea Rep o 1519 1588 1386 2341 2649 2756 1866 1321 1133 1979 2655
United Arab Emirates 2092 2002 1576 1799 2075 1672 711 572 789 1016 2628
Others 370 1161 650 874 1415 2031 1857 1778 2034 2831 3056
TOTAL 1 6850 1 8294 1 7973 2 0243 2 3115 2 2177 2 1926 1 6641 1 5901 2 0555 2 6461
8102019 Banana Import Export Global Stats
httpslidepdfcomreaderfullbanana-import-export-global-stats 24391919
Table 5 - Exports by countries of destination 1
Tableau 5 - Exportations par pays de destination 1
Cuadro 5 - Exportaciones por paiacuteses de destino 1
2002 2003 2004 2005 2006 2007 2008 2009 2010 2011 2012
(prel)
( thousand tonnes milliers de tonnes miles de toneladas )
PERU
O
United States 112 135 122 231 264 179 239 198 198 235 278
Belgium 39 22 61 92 100 48 72 38 71 55 72
Netherlands 03 02 47 59 115 277 320 432 457 609 659
Germany 33 - 04 04 44 67 57 34 59 32 55
Japan 01 34 42 44 79 73 101 79 88 118
Others 04 20 04 01 04 05 22 30 30 69 57
TOTAL 191 181 273 429 571 655 782 833 894 1088 1238
SAINT LUCIA
O
United Kingdom 493 348 417 300 341 239 393 332 232 61 120
Others 00 00 14 07 08 17 19 00 00 01 01
TOTAL 493 348 431 307 349 256 412 332 232 62 121
STVINCENT amp GRENADINES
O
United Kingdom 344 285 240 204 180 182 114 75 41 08 07
Others 25 00 00 48 58 66 100 106 81 102 103
TOTAL 369 285 240 252 238 248 214 181 121 110 110
SURINAME
O
United Kingdom 280 - 47 98 11
France 62 257 454 562 654 570
Others 00 104 40 09 - 00 - 00 00 791 629 831
TOTAL 280 01 214 396 474 562 654 570 791 629 831
1 As declared by exporting countries1 Comme declareacute par les pays exportateurs1 De acuerdo a lo declarado por los paiacuteses exportadores
8102019 Banana Import Export Global Stats
httpslidepdfcomreaderfullbanana-import-export-global-stats 25392020
Table 6 - Gross Imports by countries of origin 1
Tableau 6 - Importations brutes par pays drsquoorigine 1
Cuadro 6 - Importaciones brutas por paiacuteses de origen 1
2002 2003 2004 2005 2006 2007 2008 2009 2010 2011 2012
(prel)
( thousand tonnes milliers de tonnes miles de toneladas )
ARGENTINA
FROM
Ecuador 471 1168 1600 1415 1658 1840 2149 1973 2127 2397 2245
Brazil 1648 1293 903 981 561 583 338 523 386 232 394
Bolivia 146 249 407 557 641 647 706 780 753 994 873
Others 31 153 123 70 97 119 275 165 245 326 254
TOTAL 2295 2864 3033 3022 2957 3189 3468 3441 3511 3949 3766
CANADAFROM
Costa Rica 881 1196 1061 927 881 1253 1154 710 1058 1178 1159
Ecuador 1282 1048 821 780 942 1003 1210 1642 1472 1104 1392
Colombia 1202 1149 1297 1637 1741 1379 1218 1289 1145 963 1298
Honduras 310 287 353 206 101 235 292 175 295 274 275
Mexico 111 102 47 10 20 15 28 16 14 20 20
Guatemala 310 429 782 855 794 754 814 931 897 1475 1055
Panama 01 00 - 19 53 39 29 25 37 10 30
Dominican Rep 02 01 07 01 06 04 01 02 01 01 02
Others 75 17 56 55 42 36 31 31 41 41 39TOTAL 4174 4228 4423 4490 4580 4718 4776 4820 4961 5066 5270
CHILE
FROM
Ecuador 1472 1569 1585 1670 1630 1698 1659 1730 1738 1766 1825
Others 19 20 18 283 59 84 91 63 19 78 81
TOTAL 1491 1589 1602 1953 1689 1782 1750 1793 1757 1844 1906
CHINA
FROM
Philippines 2665 3111 2858 3038 3434 3038 3178 3521 4367 6939 4964
Ecuador 284 285 241 154 42 30 70 22 89 477
Tailand 06 18 57 96 138 152 176 104 163 225
Myanmar 01 01 44 943 1770 549 445
Vietnam 424 798 652 268 292 100 217 192 315 393 93
Others 98 00 01 00 152 02 03 11 74 55 142
TOTAL 3478 4212 3809 3557 3878 3319 3623 4913 6652 8187 6346
8102019 Banana Import Export Global Stats
httpslidepdfcomreaderfullbanana-import-export-global-stats 26392121
Table 6 - Gross Imports by countries of origin 1
Tableau 6 - Importations brutes par pays drsquoorigine 1
Cuadro 6 - Importaciones brutas por paiacuteses de origen 1
2002 2003 2004 2005 2006 2007 2008 2009 2010 2011 2012
(prel)
( thousand tonnes milliers de tonnes miles de toneladas )
EC (27) 2
FROM
Ecuador 1 1570 1 1488 1 1208 1 2392 1 1993 1 1858 1 3306 1 3431 1 2242 1 3412 1 3074
Colombia 7680 7992 7665 8824 9514 1 1561 1 2782 1 2408 1 1610 1 1366 1 1344
Costa Rica 7463 8020 8564 6345 8340 9714 8951 7572 7765 8450 7702
Panama 3962 3815 3708 2816 3130 3541 2946 1851 1844 1597 1436
Cote drsquoIvoire 2167 2074 2108 1838 2218 1894 2166 2292 2443 2241 2249
Cameroon 2365 2985 2612 2529 2527 2218 2795 2497 2430 2352 2139
Dominican Rep 973 1119 1013 1447 1768 2064 1705 2283 3037 3269 2946
Peru 68 57 96 115 227 336 389 441 516 658 814
Belize 387 738 803 742 732 624 821 798 788 711 993
Ghana 33 09 18 42 223 341 460 365 524 472 507
Saint Lucia 493 325 429 282 367 305 385 333 232 62 121
Jamaica 406 418 287 117 319 184 - - - -
Honduras 345 252 212 231 218 316 240 85 152 175 57
Saint Vincent amp the Grenadines 325 209 240 159 172 138 90 75 41 08 07
Guatemala 10 69 22 30 307 188 143 49 33 30 46
Dominica 175 105 122 128 133 73 103 369 37 41 23
Others 569 682 1007 1244 1549 1563 1593 611 1469 1272 1483
TOTAL 3 8991 4 0358 4 0112 3 9281 4 3737 4 6917 4 8873 4 5459 4 5161 4 6114 4 49412 Source European Community
JAPAN
FROM
Philippines 7435 7956 8696 9445 9106 8790 1 0193 1 1591 1 0355 1 0044 1 0267
Ecuador 1570 1456 1227 911 1013 521 462 618 461 343 359
China 251 335 182 151 159 189 90 88 95 84 84
Indonesia - - - - - - - - - - -
Others 106 120 154 162 158 207 182 229 180 170 154
TOTAL 9363 9866 1 0260 1 0669 1 0436 9706 1 0927 1 2526 1 1091 1 0641 1 0864
NEW ZEALAND
FROM
Ecuador 562 308 291 354 326 308 273 258 288 250 279
Philippines 110 360 356 419 481 493 526 500 524 556 526
Panama - - 14 01 01
Others 01 03 01 00 00 04 00 04 01 02 03
TOTAL 673 672 661 775 809 805 800 763 813 809 807
8102019 Banana Import Export Global Stats
httpslidepdfcomreaderfullbanana-import-export-global-stats 27392222
Table 6 - Gross Imports by countries of origin 1
Tableau 6 - Importations brutes par pays drsquoorigine 1
Cuadro 6 - Importaciones brutas por paiacuteses de origen 1
2002 2003 2004 2005 2006 2007 2008 2009 2010 2011 2012
(prel)
( thousand tonnes milliers de tonnes miles de toneladas )
NORWAY
FROM
Panama 07 28 34 54 68 77 108 92 100 97 95
Costa Rica 260 307 339 425 382 373 343 239 244 261 256
Ecuador 52 67 88 95 175 160 183 300 276 329 324
Colombia 276 223 187 136 79 152 181 162 148 77 75
Others 04 10 14 22 41 21 20 19 18 18 18
TOTAL 598 634 662 732 746 785 835 812 785 782 769
ROMANIA
FROM
Ecuador 547 341 973 1272 1357
Colombia 60 19 39 29 39
Costa Rica 12 17 52 101 55
Honduras 28 28 40
Others 19 52 05 01 53
TOTAL 639 429 1097 1432 1543
RUSSIAN FEDERATION
FROM
Ecuador 5922 7233 7892 7911 7976 9202 9030 9112 9766 1 1999 1 1530
Costa Rica 09 175 10 155 275 21 659 326 482 386 446
China 65 54 41 26 15 30
Colombia 157 212 393 280 205 219 02 52 95 182 123
Vietnam 13 13 12 03 03 08 04
Philippines 139 208 232 212 304 251 315 245 298 355 335
Others 259 180 30 92 194 27 05 25 16 139 72
TOTAL 6500 8021 8569 8649 8954 9787 1 0068 9809 1 0686 1 3076 1 2536
SWITZERLAND
FROM
Costa Rica 383 367 294 278 240 264 184 172 161 156 154
Panama 70 40 40 65 98 125 204 155 165 118 117
Colombia 131 126 175 133 129 87 96 131 132 185 183
Ecuador 55 74 136 180 207 239 250 250 234 224 222
Honduras 01 06 06 01 - -
Others 104 109 84 85 67 68 87 100 106 111 110
TOTAL 743 722 735 742 741 782 821 808 799 794 786
8102019 Banana Import Export Global Stats
httpslidepdfcomreaderfullbanana-import-export-global-stats 28392323
Table 6 - Gross Imports by countries of origin 1
Tableau 6 - Importations brutes par pays drsquoorigine 1
Cuadro 6 - Importaciones brutas por paiacuteses de origen 1
2002 2003 2004 2005 2006 2007 2008 2009 2010 2011 2012
(prel)
( thousand tonnes milliers de tonnes miles de toneladas )
SLOVAKIA
FROM
Ecuador 58 63 15
Costa Rica 135 195 77
Colombia 163 161 60
Panama 119 89 35
Others 12 25 312
TOTAL 487 533 499
TUNISIAFROM
Cameroon 05 - 02 - - 01 05 - - -
Cocircte DrsquoIvoire - - 07 21 38 51 01 - -
Colombia 24 - 30 11 02 46 11 - - 03
Costa Rica - - 10 06 - - 01 18 53 44
Ecuador 133 138 491 169 161 289 313 349 134 366
Others 00 00 03 02 01 23 05 04 00 - 00
TOTAL 163 138 543 208 203 410 335 371 187 413
UNITED STATESFROM
Costa Rica 9015 9761 8653 8227 9274 1 0369 8744 5629 8536 8445 8482
Ecuador 1 0218 9725 9189 9043 9943 9292 8303 9576 9798 8790 7197
Honduras 4492 4321 5079 4530 4229 4827 5056 3887 4357 4452 5357
Guatemala 9252 9341 1 0208 1 0293 9129 1 0934 1 1887 1 1122 1 1515 1 3335 1 4586
Colombia 5064 4693 4646 5137 4738 3772 4508 4216 4609 3845 4402
Mexico 423 352 336 338 386 315 663 1052 1455 1486 2233
Panama 03 02 06 20 75 05 80 54 290 278 592
Nicaragua 297 416 415 381 305 328 311 249 360 356 363
Peru 232 138 124 223 251 178 225 197 201 232 259
Venezuela 37 19 20 07 03 - - - - - -
Dominican Rep 36 21 52 44 62 17 01 10 01 07 27
Others 01 02 00 00 - 00 00 00 00 26 01 - 00
TOTAL 3 9070 3 8792 3 8728 3 8244 3 8395 4 0038 3 9779 3 5992 4 1149 4 1227 4 3497
URUGUAY
FROM
Brazil 408 402 430 457 424 384 382 321 436 390 292
Ecuador 28 01 03 16 19 35 48 42 65 115 142
Others 02 07 04 00 04 01 - 00 53 05 09 14
TOTAL 438 411 437 473 446 420 430 416 506 515 4471 Figures may differ rom those shown in able 3 (a) which exclude re-exports1 Les chiffres dans ce tableau peuvent differer des chiffres du ableau 3 (a) qui ne comprennent pas les reacuteexportations1 Las ciras pueden dierir de las del Cuadro 3 (a) las cuales excluyen las reexportaciones
8102019 Banana Import Export Global Stats
httpslidepdfcomreaderfullbanana-import-export-global-stats 29392424
Table 7 - Import prices in selected countries monthly Tableau 7 - Prix agrave lrsquoimportation mensuels dans certains paysCuadro 7 - Precios mensuales de importacioacuten en algunos paiacuteses
FRANCE
2001 2002 2003 2004 2005 2006 2007 2008 2009 2010 2011 2012 2013
( Euro tonnes )
January 572 547 620 474 623 630 620 - 658 524 794 678 770
February 636 723 628 500 753 770 700 780 720 623 923 820 820
March 865 733 698 640 798 690 700 843 962 720 755 820 770
April 795 608 600 603 810 640 698 820 878 680 760 808 763
May 652 546 528 568 860 608 633 593 715 686 680 730 710
June 580 478 476 615 888 585 594 588 668 755 513 695 688
July 565 340 360 485 498 380 565 605 528 624 440 590 660
August 550 488 298 480 664 510 608 658 490 610 483 600 660
September 615 537 460 430 753 510 338 650 563 590 573 690 660
October 530 407 383 383 673 490 - 583 538 505 586 706 618
November 410 320 410 553 723 590 - 568 527 550 605 665 623
December 460 580 490 660 716 620 - 610 545 700 580 682 660
YEAR 603 525 496 533 730 585 606 663 649 631 641 707 700
USD ton 539 494 560 661 907 734 829 972 902 835 891 908 957
JAPAN2001 2002 2003 2004 2005 2006 2007 2008 2009 2010 2011 2012 2013
( Yen tonnes )
January 44 700 54 800 54700 52700 54900 46400 57700 55300 68100 55000 53000 52100 67800
February 49 100 66 000 60000 56600 56600 58200 64200 58400 69900 61900 56500 56900 71200
March 50 700 71 600 62700 65900 64600 58200 66400 63800 72600 68800 64500 65200 77100
April 54 000 83 200 66800 76400 66800 62900 79300 79100 82100 78300 74100 72200 82100
May 60 500 84 400 72800 70200 61600 64600 78700 82600 88300 77800 78500 72300 92500
June 54 400 80 100 68800 70900 65700 63600 73100 80800 88100 74700 75800 71100 89600
July 53 800 78 700 66400 64300 61900 63600 65000 83500 85500 71700 86200 69600 86600
August 56 500 64 000 68300 52800 60400 61200 64100 84300 81200 69400 72600 66400
September 60 600 65 900 69200 56500 60900 64600 72000 90900 74300 68500 68200 62000
October 53 500 63 700 58200 55100 57000 65100 65700 85600 64200 60900 61600 61000
November 48 700 54 400 51600 55600 49500 60600 59000 80400 58100 48500 60600 59100
December 48 900 50 800 49100 56100 47900 55300 56500 67100 52100 52100 55400 59900
YEAR 52 950 68 133 62 383 61 092 58 983 60 358 66 808 75 983 73 708 65 633 67 250 63 983 80986
USD kg 436 543 538 565 535 519 567 735 788 748 843 802 829
8102019 Banana Import Export Global Stats
httpslidepdfcomreaderfullbanana-import-export-global-stats 30392525
Table 7 - Import prices in selected countries monthly Tableau 7 - Prix agrave lrsquoimportation mensuels dans certains paysCuadro 7 - Precios mensuales de importacioacuten en algunos paiacuteses
UNITED STATES
2001 2002 2003 2004 2005 2006 2007 2008 2009 2010 2011 2012 2013
( USD tonnes )
January 535 427 561 427 589 686 639 689 820 785 892 945 929
February 687 517 462 496 891 854 655 792 944 720 1 002 1 068 923
March 541 572 486 513 792 825 648 1027 909 838 996 1 144 937
April 551 544 384 529 593 730 648 967 890 825 1 027 1 030 903
May 637 626 296 556 618 926 689 923 830 799 1 011 953 909
June 610 648 308 604 486 655 779 868 854 962 976 954 910
July 698 537 296 61 401 560 734 722 827 985 961 965 923
August 683 420 286 548 405 542 697 799 834 899 951 951 940
September 572 486 312 539 594 544 665 803 818 880 947 965 937
October 484 544 328 496 630 549 659 807 810 916 954 956 931
November 496 396 408 492 589 598 651 903 834 908 956 934 923
December 506 625 370 496 646 658 648 830 796 900 942 944 923
YEAR 583 529 375 480 603 677 676 844 847 868 968 984 924
EUROPEAN UNION
2001 2002 2003 2004 2005 2006 2007 2008 2009 2010 2011 2012 2013
( Euro tonnes )
January 590 590 590 590 610 580 600 600 570 630 610 610
February 610 590 600 610 600 590 560 610 580 640 620 620
March 630 610 640 660 600 590 620 660 600 630 630 620
April 640 620 620 630 610 580 640 660 620 620 640
May 620 590 640 640 590 590 610 630 610 610 630
June 600 590 640 680 570 580 590 630 640 600 630
July 560 560 620 610 550 570 590 600 630 590 620
August 600 540 600 610 530 550 580 590 600 570 630
September 610 570 600 630 550 570 610 570 600 580 620
October 580 580 590 620 550 580 600 570 600 590 610November 560 560 600 640 580 580 590 580 600 580 620
December 590 580 620 630 570 560 600 550 610 610 620
YEAR 599 582 613 629 576 577 599 604 605 604 623 617
USD ton 564 656 762 782 722 789 878 839 801 840 801 843
8102019 Banana Import Export Global Stats
httpslidepdfcomreaderfullbanana-import-export-global-stats 31392626
Table 7 - Import prices in selected countries monthly Tableau 7 - Prix agrave lrsquoimportation mensuels dans certains paysCuadro 7 - Precios mensuales de importacioacuten en algunos paiacuteses
HUNGARY
2001 2002 2003 2004 2005 2006 2007 2008 2009 2010 2011 2012 2013
( Forint tonnes )
January 40 000 74 000 115 000 105 000 62 000 181 000 181 000 186 000 188 000 158000 210000 197000
February 39 000 76 000 119 000 109 000 171 000 189 000 189 000 210 000 221 000 172000 213000 236000
March 39 000 83 000 122 000 105 000 179 000 185 000 178 000 226 000 268 000 195000 197000 224000
April 40 000 105 000 137 000 112 000 164 000 190 000 174 000 200 000 241 000 180000 198000 225000
May 39 000 112 000 104 000 176 000 180 000 176 000 160 000 160 000 205 000 200000 185000 211000
June 37 000 108 000 108 000 157 000 184 000 177 000 151 000 149 000 207 000 220000 157000 202000
July 47 000 76 000 105 000 137 000 136 000 129 000 138 000 142 000 186 000 174000 141000 172000
August 45 000 81 000 90 000 104 000 140 000 148 000 151 000 161 000 179 000 160000 150000 187000
September 46 000 104 000 76 000 123 000 152 000 147 000 178 000 165 000 162 000 161000 162000 207000
October 47 000 93 000 98 000 159 000 149 000 145 000 159 000 160 000 151 000 173000 167000 196000
November 61 000 86 000 88 000 242 000 164 000 175 000 160 000 164 000 154 000 176000 165000 192000
December 76 000 92 000 96 000 245 000 163 000 167 000 174 000 181 000 155 000 204000 174000 208000
YEAR 46 333 90 833 104 833 147 833 153 667 167 417 166 083 175 333 193 083 181 083 176 583 204 750
USD ton 162 352 467 729 770 796 904 1 019 954 871 878 910
THE PEOPLErsquoS REPUBLIC OF CHINA (MAILAND)2001 2002 2003 2004 2005 2006 2007 2008 2009 2010 2011 2012 2013
( USD tonnes )
January 250 227 284 295 308 317 377 412 389 491 574
February 243 212 250 297 290 312 374 407 340 428 538
March 196 197 209 274 234 312 332 274 361 403 522
April 207 212 179 267 285 331 332 312 403 428 523
May 205 191 199 274 250 332 405 377 406 437 534
June 218 188 241 271 303 336 409 399 428 484 574
July 228 191 244 267 325 339 41 411 426 526 646
August 195 173 247 240 319 325 381 379 406 528 672
September 202 244 270 276 317 326 394 432 460 534 677
October 213 233 295 290 329 342 375 408 472 501 650
November 220 251 272 292 328 353 403 424 462 541 658
December 215 266 279 296 326 371 398 281 258 577 616
YEAR 216 215 247 278 301 333 352 376 401 490 599
Source United States official dataJapan Monthly Bulletin o Banana Statistics Japan Banana Importersrsquo AssociationFrance Marcheacutes Europeacuteens des Fruits et Leacutegumes Revue drsquoInormation Economique
8102019 Banana Import Export Global Stats
httpslidepdfcomreaderfullbanana-import-export-global-stats 32392727
Table 8 - Wholesalersrsquo selling prices in selected countries monthly Tableau 8 - Prix de vente en gros mensuels dans certains paysCuadro 8 - Precios mensuales de venta al por mayor en algunos paiacuteses
JAPAN
2001 2002 2003 2004 2005 2006 2007 2008 2009 2010 2011 2012 2013
( Yen kgs )
January 81 117 107 106 103 96 120 129 160 126 121 121 139
February 98 135 133 109 115 122 142 145 157 144 129 124 150
March 101 146 130 139 132 120 157 155 151 146 140 130 161
April 123 155 133 149 123 117 167 159 162 142 148 135 172
May 128 154 144 140 119 126 163 154 165 140 145 135 169
June 103 153 131 138 122 122 145 153 160 142 140 133 161
July 112 148 128 119 115 115 135 152 149 141 133 130 153August 106 116 125 101 112 115 134 150 140 135 122 125
September 113 130 126 108 115 128 138 158 137 129 125 119
October 101 128 117 113 107 134 132 178 130 120 133 118
November 102 102 98 113 98 123 128 164 122 101 131 116
December 97 95 98 109 80 111 125 151 116 101 122 121
YEAR 105 132 123 120 112 119 141 154 146 131 132 126 158
USD kg 087 105 106 111 101 102 119 149 156 149 166 157 162
UNITED STATES
2001 2002 2003 2004 2005 2006 2007 2008 2009 2010 2011 2012 2013
( USD kgs )
January 062 064 064 060 059 069 080 075 118 092 101 095 099
February 072 060 064 064 064 101 080 099 112 099 112 117 099
March 077 066 070 055 082 102 079 136 110 101 108 141 101
April 074 067 067 058 069 090 074 133 109 101 105 121 101
May 085 068 062 059 073 104 082 128 105 099 103 106 095
June 070 072 059 066 074 088 084 106 104 106 105 097 094
July 083 065 061 056 058 065 078 096 101 118 096 096 094
August 081 061 058 048 049 061 074 093 101 099 095 096 094
September 080 061 057 047 061 067 082 094 099 088 092 105 094
October 067 056 056 048 066 069 079 096 094 099 091 104 092
November 058 054 055 046 061 065 072 093 091 094 092 099 090
December 063 061 057 055 073 072 069 093 090 096 096 097 088
YEAR 073 063 061 055 066 079 078 104 103 099 100 106 095
8102019 Banana Import Export Global Stats
httpslidepdfcomreaderfullbanana-import-export-global-stats 33392828
Table 8 - Wholesalersrsquo selling prices in selected countries monthly Tableau 8 - Prix de vente en gros mensuels dans certains paysCuadro 8 - Precios mensuales de venta al por mayor en algunos paiacuteses
FRANCE
2001 2002 2003 2004 2005 2006 2007 2008 2009 2010 2011 2012 2013
( Euro kg )
January 084 079 093 081 100 098 090 090 085 079 101 087 104
February 093 095 097 082 112 107 097 105 094 083 122 104 107
March 115 107 103 097 120 103 099 113 122 093 106 105 105
April 115 103 094 093 114 094 097 104 110 094 095 105 105
May 099 090 079 093 112 091 090 081 096 093 091 105 101
June 086 078 080 094 126 094 086 081 091 096 079 105 097
July 092 069 063 082 089 071 078 081 080 085 074 092 090August 081 073 059 074 098 068 081 085 075 080 074 091 092
September 086 080 078 077 106 073 094 084 079 081 080 100 095
October 081 068 076 075 097 074 082 079 081 074 081 102 093
November 075 062 074 085 097 086 075 077 076 079 083 095 092
December 074 082 076 105 102 090 085 081 083 092 081 095
YEAR 090 082 081 086 106 087 088 088 089 086 089 099 098
USD kg 081 077 091 107 132 109 120 130 124 114 124 127 134
EUROPEAN UNION
2001 2002 2003 2004 2005 2006 2007 2008 2009 2010 2011 2012 2013
( Euro kg )
January 094 095 089 097 101 101 102 101 094 113 101 110
February 102 099 091 107 104 104 117 106 094 122 113 108
March 112 105 096 111 102 104 128 125 106 113 117 105
April 114 105 096 111 098 103 122 124 110 111 116 107
May 106 093 093 118 095 100 103 112 111 111 113 108
June 095 091 094 125 094 098 096 112 114 100 110 110
July 078 074 084 099 080 094 094 100 104 091 101
August 088 074 075 097 078 093 093 095 097 090 102
September 093 080 078 107 081 101 091 096 099 092 109
October 084 081 079 103 079 100 095 096 094 094 108
November 077 081 083 104 083 093 096 093 096 094 105
December 085 086 098 104 089 098 097 095 104 095 103
YEAR 094 089 088 107 090 099 103 105 102 102 108 108
USD kg 088 100 109 133 113 136 151 145 135 142 139 148
8102019 Banana Import Export Global Stats
httpslidepdfcomreaderfullbanana-import-export-global-stats 34392929
Table 8 - Wholesalersrsquo selling prices in selected countries monthly Tableau 8 - Prix de vente en gros mensuels dans certains paysCuadro 8 - Precios mensuales de venta al por mayor en algunos paiacuteses
THE PEOPLErsquoS REPUBLIC OF CHINA (MAILAND)
2001 2002 2003 2004 2005 2006 2007 2008 2009 2010 2011 2012 2013
( RMB kg )
January 294 305 333 282 309 310 357 351 304 433 494 385
February 376 319 316 292 324 345 375 343 346 475 508 431
March 369 288 319 275 342 380 366 345 356 511 486 451
April 370 285 342 276 368 334 383 391 407 611 465 478
May 301 278 355 274 386 289 371 457 456 566 432 526
June 264 260 338 272 386 257 356 444 483 415 414 527July 228 249 292 265 339 228 313 408 435 336 379
August 224 249 277 265 270 239 313 383 397 344 373
September 240 273 268 315 324 276 341 356 397 401 378
October 232 270 259 314 285 304 345 329 369 443 397
November 218 290 271 306 276 294 372 300 370 495 386
December 235 311 272 304 291 314 342 288 398 497 380
YEAR 279 281 304 287 325 298 353 366 393 461 424 466
USD kg 034 034 037 035 041 039 051 054 058 071 067 077
URUGUAY
2001 2002 2003 2004 2005 2006 2007 2008 2009 2010 2011 2012 2013
( Pesos uruguayos kg )
January 947 1041 981 1134 1384 1708 1799 1792 2014 1888
February 715 861 886 1160 1309 1603 1766 1605 1803 2102
March 892 937 859 1185 1394 1634 1812 187 1777 2174
April 1064 1025 925 1393 1433 1625 1927 1809 1802 2609
May 920 825 873 1111 1285 1519 1825 169 1744 2057
June 833 843 735 1157 1225 1545 1784 1758 174 2069
July 875 888 730 1267 1588 1874 176 1752 2195
August 837 974 893 1221 1414 1659 1969 182 1814 2092
September 891 887 1041 1256 1531 1607 1928 1844 1843 1909
October 1128 843 1248 1594 1545 1795 1963 1891 1867 1992
November 1107 812 1260 1478 1647 2068 1916 1944 1837 1915
December 860 925 1232 1397 2088 2001 1750 2174 1957
YEAR 922 905 972 1279 1478 1696 1859 1830 1829 2091
USD kg 033 032 040 053 063 081 082 091 095 103
8102019 Banana Import Export Global Stats
httpslidepdfcomreaderfullbanana-import-export-global-stats 35393030
Table 8 - Wholesalersrsquo selling prices in selected countries monthly Tableau 8 - Prix de vente en gros mensuels dans certains paysCuadro 8 - Precios mensuales de venta al por mayor en algunos paiacuteses
UNITED KINGDOM2001 2002 2003 2004 2005 2006 2007 2008 2009 2010 2011 2012 2013
( pence kg )
January 370 570 570 530 630 690 610 720 700 550 950 767 787
February 600 650 600 460 790 670 610 900 730 590 1020 877 778
March 760 720 700 550 690 560 570 850 1090 730 730 975 704
April 750 670 600 530 750 550 590 760 990 770 800 803 773
May 700 630 540 540 910 640 580 680 880 830 820 779 790
June 660 530 520 610 870 660 560 600 930 940 620 772 710
July 600 430 390 530 590 490 520 630 670 790 570 734 714
August 550 490 450 460 690 500 570 660 640 750 590 699
September 590 520 490 530 770 530 650 670 660 740 650 776
October 500 480 440 460 680 530 570 580 650 600 600 655
November 480 400 430 530 680 480 520 610 550 630 590 632
December 470 540 380 650 600 540 530 620 560 690 630 651
YEAR 586 553 509 532 721 570 573 690 754 718 714 760 751
USD kg 084 083 083 097 131 105 115 127 117 111 114 120 121
BANANA ORGANIC
USA
2008 2009 2010 2 011 2012 2013
( USD kg )
January 112 138 131 127 134 136
February 112 138 127 140 138 132
March 154 138 128 142 138 125
April 160 138 127 129 141 127
May 147 138 135 141 135
June 152 138 138 140 138
July 137 138 134 138 138
August 136 134 138 138 131
September 138 125 142 136 135
October 138 129 138 135 138
November 138 134 123 136 135
December 134 131 127 134 137
YEAR 138 135 132 136 136 131
SourceUnited States USDA C amp MS Fruit and Vegetable Division Market News daily reports
Japan Monthy Bulletin o Banana Statistics Japan Banana Importersrsquo Association
8102019 Banana Import Export Global Stats
httpslidepdfcomreaderfullbanana-import-export-global-stats 36393131
Table 9 - Retail prices in selected countries monthly Tableau 9 - Prix mensuels au detail dans certains paysCuadro 9 - Precios mensuales al por menor en algunos paiacuteses
FRANCE
2001 2002 2003 2004 2005 2006 2007 2008 2009 2010 2011 2012 2013
( Euro kg )
January 150 151 162 150 163 173 160 165 160 156 170 162 175
February 157 164 167 152 178 176 163 172 164 156 185 170 182
March 169 181 171 156 182 177 166 179 175 164 188 177 181
April 185 182 174 162 185 172 168 188 190 169 180 184 184
May 180 177 162 158 193 169 168 176 179 167 178 180 181
June 171 171 162 161 203 169 165 169 174 173 173 178 184
July 174 148 151 158 187 163 163 169 168 173 167 178 184
August 162 145 144 147 165 154 157 168 158 166 160 172 180
September 161 155 143 138 172 152 163 165 155 162 157 170 176
October 158 144 143 143 169 147 166 163 157 159 158 172 175
November 151 139 140 140 168 154 160 158 154 157 162 175 175
December 145 141 147 161 174 157 163 158 153 163 161 175 176
YEAR 164 158 156 152 178 164 164 169 166 164 170 174 179
USD kg 146 149 176 189 222 205 224 248 230 217 236 224 245
HUNGARY2001 2002 2003 2004 2005 2006 2007 2008 2009 2010 2011 2012 2013
( Forint kg )
January 251 263 293 251 309 345 329 338 348 323 374 358 399
February 239 263 283 249 313 339 334 348 364 323 421 407 407
March 246 280 283 261 340 339 326 392 421 338 427 425 408
April 284 312 286 276 343 345 338 410 468 357 396 424 404
May 247 302 270 289 347 345 336 361 431 349 392 419
June 221 288 264 310 376 356 319 332 406 371 364 398
July 257 247 248 303 343 340 314 311 389 377 319 372
August 239 248 249 281 317 327 316 313 351 362 297 361
September 252 272 252 258 324 328 329 319 340 361 306 381
October 244 253 250 258 325 302 338 318 331 326 324 395
November 229 233 234 254 345 316 326 303 320 330 343 394
December 245 252 232 294 339 320 320 307 309 350 343 376
YEAR 246 268 262 274 335 334 327 338 373 347 359 393 405
USD ton 086 104 117 135 168 159 178 196 184 167 178 174 188
8102019 Banana Import Export Global Stats
httpslidepdfcomreaderfullbanana-import-export-global-stats 37393232
Table 9 - Retail prices in selected countries monthly Tableau 9 - Prix mensuels au detail dans certains paysCuadro 9 - Precios mensuales al por menor en algunos paiacuteses
UNITED STATES
2001 2002 2003 2004 2005 2006 2007 2008 2009 2010 2011 2012 2013
( USD kg )
January 108 112 116 113 107 108 111 115 139 129 131 133 134
February 116 111 112 111 111 112 112 119 141 129 138 133 135
March 114 114 113 110 112 112 112 132 140 127 137 134 134
April 112 111 113 111 111 112 114 138 139 128 137 133 132
May 112 114 111 108 110 113 111 139 137 126 136 132 133
June 112 113 115 110 109 113 113 140 139 127 135 133 133
July 113 114 113 112 109 112 112 138 136 129 135 133 133
August 108 110 113 112 107 108 112 140 135 127 134 131 131
September 108 110 109 108 107 106 111 139 133 126 134 132 132
October 109 111 108 107 108 108 112 138 132 128 134 133 129
November 106 111 110 103 106 108 114 138 124 128 132 132 129
December 107 111 111 104 106 110 116 136 126 129 132 134 131
YEAR 110 112 112 109 109 110 113 134 135 128 135 133 132
JAPAN
2001 2002 2003 2004 2005 2006 2007 2008 2009 2010 2011 2012 2013
( Yen kg )
January 218 225 235 232 243 222 236 217 224 225 221 207
February 224 239 241 249 239 230 236 226 235 228 220 201
March 237 260 243 248 242 240 238 229 238 232 225 207
April 237 257 241 257 238 251 244 226 255 229 227 211
May 262 262 242 260 245 250 240 226 252 236 218 205
June 282 258 229 262 250 253 240 231 248 227 216 200
July 278 254 229 262 252 246 229 232 240 226 220 200
August 308 246 219 261 241 229 232 232 241 222 210 202
September 295 257 229 257 240 230 232 231 239 230 215 205
October 279 259 230 259 239 235 227 228 238 219 225 194November 255 260 223 245 231 231 222 221 236 218 216 193
December 233 241 220 237 220 230 219 221 233 218 193
YEAR 259 252 232 252 240 237 233 227 240 226 219 202
USD kg 213 201 200 233 218 204 198 219 256 257 275 253
8102019 Banana Import Export Global Stats
httpslidepdfcomreaderfullbanana-import-export-global-stats 38393333
Table 9 - Retail prices in selected countries monthly Tableau 9 - Prix mensuels au detail dans certains paysCuadro 9 - Precios mensuales al por menor en algunos paiacuteses
THE PEOPLErsquoS REPUBLIC OF CHINA (MAILAND)
2001 2002 2003 2004 2005 2006 2007 2008 2009 2010 2011 2012 2013
( RMB kg )
January 325 350 385 335 345 365 415 410 365 495 55
February 410 375 395 350 365 395 435 415 420 545 595
March 420 335 365 345 385 425 450 425 435 58 58
April 435 340 375 350 410 435 460 465 490 67 54
May 395 365 385 365 425 325 455 510 530 63 53
June 320 380 365 370 430 290 425 490 565 5 51
July 295 305 365 360 370 260 400 485 587 46 48
August 285 315 345 365 325 280 410 465 490 45 45
September 290 335 350 385 390 285 425 430 510 49 485
October 310 355 368 390 335 360 438 425 480 53 52
November 305 376 370 375 315 340 465 390 450 575 49
December 310 395 375 380 320 375 350 385 470 59 495
YEAR 342 352 370 364 368 345 427 441 483 543 519
USD kg 041 043 045 044 046 045 061 065 071 084 082
8102019 Banana Import Export Global Stats
httpslidepdfcomreaderfullbanana-import-export-global-stats 3939

8102019 Banana Import Export Global Stats
httpslidepdfcomreaderfullbanana-import-export-global-stats 13398
In return or MFN tariff reduction by the EU the US and Latin American countriesagreed to cease all legal disputes against the EU at the WO and not demand anyadditional cuts or bananas in the Doha Round negotiations on agriculture At theaverage import price o 623 eurostonne in 2012 the MFN tariff o 136 eurostonnewas equivalent to 218 percent ad-valorem duty
Compared to the MFN tariff EU duties on bananas rom Colombia Peru and CentralAmerican countries have been reduced as part o the trade deals in the AssociationAgreements that these countries have signed with the EU Since 1 August 2013the ree trade provisions o the Agreements are applied to imports rom ColombiaHonduras Nicaragua and Panama while preerential trade arrangements betweenthe EU and Peru have been in orce since March 2013 Under these arrangementsthe preerential tariff or these countries was set at 124 eurostonne in 2013 and willbe gradually reduced to 75 eurostonne by 2020 Te same provisions would apply toCosta Rica Guatemala and El Salvador in the coming months Mexico is benefitingrom an import quota o 2 000 tonnes with an intra-quota duty o 70 eurostonne
ACP banana suppliers who have an Economic Partnership Agreement (EPA) withthe EU benefit rom duty and quota ree access to the EU market All current bananasuppliers in the ACP5 have concluded negotiations on either a ull or interim EPAand are thereore exempt rom any import duties on bananas However apart romsome o the Arican exporters ACP producers do not have the economies o scaleto compete with banana suppliers rom South and Central America Te situationis exacerbated by the lack o strategic partnerships along the value chain (in theexporter wholesaler and retailer segments) except or the Windward Islands whichmarket their bananas through their own distribution company
Te gradual reduction in the MFN tariff and preerential duties on bananas romLatin American countries entails preerence erosion or the ACP countries So arit appears that the implications or ACP banana exports to the EU have been rathersubdued with the exception o some o the Caribbean countries where preerenceerosion contributed to a decline already underway No sizable expansion o exportsrom Latin America to the EU has been registered afer the agreement on bananas wasreached Te EUrsquos imports rom the majority o Latin American countries decreasedin 2012 due to weak demand Among the ACP countries the perormance has beenmixed While countries like Belize managed to substantially expand their exports tothe EU others like Cameroon have seen their export share decrease Moreover some
ACP countries like Cocircte drsquoIvoire managed to diversiy their exports destinationswith significant growth in exports accounted or by the expansion in shipments todestination outside the EU
However preerence erosion remains a cause o concern or many ACP countrieso help them adjust to the new trade regime by either boosting the competitivenesso their banana sector or diversiying into other productive activities the EU isproviding financial support to these countries through the Banana AccompanyingMeasures (BAM) In total 190 million euros were allocated Tese support measures
5 Belize Cameroon Ivory Coast Dominica Dominican Republic Ghana Grenada Jamaica Saint LuciaSaint Vincent and the Grenadines and Suriname
8102019 Banana Import Export Global Stats
httpslidepdfcomreaderfullbanana-import-export-global-stats 14399
were proposed by the European Commission in March 2010 However the processo adopting BAM as a legal instrument has been protracted as the Council and theEuropean Parliament (EP) engaged in a series o extended debates on the proposalAn agreement was finally reached at the end o 2011 providing long awaited legalbasis or the BAM However the calls or project proposals to be supported with
BAM have only been launched in 2013
Te beneficiary countries are those which exported more than 10 000 tonnes per yearon average over the past decade Cameroon Cocircte drsquoIvoire and Ghana in Arica andBelize Dominica Dominican Republic Jamaica Saint Lucia Saint Vincent and theGrenadines and Suriname in the Caribbean
Table 2 BAM allocation by country euro million
Min Max
Belize 205 230
Cameroon 440 490
Cote drsquoIvoire 405 450
Dominica 140 155
Dominican R 150 165
Ghana 65 75
Jamaica 45 50
St Lucia 95 105
St Vincent amp the G 90 100
Suriname 85 95
Source Programming Guidelines Banana Accompanying Measures (BAM) 2012-2013 January 2012
4 Current situation and short-term outlook
Global supplies o bananas in 2013 could be severely affected by difficult cropprospects in Ecuador and the Philippines In Ecuador output projections indicatea urther decline in 2013 as the area under cultivation has shrunk Governmentestimates show planted area ell rom 200 000 hectares in January 2012 to 171 000hectares in February 2013 Tis decline in part reflects the pessimistic outlook o
Ecuadorian producers since their bananas will struggle to remain competitive in theEuropean market where practically all other exporters will be paying a preerentialtariff while Ecuador continues to pay an MFN duty rate In the Philippines weatherconditions have negatively affected banana production About one quarter o thebanana crop in the Philippines was destroyed by yphoon Bopha in December 2012 6Shipments o bananas rom Central America and Colombia on the other hand willremain solid aided by the entry into orce o the preerential duty rates charged onexports to the EU Exports rom Colombia are expected to recover once the campaignto eradicate Moko is successully completed
6 The devastating typhoon Haiyan that swept the Philippines in early November 2013 largely spared thePhilippines major banana producing region
8102019 Banana Import Export Global Stats
httpslidepdfcomreaderfullbanana-import-export-global-stats 153910
Te demand or bananas in both the EU and Russia seem to recover in 2013 as importsare showing promising signs During the first 9 months o 2013 import quantities inthe EU and Russia increased by 56 and 57 percent relative to the same period in2012 respectively 7 US imports are also likely to grow in 2013 as monthly importshave been consistently above those o 2012 in both value and volume Overall during
the first three quarters o 2013 the volume o US imports increased 46 percent
In 2013 the import prices in the US seemed to have stabilized at a somewhat lowerlevel compared to the record prices in 2012 Te average US import price during thefirst 6 months o 2013 stood at USD 923tonne or 74 percent lower than during thesame period in 2012 Tis is still well above the average import prices prevalent inthe EU although some countries like France are showing a tendency towards higherprices in 2013 Overall prices in the EU are expected to remain firm and close to the2012 level
Te ACP countries will continue to enjoy preerential access to the EU market
although the preerential margin vis-agrave-vis the major exporters such as Colombiaand Costa Rica will be shrinking over time as the ree trade agreements with thesecountries enter into orce Unless Ecuador enters into new negotiations with theEU it will continue paying higher tariffs than its major competitors underminingEcuadorrsquos export opportunities While the gap between the MFN tariff and thepreerential tariff o Colombia or example was not that high in 2013 (132 eurostonne versus 124 eurostonne) the difference will increase substantially by 2020unless a new reduction on the MFN tariff is achieved as part o multilateral tradetalks on agriculture At current import prices in the EU by 2020 Ecuador wouldbe paying 18 percent in ad-valorem tariff equivalent while the preerential rate orColombia Peru and Central America would be 12 percent
7 Based on GTA data
8102019 Banana Import Export Global Stats
httpslidepdfcomreaderfullbanana-import-export-global-stats 1639
STATISTICAL TABLES
8102019 Banana Import Export Global Stats
httpslidepdfcomreaderfullbanana-import-export-global-stats 17391212
Table 1 - World gross exports by country Tableau 1 - Exportations brutes mondiales par paysCuadro 1 - Exportaciones brutas mundiales por paiacutes
2000 2001 2002 2003 2004 2005 2006 2007 2008 2009 2010 2011 2012
(prel)
( thousand tonnes milliers de tonnes miles de toneladas )
Latin America amp Caribbean 9 7239 9 4433 9 9331 10 4715 10 4367 10 6201 11 2608 12 1333 11 9550 12 3458 11 7717 12 5270 13 0280
Central and South America 9 4791 9 1823 9 6743 10 2260 10 2225 10 3715 10 9502 11 8437 11 6878 11 9762 11 3922 12 2020 12 7054
Belize 658 501 430 749 805 763 730 611 827 818 792 837 993
Bolivia 94 129 165 284 427 536 762 795 858 894 884 983 727
Brazil 718 1051 2410 2208 1881 2122 1943 1857 1309 1439 1395 1101 957
Colombia 1 6802 1 5163 1 5704 1 4232 1 4709 1 6215 1 6974 1 7492 1 7983 2 1018 1 8026 1 9153 1 8349
Costa Rica 1 8833 1 7393 1 6226 1 9013 1 7925 1 6145 1 9611 2 1592 1 8726 1 5875 1 8209 1 9022 2 0286
Ecuador 3 9395 3 9904 4 1992 4 6712 4 5370 4 6539 4 7978 5 0571 5 1328 5 4731 4 9450 5 3919 4 9821
Guatemala 8013 8738 9717 9333 1 0138 1 0463 9826 1 3304 1 3547 1 4064 1 3691 1 5588 1 9208
Honduras 3753 4318 4414 4434 5277 5011 5162 5701 6057 5197 5124 5166 9014
Mexico 455 374 358 399 416 702 666 416 749 1401 1741 1776 3075
Nicaragua 455 441 408 409 449 455 377 389 378 347 200 82 93
Panama 4893 3211 4185 4102 3980 3483 4311 4386 3666 2572 2724 2669 2450
Peru 09 80 191 181 273 429 571 655 782 833 894 1088 1238
Suriname 354 287 280 01 214 396 474 562 654 570 791 629 831
Venezuela 361 233 265 203 360 456 117 106 14 01 01 08 12
Caribbean 2448 2609 2589 2455 2142 2487 3105 2896 2673 3696 3795 3250 3226 Dominican Republic 802 1302 1147 1267 1020 1671 2056 2120 1919 2818 3404 3038 2972
Jamaica 420 431 399 418 287 116 319 174 00 00 00 00 00
Others 1226 877 1042 771 835 700 731 602 754 877 391 212 254
Asia 17038 16896 17853 19443 19047 21693 24103 23121 23057 18574 17649 22174 28179
China 502 392 397 530 416 388 228 209 151 132 86 102 79
Malaysia 311 302 279 246 211 338 268 271 301 200 214 229 183
Pakistan 21 14 37 72 60 85 109 79 130 867 577 588 588
Philippines 1 5994 1 6007 1 6850 1 8294 1 7973 2 0243 2 3115 2 2177 2 1926 1 6641 1 5901 2 0555 2 6461
Tailand 58 55 52 63 177 418 203 214 228 256 228 252 276
Vietnam 45 42 146 126 72 39 21 16 26 17 35 32 32 Others 107 84 92 111 138 181 159 154 296 462 608 417 560
India 86 81 87 109 126 144 115 130 276 458 608 399 545
Africa 4941 4889 5329 5651 5568 5045 6057 5801 6114 5682 6435 6337 6488
Cameroon 2382 2541 2588 3137 2949 2655 2566 2323 2687 2555 2328 2490 2465
Cocircte drsquoIvoire 2173 2244 2560 2424 2524 2344 2864 2908 2643 2570 3356 3201 3394
Ethiopia 05 03 09 13 29 00 05 26 20 28 36 41 41
Others 93 48 107 77 65 46 621 544 764 528 714 606 588
Ghana 39 33 30 13 19 19 575 521 698 476 675 579 561
Oceania 03 01 01 01 01 01 01 01 01 01 01 01 01
WORLD 11 9221 11 6218 12 2514 12 9810 12 8982 13 2940 14 2768 15 0255 14 8723 14 7714 14 1802 15 3783 16 4948
8102019 Banana Import Export Global Stats
httpslidepdfcomreaderfullbanana-import-export-global-stats 18391313
Table 2 - World net imports by country Tableau 2 - Importations nettes mondiales par paysCuadro 2 - Importaciones netas mundiales por paiacutes
2000 2001 2002 2003 2004 2005 2006 2007 2008 2009 2010 2011 2012
(prel)
( thousand tonnes milliers de tonnes miles de toneladas )
DEVELOPING COUNTRIES 2 2705 1 9519 1 9760 2 3592 2 5037 2 7438 2 9908 3 0399 3 3967 3 3997 3 8240 4 1996 3 7561
Latin America amp Caribbean 6360 6031 5006 5591 5626 6007 5629 5986 6226 6143 6412 6814 6678
Argentina 3400 3301 2295 2864 3033 3022 2957 3189 3468 3441 3511 3949 3766
Chile 1926 1475 1491 1578 1597 1953 1689 1782 1750 1793 1757 1844 1906
El Salvador 590 612 614 566 515 531 491 538 527 435 487 448 498
Uruguay 330 489 438 411 437 476 451 422 431 416 506 515 447
Others 115 154 167 171 43 25 41 54 50 58 152 59 62
Asia 1 5762 1 1937 1 2007 1 5193 1 6148 1 9356 2 2266 2 1834 2 5295 2 5112 2 8624 3 1575 2 7362
China 6423 4676 4013 4811 4373 4142 4467 3873 4210 5536 7408 9095 7158
Iran 2000 756 1507 2710 2709 4509 3728 4477 7516 7128 6395 5909 3555
Jordan 53 29 22 15 21 63 93 202 330 256 396 483 498
Korea Rep 1842 1945 1872 2200 2083 2533 2797 3077 2581 2570 3379 3527 3680 Kuwait 233 238 255 261 302 305 676 889 961 929 911 1305 1398
Saudi Arabia 1869 1810 1765 1994 2115 2332 2351 2481 2567 2524 3074 3062 3062
Singapore 423 398 376 352 350 357 365 371 384 397 393 416 446
Syria 687 530 478 704 939 1116 3227 1927 2196 1837 2323 2722 2934
urkey 1242 416 646 919 1102 1510 1686 2243 2191 1824 2007 2346 2251
United Arab Emirates 685 796 683 707 1576 1748 2105 1229 1267 845 933 1287 1297
Others 305 343 391 520 578 742 771 1066 1094 1265 1403 1423 1084
Africa 582 1551 2748 2808 3263 2074 2013 2580 2446 2741 3203 3607 3521
Algeria 00 854 2315 2233 2046 1571 1472 1626 1639 1796 2079 2453 2310
Egypt 53 59 26 12 11 28 61 47 30 25 101 256 284
Morocco 00 28 14 11 22 49 54 172 187 267 281 246 282
Senegal 71 105 121 123 141 150 157 166 169 168 165 143 156
unisia 155 110 163 138 543 208 203 410 335 371 187 413 413
Others 303 394 109 291 500 68 67 158 86 115 391 95 76
DEVELOPED COUNTRIES 9 8804 9 6173 9 8594 10 1348 10 2763 10 3758 10 8862 11 4379 11 7050 11 0187 11 5162 12 3829 12 4955
EC ( 27 ) 3 8901 3 7718 3 8868 4 0230 4 0010 3 9230 4 3653 4 6824 4 8773 4 5370 4 5087 4 6030 4 4876
Other Europe 8126 9415 1 0599 1 1827 1 3155 1 4812 1 5319 1 6675 1 7004 1 5876 1 6729 1 9533 1 9018
Albania 178 85 187 227 172 168 168 202 174 172 175 174 174
Belarus 311 173 161 209 235 287 294 332 417 367 445 401 594
Bosnia Herzgovina 05 06 03 414 462 449 378 383 408 371 370 380 380
Croatia 419 432 451 506 508 540 515 548 570 521 494 487 463
Iceland 35 37 40 41 46 47 54 55 56 57 57 59 61
Macedonia Former YR 51 20 78 153 208 176 151 161 154 167 181 191 191
Moldova Rep 16 17 15 31 49 70 77 112 129 117 105 122 112 Norway 599 609 598 634 662 732 746 785 835 812 785 782 769
Russian Fed 4995 6067 6408 7870 8427 8528 8835 9597 9885 9694 1 0686 1 3076 1 2536
Serbia Montenegro 198 679 1134 151 975 578
Serbia 558 657 689 431 419 515 454
Montenegro 83 85 84 85 66 74 74
Switzerland 723 734 743 722 735 742 741 782 821 808 799 794 786
Ukraine 595 555 791 870 676 2494 2720 2975 2781 2273 2148 2478 2426
North America 4 0289 3 8387 3 9072 3 8738 3 8649 3 8223 3 8516 4 0151 3 9309 3 5429 4 1075 4 6293 4 8768
Canada 3984 4049 4170 4228 4406 4490 4567 4718 4776 4819 4961 5066 5270
United States 3 6304 3 4338 3 4902 3 4511 3 4242 3 3733 3 3950 3 5433 3 4534 3 0610 3 6114 4 1227 4 3497
Others 1 1488 1 0653 1 0054 1 0552 1 0949 1 1493 1 1374 1 0730 1 1963 1 3512 1 2271 1 1973 1 2294
Japan 1 0787 9906 9363 9866 1 0260 1 0669 1 0436 9706 1 0927 1 2526 1 1091 1 0641 1 0864 New Zealand 676 722 673 672 661 775 809 805 800 763 813 809 807
South Arica 26 26 18 14 28 50 129 219 236 222 367 523 623
WORLD 12 1508 11 5692 11 8354 12 4940 12 7800 13 1196 13 8770 14 4778 15 1017 14 4183 15 3401 16 5824 16 2516
8102019 Banana Import Export Global Stats
httpslidepdfcomreaderfullbanana-import-export-global-stats 19391414
Table 3 - EC Total supply of bananas and per capita supply Tableau 3 - CE Offre totale de banane et offre par habitantCuadro 3 - CE Oferta total de banano y oferta por habitante
2000 2001 2002 2003 2004 2005 2006 2007 2008 2009 2010 2011 2012
( thousand tons milliers de tonnes miles de toneladas )
France 3589 3228 3589 3292 3053 2805 2686 1673 1716 2358 2420 2425 2517
Guadeloupe 876 890 951 855 591 542 478 380 467 556 426 615 669
Martinique 2713 2337 2639 2437 2462 2262 2208 293 1249 1802 1994 1810 1848
Spain 3976 4209 4073 4009 4184 3450 3482 3614 3713 3520 3970 3465 3710
Greece 33 29 24 27 29 29 29 29 27 26 19 20 22
Cyprus 85 98 105 112 105 58 65 60 42 32 50 56 57
Portugal 225 207 219 214 212 142 153 172 178 145 137 153 177
Production 7907 7771 8011 7654 7582 6484 6416 5547 5676 6080 6595 6118 6485
Net Imports
EC (27) 3 8901 3 7718 3 8868 4 0310 4 0125 3 9230 4 3676 4 6824 4 8738 4 5372 4 5086 4 6030 4 4899
Supply 4 6807 4 5489 4 6880 4 7965 4 7707 4 5714 5 0092 5 2371 5 4414 5 1453 5 1682 5 2149 5 1383
Per capita supply 1231 1191 968 986 977 931 1016 1058 1095 1031 1032 1038 1021
Source EC Commission
8102019 Banana Import Export Global Stats
httpslidepdfcomreaderfullbanana-import-export-global-stats 20391515
Table 4 - Per capita net imports by country Tableau 4 - Importations nettes par habitant par paysCuadro 4 - Importaciones netas por habitante por paiacutes
2000 2001 2002 2003 2004 2005 2006 2007 2008 2009 2010 2011 2012
(prel)
( kg per capita kg par habitant kg por habitante )
DEVELOPING COUNTRIES 127 108 108 128 135 147 158 160 177 175 196 213 185
Latin America amp Caribbean 932 875 719 796 793 839 779 821 847 828 856 902 876
Argentina 921 885 610 754 791 781 758 810 873 859 869 969 916
Chile 1249 945 945 989 990 1198 1026 1071 1042 1058 1027 1068 1094
El Salvador 994 1026 1026 942 854 878 808 882 860 705 786 719 795
Uruguay 994 1472 1317 1237 1316 1432 1356 1266 1288 1240 1501 1523 1319
Others 174 228 243 246 061 035 055 073 066 076 195 074 077
Asia 100 075 075 094 099 118 135 131 151 148 168 184 154
China 051 037 032 038 034 032 034 030 032 042 056 068 052
Iran 306 114 224 398 393 647 528 627 1040 975 865 790 470
Jordan 109 059 044 029 040 118 169 356 564 426 641 762 771
Korea Rep 401 421 403 472 445 538 592 648 541 536 701 729 757 Kuwait 1203 1183 1231 1227 1378 1345 2877 3630 3771 3511 3328 4631 4834
Saudi Arabia 933 875 822 893 911 970 948 973 981 941 1120 1090 1067
Singapore 1078 999 931 861 841 838 828 809 804 802 774 802 848
Syria 430 322 282 403 522 604 1706 997 1115 916 1138 1311 1389
urkey 195 064 099 139 164 222 244 320 309 254 276 319 302
United Arab Emirates 2258 2529 2099 2078 4309 4295 4514 2273 2041 1218 1242 1631 1600
Others 031 034 038 051 056 070 072 097 098 111 121 120 090
Africa 039 103 180 181 207 129 124 156 146 161 185 205 197
Algeria 000 276 736 700 632 478 441 480 476 514 586 682 633
Egypt 008 009 004 002 002 004 008 006 004 003 013 031 034
Morocco 000 010 005 004 007 016 017 056 060 084 088 076 086
Senegal 075 108 120 120 133 138 141 145 144 138 133 112 119
unisia 164 116 169 142 553 210 202 405 327 358 178 390 386
Others 1726 2207 601 1590 2699 360 352 821 439 579 1947 470 368
DEVELOPED COUNTRIES 813 789 805 825 833 837 875 916 933 875 911 976 981
EC ( 27 ) 808 781 802 826 818 799 885 946 981 909 901 917 891
Other Europe 331 385 435 488 545 616 639 696 711 665 702 821 800
Albania 581 275 605 731 549 535 533 636 547 540 547 541 539
Belarus 309 173 161 210 238 292 301 341 431 381 463 419 623
Bosnia Herzgovina 014 016 007 1093 1223 1188 999 1014 1081 986 983 1013 1015
Croatia 929 964 1009 1135 1142 1215 1161 1237 1291 1182 1121 1107 1055
Iceland 1246 1286 1401 1414 1573 1591 1778 1803 1785 1818 1797 1818 1855
Macedonia Former YR 254 101 383 755 1021 863 738 786 751 812 878 925 923
Moldova Rep 040 042 037 079 128 185 207 306 354 326 295 344 318
Norway 1334 1350 1319 1390 1444 1584 1599 1662 1748 1681 1607 1588 1550
Russian Fed 340 415 440 543 584 593 616 670 690 678 747 915 878
Serbia Montenegro 184 634 1066 143 926 552
Serbia 568 668 700 437 425 522 461
Montenegro 1318 1356 1338 1343 1040 1172 1170
Switzerland 1009 1019 1024 988 999 1001 992 1040 1085 1060 1042 1031 1016
Ukraine 122 115 165 183 143 532 584 643 605 497 473 548 540
North America 1287 1213 1222 1200 1186 1161 1159 1198 1162 1038 1193 1332 1392
Canada 1299 1308 1333 1338 1379 1391 1400 1431 1433 1431 1458 1475 1520
United States 1285 1203 1210 1185 1164 1136 1133 1172 1132 995 1164 1317 1377
Others 659 608 571 597 616 645 635 597 664 748 678 660 677
Japan 858 787 743 782 812 844 825 767 864 990 876 841 859
New Zealand 1753 1847 1700 1670 1619 1874 1932 1901 1869 1766 1862 1832 1809
South Arica 006 006 004 003 006 010 027 045 048 045 073 104 123
WORLD 404 382 388 407 413 422 443 459 475 451 477 512 492
8102019 Banana Import Export Global Stats
httpslidepdfcomreaderfullbanana-import-export-global-stats 21391616
Table 5 - Exports by countries of destination 1
Tableau 5 - Exportations par pays de destination 1
Cuadro 5 - Exportaciones por paiacuteses de destino 1
2002 2003 2004 2005 2006 2007 2008 2009 2010 2011 2012
(prel)
( thousand tonnes milliers de tonnes miles de toneladas )
BELIZE
O
United Kingdom 430 749 805 763 730 609 821 798 788 711 990
Others 06 20 04 126 03
TOTAL 430 749 805 763 730 611 827 818 792 837 993
BRAZIL
O
Argentina 1631 1297 914 979 561 583 339 522 385 231 354
Italy 208 234 171 191 128 86 70
Uruguay 395 401 423 478 429 393 388 364 372 338 350
United Kingdom 301 259 306 361 546 400 165 190 120 140 147
Others 84 251 30 69 236 290 290 276 448 392 107
TOTAL 2410 2208 1881 2121 1943 1857 1309 1439 1395 1101 957
COLOMBIA
O
Belgium-Lux 5669 4763 5707 6246 6048 5023 6122 5194 4162 5093 5397
United States 5682 4869 4634 5259 4802 4767 4884 6765 5478 4767 3173
UK 264 2563 2740 4468
Italy 1226 1193 1120 1006 721 991 1147 1801 2122 2236 2425
Russian Federation 147 177 501 311 184 215 52 04 35 China 191 - - - - - -
Saudi Arabia 05 66 27 - - - -
Germany 2064 1929 1351 1615 2086 3698 2882 2909 2181 3560 1532
Others 720 1235 1369 1778 3133 2798 2948 4032 1516 723 1355
TOTAL 1 5704 1 4232 1 4709 1 6215 1 6974 1 7492 1 7983 2 1018 1 8026 1 9153 1 8349
COSTA RICA
O
North America 8093 9276 8548 7911 9505 1 0382 8557 6569 8553 8832 8723
Europe 8133 9733 9376 8073 9462 9541 9112 8135 8654 8553 9960
Russian Federation 154 693 303 439 438 1546
Others 00 04 01 161 490 1670 364 868 563 1199 57TOTAL 1 6226 1 9013 1 7925 1 6145 1 9611 2 1592 1 8726 1 5875 1 8209 1 9022 2 0286
COcircTE DrsquoIVOIRE
O
France 1740 1288 1201 1432 1238 998 813 1333 871 494 707
UK 64 198 228 306 420 402 418 510 887 892 921
Germany 01 - 168 207 194
Italy 09 - 03 - 03
Belgium - Luxembourg 917 422 950 1218 1077 375 857 1130 1029
Senegal 140 131 144 149 200 213 214 179 239 167 210
Others 616 805 34 35 55 78 110 173 331 311 331
TOTAL 2560 2422 2524 2344 2864 2908 2643 2570 3356 3201 3394
8102019 Banana Import Export Global Stats
httpslidepdfcomreaderfullbanana-import-export-global-stats 22391717
Table 5 - Exports by countries of destination 1
Tableau 5 - Exportations par pays de destination 1
Cuadro 5 - Exportaciones por paiacuteses de destino 1
2002 2003 2004 2005 2006 2007 2008 2009 2010 2011 2012
(prel)
( thousand tonnes milliers de tonnes miles de toneladas )
DOMINICA
O
United Kingdom 164 134 133 118 118 72 105 364 39 41 23
Others 10 - 00 28 23 23 24 17 01 00 00 00
TOTAL 175 134 161 141 141 96 122 365 39 41 23
DOMINICAN REPUBLIC
O
Belgium-Lux 290 472 215 213 262 298 376 619 731 490 591
Italy 79 53 62 71 107 57 14 04 03 60 21United Kingdom 562 604 627 1271 1274 1585 1316 1669 2051 1 803 1 773
United States 34 26 41 33 72 17 04 20 02 05 09
Others 182 112 75 84 341 163 209 507 618 680 579
TOTAL 1147 1267 1020 1671 2056 2120 1919 2818 3404 3038 2972
ECUADOR
O
United States 1 1284 9382 9246 9562 9425 7297 8805 1 1445 1 0001 8942 7256
Italy 9337 1 1752 1 1745 1 1317 9455 9163 9439 1 0043 8401 7337 5906
Germany 5018 5232 4691 5200 4247 3202 5324 5250 4473 5740 4132
Belgium-Lux 2036 2140 2205 1686 2004 2633 3904 3189 3472 3187 2852
Russian Federation 8742 9766 1 0310 1 1439 9893 9103 1 3947 1 3151 1 0624 1 2140 1 1401Argentina 394 1095 1419 1227 1053 1120 2156 1955 1813 326 421
Chile 1678 2195 1847 1840 1893 1421 1857 1977 2076 3992 3955
Japan 1708 1552 1330 982 923 446 532 664 447 354 357
New Zealand 619 397 418 384 310 239 303 322 313 235 225
Poland 410 48 - 67 - 42 225 172 266 207
China 168 108 39 04 45 10 19 102 451
Iran - - - 39 - - - 10 21 24
Others 597 3201 2004 2823 8706 1 5943 4217 3088 1 2900 6805 1 6756
TOTAL 4 1992 4 6712 4 5370 4 6539 4 7978 5 0571 5 1328 5 4731 4 9450 5 3919 4 9821
GRENADA
OUnited Kingdom 06 04 04 03 02 05
TOTAL 06 04 04 - 03 02 05
GUATEMALA
O
United States 8259 9251 8617 8894 9216 6001 1 2215 1 3638 1 2652 1 3384 1 5841
United Kingdom - - - 04 10 10 51 15 11 16 28
Italy - - - 03 46 04 - 01 23 416 152
El Salvador 31 28 315 493 416 213 952 243 875 733 825
Others 1427 54 1206 1070 138 7076 329 167 130 1039 2362
TOTAL 9717 9333 1 0138 1 0463 9826 1 3304 1 3547 1 4064 1 3691 1 5588 1 9208
8102019 Banana Import Export Global Stats
httpslidepdfcomreaderfullbanana-import-export-global-stats 23391818
Table 5 - Exports by countries of destination 1
Tableau 5 - Exportations par pays de destination 1
Cuadro 5 - Exportaciones por paiacuteses de destino 1
2002 2003 2004 2005 2006 2007 2008 2009 2010 2011 2012
(prel)
( thousand tonnes milliers de tonnes miles de toneladas )
HONDURAS
O
United States 3913 3915 4984 4535 4569 4586 5656 4829 4560 4598 8022
Belgium-Lux 155 84 183 226 212 215 122 73 154 155 270
Germany
Italy 09
United Kingdom 13 46 07 26 26 45
Others 324 436 110 250 381 900 233 288 384 387 676
TOTAL 4414 4434 5277 5011 5162 5701 6057 5197 5124 5166 9014
JAMAICA
O
United Kingdom 399 418 287 116 319 174 00 00 00 00 00
Others 00 - 00 00 00 00 00 00 00 00 00 00
TOTAL 399 418 287 116 319 174 00 00 00 00 00
MEXICO
O
United States 334 277 363 379 429 367 593 1238 1552 1635 2499
Japan 54 47 37 30 29
Spain 01 56 64 70 54
Russian Fed 01 23 09 01 01Others 24 122 53 323 237 49 100 36 78 40 492
TOTAL 358 399 416 702 666 416 749 1401 1741 1776 3075
PANAMA
O
Germany 162 131 166 22 118 01 46 - 28 05 29
United States - - 06 59 175 136 266 47 281 340 150
Belgium-Lux 1201 888 739 578 765 716 91 30 78 00 00
Portugal 1056 1031 817 430 415 438 101 65 113 196 160
Sweden 1743 1785 2093 1922 2129 2331 2315 1385 1855 1530 1391
Italy - - 66 116 160 88 490 57 49 179 123
Others 22 267 93 356 549 676 358 989 320 419 596TOTAL 4185 4102 3980 3483 4311 4386 3666 2572 2724 2669 2450
PHILIPPINES
O
Japan 8477 8840 9152 9182 9095 9142 1 1065 9138 7921 8922 1 0848
Iran 93 304 1699 2234 3727 4287 4013 2506 2196 1497 990
Saudi Arabia 507 01 102 187 65 217 120 95 78 1161
China 3788 4156 3309 3512 3815 2034 1815 983 1658 4034 4220
China Hong Kong SAR 04 243 201 199 152 190 383 223 75 198 903
Korea Rep o 1519 1588 1386 2341 2649 2756 1866 1321 1133 1979 2655
United Arab Emirates 2092 2002 1576 1799 2075 1672 711 572 789 1016 2628
Others 370 1161 650 874 1415 2031 1857 1778 2034 2831 3056
TOTAL 1 6850 1 8294 1 7973 2 0243 2 3115 2 2177 2 1926 1 6641 1 5901 2 0555 2 6461
8102019 Banana Import Export Global Stats
httpslidepdfcomreaderfullbanana-import-export-global-stats 24391919
Table 5 - Exports by countries of destination 1
Tableau 5 - Exportations par pays de destination 1
Cuadro 5 - Exportaciones por paiacuteses de destino 1
2002 2003 2004 2005 2006 2007 2008 2009 2010 2011 2012
(prel)
( thousand tonnes milliers de tonnes miles de toneladas )
PERU
O
United States 112 135 122 231 264 179 239 198 198 235 278
Belgium 39 22 61 92 100 48 72 38 71 55 72
Netherlands 03 02 47 59 115 277 320 432 457 609 659
Germany 33 - 04 04 44 67 57 34 59 32 55
Japan 01 34 42 44 79 73 101 79 88 118
Others 04 20 04 01 04 05 22 30 30 69 57
TOTAL 191 181 273 429 571 655 782 833 894 1088 1238
SAINT LUCIA
O
United Kingdom 493 348 417 300 341 239 393 332 232 61 120
Others 00 00 14 07 08 17 19 00 00 01 01
TOTAL 493 348 431 307 349 256 412 332 232 62 121
STVINCENT amp GRENADINES
O
United Kingdom 344 285 240 204 180 182 114 75 41 08 07
Others 25 00 00 48 58 66 100 106 81 102 103
TOTAL 369 285 240 252 238 248 214 181 121 110 110
SURINAME
O
United Kingdom 280 - 47 98 11
France 62 257 454 562 654 570
Others 00 104 40 09 - 00 - 00 00 791 629 831
TOTAL 280 01 214 396 474 562 654 570 791 629 831
1 As declared by exporting countries1 Comme declareacute par les pays exportateurs1 De acuerdo a lo declarado por los paiacuteses exportadores
8102019 Banana Import Export Global Stats
httpslidepdfcomreaderfullbanana-import-export-global-stats 25392020
Table 6 - Gross Imports by countries of origin 1
Tableau 6 - Importations brutes par pays drsquoorigine 1
Cuadro 6 - Importaciones brutas por paiacuteses de origen 1
2002 2003 2004 2005 2006 2007 2008 2009 2010 2011 2012
(prel)
( thousand tonnes milliers de tonnes miles de toneladas )
ARGENTINA
FROM
Ecuador 471 1168 1600 1415 1658 1840 2149 1973 2127 2397 2245
Brazil 1648 1293 903 981 561 583 338 523 386 232 394
Bolivia 146 249 407 557 641 647 706 780 753 994 873
Others 31 153 123 70 97 119 275 165 245 326 254
TOTAL 2295 2864 3033 3022 2957 3189 3468 3441 3511 3949 3766
CANADAFROM
Costa Rica 881 1196 1061 927 881 1253 1154 710 1058 1178 1159
Ecuador 1282 1048 821 780 942 1003 1210 1642 1472 1104 1392
Colombia 1202 1149 1297 1637 1741 1379 1218 1289 1145 963 1298
Honduras 310 287 353 206 101 235 292 175 295 274 275
Mexico 111 102 47 10 20 15 28 16 14 20 20
Guatemala 310 429 782 855 794 754 814 931 897 1475 1055
Panama 01 00 - 19 53 39 29 25 37 10 30
Dominican Rep 02 01 07 01 06 04 01 02 01 01 02
Others 75 17 56 55 42 36 31 31 41 41 39TOTAL 4174 4228 4423 4490 4580 4718 4776 4820 4961 5066 5270
CHILE
FROM
Ecuador 1472 1569 1585 1670 1630 1698 1659 1730 1738 1766 1825
Others 19 20 18 283 59 84 91 63 19 78 81
TOTAL 1491 1589 1602 1953 1689 1782 1750 1793 1757 1844 1906
CHINA
FROM
Philippines 2665 3111 2858 3038 3434 3038 3178 3521 4367 6939 4964
Ecuador 284 285 241 154 42 30 70 22 89 477
Tailand 06 18 57 96 138 152 176 104 163 225
Myanmar 01 01 44 943 1770 549 445
Vietnam 424 798 652 268 292 100 217 192 315 393 93
Others 98 00 01 00 152 02 03 11 74 55 142
TOTAL 3478 4212 3809 3557 3878 3319 3623 4913 6652 8187 6346
8102019 Banana Import Export Global Stats
httpslidepdfcomreaderfullbanana-import-export-global-stats 26392121
Table 6 - Gross Imports by countries of origin 1
Tableau 6 - Importations brutes par pays drsquoorigine 1
Cuadro 6 - Importaciones brutas por paiacuteses de origen 1
2002 2003 2004 2005 2006 2007 2008 2009 2010 2011 2012
(prel)
( thousand tonnes milliers de tonnes miles de toneladas )
EC (27) 2
FROM
Ecuador 1 1570 1 1488 1 1208 1 2392 1 1993 1 1858 1 3306 1 3431 1 2242 1 3412 1 3074
Colombia 7680 7992 7665 8824 9514 1 1561 1 2782 1 2408 1 1610 1 1366 1 1344
Costa Rica 7463 8020 8564 6345 8340 9714 8951 7572 7765 8450 7702
Panama 3962 3815 3708 2816 3130 3541 2946 1851 1844 1597 1436
Cote drsquoIvoire 2167 2074 2108 1838 2218 1894 2166 2292 2443 2241 2249
Cameroon 2365 2985 2612 2529 2527 2218 2795 2497 2430 2352 2139
Dominican Rep 973 1119 1013 1447 1768 2064 1705 2283 3037 3269 2946
Peru 68 57 96 115 227 336 389 441 516 658 814
Belize 387 738 803 742 732 624 821 798 788 711 993
Ghana 33 09 18 42 223 341 460 365 524 472 507
Saint Lucia 493 325 429 282 367 305 385 333 232 62 121
Jamaica 406 418 287 117 319 184 - - - -
Honduras 345 252 212 231 218 316 240 85 152 175 57
Saint Vincent amp the Grenadines 325 209 240 159 172 138 90 75 41 08 07
Guatemala 10 69 22 30 307 188 143 49 33 30 46
Dominica 175 105 122 128 133 73 103 369 37 41 23
Others 569 682 1007 1244 1549 1563 1593 611 1469 1272 1483
TOTAL 3 8991 4 0358 4 0112 3 9281 4 3737 4 6917 4 8873 4 5459 4 5161 4 6114 4 49412 Source European Community
JAPAN
FROM
Philippines 7435 7956 8696 9445 9106 8790 1 0193 1 1591 1 0355 1 0044 1 0267
Ecuador 1570 1456 1227 911 1013 521 462 618 461 343 359
China 251 335 182 151 159 189 90 88 95 84 84
Indonesia - - - - - - - - - - -
Others 106 120 154 162 158 207 182 229 180 170 154
TOTAL 9363 9866 1 0260 1 0669 1 0436 9706 1 0927 1 2526 1 1091 1 0641 1 0864
NEW ZEALAND
FROM
Ecuador 562 308 291 354 326 308 273 258 288 250 279
Philippines 110 360 356 419 481 493 526 500 524 556 526
Panama - - 14 01 01
Others 01 03 01 00 00 04 00 04 01 02 03
TOTAL 673 672 661 775 809 805 800 763 813 809 807
8102019 Banana Import Export Global Stats
httpslidepdfcomreaderfullbanana-import-export-global-stats 27392222
Table 6 - Gross Imports by countries of origin 1
Tableau 6 - Importations brutes par pays drsquoorigine 1
Cuadro 6 - Importaciones brutas por paiacuteses de origen 1
2002 2003 2004 2005 2006 2007 2008 2009 2010 2011 2012
(prel)
( thousand tonnes milliers de tonnes miles de toneladas )
NORWAY
FROM
Panama 07 28 34 54 68 77 108 92 100 97 95
Costa Rica 260 307 339 425 382 373 343 239 244 261 256
Ecuador 52 67 88 95 175 160 183 300 276 329 324
Colombia 276 223 187 136 79 152 181 162 148 77 75
Others 04 10 14 22 41 21 20 19 18 18 18
TOTAL 598 634 662 732 746 785 835 812 785 782 769
ROMANIA
FROM
Ecuador 547 341 973 1272 1357
Colombia 60 19 39 29 39
Costa Rica 12 17 52 101 55
Honduras 28 28 40
Others 19 52 05 01 53
TOTAL 639 429 1097 1432 1543
RUSSIAN FEDERATION
FROM
Ecuador 5922 7233 7892 7911 7976 9202 9030 9112 9766 1 1999 1 1530
Costa Rica 09 175 10 155 275 21 659 326 482 386 446
China 65 54 41 26 15 30
Colombia 157 212 393 280 205 219 02 52 95 182 123
Vietnam 13 13 12 03 03 08 04
Philippines 139 208 232 212 304 251 315 245 298 355 335
Others 259 180 30 92 194 27 05 25 16 139 72
TOTAL 6500 8021 8569 8649 8954 9787 1 0068 9809 1 0686 1 3076 1 2536
SWITZERLAND
FROM
Costa Rica 383 367 294 278 240 264 184 172 161 156 154
Panama 70 40 40 65 98 125 204 155 165 118 117
Colombia 131 126 175 133 129 87 96 131 132 185 183
Ecuador 55 74 136 180 207 239 250 250 234 224 222
Honduras 01 06 06 01 - -
Others 104 109 84 85 67 68 87 100 106 111 110
TOTAL 743 722 735 742 741 782 821 808 799 794 786
8102019 Banana Import Export Global Stats
httpslidepdfcomreaderfullbanana-import-export-global-stats 28392323
Table 6 - Gross Imports by countries of origin 1
Tableau 6 - Importations brutes par pays drsquoorigine 1
Cuadro 6 - Importaciones brutas por paiacuteses de origen 1
2002 2003 2004 2005 2006 2007 2008 2009 2010 2011 2012
(prel)
( thousand tonnes milliers de tonnes miles de toneladas )
SLOVAKIA
FROM
Ecuador 58 63 15
Costa Rica 135 195 77
Colombia 163 161 60
Panama 119 89 35
Others 12 25 312
TOTAL 487 533 499
TUNISIAFROM
Cameroon 05 - 02 - - 01 05 - - -
Cocircte DrsquoIvoire - - 07 21 38 51 01 - -
Colombia 24 - 30 11 02 46 11 - - 03
Costa Rica - - 10 06 - - 01 18 53 44
Ecuador 133 138 491 169 161 289 313 349 134 366
Others 00 00 03 02 01 23 05 04 00 - 00
TOTAL 163 138 543 208 203 410 335 371 187 413
UNITED STATESFROM
Costa Rica 9015 9761 8653 8227 9274 1 0369 8744 5629 8536 8445 8482
Ecuador 1 0218 9725 9189 9043 9943 9292 8303 9576 9798 8790 7197
Honduras 4492 4321 5079 4530 4229 4827 5056 3887 4357 4452 5357
Guatemala 9252 9341 1 0208 1 0293 9129 1 0934 1 1887 1 1122 1 1515 1 3335 1 4586
Colombia 5064 4693 4646 5137 4738 3772 4508 4216 4609 3845 4402
Mexico 423 352 336 338 386 315 663 1052 1455 1486 2233
Panama 03 02 06 20 75 05 80 54 290 278 592
Nicaragua 297 416 415 381 305 328 311 249 360 356 363
Peru 232 138 124 223 251 178 225 197 201 232 259
Venezuela 37 19 20 07 03 - - - - - -
Dominican Rep 36 21 52 44 62 17 01 10 01 07 27
Others 01 02 00 00 - 00 00 00 00 26 01 - 00
TOTAL 3 9070 3 8792 3 8728 3 8244 3 8395 4 0038 3 9779 3 5992 4 1149 4 1227 4 3497
URUGUAY
FROM
Brazil 408 402 430 457 424 384 382 321 436 390 292
Ecuador 28 01 03 16 19 35 48 42 65 115 142
Others 02 07 04 00 04 01 - 00 53 05 09 14
TOTAL 438 411 437 473 446 420 430 416 506 515 4471 Figures may differ rom those shown in able 3 (a) which exclude re-exports1 Les chiffres dans ce tableau peuvent differer des chiffres du ableau 3 (a) qui ne comprennent pas les reacuteexportations1 Las ciras pueden dierir de las del Cuadro 3 (a) las cuales excluyen las reexportaciones
8102019 Banana Import Export Global Stats
httpslidepdfcomreaderfullbanana-import-export-global-stats 29392424
Table 7 - Import prices in selected countries monthly Tableau 7 - Prix agrave lrsquoimportation mensuels dans certains paysCuadro 7 - Precios mensuales de importacioacuten en algunos paiacuteses
FRANCE
2001 2002 2003 2004 2005 2006 2007 2008 2009 2010 2011 2012 2013
( Euro tonnes )
January 572 547 620 474 623 630 620 - 658 524 794 678 770
February 636 723 628 500 753 770 700 780 720 623 923 820 820
March 865 733 698 640 798 690 700 843 962 720 755 820 770
April 795 608 600 603 810 640 698 820 878 680 760 808 763
May 652 546 528 568 860 608 633 593 715 686 680 730 710
June 580 478 476 615 888 585 594 588 668 755 513 695 688
July 565 340 360 485 498 380 565 605 528 624 440 590 660
August 550 488 298 480 664 510 608 658 490 610 483 600 660
September 615 537 460 430 753 510 338 650 563 590 573 690 660
October 530 407 383 383 673 490 - 583 538 505 586 706 618
November 410 320 410 553 723 590 - 568 527 550 605 665 623
December 460 580 490 660 716 620 - 610 545 700 580 682 660
YEAR 603 525 496 533 730 585 606 663 649 631 641 707 700
USD ton 539 494 560 661 907 734 829 972 902 835 891 908 957
JAPAN2001 2002 2003 2004 2005 2006 2007 2008 2009 2010 2011 2012 2013
( Yen tonnes )
January 44 700 54 800 54700 52700 54900 46400 57700 55300 68100 55000 53000 52100 67800
February 49 100 66 000 60000 56600 56600 58200 64200 58400 69900 61900 56500 56900 71200
March 50 700 71 600 62700 65900 64600 58200 66400 63800 72600 68800 64500 65200 77100
April 54 000 83 200 66800 76400 66800 62900 79300 79100 82100 78300 74100 72200 82100
May 60 500 84 400 72800 70200 61600 64600 78700 82600 88300 77800 78500 72300 92500
June 54 400 80 100 68800 70900 65700 63600 73100 80800 88100 74700 75800 71100 89600
July 53 800 78 700 66400 64300 61900 63600 65000 83500 85500 71700 86200 69600 86600
August 56 500 64 000 68300 52800 60400 61200 64100 84300 81200 69400 72600 66400
September 60 600 65 900 69200 56500 60900 64600 72000 90900 74300 68500 68200 62000
October 53 500 63 700 58200 55100 57000 65100 65700 85600 64200 60900 61600 61000
November 48 700 54 400 51600 55600 49500 60600 59000 80400 58100 48500 60600 59100
December 48 900 50 800 49100 56100 47900 55300 56500 67100 52100 52100 55400 59900
YEAR 52 950 68 133 62 383 61 092 58 983 60 358 66 808 75 983 73 708 65 633 67 250 63 983 80986
USD kg 436 543 538 565 535 519 567 735 788 748 843 802 829
8102019 Banana Import Export Global Stats
httpslidepdfcomreaderfullbanana-import-export-global-stats 30392525
Table 7 - Import prices in selected countries monthly Tableau 7 - Prix agrave lrsquoimportation mensuels dans certains paysCuadro 7 - Precios mensuales de importacioacuten en algunos paiacuteses
UNITED STATES
2001 2002 2003 2004 2005 2006 2007 2008 2009 2010 2011 2012 2013
( USD tonnes )
January 535 427 561 427 589 686 639 689 820 785 892 945 929
February 687 517 462 496 891 854 655 792 944 720 1 002 1 068 923
March 541 572 486 513 792 825 648 1027 909 838 996 1 144 937
April 551 544 384 529 593 730 648 967 890 825 1 027 1 030 903
May 637 626 296 556 618 926 689 923 830 799 1 011 953 909
June 610 648 308 604 486 655 779 868 854 962 976 954 910
July 698 537 296 61 401 560 734 722 827 985 961 965 923
August 683 420 286 548 405 542 697 799 834 899 951 951 940
September 572 486 312 539 594 544 665 803 818 880 947 965 937
October 484 544 328 496 630 549 659 807 810 916 954 956 931
November 496 396 408 492 589 598 651 903 834 908 956 934 923
December 506 625 370 496 646 658 648 830 796 900 942 944 923
YEAR 583 529 375 480 603 677 676 844 847 868 968 984 924
EUROPEAN UNION
2001 2002 2003 2004 2005 2006 2007 2008 2009 2010 2011 2012 2013
( Euro tonnes )
January 590 590 590 590 610 580 600 600 570 630 610 610
February 610 590 600 610 600 590 560 610 580 640 620 620
March 630 610 640 660 600 590 620 660 600 630 630 620
April 640 620 620 630 610 580 640 660 620 620 640
May 620 590 640 640 590 590 610 630 610 610 630
June 600 590 640 680 570 580 590 630 640 600 630
July 560 560 620 610 550 570 590 600 630 590 620
August 600 540 600 610 530 550 580 590 600 570 630
September 610 570 600 630 550 570 610 570 600 580 620
October 580 580 590 620 550 580 600 570 600 590 610November 560 560 600 640 580 580 590 580 600 580 620
December 590 580 620 630 570 560 600 550 610 610 620
YEAR 599 582 613 629 576 577 599 604 605 604 623 617
USD ton 564 656 762 782 722 789 878 839 801 840 801 843
8102019 Banana Import Export Global Stats
httpslidepdfcomreaderfullbanana-import-export-global-stats 31392626
Table 7 - Import prices in selected countries monthly Tableau 7 - Prix agrave lrsquoimportation mensuels dans certains paysCuadro 7 - Precios mensuales de importacioacuten en algunos paiacuteses
HUNGARY
2001 2002 2003 2004 2005 2006 2007 2008 2009 2010 2011 2012 2013
( Forint tonnes )
January 40 000 74 000 115 000 105 000 62 000 181 000 181 000 186 000 188 000 158000 210000 197000
February 39 000 76 000 119 000 109 000 171 000 189 000 189 000 210 000 221 000 172000 213000 236000
March 39 000 83 000 122 000 105 000 179 000 185 000 178 000 226 000 268 000 195000 197000 224000
April 40 000 105 000 137 000 112 000 164 000 190 000 174 000 200 000 241 000 180000 198000 225000
May 39 000 112 000 104 000 176 000 180 000 176 000 160 000 160 000 205 000 200000 185000 211000
June 37 000 108 000 108 000 157 000 184 000 177 000 151 000 149 000 207 000 220000 157000 202000
July 47 000 76 000 105 000 137 000 136 000 129 000 138 000 142 000 186 000 174000 141000 172000
August 45 000 81 000 90 000 104 000 140 000 148 000 151 000 161 000 179 000 160000 150000 187000
September 46 000 104 000 76 000 123 000 152 000 147 000 178 000 165 000 162 000 161000 162000 207000
October 47 000 93 000 98 000 159 000 149 000 145 000 159 000 160 000 151 000 173000 167000 196000
November 61 000 86 000 88 000 242 000 164 000 175 000 160 000 164 000 154 000 176000 165000 192000
December 76 000 92 000 96 000 245 000 163 000 167 000 174 000 181 000 155 000 204000 174000 208000
YEAR 46 333 90 833 104 833 147 833 153 667 167 417 166 083 175 333 193 083 181 083 176 583 204 750
USD ton 162 352 467 729 770 796 904 1 019 954 871 878 910
THE PEOPLErsquoS REPUBLIC OF CHINA (MAILAND)2001 2002 2003 2004 2005 2006 2007 2008 2009 2010 2011 2012 2013
( USD tonnes )
January 250 227 284 295 308 317 377 412 389 491 574
February 243 212 250 297 290 312 374 407 340 428 538
March 196 197 209 274 234 312 332 274 361 403 522
April 207 212 179 267 285 331 332 312 403 428 523
May 205 191 199 274 250 332 405 377 406 437 534
June 218 188 241 271 303 336 409 399 428 484 574
July 228 191 244 267 325 339 41 411 426 526 646
August 195 173 247 240 319 325 381 379 406 528 672
September 202 244 270 276 317 326 394 432 460 534 677
October 213 233 295 290 329 342 375 408 472 501 650
November 220 251 272 292 328 353 403 424 462 541 658
December 215 266 279 296 326 371 398 281 258 577 616
YEAR 216 215 247 278 301 333 352 376 401 490 599
Source United States official dataJapan Monthly Bulletin o Banana Statistics Japan Banana Importersrsquo AssociationFrance Marcheacutes Europeacuteens des Fruits et Leacutegumes Revue drsquoInormation Economique
8102019 Banana Import Export Global Stats
httpslidepdfcomreaderfullbanana-import-export-global-stats 32392727
Table 8 - Wholesalersrsquo selling prices in selected countries monthly Tableau 8 - Prix de vente en gros mensuels dans certains paysCuadro 8 - Precios mensuales de venta al por mayor en algunos paiacuteses
JAPAN
2001 2002 2003 2004 2005 2006 2007 2008 2009 2010 2011 2012 2013
( Yen kgs )
January 81 117 107 106 103 96 120 129 160 126 121 121 139
February 98 135 133 109 115 122 142 145 157 144 129 124 150
March 101 146 130 139 132 120 157 155 151 146 140 130 161
April 123 155 133 149 123 117 167 159 162 142 148 135 172
May 128 154 144 140 119 126 163 154 165 140 145 135 169
June 103 153 131 138 122 122 145 153 160 142 140 133 161
July 112 148 128 119 115 115 135 152 149 141 133 130 153August 106 116 125 101 112 115 134 150 140 135 122 125
September 113 130 126 108 115 128 138 158 137 129 125 119
October 101 128 117 113 107 134 132 178 130 120 133 118
November 102 102 98 113 98 123 128 164 122 101 131 116
December 97 95 98 109 80 111 125 151 116 101 122 121
YEAR 105 132 123 120 112 119 141 154 146 131 132 126 158
USD kg 087 105 106 111 101 102 119 149 156 149 166 157 162
UNITED STATES
2001 2002 2003 2004 2005 2006 2007 2008 2009 2010 2011 2012 2013
( USD kgs )
January 062 064 064 060 059 069 080 075 118 092 101 095 099
February 072 060 064 064 064 101 080 099 112 099 112 117 099
March 077 066 070 055 082 102 079 136 110 101 108 141 101
April 074 067 067 058 069 090 074 133 109 101 105 121 101
May 085 068 062 059 073 104 082 128 105 099 103 106 095
June 070 072 059 066 074 088 084 106 104 106 105 097 094
July 083 065 061 056 058 065 078 096 101 118 096 096 094
August 081 061 058 048 049 061 074 093 101 099 095 096 094
September 080 061 057 047 061 067 082 094 099 088 092 105 094
October 067 056 056 048 066 069 079 096 094 099 091 104 092
November 058 054 055 046 061 065 072 093 091 094 092 099 090
December 063 061 057 055 073 072 069 093 090 096 096 097 088
YEAR 073 063 061 055 066 079 078 104 103 099 100 106 095
8102019 Banana Import Export Global Stats
httpslidepdfcomreaderfullbanana-import-export-global-stats 33392828
Table 8 - Wholesalersrsquo selling prices in selected countries monthly Tableau 8 - Prix de vente en gros mensuels dans certains paysCuadro 8 - Precios mensuales de venta al por mayor en algunos paiacuteses
FRANCE
2001 2002 2003 2004 2005 2006 2007 2008 2009 2010 2011 2012 2013
( Euro kg )
January 084 079 093 081 100 098 090 090 085 079 101 087 104
February 093 095 097 082 112 107 097 105 094 083 122 104 107
March 115 107 103 097 120 103 099 113 122 093 106 105 105
April 115 103 094 093 114 094 097 104 110 094 095 105 105
May 099 090 079 093 112 091 090 081 096 093 091 105 101
June 086 078 080 094 126 094 086 081 091 096 079 105 097
July 092 069 063 082 089 071 078 081 080 085 074 092 090August 081 073 059 074 098 068 081 085 075 080 074 091 092
September 086 080 078 077 106 073 094 084 079 081 080 100 095
October 081 068 076 075 097 074 082 079 081 074 081 102 093
November 075 062 074 085 097 086 075 077 076 079 083 095 092
December 074 082 076 105 102 090 085 081 083 092 081 095
YEAR 090 082 081 086 106 087 088 088 089 086 089 099 098
USD kg 081 077 091 107 132 109 120 130 124 114 124 127 134
EUROPEAN UNION
2001 2002 2003 2004 2005 2006 2007 2008 2009 2010 2011 2012 2013
( Euro kg )
January 094 095 089 097 101 101 102 101 094 113 101 110
February 102 099 091 107 104 104 117 106 094 122 113 108
March 112 105 096 111 102 104 128 125 106 113 117 105
April 114 105 096 111 098 103 122 124 110 111 116 107
May 106 093 093 118 095 100 103 112 111 111 113 108
June 095 091 094 125 094 098 096 112 114 100 110 110
July 078 074 084 099 080 094 094 100 104 091 101
August 088 074 075 097 078 093 093 095 097 090 102
September 093 080 078 107 081 101 091 096 099 092 109
October 084 081 079 103 079 100 095 096 094 094 108
November 077 081 083 104 083 093 096 093 096 094 105
December 085 086 098 104 089 098 097 095 104 095 103
YEAR 094 089 088 107 090 099 103 105 102 102 108 108
USD kg 088 100 109 133 113 136 151 145 135 142 139 148
8102019 Banana Import Export Global Stats
httpslidepdfcomreaderfullbanana-import-export-global-stats 34392929
Table 8 - Wholesalersrsquo selling prices in selected countries monthly Tableau 8 - Prix de vente en gros mensuels dans certains paysCuadro 8 - Precios mensuales de venta al por mayor en algunos paiacuteses
THE PEOPLErsquoS REPUBLIC OF CHINA (MAILAND)
2001 2002 2003 2004 2005 2006 2007 2008 2009 2010 2011 2012 2013
( RMB kg )
January 294 305 333 282 309 310 357 351 304 433 494 385
February 376 319 316 292 324 345 375 343 346 475 508 431
March 369 288 319 275 342 380 366 345 356 511 486 451
April 370 285 342 276 368 334 383 391 407 611 465 478
May 301 278 355 274 386 289 371 457 456 566 432 526
June 264 260 338 272 386 257 356 444 483 415 414 527July 228 249 292 265 339 228 313 408 435 336 379
August 224 249 277 265 270 239 313 383 397 344 373
September 240 273 268 315 324 276 341 356 397 401 378
October 232 270 259 314 285 304 345 329 369 443 397
November 218 290 271 306 276 294 372 300 370 495 386
December 235 311 272 304 291 314 342 288 398 497 380
YEAR 279 281 304 287 325 298 353 366 393 461 424 466
USD kg 034 034 037 035 041 039 051 054 058 071 067 077
URUGUAY
2001 2002 2003 2004 2005 2006 2007 2008 2009 2010 2011 2012 2013
( Pesos uruguayos kg )
January 947 1041 981 1134 1384 1708 1799 1792 2014 1888
February 715 861 886 1160 1309 1603 1766 1605 1803 2102
March 892 937 859 1185 1394 1634 1812 187 1777 2174
April 1064 1025 925 1393 1433 1625 1927 1809 1802 2609
May 920 825 873 1111 1285 1519 1825 169 1744 2057
June 833 843 735 1157 1225 1545 1784 1758 174 2069
July 875 888 730 1267 1588 1874 176 1752 2195
August 837 974 893 1221 1414 1659 1969 182 1814 2092
September 891 887 1041 1256 1531 1607 1928 1844 1843 1909
October 1128 843 1248 1594 1545 1795 1963 1891 1867 1992
November 1107 812 1260 1478 1647 2068 1916 1944 1837 1915
December 860 925 1232 1397 2088 2001 1750 2174 1957
YEAR 922 905 972 1279 1478 1696 1859 1830 1829 2091
USD kg 033 032 040 053 063 081 082 091 095 103
8102019 Banana Import Export Global Stats
httpslidepdfcomreaderfullbanana-import-export-global-stats 35393030
Table 8 - Wholesalersrsquo selling prices in selected countries monthly Tableau 8 - Prix de vente en gros mensuels dans certains paysCuadro 8 - Precios mensuales de venta al por mayor en algunos paiacuteses
UNITED KINGDOM2001 2002 2003 2004 2005 2006 2007 2008 2009 2010 2011 2012 2013
( pence kg )
January 370 570 570 530 630 690 610 720 700 550 950 767 787
February 600 650 600 460 790 670 610 900 730 590 1020 877 778
March 760 720 700 550 690 560 570 850 1090 730 730 975 704
April 750 670 600 530 750 550 590 760 990 770 800 803 773
May 700 630 540 540 910 640 580 680 880 830 820 779 790
June 660 530 520 610 870 660 560 600 930 940 620 772 710
July 600 430 390 530 590 490 520 630 670 790 570 734 714
August 550 490 450 460 690 500 570 660 640 750 590 699
September 590 520 490 530 770 530 650 670 660 740 650 776
October 500 480 440 460 680 530 570 580 650 600 600 655
November 480 400 430 530 680 480 520 610 550 630 590 632
December 470 540 380 650 600 540 530 620 560 690 630 651
YEAR 586 553 509 532 721 570 573 690 754 718 714 760 751
USD kg 084 083 083 097 131 105 115 127 117 111 114 120 121
BANANA ORGANIC
USA
2008 2009 2010 2 011 2012 2013
( USD kg )
January 112 138 131 127 134 136
February 112 138 127 140 138 132
March 154 138 128 142 138 125
April 160 138 127 129 141 127
May 147 138 135 141 135
June 152 138 138 140 138
July 137 138 134 138 138
August 136 134 138 138 131
September 138 125 142 136 135
October 138 129 138 135 138
November 138 134 123 136 135
December 134 131 127 134 137
YEAR 138 135 132 136 136 131
SourceUnited States USDA C amp MS Fruit and Vegetable Division Market News daily reports
Japan Monthy Bulletin o Banana Statistics Japan Banana Importersrsquo Association
8102019 Banana Import Export Global Stats
httpslidepdfcomreaderfullbanana-import-export-global-stats 36393131
Table 9 - Retail prices in selected countries monthly Tableau 9 - Prix mensuels au detail dans certains paysCuadro 9 - Precios mensuales al por menor en algunos paiacuteses
FRANCE
2001 2002 2003 2004 2005 2006 2007 2008 2009 2010 2011 2012 2013
( Euro kg )
January 150 151 162 150 163 173 160 165 160 156 170 162 175
February 157 164 167 152 178 176 163 172 164 156 185 170 182
March 169 181 171 156 182 177 166 179 175 164 188 177 181
April 185 182 174 162 185 172 168 188 190 169 180 184 184
May 180 177 162 158 193 169 168 176 179 167 178 180 181
June 171 171 162 161 203 169 165 169 174 173 173 178 184
July 174 148 151 158 187 163 163 169 168 173 167 178 184
August 162 145 144 147 165 154 157 168 158 166 160 172 180
September 161 155 143 138 172 152 163 165 155 162 157 170 176
October 158 144 143 143 169 147 166 163 157 159 158 172 175
November 151 139 140 140 168 154 160 158 154 157 162 175 175
December 145 141 147 161 174 157 163 158 153 163 161 175 176
YEAR 164 158 156 152 178 164 164 169 166 164 170 174 179
USD kg 146 149 176 189 222 205 224 248 230 217 236 224 245
HUNGARY2001 2002 2003 2004 2005 2006 2007 2008 2009 2010 2011 2012 2013
( Forint kg )
January 251 263 293 251 309 345 329 338 348 323 374 358 399
February 239 263 283 249 313 339 334 348 364 323 421 407 407
March 246 280 283 261 340 339 326 392 421 338 427 425 408
April 284 312 286 276 343 345 338 410 468 357 396 424 404
May 247 302 270 289 347 345 336 361 431 349 392 419
June 221 288 264 310 376 356 319 332 406 371 364 398
July 257 247 248 303 343 340 314 311 389 377 319 372
August 239 248 249 281 317 327 316 313 351 362 297 361
September 252 272 252 258 324 328 329 319 340 361 306 381
October 244 253 250 258 325 302 338 318 331 326 324 395
November 229 233 234 254 345 316 326 303 320 330 343 394
December 245 252 232 294 339 320 320 307 309 350 343 376
YEAR 246 268 262 274 335 334 327 338 373 347 359 393 405
USD ton 086 104 117 135 168 159 178 196 184 167 178 174 188
8102019 Banana Import Export Global Stats
httpslidepdfcomreaderfullbanana-import-export-global-stats 37393232
Table 9 - Retail prices in selected countries monthly Tableau 9 - Prix mensuels au detail dans certains paysCuadro 9 - Precios mensuales al por menor en algunos paiacuteses
UNITED STATES
2001 2002 2003 2004 2005 2006 2007 2008 2009 2010 2011 2012 2013
( USD kg )
January 108 112 116 113 107 108 111 115 139 129 131 133 134
February 116 111 112 111 111 112 112 119 141 129 138 133 135
March 114 114 113 110 112 112 112 132 140 127 137 134 134
April 112 111 113 111 111 112 114 138 139 128 137 133 132
May 112 114 111 108 110 113 111 139 137 126 136 132 133
June 112 113 115 110 109 113 113 140 139 127 135 133 133
July 113 114 113 112 109 112 112 138 136 129 135 133 133
August 108 110 113 112 107 108 112 140 135 127 134 131 131
September 108 110 109 108 107 106 111 139 133 126 134 132 132
October 109 111 108 107 108 108 112 138 132 128 134 133 129
November 106 111 110 103 106 108 114 138 124 128 132 132 129
December 107 111 111 104 106 110 116 136 126 129 132 134 131
YEAR 110 112 112 109 109 110 113 134 135 128 135 133 132
JAPAN
2001 2002 2003 2004 2005 2006 2007 2008 2009 2010 2011 2012 2013
( Yen kg )
January 218 225 235 232 243 222 236 217 224 225 221 207
February 224 239 241 249 239 230 236 226 235 228 220 201
March 237 260 243 248 242 240 238 229 238 232 225 207
April 237 257 241 257 238 251 244 226 255 229 227 211
May 262 262 242 260 245 250 240 226 252 236 218 205
June 282 258 229 262 250 253 240 231 248 227 216 200
July 278 254 229 262 252 246 229 232 240 226 220 200
August 308 246 219 261 241 229 232 232 241 222 210 202
September 295 257 229 257 240 230 232 231 239 230 215 205
October 279 259 230 259 239 235 227 228 238 219 225 194November 255 260 223 245 231 231 222 221 236 218 216 193
December 233 241 220 237 220 230 219 221 233 218 193
YEAR 259 252 232 252 240 237 233 227 240 226 219 202
USD kg 213 201 200 233 218 204 198 219 256 257 275 253
8102019 Banana Import Export Global Stats
httpslidepdfcomreaderfullbanana-import-export-global-stats 38393333
Table 9 - Retail prices in selected countries monthly Tableau 9 - Prix mensuels au detail dans certains paysCuadro 9 - Precios mensuales al por menor en algunos paiacuteses
THE PEOPLErsquoS REPUBLIC OF CHINA (MAILAND)
2001 2002 2003 2004 2005 2006 2007 2008 2009 2010 2011 2012 2013
( RMB kg )
January 325 350 385 335 345 365 415 410 365 495 55
February 410 375 395 350 365 395 435 415 420 545 595
March 420 335 365 345 385 425 450 425 435 58 58
April 435 340 375 350 410 435 460 465 490 67 54
May 395 365 385 365 425 325 455 510 530 63 53
June 320 380 365 370 430 290 425 490 565 5 51
July 295 305 365 360 370 260 400 485 587 46 48
August 285 315 345 365 325 280 410 465 490 45 45
September 290 335 350 385 390 285 425 430 510 49 485
October 310 355 368 390 335 360 438 425 480 53 52
November 305 376 370 375 315 340 465 390 450 575 49
December 310 395 375 380 320 375 350 385 470 59 495
YEAR 342 352 370 364 368 345 427 441 483 543 519
USD kg 041 043 045 044 046 045 061 065 071 084 082
8102019 Banana Import Export Global Stats
httpslidepdfcomreaderfullbanana-import-export-global-stats 3939
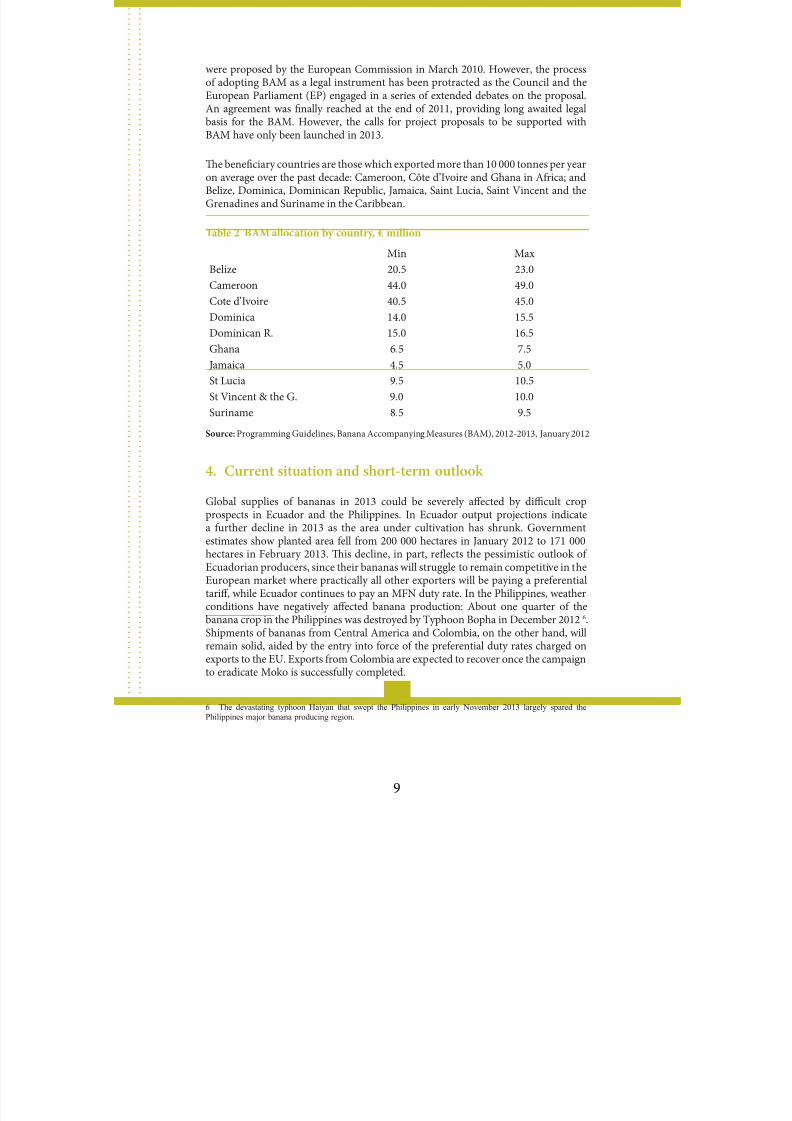
8102019 Banana Import Export Global Stats
httpslidepdfcomreaderfullbanana-import-export-global-stats 14399
were proposed by the European Commission in March 2010 However the processo adopting BAM as a legal instrument has been protracted as the Council and theEuropean Parliament (EP) engaged in a series o extended debates on the proposalAn agreement was finally reached at the end o 2011 providing long awaited legalbasis or the BAM However the calls or project proposals to be supported with
BAM have only been launched in 2013
Te beneficiary countries are those which exported more than 10 000 tonnes per yearon average over the past decade Cameroon Cocircte drsquoIvoire and Ghana in Arica andBelize Dominica Dominican Republic Jamaica Saint Lucia Saint Vincent and theGrenadines and Suriname in the Caribbean
Table 2 BAM allocation by country euro million
Min Max
Belize 205 230
Cameroon 440 490
Cote drsquoIvoire 405 450
Dominica 140 155
Dominican R 150 165
Ghana 65 75
Jamaica 45 50
St Lucia 95 105
St Vincent amp the G 90 100
Suriname 85 95
Source Programming Guidelines Banana Accompanying Measures (BAM) 2012-2013 January 2012
4 Current situation and short-term outlook
Global supplies o bananas in 2013 could be severely affected by difficult cropprospects in Ecuador and the Philippines In Ecuador output projections indicatea urther decline in 2013 as the area under cultivation has shrunk Governmentestimates show planted area ell rom 200 000 hectares in January 2012 to 171 000hectares in February 2013 Tis decline in part reflects the pessimistic outlook o
Ecuadorian producers since their bananas will struggle to remain competitive in theEuropean market where practically all other exporters will be paying a preerentialtariff while Ecuador continues to pay an MFN duty rate In the Philippines weatherconditions have negatively affected banana production About one quarter o thebanana crop in the Philippines was destroyed by yphoon Bopha in December 2012 6Shipments o bananas rom Central America and Colombia on the other hand willremain solid aided by the entry into orce o the preerential duty rates charged onexports to the EU Exports rom Colombia are expected to recover once the campaignto eradicate Moko is successully completed
6 The devastating typhoon Haiyan that swept the Philippines in early November 2013 largely spared thePhilippines major banana producing region
8102019 Banana Import Export Global Stats
httpslidepdfcomreaderfullbanana-import-export-global-stats 153910
Te demand or bananas in both the EU and Russia seem to recover in 2013 as importsare showing promising signs During the first 9 months o 2013 import quantities inthe EU and Russia increased by 56 and 57 percent relative to the same period in2012 respectively 7 US imports are also likely to grow in 2013 as monthly importshave been consistently above those o 2012 in both value and volume Overall during
the first three quarters o 2013 the volume o US imports increased 46 percent
In 2013 the import prices in the US seemed to have stabilized at a somewhat lowerlevel compared to the record prices in 2012 Te average US import price during thefirst 6 months o 2013 stood at USD 923tonne or 74 percent lower than during thesame period in 2012 Tis is still well above the average import prices prevalent inthe EU although some countries like France are showing a tendency towards higherprices in 2013 Overall prices in the EU are expected to remain firm and close to the2012 level
Te ACP countries will continue to enjoy preerential access to the EU market
although the preerential margin vis-agrave-vis the major exporters such as Colombiaand Costa Rica will be shrinking over time as the ree trade agreements with thesecountries enter into orce Unless Ecuador enters into new negotiations with theEU it will continue paying higher tariffs than its major competitors underminingEcuadorrsquos export opportunities While the gap between the MFN tariff and thepreerential tariff o Colombia or example was not that high in 2013 (132 eurostonne versus 124 eurostonne) the difference will increase substantially by 2020unless a new reduction on the MFN tariff is achieved as part o multilateral tradetalks on agriculture At current import prices in the EU by 2020 Ecuador wouldbe paying 18 percent in ad-valorem tariff equivalent while the preerential rate orColombia Peru and Central America would be 12 percent
7 Based on GTA data
8102019 Banana Import Export Global Stats
httpslidepdfcomreaderfullbanana-import-export-global-stats 1639
STATISTICAL TABLES
8102019 Banana Import Export Global Stats
httpslidepdfcomreaderfullbanana-import-export-global-stats 17391212
Table 1 - World gross exports by country Tableau 1 - Exportations brutes mondiales par paysCuadro 1 - Exportaciones brutas mundiales por paiacutes
2000 2001 2002 2003 2004 2005 2006 2007 2008 2009 2010 2011 2012
(prel)
( thousand tonnes milliers de tonnes miles de toneladas )
Latin America amp Caribbean 9 7239 9 4433 9 9331 10 4715 10 4367 10 6201 11 2608 12 1333 11 9550 12 3458 11 7717 12 5270 13 0280
Central and South America 9 4791 9 1823 9 6743 10 2260 10 2225 10 3715 10 9502 11 8437 11 6878 11 9762 11 3922 12 2020 12 7054
Belize 658 501 430 749 805 763 730 611 827 818 792 837 993
Bolivia 94 129 165 284 427 536 762 795 858 894 884 983 727
Brazil 718 1051 2410 2208 1881 2122 1943 1857 1309 1439 1395 1101 957
Colombia 1 6802 1 5163 1 5704 1 4232 1 4709 1 6215 1 6974 1 7492 1 7983 2 1018 1 8026 1 9153 1 8349
Costa Rica 1 8833 1 7393 1 6226 1 9013 1 7925 1 6145 1 9611 2 1592 1 8726 1 5875 1 8209 1 9022 2 0286
Ecuador 3 9395 3 9904 4 1992 4 6712 4 5370 4 6539 4 7978 5 0571 5 1328 5 4731 4 9450 5 3919 4 9821
Guatemala 8013 8738 9717 9333 1 0138 1 0463 9826 1 3304 1 3547 1 4064 1 3691 1 5588 1 9208
Honduras 3753 4318 4414 4434 5277 5011 5162 5701 6057 5197 5124 5166 9014
Mexico 455 374 358 399 416 702 666 416 749 1401 1741 1776 3075
Nicaragua 455 441 408 409 449 455 377 389 378 347 200 82 93
Panama 4893 3211 4185 4102 3980 3483 4311 4386 3666 2572 2724 2669 2450
Peru 09 80 191 181 273 429 571 655 782 833 894 1088 1238
Suriname 354 287 280 01 214 396 474 562 654 570 791 629 831
Venezuela 361 233 265 203 360 456 117 106 14 01 01 08 12
Caribbean 2448 2609 2589 2455 2142 2487 3105 2896 2673 3696 3795 3250 3226 Dominican Republic 802 1302 1147 1267 1020 1671 2056 2120 1919 2818 3404 3038 2972
Jamaica 420 431 399 418 287 116 319 174 00 00 00 00 00
Others 1226 877 1042 771 835 700 731 602 754 877 391 212 254
Asia 17038 16896 17853 19443 19047 21693 24103 23121 23057 18574 17649 22174 28179
China 502 392 397 530 416 388 228 209 151 132 86 102 79
Malaysia 311 302 279 246 211 338 268 271 301 200 214 229 183
Pakistan 21 14 37 72 60 85 109 79 130 867 577 588 588
Philippines 1 5994 1 6007 1 6850 1 8294 1 7973 2 0243 2 3115 2 2177 2 1926 1 6641 1 5901 2 0555 2 6461
Tailand 58 55 52 63 177 418 203 214 228 256 228 252 276
Vietnam 45 42 146 126 72 39 21 16 26 17 35 32 32 Others 107 84 92 111 138 181 159 154 296 462 608 417 560
India 86 81 87 109 126 144 115 130 276 458 608 399 545
Africa 4941 4889 5329 5651 5568 5045 6057 5801 6114 5682 6435 6337 6488
Cameroon 2382 2541 2588 3137 2949 2655 2566 2323 2687 2555 2328 2490 2465
Cocircte drsquoIvoire 2173 2244 2560 2424 2524 2344 2864 2908 2643 2570 3356 3201 3394
Ethiopia 05 03 09 13 29 00 05 26 20 28 36 41 41
Others 93 48 107 77 65 46 621 544 764 528 714 606 588
Ghana 39 33 30 13 19 19 575 521 698 476 675 579 561
Oceania 03 01 01 01 01 01 01 01 01 01 01 01 01
WORLD 11 9221 11 6218 12 2514 12 9810 12 8982 13 2940 14 2768 15 0255 14 8723 14 7714 14 1802 15 3783 16 4948
8102019 Banana Import Export Global Stats
httpslidepdfcomreaderfullbanana-import-export-global-stats 18391313
Table 2 - World net imports by country Tableau 2 - Importations nettes mondiales par paysCuadro 2 - Importaciones netas mundiales por paiacutes
2000 2001 2002 2003 2004 2005 2006 2007 2008 2009 2010 2011 2012
(prel)
( thousand tonnes milliers de tonnes miles de toneladas )
DEVELOPING COUNTRIES 2 2705 1 9519 1 9760 2 3592 2 5037 2 7438 2 9908 3 0399 3 3967 3 3997 3 8240 4 1996 3 7561
Latin America amp Caribbean 6360 6031 5006 5591 5626 6007 5629 5986 6226 6143 6412 6814 6678
Argentina 3400 3301 2295 2864 3033 3022 2957 3189 3468 3441 3511 3949 3766
Chile 1926 1475 1491 1578 1597 1953 1689 1782 1750 1793 1757 1844 1906
El Salvador 590 612 614 566 515 531 491 538 527 435 487 448 498
Uruguay 330 489 438 411 437 476 451 422 431 416 506 515 447
Others 115 154 167 171 43 25 41 54 50 58 152 59 62
Asia 1 5762 1 1937 1 2007 1 5193 1 6148 1 9356 2 2266 2 1834 2 5295 2 5112 2 8624 3 1575 2 7362
China 6423 4676 4013 4811 4373 4142 4467 3873 4210 5536 7408 9095 7158
Iran 2000 756 1507 2710 2709 4509 3728 4477 7516 7128 6395 5909 3555
Jordan 53 29 22 15 21 63 93 202 330 256 396 483 498
Korea Rep 1842 1945 1872 2200 2083 2533 2797 3077 2581 2570 3379 3527 3680 Kuwait 233 238 255 261 302 305 676 889 961 929 911 1305 1398
Saudi Arabia 1869 1810 1765 1994 2115 2332 2351 2481 2567 2524 3074 3062 3062
Singapore 423 398 376 352 350 357 365 371 384 397 393 416 446
Syria 687 530 478 704 939 1116 3227 1927 2196 1837 2323 2722 2934
urkey 1242 416 646 919 1102 1510 1686 2243 2191 1824 2007 2346 2251
United Arab Emirates 685 796 683 707 1576 1748 2105 1229 1267 845 933 1287 1297
Others 305 343 391 520 578 742 771 1066 1094 1265 1403 1423 1084
Africa 582 1551 2748 2808 3263 2074 2013 2580 2446 2741 3203 3607 3521
Algeria 00 854 2315 2233 2046 1571 1472 1626 1639 1796 2079 2453 2310
Egypt 53 59 26 12 11 28 61 47 30 25 101 256 284
Morocco 00 28 14 11 22 49 54 172 187 267 281 246 282
Senegal 71 105 121 123 141 150 157 166 169 168 165 143 156
unisia 155 110 163 138 543 208 203 410 335 371 187 413 413
Others 303 394 109 291 500 68 67 158 86 115 391 95 76
DEVELOPED COUNTRIES 9 8804 9 6173 9 8594 10 1348 10 2763 10 3758 10 8862 11 4379 11 7050 11 0187 11 5162 12 3829 12 4955
EC ( 27 ) 3 8901 3 7718 3 8868 4 0230 4 0010 3 9230 4 3653 4 6824 4 8773 4 5370 4 5087 4 6030 4 4876
Other Europe 8126 9415 1 0599 1 1827 1 3155 1 4812 1 5319 1 6675 1 7004 1 5876 1 6729 1 9533 1 9018
Albania 178 85 187 227 172 168 168 202 174 172 175 174 174
Belarus 311 173 161 209 235 287 294 332 417 367 445 401 594
Bosnia Herzgovina 05 06 03 414 462 449 378 383 408 371 370 380 380
Croatia 419 432 451 506 508 540 515 548 570 521 494 487 463
Iceland 35 37 40 41 46 47 54 55 56 57 57 59 61
Macedonia Former YR 51 20 78 153 208 176 151 161 154 167 181 191 191
Moldova Rep 16 17 15 31 49 70 77 112 129 117 105 122 112 Norway 599 609 598 634 662 732 746 785 835 812 785 782 769
Russian Fed 4995 6067 6408 7870 8427 8528 8835 9597 9885 9694 1 0686 1 3076 1 2536
Serbia Montenegro 198 679 1134 151 975 578
Serbia 558 657 689 431 419 515 454
Montenegro 83 85 84 85 66 74 74
Switzerland 723 734 743 722 735 742 741 782 821 808 799 794 786
Ukraine 595 555 791 870 676 2494 2720 2975 2781 2273 2148 2478 2426
North America 4 0289 3 8387 3 9072 3 8738 3 8649 3 8223 3 8516 4 0151 3 9309 3 5429 4 1075 4 6293 4 8768
Canada 3984 4049 4170 4228 4406 4490 4567 4718 4776 4819 4961 5066 5270
United States 3 6304 3 4338 3 4902 3 4511 3 4242 3 3733 3 3950 3 5433 3 4534 3 0610 3 6114 4 1227 4 3497
Others 1 1488 1 0653 1 0054 1 0552 1 0949 1 1493 1 1374 1 0730 1 1963 1 3512 1 2271 1 1973 1 2294
Japan 1 0787 9906 9363 9866 1 0260 1 0669 1 0436 9706 1 0927 1 2526 1 1091 1 0641 1 0864 New Zealand 676 722 673 672 661 775 809 805 800 763 813 809 807
South Arica 26 26 18 14 28 50 129 219 236 222 367 523 623
WORLD 12 1508 11 5692 11 8354 12 4940 12 7800 13 1196 13 8770 14 4778 15 1017 14 4183 15 3401 16 5824 16 2516
8102019 Banana Import Export Global Stats
httpslidepdfcomreaderfullbanana-import-export-global-stats 19391414
Table 3 - EC Total supply of bananas and per capita supply Tableau 3 - CE Offre totale de banane et offre par habitantCuadro 3 - CE Oferta total de banano y oferta por habitante
2000 2001 2002 2003 2004 2005 2006 2007 2008 2009 2010 2011 2012
( thousand tons milliers de tonnes miles de toneladas )
France 3589 3228 3589 3292 3053 2805 2686 1673 1716 2358 2420 2425 2517
Guadeloupe 876 890 951 855 591 542 478 380 467 556 426 615 669
Martinique 2713 2337 2639 2437 2462 2262 2208 293 1249 1802 1994 1810 1848
Spain 3976 4209 4073 4009 4184 3450 3482 3614 3713 3520 3970 3465 3710
Greece 33 29 24 27 29 29 29 29 27 26 19 20 22
Cyprus 85 98 105 112 105 58 65 60 42 32 50 56 57
Portugal 225 207 219 214 212 142 153 172 178 145 137 153 177
Production 7907 7771 8011 7654 7582 6484 6416 5547 5676 6080 6595 6118 6485
Net Imports
EC (27) 3 8901 3 7718 3 8868 4 0310 4 0125 3 9230 4 3676 4 6824 4 8738 4 5372 4 5086 4 6030 4 4899
Supply 4 6807 4 5489 4 6880 4 7965 4 7707 4 5714 5 0092 5 2371 5 4414 5 1453 5 1682 5 2149 5 1383
Per capita supply 1231 1191 968 986 977 931 1016 1058 1095 1031 1032 1038 1021
Source EC Commission
8102019 Banana Import Export Global Stats
httpslidepdfcomreaderfullbanana-import-export-global-stats 20391515
Table 4 - Per capita net imports by country Tableau 4 - Importations nettes par habitant par paysCuadro 4 - Importaciones netas por habitante por paiacutes
2000 2001 2002 2003 2004 2005 2006 2007 2008 2009 2010 2011 2012
(prel)
( kg per capita kg par habitant kg por habitante )
DEVELOPING COUNTRIES 127 108 108 128 135 147 158 160 177 175 196 213 185
Latin America amp Caribbean 932 875 719 796 793 839 779 821 847 828 856 902 876
Argentina 921 885 610 754 791 781 758 810 873 859 869 969 916
Chile 1249 945 945 989 990 1198 1026 1071 1042 1058 1027 1068 1094
El Salvador 994 1026 1026 942 854 878 808 882 860 705 786 719 795
Uruguay 994 1472 1317 1237 1316 1432 1356 1266 1288 1240 1501 1523 1319
Others 174 228 243 246 061 035 055 073 066 076 195 074 077
Asia 100 075 075 094 099 118 135 131 151 148 168 184 154
China 051 037 032 038 034 032 034 030 032 042 056 068 052
Iran 306 114 224 398 393 647 528 627 1040 975 865 790 470
Jordan 109 059 044 029 040 118 169 356 564 426 641 762 771
Korea Rep 401 421 403 472 445 538 592 648 541 536 701 729 757 Kuwait 1203 1183 1231 1227 1378 1345 2877 3630 3771 3511 3328 4631 4834
Saudi Arabia 933 875 822 893 911 970 948 973 981 941 1120 1090 1067
Singapore 1078 999 931 861 841 838 828 809 804 802 774 802 848
Syria 430 322 282 403 522 604 1706 997 1115 916 1138 1311 1389
urkey 195 064 099 139 164 222 244 320 309 254 276 319 302
United Arab Emirates 2258 2529 2099 2078 4309 4295 4514 2273 2041 1218 1242 1631 1600
Others 031 034 038 051 056 070 072 097 098 111 121 120 090
Africa 039 103 180 181 207 129 124 156 146 161 185 205 197
Algeria 000 276 736 700 632 478 441 480 476 514 586 682 633
Egypt 008 009 004 002 002 004 008 006 004 003 013 031 034
Morocco 000 010 005 004 007 016 017 056 060 084 088 076 086
Senegal 075 108 120 120 133 138 141 145 144 138 133 112 119
unisia 164 116 169 142 553 210 202 405 327 358 178 390 386
Others 1726 2207 601 1590 2699 360 352 821 439 579 1947 470 368
DEVELOPED COUNTRIES 813 789 805 825 833 837 875 916 933 875 911 976 981
EC ( 27 ) 808 781 802 826 818 799 885 946 981 909 901 917 891
Other Europe 331 385 435 488 545 616 639 696 711 665 702 821 800
Albania 581 275 605 731 549 535 533 636 547 540 547 541 539
Belarus 309 173 161 210 238 292 301 341 431 381 463 419 623
Bosnia Herzgovina 014 016 007 1093 1223 1188 999 1014 1081 986 983 1013 1015
Croatia 929 964 1009 1135 1142 1215 1161 1237 1291 1182 1121 1107 1055
Iceland 1246 1286 1401 1414 1573 1591 1778 1803 1785 1818 1797 1818 1855
Macedonia Former YR 254 101 383 755 1021 863 738 786 751 812 878 925 923
Moldova Rep 040 042 037 079 128 185 207 306 354 326 295 344 318
Norway 1334 1350 1319 1390 1444 1584 1599 1662 1748 1681 1607 1588 1550
Russian Fed 340 415 440 543 584 593 616 670 690 678 747 915 878
Serbia Montenegro 184 634 1066 143 926 552
Serbia 568 668 700 437 425 522 461
Montenegro 1318 1356 1338 1343 1040 1172 1170
Switzerland 1009 1019 1024 988 999 1001 992 1040 1085 1060 1042 1031 1016
Ukraine 122 115 165 183 143 532 584 643 605 497 473 548 540
North America 1287 1213 1222 1200 1186 1161 1159 1198 1162 1038 1193 1332 1392
Canada 1299 1308 1333 1338 1379 1391 1400 1431 1433 1431 1458 1475 1520
United States 1285 1203 1210 1185 1164 1136 1133 1172 1132 995 1164 1317 1377
Others 659 608 571 597 616 645 635 597 664 748 678 660 677
Japan 858 787 743 782 812 844 825 767 864 990 876 841 859
New Zealand 1753 1847 1700 1670 1619 1874 1932 1901 1869 1766 1862 1832 1809
South Arica 006 006 004 003 006 010 027 045 048 045 073 104 123
WORLD 404 382 388 407 413 422 443 459 475 451 477 512 492
8102019 Banana Import Export Global Stats
httpslidepdfcomreaderfullbanana-import-export-global-stats 21391616
Table 5 - Exports by countries of destination 1
Tableau 5 - Exportations par pays de destination 1
Cuadro 5 - Exportaciones por paiacuteses de destino 1
2002 2003 2004 2005 2006 2007 2008 2009 2010 2011 2012
(prel)
( thousand tonnes milliers de tonnes miles de toneladas )
BELIZE
O
United Kingdom 430 749 805 763 730 609 821 798 788 711 990
Others 06 20 04 126 03
TOTAL 430 749 805 763 730 611 827 818 792 837 993
BRAZIL
O
Argentina 1631 1297 914 979 561 583 339 522 385 231 354
Italy 208 234 171 191 128 86 70
Uruguay 395 401 423 478 429 393 388 364 372 338 350
United Kingdom 301 259 306 361 546 400 165 190 120 140 147
Others 84 251 30 69 236 290 290 276 448 392 107
TOTAL 2410 2208 1881 2121 1943 1857 1309 1439 1395 1101 957
COLOMBIA
O
Belgium-Lux 5669 4763 5707 6246 6048 5023 6122 5194 4162 5093 5397
United States 5682 4869 4634 5259 4802 4767 4884 6765 5478 4767 3173
UK 264 2563 2740 4468
Italy 1226 1193 1120 1006 721 991 1147 1801 2122 2236 2425
Russian Federation 147 177 501 311 184 215 52 04 35 China 191 - - - - - -
Saudi Arabia 05 66 27 - - - -
Germany 2064 1929 1351 1615 2086 3698 2882 2909 2181 3560 1532
Others 720 1235 1369 1778 3133 2798 2948 4032 1516 723 1355
TOTAL 1 5704 1 4232 1 4709 1 6215 1 6974 1 7492 1 7983 2 1018 1 8026 1 9153 1 8349
COSTA RICA
O
North America 8093 9276 8548 7911 9505 1 0382 8557 6569 8553 8832 8723
Europe 8133 9733 9376 8073 9462 9541 9112 8135 8654 8553 9960
Russian Federation 154 693 303 439 438 1546
Others 00 04 01 161 490 1670 364 868 563 1199 57TOTAL 1 6226 1 9013 1 7925 1 6145 1 9611 2 1592 1 8726 1 5875 1 8209 1 9022 2 0286
COcircTE DrsquoIVOIRE
O
France 1740 1288 1201 1432 1238 998 813 1333 871 494 707
UK 64 198 228 306 420 402 418 510 887 892 921
Germany 01 - 168 207 194
Italy 09 - 03 - 03
Belgium - Luxembourg 917 422 950 1218 1077 375 857 1130 1029
Senegal 140 131 144 149 200 213 214 179 239 167 210
Others 616 805 34 35 55 78 110 173 331 311 331
TOTAL 2560 2422 2524 2344 2864 2908 2643 2570 3356 3201 3394
8102019 Banana Import Export Global Stats
httpslidepdfcomreaderfullbanana-import-export-global-stats 22391717
Table 5 - Exports by countries of destination 1
Tableau 5 - Exportations par pays de destination 1
Cuadro 5 - Exportaciones por paiacuteses de destino 1
2002 2003 2004 2005 2006 2007 2008 2009 2010 2011 2012
(prel)
( thousand tonnes milliers de tonnes miles de toneladas )
DOMINICA
O
United Kingdom 164 134 133 118 118 72 105 364 39 41 23
Others 10 - 00 28 23 23 24 17 01 00 00 00
TOTAL 175 134 161 141 141 96 122 365 39 41 23
DOMINICAN REPUBLIC
O
Belgium-Lux 290 472 215 213 262 298 376 619 731 490 591
Italy 79 53 62 71 107 57 14 04 03 60 21United Kingdom 562 604 627 1271 1274 1585 1316 1669 2051 1 803 1 773
United States 34 26 41 33 72 17 04 20 02 05 09
Others 182 112 75 84 341 163 209 507 618 680 579
TOTAL 1147 1267 1020 1671 2056 2120 1919 2818 3404 3038 2972
ECUADOR
O
United States 1 1284 9382 9246 9562 9425 7297 8805 1 1445 1 0001 8942 7256
Italy 9337 1 1752 1 1745 1 1317 9455 9163 9439 1 0043 8401 7337 5906
Germany 5018 5232 4691 5200 4247 3202 5324 5250 4473 5740 4132
Belgium-Lux 2036 2140 2205 1686 2004 2633 3904 3189 3472 3187 2852
Russian Federation 8742 9766 1 0310 1 1439 9893 9103 1 3947 1 3151 1 0624 1 2140 1 1401Argentina 394 1095 1419 1227 1053 1120 2156 1955 1813 326 421
Chile 1678 2195 1847 1840 1893 1421 1857 1977 2076 3992 3955
Japan 1708 1552 1330 982 923 446 532 664 447 354 357
New Zealand 619 397 418 384 310 239 303 322 313 235 225
Poland 410 48 - 67 - 42 225 172 266 207
China 168 108 39 04 45 10 19 102 451
Iran - - - 39 - - - 10 21 24
Others 597 3201 2004 2823 8706 1 5943 4217 3088 1 2900 6805 1 6756
TOTAL 4 1992 4 6712 4 5370 4 6539 4 7978 5 0571 5 1328 5 4731 4 9450 5 3919 4 9821
GRENADA
OUnited Kingdom 06 04 04 03 02 05
TOTAL 06 04 04 - 03 02 05
GUATEMALA
O
United States 8259 9251 8617 8894 9216 6001 1 2215 1 3638 1 2652 1 3384 1 5841
United Kingdom - - - 04 10 10 51 15 11 16 28
Italy - - - 03 46 04 - 01 23 416 152
El Salvador 31 28 315 493 416 213 952 243 875 733 825
Others 1427 54 1206 1070 138 7076 329 167 130 1039 2362
TOTAL 9717 9333 1 0138 1 0463 9826 1 3304 1 3547 1 4064 1 3691 1 5588 1 9208
8102019 Banana Import Export Global Stats
httpslidepdfcomreaderfullbanana-import-export-global-stats 23391818
Table 5 - Exports by countries of destination 1
Tableau 5 - Exportations par pays de destination 1
Cuadro 5 - Exportaciones por paiacuteses de destino 1
2002 2003 2004 2005 2006 2007 2008 2009 2010 2011 2012
(prel)
( thousand tonnes milliers de tonnes miles de toneladas )
HONDURAS
O
United States 3913 3915 4984 4535 4569 4586 5656 4829 4560 4598 8022
Belgium-Lux 155 84 183 226 212 215 122 73 154 155 270
Germany
Italy 09
United Kingdom 13 46 07 26 26 45
Others 324 436 110 250 381 900 233 288 384 387 676
TOTAL 4414 4434 5277 5011 5162 5701 6057 5197 5124 5166 9014
JAMAICA
O
United Kingdom 399 418 287 116 319 174 00 00 00 00 00
Others 00 - 00 00 00 00 00 00 00 00 00 00
TOTAL 399 418 287 116 319 174 00 00 00 00 00
MEXICO
O
United States 334 277 363 379 429 367 593 1238 1552 1635 2499
Japan 54 47 37 30 29
Spain 01 56 64 70 54
Russian Fed 01 23 09 01 01Others 24 122 53 323 237 49 100 36 78 40 492
TOTAL 358 399 416 702 666 416 749 1401 1741 1776 3075
PANAMA
O
Germany 162 131 166 22 118 01 46 - 28 05 29
United States - - 06 59 175 136 266 47 281 340 150
Belgium-Lux 1201 888 739 578 765 716 91 30 78 00 00
Portugal 1056 1031 817 430 415 438 101 65 113 196 160
Sweden 1743 1785 2093 1922 2129 2331 2315 1385 1855 1530 1391
Italy - - 66 116 160 88 490 57 49 179 123
Others 22 267 93 356 549 676 358 989 320 419 596TOTAL 4185 4102 3980 3483 4311 4386 3666 2572 2724 2669 2450
PHILIPPINES
O
Japan 8477 8840 9152 9182 9095 9142 1 1065 9138 7921 8922 1 0848
Iran 93 304 1699 2234 3727 4287 4013 2506 2196 1497 990
Saudi Arabia 507 01 102 187 65 217 120 95 78 1161
China 3788 4156 3309 3512 3815 2034 1815 983 1658 4034 4220
China Hong Kong SAR 04 243 201 199 152 190 383 223 75 198 903
Korea Rep o 1519 1588 1386 2341 2649 2756 1866 1321 1133 1979 2655
United Arab Emirates 2092 2002 1576 1799 2075 1672 711 572 789 1016 2628
Others 370 1161 650 874 1415 2031 1857 1778 2034 2831 3056
TOTAL 1 6850 1 8294 1 7973 2 0243 2 3115 2 2177 2 1926 1 6641 1 5901 2 0555 2 6461
8102019 Banana Import Export Global Stats
httpslidepdfcomreaderfullbanana-import-export-global-stats 24391919
Table 5 - Exports by countries of destination 1
Tableau 5 - Exportations par pays de destination 1
Cuadro 5 - Exportaciones por paiacuteses de destino 1
2002 2003 2004 2005 2006 2007 2008 2009 2010 2011 2012
(prel)
( thousand tonnes milliers de tonnes miles de toneladas )
PERU
O
United States 112 135 122 231 264 179 239 198 198 235 278
Belgium 39 22 61 92 100 48 72 38 71 55 72
Netherlands 03 02 47 59 115 277 320 432 457 609 659
Germany 33 - 04 04 44 67 57 34 59 32 55
Japan 01 34 42 44 79 73 101 79 88 118
Others 04 20 04 01 04 05 22 30 30 69 57
TOTAL 191 181 273 429 571 655 782 833 894 1088 1238
SAINT LUCIA
O
United Kingdom 493 348 417 300 341 239 393 332 232 61 120
Others 00 00 14 07 08 17 19 00 00 01 01
TOTAL 493 348 431 307 349 256 412 332 232 62 121
STVINCENT amp GRENADINES
O
United Kingdom 344 285 240 204 180 182 114 75 41 08 07
Others 25 00 00 48 58 66 100 106 81 102 103
TOTAL 369 285 240 252 238 248 214 181 121 110 110
SURINAME
O
United Kingdom 280 - 47 98 11
France 62 257 454 562 654 570
Others 00 104 40 09 - 00 - 00 00 791 629 831
TOTAL 280 01 214 396 474 562 654 570 791 629 831
1 As declared by exporting countries1 Comme declareacute par les pays exportateurs1 De acuerdo a lo declarado por los paiacuteses exportadores
8102019 Banana Import Export Global Stats
httpslidepdfcomreaderfullbanana-import-export-global-stats 25392020
Table 6 - Gross Imports by countries of origin 1
Tableau 6 - Importations brutes par pays drsquoorigine 1
Cuadro 6 - Importaciones brutas por paiacuteses de origen 1
2002 2003 2004 2005 2006 2007 2008 2009 2010 2011 2012
(prel)
( thousand tonnes milliers de tonnes miles de toneladas )
ARGENTINA
FROM
Ecuador 471 1168 1600 1415 1658 1840 2149 1973 2127 2397 2245
Brazil 1648 1293 903 981 561 583 338 523 386 232 394
Bolivia 146 249 407 557 641 647 706 780 753 994 873
Others 31 153 123 70 97 119 275 165 245 326 254
TOTAL 2295 2864 3033 3022 2957 3189 3468 3441 3511 3949 3766
CANADAFROM
Costa Rica 881 1196 1061 927 881 1253 1154 710 1058 1178 1159
Ecuador 1282 1048 821 780 942 1003 1210 1642 1472 1104 1392
Colombia 1202 1149 1297 1637 1741 1379 1218 1289 1145 963 1298
Honduras 310 287 353 206 101 235 292 175 295 274 275
Mexico 111 102 47 10 20 15 28 16 14 20 20
Guatemala 310 429 782 855 794 754 814 931 897 1475 1055
Panama 01 00 - 19 53 39 29 25 37 10 30
Dominican Rep 02 01 07 01 06 04 01 02 01 01 02
Others 75 17 56 55 42 36 31 31 41 41 39TOTAL 4174 4228 4423 4490 4580 4718 4776 4820 4961 5066 5270
CHILE
FROM
Ecuador 1472 1569 1585 1670 1630 1698 1659 1730 1738 1766 1825
Others 19 20 18 283 59 84 91 63 19 78 81
TOTAL 1491 1589 1602 1953 1689 1782 1750 1793 1757 1844 1906
CHINA
FROM
Philippines 2665 3111 2858 3038 3434 3038 3178 3521 4367 6939 4964
Ecuador 284 285 241 154 42 30 70 22 89 477
Tailand 06 18 57 96 138 152 176 104 163 225
Myanmar 01 01 44 943 1770 549 445
Vietnam 424 798 652 268 292 100 217 192 315 393 93
Others 98 00 01 00 152 02 03 11 74 55 142
TOTAL 3478 4212 3809 3557 3878 3319 3623 4913 6652 8187 6346
8102019 Banana Import Export Global Stats
httpslidepdfcomreaderfullbanana-import-export-global-stats 26392121
Table 6 - Gross Imports by countries of origin 1
Tableau 6 - Importations brutes par pays drsquoorigine 1
Cuadro 6 - Importaciones brutas por paiacuteses de origen 1
2002 2003 2004 2005 2006 2007 2008 2009 2010 2011 2012
(prel)
( thousand tonnes milliers de tonnes miles de toneladas )
EC (27) 2
FROM
Ecuador 1 1570 1 1488 1 1208 1 2392 1 1993 1 1858 1 3306 1 3431 1 2242 1 3412 1 3074
Colombia 7680 7992 7665 8824 9514 1 1561 1 2782 1 2408 1 1610 1 1366 1 1344
Costa Rica 7463 8020 8564 6345 8340 9714 8951 7572 7765 8450 7702
Panama 3962 3815 3708 2816 3130 3541 2946 1851 1844 1597 1436
Cote drsquoIvoire 2167 2074 2108 1838 2218 1894 2166 2292 2443 2241 2249
Cameroon 2365 2985 2612 2529 2527 2218 2795 2497 2430 2352 2139
Dominican Rep 973 1119 1013 1447 1768 2064 1705 2283 3037 3269 2946
Peru 68 57 96 115 227 336 389 441 516 658 814
Belize 387 738 803 742 732 624 821 798 788 711 993
Ghana 33 09 18 42 223 341 460 365 524 472 507
Saint Lucia 493 325 429 282 367 305 385 333 232 62 121
Jamaica 406 418 287 117 319 184 - - - -
Honduras 345 252 212 231 218 316 240 85 152 175 57
Saint Vincent amp the Grenadines 325 209 240 159 172 138 90 75 41 08 07
Guatemala 10 69 22 30 307 188 143 49 33 30 46
Dominica 175 105 122 128 133 73 103 369 37 41 23
Others 569 682 1007 1244 1549 1563 1593 611 1469 1272 1483
TOTAL 3 8991 4 0358 4 0112 3 9281 4 3737 4 6917 4 8873 4 5459 4 5161 4 6114 4 49412 Source European Community
JAPAN
FROM
Philippines 7435 7956 8696 9445 9106 8790 1 0193 1 1591 1 0355 1 0044 1 0267
Ecuador 1570 1456 1227 911 1013 521 462 618 461 343 359
China 251 335 182 151 159 189 90 88 95 84 84
Indonesia - - - - - - - - - - -
Others 106 120 154 162 158 207 182 229 180 170 154
TOTAL 9363 9866 1 0260 1 0669 1 0436 9706 1 0927 1 2526 1 1091 1 0641 1 0864
NEW ZEALAND
FROM
Ecuador 562 308 291 354 326 308 273 258 288 250 279
Philippines 110 360 356 419 481 493 526 500 524 556 526
Panama - - 14 01 01
Others 01 03 01 00 00 04 00 04 01 02 03
TOTAL 673 672 661 775 809 805 800 763 813 809 807
8102019 Banana Import Export Global Stats
httpslidepdfcomreaderfullbanana-import-export-global-stats 27392222
Table 6 - Gross Imports by countries of origin 1
Tableau 6 - Importations brutes par pays drsquoorigine 1
Cuadro 6 - Importaciones brutas por paiacuteses de origen 1
2002 2003 2004 2005 2006 2007 2008 2009 2010 2011 2012
(prel)
( thousand tonnes milliers de tonnes miles de toneladas )
NORWAY
FROM
Panama 07 28 34 54 68 77 108 92 100 97 95
Costa Rica 260 307 339 425 382 373 343 239 244 261 256
Ecuador 52 67 88 95 175 160 183 300 276 329 324
Colombia 276 223 187 136 79 152 181 162 148 77 75
Others 04 10 14 22 41 21 20 19 18 18 18
TOTAL 598 634 662 732 746 785 835 812 785 782 769
ROMANIA
FROM
Ecuador 547 341 973 1272 1357
Colombia 60 19 39 29 39
Costa Rica 12 17 52 101 55
Honduras 28 28 40
Others 19 52 05 01 53
TOTAL 639 429 1097 1432 1543
RUSSIAN FEDERATION
FROM
Ecuador 5922 7233 7892 7911 7976 9202 9030 9112 9766 1 1999 1 1530
Costa Rica 09 175 10 155 275 21 659 326 482 386 446
China 65 54 41 26 15 30
Colombia 157 212 393 280 205 219 02 52 95 182 123
Vietnam 13 13 12 03 03 08 04
Philippines 139 208 232 212 304 251 315 245 298 355 335
Others 259 180 30 92 194 27 05 25 16 139 72
TOTAL 6500 8021 8569 8649 8954 9787 1 0068 9809 1 0686 1 3076 1 2536
SWITZERLAND
FROM
Costa Rica 383 367 294 278 240 264 184 172 161 156 154
Panama 70 40 40 65 98 125 204 155 165 118 117
Colombia 131 126 175 133 129 87 96 131 132 185 183
Ecuador 55 74 136 180 207 239 250 250 234 224 222
Honduras 01 06 06 01 - -
Others 104 109 84 85 67 68 87 100 106 111 110
TOTAL 743 722 735 742 741 782 821 808 799 794 786
8102019 Banana Import Export Global Stats
httpslidepdfcomreaderfullbanana-import-export-global-stats 28392323
Table 6 - Gross Imports by countries of origin 1
Tableau 6 - Importations brutes par pays drsquoorigine 1
Cuadro 6 - Importaciones brutas por paiacuteses de origen 1
2002 2003 2004 2005 2006 2007 2008 2009 2010 2011 2012
(prel)
( thousand tonnes milliers de tonnes miles de toneladas )
SLOVAKIA
FROM
Ecuador 58 63 15
Costa Rica 135 195 77
Colombia 163 161 60
Panama 119 89 35
Others 12 25 312
TOTAL 487 533 499
TUNISIAFROM
Cameroon 05 - 02 - - 01 05 - - -
Cocircte DrsquoIvoire - - 07 21 38 51 01 - -
Colombia 24 - 30 11 02 46 11 - - 03
Costa Rica - - 10 06 - - 01 18 53 44
Ecuador 133 138 491 169 161 289 313 349 134 366
Others 00 00 03 02 01 23 05 04 00 - 00
TOTAL 163 138 543 208 203 410 335 371 187 413
UNITED STATESFROM
Costa Rica 9015 9761 8653 8227 9274 1 0369 8744 5629 8536 8445 8482
Ecuador 1 0218 9725 9189 9043 9943 9292 8303 9576 9798 8790 7197
Honduras 4492 4321 5079 4530 4229 4827 5056 3887 4357 4452 5357
Guatemala 9252 9341 1 0208 1 0293 9129 1 0934 1 1887 1 1122 1 1515 1 3335 1 4586
Colombia 5064 4693 4646 5137 4738 3772 4508 4216 4609 3845 4402
Mexico 423 352 336 338 386 315 663 1052 1455 1486 2233
Panama 03 02 06 20 75 05 80 54 290 278 592
Nicaragua 297 416 415 381 305 328 311 249 360 356 363
Peru 232 138 124 223 251 178 225 197 201 232 259
Venezuela 37 19 20 07 03 - - - - - -
Dominican Rep 36 21 52 44 62 17 01 10 01 07 27
Others 01 02 00 00 - 00 00 00 00 26 01 - 00
TOTAL 3 9070 3 8792 3 8728 3 8244 3 8395 4 0038 3 9779 3 5992 4 1149 4 1227 4 3497
URUGUAY
FROM
Brazil 408 402 430 457 424 384 382 321 436 390 292
Ecuador 28 01 03 16 19 35 48 42 65 115 142
Others 02 07 04 00 04 01 - 00 53 05 09 14
TOTAL 438 411 437 473 446 420 430 416 506 515 4471 Figures may differ rom those shown in able 3 (a) which exclude re-exports1 Les chiffres dans ce tableau peuvent differer des chiffres du ableau 3 (a) qui ne comprennent pas les reacuteexportations1 Las ciras pueden dierir de las del Cuadro 3 (a) las cuales excluyen las reexportaciones
8102019 Banana Import Export Global Stats
httpslidepdfcomreaderfullbanana-import-export-global-stats 29392424
Table 7 - Import prices in selected countries monthly Tableau 7 - Prix agrave lrsquoimportation mensuels dans certains paysCuadro 7 - Precios mensuales de importacioacuten en algunos paiacuteses
FRANCE
2001 2002 2003 2004 2005 2006 2007 2008 2009 2010 2011 2012 2013
( Euro tonnes )
January 572 547 620 474 623 630 620 - 658 524 794 678 770
February 636 723 628 500 753 770 700 780 720 623 923 820 820
March 865 733 698 640 798 690 700 843 962 720 755 820 770
April 795 608 600 603 810 640 698 820 878 680 760 808 763
May 652 546 528 568 860 608 633 593 715 686 680 730 710
June 580 478 476 615 888 585 594 588 668 755 513 695 688
July 565 340 360 485 498 380 565 605 528 624 440 590 660
August 550 488 298 480 664 510 608 658 490 610 483 600 660
September 615 537 460 430 753 510 338 650 563 590 573 690 660
October 530 407 383 383 673 490 - 583 538 505 586 706 618
November 410 320 410 553 723 590 - 568 527 550 605 665 623
December 460 580 490 660 716 620 - 610 545 700 580 682 660
YEAR 603 525 496 533 730 585 606 663 649 631 641 707 700
USD ton 539 494 560 661 907 734 829 972 902 835 891 908 957
JAPAN2001 2002 2003 2004 2005 2006 2007 2008 2009 2010 2011 2012 2013
( Yen tonnes )
January 44 700 54 800 54700 52700 54900 46400 57700 55300 68100 55000 53000 52100 67800
February 49 100 66 000 60000 56600 56600 58200 64200 58400 69900 61900 56500 56900 71200
March 50 700 71 600 62700 65900 64600 58200 66400 63800 72600 68800 64500 65200 77100
April 54 000 83 200 66800 76400 66800 62900 79300 79100 82100 78300 74100 72200 82100
May 60 500 84 400 72800 70200 61600 64600 78700 82600 88300 77800 78500 72300 92500
June 54 400 80 100 68800 70900 65700 63600 73100 80800 88100 74700 75800 71100 89600
July 53 800 78 700 66400 64300 61900 63600 65000 83500 85500 71700 86200 69600 86600
August 56 500 64 000 68300 52800 60400 61200 64100 84300 81200 69400 72600 66400
September 60 600 65 900 69200 56500 60900 64600 72000 90900 74300 68500 68200 62000
October 53 500 63 700 58200 55100 57000 65100 65700 85600 64200 60900 61600 61000
November 48 700 54 400 51600 55600 49500 60600 59000 80400 58100 48500 60600 59100
December 48 900 50 800 49100 56100 47900 55300 56500 67100 52100 52100 55400 59900
YEAR 52 950 68 133 62 383 61 092 58 983 60 358 66 808 75 983 73 708 65 633 67 250 63 983 80986
USD kg 436 543 538 565 535 519 567 735 788 748 843 802 829
8102019 Banana Import Export Global Stats
httpslidepdfcomreaderfullbanana-import-export-global-stats 30392525
Table 7 - Import prices in selected countries monthly Tableau 7 - Prix agrave lrsquoimportation mensuels dans certains paysCuadro 7 - Precios mensuales de importacioacuten en algunos paiacuteses
UNITED STATES
2001 2002 2003 2004 2005 2006 2007 2008 2009 2010 2011 2012 2013
( USD tonnes )
January 535 427 561 427 589 686 639 689 820 785 892 945 929
February 687 517 462 496 891 854 655 792 944 720 1 002 1 068 923
March 541 572 486 513 792 825 648 1027 909 838 996 1 144 937
April 551 544 384 529 593 730 648 967 890 825 1 027 1 030 903
May 637 626 296 556 618 926 689 923 830 799 1 011 953 909
June 610 648 308 604 486 655 779 868 854 962 976 954 910
July 698 537 296 61 401 560 734 722 827 985 961 965 923
August 683 420 286 548 405 542 697 799 834 899 951 951 940
September 572 486 312 539 594 544 665 803 818 880 947 965 937
October 484 544 328 496 630 549 659 807 810 916 954 956 931
November 496 396 408 492 589 598 651 903 834 908 956 934 923
December 506 625 370 496 646 658 648 830 796 900 942 944 923
YEAR 583 529 375 480 603 677 676 844 847 868 968 984 924
EUROPEAN UNION
2001 2002 2003 2004 2005 2006 2007 2008 2009 2010 2011 2012 2013
( Euro tonnes )
January 590 590 590 590 610 580 600 600 570 630 610 610
February 610 590 600 610 600 590 560 610 580 640 620 620
March 630 610 640 660 600 590 620 660 600 630 630 620
April 640 620 620 630 610 580 640 660 620 620 640
May 620 590 640 640 590 590 610 630 610 610 630
June 600 590 640 680 570 580 590 630 640 600 630
July 560 560 620 610 550 570 590 600 630 590 620
August 600 540 600 610 530 550 580 590 600 570 630
September 610 570 600 630 550 570 610 570 600 580 620
October 580 580 590 620 550 580 600 570 600 590 610November 560 560 600 640 580 580 590 580 600 580 620
December 590 580 620 630 570 560 600 550 610 610 620
YEAR 599 582 613 629 576 577 599 604 605 604 623 617
USD ton 564 656 762 782 722 789 878 839 801 840 801 843
8102019 Banana Import Export Global Stats
httpslidepdfcomreaderfullbanana-import-export-global-stats 31392626
Table 7 - Import prices in selected countries monthly Tableau 7 - Prix agrave lrsquoimportation mensuels dans certains paysCuadro 7 - Precios mensuales de importacioacuten en algunos paiacuteses
HUNGARY
2001 2002 2003 2004 2005 2006 2007 2008 2009 2010 2011 2012 2013
( Forint tonnes )
January 40 000 74 000 115 000 105 000 62 000 181 000 181 000 186 000 188 000 158000 210000 197000
February 39 000 76 000 119 000 109 000 171 000 189 000 189 000 210 000 221 000 172000 213000 236000
March 39 000 83 000 122 000 105 000 179 000 185 000 178 000 226 000 268 000 195000 197000 224000
April 40 000 105 000 137 000 112 000 164 000 190 000 174 000 200 000 241 000 180000 198000 225000
May 39 000 112 000 104 000 176 000 180 000 176 000 160 000 160 000 205 000 200000 185000 211000
June 37 000 108 000 108 000 157 000 184 000 177 000 151 000 149 000 207 000 220000 157000 202000
July 47 000 76 000 105 000 137 000 136 000 129 000 138 000 142 000 186 000 174000 141000 172000
August 45 000 81 000 90 000 104 000 140 000 148 000 151 000 161 000 179 000 160000 150000 187000
September 46 000 104 000 76 000 123 000 152 000 147 000 178 000 165 000 162 000 161000 162000 207000
October 47 000 93 000 98 000 159 000 149 000 145 000 159 000 160 000 151 000 173000 167000 196000
November 61 000 86 000 88 000 242 000 164 000 175 000 160 000 164 000 154 000 176000 165000 192000
December 76 000 92 000 96 000 245 000 163 000 167 000 174 000 181 000 155 000 204000 174000 208000
YEAR 46 333 90 833 104 833 147 833 153 667 167 417 166 083 175 333 193 083 181 083 176 583 204 750
USD ton 162 352 467 729 770 796 904 1 019 954 871 878 910
THE PEOPLErsquoS REPUBLIC OF CHINA (MAILAND)2001 2002 2003 2004 2005 2006 2007 2008 2009 2010 2011 2012 2013
( USD tonnes )
January 250 227 284 295 308 317 377 412 389 491 574
February 243 212 250 297 290 312 374 407 340 428 538
March 196 197 209 274 234 312 332 274 361 403 522
April 207 212 179 267 285 331 332 312 403 428 523
May 205 191 199 274 250 332 405 377 406 437 534
June 218 188 241 271 303 336 409 399 428 484 574
July 228 191 244 267 325 339 41 411 426 526 646
August 195 173 247 240 319 325 381 379 406 528 672
September 202 244 270 276 317 326 394 432 460 534 677
October 213 233 295 290 329 342 375 408 472 501 650
November 220 251 272 292 328 353 403 424 462 541 658
December 215 266 279 296 326 371 398 281 258 577 616
YEAR 216 215 247 278 301 333 352 376 401 490 599
Source United States official dataJapan Monthly Bulletin o Banana Statistics Japan Banana Importersrsquo AssociationFrance Marcheacutes Europeacuteens des Fruits et Leacutegumes Revue drsquoInormation Economique
8102019 Banana Import Export Global Stats
httpslidepdfcomreaderfullbanana-import-export-global-stats 32392727
Table 8 - Wholesalersrsquo selling prices in selected countries monthly Tableau 8 - Prix de vente en gros mensuels dans certains paysCuadro 8 - Precios mensuales de venta al por mayor en algunos paiacuteses
JAPAN
2001 2002 2003 2004 2005 2006 2007 2008 2009 2010 2011 2012 2013
( Yen kgs )
January 81 117 107 106 103 96 120 129 160 126 121 121 139
February 98 135 133 109 115 122 142 145 157 144 129 124 150
March 101 146 130 139 132 120 157 155 151 146 140 130 161
April 123 155 133 149 123 117 167 159 162 142 148 135 172
May 128 154 144 140 119 126 163 154 165 140 145 135 169
June 103 153 131 138 122 122 145 153 160 142 140 133 161
July 112 148 128 119 115 115 135 152 149 141 133 130 153August 106 116 125 101 112 115 134 150 140 135 122 125
September 113 130 126 108 115 128 138 158 137 129 125 119
October 101 128 117 113 107 134 132 178 130 120 133 118
November 102 102 98 113 98 123 128 164 122 101 131 116
December 97 95 98 109 80 111 125 151 116 101 122 121
YEAR 105 132 123 120 112 119 141 154 146 131 132 126 158
USD kg 087 105 106 111 101 102 119 149 156 149 166 157 162
UNITED STATES
2001 2002 2003 2004 2005 2006 2007 2008 2009 2010 2011 2012 2013
( USD kgs )
January 062 064 064 060 059 069 080 075 118 092 101 095 099
February 072 060 064 064 064 101 080 099 112 099 112 117 099
March 077 066 070 055 082 102 079 136 110 101 108 141 101
April 074 067 067 058 069 090 074 133 109 101 105 121 101
May 085 068 062 059 073 104 082 128 105 099 103 106 095
June 070 072 059 066 074 088 084 106 104 106 105 097 094
July 083 065 061 056 058 065 078 096 101 118 096 096 094
August 081 061 058 048 049 061 074 093 101 099 095 096 094
September 080 061 057 047 061 067 082 094 099 088 092 105 094
October 067 056 056 048 066 069 079 096 094 099 091 104 092
November 058 054 055 046 061 065 072 093 091 094 092 099 090
December 063 061 057 055 073 072 069 093 090 096 096 097 088
YEAR 073 063 061 055 066 079 078 104 103 099 100 106 095
8102019 Banana Import Export Global Stats
httpslidepdfcomreaderfullbanana-import-export-global-stats 33392828
Table 8 - Wholesalersrsquo selling prices in selected countries monthly Tableau 8 - Prix de vente en gros mensuels dans certains paysCuadro 8 - Precios mensuales de venta al por mayor en algunos paiacuteses
FRANCE
2001 2002 2003 2004 2005 2006 2007 2008 2009 2010 2011 2012 2013
( Euro kg )
January 084 079 093 081 100 098 090 090 085 079 101 087 104
February 093 095 097 082 112 107 097 105 094 083 122 104 107
March 115 107 103 097 120 103 099 113 122 093 106 105 105
April 115 103 094 093 114 094 097 104 110 094 095 105 105
May 099 090 079 093 112 091 090 081 096 093 091 105 101
June 086 078 080 094 126 094 086 081 091 096 079 105 097
July 092 069 063 082 089 071 078 081 080 085 074 092 090August 081 073 059 074 098 068 081 085 075 080 074 091 092
September 086 080 078 077 106 073 094 084 079 081 080 100 095
October 081 068 076 075 097 074 082 079 081 074 081 102 093
November 075 062 074 085 097 086 075 077 076 079 083 095 092
December 074 082 076 105 102 090 085 081 083 092 081 095
YEAR 090 082 081 086 106 087 088 088 089 086 089 099 098
USD kg 081 077 091 107 132 109 120 130 124 114 124 127 134
EUROPEAN UNION
2001 2002 2003 2004 2005 2006 2007 2008 2009 2010 2011 2012 2013
( Euro kg )
January 094 095 089 097 101 101 102 101 094 113 101 110
February 102 099 091 107 104 104 117 106 094 122 113 108
March 112 105 096 111 102 104 128 125 106 113 117 105
April 114 105 096 111 098 103 122 124 110 111 116 107
May 106 093 093 118 095 100 103 112 111 111 113 108
June 095 091 094 125 094 098 096 112 114 100 110 110
July 078 074 084 099 080 094 094 100 104 091 101
August 088 074 075 097 078 093 093 095 097 090 102
September 093 080 078 107 081 101 091 096 099 092 109
October 084 081 079 103 079 100 095 096 094 094 108
November 077 081 083 104 083 093 096 093 096 094 105
December 085 086 098 104 089 098 097 095 104 095 103
YEAR 094 089 088 107 090 099 103 105 102 102 108 108
USD kg 088 100 109 133 113 136 151 145 135 142 139 148
8102019 Banana Import Export Global Stats
httpslidepdfcomreaderfullbanana-import-export-global-stats 34392929
Table 8 - Wholesalersrsquo selling prices in selected countries monthly Tableau 8 - Prix de vente en gros mensuels dans certains paysCuadro 8 - Precios mensuales de venta al por mayor en algunos paiacuteses
THE PEOPLErsquoS REPUBLIC OF CHINA (MAILAND)
2001 2002 2003 2004 2005 2006 2007 2008 2009 2010 2011 2012 2013
( RMB kg )
January 294 305 333 282 309 310 357 351 304 433 494 385
February 376 319 316 292 324 345 375 343 346 475 508 431
March 369 288 319 275 342 380 366 345 356 511 486 451
April 370 285 342 276 368 334 383 391 407 611 465 478
May 301 278 355 274 386 289 371 457 456 566 432 526
June 264 260 338 272 386 257 356 444 483 415 414 527July 228 249 292 265 339 228 313 408 435 336 379
August 224 249 277 265 270 239 313 383 397 344 373
September 240 273 268 315 324 276 341 356 397 401 378
October 232 270 259 314 285 304 345 329 369 443 397
November 218 290 271 306 276 294 372 300 370 495 386
December 235 311 272 304 291 314 342 288 398 497 380
YEAR 279 281 304 287 325 298 353 366 393 461 424 466
USD kg 034 034 037 035 041 039 051 054 058 071 067 077
URUGUAY
2001 2002 2003 2004 2005 2006 2007 2008 2009 2010 2011 2012 2013
( Pesos uruguayos kg )
January 947 1041 981 1134 1384 1708 1799 1792 2014 1888
February 715 861 886 1160 1309 1603 1766 1605 1803 2102
March 892 937 859 1185 1394 1634 1812 187 1777 2174
April 1064 1025 925 1393 1433 1625 1927 1809 1802 2609
May 920 825 873 1111 1285 1519 1825 169 1744 2057
June 833 843 735 1157 1225 1545 1784 1758 174 2069
July 875 888 730 1267 1588 1874 176 1752 2195
August 837 974 893 1221 1414 1659 1969 182 1814 2092
September 891 887 1041 1256 1531 1607 1928 1844 1843 1909
October 1128 843 1248 1594 1545 1795 1963 1891 1867 1992
November 1107 812 1260 1478 1647 2068 1916 1944 1837 1915
December 860 925 1232 1397 2088 2001 1750 2174 1957
YEAR 922 905 972 1279 1478 1696 1859 1830 1829 2091
USD kg 033 032 040 053 063 081 082 091 095 103
8102019 Banana Import Export Global Stats
httpslidepdfcomreaderfullbanana-import-export-global-stats 35393030
Table 8 - Wholesalersrsquo selling prices in selected countries monthly Tableau 8 - Prix de vente en gros mensuels dans certains paysCuadro 8 - Precios mensuales de venta al por mayor en algunos paiacuteses
UNITED KINGDOM2001 2002 2003 2004 2005 2006 2007 2008 2009 2010 2011 2012 2013
( pence kg )
January 370 570 570 530 630 690 610 720 700 550 950 767 787
February 600 650 600 460 790 670 610 900 730 590 1020 877 778
March 760 720 700 550 690 560 570 850 1090 730 730 975 704
April 750 670 600 530 750 550 590 760 990 770 800 803 773
May 700 630 540 540 910 640 580 680 880 830 820 779 790
June 660 530 520 610 870 660 560 600 930 940 620 772 710
July 600 430 390 530 590 490 520 630 670 790 570 734 714
August 550 490 450 460 690 500 570 660 640 750 590 699
September 590 520 490 530 770 530 650 670 660 740 650 776
October 500 480 440 460 680 530 570 580 650 600 600 655
November 480 400 430 530 680 480 520 610 550 630 590 632
December 470 540 380 650 600 540 530 620 560 690 630 651
YEAR 586 553 509 532 721 570 573 690 754 718 714 760 751
USD kg 084 083 083 097 131 105 115 127 117 111 114 120 121
BANANA ORGANIC
USA
2008 2009 2010 2 011 2012 2013
( USD kg )
January 112 138 131 127 134 136
February 112 138 127 140 138 132
March 154 138 128 142 138 125
April 160 138 127 129 141 127
May 147 138 135 141 135
June 152 138 138 140 138
July 137 138 134 138 138
August 136 134 138 138 131
September 138 125 142 136 135
October 138 129 138 135 138
November 138 134 123 136 135
December 134 131 127 134 137
YEAR 138 135 132 136 136 131
SourceUnited States USDA C amp MS Fruit and Vegetable Division Market News daily reports
Japan Monthy Bulletin o Banana Statistics Japan Banana Importersrsquo Association
8102019 Banana Import Export Global Stats
httpslidepdfcomreaderfullbanana-import-export-global-stats 36393131
Table 9 - Retail prices in selected countries monthly Tableau 9 - Prix mensuels au detail dans certains paysCuadro 9 - Precios mensuales al por menor en algunos paiacuteses
FRANCE
2001 2002 2003 2004 2005 2006 2007 2008 2009 2010 2011 2012 2013
( Euro kg )
January 150 151 162 150 163 173 160 165 160 156 170 162 175
February 157 164 167 152 178 176 163 172 164 156 185 170 182
March 169 181 171 156 182 177 166 179 175 164 188 177 181
April 185 182 174 162 185 172 168 188 190 169 180 184 184
May 180 177 162 158 193 169 168 176 179 167 178 180 181
June 171 171 162 161 203 169 165 169 174 173 173 178 184
July 174 148 151 158 187 163 163 169 168 173 167 178 184
August 162 145 144 147 165 154 157 168 158 166 160 172 180
September 161 155 143 138 172 152 163 165 155 162 157 170 176
October 158 144 143 143 169 147 166 163 157 159 158 172 175
November 151 139 140 140 168 154 160 158 154 157 162 175 175
December 145 141 147 161 174 157 163 158 153 163 161 175 176
YEAR 164 158 156 152 178 164 164 169 166 164 170 174 179
USD kg 146 149 176 189 222 205 224 248 230 217 236 224 245
HUNGARY2001 2002 2003 2004 2005 2006 2007 2008 2009 2010 2011 2012 2013
( Forint kg )
January 251 263 293 251 309 345 329 338 348 323 374 358 399
February 239 263 283 249 313 339 334 348 364 323 421 407 407
March 246 280 283 261 340 339 326 392 421 338 427 425 408
April 284 312 286 276 343 345 338 410 468 357 396 424 404
May 247 302 270 289 347 345 336 361 431 349 392 419
June 221 288 264 310 376 356 319 332 406 371 364 398
July 257 247 248 303 343 340 314 311 389 377 319 372
August 239 248 249 281 317 327 316 313 351 362 297 361
September 252 272 252 258 324 328 329 319 340 361 306 381
October 244 253 250 258 325 302 338 318 331 326 324 395
November 229 233 234 254 345 316 326 303 320 330 343 394
December 245 252 232 294 339 320 320 307 309 350 343 376
YEAR 246 268 262 274 335 334 327 338 373 347 359 393 405
USD ton 086 104 117 135 168 159 178 196 184 167 178 174 188
8102019 Banana Import Export Global Stats
httpslidepdfcomreaderfullbanana-import-export-global-stats 37393232
Table 9 - Retail prices in selected countries monthly Tableau 9 - Prix mensuels au detail dans certains paysCuadro 9 - Precios mensuales al por menor en algunos paiacuteses
UNITED STATES
2001 2002 2003 2004 2005 2006 2007 2008 2009 2010 2011 2012 2013
( USD kg )
January 108 112 116 113 107 108 111 115 139 129 131 133 134
February 116 111 112 111 111 112 112 119 141 129 138 133 135
March 114 114 113 110 112 112 112 132 140 127 137 134 134
April 112 111 113 111 111 112 114 138 139 128 137 133 132
May 112 114 111 108 110 113 111 139 137 126 136 132 133
June 112 113 115 110 109 113 113 140 139 127 135 133 133
July 113 114 113 112 109 112 112 138 136 129 135 133 133
August 108 110 113 112 107 108 112 140 135 127 134 131 131
September 108 110 109 108 107 106 111 139 133 126 134 132 132
October 109 111 108 107 108 108 112 138 132 128 134 133 129
November 106 111 110 103 106 108 114 138 124 128 132 132 129
December 107 111 111 104 106 110 116 136 126 129 132 134 131
YEAR 110 112 112 109 109 110 113 134 135 128 135 133 132
JAPAN
2001 2002 2003 2004 2005 2006 2007 2008 2009 2010 2011 2012 2013
( Yen kg )
January 218 225 235 232 243 222 236 217 224 225 221 207
February 224 239 241 249 239 230 236 226 235 228 220 201
March 237 260 243 248 242 240 238 229 238 232 225 207
April 237 257 241 257 238 251 244 226 255 229 227 211
May 262 262 242 260 245 250 240 226 252 236 218 205
June 282 258 229 262 250 253 240 231 248 227 216 200
July 278 254 229 262 252 246 229 232 240 226 220 200
August 308 246 219 261 241 229 232 232 241 222 210 202
September 295 257 229 257 240 230 232 231 239 230 215 205
October 279 259 230 259 239 235 227 228 238 219 225 194November 255 260 223 245 231 231 222 221 236 218 216 193
December 233 241 220 237 220 230 219 221 233 218 193
YEAR 259 252 232 252 240 237 233 227 240 226 219 202
USD kg 213 201 200 233 218 204 198 219 256 257 275 253
8102019 Banana Import Export Global Stats
httpslidepdfcomreaderfullbanana-import-export-global-stats 38393333
Table 9 - Retail prices in selected countries monthly Tableau 9 - Prix mensuels au detail dans certains paysCuadro 9 - Precios mensuales al por menor en algunos paiacuteses
THE PEOPLErsquoS REPUBLIC OF CHINA (MAILAND)
2001 2002 2003 2004 2005 2006 2007 2008 2009 2010 2011 2012 2013
( RMB kg )
January 325 350 385 335 345 365 415 410 365 495 55
February 410 375 395 350 365 395 435 415 420 545 595
March 420 335 365 345 385 425 450 425 435 58 58
April 435 340 375 350 410 435 460 465 490 67 54
May 395 365 385 365 425 325 455 510 530 63 53
June 320 380 365 370 430 290 425 490 565 5 51
July 295 305 365 360 370 260 400 485 587 46 48
August 285 315 345 365 325 280 410 465 490 45 45
September 290 335 350 385 390 285 425 430 510 49 485
October 310 355 368 390 335 360 438 425 480 53 52
November 305 376 370 375 315 340 465 390 450 575 49
December 310 395 375 380 320 375 350 385 470 59 495
YEAR 342 352 370 364 368 345 427 441 483 543 519
USD kg 041 043 045 044 046 045 061 065 071 084 082
8102019 Banana Import Export Global Stats
httpslidepdfcomreaderfullbanana-import-export-global-stats 3939
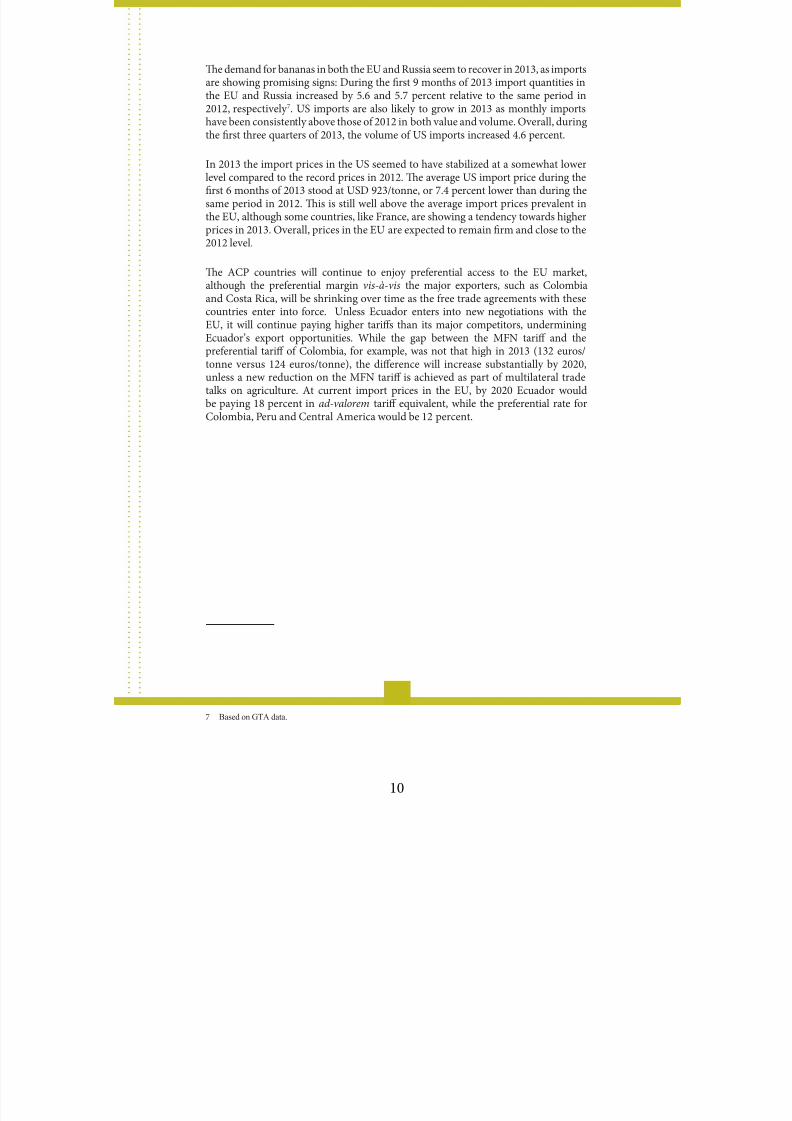
8102019 Banana Import Export Global Stats
httpslidepdfcomreaderfullbanana-import-export-global-stats 153910
Te demand or bananas in both the EU and Russia seem to recover in 2013 as importsare showing promising signs During the first 9 months o 2013 import quantities inthe EU and Russia increased by 56 and 57 percent relative to the same period in2012 respectively 7 US imports are also likely to grow in 2013 as monthly importshave been consistently above those o 2012 in both value and volume Overall during
the first three quarters o 2013 the volume o US imports increased 46 percent
In 2013 the import prices in the US seemed to have stabilized at a somewhat lowerlevel compared to the record prices in 2012 Te average US import price during thefirst 6 months o 2013 stood at USD 923tonne or 74 percent lower than during thesame period in 2012 Tis is still well above the average import prices prevalent inthe EU although some countries like France are showing a tendency towards higherprices in 2013 Overall prices in the EU are expected to remain firm and close to the2012 level
Te ACP countries will continue to enjoy preerential access to the EU market
although the preerential margin vis-agrave-vis the major exporters such as Colombiaand Costa Rica will be shrinking over time as the ree trade agreements with thesecountries enter into orce Unless Ecuador enters into new negotiations with theEU it will continue paying higher tariffs than its major competitors underminingEcuadorrsquos export opportunities While the gap between the MFN tariff and thepreerential tariff o Colombia or example was not that high in 2013 (132 eurostonne versus 124 eurostonne) the difference will increase substantially by 2020unless a new reduction on the MFN tariff is achieved as part o multilateral tradetalks on agriculture At current import prices in the EU by 2020 Ecuador wouldbe paying 18 percent in ad-valorem tariff equivalent while the preerential rate orColombia Peru and Central America would be 12 percent
7 Based on GTA data
8102019 Banana Import Export Global Stats
httpslidepdfcomreaderfullbanana-import-export-global-stats 1639
STATISTICAL TABLES
8102019 Banana Import Export Global Stats
httpslidepdfcomreaderfullbanana-import-export-global-stats 17391212
Table 1 - World gross exports by country Tableau 1 - Exportations brutes mondiales par paysCuadro 1 - Exportaciones brutas mundiales por paiacutes
2000 2001 2002 2003 2004 2005 2006 2007 2008 2009 2010 2011 2012
(prel)
( thousand tonnes milliers de tonnes miles de toneladas )
Latin America amp Caribbean 9 7239 9 4433 9 9331 10 4715 10 4367 10 6201 11 2608 12 1333 11 9550 12 3458 11 7717 12 5270 13 0280
Central and South America 9 4791 9 1823 9 6743 10 2260 10 2225 10 3715 10 9502 11 8437 11 6878 11 9762 11 3922 12 2020 12 7054
Belize 658 501 430 749 805 763 730 611 827 818 792 837 993
Bolivia 94 129 165 284 427 536 762 795 858 894 884 983 727
Brazil 718 1051 2410 2208 1881 2122 1943 1857 1309 1439 1395 1101 957
Colombia 1 6802 1 5163 1 5704 1 4232 1 4709 1 6215 1 6974 1 7492 1 7983 2 1018 1 8026 1 9153 1 8349
Costa Rica 1 8833 1 7393 1 6226 1 9013 1 7925 1 6145 1 9611 2 1592 1 8726 1 5875 1 8209 1 9022 2 0286
Ecuador 3 9395 3 9904 4 1992 4 6712 4 5370 4 6539 4 7978 5 0571 5 1328 5 4731 4 9450 5 3919 4 9821
Guatemala 8013 8738 9717 9333 1 0138 1 0463 9826 1 3304 1 3547 1 4064 1 3691 1 5588 1 9208
Honduras 3753 4318 4414 4434 5277 5011 5162 5701 6057 5197 5124 5166 9014
Mexico 455 374 358 399 416 702 666 416 749 1401 1741 1776 3075
Nicaragua 455 441 408 409 449 455 377 389 378 347 200 82 93
Panama 4893 3211 4185 4102 3980 3483 4311 4386 3666 2572 2724 2669 2450
Peru 09 80 191 181 273 429 571 655 782 833 894 1088 1238
Suriname 354 287 280 01 214 396 474 562 654 570 791 629 831
Venezuela 361 233 265 203 360 456 117 106 14 01 01 08 12
Caribbean 2448 2609 2589 2455 2142 2487 3105 2896 2673 3696 3795 3250 3226 Dominican Republic 802 1302 1147 1267 1020 1671 2056 2120 1919 2818 3404 3038 2972
Jamaica 420 431 399 418 287 116 319 174 00 00 00 00 00
Others 1226 877 1042 771 835 700 731 602 754 877 391 212 254
Asia 17038 16896 17853 19443 19047 21693 24103 23121 23057 18574 17649 22174 28179
China 502 392 397 530 416 388 228 209 151 132 86 102 79
Malaysia 311 302 279 246 211 338 268 271 301 200 214 229 183
Pakistan 21 14 37 72 60 85 109 79 130 867 577 588 588
Philippines 1 5994 1 6007 1 6850 1 8294 1 7973 2 0243 2 3115 2 2177 2 1926 1 6641 1 5901 2 0555 2 6461
Tailand 58 55 52 63 177 418 203 214 228 256 228 252 276
Vietnam 45 42 146 126 72 39 21 16 26 17 35 32 32 Others 107 84 92 111 138 181 159 154 296 462 608 417 560
India 86 81 87 109 126 144 115 130 276 458 608 399 545
Africa 4941 4889 5329 5651 5568 5045 6057 5801 6114 5682 6435 6337 6488
Cameroon 2382 2541 2588 3137 2949 2655 2566 2323 2687 2555 2328 2490 2465
Cocircte drsquoIvoire 2173 2244 2560 2424 2524 2344 2864 2908 2643 2570 3356 3201 3394
Ethiopia 05 03 09 13 29 00 05 26 20 28 36 41 41
Others 93 48 107 77 65 46 621 544 764 528 714 606 588
Ghana 39 33 30 13 19 19 575 521 698 476 675 579 561
Oceania 03 01 01 01 01 01 01 01 01 01 01 01 01
WORLD 11 9221 11 6218 12 2514 12 9810 12 8982 13 2940 14 2768 15 0255 14 8723 14 7714 14 1802 15 3783 16 4948
8102019 Banana Import Export Global Stats
httpslidepdfcomreaderfullbanana-import-export-global-stats 18391313
Table 2 - World net imports by country Tableau 2 - Importations nettes mondiales par paysCuadro 2 - Importaciones netas mundiales por paiacutes
2000 2001 2002 2003 2004 2005 2006 2007 2008 2009 2010 2011 2012
(prel)
( thousand tonnes milliers de tonnes miles de toneladas )
DEVELOPING COUNTRIES 2 2705 1 9519 1 9760 2 3592 2 5037 2 7438 2 9908 3 0399 3 3967 3 3997 3 8240 4 1996 3 7561
Latin America amp Caribbean 6360 6031 5006 5591 5626 6007 5629 5986 6226 6143 6412 6814 6678
Argentina 3400 3301 2295 2864 3033 3022 2957 3189 3468 3441 3511 3949 3766
Chile 1926 1475 1491 1578 1597 1953 1689 1782 1750 1793 1757 1844 1906
El Salvador 590 612 614 566 515 531 491 538 527 435 487 448 498
Uruguay 330 489 438 411 437 476 451 422 431 416 506 515 447
Others 115 154 167 171 43 25 41 54 50 58 152 59 62
Asia 1 5762 1 1937 1 2007 1 5193 1 6148 1 9356 2 2266 2 1834 2 5295 2 5112 2 8624 3 1575 2 7362
China 6423 4676 4013 4811 4373 4142 4467 3873 4210 5536 7408 9095 7158
Iran 2000 756 1507 2710 2709 4509 3728 4477 7516 7128 6395 5909 3555
Jordan 53 29 22 15 21 63 93 202 330 256 396 483 498
Korea Rep 1842 1945 1872 2200 2083 2533 2797 3077 2581 2570 3379 3527 3680 Kuwait 233 238 255 261 302 305 676 889 961 929 911 1305 1398
Saudi Arabia 1869 1810 1765 1994 2115 2332 2351 2481 2567 2524 3074 3062 3062
Singapore 423 398 376 352 350 357 365 371 384 397 393 416 446
Syria 687 530 478 704 939 1116 3227 1927 2196 1837 2323 2722 2934
urkey 1242 416 646 919 1102 1510 1686 2243 2191 1824 2007 2346 2251
United Arab Emirates 685 796 683 707 1576 1748 2105 1229 1267 845 933 1287 1297
Others 305 343 391 520 578 742 771 1066 1094 1265 1403 1423 1084
Africa 582 1551 2748 2808 3263 2074 2013 2580 2446 2741 3203 3607 3521
Algeria 00 854 2315 2233 2046 1571 1472 1626 1639 1796 2079 2453 2310
Egypt 53 59 26 12 11 28 61 47 30 25 101 256 284
Morocco 00 28 14 11 22 49 54 172 187 267 281 246 282
Senegal 71 105 121 123 141 150 157 166 169 168 165 143 156
unisia 155 110 163 138 543 208 203 410 335 371 187 413 413
Others 303 394 109 291 500 68 67 158 86 115 391 95 76
DEVELOPED COUNTRIES 9 8804 9 6173 9 8594 10 1348 10 2763 10 3758 10 8862 11 4379 11 7050 11 0187 11 5162 12 3829 12 4955
EC ( 27 ) 3 8901 3 7718 3 8868 4 0230 4 0010 3 9230 4 3653 4 6824 4 8773 4 5370 4 5087 4 6030 4 4876
Other Europe 8126 9415 1 0599 1 1827 1 3155 1 4812 1 5319 1 6675 1 7004 1 5876 1 6729 1 9533 1 9018
Albania 178 85 187 227 172 168 168 202 174 172 175 174 174
Belarus 311 173 161 209 235 287 294 332 417 367 445 401 594
Bosnia Herzgovina 05 06 03 414 462 449 378 383 408 371 370 380 380
Croatia 419 432 451 506 508 540 515 548 570 521 494 487 463
Iceland 35 37 40 41 46 47 54 55 56 57 57 59 61
Macedonia Former YR 51 20 78 153 208 176 151 161 154 167 181 191 191
Moldova Rep 16 17 15 31 49 70 77 112 129 117 105 122 112 Norway 599 609 598 634 662 732 746 785 835 812 785 782 769
Russian Fed 4995 6067 6408 7870 8427 8528 8835 9597 9885 9694 1 0686 1 3076 1 2536
Serbia Montenegro 198 679 1134 151 975 578
Serbia 558 657 689 431 419 515 454
Montenegro 83 85 84 85 66 74 74
Switzerland 723 734 743 722 735 742 741 782 821 808 799 794 786
Ukraine 595 555 791 870 676 2494 2720 2975 2781 2273 2148 2478 2426
North America 4 0289 3 8387 3 9072 3 8738 3 8649 3 8223 3 8516 4 0151 3 9309 3 5429 4 1075 4 6293 4 8768
Canada 3984 4049 4170 4228 4406 4490 4567 4718 4776 4819 4961 5066 5270
United States 3 6304 3 4338 3 4902 3 4511 3 4242 3 3733 3 3950 3 5433 3 4534 3 0610 3 6114 4 1227 4 3497
Others 1 1488 1 0653 1 0054 1 0552 1 0949 1 1493 1 1374 1 0730 1 1963 1 3512 1 2271 1 1973 1 2294
Japan 1 0787 9906 9363 9866 1 0260 1 0669 1 0436 9706 1 0927 1 2526 1 1091 1 0641 1 0864 New Zealand 676 722 673 672 661 775 809 805 800 763 813 809 807
South Arica 26 26 18 14 28 50 129 219 236 222 367 523 623
WORLD 12 1508 11 5692 11 8354 12 4940 12 7800 13 1196 13 8770 14 4778 15 1017 14 4183 15 3401 16 5824 16 2516
8102019 Banana Import Export Global Stats
httpslidepdfcomreaderfullbanana-import-export-global-stats 19391414
Table 3 - EC Total supply of bananas and per capita supply Tableau 3 - CE Offre totale de banane et offre par habitantCuadro 3 - CE Oferta total de banano y oferta por habitante
2000 2001 2002 2003 2004 2005 2006 2007 2008 2009 2010 2011 2012
( thousand tons milliers de tonnes miles de toneladas )
France 3589 3228 3589 3292 3053 2805 2686 1673 1716 2358 2420 2425 2517
Guadeloupe 876 890 951 855 591 542 478 380 467 556 426 615 669
Martinique 2713 2337 2639 2437 2462 2262 2208 293 1249 1802 1994 1810 1848
Spain 3976 4209 4073 4009 4184 3450 3482 3614 3713 3520 3970 3465 3710
Greece 33 29 24 27 29 29 29 29 27 26 19 20 22
Cyprus 85 98 105 112 105 58 65 60 42 32 50 56 57
Portugal 225 207 219 214 212 142 153 172 178 145 137 153 177
Production 7907 7771 8011 7654 7582 6484 6416 5547 5676 6080 6595 6118 6485
Net Imports
EC (27) 3 8901 3 7718 3 8868 4 0310 4 0125 3 9230 4 3676 4 6824 4 8738 4 5372 4 5086 4 6030 4 4899
Supply 4 6807 4 5489 4 6880 4 7965 4 7707 4 5714 5 0092 5 2371 5 4414 5 1453 5 1682 5 2149 5 1383
Per capita supply 1231 1191 968 986 977 931 1016 1058 1095 1031 1032 1038 1021
Source EC Commission
8102019 Banana Import Export Global Stats
httpslidepdfcomreaderfullbanana-import-export-global-stats 20391515
Table 4 - Per capita net imports by country Tableau 4 - Importations nettes par habitant par paysCuadro 4 - Importaciones netas por habitante por paiacutes
2000 2001 2002 2003 2004 2005 2006 2007 2008 2009 2010 2011 2012
(prel)
( kg per capita kg par habitant kg por habitante )
DEVELOPING COUNTRIES 127 108 108 128 135 147 158 160 177 175 196 213 185
Latin America amp Caribbean 932 875 719 796 793 839 779 821 847 828 856 902 876
Argentina 921 885 610 754 791 781 758 810 873 859 869 969 916
Chile 1249 945 945 989 990 1198 1026 1071 1042 1058 1027 1068 1094
El Salvador 994 1026 1026 942 854 878 808 882 860 705 786 719 795
Uruguay 994 1472 1317 1237 1316 1432 1356 1266 1288 1240 1501 1523 1319
Others 174 228 243 246 061 035 055 073 066 076 195 074 077
Asia 100 075 075 094 099 118 135 131 151 148 168 184 154
China 051 037 032 038 034 032 034 030 032 042 056 068 052
Iran 306 114 224 398 393 647 528 627 1040 975 865 790 470
Jordan 109 059 044 029 040 118 169 356 564 426 641 762 771
Korea Rep 401 421 403 472 445 538 592 648 541 536 701 729 757 Kuwait 1203 1183 1231 1227 1378 1345 2877 3630 3771 3511 3328 4631 4834
Saudi Arabia 933 875 822 893 911 970 948 973 981 941 1120 1090 1067
Singapore 1078 999 931 861 841 838 828 809 804 802 774 802 848
Syria 430 322 282 403 522 604 1706 997 1115 916 1138 1311 1389
urkey 195 064 099 139 164 222 244 320 309 254 276 319 302
United Arab Emirates 2258 2529 2099 2078 4309 4295 4514 2273 2041 1218 1242 1631 1600
Others 031 034 038 051 056 070 072 097 098 111 121 120 090
Africa 039 103 180 181 207 129 124 156 146 161 185 205 197
Algeria 000 276 736 700 632 478 441 480 476 514 586 682 633
Egypt 008 009 004 002 002 004 008 006 004 003 013 031 034
Morocco 000 010 005 004 007 016 017 056 060 084 088 076 086
Senegal 075 108 120 120 133 138 141 145 144 138 133 112 119
unisia 164 116 169 142 553 210 202 405 327 358 178 390 386
Others 1726 2207 601 1590 2699 360 352 821 439 579 1947 470 368
DEVELOPED COUNTRIES 813 789 805 825 833 837 875 916 933 875 911 976 981
EC ( 27 ) 808 781 802 826 818 799 885 946 981 909 901 917 891
Other Europe 331 385 435 488 545 616 639 696 711 665 702 821 800
Albania 581 275 605 731 549 535 533 636 547 540 547 541 539
Belarus 309 173 161 210 238 292 301 341 431 381 463 419 623
Bosnia Herzgovina 014 016 007 1093 1223 1188 999 1014 1081 986 983 1013 1015
Croatia 929 964 1009 1135 1142 1215 1161 1237 1291 1182 1121 1107 1055
Iceland 1246 1286 1401 1414 1573 1591 1778 1803 1785 1818 1797 1818 1855
Macedonia Former YR 254 101 383 755 1021 863 738 786 751 812 878 925 923
Moldova Rep 040 042 037 079 128 185 207 306 354 326 295 344 318
Norway 1334 1350 1319 1390 1444 1584 1599 1662 1748 1681 1607 1588 1550
Russian Fed 340 415 440 543 584 593 616 670 690 678 747 915 878
Serbia Montenegro 184 634 1066 143 926 552
Serbia 568 668 700 437 425 522 461
Montenegro 1318 1356 1338 1343 1040 1172 1170
Switzerland 1009 1019 1024 988 999 1001 992 1040 1085 1060 1042 1031 1016
Ukraine 122 115 165 183 143 532 584 643 605 497 473 548 540
North America 1287 1213 1222 1200 1186 1161 1159 1198 1162 1038 1193 1332 1392
Canada 1299 1308 1333 1338 1379 1391 1400 1431 1433 1431 1458 1475 1520
United States 1285 1203 1210 1185 1164 1136 1133 1172 1132 995 1164 1317 1377
Others 659 608 571 597 616 645 635 597 664 748 678 660 677
Japan 858 787 743 782 812 844 825 767 864 990 876 841 859
New Zealand 1753 1847 1700 1670 1619 1874 1932 1901 1869 1766 1862 1832 1809
South Arica 006 006 004 003 006 010 027 045 048 045 073 104 123
WORLD 404 382 388 407 413 422 443 459 475 451 477 512 492
8102019 Banana Import Export Global Stats
httpslidepdfcomreaderfullbanana-import-export-global-stats 21391616
Table 5 - Exports by countries of destination 1
Tableau 5 - Exportations par pays de destination 1
Cuadro 5 - Exportaciones por paiacuteses de destino 1
2002 2003 2004 2005 2006 2007 2008 2009 2010 2011 2012
(prel)
( thousand tonnes milliers de tonnes miles de toneladas )
BELIZE
O
United Kingdom 430 749 805 763 730 609 821 798 788 711 990
Others 06 20 04 126 03
TOTAL 430 749 805 763 730 611 827 818 792 837 993
BRAZIL
O
Argentina 1631 1297 914 979 561 583 339 522 385 231 354
Italy 208 234 171 191 128 86 70
Uruguay 395 401 423 478 429 393 388 364 372 338 350
United Kingdom 301 259 306 361 546 400 165 190 120 140 147
Others 84 251 30 69 236 290 290 276 448 392 107
TOTAL 2410 2208 1881 2121 1943 1857 1309 1439 1395 1101 957
COLOMBIA
O
Belgium-Lux 5669 4763 5707 6246 6048 5023 6122 5194 4162 5093 5397
United States 5682 4869 4634 5259 4802 4767 4884 6765 5478 4767 3173
UK 264 2563 2740 4468
Italy 1226 1193 1120 1006 721 991 1147 1801 2122 2236 2425
Russian Federation 147 177 501 311 184 215 52 04 35 China 191 - - - - - -
Saudi Arabia 05 66 27 - - - -
Germany 2064 1929 1351 1615 2086 3698 2882 2909 2181 3560 1532
Others 720 1235 1369 1778 3133 2798 2948 4032 1516 723 1355
TOTAL 1 5704 1 4232 1 4709 1 6215 1 6974 1 7492 1 7983 2 1018 1 8026 1 9153 1 8349
COSTA RICA
O
North America 8093 9276 8548 7911 9505 1 0382 8557 6569 8553 8832 8723
Europe 8133 9733 9376 8073 9462 9541 9112 8135 8654 8553 9960
Russian Federation 154 693 303 439 438 1546
Others 00 04 01 161 490 1670 364 868 563 1199 57TOTAL 1 6226 1 9013 1 7925 1 6145 1 9611 2 1592 1 8726 1 5875 1 8209 1 9022 2 0286
COcircTE DrsquoIVOIRE
O
France 1740 1288 1201 1432 1238 998 813 1333 871 494 707
UK 64 198 228 306 420 402 418 510 887 892 921
Germany 01 - 168 207 194
Italy 09 - 03 - 03
Belgium - Luxembourg 917 422 950 1218 1077 375 857 1130 1029
Senegal 140 131 144 149 200 213 214 179 239 167 210
Others 616 805 34 35 55 78 110 173 331 311 331
TOTAL 2560 2422 2524 2344 2864 2908 2643 2570 3356 3201 3394
8102019 Banana Import Export Global Stats
httpslidepdfcomreaderfullbanana-import-export-global-stats 22391717
Table 5 - Exports by countries of destination 1
Tableau 5 - Exportations par pays de destination 1
Cuadro 5 - Exportaciones por paiacuteses de destino 1
2002 2003 2004 2005 2006 2007 2008 2009 2010 2011 2012
(prel)
( thousand tonnes milliers de tonnes miles de toneladas )
DOMINICA
O
United Kingdom 164 134 133 118 118 72 105 364 39 41 23
Others 10 - 00 28 23 23 24 17 01 00 00 00
TOTAL 175 134 161 141 141 96 122 365 39 41 23
DOMINICAN REPUBLIC
O
Belgium-Lux 290 472 215 213 262 298 376 619 731 490 591
Italy 79 53 62 71 107 57 14 04 03 60 21United Kingdom 562 604 627 1271 1274 1585 1316 1669 2051 1 803 1 773
United States 34 26 41 33 72 17 04 20 02 05 09
Others 182 112 75 84 341 163 209 507 618 680 579
TOTAL 1147 1267 1020 1671 2056 2120 1919 2818 3404 3038 2972
ECUADOR
O
United States 1 1284 9382 9246 9562 9425 7297 8805 1 1445 1 0001 8942 7256
Italy 9337 1 1752 1 1745 1 1317 9455 9163 9439 1 0043 8401 7337 5906
Germany 5018 5232 4691 5200 4247 3202 5324 5250 4473 5740 4132
Belgium-Lux 2036 2140 2205 1686 2004 2633 3904 3189 3472 3187 2852
Russian Federation 8742 9766 1 0310 1 1439 9893 9103 1 3947 1 3151 1 0624 1 2140 1 1401Argentina 394 1095 1419 1227 1053 1120 2156 1955 1813 326 421
Chile 1678 2195 1847 1840 1893 1421 1857 1977 2076 3992 3955
Japan 1708 1552 1330 982 923 446 532 664 447 354 357
New Zealand 619 397 418 384 310 239 303 322 313 235 225
Poland 410 48 - 67 - 42 225 172 266 207
China 168 108 39 04 45 10 19 102 451
Iran - - - 39 - - - 10 21 24
Others 597 3201 2004 2823 8706 1 5943 4217 3088 1 2900 6805 1 6756
TOTAL 4 1992 4 6712 4 5370 4 6539 4 7978 5 0571 5 1328 5 4731 4 9450 5 3919 4 9821
GRENADA
OUnited Kingdom 06 04 04 03 02 05
TOTAL 06 04 04 - 03 02 05
GUATEMALA
O
United States 8259 9251 8617 8894 9216 6001 1 2215 1 3638 1 2652 1 3384 1 5841
United Kingdom - - - 04 10 10 51 15 11 16 28
Italy - - - 03 46 04 - 01 23 416 152
El Salvador 31 28 315 493 416 213 952 243 875 733 825
Others 1427 54 1206 1070 138 7076 329 167 130 1039 2362
TOTAL 9717 9333 1 0138 1 0463 9826 1 3304 1 3547 1 4064 1 3691 1 5588 1 9208
8102019 Banana Import Export Global Stats
httpslidepdfcomreaderfullbanana-import-export-global-stats 23391818
Table 5 - Exports by countries of destination 1
Tableau 5 - Exportations par pays de destination 1
Cuadro 5 - Exportaciones por paiacuteses de destino 1
2002 2003 2004 2005 2006 2007 2008 2009 2010 2011 2012
(prel)
( thousand tonnes milliers de tonnes miles de toneladas )
HONDURAS
O
United States 3913 3915 4984 4535 4569 4586 5656 4829 4560 4598 8022
Belgium-Lux 155 84 183 226 212 215 122 73 154 155 270
Germany
Italy 09
United Kingdom 13 46 07 26 26 45
Others 324 436 110 250 381 900 233 288 384 387 676
TOTAL 4414 4434 5277 5011 5162 5701 6057 5197 5124 5166 9014
JAMAICA
O
United Kingdom 399 418 287 116 319 174 00 00 00 00 00
Others 00 - 00 00 00 00 00 00 00 00 00 00
TOTAL 399 418 287 116 319 174 00 00 00 00 00
MEXICO
O
United States 334 277 363 379 429 367 593 1238 1552 1635 2499
Japan 54 47 37 30 29
Spain 01 56 64 70 54
Russian Fed 01 23 09 01 01Others 24 122 53 323 237 49 100 36 78 40 492
TOTAL 358 399 416 702 666 416 749 1401 1741 1776 3075
PANAMA
O
Germany 162 131 166 22 118 01 46 - 28 05 29
United States - - 06 59 175 136 266 47 281 340 150
Belgium-Lux 1201 888 739 578 765 716 91 30 78 00 00
Portugal 1056 1031 817 430 415 438 101 65 113 196 160
Sweden 1743 1785 2093 1922 2129 2331 2315 1385 1855 1530 1391
Italy - - 66 116 160 88 490 57 49 179 123
Others 22 267 93 356 549 676 358 989 320 419 596TOTAL 4185 4102 3980 3483 4311 4386 3666 2572 2724 2669 2450
PHILIPPINES
O
Japan 8477 8840 9152 9182 9095 9142 1 1065 9138 7921 8922 1 0848
Iran 93 304 1699 2234 3727 4287 4013 2506 2196 1497 990
Saudi Arabia 507 01 102 187 65 217 120 95 78 1161
China 3788 4156 3309 3512 3815 2034 1815 983 1658 4034 4220
China Hong Kong SAR 04 243 201 199 152 190 383 223 75 198 903
Korea Rep o 1519 1588 1386 2341 2649 2756 1866 1321 1133 1979 2655
United Arab Emirates 2092 2002 1576 1799 2075 1672 711 572 789 1016 2628
Others 370 1161 650 874 1415 2031 1857 1778 2034 2831 3056
TOTAL 1 6850 1 8294 1 7973 2 0243 2 3115 2 2177 2 1926 1 6641 1 5901 2 0555 2 6461
8102019 Banana Import Export Global Stats
httpslidepdfcomreaderfullbanana-import-export-global-stats 24391919
Table 5 - Exports by countries of destination 1
Tableau 5 - Exportations par pays de destination 1
Cuadro 5 - Exportaciones por paiacuteses de destino 1
2002 2003 2004 2005 2006 2007 2008 2009 2010 2011 2012
(prel)
( thousand tonnes milliers de tonnes miles de toneladas )
PERU
O
United States 112 135 122 231 264 179 239 198 198 235 278
Belgium 39 22 61 92 100 48 72 38 71 55 72
Netherlands 03 02 47 59 115 277 320 432 457 609 659
Germany 33 - 04 04 44 67 57 34 59 32 55
Japan 01 34 42 44 79 73 101 79 88 118
Others 04 20 04 01 04 05 22 30 30 69 57
TOTAL 191 181 273 429 571 655 782 833 894 1088 1238
SAINT LUCIA
O
United Kingdom 493 348 417 300 341 239 393 332 232 61 120
Others 00 00 14 07 08 17 19 00 00 01 01
TOTAL 493 348 431 307 349 256 412 332 232 62 121
STVINCENT amp GRENADINES
O
United Kingdom 344 285 240 204 180 182 114 75 41 08 07
Others 25 00 00 48 58 66 100 106 81 102 103
TOTAL 369 285 240 252 238 248 214 181 121 110 110
SURINAME
O
United Kingdom 280 - 47 98 11
France 62 257 454 562 654 570
Others 00 104 40 09 - 00 - 00 00 791 629 831
TOTAL 280 01 214 396 474 562 654 570 791 629 831
1 As declared by exporting countries1 Comme declareacute par les pays exportateurs1 De acuerdo a lo declarado por los paiacuteses exportadores
8102019 Banana Import Export Global Stats
httpslidepdfcomreaderfullbanana-import-export-global-stats 25392020
Table 6 - Gross Imports by countries of origin 1
Tableau 6 - Importations brutes par pays drsquoorigine 1
Cuadro 6 - Importaciones brutas por paiacuteses de origen 1
2002 2003 2004 2005 2006 2007 2008 2009 2010 2011 2012
(prel)
( thousand tonnes milliers de tonnes miles de toneladas )
ARGENTINA
FROM
Ecuador 471 1168 1600 1415 1658 1840 2149 1973 2127 2397 2245
Brazil 1648 1293 903 981 561 583 338 523 386 232 394
Bolivia 146 249 407 557 641 647 706 780 753 994 873
Others 31 153 123 70 97 119 275 165 245 326 254
TOTAL 2295 2864 3033 3022 2957 3189 3468 3441 3511 3949 3766
CANADAFROM
Costa Rica 881 1196 1061 927 881 1253 1154 710 1058 1178 1159
Ecuador 1282 1048 821 780 942 1003 1210 1642 1472 1104 1392
Colombia 1202 1149 1297 1637 1741 1379 1218 1289 1145 963 1298
Honduras 310 287 353 206 101 235 292 175 295 274 275
Mexico 111 102 47 10 20 15 28 16 14 20 20
Guatemala 310 429 782 855 794 754 814 931 897 1475 1055
Panama 01 00 - 19 53 39 29 25 37 10 30
Dominican Rep 02 01 07 01 06 04 01 02 01 01 02
Others 75 17 56 55 42 36 31 31 41 41 39TOTAL 4174 4228 4423 4490 4580 4718 4776 4820 4961 5066 5270
CHILE
FROM
Ecuador 1472 1569 1585 1670 1630 1698 1659 1730 1738 1766 1825
Others 19 20 18 283 59 84 91 63 19 78 81
TOTAL 1491 1589 1602 1953 1689 1782 1750 1793 1757 1844 1906
CHINA
FROM
Philippines 2665 3111 2858 3038 3434 3038 3178 3521 4367 6939 4964
Ecuador 284 285 241 154 42 30 70 22 89 477
Tailand 06 18 57 96 138 152 176 104 163 225
Myanmar 01 01 44 943 1770 549 445
Vietnam 424 798 652 268 292 100 217 192 315 393 93
Others 98 00 01 00 152 02 03 11 74 55 142
TOTAL 3478 4212 3809 3557 3878 3319 3623 4913 6652 8187 6346
8102019 Banana Import Export Global Stats
httpslidepdfcomreaderfullbanana-import-export-global-stats 26392121
Table 6 - Gross Imports by countries of origin 1
Tableau 6 - Importations brutes par pays drsquoorigine 1
Cuadro 6 - Importaciones brutas por paiacuteses de origen 1
2002 2003 2004 2005 2006 2007 2008 2009 2010 2011 2012
(prel)
( thousand tonnes milliers de tonnes miles de toneladas )
EC (27) 2
FROM
Ecuador 1 1570 1 1488 1 1208 1 2392 1 1993 1 1858 1 3306 1 3431 1 2242 1 3412 1 3074
Colombia 7680 7992 7665 8824 9514 1 1561 1 2782 1 2408 1 1610 1 1366 1 1344
Costa Rica 7463 8020 8564 6345 8340 9714 8951 7572 7765 8450 7702
Panama 3962 3815 3708 2816 3130 3541 2946 1851 1844 1597 1436
Cote drsquoIvoire 2167 2074 2108 1838 2218 1894 2166 2292 2443 2241 2249
Cameroon 2365 2985 2612 2529 2527 2218 2795 2497 2430 2352 2139
Dominican Rep 973 1119 1013 1447 1768 2064 1705 2283 3037 3269 2946
Peru 68 57 96 115 227 336 389 441 516 658 814
Belize 387 738 803 742 732 624 821 798 788 711 993
Ghana 33 09 18 42 223 341 460 365 524 472 507
Saint Lucia 493 325 429 282 367 305 385 333 232 62 121
Jamaica 406 418 287 117 319 184 - - - -
Honduras 345 252 212 231 218 316 240 85 152 175 57
Saint Vincent amp the Grenadines 325 209 240 159 172 138 90 75 41 08 07
Guatemala 10 69 22 30 307 188 143 49 33 30 46
Dominica 175 105 122 128 133 73 103 369 37 41 23
Others 569 682 1007 1244 1549 1563 1593 611 1469 1272 1483
TOTAL 3 8991 4 0358 4 0112 3 9281 4 3737 4 6917 4 8873 4 5459 4 5161 4 6114 4 49412 Source European Community
JAPAN
FROM
Philippines 7435 7956 8696 9445 9106 8790 1 0193 1 1591 1 0355 1 0044 1 0267
Ecuador 1570 1456 1227 911 1013 521 462 618 461 343 359
China 251 335 182 151 159 189 90 88 95 84 84
Indonesia - - - - - - - - - - -
Others 106 120 154 162 158 207 182 229 180 170 154
TOTAL 9363 9866 1 0260 1 0669 1 0436 9706 1 0927 1 2526 1 1091 1 0641 1 0864
NEW ZEALAND
FROM
Ecuador 562 308 291 354 326 308 273 258 288 250 279
Philippines 110 360 356 419 481 493 526 500 524 556 526
Panama - - 14 01 01
Others 01 03 01 00 00 04 00 04 01 02 03
TOTAL 673 672 661 775 809 805 800 763 813 809 807
8102019 Banana Import Export Global Stats
httpslidepdfcomreaderfullbanana-import-export-global-stats 27392222
Table 6 - Gross Imports by countries of origin 1
Tableau 6 - Importations brutes par pays drsquoorigine 1
Cuadro 6 - Importaciones brutas por paiacuteses de origen 1
2002 2003 2004 2005 2006 2007 2008 2009 2010 2011 2012
(prel)
( thousand tonnes milliers de tonnes miles de toneladas )
NORWAY
FROM
Panama 07 28 34 54 68 77 108 92 100 97 95
Costa Rica 260 307 339 425 382 373 343 239 244 261 256
Ecuador 52 67 88 95 175 160 183 300 276 329 324
Colombia 276 223 187 136 79 152 181 162 148 77 75
Others 04 10 14 22 41 21 20 19 18 18 18
TOTAL 598 634 662 732 746 785 835 812 785 782 769
ROMANIA
FROM
Ecuador 547 341 973 1272 1357
Colombia 60 19 39 29 39
Costa Rica 12 17 52 101 55
Honduras 28 28 40
Others 19 52 05 01 53
TOTAL 639 429 1097 1432 1543
RUSSIAN FEDERATION
FROM
Ecuador 5922 7233 7892 7911 7976 9202 9030 9112 9766 1 1999 1 1530
Costa Rica 09 175 10 155 275 21 659 326 482 386 446
China 65 54 41 26 15 30
Colombia 157 212 393 280 205 219 02 52 95 182 123
Vietnam 13 13 12 03 03 08 04
Philippines 139 208 232 212 304 251 315 245 298 355 335
Others 259 180 30 92 194 27 05 25 16 139 72
TOTAL 6500 8021 8569 8649 8954 9787 1 0068 9809 1 0686 1 3076 1 2536
SWITZERLAND
FROM
Costa Rica 383 367 294 278 240 264 184 172 161 156 154
Panama 70 40 40 65 98 125 204 155 165 118 117
Colombia 131 126 175 133 129 87 96 131 132 185 183
Ecuador 55 74 136 180 207 239 250 250 234 224 222
Honduras 01 06 06 01 - -
Others 104 109 84 85 67 68 87 100 106 111 110
TOTAL 743 722 735 742 741 782 821 808 799 794 786
8102019 Banana Import Export Global Stats
httpslidepdfcomreaderfullbanana-import-export-global-stats 28392323
Table 6 - Gross Imports by countries of origin 1
Tableau 6 - Importations brutes par pays drsquoorigine 1
Cuadro 6 - Importaciones brutas por paiacuteses de origen 1
2002 2003 2004 2005 2006 2007 2008 2009 2010 2011 2012
(prel)
( thousand tonnes milliers de tonnes miles de toneladas )
SLOVAKIA
FROM
Ecuador 58 63 15
Costa Rica 135 195 77
Colombia 163 161 60
Panama 119 89 35
Others 12 25 312
TOTAL 487 533 499
TUNISIAFROM
Cameroon 05 - 02 - - 01 05 - - -
Cocircte DrsquoIvoire - - 07 21 38 51 01 - -
Colombia 24 - 30 11 02 46 11 - - 03
Costa Rica - - 10 06 - - 01 18 53 44
Ecuador 133 138 491 169 161 289 313 349 134 366
Others 00 00 03 02 01 23 05 04 00 - 00
TOTAL 163 138 543 208 203 410 335 371 187 413
UNITED STATESFROM
Costa Rica 9015 9761 8653 8227 9274 1 0369 8744 5629 8536 8445 8482
Ecuador 1 0218 9725 9189 9043 9943 9292 8303 9576 9798 8790 7197
Honduras 4492 4321 5079 4530 4229 4827 5056 3887 4357 4452 5357
Guatemala 9252 9341 1 0208 1 0293 9129 1 0934 1 1887 1 1122 1 1515 1 3335 1 4586
Colombia 5064 4693 4646 5137 4738 3772 4508 4216 4609 3845 4402
Mexico 423 352 336 338 386 315 663 1052 1455 1486 2233
Panama 03 02 06 20 75 05 80 54 290 278 592
Nicaragua 297 416 415 381 305 328 311 249 360 356 363
Peru 232 138 124 223 251 178 225 197 201 232 259
Venezuela 37 19 20 07 03 - - - - - -
Dominican Rep 36 21 52 44 62 17 01 10 01 07 27
Others 01 02 00 00 - 00 00 00 00 26 01 - 00
TOTAL 3 9070 3 8792 3 8728 3 8244 3 8395 4 0038 3 9779 3 5992 4 1149 4 1227 4 3497
URUGUAY
FROM
Brazil 408 402 430 457 424 384 382 321 436 390 292
Ecuador 28 01 03 16 19 35 48 42 65 115 142
Others 02 07 04 00 04 01 - 00 53 05 09 14
TOTAL 438 411 437 473 446 420 430 416 506 515 4471 Figures may differ rom those shown in able 3 (a) which exclude re-exports1 Les chiffres dans ce tableau peuvent differer des chiffres du ableau 3 (a) qui ne comprennent pas les reacuteexportations1 Las ciras pueden dierir de las del Cuadro 3 (a) las cuales excluyen las reexportaciones
8102019 Banana Import Export Global Stats
httpslidepdfcomreaderfullbanana-import-export-global-stats 29392424
Table 7 - Import prices in selected countries monthly Tableau 7 - Prix agrave lrsquoimportation mensuels dans certains paysCuadro 7 - Precios mensuales de importacioacuten en algunos paiacuteses
FRANCE
2001 2002 2003 2004 2005 2006 2007 2008 2009 2010 2011 2012 2013
( Euro tonnes )
January 572 547 620 474 623 630 620 - 658 524 794 678 770
February 636 723 628 500 753 770 700 780 720 623 923 820 820
March 865 733 698 640 798 690 700 843 962 720 755 820 770
April 795 608 600 603 810 640 698 820 878 680 760 808 763
May 652 546 528 568 860 608 633 593 715 686 680 730 710
June 580 478 476 615 888 585 594 588 668 755 513 695 688
July 565 340 360 485 498 380 565 605 528 624 440 590 660
August 550 488 298 480 664 510 608 658 490 610 483 600 660
September 615 537 460 430 753 510 338 650 563 590 573 690 660
October 530 407 383 383 673 490 - 583 538 505 586 706 618
November 410 320 410 553 723 590 - 568 527 550 605 665 623
December 460 580 490 660 716 620 - 610 545 700 580 682 660
YEAR 603 525 496 533 730 585 606 663 649 631 641 707 700
USD ton 539 494 560 661 907 734 829 972 902 835 891 908 957
JAPAN2001 2002 2003 2004 2005 2006 2007 2008 2009 2010 2011 2012 2013
( Yen tonnes )
January 44 700 54 800 54700 52700 54900 46400 57700 55300 68100 55000 53000 52100 67800
February 49 100 66 000 60000 56600 56600 58200 64200 58400 69900 61900 56500 56900 71200
March 50 700 71 600 62700 65900 64600 58200 66400 63800 72600 68800 64500 65200 77100
April 54 000 83 200 66800 76400 66800 62900 79300 79100 82100 78300 74100 72200 82100
May 60 500 84 400 72800 70200 61600 64600 78700 82600 88300 77800 78500 72300 92500
June 54 400 80 100 68800 70900 65700 63600 73100 80800 88100 74700 75800 71100 89600
July 53 800 78 700 66400 64300 61900 63600 65000 83500 85500 71700 86200 69600 86600
August 56 500 64 000 68300 52800 60400 61200 64100 84300 81200 69400 72600 66400
September 60 600 65 900 69200 56500 60900 64600 72000 90900 74300 68500 68200 62000
October 53 500 63 700 58200 55100 57000 65100 65700 85600 64200 60900 61600 61000
November 48 700 54 400 51600 55600 49500 60600 59000 80400 58100 48500 60600 59100
December 48 900 50 800 49100 56100 47900 55300 56500 67100 52100 52100 55400 59900
YEAR 52 950 68 133 62 383 61 092 58 983 60 358 66 808 75 983 73 708 65 633 67 250 63 983 80986
USD kg 436 543 538 565 535 519 567 735 788 748 843 802 829
8102019 Banana Import Export Global Stats
httpslidepdfcomreaderfullbanana-import-export-global-stats 30392525
Table 7 - Import prices in selected countries monthly Tableau 7 - Prix agrave lrsquoimportation mensuels dans certains paysCuadro 7 - Precios mensuales de importacioacuten en algunos paiacuteses
UNITED STATES
2001 2002 2003 2004 2005 2006 2007 2008 2009 2010 2011 2012 2013
( USD tonnes )
January 535 427 561 427 589 686 639 689 820 785 892 945 929
February 687 517 462 496 891 854 655 792 944 720 1 002 1 068 923
March 541 572 486 513 792 825 648 1027 909 838 996 1 144 937
April 551 544 384 529 593 730 648 967 890 825 1 027 1 030 903
May 637 626 296 556 618 926 689 923 830 799 1 011 953 909
June 610 648 308 604 486 655 779 868 854 962 976 954 910
July 698 537 296 61 401 560 734 722 827 985 961 965 923
August 683 420 286 548 405 542 697 799 834 899 951 951 940
September 572 486 312 539 594 544 665 803 818 880 947 965 937
October 484 544 328 496 630 549 659 807 810 916 954 956 931
November 496 396 408 492 589 598 651 903 834 908 956 934 923
December 506 625 370 496 646 658 648 830 796 900 942 944 923
YEAR 583 529 375 480 603 677 676 844 847 868 968 984 924
EUROPEAN UNION
2001 2002 2003 2004 2005 2006 2007 2008 2009 2010 2011 2012 2013
( Euro tonnes )
January 590 590 590 590 610 580 600 600 570 630 610 610
February 610 590 600 610 600 590 560 610 580 640 620 620
March 630 610 640 660 600 590 620 660 600 630 630 620
April 640 620 620 630 610 580 640 660 620 620 640
May 620 590 640 640 590 590 610 630 610 610 630
June 600 590 640 680 570 580 590 630 640 600 630
July 560 560 620 610 550 570 590 600 630 590 620
August 600 540 600 610 530 550 580 590 600 570 630
September 610 570 600 630 550 570 610 570 600 580 620
October 580 580 590 620 550 580 600 570 600 590 610November 560 560 600 640 580 580 590 580 600 580 620
December 590 580 620 630 570 560 600 550 610 610 620
YEAR 599 582 613 629 576 577 599 604 605 604 623 617
USD ton 564 656 762 782 722 789 878 839 801 840 801 843
8102019 Banana Import Export Global Stats
httpslidepdfcomreaderfullbanana-import-export-global-stats 31392626
Table 7 - Import prices in selected countries monthly Tableau 7 - Prix agrave lrsquoimportation mensuels dans certains paysCuadro 7 - Precios mensuales de importacioacuten en algunos paiacuteses
HUNGARY
2001 2002 2003 2004 2005 2006 2007 2008 2009 2010 2011 2012 2013
( Forint tonnes )
January 40 000 74 000 115 000 105 000 62 000 181 000 181 000 186 000 188 000 158000 210000 197000
February 39 000 76 000 119 000 109 000 171 000 189 000 189 000 210 000 221 000 172000 213000 236000
March 39 000 83 000 122 000 105 000 179 000 185 000 178 000 226 000 268 000 195000 197000 224000
April 40 000 105 000 137 000 112 000 164 000 190 000 174 000 200 000 241 000 180000 198000 225000
May 39 000 112 000 104 000 176 000 180 000 176 000 160 000 160 000 205 000 200000 185000 211000
June 37 000 108 000 108 000 157 000 184 000 177 000 151 000 149 000 207 000 220000 157000 202000
July 47 000 76 000 105 000 137 000 136 000 129 000 138 000 142 000 186 000 174000 141000 172000
August 45 000 81 000 90 000 104 000 140 000 148 000 151 000 161 000 179 000 160000 150000 187000
September 46 000 104 000 76 000 123 000 152 000 147 000 178 000 165 000 162 000 161000 162000 207000
October 47 000 93 000 98 000 159 000 149 000 145 000 159 000 160 000 151 000 173000 167000 196000
November 61 000 86 000 88 000 242 000 164 000 175 000 160 000 164 000 154 000 176000 165000 192000
December 76 000 92 000 96 000 245 000 163 000 167 000 174 000 181 000 155 000 204000 174000 208000
YEAR 46 333 90 833 104 833 147 833 153 667 167 417 166 083 175 333 193 083 181 083 176 583 204 750
USD ton 162 352 467 729 770 796 904 1 019 954 871 878 910
THE PEOPLErsquoS REPUBLIC OF CHINA (MAILAND)2001 2002 2003 2004 2005 2006 2007 2008 2009 2010 2011 2012 2013
( USD tonnes )
January 250 227 284 295 308 317 377 412 389 491 574
February 243 212 250 297 290 312 374 407 340 428 538
March 196 197 209 274 234 312 332 274 361 403 522
April 207 212 179 267 285 331 332 312 403 428 523
May 205 191 199 274 250 332 405 377 406 437 534
June 218 188 241 271 303 336 409 399 428 484 574
July 228 191 244 267 325 339 41 411 426 526 646
August 195 173 247 240 319 325 381 379 406 528 672
September 202 244 270 276 317 326 394 432 460 534 677
October 213 233 295 290 329 342 375 408 472 501 650
November 220 251 272 292 328 353 403 424 462 541 658
December 215 266 279 296 326 371 398 281 258 577 616
YEAR 216 215 247 278 301 333 352 376 401 490 599
Source United States official dataJapan Monthly Bulletin o Banana Statistics Japan Banana Importersrsquo AssociationFrance Marcheacutes Europeacuteens des Fruits et Leacutegumes Revue drsquoInormation Economique
8102019 Banana Import Export Global Stats
httpslidepdfcomreaderfullbanana-import-export-global-stats 32392727
Table 8 - Wholesalersrsquo selling prices in selected countries monthly Tableau 8 - Prix de vente en gros mensuels dans certains paysCuadro 8 - Precios mensuales de venta al por mayor en algunos paiacuteses
JAPAN
2001 2002 2003 2004 2005 2006 2007 2008 2009 2010 2011 2012 2013
( Yen kgs )
January 81 117 107 106 103 96 120 129 160 126 121 121 139
February 98 135 133 109 115 122 142 145 157 144 129 124 150
March 101 146 130 139 132 120 157 155 151 146 140 130 161
April 123 155 133 149 123 117 167 159 162 142 148 135 172
May 128 154 144 140 119 126 163 154 165 140 145 135 169
June 103 153 131 138 122 122 145 153 160 142 140 133 161
July 112 148 128 119 115 115 135 152 149 141 133 130 153August 106 116 125 101 112 115 134 150 140 135 122 125
September 113 130 126 108 115 128 138 158 137 129 125 119
October 101 128 117 113 107 134 132 178 130 120 133 118
November 102 102 98 113 98 123 128 164 122 101 131 116
December 97 95 98 109 80 111 125 151 116 101 122 121
YEAR 105 132 123 120 112 119 141 154 146 131 132 126 158
USD kg 087 105 106 111 101 102 119 149 156 149 166 157 162
UNITED STATES
2001 2002 2003 2004 2005 2006 2007 2008 2009 2010 2011 2012 2013
( USD kgs )
January 062 064 064 060 059 069 080 075 118 092 101 095 099
February 072 060 064 064 064 101 080 099 112 099 112 117 099
March 077 066 070 055 082 102 079 136 110 101 108 141 101
April 074 067 067 058 069 090 074 133 109 101 105 121 101
May 085 068 062 059 073 104 082 128 105 099 103 106 095
June 070 072 059 066 074 088 084 106 104 106 105 097 094
July 083 065 061 056 058 065 078 096 101 118 096 096 094
August 081 061 058 048 049 061 074 093 101 099 095 096 094
September 080 061 057 047 061 067 082 094 099 088 092 105 094
October 067 056 056 048 066 069 079 096 094 099 091 104 092
November 058 054 055 046 061 065 072 093 091 094 092 099 090
December 063 061 057 055 073 072 069 093 090 096 096 097 088
YEAR 073 063 061 055 066 079 078 104 103 099 100 106 095
8102019 Banana Import Export Global Stats
httpslidepdfcomreaderfullbanana-import-export-global-stats 33392828
Table 8 - Wholesalersrsquo selling prices in selected countries monthly Tableau 8 - Prix de vente en gros mensuels dans certains paysCuadro 8 - Precios mensuales de venta al por mayor en algunos paiacuteses
FRANCE
2001 2002 2003 2004 2005 2006 2007 2008 2009 2010 2011 2012 2013
( Euro kg )
January 084 079 093 081 100 098 090 090 085 079 101 087 104
February 093 095 097 082 112 107 097 105 094 083 122 104 107
March 115 107 103 097 120 103 099 113 122 093 106 105 105
April 115 103 094 093 114 094 097 104 110 094 095 105 105
May 099 090 079 093 112 091 090 081 096 093 091 105 101
June 086 078 080 094 126 094 086 081 091 096 079 105 097
July 092 069 063 082 089 071 078 081 080 085 074 092 090August 081 073 059 074 098 068 081 085 075 080 074 091 092
September 086 080 078 077 106 073 094 084 079 081 080 100 095
October 081 068 076 075 097 074 082 079 081 074 081 102 093
November 075 062 074 085 097 086 075 077 076 079 083 095 092
December 074 082 076 105 102 090 085 081 083 092 081 095
YEAR 090 082 081 086 106 087 088 088 089 086 089 099 098
USD kg 081 077 091 107 132 109 120 130 124 114 124 127 134
EUROPEAN UNION
2001 2002 2003 2004 2005 2006 2007 2008 2009 2010 2011 2012 2013
( Euro kg )
January 094 095 089 097 101 101 102 101 094 113 101 110
February 102 099 091 107 104 104 117 106 094 122 113 108
March 112 105 096 111 102 104 128 125 106 113 117 105
April 114 105 096 111 098 103 122 124 110 111 116 107
May 106 093 093 118 095 100 103 112 111 111 113 108
June 095 091 094 125 094 098 096 112 114 100 110 110
July 078 074 084 099 080 094 094 100 104 091 101
August 088 074 075 097 078 093 093 095 097 090 102
September 093 080 078 107 081 101 091 096 099 092 109
October 084 081 079 103 079 100 095 096 094 094 108
November 077 081 083 104 083 093 096 093 096 094 105
December 085 086 098 104 089 098 097 095 104 095 103
YEAR 094 089 088 107 090 099 103 105 102 102 108 108
USD kg 088 100 109 133 113 136 151 145 135 142 139 148
8102019 Banana Import Export Global Stats
httpslidepdfcomreaderfullbanana-import-export-global-stats 34392929
Table 8 - Wholesalersrsquo selling prices in selected countries monthly Tableau 8 - Prix de vente en gros mensuels dans certains paysCuadro 8 - Precios mensuales de venta al por mayor en algunos paiacuteses
THE PEOPLErsquoS REPUBLIC OF CHINA (MAILAND)
2001 2002 2003 2004 2005 2006 2007 2008 2009 2010 2011 2012 2013
( RMB kg )
January 294 305 333 282 309 310 357 351 304 433 494 385
February 376 319 316 292 324 345 375 343 346 475 508 431
March 369 288 319 275 342 380 366 345 356 511 486 451
April 370 285 342 276 368 334 383 391 407 611 465 478
May 301 278 355 274 386 289 371 457 456 566 432 526
June 264 260 338 272 386 257 356 444 483 415 414 527July 228 249 292 265 339 228 313 408 435 336 379
August 224 249 277 265 270 239 313 383 397 344 373
September 240 273 268 315 324 276 341 356 397 401 378
October 232 270 259 314 285 304 345 329 369 443 397
November 218 290 271 306 276 294 372 300 370 495 386
December 235 311 272 304 291 314 342 288 398 497 380
YEAR 279 281 304 287 325 298 353 366 393 461 424 466
USD kg 034 034 037 035 041 039 051 054 058 071 067 077
URUGUAY
2001 2002 2003 2004 2005 2006 2007 2008 2009 2010 2011 2012 2013
( Pesos uruguayos kg )
January 947 1041 981 1134 1384 1708 1799 1792 2014 1888
February 715 861 886 1160 1309 1603 1766 1605 1803 2102
March 892 937 859 1185 1394 1634 1812 187 1777 2174
April 1064 1025 925 1393 1433 1625 1927 1809 1802 2609
May 920 825 873 1111 1285 1519 1825 169 1744 2057
June 833 843 735 1157 1225 1545 1784 1758 174 2069
July 875 888 730 1267 1588 1874 176 1752 2195
August 837 974 893 1221 1414 1659 1969 182 1814 2092
September 891 887 1041 1256 1531 1607 1928 1844 1843 1909
October 1128 843 1248 1594 1545 1795 1963 1891 1867 1992
November 1107 812 1260 1478 1647 2068 1916 1944 1837 1915
December 860 925 1232 1397 2088 2001 1750 2174 1957
YEAR 922 905 972 1279 1478 1696 1859 1830 1829 2091
USD kg 033 032 040 053 063 081 082 091 095 103
8102019 Banana Import Export Global Stats
httpslidepdfcomreaderfullbanana-import-export-global-stats 35393030
Table 8 - Wholesalersrsquo selling prices in selected countries monthly Tableau 8 - Prix de vente en gros mensuels dans certains paysCuadro 8 - Precios mensuales de venta al por mayor en algunos paiacuteses
UNITED KINGDOM2001 2002 2003 2004 2005 2006 2007 2008 2009 2010 2011 2012 2013
( pence kg )
January 370 570 570 530 630 690 610 720 700 550 950 767 787
February 600 650 600 460 790 670 610 900 730 590 1020 877 778
March 760 720 700 550 690 560 570 850 1090 730 730 975 704
April 750 670 600 530 750 550 590 760 990 770 800 803 773
May 700 630 540 540 910 640 580 680 880 830 820 779 790
June 660 530 520 610 870 660 560 600 930 940 620 772 710
July 600 430 390 530 590 490 520 630 670 790 570 734 714
August 550 490 450 460 690 500 570 660 640 750 590 699
September 590 520 490 530 770 530 650 670 660 740 650 776
October 500 480 440 460 680 530 570 580 650 600 600 655
November 480 400 430 530 680 480 520 610 550 630 590 632
December 470 540 380 650 600 540 530 620 560 690 630 651
YEAR 586 553 509 532 721 570 573 690 754 718 714 760 751
USD kg 084 083 083 097 131 105 115 127 117 111 114 120 121
BANANA ORGANIC
USA
2008 2009 2010 2 011 2012 2013
( USD kg )
January 112 138 131 127 134 136
February 112 138 127 140 138 132
March 154 138 128 142 138 125
April 160 138 127 129 141 127
May 147 138 135 141 135
June 152 138 138 140 138
July 137 138 134 138 138
August 136 134 138 138 131
September 138 125 142 136 135
October 138 129 138 135 138
November 138 134 123 136 135
December 134 131 127 134 137
YEAR 138 135 132 136 136 131
SourceUnited States USDA C amp MS Fruit and Vegetable Division Market News daily reports
Japan Monthy Bulletin o Banana Statistics Japan Banana Importersrsquo Association
8102019 Banana Import Export Global Stats
httpslidepdfcomreaderfullbanana-import-export-global-stats 36393131
Table 9 - Retail prices in selected countries monthly Tableau 9 - Prix mensuels au detail dans certains paysCuadro 9 - Precios mensuales al por menor en algunos paiacuteses
FRANCE
2001 2002 2003 2004 2005 2006 2007 2008 2009 2010 2011 2012 2013
( Euro kg )
January 150 151 162 150 163 173 160 165 160 156 170 162 175
February 157 164 167 152 178 176 163 172 164 156 185 170 182
March 169 181 171 156 182 177 166 179 175 164 188 177 181
April 185 182 174 162 185 172 168 188 190 169 180 184 184
May 180 177 162 158 193 169 168 176 179 167 178 180 181
June 171 171 162 161 203 169 165 169 174 173 173 178 184
July 174 148 151 158 187 163 163 169 168 173 167 178 184
August 162 145 144 147 165 154 157 168 158 166 160 172 180
September 161 155 143 138 172 152 163 165 155 162 157 170 176
October 158 144 143 143 169 147 166 163 157 159 158 172 175
November 151 139 140 140 168 154 160 158 154 157 162 175 175
December 145 141 147 161 174 157 163 158 153 163 161 175 176
YEAR 164 158 156 152 178 164 164 169 166 164 170 174 179
USD kg 146 149 176 189 222 205 224 248 230 217 236 224 245
HUNGARY2001 2002 2003 2004 2005 2006 2007 2008 2009 2010 2011 2012 2013
( Forint kg )
January 251 263 293 251 309 345 329 338 348 323 374 358 399
February 239 263 283 249 313 339 334 348 364 323 421 407 407
March 246 280 283 261 340 339 326 392 421 338 427 425 408
April 284 312 286 276 343 345 338 410 468 357 396 424 404
May 247 302 270 289 347 345 336 361 431 349 392 419
June 221 288 264 310 376 356 319 332 406 371 364 398
July 257 247 248 303 343 340 314 311 389 377 319 372
August 239 248 249 281 317 327 316 313 351 362 297 361
September 252 272 252 258 324 328 329 319 340 361 306 381
October 244 253 250 258 325 302 338 318 331 326 324 395
November 229 233 234 254 345 316 326 303 320 330 343 394
December 245 252 232 294 339 320 320 307 309 350 343 376
YEAR 246 268 262 274 335 334 327 338 373 347 359 393 405
USD ton 086 104 117 135 168 159 178 196 184 167 178 174 188
8102019 Banana Import Export Global Stats
httpslidepdfcomreaderfullbanana-import-export-global-stats 37393232
Table 9 - Retail prices in selected countries monthly Tableau 9 - Prix mensuels au detail dans certains paysCuadro 9 - Precios mensuales al por menor en algunos paiacuteses
UNITED STATES
2001 2002 2003 2004 2005 2006 2007 2008 2009 2010 2011 2012 2013
( USD kg )
January 108 112 116 113 107 108 111 115 139 129 131 133 134
February 116 111 112 111 111 112 112 119 141 129 138 133 135
March 114 114 113 110 112 112 112 132 140 127 137 134 134
April 112 111 113 111 111 112 114 138 139 128 137 133 132
May 112 114 111 108 110 113 111 139 137 126 136 132 133
June 112 113 115 110 109 113 113 140 139 127 135 133 133
July 113 114 113 112 109 112 112 138 136 129 135 133 133
August 108 110 113 112 107 108 112 140 135 127 134 131 131
September 108 110 109 108 107 106 111 139 133 126 134 132 132
October 109 111 108 107 108 108 112 138 132 128 134 133 129
November 106 111 110 103 106 108 114 138 124 128 132 132 129
December 107 111 111 104 106 110 116 136 126 129 132 134 131
YEAR 110 112 112 109 109 110 113 134 135 128 135 133 132
JAPAN
2001 2002 2003 2004 2005 2006 2007 2008 2009 2010 2011 2012 2013
( Yen kg )
January 218 225 235 232 243 222 236 217 224 225 221 207
February 224 239 241 249 239 230 236 226 235 228 220 201
March 237 260 243 248 242 240 238 229 238 232 225 207
April 237 257 241 257 238 251 244 226 255 229 227 211
May 262 262 242 260 245 250 240 226 252 236 218 205
June 282 258 229 262 250 253 240 231 248 227 216 200
July 278 254 229 262 252 246 229 232 240 226 220 200
August 308 246 219 261 241 229 232 232 241 222 210 202
September 295 257 229 257 240 230 232 231 239 230 215 205
October 279 259 230 259 239 235 227 228 238 219 225 194November 255 260 223 245 231 231 222 221 236 218 216 193
December 233 241 220 237 220 230 219 221 233 218 193
YEAR 259 252 232 252 240 237 233 227 240 226 219 202
USD kg 213 201 200 233 218 204 198 219 256 257 275 253
8102019 Banana Import Export Global Stats
httpslidepdfcomreaderfullbanana-import-export-global-stats 38393333
Table 9 - Retail prices in selected countries monthly Tableau 9 - Prix mensuels au detail dans certains paysCuadro 9 - Precios mensuales al por menor en algunos paiacuteses
THE PEOPLErsquoS REPUBLIC OF CHINA (MAILAND)
2001 2002 2003 2004 2005 2006 2007 2008 2009 2010 2011 2012 2013
( RMB kg )
January 325 350 385 335 345 365 415 410 365 495 55
February 410 375 395 350 365 395 435 415 420 545 595
March 420 335 365 345 385 425 450 425 435 58 58
April 435 340 375 350 410 435 460 465 490 67 54
May 395 365 385 365 425 325 455 510 530 63 53
June 320 380 365 370 430 290 425 490 565 5 51
July 295 305 365 360 370 260 400 485 587 46 48
August 285 315 345 365 325 280 410 465 490 45 45
September 290 335 350 385 390 285 425 430 510 49 485
October 310 355 368 390 335 360 438 425 480 53 52
November 305 376 370 375 315 340 465 390 450 575 49
December 310 395 375 380 320 375 350 385 470 59 495
YEAR 342 352 370 364 368 345 427 441 483 543 519
USD kg 041 043 045 044 046 045 061 065 071 084 082
8102019 Banana Import Export Global Stats
httpslidepdfcomreaderfullbanana-import-export-global-stats 3939
8102019 Banana Import Export Global Stats
httpslidepdfcomreaderfullbanana-import-export-global-stats 1639
STATISTICAL TABLES
8102019 Banana Import Export Global Stats
httpslidepdfcomreaderfullbanana-import-export-global-stats 17391212
Table 1 - World gross exports by country Tableau 1 - Exportations brutes mondiales par paysCuadro 1 - Exportaciones brutas mundiales por paiacutes
2000 2001 2002 2003 2004 2005 2006 2007 2008 2009 2010 2011 2012
(prel)
( thousand tonnes milliers de tonnes miles de toneladas )
Latin America amp Caribbean 9 7239 9 4433 9 9331 10 4715 10 4367 10 6201 11 2608 12 1333 11 9550 12 3458 11 7717 12 5270 13 0280
Central and South America 9 4791 9 1823 9 6743 10 2260 10 2225 10 3715 10 9502 11 8437 11 6878 11 9762 11 3922 12 2020 12 7054
Belize 658 501 430 749 805 763 730 611 827 818 792 837 993
Bolivia 94 129 165 284 427 536 762 795 858 894 884 983 727
Brazil 718 1051 2410 2208 1881 2122 1943 1857 1309 1439 1395 1101 957
Colombia 1 6802 1 5163 1 5704 1 4232 1 4709 1 6215 1 6974 1 7492 1 7983 2 1018 1 8026 1 9153 1 8349
Costa Rica 1 8833 1 7393 1 6226 1 9013 1 7925 1 6145 1 9611 2 1592 1 8726 1 5875 1 8209 1 9022 2 0286
Ecuador 3 9395 3 9904 4 1992 4 6712 4 5370 4 6539 4 7978 5 0571 5 1328 5 4731 4 9450 5 3919 4 9821
Guatemala 8013 8738 9717 9333 1 0138 1 0463 9826 1 3304 1 3547 1 4064 1 3691 1 5588 1 9208
Honduras 3753 4318 4414 4434 5277 5011 5162 5701 6057 5197 5124 5166 9014
Mexico 455 374 358 399 416 702 666 416 749 1401 1741 1776 3075
Nicaragua 455 441 408 409 449 455 377 389 378 347 200 82 93
Panama 4893 3211 4185 4102 3980 3483 4311 4386 3666 2572 2724 2669 2450
Peru 09 80 191 181 273 429 571 655 782 833 894 1088 1238
Suriname 354 287 280 01 214 396 474 562 654 570 791 629 831
Venezuela 361 233 265 203 360 456 117 106 14 01 01 08 12
Caribbean 2448 2609 2589 2455 2142 2487 3105 2896 2673 3696 3795 3250 3226 Dominican Republic 802 1302 1147 1267 1020 1671 2056 2120 1919 2818 3404 3038 2972
Jamaica 420 431 399 418 287 116 319 174 00 00 00 00 00
Others 1226 877 1042 771 835 700 731 602 754 877 391 212 254
Asia 17038 16896 17853 19443 19047 21693 24103 23121 23057 18574 17649 22174 28179
China 502 392 397 530 416 388 228 209 151 132 86 102 79
Malaysia 311 302 279 246 211 338 268 271 301 200 214 229 183
Pakistan 21 14 37 72 60 85 109 79 130 867 577 588 588
Philippines 1 5994 1 6007 1 6850 1 8294 1 7973 2 0243 2 3115 2 2177 2 1926 1 6641 1 5901 2 0555 2 6461
Tailand 58 55 52 63 177 418 203 214 228 256 228 252 276
Vietnam 45 42 146 126 72 39 21 16 26 17 35 32 32 Others 107 84 92 111 138 181 159 154 296 462 608 417 560
India 86 81 87 109 126 144 115 130 276 458 608 399 545
Africa 4941 4889 5329 5651 5568 5045 6057 5801 6114 5682 6435 6337 6488
Cameroon 2382 2541 2588 3137 2949 2655 2566 2323 2687 2555 2328 2490 2465
Cocircte drsquoIvoire 2173 2244 2560 2424 2524 2344 2864 2908 2643 2570 3356 3201 3394
Ethiopia 05 03 09 13 29 00 05 26 20 28 36 41 41
Others 93 48 107 77 65 46 621 544 764 528 714 606 588
Ghana 39 33 30 13 19 19 575 521 698 476 675 579 561
Oceania 03 01 01 01 01 01 01 01 01 01 01 01 01
WORLD 11 9221 11 6218 12 2514 12 9810 12 8982 13 2940 14 2768 15 0255 14 8723 14 7714 14 1802 15 3783 16 4948
8102019 Banana Import Export Global Stats
httpslidepdfcomreaderfullbanana-import-export-global-stats 18391313
Table 2 - World net imports by country Tableau 2 - Importations nettes mondiales par paysCuadro 2 - Importaciones netas mundiales por paiacutes
2000 2001 2002 2003 2004 2005 2006 2007 2008 2009 2010 2011 2012
(prel)
( thousand tonnes milliers de tonnes miles de toneladas )
DEVELOPING COUNTRIES 2 2705 1 9519 1 9760 2 3592 2 5037 2 7438 2 9908 3 0399 3 3967 3 3997 3 8240 4 1996 3 7561
Latin America amp Caribbean 6360 6031 5006 5591 5626 6007 5629 5986 6226 6143 6412 6814 6678
Argentina 3400 3301 2295 2864 3033 3022 2957 3189 3468 3441 3511 3949 3766
Chile 1926 1475 1491 1578 1597 1953 1689 1782 1750 1793 1757 1844 1906
El Salvador 590 612 614 566 515 531 491 538 527 435 487 448 498
Uruguay 330 489 438 411 437 476 451 422 431 416 506 515 447
Others 115 154 167 171 43 25 41 54 50 58 152 59 62
Asia 1 5762 1 1937 1 2007 1 5193 1 6148 1 9356 2 2266 2 1834 2 5295 2 5112 2 8624 3 1575 2 7362
China 6423 4676 4013 4811 4373 4142 4467 3873 4210 5536 7408 9095 7158
Iran 2000 756 1507 2710 2709 4509 3728 4477 7516 7128 6395 5909 3555
Jordan 53 29 22 15 21 63 93 202 330 256 396 483 498
Korea Rep 1842 1945 1872 2200 2083 2533 2797 3077 2581 2570 3379 3527 3680 Kuwait 233 238 255 261 302 305 676 889 961 929 911 1305 1398
Saudi Arabia 1869 1810 1765 1994 2115 2332 2351 2481 2567 2524 3074 3062 3062
Singapore 423 398 376 352 350 357 365 371 384 397 393 416 446
Syria 687 530 478 704 939 1116 3227 1927 2196 1837 2323 2722 2934
urkey 1242 416 646 919 1102 1510 1686 2243 2191 1824 2007 2346 2251
United Arab Emirates 685 796 683 707 1576 1748 2105 1229 1267 845 933 1287 1297
Others 305 343 391 520 578 742 771 1066 1094 1265 1403 1423 1084
Africa 582 1551 2748 2808 3263 2074 2013 2580 2446 2741 3203 3607 3521
Algeria 00 854 2315 2233 2046 1571 1472 1626 1639 1796 2079 2453 2310
Egypt 53 59 26 12 11 28 61 47 30 25 101 256 284
Morocco 00 28 14 11 22 49 54 172 187 267 281 246 282
Senegal 71 105 121 123 141 150 157 166 169 168 165 143 156
unisia 155 110 163 138 543 208 203 410 335 371 187 413 413
Others 303 394 109 291 500 68 67 158 86 115 391 95 76
DEVELOPED COUNTRIES 9 8804 9 6173 9 8594 10 1348 10 2763 10 3758 10 8862 11 4379 11 7050 11 0187 11 5162 12 3829 12 4955
EC ( 27 ) 3 8901 3 7718 3 8868 4 0230 4 0010 3 9230 4 3653 4 6824 4 8773 4 5370 4 5087 4 6030 4 4876
Other Europe 8126 9415 1 0599 1 1827 1 3155 1 4812 1 5319 1 6675 1 7004 1 5876 1 6729 1 9533 1 9018
Albania 178 85 187 227 172 168 168 202 174 172 175 174 174
Belarus 311 173 161 209 235 287 294 332 417 367 445 401 594
Bosnia Herzgovina 05 06 03 414 462 449 378 383 408 371 370 380 380
Croatia 419 432 451 506 508 540 515 548 570 521 494 487 463
Iceland 35 37 40 41 46 47 54 55 56 57 57 59 61
Macedonia Former YR 51 20 78 153 208 176 151 161 154 167 181 191 191
Moldova Rep 16 17 15 31 49 70 77 112 129 117 105 122 112 Norway 599 609 598 634 662 732 746 785 835 812 785 782 769
Russian Fed 4995 6067 6408 7870 8427 8528 8835 9597 9885 9694 1 0686 1 3076 1 2536
Serbia Montenegro 198 679 1134 151 975 578
Serbia 558 657 689 431 419 515 454
Montenegro 83 85 84 85 66 74 74
Switzerland 723 734 743 722 735 742 741 782 821 808 799 794 786
Ukraine 595 555 791 870 676 2494 2720 2975 2781 2273 2148 2478 2426
North America 4 0289 3 8387 3 9072 3 8738 3 8649 3 8223 3 8516 4 0151 3 9309 3 5429 4 1075 4 6293 4 8768
Canada 3984 4049 4170 4228 4406 4490 4567 4718 4776 4819 4961 5066 5270
United States 3 6304 3 4338 3 4902 3 4511 3 4242 3 3733 3 3950 3 5433 3 4534 3 0610 3 6114 4 1227 4 3497
Others 1 1488 1 0653 1 0054 1 0552 1 0949 1 1493 1 1374 1 0730 1 1963 1 3512 1 2271 1 1973 1 2294
Japan 1 0787 9906 9363 9866 1 0260 1 0669 1 0436 9706 1 0927 1 2526 1 1091 1 0641 1 0864 New Zealand 676 722 673 672 661 775 809 805 800 763 813 809 807
South Arica 26 26 18 14 28 50 129 219 236 222 367 523 623
WORLD 12 1508 11 5692 11 8354 12 4940 12 7800 13 1196 13 8770 14 4778 15 1017 14 4183 15 3401 16 5824 16 2516
8102019 Banana Import Export Global Stats
httpslidepdfcomreaderfullbanana-import-export-global-stats 19391414
Table 3 - EC Total supply of bananas and per capita supply Tableau 3 - CE Offre totale de banane et offre par habitantCuadro 3 - CE Oferta total de banano y oferta por habitante
2000 2001 2002 2003 2004 2005 2006 2007 2008 2009 2010 2011 2012
( thousand tons milliers de tonnes miles de toneladas )
France 3589 3228 3589 3292 3053 2805 2686 1673 1716 2358 2420 2425 2517
Guadeloupe 876 890 951 855 591 542 478 380 467 556 426 615 669
Martinique 2713 2337 2639 2437 2462 2262 2208 293 1249 1802 1994 1810 1848
Spain 3976 4209 4073 4009 4184 3450 3482 3614 3713 3520 3970 3465 3710
Greece 33 29 24 27 29 29 29 29 27 26 19 20 22
Cyprus 85 98 105 112 105 58 65 60 42 32 50 56 57
Portugal 225 207 219 214 212 142 153 172 178 145 137 153 177
Production 7907 7771 8011 7654 7582 6484 6416 5547 5676 6080 6595 6118 6485
Net Imports
EC (27) 3 8901 3 7718 3 8868 4 0310 4 0125 3 9230 4 3676 4 6824 4 8738 4 5372 4 5086 4 6030 4 4899
Supply 4 6807 4 5489 4 6880 4 7965 4 7707 4 5714 5 0092 5 2371 5 4414 5 1453 5 1682 5 2149 5 1383
Per capita supply 1231 1191 968 986 977 931 1016 1058 1095 1031 1032 1038 1021
Source EC Commission
8102019 Banana Import Export Global Stats
httpslidepdfcomreaderfullbanana-import-export-global-stats 20391515
Table 4 - Per capita net imports by country Tableau 4 - Importations nettes par habitant par paysCuadro 4 - Importaciones netas por habitante por paiacutes
2000 2001 2002 2003 2004 2005 2006 2007 2008 2009 2010 2011 2012
(prel)
( kg per capita kg par habitant kg por habitante )
DEVELOPING COUNTRIES 127 108 108 128 135 147 158 160 177 175 196 213 185
Latin America amp Caribbean 932 875 719 796 793 839 779 821 847 828 856 902 876
Argentina 921 885 610 754 791 781 758 810 873 859 869 969 916
Chile 1249 945 945 989 990 1198 1026 1071 1042 1058 1027 1068 1094
El Salvador 994 1026 1026 942 854 878 808 882 860 705 786 719 795
Uruguay 994 1472 1317 1237 1316 1432 1356 1266 1288 1240 1501 1523 1319
Others 174 228 243 246 061 035 055 073 066 076 195 074 077
Asia 100 075 075 094 099 118 135 131 151 148 168 184 154
China 051 037 032 038 034 032 034 030 032 042 056 068 052
Iran 306 114 224 398 393 647 528 627 1040 975 865 790 470
Jordan 109 059 044 029 040 118 169 356 564 426 641 762 771
Korea Rep 401 421 403 472 445 538 592 648 541 536 701 729 757 Kuwait 1203 1183 1231 1227 1378 1345 2877 3630 3771 3511 3328 4631 4834
Saudi Arabia 933 875 822 893 911 970 948 973 981 941 1120 1090 1067
Singapore 1078 999 931 861 841 838 828 809 804 802 774 802 848
Syria 430 322 282 403 522 604 1706 997 1115 916 1138 1311 1389
urkey 195 064 099 139 164 222 244 320 309 254 276 319 302
United Arab Emirates 2258 2529 2099 2078 4309 4295 4514 2273 2041 1218 1242 1631 1600
Others 031 034 038 051 056 070 072 097 098 111 121 120 090
Africa 039 103 180 181 207 129 124 156 146 161 185 205 197
Algeria 000 276 736 700 632 478 441 480 476 514 586 682 633
Egypt 008 009 004 002 002 004 008 006 004 003 013 031 034
Morocco 000 010 005 004 007 016 017 056 060 084 088 076 086
Senegal 075 108 120 120 133 138 141 145 144 138 133 112 119
unisia 164 116 169 142 553 210 202 405 327 358 178 390 386
Others 1726 2207 601 1590 2699 360 352 821 439 579 1947 470 368
DEVELOPED COUNTRIES 813 789 805 825 833 837 875 916 933 875 911 976 981
EC ( 27 ) 808 781 802 826 818 799 885 946 981 909 901 917 891
Other Europe 331 385 435 488 545 616 639 696 711 665 702 821 800
Albania 581 275 605 731 549 535 533 636 547 540 547 541 539
Belarus 309 173 161 210 238 292 301 341 431 381 463 419 623
Bosnia Herzgovina 014 016 007 1093 1223 1188 999 1014 1081 986 983 1013 1015
Croatia 929 964 1009 1135 1142 1215 1161 1237 1291 1182 1121 1107 1055
Iceland 1246 1286 1401 1414 1573 1591 1778 1803 1785 1818 1797 1818 1855
Macedonia Former YR 254 101 383 755 1021 863 738 786 751 812 878 925 923
Moldova Rep 040 042 037 079 128 185 207 306 354 326 295 344 318
Norway 1334 1350 1319 1390 1444 1584 1599 1662 1748 1681 1607 1588 1550
Russian Fed 340 415 440 543 584 593 616 670 690 678 747 915 878
Serbia Montenegro 184 634 1066 143 926 552
Serbia 568 668 700 437 425 522 461
Montenegro 1318 1356 1338 1343 1040 1172 1170
Switzerland 1009 1019 1024 988 999 1001 992 1040 1085 1060 1042 1031 1016
Ukraine 122 115 165 183 143 532 584 643 605 497 473 548 540
North America 1287 1213 1222 1200 1186 1161 1159 1198 1162 1038 1193 1332 1392
Canada 1299 1308 1333 1338 1379 1391 1400 1431 1433 1431 1458 1475 1520
United States 1285 1203 1210 1185 1164 1136 1133 1172 1132 995 1164 1317 1377
Others 659 608 571 597 616 645 635 597 664 748 678 660 677
Japan 858 787 743 782 812 844 825 767 864 990 876 841 859
New Zealand 1753 1847 1700 1670 1619 1874 1932 1901 1869 1766 1862 1832 1809
South Arica 006 006 004 003 006 010 027 045 048 045 073 104 123
WORLD 404 382 388 407 413 422 443 459 475 451 477 512 492
8102019 Banana Import Export Global Stats
httpslidepdfcomreaderfullbanana-import-export-global-stats 21391616
Table 5 - Exports by countries of destination 1
Tableau 5 - Exportations par pays de destination 1
Cuadro 5 - Exportaciones por paiacuteses de destino 1
2002 2003 2004 2005 2006 2007 2008 2009 2010 2011 2012
(prel)
( thousand tonnes milliers de tonnes miles de toneladas )
BELIZE
O
United Kingdom 430 749 805 763 730 609 821 798 788 711 990
Others 06 20 04 126 03
TOTAL 430 749 805 763 730 611 827 818 792 837 993
BRAZIL
O
Argentina 1631 1297 914 979 561 583 339 522 385 231 354
Italy 208 234 171 191 128 86 70
Uruguay 395 401 423 478 429 393 388 364 372 338 350
United Kingdom 301 259 306 361 546 400 165 190 120 140 147
Others 84 251 30 69 236 290 290 276 448 392 107
TOTAL 2410 2208 1881 2121 1943 1857 1309 1439 1395 1101 957
COLOMBIA
O
Belgium-Lux 5669 4763 5707 6246 6048 5023 6122 5194 4162 5093 5397
United States 5682 4869 4634 5259 4802 4767 4884 6765 5478 4767 3173
UK 264 2563 2740 4468
Italy 1226 1193 1120 1006 721 991 1147 1801 2122 2236 2425
Russian Federation 147 177 501 311 184 215 52 04 35 China 191 - - - - - -
Saudi Arabia 05 66 27 - - - -
Germany 2064 1929 1351 1615 2086 3698 2882 2909 2181 3560 1532
Others 720 1235 1369 1778 3133 2798 2948 4032 1516 723 1355
TOTAL 1 5704 1 4232 1 4709 1 6215 1 6974 1 7492 1 7983 2 1018 1 8026 1 9153 1 8349
COSTA RICA
O
North America 8093 9276 8548 7911 9505 1 0382 8557 6569 8553 8832 8723
Europe 8133 9733 9376 8073 9462 9541 9112 8135 8654 8553 9960
Russian Federation 154 693 303 439 438 1546
Others 00 04 01 161 490 1670 364 868 563 1199 57TOTAL 1 6226 1 9013 1 7925 1 6145 1 9611 2 1592 1 8726 1 5875 1 8209 1 9022 2 0286
COcircTE DrsquoIVOIRE
O
France 1740 1288 1201 1432 1238 998 813 1333 871 494 707
UK 64 198 228 306 420 402 418 510 887 892 921
Germany 01 - 168 207 194
Italy 09 - 03 - 03
Belgium - Luxembourg 917 422 950 1218 1077 375 857 1130 1029
Senegal 140 131 144 149 200 213 214 179 239 167 210
Others 616 805 34 35 55 78 110 173 331 311 331
TOTAL 2560 2422 2524 2344 2864 2908 2643 2570 3356 3201 3394
8102019 Banana Import Export Global Stats
httpslidepdfcomreaderfullbanana-import-export-global-stats 22391717
Table 5 - Exports by countries of destination 1
Tableau 5 - Exportations par pays de destination 1
Cuadro 5 - Exportaciones por paiacuteses de destino 1
2002 2003 2004 2005 2006 2007 2008 2009 2010 2011 2012
(prel)
( thousand tonnes milliers de tonnes miles de toneladas )
DOMINICA
O
United Kingdom 164 134 133 118 118 72 105 364 39 41 23
Others 10 - 00 28 23 23 24 17 01 00 00 00
TOTAL 175 134 161 141 141 96 122 365 39 41 23
DOMINICAN REPUBLIC
O
Belgium-Lux 290 472 215 213 262 298 376 619 731 490 591
Italy 79 53 62 71 107 57 14 04 03 60 21United Kingdom 562 604 627 1271 1274 1585 1316 1669 2051 1 803 1 773
United States 34 26 41 33 72 17 04 20 02 05 09
Others 182 112 75 84 341 163 209 507 618 680 579
TOTAL 1147 1267 1020 1671 2056 2120 1919 2818 3404 3038 2972
ECUADOR
O
United States 1 1284 9382 9246 9562 9425 7297 8805 1 1445 1 0001 8942 7256
Italy 9337 1 1752 1 1745 1 1317 9455 9163 9439 1 0043 8401 7337 5906
Germany 5018 5232 4691 5200 4247 3202 5324 5250 4473 5740 4132
Belgium-Lux 2036 2140 2205 1686 2004 2633 3904 3189 3472 3187 2852
Russian Federation 8742 9766 1 0310 1 1439 9893 9103 1 3947 1 3151 1 0624 1 2140 1 1401Argentina 394 1095 1419 1227 1053 1120 2156 1955 1813 326 421
Chile 1678 2195 1847 1840 1893 1421 1857 1977 2076 3992 3955
Japan 1708 1552 1330 982 923 446 532 664 447 354 357
New Zealand 619 397 418 384 310 239 303 322 313 235 225
Poland 410 48 - 67 - 42 225 172 266 207
China 168 108 39 04 45 10 19 102 451
Iran - - - 39 - - - 10 21 24
Others 597 3201 2004 2823 8706 1 5943 4217 3088 1 2900 6805 1 6756
TOTAL 4 1992 4 6712 4 5370 4 6539 4 7978 5 0571 5 1328 5 4731 4 9450 5 3919 4 9821
GRENADA
OUnited Kingdom 06 04 04 03 02 05
TOTAL 06 04 04 - 03 02 05
GUATEMALA
O
United States 8259 9251 8617 8894 9216 6001 1 2215 1 3638 1 2652 1 3384 1 5841
United Kingdom - - - 04 10 10 51 15 11 16 28
Italy - - - 03 46 04 - 01 23 416 152
El Salvador 31 28 315 493 416 213 952 243 875 733 825
Others 1427 54 1206 1070 138 7076 329 167 130 1039 2362
TOTAL 9717 9333 1 0138 1 0463 9826 1 3304 1 3547 1 4064 1 3691 1 5588 1 9208
8102019 Banana Import Export Global Stats
httpslidepdfcomreaderfullbanana-import-export-global-stats 23391818
Table 5 - Exports by countries of destination 1
Tableau 5 - Exportations par pays de destination 1
Cuadro 5 - Exportaciones por paiacuteses de destino 1
2002 2003 2004 2005 2006 2007 2008 2009 2010 2011 2012
(prel)
( thousand tonnes milliers de tonnes miles de toneladas )
HONDURAS
O
United States 3913 3915 4984 4535 4569 4586 5656 4829 4560 4598 8022
Belgium-Lux 155 84 183 226 212 215 122 73 154 155 270
Germany
Italy 09
United Kingdom 13 46 07 26 26 45
Others 324 436 110 250 381 900 233 288 384 387 676
TOTAL 4414 4434 5277 5011 5162 5701 6057 5197 5124 5166 9014
JAMAICA
O
United Kingdom 399 418 287 116 319 174 00 00 00 00 00
Others 00 - 00 00 00 00 00 00 00 00 00 00
TOTAL 399 418 287 116 319 174 00 00 00 00 00
MEXICO
O
United States 334 277 363 379 429 367 593 1238 1552 1635 2499
Japan 54 47 37 30 29
Spain 01 56 64 70 54
Russian Fed 01 23 09 01 01Others 24 122 53 323 237 49 100 36 78 40 492
TOTAL 358 399 416 702 666 416 749 1401 1741 1776 3075
PANAMA
O
Germany 162 131 166 22 118 01 46 - 28 05 29
United States - - 06 59 175 136 266 47 281 340 150
Belgium-Lux 1201 888 739 578 765 716 91 30 78 00 00
Portugal 1056 1031 817 430 415 438 101 65 113 196 160
Sweden 1743 1785 2093 1922 2129 2331 2315 1385 1855 1530 1391
Italy - - 66 116 160 88 490 57 49 179 123
Others 22 267 93 356 549 676 358 989 320 419 596TOTAL 4185 4102 3980 3483 4311 4386 3666 2572 2724 2669 2450
PHILIPPINES
O
Japan 8477 8840 9152 9182 9095 9142 1 1065 9138 7921 8922 1 0848
Iran 93 304 1699 2234 3727 4287 4013 2506 2196 1497 990
Saudi Arabia 507 01 102 187 65 217 120 95 78 1161
China 3788 4156 3309 3512 3815 2034 1815 983 1658 4034 4220
China Hong Kong SAR 04 243 201 199 152 190 383 223 75 198 903
Korea Rep o 1519 1588 1386 2341 2649 2756 1866 1321 1133 1979 2655
United Arab Emirates 2092 2002 1576 1799 2075 1672 711 572 789 1016 2628
Others 370 1161 650 874 1415 2031 1857 1778 2034 2831 3056
TOTAL 1 6850 1 8294 1 7973 2 0243 2 3115 2 2177 2 1926 1 6641 1 5901 2 0555 2 6461
8102019 Banana Import Export Global Stats
httpslidepdfcomreaderfullbanana-import-export-global-stats 24391919
Table 5 - Exports by countries of destination 1
Tableau 5 - Exportations par pays de destination 1
Cuadro 5 - Exportaciones por paiacuteses de destino 1
2002 2003 2004 2005 2006 2007 2008 2009 2010 2011 2012
(prel)
( thousand tonnes milliers de tonnes miles de toneladas )
PERU
O
United States 112 135 122 231 264 179 239 198 198 235 278
Belgium 39 22 61 92 100 48 72 38 71 55 72
Netherlands 03 02 47 59 115 277 320 432 457 609 659
Germany 33 - 04 04 44 67 57 34 59 32 55
Japan 01 34 42 44 79 73 101 79 88 118
Others 04 20 04 01 04 05 22 30 30 69 57
TOTAL 191 181 273 429 571 655 782 833 894 1088 1238
SAINT LUCIA
O
United Kingdom 493 348 417 300 341 239 393 332 232 61 120
Others 00 00 14 07 08 17 19 00 00 01 01
TOTAL 493 348 431 307 349 256 412 332 232 62 121
STVINCENT amp GRENADINES
O
United Kingdom 344 285 240 204 180 182 114 75 41 08 07
Others 25 00 00 48 58 66 100 106 81 102 103
TOTAL 369 285 240 252 238 248 214 181 121 110 110
SURINAME
O
United Kingdom 280 - 47 98 11
France 62 257 454 562 654 570
Others 00 104 40 09 - 00 - 00 00 791 629 831
TOTAL 280 01 214 396 474 562 654 570 791 629 831
1 As declared by exporting countries1 Comme declareacute par les pays exportateurs1 De acuerdo a lo declarado por los paiacuteses exportadores
8102019 Banana Import Export Global Stats
httpslidepdfcomreaderfullbanana-import-export-global-stats 25392020
Table 6 - Gross Imports by countries of origin 1
Tableau 6 - Importations brutes par pays drsquoorigine 1
Cuadro 6 - Importaciones brutas por paiacuteses de origen 1
2002 2003 2004 2005 2006 2007 2008 2009 2010 2011 2012
(prel)
( thousand tonnes milliers de tonnes miles de toneladas )
ARGENTINA
FROM
Ecuador 471 1168 1600 1415 1658 1840 2149 1973 2127 2397 2245
Brazil 1648 1293 903 981 561 583 338 523 386 232 394
Bolivia 146 249 407 557 641 647 706 780 753 994 873
Others 31 153 123 70 97 119 275 165 245 326 254
TOTAL 2295 2864 3033 3022 2957 3189 3468 3441 3511 3949 3766
CANADAFROM
Costa Rica 881 1196 1061 927 881 1253 1154 710 1058 1178 1159
Ecuador 1282 1048 821 780 942 1003 1210 1642 1472 1104 1392
Colombia 1202 1149 1297 1637 1741 1379 1218 1289 1145 963 1298
Honduras 310 287 353 206 101 235 292 175 295 274 275
Mexico 111 102 47 10 20 15 28 16 14 20 20
Guatemala 310 429 782 855 794 754 814 931 897 1475 1055
Panama 01 00 - 19 53 39 29 25 37 10 30
Dominican Rep 02 01 07 01 06 04 01 02 01 01 02
Others 75 17 56 55 42 36 31 31 41 41 39TOTAL 4174 4228 4423 4490 4580 4718 4776 4820 4961 5066 5270
CHILE
FROM
Ecuador 1472 1569 1585 1670 1630 1698 1659 1730 1738 1766 1825
Others 19 20 18 283 59 84 91 63 19 78 81
TOTAL 1491 1589 1602 1953 1689 1782 1750 1793 1757 1844 1906
CHINA
FROM
Philippines 2665 3111 2858 3038 3434 3038 3178 3521 4367 6939 4964
Ecuador 284 285 241 154 42 30 70 22 89 477
Tailand 06 18 57 96 138 152 176 104 163 225
Myanmar 01 01 44 943 1770 549 445
Vietnam 424 798 652 268 292 100 217 192 315 393 93
Others 98 00 01 00 152 02 03 11 74 55 142
TOTAL 3478 4212 3809 3557 3878 3319 3623 4913 6652 8187 6346
8102019 Banana Import Export Global Stats
httpslidepdfcomreaderfullbanana-import-export-global-stats 26392121
Table 6 - Gross Imports by countries of origin 1
Tableau 6 - Importations brutes par pays drsquoorigine 1
Cuadro 6 - Importaciones brutas por paiacuteses de origen 1
2002 2003 2004 2005 2006 2007 2008 2009 2010 2011 2012
(prel)
( thousand tonnes milliers de tonnes miles de toneladas )
EC (27) 2
FROM
Ecuador 1 1570 1 1488 1 1208 1 2392 1 1993 1 1858 1 3306 1 3431 1 2242 1 3412 1 3074
Colombia 7680 7992 7665 8824 9514 1 1561 1 2782 1 2408 1 1610 1 1366 1 1344
Costa Rica 7463 8020 8564 6345 8340 9714 8951 7572 7765 8450 7702
Panama 3962 3815 3708 2816 3130 3541 2946 1851 1844 1597 1436
Cote drsquoIvoire 2167 2074 2108 1838 2218 1894 2166 2292 2443 2241 2249
Cameroon 2365 2985 2612 2529 2527 2218 2795 2497 2430 2352 2139
Dominican Rep 973 1119 1013 1447 1768 2064 1705 2283 3037 3269 2946
Peru 68 57 96 115 227 336 389 441 516 658 814
Belize 387 738 803 742 732 624 821 798 788 711 993
Ghana 33 09 18 42 223 341 460 365 524 472 507
Saint Lucia 493 325 429 282 367 305 385 333 232 62 121
Jamaica 406 418 287 117 319 184 - - - -
Honduras 345 252 212 231 218 316 240 85 152 175 57
Saint Vincent amp the Grenadines 325 209 240 159 172 138 90 75 41 08 07
Guatemala 10 69 22 30 307 188 143 49 33 30 46
Dominica 175 105 122 128 133 73 103 369 37 41 23
Others 569 682 1007 1244 1549 1563 1593 611 1469 1272 1483
TOTAL 3 8991 4 0358 4 0112 3 9281 4 3737 4 6917 4 8873 4 5459 4 5161 4 6114 4 49412 Source European Community
JAPAN
FROM
Philippines 7435 7956 8696 9445 9106 8790 1 0193 1 1591 1 0355 1 0044 1 0267
Ecuador 1570 1456 1227 911 1013 521 462 618 461 343 359
China 251 335 182 151 159 189 90 88 95 84 84
Indonesia - - - - - - - - - - -
Others 106 120 154 162 158 207 182 229 180 170 154
TOTAL 9363 9866 1 0260 1 0669 1 0436 9706 1 0927 1 2526 1 1091 1 0641 1 0864
NEW ZEALAND
FROM
Ecuador 562 308 291 354 326 308 273 258 288 250 279
Philippines 110 360 356 419 481 493 526 500 524 556 526
Panama - - 14 01 01
Others 01 03 01 00 00 04 00 04 01 02 03
TOTAL 673 672 661 775 809 805 800 763 813 809 807
8102019 Banana Import Export Global Stats
httpslidepdfcomreaderfullbanana-import-export-global-stats 27392222
Table 6 - Gross Imports by countries of origin 1
Tableau 6 - Importations brutes par pays drsquoorigine 1
Cuadro 6 - Importaciones brutas por paiacuteses de origen 1
2002 2003 2004 2005 2006 2007 2008 2009 2010 2011 2012
(prel)
( thousand tonnes milliers de tonnes miles de toneladas )
NORWAY
FROM
Panama 07 28 34 54 68 77 108 92 100 97 95
Costa Rica 260 307 339 425 382 373 343 239 244 261 256
Ecuador 52 67 88 95 175 160 183 300 276 329 324
Colombia 276 223 187 136 79 152 181 162 148 77 75
Others 04 10 14 22 41 21 20 19 18 18 18
TOTAL 598 634 662 732 746 785 835 812 785 782 769
ROMANIA
FROM
Ecuador 547 341 973 1272 1357
Colombia 60 19 39 29 39
Costa Rica 12 17 52 101 55
Honduras 28 28 40
Others 19 52 05 01 53
TOTAL 639 429 1097 1432 1543
RUSSIAN FEDERATION
FROM
Ecuador 5922 7233 7892 7911 7976 9202 9030 9112 9766 1 1999 1 1530
Costa Rica 09 175 10 155 275 21 659 326 482 386 446
China 65 54 41 26 15 30
Colombia 157 212 393 280 205 219 02 52 95 182 123
Vietnam 13 13 12 03 03 08 04
Philippines 139 208 232 212 304 251 315 245 298 355 335
Others 259 180 30 92 194 27 05 25 16 139 72
TOTAL 6500 8021 8569 8649 8954 9787 1 0068 9809 1 0686 1 3076 1 2536
SWITZERLAND
FROM
Costa Rica 383 367 294 278 240 264 184 172 161 156 154
Panama 70 40 40 65 98 125 204 155 165 118 117
Colombia 131 126 175 133 129 87 96 131 132 185 183
Ecuador 55 74 136 180 207 239 250 250 234 224 222
Honduras 01 06 06 01 - -
Others 104 109 84 85 67 68 87 100 106 111 110
TOTAL 743 722 735 742 741 782 821 808 799 794 786
8102019 Banana Import Export Global Stats
httpslidepdfcomreaderfullbanana-import-export-global-stats 28392323
Table 6 - Gross Imports by countries of origin 1
Tableau 6 - Importations brutes par pays drsquoorigine 1
Cuadro 6 - Importaciones brutas por paiacuteses de origen 1
2002 2003 2004 2005 2006 2007 2008 2009 2010 2011 2012
(prel)
( thousand tonnes milliers de tonnes miles de toneladas )
SLOVAKIA
FROM
Ecuador 58 63 15
Costa Rica 135 195 77
Colombia 163 161 60
Panama 119 89 35
Others 12 25 312
TOTAL 487 533 499
TUNISIAFROM
Cameroon 05 - 02 - - 01 05 - - -
Cocircte DrsquoIvoire - - 07 21 38 51 01 - -
Colombia 24 - 30 11 02 46 11 - - 03
Costa Rica - - 10 06 - - 01 18 53 44
Ecuador 133 138 491 169 161 289 313 349 134 366
Others 00 00 03 02 01 23 05 04 00 - 00
TOTAL 163 138 543 208 203 410 335 371 187 413
UNITED STATESFROM
Costa Rica 9015 9761 8653 8227 9274 1 0369 8744 5629 8536 8445 8482
Ecuador 1 0218 9725 9189 9043 9943 9292 8303 9576 9798 8790 7197
Honduras 4492 4321 5079 4530 4229 4827 5056 3887 4357 4452 5357
Guatemala 9252 9341 1 0208 1 0293 9129 1 0934 1 1887 1 1122 1 1515 1 3335 1 4586
Colombia 5064 4693 4646 5137 4738 3772 4508 4216 4609 3845 4402
Mexico 423 352 336 338 386 315 663 1052 1455 1486 2233
Panama 03 02 06 20 75 05 80 54 290 278 592
Nicaragua 297 416 415 381 305 328 311 249 360 356 363
Peru 232 138 124 223 251 178 225 197 201 232 259
Venezuela 37 19 20 07 03 - - - - - -
Dominican Rep 36 21 52 44 62 17 01 10 01 07 27
Others 01 02 00 00 - 00 00 00 00 26 01 - 00
TOTAL 3 9070 3 8792 3 8728 3 8244 3 8395 4 0038 3 9779 3 5992 4 1149 4 1227 4 3497
URUGUAY
FROM
Brazil 408 402 430 457 424 384 382 321 436 390 292
Ecuador 28 01 03 16 19 35 48 42 65 115 142
Others 02 07 04 00 04 01 - 00 53 05 09 14
TOTAL 438 411 437 473 446 420 430 416 506 515 4471 Figures may differ rom those shown in able 3 (a) which exclude re-exports1 Les chiffres dans ce tableau peuvent differer des chiffres du ableau 3 (a) qui ne comprennent pas les reacuteexportations1 Las ciras pueden dierir de las del Cuadro 3 (a) las cuales excluyen las reexportaciones
8102019 Banana Import Export Global Stats
httpslidepdfcomreaderfullbanana-import-export-global-stats 29392424
Table 7 - Import prices in selected countries monthly Tableau 7 - Prix agrave lrsquoimportation mensuels dans certains paysCuadro 7 - Precios mensuales de importacioacuten en algunos paiacuteses
FRANCE
2001 2002 2003 2004 2005 2006 2007 2008 2009 2010 2011 2012 2013
( Euro tonnes )
January 572 547 620 474 623 630 620 - 658 524 794 678 770
February 636 723 628 500 753 770 700 780 720 623 923 820 820
March 865 733 698 640 798 690 700 843 962 720 755 820 770
April 795 608 600 603 810 640 698 820 878 680 760 808 763
May 652 546 528 568 860 608 633 593 715 686 680 730 710
June 580 478 476 615 888 585 594 588 668 755 513 695 688
July 565 340 360 485 498 380 565 605 528 624 440 590 660
August 550 488 298 480 664 510 608 658 490 610 483 600 660
September 615 537 460 430 753 510 338 650 563 590 573 690 660
October 530 407 383 383 673 490 - 583 538 505 586 706 618
November 410 320 410 553 723 590 - 568 527 550 605 665 623
December 460 580 490 660 716 620 - 610 545 700 580 682 660
YEAR 603 525 496 533 730 585 606 663 649 631 641 707 700
USD ton 539 494 560 661 907 734 829 972 902 835 891 908 957
JAPAN2001 2002 2003 2004 2005 2006 2007 2008 2009 2010 2011 2012 2013
( Yen tonnes )
January 44 700 54 800 54700 52700 54900 46400 57700 55300 68100 55000 53000 52100 67800
February 49 100 66 000 60000 56600 56600 58200 64200 58400 69900 61900 56500 56900 71200
March 50 700 71 600 62700 65900 64600 58200 66400 63800 72600 68800 64500 65200 77100
April 54 000 83 200 66800 76400 66800 62900 79300 79100 82100 78300 74100 72200 82100
May 60 500 84 400 72800 70200 61600 64600 78700 82600 88300 77800 78500 72300 92500
June 54 400 80 100 68800 70900 65700 63600 73100 80800 88100 74700 75800 71100 89600
July 53 800 78 700 66400 64300 61900 63600 65000 83500 85500 71700 86200 69600 86600
August 56 500 64 000 68300 52800 60400 61200 64100 84300 81200 69400 72600 66400
September 60 600 65 900 69200 56500 60900 64600 72000 90900 74300 68500 68200 62000
October 53 500 63 700 58200 55100 57000 65100 65700 85600 64200 60900 61600 61000
November 48 700 54 400 51600 55600 49500 60600 59000 80400 58100 48500 60600 59100
December 48 900 50 800 49100 56100 47900 55300 56500 67100 52100 52100 55400 59900
YEAR 52 950 68 133 62 383 61 092 58 983 60 358 66 808 75 983 73 708 65 633 67 250 63 983 80986
USD kg 436 543 538 565 535 519 567 735 788 748 843 802 829
8102019 Banana Import Export Global Stats
httpslidepdfcomreaderfullbanana-import-export-global-stats 30392525
Table 7 - Import prices in selected countries monthly Tableau 7 - Prix agrave lrsquoimportation mensuels dans certains paysCuadro 7 - Precios mensuales de importacioacuten en algunos paiacuteses
UNITED STATES
2001 2002 2003 2004 2005 2006 2007 2008 2009 2010 2011 2012 2013
( USD tonnes )
January 535 427 561 427 589 686 639 689 820 785 892 945 929
February 687 517 462 496 891 854 655 792 944 720 1 002 1 068 923
March 541 572 486 513 792 825 648 1027 909 838 996 1 144 937
April 551 544 384 529 593 730 648 967 890 825 1 027 1 030 903
May 637 626 296 556 618 926 689 923 830 799 1 011 953 909
June 610 648 308 604 486 655 779 868 854 962 976 954 910
July 698 537 296 61 401 560 734 722 827 985 961 965 923
August 683 420 286 548 405 542 697 799 834 899 951 951 940
September 572 486 312 539 594 544 665 803 818 880 947 965 937
October 484 544 328 496 630 549 659 807 810 916 954 956 931
November 496 396 408 492 589 598 651 903 834 908 956 934 923
December 506 625 370 496 646 658 648 830 796 900 942 944 923
YEAR 583 529 375 480 603 677 676 844 847 868 968 984 924
EUROPEAN UNION
2001 2002 2003 2004 2005 2006 2007 2008 2009 2010 2011 2012 2013
( Euro tonnes )
January 590 590 590 590 610 580 600 600 570 630 610 610
February 610 590 600 610 600 590 560 610 580 640 620 620
March 630 610 640 660 600 590 620 660 600 630 630 620
April 640 620 620 630 610 580 640 660 620 620 640
May 620 590 640 640 590 590 610 630 610 610 630
June 600 590 640 680 570 580 590 630 640 600 630
July 560 560 620 610 550 570 590 600 630 590 620
August 600 540 600 610 530 550 580 590 600 570 630
September 610 570 600 630 550 570 610 570 600 580 620
October 580 580 590 620 550 580 600 570 600 590 610November 560 560 600 640 580 580 590 580 600 580 620
December 590 580 620 630 570 560 600 550 610 610 620
YEAR 599 582 613 629 576 577 599 604 605 604 623 617
USD ton 564 656 762 782 722 789 878 839 801 840 801 843
8102019 Banana Import Export Global Stats
httpslidepdfcomreaderfullbanana-import-export-global-stats 31392626
Table 7 - Import prices in selected countries monthly Tableau 7 - Prix agrave lrsquoimportation mensuels dans certains paysCuadro 7 - Precios mensuales de importacioacuten en algunos paiacuteses
HUNGARY
2001 2002 2003 2004 2005 2006 2007 2008 2009 2010 2011 2012 2013
( Forint tonnes )
January 40 000 74 000 115 000 105 000 62 000 181 000 181 000 186 000 188 000 158000 210000 197000
February 39 000 76 000 119 000 109 000 171 000 189 000 189 000 210 000 221 000 172000 213000 236000
March 39 000 83 000 122 000 105 000 179 000 185 000 178 000 226 000 268 000 195000 197000 224000
April 40 000 105 000 137 000 112 000 164 000 190 000 174 000 200 000 241 000 180000 198000 225000
May 39 000 112 000 104 000 176 000 180 000 176 000 160 000 160 000 205 000 200000 185000 211000
June 37 000 108 000 108 000 157 000 184 000 177 000 151 000 149 000 207 000 220000 157000 202000
July 47 000 76 000 105 000 137 000 136 000 129 000 138 000 142 000 186 000 174000 141000 172000
August 45 000 81 000 90 000 104 000 140 000 148 000 151 000 161 000 179 000 160000 150000 187000
September 46 000 104 000 76 000 123 000 152 000 147 000 178 000 165 000 162 000 161000 162000 207000
October 47 000 93 000 98 000 159 000 149 000 145 000 159 000 160 000 151 000 173000 167000 196000
November 61 000 86 000 88 000 242 000 164 000 175 000 160 000 164 000 154 000 176000 165000 192000
December 76 000 92 000 96 000 245 000 163 000 167 000 174 000 181 000 155 000 204000 174000 208000
YEAR 46 333 90 833 104 833 147 833 153 667 167 417 166 083 175 333 193 083 181 083 176 583 204 750
USD ton 162 352 467 729 770 796 904 1 019 954 871 878 910
THE PEOPLErsquoS REPUBLIC OF CHINA (MAILAND)2001 2002 2003 2004 2005 2006 2007 2008 2009 2010 2011 2012 2013
( USD tonnes )
January 250 227 284 295 308 317 377 412 389 491 574
February 243 212 250 297 290 312 374 407 340 428 538
March 196 197 209 274 234 312 332 274 361 403 522
April 207 212 179 267 285 331 332 312 403 428 523
May 205 191 199 274 250 332 405 377 406 437 534
June 218 188 241 271 303 336 409 399 428 484 574
July 228 191 244 267 325 339 41 411 426 526 646
August 195 173 247 240 319 325 381 379 406 528 672
September 202 244 270 276 317 326 394 432 460 534 677
October 213 233 295 290 329 342 375 408 472 501 650
November 220 251 272 292 328 353 403 424 462 541 658
December 215 266 279 296 326 371 398 281 258 577 616
YEAR 216 215 247 278 301 333 352 376 401 490 599
Source United States official dataJapan Monthly Bulletin o Banana Statistics Japan Banana Importersrsquo AssociationFrance Marcheacutes Europeacuteens des Fruits et Leacutegumes Revue drsquoInormation Economique
8102019 Banana Import Export Global Stats
httpslidepdfcomreaderfullbanana-import-export-global-stats 32392727
Table 8 - Wholesalersrsquo selling prices in selected countries monthly Tableau 8 - Prix de vente en gros mensuels dans certains paysCuadro 8 - Precios mensuales de venta al por mayor en algunos paiacuteses
JAPAN
2001 2002 2003 2004 2005 2006 2007 2008 2009 2010 2011 2012 2013
( Yen kgs )
January 81 117 107 106 103 96 120 129 160 126 121 121 139
February 98 135 133 109 115 122 142 145 157 144 129 124 150
March 101 146 130 139 132 120 157 155 151 146 140 130 161
April 123 155 133 149 123 117 167 159 162 142 148 135 172
May 128 154 144 140 119 126 163 154 165 140 145 135 169
June 103 153 131 138 122 122 145 153 160 142 140 133 161
July 112 148 128 119 115 115 135 152 149 141 133 130 153August 106 116 125 101 112 115 134 150 140 135 122 125
September 113 130 126 108 115 128 138 158 137 129 125 119
October 101 128 117 113 107 134 132 178 130 120 133 118
November 102 102 98 113 98 123 128 164 122 101 131 116
December 97 95 98 109 80 111 125 151 116 101 122 121
YEAR 105 132 123 120 112 119 141 154 146 131 132 126 158
USD kg 087 105 106 111 101 102 119 149 156 149 166 157 162
UNITED STATES
2001 2002 2003 2004 2005 2006 2007 2008 2009 2010 2011 2012 2013
( USD kgs )
January 062 064 064 060 059 069 080 075 118 092 101 095 099
February 072 060 064 064 064 101 080 099 112 099 112 117 099
March 077 066 070 055 082 102 079 136 110 101 108 141 101
April 074 067 067 058 069 090 074 133 109 101 105 121 101
May 085 068 062 059 073 104 082 128 105 099 103 106 095
June 070 072 059 066 074 088 084 106 104 106 105 097 094
July 083 065 061 056 058 065 078 096 101 118 096 096 094
August 081 061 058 048 049 061 074 093 101 099 095 096 094
September 080 061 057 047 061 067 082 094 099 088 092 105 094
October 067 056 056 048 066 069 079 096 094 099 091 104 092
November 058 054 055 046 061 065 072 093 091 094 092 099 090
December 063 061 057 055 073 072 069 093 090 096 096 097 088
YEAR 073 063 061 055 066 079 078 104 103 099 100 106 095
8102019 Banana Import Export Global Stats
httpslidepdfcomreaderfullbanana-import-export-global-stats 33392828
Table 8 - Wholesalersrsquo selling prices in selected countries monthly Tableau 8 - Prix de vente en gros mensuels dans certains paysCuadro 8 - Precios mensuales de venta al por mayor en algunos paiacuteses
FRANCE
2001 2002 2003 2004 2005 2006 2007 2008 2009 2010 2011 2012 2013
( Euro kg )
January 084 079 093 081 100 098 090 090 085 079 101 087 104
February 093 095 097 082 112 107 097 105 094 083 122 104 107
March 115 107 103 097 120 103 099 113 122 093 106 105 105
April 115 103 094 093 114 094 097 104 110 094 095 105 105
May 099 090 079 093 112 091 090 081 096 093 091 105 101
June 086 078 080 094 126 094 086 081 091 096 079 105 097
July 092 069 063 082 089 071 078 081 080 085 074 092 090August 081 073 059 074 098 068 081 085 075 080 074 091 092
September 086 080 078 077 106 073 094 084 079 081 080 100 095
October 081 068 076 075 097 074 082 079 081 074 081 102 093
November 075 062 074 085 097 086 075 077 076 079 083 095 092
December 074 082 076 105 102 090 085 081 083 092 081 095
YEAR 090 082 081 086 106 087 088 088 089 086 089 099 098
USD kg 081 077 091 107 132 109 120 130 124 114 124 127 134
EUROPEAN UNION
2001 2002 2003 2004 2005 2006 2007 2008 2009 2010 2011 2012 2013
( Euro kg )
January 094 095 089 097 101 101 102 101 094 113 101 110
February 102 099 091 107 104 104 117 106 094 122 113 108
March 112 105 096 111 102 104 128 125 106 113 117 105
April 114 105 096 111 098 103 122 124 110 111 116 107
May 106 093 093 118 095 100 103 112 111 111 113 108
June 095 091 094 125 094 098 096 112 114 100 110 110
July 078 074 084 099 080 094 094 100 104 091 101
August 088 074 075 097 078 093 093 095 097 090 102
September 093 080 078 107 081 101 091 096 099 092 109
October 084 081 079 103 079 100 095 096 094 094 108
November 077 081 083 104 083 093 096 093 096 094 105
December 085 086 098 104 089 098 097 095 104 095 103
YEAR 094 089 088 107 090 099 103 105 102 102 108 108
USD kg 088 100 109 133 113 136 151 145 135 142 139 148
8102019 Banana Import Export Global Stats
httpslidepdfcomreaderfullbanana-import-export-global-stats 34392929
Table 8 - Wholesalersrsquo selling prices in selected countries monthly Tableau 8 - Prix de vente en gros mensuels dans certains paysCuadro 8 - Precios mensuales de venta al por mayor en algunos paiacuteses
THE PEOPLErsquoS REPUBLIC OF CHINA (MAILAND)
2001 2002 2003 2004 2005 2006 2007 2008 2009 2010 2011 2012 2013
( RMB kg )
January 294 305 333 282 309 310 357 351 304 433 494 385
February 376 319 316 292 324 345 375 343 346 475 508 431
March 369 288 319 275 342 380 366 345 356 511 486 451
April 370 285 342 276 368 334 383 391 407 611 465 478
May 301 278 355 274 386 289 371 457 456 566 432 526
June 264 260 338 272 386 257 356 444 483 415 414 527July 228 249 292 265 339 228 313 408 435 336 379
August 224 249 277 265 270 239 313 383 397 344 373
September 240 273 268 315 324 276 341 356 397 401 378
October 232 270 259 314 285 304 345 329 369 443 397
November 218 290 271 306 276 294 372 300 370 495 386
December 235 311 272 304 291 314 342 288 398 497 380
YEAR 279 281 304 287 325 298 353 366 393 461 424 466
USD kg 034 034 037 035 041 039 051 054 058 071 067 077
URUGUAY
2001 2002 2003 2004 2005 2006 2007 2008 2009 2010 2011 2012 2013
( Pesos uruguayos kg )
January 947 1041 981 1134 1384 1708 1799 1792 2014 1888
February 715 861 886 1160 1309 1603 1766 1605 1803 2102
March 892 937 859 1185 1394 1634 1812 187 1777 2174
April 1064 1025 925 1393 1433 1625 1927 1809 1802 2609
May 920 825 873 1111 1285 1519 1825 169 1744 2057
June 833 843 735 1157 1225 1545 1784 1758 174 2069
July 875 888 730 1267 1588 1874 176 1752 2195
August 837 974 893 1221 1414 1659 1969 182 1814 2092
September 891 887 1041 1256 1531 1607 1928 1844 1843 1909
October 1128 843 1248 1594 1545 1795 1963 1891 1867 1992
November 1107 812 1260 1478 1647 2068 1916 1944 1837 1915
December 860 925 1232 1397 2088 2001 1750 2174 1957
YEAR 922 905 972 1279 1478 1696 1859 1830 1829 2091
USD kg 033 032 040 053 063 081 082 091 095 103
8102019 Banana Import Export Global Stats
httpslidepdfcomreaderfullbanana-import-export-global-stats 35393030
Table 8 - Wholesalersrsquo selling prices in selected countries monthly Tableau 8 - Prix de vente en gros mensuels dans certains paysCuadro 8 - Precios mensuales de venta al por mayor en algunos paiacuteses
UNITED KINGDOM2001 2002 2003 2004 2005 2006 2007 2008 2009 2010 2011 2012 2013
( pence kg )
January 370 570 570 530 630 690 610 720 700 550 950 767 787
February 600 650 600 460 790 670 610 900 730 590 1020 877 778
March 760 720 700 550 690 560 570 850 1090 730 730 975 704
April 750 670 600 530 750 550 590 760 990 770 800 803 773
May 700 630 540 540 910 640 580 680 880 830 820 779 790
June 660 530 520 610 870 660 560 600 930 940 620 772 710
July 600 430 390 530 590 490 520 630 670 790 570 734 714
August 550 490 450 460 690 500 570 660 640 750 590 699
September 590 520 490 530 770 530 650 670 660 740 650 776
October 500 480 440 460 680 530 570 580 650 600 600 655
November 480 400 430 530 680 480 520 610 550 630 590 632
December 470 540 380 650 600 540 530 620 560 690 630 651
YEAR 586 553 509 532 721 570 573 690 754 718 714 760 751
USD kg 084 083 083 097 131 105 115 127 117 111 114 120 121
BANANA ORGANIC
USA
2008 2009 2010 2 011 2012 2013
( USD kg )
January 112 138 131 127 134 136
February 112 138 127 140 138 132
March 154 138 128 142 138 125
April 160 138 127 129 141 127
May 147 138 135 141 135
June 152 138 138 140 138
July 137 138 134 138 138
August 136 134 138 138 131
September 138 125 142 136 135
October 138 129 138 135 138
November 138 134 123 136 135
December 134 131 127 134 137
YEAR 138 135 132 136 136 131
SourceUnited States USDA C amp MS Fruit and Vegetable Division Market News daily reports
Japan Monthy Bulletin o Banana Statistics Japan Banana Importersrsquo Association
8102019 Banana Import Export Global Stats
httpslidepdfcomreaderfullbanana-import-export-global-stats 36393131
Table 9 - Retail prices in selected countries monthly Tableau 9 - Prix mensuels au detail dans certains paysCuadro 9 - Precios mensuales al por menor en algunos paiacuteses
FRANCE
2001 2002 2003 2004 2005 2006 2007 2008 2009 2010 2011 2012 2013
( Euro kg )
January 150 151 162 150 163 173 160 165 160 156 170 162 175
February 157 164 167 152 178 176 163 172 164 156 185 170 182
March 169 181 171 156 182 177 166 179 175 164 188 177 181
April 185 182 174 162 185 172 168 188 190 169 180 184 184
May 180 177 162 158 193 169 168 176 179 167 178 180 181
June 171 171 162 161 203 169 165 169 174 173 173 178 184
July 174 148 151 158 187 163 163 169 168 173 167 178 184
August 162 145 144 147 165 154 157 168 158 166 160 172 180
September 161 155 143 138 172 152 163 165 155 162 157 170 176
October 158 144 143 143 169 147 166 163 157 159 158 172 175
November 151 139 140 140 168 154 160 158 154 157 162 175 175
December 145 141 147 161 174 157 163 158 153 163 161 175 176
YEAR 164 158 156 152 178 164 164 169 166 164 170 174 179
USD kg 146 149 176 189 222 205 224 248 230 217 236 224 245
HUNGARY2001 2002 2003 2004 2005 2006 2007 2008 2009 2010 2011 2012 2013
( Forint kg )
January 251 263 293 251 309 345 329 338 348 323 374 358 399
February 239 263 283 249 313 339 334 348 364 323 421 407 407
March 246 280 283 261 340 339 326 392 421 338 427 425 408
April 284 312 286 276 343 345 338 410 468 357 396 424 404
May 247 302 270 289 347 345 336 361 431 349 392 419
June 221 288 264 310 376 356 319 332 406 371 364 398
July 257 247 248 303 343 340 314 311 389 377 319 372
August 239 248 249 281 317 327 316 313 351 362 297 361
September 252 272 252 258 324 328 329 319 340 361 306 381
October 244 253 250 258 325 302 338 318 331 326 324 395
November 229 233 234 254 345 316 326 303 320 330 343 394
December 245 252 232 294 339 320 320 307 309 350 343 376
YEAR 246 268 262 274 335 334 327 338 373 347 359 393 405
USD ton 086 104 117 135 168 159 178 196 184 167 178 174 188
8102019 Banana Import Export Global Stats
httpslidepdfcomreaderfullbanana-import-export-global-stats 37393232
Table 9 - Retail prices in selected countries monthly Tableau 9 - Prix mensuels au detail dans certains paysCuadro 9 - Precios mensuales al por menor en algunos paiacuteses
UNITED STATES
2001 2002 2003 2004 2005 2006 2007 2008 2009 2010 2011 2012 2013
( USD kg )
January 108 112 116 113 107 108 111 115 139 129 131 133 134
February 116 111 112 111 111 112 112 119 141 129 138 133 135
March 114 114 113 110 112 112 112 132 140 127 137 134 134
April 112 111 113 111 111 112 114 138 139 128 137 133 132
May 112 114 111 108 110 113 111 139 137 126 136 132 133
June 112 113 115 110 109 113 113 140 139 127 135 133 133
July 113 114 113 112 109 112 112 138 136 129 135 133 133
August 108 110 113 112 107 108 112 140 135 127 134 131 131
September 108 110 109 108 107 106 111 139 133 126 134 132 132
October 109 111 108 107 108 108 112 138 132 128 134 133 129
November 106 111 110 103 106 108 114 138 124 128 132 132 129
December 107 111 111 104 106 110 116 136 126 129 132 134 131
YEAR 110 112 112 109 109 110 113 134 135 128 135 133 132
JAPAN
2001 2002 2003 2004 2005 2006 2007 2008 2009 2010 2011 2012 2013
( Yen kg )
January 218 225 235 232 243 222 236 217 224 225 221 207
February 224 239 241 249 239 230 236 226 235 228 220 201
March 237 260 243 248 242 240 238 229 238 232 225 207
April 237 257 241 257 238 251 244 226 255 229 227 211
May 262 262 242 260 245 250 240 226 252 236 218 205
June 282 258 229 262 250 253 240 231 248 227 216 200
July 278 254 229 262 252 246 229 232 240 226 220 200
August 308 246 219 261 241 229 232 232 241 222 210 202
September 295 257 229 257 240 230 232 231 239 230 215 205
October 279 259 230 259 239 235 227 228 238 219 225 194November 255 260 223 245 231 231 222 221 236 218 216 193
December 233 241 220 237 220 230 219 221 233 218 193
YEAR 259 252 232 252 240 237 233 227 240 226 219 202
USD kg 213 201 200 233 218 204 198 219 256 257 275 253
8102019 Banana Import Export Global Stats
httpslidepdfcomreaderfullbanana-import-export-global-stats 38393333
Table 9 - Retail prices in selected countries monthly Tableau 9 - Prix mensuels au detail dans certains paysCuadro 9 - Precios mensuales al por menor en algunos paiacuteses
THE PEOPLErsquoS REPUBLIC OF CHINA (MAILAND)
2001 2002 2003 2004 2005 2006 2007 2008 2009 2010 2011 2012 2013
( RMB kg )
January 325 350 385 335 345 365 415 410 365 495 55
February 410 375 395 350 365 395 435 415 420 545 595
March 420 335 365 345 385 425 450 425 435 58 58
April 435 340 375 350 410 435 460 465 490 67 54
May 395 365 385 365 425 325 455 510 530 63 53
June 320 380 365 370 430 290 425 490 565 5 51
July 295 305 365 360 370 260 400 485 587 46 48
August 285 315 345 365 325 280 410 465 490 45 45
September 290 335 350 385 390 285 425 430 510 49 485
October 310 355 368 390 335 360 438 425 480 53 52
November 305 376 370 375 315 340 465 390 450 575 49
December 310 395 375 380 320 375 350 385 470 59 495
YEAR 342 352 370 364 368 345 427 441 483 543 519
USD kg 041 043 045 044 046 045 061 065 071 084 082
8102019 Banana Import Export Global Stats
httpslidepdfcomreaderfullbanana-import-export-global-stats 3939

8102019 Banana Import Export Global Stats
httpslidepdfcomreaderfullbanana-import-export-global-stats 24391919
Table 5 - Exports by countries of destination 1
Tableau 5 - Exportations par pays de destination 1
Cuadro 5 - Exportaciones por paiacuteses de destino 1
2002 2003 2004 2005 2006 2007 2008 2009 2010 2011 2012
(prel)
( thousand tonnes milliers de tonnes miles de toneladas )
PERU
O
United States 112 135 122 231 264 179 239 198 198 235 278
Belgium 39 22 61 92 100 48 72 38 71 55 72
Netherlands 03 02 47 59 115 277 320 432 457 609 659
Germany 33 - 04 04 44 67 57 34 59 32 55
Japan 01 34 42 44 79 73 101 79 88 118
Others 04 20 04 01 04 05 22 30 30 69 57
TOTAL 191 181 273 429 571 655 782 833 894 1088 1238
SAINT LUCIA
O
United Kingdom 493 348 417 300 341 239 393 332 232 61 120
Others 00 00 14 07 08 17 19 00 00 01 01
TOTAL 493 348 431 307 349 256 412 332 232 62 121
STVINCENT amp GRENADINES
O
United Kingdom 344 285 240 204 180 182 114 75 41 08 07
Others 25 00 00 48 58 66 100 106 81 102 103
TOTAL 369 285 240 252 238 248 214 181 121 110 110
SURINAME
O
United Kingdom 280 - 47 98 11
France 62 257 454 562 654 570
Others 00 104 40 09 - 00 - 00 00 791 629 831
TOTAL 280 01 214 396 474 562 654 570 791 629 831
1 As declared by exporting countries1 Comme declareacute par les pays exportateurs1 De acuerdo a lo declarado por los paiacuteses exportadores
8102019 Banana Import Export Global Stats
httpslidepdfcomreaderfullbanana-import-export-global-stats 25392020
Table 6 - Gross Imports by countries of origin 1
Tableau 6 - Importations brutes par pays drsquoorigine 1
Cuadro 6 - Importaciones brutas por paiacuteses de origen 1
2002 2003 2004 2005 2006 2007 2008 2009 2010 2011 2012
(prel)
( thousand tonnes milliers de tonnes miles de toneladas )
ARGENTINA
FROM
Ecuador 471 1168 1600 1415 1658 1840 2149 1973 2127 2397 2245
Brazil 1648 1293 903 981 561 583 338 523 386 232 394
Bolivia 146 249 407 557 641 647 706 780 753 994 873
Others 31 153 123 70 97 119 275 165 245 326 254
TOTAL 2295 2864 3033 3022 2957 3189 3468 3441 3511 3949 3766
CANADAFROM
Costa Rica 881 1196 1061 927 881 1253 1154 710 1058 1178 1159
Ecuador 1282 1048 821 780 942 1003 1210 1642 1472 1104 1392
Colombia 1202 1149 1297 1637 1741 1379 1218 1289 1145 963 1298
Honduras 310 287 353 206 101 235 292 175 295 274 275
Mexico 111 102 47 10 20 15 28 16 14 20 20
Guatemala 310 429 782 855 794 754 814 931 897 1475 1055
Panama 01 00 - 19 53 39 29 25 37 10 30
Dominican Rep 02 01 07 01 06 04 01 02 01 01 02
Others 75 17 56 55 42 36 31 31 41 41 39TOTAL 4174 4228 4423 4490 4580 4718 4776 4820 4961 5066 5270
CHILE
FROM
Ecuador 1472 1569 1585 1670 1630 1698 1659 1730 1738 1766 1825
Others 19 20 18 283 59 84 91 63 19 78 81
TOTAL 1491 1589 1602 1953 1689 1782 1750 1793 1757 1844 1906
CHINA
FROM
Philippines 2665 3111 2858 3038 3434 3038 3178 3521 4367 6939 4964
Ecuador 284 285 241 154 42 30 70 22 89 477
Tailand 06 18 57 96 138 152 176 104 163 225
Myanmar 01 01 44 943 1770 549 445
Vietnam 424 798 652 268 292 100 217 192 315 393 93
Others 98 00 01 00 152 02 03 11 74 55 142
TOTAL 3478 4212 3809 3557 3878 3319 3623 4913 6652 8187 6346
8102019 Banana Import Export Global Stats
httpslidepdfcomreaderfullbanana-import-export-global-stats 26392121
Table 6 - Gross Imports by countries of origin 1
Tableau 6 - Importations brutes par pays drsquoorigine 1
Cuadro 6 - Importaciones brutas por paiacuteses de origen 1
2002 2003 2004 2005 2006 2007 2008 2009 2010 2011 2012
(prel)
( thousand tonnes milliers de tonnes miles de toneladas )
EC (27) 2
FROM
Ecuador 1 1570 1 1488 1 1208 1 2392 1 1993 1 1858 1 3306 1 3431 1 2242 1 3412 1 3074
Colombia 7680 7992 7665 8824 9514 1 1561 1 2782 1 2408 1 1610 1 1366 1 1344
Costa Rica 7463 8020 8564 6345 8340 9714 8951 7572 7765 8450 7702
Panama 3962 3815 3708 2816 3130 3541 2946 1851 1844 1597 1436
Cote drsquoIvoire 2167 2074 2108 1838 2218 1894 2166 2292 2443 2241 2249
Cameroon 2365 2985 2612 2529 2527 2218 2795 2497 2430 2352 2139
Dominican Rep 973 1119 1013 1447 1768 2064 1705 2283 3037 3269 2946
Peru 68 57 96 115 227 336 389 441 516 658 814
Belize 387 738 803 742 732 624 821 798 788 711 993
Ghana 33 09 18 42 223 341 460 365 524 472 507
Saint Lucia 493 325 429 282 367 305 385 333 232 62 121
Jamaica 406 418 287 117 319 184 - - - -
Honduras 345 252 212 231 218 316 240 85 152 175 57
Saint Vincent amp the Grenadines 325 209 240 159 172 138 90 75 41 08 07
Guatemala 10 69 22 30 307 188 143 49 33 30 46
Dominica 175 105 122 128 133 73 103 369 37 41 23
Others 569 682 1007 1244 1549 1563 1593 611 1469 1272 1483
TOTAL 3 8991 4 0358 4 0112 3 9281 4 3737 4 6917 4 8873 4 5459 4 5161 4 6114 4 49412 Source European Community
JAPAN
FROM
Philippines 7435 7956 8696 9445 9106 8790 1 0193 1 1591 1 0355 1 0044 1 0267
Ecuador 1570 1456 1227 911 1013 521 462 618 461 343 359
China 251 335 182 151 159 189 90 88 95 84 84
Indonesia - - - - - - - - - - -
Others 106 120 154 162 158 207 182 229 180 170 154
TOTAL 9363 9866 1 0260 1 0669 1 0436 9706 1 0927 1 2526 1 1091 1 0641 1 0864
NEW ZEALAND
FROM
Ecuador 562 308 291 354 326 308 273 258 288 250 279
Philippines 110 360 356 419 481 493 526 500 524 556 526
Panama - - 14 01 01
Others 01 03 01 00 00 04 00 04 01 02 03
TOTAL 673 672 661 775 809 805 800 763 813 809 807
8102019 Banana Import Export Global Stats
httpslidepdfcomreaderfullbanana-import-export-global-stats 27392222
Table 6 - Gross Imports by countries of origin 1
Tableau 6 - Importations brutes par pays drsquoorigine 1
Cuadro 6 - Importaciones brutas por paiacuteses de origen 1
2002 2003 2004 2005 2006 2007 2008 2009 2010 2011 2012
(prel)
( thousand tonnes milliers de tonnes miles de toneladas )
NORWAY
FROM
Panama 07 28 34 54 68 77 108 92 100 97 95
Costa Rica 260 307 339 425 382 373 343 239 244 261 256
Ecuador 52 67 88 95 175 160 183 300 276 329 324
Colombia 276 223 187 136 79 152 181 162 148 77 75
Others 04 10 14 22 41 21 20 19 18 18 18
TOTAL 598 634 662 732 746 785 835 812 785 782 769
ROMANIA
FROM
Ecuador 547 341 973 1272 1357
Colombia 60 19 39 29 39
Costa Rica 12 17 52 101 55
Honduras 28 28 40
Others 19 52 05 01 53
TOTAL 639 429 1097 1432 1543
RUSSIAN FEDERATION
FROM
Ecuador 5922 7233 7892 7911 7976 9202 9030 9112 9766 1 1999 1 1530
Costa Rica 09 175 10 155 275 21 659 326 482 386 446
China 65 54 41 26 15 30
Colombia 157 212 393 280 205 219 02 52 95 182 123
Vietnam 13 13 12 03 03 08 04
Philippines 139 208 232 212 304 251 315 245 298 355 335
Others 259 180 30 92 194 27 05 25 16 139 72
TOTAL 6500 8021 8569 8649 8954 9787 1 0068 9809 1 0686 1 3076 1 2536
SWITZERLAND
FROM
Costa Rica 383 367 294 278 240 264 184 172 161 156 154
Panama 70 40 40 65 98 125 204 155 165 118 117
Colombia 131 126 175 133 129 87 96 131 132 185 183
Ecuador 55 74 136 180 207 239 250 250 234 224 222
Honduras 01 06 06 01 - -
Others 104 109 84 85 67 68 87 100 106 111 110
TOTAL 743 722 735 742 741 782 821 808 799 794 786
8102019 Banana Import Export Global Stats
httpslidepdfcomreaderfullbanana-import-export-global-stats 28392323
Table 6 - Gross Imports by countries of origin 1
Tableau 6 - Importations brutes par pays drsquoorigine 1
Cuadro 6 - Importaciones brutas por paiacuteses de origen 1
2002 2003 2004 2005 2006 2007 2008 2009 2010 2011 2012
(prel)
( thousand tonnes milliers de tonnes miles de toneladas )
SLOVAKIA
FROM
Ecuador 58 63 15
Costa Rica 135 195 77
Colombia 163 161 60
Panama 119 89 35
Others 12 25 312
TOTAL 487 533 499
TUNISIAFROM
Cameroon 05 - 02 - - 01 05 - - -
Cocircte DrsquoIvoire - - 07 21 38 51 01 - -
Colombia 24 - 30 11 02 46 11 - - 03
Costa Rica - - 10 06 - - 01 18 53 44
Ecuador 133 138 491 169 161 289 313 349 134 366
Others 00 00 03 02 01 23 05 04 00 - 00
TOTAL 163 138 543 208 203 410 335 371 187 413
UNITED STATESFROM
Costa Rica 9015 9761 8653 8227 9274 1 0369 8744 5629 8536 8445 8482
Ecuador 1 0218 9725 9189 9043 9943 9292 8303 9576 9798 8790 7197
Honduras 4492 4321 5079 4530 4229 4827 5056 3887 4357 4452 5357
Guatemala 9252 9341 1 0208 1 0293 9129 1 0934 1 1887 1 1122 1 1515 1 3335 1 4586
Colombia 5064 4693 4646 5137 4738 3772 4508 4216 4609 3845 4402
Mexico 423 352 336 338 386 315 663 1052 1455 1486 2233
Panama 03 02 06 20 75 05 80 54 290 278 592
Nicaragua 297 416 415 381 305 328 311 249 360 356 363
Peru 232 138 124 223 251 178 225 197 201 232 259
Venezuela 37 19 20 07 03 - - - - - -
Dominican Rep 36 21 52 44 62 17 01 10 01 07 27
Others 01 02 00 00 - 00 00 00 00 26 01 - 00
TOTAL 3 9070 3 8792 3 8728 3 8244 3 8395 4 0038 3 9779 3 5992 4 1149 4 1227 4 3497
URUGUAY
FROM
Brazil 408 402 430 457 424 384 382 321 436 390 292
Ecuador 28 01 03 16 19 35 48 42 65 115 142
Others 02 07 04 00 04 01 - 00 53 05 09 14
TOTAL 438 411 437 473 446 420 430 416 506 515 4471 Figures may differ rom those shown in able 3 (a) which exclude re-exports1 Les chiffres dans ce tableau peuvent differer des chiffres du ableau 3 (a) qui ne comprennent pas les reacuteexportations1 Las ciras pueden dierir de las del Cuadro 3 (a) las cuales excluyen las reexportaciones
8102019 Banana Import Export Global Stats
httpslidepdfcomreaderfullbanana-import-export-global-stats 29392424
Table 7 - Import prices in selected countries monthly Tableau 7 - Prix agrave lrsquoimportation mensuels dans certains paysCuadro 7 - Precios mensuales de importacioacuten en algunos paiacuteses
FRANCE
2001 2002 2003 2004 2005 2006 2007 2008 2009 2010 2011 2012 2013
( Euro tonnes )
January 572 547 620 474 623 630 620 - 658 524 794 678 770
February 636 723 628 500 753 770 700 780 720 623 923 820 820
March 865 733 698 640 798 690 700 843 962 720 755 820 770
April 795 608 600 603 810 640 698 820 878 680 760 808 763
May 652 546 528 568 860 608 633 593 715 686 680 730 710
June 580 478 476 615 888 585 594 588 668 755 513 695 688
July 565 340 360 485 498 380 565 605 528 624 440 590 660
August 550 488 298 480 664 510 608 658 490 610 483 600 660
September 615 537 460 430 753 510 338 650 563 590 573 690 660
October 530 407 383 383 673 490 - 583 538 505 586 706 618
November 410 320 410 553 723 590 - 568 527 550 605 665 623
December 460 580 490 660 716 620 - 610 545 700 580 682 660
YEAR 603 525 496 533 730 585 606 663 649 631 641 707 700
USD ton 539 494 560 661 907 734 829 972 902 835 891 908 957
JAPAN2001 2002 2003 2004 2005 2006 2007 2008 2009 2010 2011 2012 2013
( Yen tonnes )
January 44 700 54 800 54700 52700 54900 46400 57700 55300 68100 55000 53000 52100 67800
February 49 100 66 000 60000 56600 56600 58200 64200 58400 69900 61900 56500 56900 71200
March 50 700 71 600 62700 65900 64600 58200 66400 63800 72600 68800 64500 65200 77100
April 54 000 83 200 66800 76400 66800 62900 79300 79100 82100 78300 74100 72200 82100
May 60 500 84 400 72800 70200 61600 64600 78700 82600 88300 77800 78500 72300 92500
June 54 400 80 100 68800 70900 65700 63600 73100 80800 88100 74700 75800 71100 89600
July 53 800 78 700 66400 64300 61900 63600 65000 83500 85500 71700 86200 69600 86600
August 56 500 64 000 68300 52800 60400 61200 64100 84300 81200 69400 72600 66400
September 60 600 65 900 69200 56500 60900 64600 72000 90900 74300 68500 68200 62000
October 53 500 63 700 58200 55100 57000 65100 65700 85600 64200 60900 61600 61000
November 48 700 54 400 51600 55600 49500 60600 59000 80400 58100 48500 60600 59100
December 48 900 50 800 49100 56100 47900 55300 56500 67100 52100 52100 55400 59900
YEAR 52 950 68 133 62 383 61 092 58 983 60 358 66 808 75 983 73 708 65 633 67 250 63 983 80986
USD kg 436 543 538 565 535 519 567 735 788 748 843 802 829
8102019 Banana Import Export Global Stats
httpslidepdfcomreaderfullbanana-import-export-global-stats 30392525
Table 7 - Import prices in selected countries monthly Tableau 7 - Prix agrave lrsquoimportation mensuels dans certains paysCuadro 7 - Precios mensuales de importacioacuten en algunos paiacuteses
UNITED STATES
2001 2002 2003 2004 2005 2006 2007 2008 2009 2010 2011 2012 2013
( USD tonnes )
January 535 427 561 427 589 686 639 689 820 785 892 945 929
February 687 517 462 496 891 854 655 792 944 720 1 002 1 068 923
March 541 572 486 513 792 825 648 1027 909 838 996 1 144 937
April 551 544 384 529 593 730 648 967 890 825 1 027 1 030 903
May 637 626 296 556 618 926 689 923 830 799 1 011 953 909
June 610 648 308 604 486 655 779 868 854 962 976 954 910
July 698 537 296 61 401 560 734 722 827 985 961 965 923
August 683 420 286 548 405 542 697 799 834 899 951 951 940
September 572 486 312 539 594 544 665 803 818 880 947 965 937
October 484 544 328 496 630 549 659 807 810 916 954 956 931
November 496 396 408 492 589 598 651 903 834 908 956 934 923
December 506 625 370 496 646 658 648 830 796 900 942 944 923
YEAR 583 529 375 480 603 677 676 844 847 868 968 984 924
EUROPEAN UNION
2001 2002 2003 2004 2005 2006 2007 2008 2009 2010 2011 2012 2013
( Euro tonnes )
January 590 590 590 590 610 580 600 600 570 630 610 610
February 610 590 600 610 600 590 560 610 580 640 620 620
March 630 610 640 660 600 590 620 660 600 630 630 620
April 640 620 620 630 610 580 640 660 620 620 640
May 620 590 640 640 590 590 610 630 610 610 630
June 600 590 640 680 570 580 590 630 640 600 630
July 560 560 620 610 550 570 590 600 630 590 620
August 600 540 600 610 530 550 580 590 600 570 630
September 610 570 600 630 550 570 610 570 600 580 620
October 580 580 590 620 550 580 600 570 600 590 610November 560 560 600 640 580 580 590 580 600 580 620
December 590 580 620 630 570 560 600 550 610 610 620
YEAR 599 582 613 629 576 577 599 604 605 604 623 617
USD ton 564 656 762 782 722 789 878 839 801 840 801 843
8102019 Banana Import Export Global Stats
httpslidepdfcomreaderfullbanana-import-export-global-stats 31392626
Table 7 - Import prices in selected countries monthly Tableau 7 - Prix agrave lrsquoimportation mensuels dans certains paysCuadro 7 - Precios mensuales de importacioacuten en algunos paiacuteses
HUNGARY
2001 2002 2003 2004 2005 2006 2007 2008 2009 2010 2011 2012 2013
( Forint tonnes )
January 40 000 74 000 115 000 105 000 62 000 181 000 181 000 186 000 188 000 158000 210000 197000
February 39 000 76 000 119 000 109 000 171 000 189 000 189 000 210 000 221 000 172000 213000 236000
March 39 000 83 000 122 000 105 000 179 000 185 000 178 000 226 000 268 000 195000 197000 224000
April 40 000 105 000 137 000 112 000 164 000 190 000 174 000 200 000 241 000 180000 198000 225000
May 39 000 112 000 104 000 176 000 180 000 176 000 160 000 160 000 205 000 200000 185000 211000
June 37 000 108 000 108 000 157 000 184 000 177 000 151 000 149 000 207 000 220000 157000 202000
July 47 000 76 000 105 000 137 000 136 000 129 000 138 000 142 000 186 000 174000 141000 172000
August 45 000 81 000 90 000 104 000 140 000 148 000 151 000 161 000 179 000 160000 150000 187000
September 46 000 104 000 76 000 123 000 152 000 147 000 178 000 165 000 162 000 161000 162000 207000
October 47 000 93 000 98 000 159 000 149 000 145 000 159 000 160 000 151 000 173000 167000 196000
November 61 000 86 000 88 000 242 000 164 000 175 000 160 000 164 000 154 000 176000 165000 192000
December 76 000 92 000 96 000 245 000 163 000 167 000 174 000 181 000 155 000 204000 174000 208000
YEAR 46 333 90 833 104 833 147 833 153 667 167 417 166 083 175 333 193 083 181 083 176 583 204 750
USD ton 162 352 467 729 770 796 904 1 019 954 871 878 910
THE PEOPLErsquoS REPUBLIC OF CHINA (MAILAND)2001 2002 2003 2004 2005 2006 2007 2008 2009 2010 2011 2012 2013
( USD tonnes )
January 250 227 284 295 308 317 377 412 389 491 574
February 243 212 250 297 290 312 374 407 340 428 538
March 196 197 209 274 234 312 332 274 361 403 522
April 207 212 179 267 285 331 332 312 403 428 523
May 205 191 199 274 250 332 405 377 406 437 534
June 218 188 241 271 303 336 409 399 428 484 574
July 228 191 244 267 325 339 41 411 426 526 646
August 195 173 247 240 319 325 381 379 406 528 672
September 202 244 270 276 317 326 394 432 460 534 677
October 213 233 295 290 329 342 375 408 472 501 650
November 220 251 272 292 328 353 403 424 462 541 658
December 215 266 279 296 326 371 398 281 258 577 616
YEAR 216 215 247 278 301 333 352 376 401 490 599
Source United States official dataJapan Monthly Bulletin o Banana Statistics Japan Banana Importersrsquo AssociationFrance Marcheacutes Europeacuteens des Fruits et Leacutegumes Revue drsquoInormation Economique
8102019 Banana Import Export Global Stats
httpslidepdfcomreaderfullbanana-import-export-global-stats 32392727
Table 8 - Wholesalersrsquo selling prices in selected countries monthly Tableau 8 - Prix de vente en gros mensuels dans certains paysCuadro 8 - Precios mensuales de venta al por mayor en algunos paiacuteses
JAPAN
2001 2002 2003 2004 2005 2006 2007 2008 2009 2010 2011 2012 2013
( Yen kgs )
January 81 117 107 106 103 96 120 129 160 126 121 121 139
February 98 135 133 109 115 122 142 145 157 144 129 124 150
March 101 146 130 139 132 120 157 155 151 146 140 130 161
April 123 155 133 149 123 117 167 159 162 142 148 135 172
May 128 154 144 140 119 126 163 154 165 140 145 135 169
June 103 153 131 138 122 122 145 153 160 142 140 133 161
July 112 148 128 119 115 115 135 152 149 141 133 130 153August 106 116 125 101 112 115 134 150 140 135 122 125
September 113 130 126 108 115 128 138 158 137 129 125 119
October 101 128 117 113 107 134 132 178 130 120 133 118
November 102 102 98 113 98 123 128 164 122 101 131 116
December 97 95 98 109 80 111 125 151 116 101 122 121
YEAR 105 132 123 120 112 119 141 154 146 131 132 126 158
USD kg 087 105 106 111 101 102 119 149 156 149 166 157 162
UNITED STATES
2001 2002 2003 2004 2005 2006 2007 2008 2009 2010 2011 2012 2013
( USD kgs )
January 062 064 064 060 059 069 080 075 118 092 101 095 099
February 072 060 064 064 064 101 080 099 112 099 112 117 099
March 077 066 070 055 082 102 079 136 110 101 108 141 101
April 074 067 067 058 069 090 074 133 109 101 105 121 101
May 085 068 062 059 073 104 082 128 105 099 103 106 095
June 070 072 059 066 074 088 084 106 104 106 105 097 094
July 083 065 061 056 058 065 078 096 101 118 096 096 094
August 081 061 058 048 049 061 074 093 101 099 095 096 094
September 080 061 057 047 061 067 082 094 099 088 092 105 094
October 067 056 056 048 066 069 079 096 094 099 091 104 092
November 058 054 055 046 061 065 072 093 091 094 092 099 090
December 063 061 057 055 073 072 069 093 090 096 096 097 088
YEAR 073 063 061 055 066 079 078 104 103 099 100 106 095
8102019 Banana Import Export Global Stats
httpslidepdfcomreaderfullbanana-import-export-global-stats 33392828
Table 8 - Wholesalersrsquo selling prices in selected countries monthly Tableau 8 - Prix de vente en gros mensuels dans certains paysCuadro 8 - Precios mensuales de venta al por mayor en algunos paiacuteses
FRANCE
2001 2002 2003 2004 2005 2006 2007 2008 2009 2010 2011 2012 2013
( Euro kg )
January 084 079 093 081 100 098 090 090 085 079 101 087 104
February 093 095 097 082 112 107 097 105 094 083 122 104 107
March 115 107 103 097 120 103 099 113 122 093 106 105 105
April 115 103 094 093 114 094 097 104 110 094 095 105 105
May 099 090 079 093 112 091 090 081 096 093 091 105 101
June 086 078 080 094 126 094 086 081 091 096 079 105 097
July 092 069 063 082 089 071 078 081 080 085 074 092 090August 081 073 059 074 098 068 081 085 075 080 074 091 092
September 086 080 078 077 106 073 094 084 079 081 080 100 095
October 081 068 076 075 097 074 082 079 081 074 081 102 093
November 075 062 074 085 097 086 075 077 076 079 083 095 092
December 074 082 076 105 102 090 085 081 083 092 081 095
YEAR 090 082 081 086 106 087 088 088 089 086 089 099 098
USD kg 081 077 091 107 132 109 120 130 124 114 124 127 134
EUROPEAN UNION
2001 2002 2003 2004 2005 2006 2007 2008 2009 2010 2011 2012 2013
( Euro kg )
January 094 095 089 097 101 101 102 101 094 113 101 110
February 102 099 091 107 104 104 117 106 094 122 113 108
March 112 105 096 111 102 104 128 125 106 113 117 105
April 114 105 096 111 098 103 122 124 110 111 116 107
May 106 093 093 118 095 100 103 112 111 111 113 108
June 095 091 094 125 094 098 096 112 114 100 110 110
July 078 074 084 099 080 094 094 100 104 091 101
August 088 074 075 097 078 093 093 095 097 090 102
September 093 080 078 107 081 101 091 096 099 092 109
October 084 081 079 103 079 100 095 096 094 094 108
November 077 081 083 104 083 093 096 093 096 094 105
December 085 086 098 104 089 098 097 095 104 095 103
YEAR 094 089 088 107 090 099 103 105 102 102 108 108
USD kg 088 100 109 133 113 136 151 145 135 142 139 148
8102019 Banana Import Export Global Stats
httpslidepdfcomreaderfullbanana-import-export-global-stats 34392929
Table 8 - Wholesalersrsquo selling prices in selected countries monthly Tableau 8 - Prix de vente en gros mensuels dans certains paysCuadro 8 - Precios mensuales de venta al por mayor en algunos paiacuteses
THE PEOPLErsquoS REPUBLIC OF CHINA (MAILAND)
2001 2002 2003 2004 2005 2006 2007 2008 2009 2010 2011 2012 2013
( RMB kg )
January 294 305 333 282 309 310 357 351 304 433 494 385
February 376 319 316 292 324 345 375 343 346 475 508 431
March 369 288 319 275 342 380 366 345 356 511 486 451
April 370 285 342 276 368 334 383 391 407 611 465 478
May 301 278 355 274 386 289 371 457 456 566 432 526
June 264 260 338 272 386 257 356 444 483 415 414 527July 228 249 292 265 339 228 313 408 435 336 379
August 224 249 277 265 270 239 313 383 397 344 373
September 240 273 268 315 324 276 341 356 397 401 378
October 232 270 259 314 285 304 345 329 369 443 397
November 218 290 271 306 276 294 372 300 370 495 386
December 235 311 272 304 291 314 342 288 398 497 380
YEAR 279 281 304 287 325 298 353 366 393 461 424 466
USD kg 034 034 037 035 041 039 051 054 058 071 067 077
URUGUAY
2001 2002 2003 2004 2005 2006 2007 2008 2009 2010 2011 2012 2013
( Pesos uruguayos kg )
January 947 1041 981 1134 1384 1708 1799 1792 2014 1888
February 715 861 886 1160 1309 1603 1766 1605 1803 2102
March 892 937 859 1185 1394 1634 1812 187 1777 2174
April 1064 1025 925 1393 1433 1625 1927 1809 1802 2609
May 920 825 873 1111 1285 1519 1825 169 1744 2057
June 833 843 735 1157 1225 1545 1784 1758 174 2069
July 875 888 730 1267 1588 1874 176 1752 2195
August 837 974 893 1221 1414 1659 1969 182 1814 2092
September 891 887 1041 1256 1531 1607 1928 1844 1843 1909
October 1128 843 1248 1594 1545 1795 1963 1891 1867 1992
November 1107 812 1260 1478 1647 2068 1916 1944 1837 1915
December 860 925 1232 1397 2088 2001 1750 2174 1957
YEAR 922 905 972 1279 1478 1696 1859 1830 1829 2091
USD kg 033 032 040 053 063 081 082 091 095 103
8102019 Banana Import Export Global Stats
httpslidepdfcomreaderfullbanana-import-export-global-stats 35393030
Table 8 - Wholesalersrsquo selling prices in selected countries monthly Tableau 8 - Prix de vente en gros mensuels dans certains paysCuadro 8 - Precios mensuales de venta al por mayor en algunos paiacuteses
UNITED KINGDOM2001 2002 2003 2004 2005 2006 2007 2008 2009 2010 2011 2012 2013
( pence kg )
January 370 570 570 530 630 690 610 720 700 550 950 767 787
February 600 650 600 460 790 670 610 900 730 590 1020 877 778
March 760 720 700 550 690 560 570 850 1090 730 730 975 704
April 750 670 600 530 750 550 590 760 990 770 800 803 773
May 700 630 540 540 910 640 580 680 880 830 820 779 790
June 660 530 520 610 870 660 560 600 930 940 620 772 710
July 600 430 390 530 590 490 520 630 670 790 570 734 714
August 550 490 450 460 690 500 570 660 640 750 590 699
September 590 520 490 530 770 530 650 670 660 740 650 776
October 500 480 440 460 680 530 570 580 650 600 600 655
November 480 400 430 530 680 480 520 610 550 630 590 632
December 470 540 380 650 600 540 530 620 560 690 630 651
YEAR 586 553 509 532 721 570 573 690 754 718 714 760 751
USD kg 084 083 083 097 131 105 115 127 117 111 114 120 121
BANANA ORGANIC
USA
2008 2009 2010 2 011 2012 2013
( USD kg )
January 112 138 131 127 134 136
February 112 138 127 140 138 132
March 154 138 128 142 138 125
April 160 138 127 129 141 127
May 147 138 135 141 135
June 152 138 138 140 138
July 137 138 134 138 138
August 136 134 138 138 131
September 138 125 142 136 135
October 138 129 138 135 138
November 138 134 123 136 135
December 134 131 127 134 137
YEAR 138 135 132 136 136 131
SourceUnited States USDA C amp MS Fruit and Vegetable Division Market News daily reports
Japan Monthy Bulletin o Banana Statistics Japan Banana Importersrsquo Association
8102019 Banana Import Export Global Stats
httpslidepdfcomreaderfullbanana-import-export-global-stats 36393131
Table 9 - Retail prices in selected countries monthly Tableau 9 - Prix mensuels au detail dans certains paysCuadro 9 - Precios mensuales al por menor en algunos paiacuteses
FRANCE
2001 2002 2003 2004 2005 2006 2007 2008 2009 2010 2011 2012 2013
( Euro kg )
January 150 151 162 150 163 173 160 165 160 156 170 162 175
February 157 164 167 152 178 176 163 172 164 156 185 170 182
March 169 181 171 156 182 177 166 179 175 164 188 177 181
April 185 182 174 162 185 172 168 188 190 169 180 184 184
May 180 177 162 158 193 169 168 176 179 167 178 180 181
June 171 171 162 161 203 169 165 169 174 173 173 178 184
July 174 148 151 158 187 163 163 169 168 173 167 178 184
August 162 145 144 147 165 154 157 168 158 166 160 172 180
September 161 155 143 138 172 152 163 165 155 162 157 170 176
October 158 144 143 143 169 147 166 163 157 159 158 172 175
November 151 139 140 140 168 154 160 158 154 157 162 175 175
December 145 141 147 161 174 157 163 158 153 163 161 175 176
YEAR 164 158 156 152 178 164 164 169 166 164 170 174 179
USD kg 146 149 176 189 222 205 224 248 230 217 236 224 245
HUNGARY2001 2002 2003 2004 2005 2006 2007 2008 2009 2010 2011 2012 2013
( Forint kg )
January 251 263 293 251 309 345 329 338 348 323 374 358 399
February 239 263 283 249 313 339 334 348 364 323 421 407 407
March 246 280 283 261 340 339 326 392 421 338 427 425 408
April 284 312 286 276 343 345 338 410 468 357 396 424 404
May 247 302 270 289 347 345 336 361 431 349 392 419
June 221 288 264 310 376 356 319 332 406 371 364 398
July 257 247 248 303 343 340 314 311 389 377 319 372
August 239 248 249 281 317 327 316 313 351 362 297 361
September 252 272 252 258 324 328 329 319 340 361 306 381
October 244 253 250 258 325 302 338 318 331 326 324 395
November 229 233 234 254 345 316 326 303 320 330 343 394
December 245 252 232 294 339 320 320 307 309 350 343 376
YEAR 246 268 262 274 335 334 327 338 373 347 359 393 405
USD ton 086 104 117 135 168 159 178 196 184 167 178 174 188
8102019 Banana Import Export Global Stats
httpslidepdfcomreaderfullbanana-import-export-global-stats 37393232
Table 9 - Retail prices in selected countries monthly Tableau 9 - Prix mensuels au detail dans certains paysCuadro 9 - Precios mensuales al por menor en algunos paiacuteses
UNITED STATES
2001 2002 2003 2004 2005 2006 2007 2008 2009 2010 2011 2012 2013
( USD kg )
January 108 112 116 113 107 108 111 115 139 129 131 133 134
February 116 111 112 111 111 112 112 119 141 129 138 133 135
March 114 114 113 110 112 112 112 132 140 127 137 134 134
April 112 111 113 111 111 112 114 138 139 128 137 133 132
May 112 114 111 108 110 113 111 139 137 126 136 132 133
June 112 113 115 110 109 113 113 140 139 127 135 133 133
July 113 114 113 112 109 112 112 138 136 129 135 133 133
August 108 110 113 112 107 108 112 140 135 127 134 131 131
September 108 110 109 108 107 106 111 139 133 126 134 132 132
October 109 111 108 107 108 108 112 138 132 128 134 133 129
November 106 111 110 103 106 108 114 138 124 128 132 132 129
December 107 111 111 104 106 110 116 136 126 129 132 134 131
YEAR 110 112 112 109 109 110 113 134 135 128 135 133 132
JAPAN
2001 2002 2003 2004 2005 2006 2007 2008 2009 2010 2011 2012 2013
( Yen kg )
January 218 225 235 232 243 222 236 217 224 225 221 207
February 224 239 241 249 239 230 236 226 235 228 220 201
March 237 260 243 248 242 240 238 229 238 232 225 207
April 237 257 241 257 238 251 244 226 255 229 227 211
May 262 262 242 260 245 250 240 226 252 236 218 205
June 282 258 229 262 250 253 240 231 248 227 216 200
July 278 254 229 262 252 246 229 232 240 226 220 200
August 308 246 219 261 241 229 232 232 241 222 210 202
September 295 257 229 257 240 230 232 231 239 230 215 205
October 279 259 230 259 239 235 227 228 238 219 225 194November 255 260 223 245 231 231 222 221 236 218 216 193
December 233 241 220 237 220 230 219 221 233 218 193
YEAR 259 252 232 252 240 237 233 227 240 226 219 202
USD kg 213 201 200 233 218 204 198 219 256 257 275 253
8102019 Banana Import Export Global Stats
httpslidepdfcomreaderfullbanana-import-export-global-stats 38393333
Table 9 - Retail prices in selected countries monthly Tableau 9 - Prix mensuels au detail dans certains paysCuadro 9 - Precios mensuales al por menor en algunos paiacuteses
THE PEOPLErsquoS REPUBLIC OF CHINA (MAILAND)
2001 2002 2003 2004 2005 2006 2007 2008 2009 2010 2011 2012 2013
( RMB kg )
January 325 350 385 335 345 365 415 410 365 495 55
February 410 375 395 350 365 395 435 415 420 545 595
March 420 335 365 345 385 425 450 425 435 58 58
April 435 340 375 350 410 435 460 465 490 67 54
May 395 365 385 365 425 325 455 510 530 63 53
June 320 380 365 370 430 290 425 490 565 5 51
July 295 305 365 360 370 260 400 485 587 46 48
August 285 315 345 365 325 280 410 465 490 45 45
September 290 335 350 385 390 285 425 430 510 49 485
October 310 355 368 390 335 360 438 425 480 53 52
November 305 376 370 375 315 340 465 390 450 575 49
December 310 395 375 380 320 375 350 385 470 59 495
YEAR 342 352 370 364 368 345 427 441 483 543 519
USD kg 041 043 045 044 046 045 061 065 071 084 082
8102019 Banana Import Export Global Stats
httpslidepdfcomreaderfullbanana-import-export-global-stats 3939
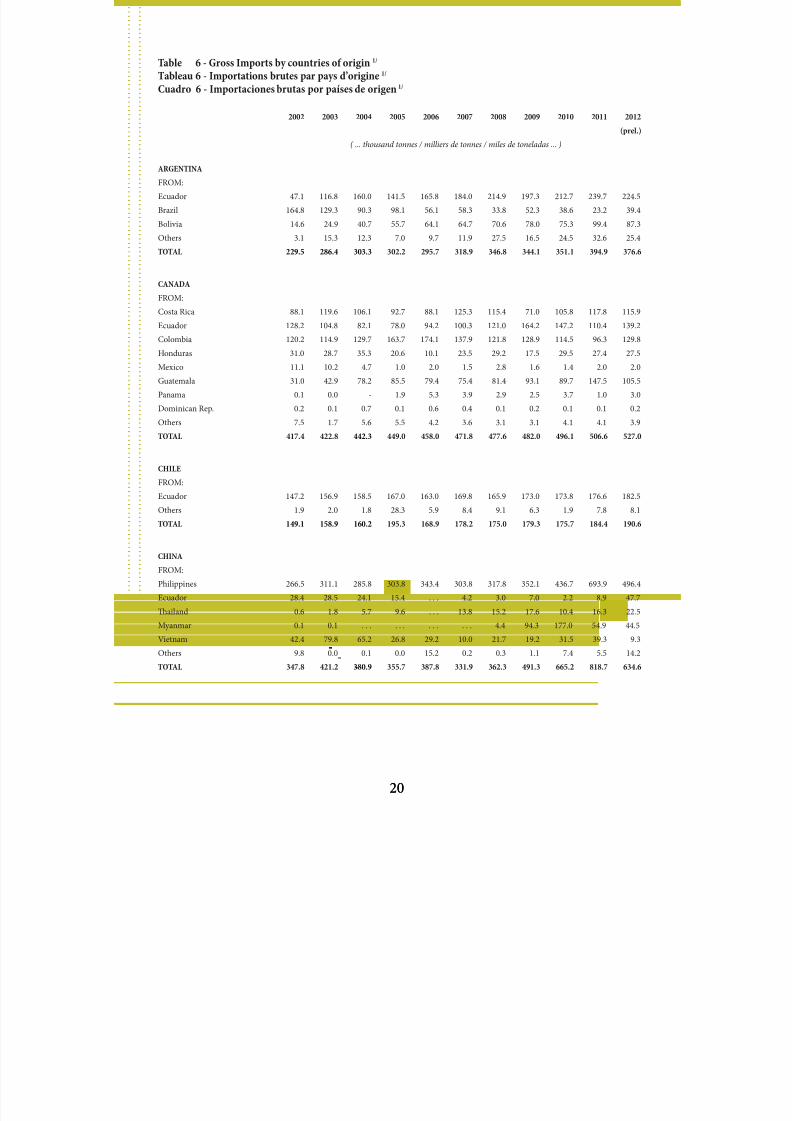
8102019 Banana Import Export Global Stats
httpslidepdfcomreaderfullbanana-import-export-global-stats 31392626
Table 7 - Import prices in selected countries monthly Tableau 7 - Prix agrave lrsquoimportation mensuels dans certains paysCuadro 7 - Precios mensuales de importacioacuten en algunos paiacuteses
HUNGARY
2001 2002 2003 2004 2005 2006 2007 2008 2009 2010 2011 2012 2013
( Forint tonnes )
January 40 000 74 000 115 000 105 000 62 000 181 000 181 000 186 000 188 000 158000 210000 197000
February 39 000 76 000 119 000 109 000 171 000 189 000 189 000 210 000 221 000 172000 213000 236000
March 39 000 83 000 122 000 105 000 179 000 185 000 178 000 226 000 268 000 195000 197000 224000
April 40 000 105 000 137 000 112 000 164 000 190 000 174 000 200 000 241 000 180000 198000 225000
May 39 000 112 000 104 000 176 000 180 000 176 000 160 000 160 000 205 000 200000 185000 211000
June 37 000 108 000 108 000 157 000 184 000 177 000 151 000 149 000 207 000 220000 157000 202000
July 47 000 76 000 105 000 137 000 136 000 129 000 138 000 142 000 186 000 174000 141000 172000
August 45 000 81 000 90 000 104 000 140 000 148 000 151 000 161 000 179 000 160000 150000 187000
September 46 000 104 000 76 000 123 000 152 000 147 000 178 000 165 000 162 000 161000 162000 207000
October 47 000 93 000 98 000 159 000 149 000 145 000 159 000 160 000 151 000 173000 167000 196000
November 61 000 86 000 88 000 242 000 164 000 175 000 160 000 164 000 154 000 176000 165000 192000
December 76 000 92 000 96 000 245 000 163 000 167 000 174 000 181 000 155 000 204000 174000 208000
YEAR 46 333 90 833 104 833 147 833 153 667 167 417 166 083 175 333 193 083 181 083 176 583 204 750
USD ton 162 352 467 729 770 796 904 1 019 954 871 878 910
THE PEOPLErsquoS REPUBLIC OF CHINA (MAILAND)2001 2002 2003 2004 2005 2006 2007 2008 2009 2010 2011 2012 2013
( USD tonnes )
January 250 227 284 295 308 317 377 412 389 491 574
February 243 212 250 297 290 312 374 407 340 428 538
March 196 197 209 274 234 312 332 274 361 403 522
April 207 212 179 267 285 331 332 312 403 428 523
May 205 191 199 274 250 332 405 377 406 437 534
June 218 188 241 271 303 336 409 399 428 484 574
July 228 191 244 267 325 339 41 411 426 526 646
August 195 173 247 240 319 325 381 379 406 528 672
September 202 244 270 276 317 326 394 432 460 534 677
October 213 233 295 290 329 342 375 408 472 501 650
November 220 251 272 292 328 353 403 424 462 541 658
December 215 266 279 296 326 371 398 281 258 577 616
YEAR 216 215 247 278 301 333 352 376 401 490 599
Source United States official dataJapan Monthly Bulletin o Banana Statistics Japan Banana Importersrsquo AssociationFrance Marcheacutes Europeacuteens des Fruits et Leacutegumes Revue drsquoInormation Economique
8102019 Banana Import Export Global Stats
httpslidepdfcomreaderfullbanana-import-export-global-stats 32392727
Table 8 - Wholesalersrsquo selling prices in selected countries monthly Tableau 8 - Prix de vente en gros mensuels dans certains paysCuadro 8 - Precios mensuales de venta al por mayor en algunos paiacuteses
JAPAN
2001 2002 2003 2004 2005 2006 2007 2008 2009 2010 2011 2012 2013
( Yen kgs )
January 81 117 107 106 103 96 120 129 160 126 121 121 139
February 98 135 133 109 115 122 142 145 157 144 129 124 150
March 101 146 130 139 132 120 157 155 151 146 140 130 161
April 123 155 133 149 123 117 167 159 162 142 148 135 172
May 128 154 144 140 119 126 163 154 165 140 145 135 169
June 103 153 131 138 122 122 145 153 160 142 140 133 161
July 112 148 128 119 115 115 135 152 149 141 133 130 153August 106 116 125 101 112 115 134 150 140 135 122 125
September 113 130 126 108 115 128 138 158 137 129 125 119
October 101 128 117 113 107 134 132 178 130 120 133 118
November 102 102 98 113 98 123 128 164 122 101 131 116
December 97 95 98 109 80 111 125 151 116 101 122 121
YEAR 105 132 123 120 112 119 141 154 146 131 132 126 158
USD kg 087 105 106 111 101 102 119 149 156 149 166 157 162
UNITED STATES
2001 2002 2003 2004 2005 2006 2007 2008 2009 2010 2011 2012 2013
( USD kgs )
January 062 064 064 060 059 069 080 075 118 092 101 095 099
February 072 060 064 064 064 101 080 099 112 099 112 117 099
March 077 066 070 055 082 102 079 136 110 101 108 141 101
April 074 067 067 058 069 090 074 133 109 101 105 121 101
May 085 068 062 059 073 104 082 128 105 099 103 106 095
June 070 072 059 066 074 088 084 106 104 106 105 097 094
July 083 065 061 056 058 065 078 096 101 118 096 096 094
August 081 061 058 048 049 061 074 093 101 099 095 096 094
September 080 061 057 047 061 067 082 094 099 088 092 105 094
October 067 056 056 048 066 069 079 096 094 099 091 104 092
November 058 054 055 046 061 065 072 093 091 094 092 099 090
December 063 061 057 055 073 072 069 093 090 096 096 097 088
YEAR 073 063 061 055 066 079 078 104 103 099 100 106 095
8102019 Banana Import Export Global Stats
httpslidepdfcomreaderfullbanana-import-export-global-stats 33392828
Table 8 - Wholesalersrsquo selling prices in selected countries monthly Tableau 8 - Prix de vente en gros mensuels dans certains paysCuadro 8 - Precios mensuales de venta al por mayor en algunos paiacuteses
FRANCE
2001 2002 2003 2004 2005 2006 2007 2008 2009 2010 2011 2012 2013
( Euro kg )
January 084 079 093 081 100 098 090 090 085 079 101 087 104
February 093 095 097 082 112 107 097 105 094 083 122 104 107
March 115 107 103 097 120 103 099 113 122 093 106 105 105
April 115 103 094 093 114 094 097 104 110 094 095 105 105
May 099 090 079 093 112 091 090 081 096 093 091 105 101
June 086 078 080 094 126 094 086 081 091 096 079 105 097
July 092 069 063 082 089 071 078 081 080 085 074 092 090August 081 073 059 074 098 068 081 085 075 080 074 091 092
September 086 080 078 077 106 073 094 084 079 081 080 100 095
October 081 068 076 075 097 074 082 079 081 074 081 102 093
November 075 062 074 085 097 086 075 077 076 079 083 095 092
December 074 082 076 105 102 090 085 081 083 092 081 095
YEAR 090 082 081 086 106 087 088 088 089 086 089 099 098
USD kg 081 077 091 107 132 109 120 130 124 114 124 127 134
EUROPEAN UNION
2001 2002 2003 2004 2005 2006 2007 2008 2009 2010 2011 2012 2013
( Euro kg )
January 094 095 089 097 101 101 102 101 094 113 101 110
February 102 099 091 107 104 104 117 106 094 122 113 108
March 112 105 096 111 102 104 128 125 106 113 117 105
April 114 105 096 111 098 103 122 124 110 111 116 107
May 106 093 093 118 095 100 103 112 111 111 113 108
June 095 091 094 125 094 098 096 112 114 100 110 110
July 078 074 084 099 080 094 094 100 104 091 101
August 088 074 075 097 078 093 093 095 097 090 102
September 093 080 078 107 081 101 091 096 099 092 109
October 084 081 079 103 079 100 095 096 094 094 108
November 077 081 083 104 083 093 096 093 096 094 105
December 085 086 098 104 089 098 097 095 104 095 103
YEAR 094 089 088 107 090 099 103 105 102 102 108 108
USD kg 088 100 109 133 113 136 151 145 135 142 139 148
8102019 Banana Import Export Global Stats
httpslidepdfcomreaderfullbanana-import-export-global-stats 34392929
Table 8 - Wholesalersrsquo selling prices in selected countries monthly Tableau 8 - Prix de vente en gros mensuels dans certains paysCuadro 8 - Precios mensuales de venta al por mayor en algunos paiacuteses
THE PEOPLErsquoS REPUBLIC OF CHINA (MAILAND)
2001 2002 2003 2004 2005 2006 2007 2008 2009 2010 2011 2012 2013
( RMB kg )
January 294 305 333 282 309 310 357 351 304 433 494 385
February 376 319 316 292 324 345 375 343 346 475 508 431
March 369 288 319 275 342 380 366 345 356 511 486 451
April 370 285 342 276 368 334 383 391 407 611 465 478
May 301 278 355 274 386 289 371 457 456 566 432 526
June 264 260 338 272 386 257 356 444 483 415 414 527July 228 249 292 265 339 228 313 408 435 336 379
August 224 249 277 265 270 239 313 383 397 344 373
September 240 273 268 315 324 276 341 356 397 401 378
October 232 270 259 314 285 304 345 329 369 443 397
November 218 290 271 306 276 294 372 300 370 495 386
December 235 311 272 304 291 314 342 288 398 497 380
YEAR 279 281 304 287 325 298 353 366 393 461 424 466
USD kg 034 034 037 035 041 039 051 054 058 071 067 077
URUGUAY
2001 2002 2003 2004 2005 2006 2007 2008 2009 2010 2011 2012 2013
( Pesos uruguayos kg )
January 947 1041 981 1134 1384 1708 1799 1792 2014 1888
February 715 861 886 1160 1309 1603 1766 1605 1803 2102
March 892 937 859 1185 1394 1634 1812 187 1777 2174
April 1064 1025 925 1393 1433 1625 1927 1809 1802 2609
May 920 825 873 1111 1285 1519 1825 169 1744 2057
June 833 843 735 1157 1225 1545 1784 1758 174 2069
July 875 888 730 1267 1588 1874 176 1752 2195
August 837 974 893 1221 1414 1659 1969 182 1814 2092
September 891 887 1041 1256 1531 1607 1928 1844 1843 1909
October 1128 843 1248 1594 1545 1795 1963 1891 1867 1992
November 1107 812 1260 1478 1647 2068 1916 1944 1837 1915
December 860 925 1232 1397 2088 2001 1750 2174 1957
YEAR 922 905 972 1279 1478 1696 1859 1830 1829 2091
USD kg 033 032 040 053 063 081 082 091 095 103
8102019 Banana Import Export Global Stats
httpslidepdfcomreaderfullbanana-import-export-global-stats 35393030
Table 8 - Wholesalersrsquo selling prices in selected countries monthly Tableau 8 - Prix de vente en gros mensuels dans certains paysCuadro 8 - Precios mensuales de venta al por mayor en algunos paiacuteses
UNITED KINGDOM2001 2002 2003 2004 2005 2006 2007 2008 2009 2010 2011 2012 2013
( pence kg )
January 370 570 570 530 630 690 610 720 700 550 950 767 787
February 600 650 600 460 790 670 610 900 730 590 1020 877 778
March 760 720 700 550 690 560 570 850 1090 730 730 975 704
April 750 670 600 530 750 550 590 760 990 770 800 803 773
May 700 630 540 540 910 640 580 680 880 830 820 779 790
June 660 530 520 610 870 660 560 600 930 940 620 772 710
July 600 430 390 530 590 490 520 630 670 790 570 734 714
August 550 490 450 460 690 500 570 660 640 750 590 699
September 590 520 490 530 770 530 650 670 660 740 650 776
October 500 480 440 460 680 530 570 580 650 600 600 655
November 480 400 430 530 680 480 520 610 550 630 590 632
December 470 540 380 650 600 540 530 620 560 690 630 651
YEAR 586 553 509 532 721 570 573 690 754 718 714 760 751
USD kg 084 083 083 097 131 105 115 127 117 111 114 120 121
BANANA ORGANIC
USA
2008 2009 2010 2 011 2012 2013
( USD kg )
January 112 138 131 127 134 136
February 112 138 127 140 138 132
March 154 138 128 142 138 125
April 160 138 127 129 141 127
May 147 138 135 141 135
June 152 138 138 140 138
July 137 138 134 138 138
August 136 134 138 138 131
September 138 125 142 136 135
October 138 129 138 135 138
November 138 134 123 136 135
December 134 131 127 134 137
YEAR 138 135 132 136 136 131
SourceUnited States USDA C amp MS Fruit and Vegetable Division Market News daily reports
Japan Monthy Bulletin o Banana Statistics Japan Banana Importersrsquo Association
8102019 Banana Import Export Global Stats
httpslidepdfcomreaderfullbanana-import-export-global-stats 36393131
Table 9 - Retail prices in selected countries monthly Tableau 9 - Prix mensuels au detail dans certains paysCuadro 9 - Precios mensuales al por menor en algunos paiacuteses
FRANCE
2001 2002 2003 2004 2005 2006 2007 2008 2009 2010 2011 2012 2013
( Euro kg )
January 150 151 162 150 163 173 160 165 160 156 170 162 175
February 157 164 167 152 178 176 163 172 164 156 185 170 182
March 169 181 171 156 182 177 166 179 175 164 188 177 181
April 185 182 174 162 185 172 168 188 190 169 180 184 184
May 180 177 162 158 193 169 168 176 179 167 178 180 181
June 171 171 162 161 203 169 165 169 174 173 173 178 184
July 174 148 151 158 187 163 163 169 168 173 167 178 184
August 162 145 144 147 165 154 157 168 158 166 160 172 180
September 161 155 143 138 172 152 163 165 155 162 157 170 176
October 158 144 143 143 169 147 166 163 157 159 158 172 175
November 151 139 140 140 168 154 160 158 154 157 162 175 175
December 145 141 147 161 174 157 163 158 153 163 161 175 176
YEAR 164 158 156 152 178 164 164 169 166 164 170 174 179
USD kg 146 149 176 189 222 205 224 248 230 217 236 224 245
HUNGARY2001 2002 2003 2004 2005 2006 2007 2008 2009 2010 2011 2012 2013
( Forint kg )
January 251 263 293 251 309 345 329 338 348 323 374 358 399
February 239 263 283 249 313 339 334 348 364 323 421 407 407
March 246 280 283 261 340 339 326 392 421 338 427 425 408
April 284 312 286 276 343 345 338 410 468 357 396 424 404
May 247 302 270 289 347 345 336 361 431 349 392 419
June 221 288 264 310 376 356 319 332 406 371 364 398
July 257 247 248 303 343 340 314 311 389 377 319 372
August 239 248 249 281 317 327 316 313 351 362 297 361
September 252 272 252 258 324 328 329 319 340 361 306 381
October 244 253 250 258 325 302 338 318 331 326 324 395
November 229 233 234 254 345 316 326 303 320 330 343 394
December 245 252 232 294 339 320 320 307 309 350 343 376
YEAR 246 268 262 274 335 334 327 338 373 347 359 393 405
USD ton 086 104 117 135 168 159 178 196 184 167 178 174 188
8102019 Banana Import Export Global Stats
httpslidepdfcomreaderfullbanana-import-export-global-stats 37393232
Table 9 - Retail prices in selected countries monthly Tableau 9 - Prix mensuels au detail dans certains paysCuadro 9 - Precios mensuales al por menor en algunos paiacuteses
UNITED STATES
2001 2002 2003 2004 2005 2006 2007 2008 2009 2010 2011 2012 2013
( USD kg )
January 108 112 116 113 107 108 111 115 139 129 131 133 134
February 116 111 112 111 111 112 112 119 141 129 138 133 135
March 114 114 113 110 112 112 112 132 140 127 137 134 134
April 112 111 113 111 111 112 114 138 139 128 137 133 132
May 112 114 111 108 110 113 111 139 137 126 136 132 133
June 112 113 115 110 109 113 113 140 139 127 135 133 133
July 113 114 113 112 109 112 112 138 136 129 135 133 133
August 108 110 113 112 107 108 112 140 135 127 134 131 131
September 108 110 109 108 107 106 111 139 133 126 134 132 132
October 109 111 108 107 108 108 112 138 132 128 134 133 129
November 106 111 110 103 106 108 114 138 124 128 132 132 129
December 107 111 111 104 106 110 116 136 126 129 132 134 131
YEAR 110 112 112 109 109 110 113 134 135 128 135 133 132
JAPAN
2001 2002 2003 2004 2005 2006 2007 2008 2009 2010 2011 2012 2013
( Yen kg )
January 218 225 235 232 243 222 236 217 224 225 221 207
February 224 239 241 249 239 230 236 226 235 228 220 201
March 237 260 243 248 242 240 238 229 238 232 225 207
April 237 257 241 257 238 251 244 226 255 229 227 211
May 262 262 242 260 245 250 240 226 252 236 218 205
June 282 258 229 262 250 253 240 231 248 227 216 200
July 278 254 229 262 252 246 229 232 240 226 220 200
August 308 246 219 261 241 229 232 232 241 222 210 202
September 295 257 229 257 240 230 232 231 239 230 215 205
October 279 259 230 259 239 235 227 228 238 219 225 194November 255 260 223 245 231 231 222 221 236 218 216 193
December 233 241 220 237 220 230 219 221 233 218 193
YEAR 259 252 232 252 240 237 233 227 240 226 219 202
USD kg 213 201 200 233 218 204 198 219 256 257 275 253
8102019 Banana Import Export Global Stats
httpslidepdfcomreaderfullbanana-import-export-global-stats 38393333
Table 9 - Retail prices in selected countries monthly Tableau 9 - Prix mensuels au detail dans certains paysCuadro 9 - Precios mensuales al por menor en algunos paiacuteses
THE PEOPLErsquoS REPUBLIC OF CHINA (MAILAND)
2001 2002 2003 2004 2005 2006 2007 2008 2009 2010 2011 2012 2013
( RMB kg )
January 325 350 385 335 345 365 415 410 365 495 55
February 410 375 395 350 365 395 435 415 420 545 595
March 420 335 365 345 385 425 450 425 435 58 58
April 435 340 375 350 410 435 460 465 490 67 54
May 395 365 385 365 425 325 455 510 530 63 53
June 320 380 365 370 430 290 425 490 565 5 51
July 295 305 365 360 370 260 400 485 587 46 48
August 285 315 345 365 325 280 410 465 490 45 45
September 290 335 350 385 390 285 425 430 510 49 485
October 310 355 368 390 335 360 438 425 480 53 52
November 305 376 370 375 315 340 465 390 450 575 49
December 310 395 375 380 320 375 350 385 470 59 495
YEAR 342 352 370 364 368 345 427 441 483 543 519
USD kg 041 043 045 044 046 045 061 065 071 084 082
8102019 Banana Import Export Global Stats
httpslidepdfcomreaderfullbanana-import-export-global-stats 3939
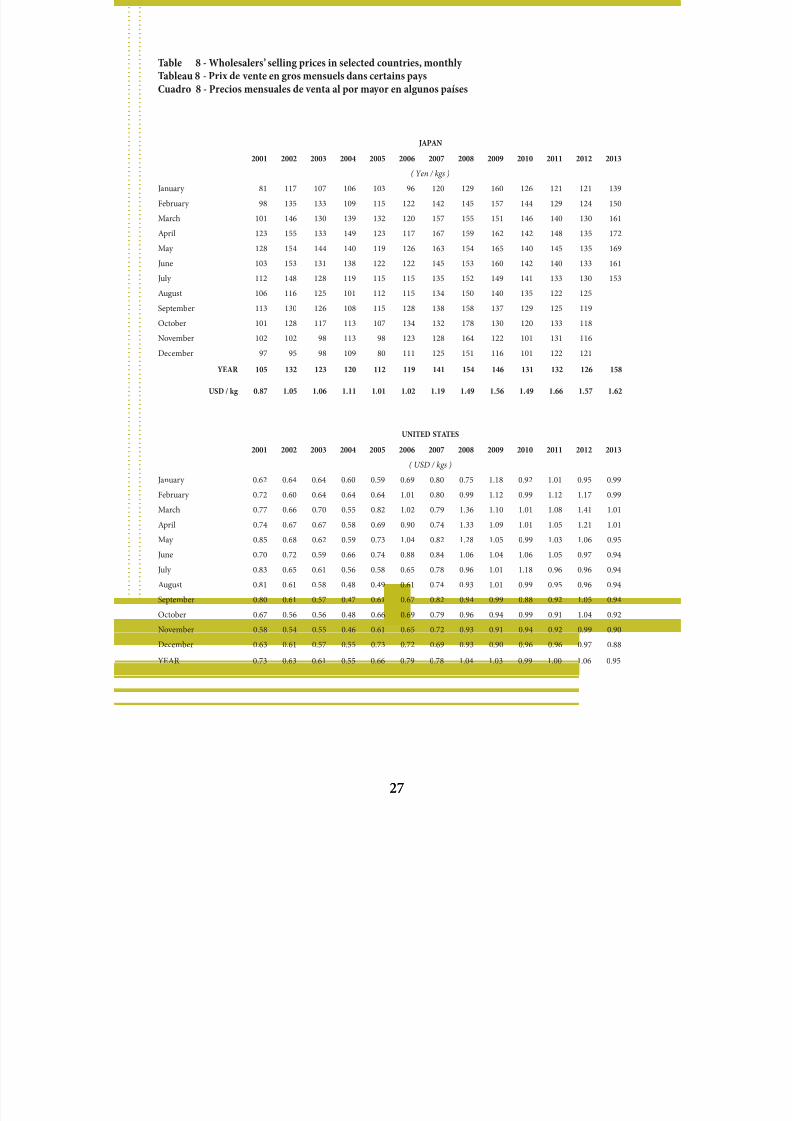
8102019 Banana Import Export Global Stats
httpslidepdfcomreaderfullbanana-import-export-global-stats 32392727
Table 8 - Wholesalersrsquo selling prices in selected countries monthly Tableau 8 - Prix de vente en gros mensuels dans certains paysCuadro 8 - Precios mensuales de venta al por mayor en algunos paiacuteses
JAPAN
2001 2002 2003 2004 2005 2006 2007 2008 2009 2010 2011 2012 2013
( Yen kgs )
January 81 117 107 106 103 96 120 129 160 126 121 121 139
February 98 135 133 109 115 122 142 145 157 144 129 124 150
March 101 146 130 139 132 120 157 155 151 146 140 130 161
April 123 155 133 149 123 117 167 159 162 142 148 135 172
May 128 154 144 140 119 126 163 154 165 140 145 135 169
June 103 153 131 138 122 122 145 153 160 142 140 133 161
July 112 148 128 119 115 115 135 152 149 141 133 130 153August 106 116 125 101 112 115 134 150 140 135 122 125
September 113 130 126 108 115 128 138 158 137 129 125 119
October 101 128 117 113 107 134 132 178 130 120 133 118
November 102 102 98 113 98 123 128 164 122 101 131 116
December 97 95 98 109 80 111 125 151 116 101 122 121
YEAR 105 132 123 120 112 119 141 154 146 131 132 126 158
USD kg 087 105 106 111 101 102 119 149 156 149 166 157 162
UNITED STATES
2001 2002 2003 2004 2005 2006 2007 2008 2009 2010 2011 2012 2013
( USD kgs )
January 062 064 064 060 059 069 080 075 118 092 101 095 099
February 072 060 064 064 064 101 080 099 112 099 112 117 099
March 077 066 070 055 082 102 079 136 110 101 108 141 101
April 074 067 067 058 069 090 074 133 109 101 105 121 101
May 085 068 062 059 073 104 082 128 105 099 103 106 095
June 070 072 059 066 074 088 084 106 104 106 105 097 094
July 083 065 061 056 058 065 078 096 101 118 096 096 094
August 081 061 058 048 049 061 074 093 101 099 095 096 094
September 080 061 057 047 061 067 082 094 099 088 092 105 094
October 067 056 056 048 066 069 079 096 094 099 091 104 092
November 058 054 055 046 061 065 072 093 091 094 092 099 090
December 063 061 057 055 073 072 069 093 090 096 096 097 088
YEAR 073 063 061 055 066 079 078 104 103 099 100 106 095
8102019 Banana Import Export Global Stats
httpslidepdfcomreaderfullbanana-import-export-global-stats 33392828
Table 8 - Wholesalersrsquo selling prices in selected countries monthly Tableau 8 - Prix de vente en gros mensuels dans certains paysCuadro 8 - Precios mensuales de venta al por mayor en algunos paiacuteses
FRANCE
2001 2002 2003 2004 2005 2006 2007 2008 2009 2010 2011 2012 2013
( Euro kg )
January 084 079 093 081 100 098 090 090 085 079 101 087 104
February 093 095 097 082 112 107 097 105 094 083 122 104 107
March 115 107 103 097 120 103 099 113 122 093 106 105 105
April 115 103 094 093 114 094 097 104 110 094 095 105 105
May 099 090 079 093 112 091 090 081 096 093 091 105 101
June 086 078 080 094 126 094 086 081 091 096 079 105 097
July 092 069 063 082 089 071 078 081 080 085 074 092 090August 081 073 059 074 098 068 081 085 075 080 074 091 092
September 086 080 078 077 106 073 094 084 079 081 080 100 095
October 081 068 076 075 097 074 082 079 081 074 081 102 093
November 075 062 074 085 097 086 075 077 076 079 083 095 092
December 074 082 076 105 102 090 085 081 083 092 081 095
YEAR 090 082 081 086 106 087 088 088 089 086 089 099 098
USD kg 081 077 091 107 132 109 120 130 124 114 124 127 134
EUROPEAN UNION
2001 2002 2003 2004 2005 2006 2007 2008 2009 2010 2011 2012 2013
( Euro kg )
January 094 095 089 097 101 101 102 101 094 113 101 110
February 102 099 091 107 104 104 117 106 094 122 113 108
March 112 105 096 111 102 104 128 125 106 113 117 105
April 114 105 096 111 098 103 122 124 110 111 116 107
May 106 093 093 118 095 100 103 112 111 111 113 108
June 095 091 094 125 094 098 096 112 114 100 110 110
July 078 074 084 099 080 094 094 100 104 091 101
August 088 074 075 097 078 093 093 095 097 090 102
September 093 080 078 107 081 101 091 096 099 092 109
October 084 081 079 103 079 100 095 096 094 094 108
November 077 081 083 104 083 093 096 093 096 094 105
December 085 086 098 104 089 098 097 095 104 095 103
YEAR 094 089 088 107 090 099 103 105 102 102 108 108
USD kg 088 100 109 133 113 136 151 145 135 142 139 148
8102019 Banana Import Export Global Stats
httpslidepdfcomreaderfullbanana-import-export-global-stats 34392929
Table 8 - Wholesalersrsquo selling prices in selected countries monthly Tableau 8 - Prix de vente en gros mensuels dans certains paysCuadro 8 - Precios mensuales de venta al por mayor en algunos paiacuteses
THE PEOPLErsquoS REPUBLIC OF CHINA (MAILAND)
2001 2002 2003 2004 2005 2006 2007 2008 2009 2010 2011 2012 2013
( RMB kg )
January 294 305 333 282 309 310 357 351 304 433 494 385
February 376 319 316 292 324 345 375 343 346 475 508 431
March 369 288 319 275 342 380 366 345 356 511 486 451
April 370 285 342 276 368 334 383 391 407 611 465 478
May 301 278 355 274 386 289 371 457 456 566 432 526
June 264 260 338 272 386 257 356 444 483 415 414 527July 228 249 292 265 339 228 313 408 435 336 379
August 224 249 277 265 270 239 313 383 397 344 373
September 240 273 268 315 324 276 341 356 397 401 378
October 232 270 259 314 285 304 345 329 369 443 397
November 218 290 271 306 276 294 372 300 370 495 386
December 235 311 272 304 291 314 342 288 398 497 380
YEAR 279 281 304 287 325 298 353 366 393 461 424 466
USD kg 034 034 037 035 041 039 051 054 058 071 067 077
URUGUAY
2001 2002 2003 2004 2005 2006 2007 2008 2009 2010 2011 2012 2013
( Pesos uruguayos kg )
January 947 1041 981 1134 1384 1708 1799 1792 2014 1888
February 715 861 886 1160 1309 1603 1766 1605 1803 2102
March 892 937 859 1185 1394 1634 1812 187 1777 2174
April 1064 1025 925 1393 1433 1625 1927 1809 1802 2609
May 920 825 873 1111 1285 1519 1825 169 1744 2057
June 833 843 735 1157 1225 1545 1784 1758 174 2069
July 875 888 730 1267 1588 1874 176 1752 2195
August 837 974 893 1221 1414 1659 1969 182 1814 2092
September 891 887 1041 1256 1531 1607 1928 1844 1843 1909
October 1128 843 1248 1594 1545 1795 1963 1891 1867 1992
November 1107 812 1260 1478 1647 2068 1916 1944 1837 1915
December 860 925 1232 1397 2088 2001 1750 2174 1957
YEAR 922 905 972 1279 1478 1696 1859 1830 1829 2091
USD kg 033 032 040 053 063 081 082 091 095 103
8102019 Banana Import Export Global Stats
httpslidepdfcomreaderfullbanana-import-export-global-stats 35393030
Table 8 - Wholesalersrsquo selling prices in selected countries monthly Tableau 8 - Prix de vente en gros mensuels dans certains paysCuadro 8 - Precios mensuales de venta al por mayor en algunos paiacuteses
UNITED KINGDOM2001 2002 2003 2004 2005 2006 2007 2008 2009 2010 2011 2012 2013
( pence kg )
January 370 570 570 530 630 690 610 720 700 550 950 767 787
February 600 650 600 460 790 670 610 900 730 590 1020 877 778
March 760 720 700 550 690 560 570 850 1090 730 730 975 704
April 750 670 600 530 750 550 590 760 990 770 800 803 773
May 700 630 540 540 910 640 580 680 880 830 820 779 790
June 660 530 520 610 870 660 560 600 930 940 620 772 710
July 600 430 390 530 590 490 520 630 670 790 570 734 714
August 550 490 450 460 690 500 570 660 640 750 590 699
September 590 520 490 530 770 530 650 670 660 740 650 776
October 500 480 440 460 680 530 570 580 650 600 600 655
November 480 400 430 530 680 480 520 610 550 630 590 632
December 470 540 380 650 600 540 530 620 560 690 630 651
YEAR 586 553 509 532 721 570 573 690 754 718 714 760 751
USD kg 084 083 083 097 131 105 115 127 117 111 114 120 121
BANANA ORGANIC
USA
2008 2009 2010 2 011 2012 2013
( USD kg )
January 112 138 131 127 134 136
February 112 138 127 140 138 132
March 154 138 128 142 138 125
April 160 138 127 129 141 127
May 147 138 135 141 135
June 152 138 138 140 138
July 137 138 134 138 138
August 136 134 138 138 131
September 138 125 142 136 135
October 138 129 138 135 138
November 138 134 123 136 135
December 134 131 127 134 137
YEAR 138 135 132 136 136 131
SourceUnited States USDA C amp MS Fruit and Vegetable Division Market News daily reports
Japan Monthy Bulletin o Banana Statistics Japan Banana Importersrsquo Association
8102019 Banana Import Export Global Stats
httpslidepdfcomreaderfullbanana-import-export-global-stats 36393131
Table 9 - Retail prices in selected countries monthly Tableau 9 - Prix mensuels au detail dans certains paysCuadro 9 - Precios mensuales al por menor en algunos paiacuteses
FRANCE
2001 2002 2003 2004 2005 2006 2007 2008 2009 2010 2011 2012 2013
( Euro kg )
January 150 151 162 150 163 173 160 165 160 156 170 162 175
February 157 164 167 152 178 176 163 172 164 156 185 170 182
March 169 181 171 156 182 177 166 179 175 164 188 177 181
April 185 182 174 162 185 172 168 188 190 169 180 184 184
May 180 177 162 158 193 169 168 176 179 167 178 180 181
June 171 171 162 161 203 169 165 169 174 173 173 178 184
July 174 148 151 158 187 163 163 169 168 173 167 178 184
August 162 145 144 147 165 154 157 168 158 166 160 172 180
September 161 155 143 138 172 152 163 165 155 162 157 170 176
October 158 144 143 143 169 147 166 163 157 159 158 172 175
November 151 139 140 140 168 154 160 158 154 157 162 175 175
December 145 141 147 161 174 157 163 158 153 163 161 175 176
YEAR 164 158 156 152 178 164 164 169 166 164 170 174 179
USD kg 146 149 176 189 222 205 224 248 230 217 236 224 245
HUNGARY2001 2002 2003 2004 2005 2006 2007 2008 2009 2010 2011 2012 2013
( Forint kg )
January 251 263 293 251 309 345 329 338 348 323 374 358 399
February 239 263 283 249 313 339 334 348 364 323 421 407 407
March 246 280 283 261 340 339 326 392 421 338 427 425 408
April 284 312 286 276 343 345 338 410 468 357 396 424 404
May 247 302 270 289 347 345 336 361 431 349 392 419
June 221 288 264 310 376 356 319 332 406 371 364 398
July 257 247 248 303 343 340 314 311 389 377 319 372
August 239 248 249 281 317 327 316 313 351 362 297 361
September 252 272 252 258 324 328 329 319 340 361 306 381
October 244 253 250 258 325 302 338 318 331 326 324 395
November 229 233 234 254 345 316 326 303 320 330 343 394
December 245 252 232 294 339 320 320 307 309 350 343 376
YEAR 246 268 262 274 335 334 327 338 373 347 359 393 405
USD ton 086 104 117 135 168 159 178 196 184 167 178 174 188
8102019 Banana Import Export Global Stats
httpslidepdfcomreaderfullbanana-import-export-global-stats 37393232
Table 9 - Retail prices in selected countries monthly Tableau 9 - Prix mensuels au detail dans certains paysCuadro 9 - Precios mensuales al por menor en algunos paiacuteses
UNITED STATES
2001 2002 2003 2004 2005 2006 2007 2008 2009 2010 2011 2012 2013
( USD kg )
January 108 112 116 113 107 108 111 115 139 129 131 133 134
February 116 111 112 111 111 112 112 119 141 129 138 133 135
March 114 114 113 110 112 112 112 132 140 127 137 134 134
April 112 111 113 111 111 112 114 138 139 128 137 133 132
May 112 114 111 108 110 113 111 139 137 126 136 132 133
June 112 113 115 110 109 113 113 140 139 127 135 133 133
July 113 114 113 112 109 112 112 138 136 129 135 133 133
August 108 110 113 112 107 108 112 140 135 127 134 131 131
September 108 110 109 108 107 106 111 139 133 126 134 132 132
October 109 111 108 107 108 108 112 138 132 128 134 133 129
November 106 111 110 103 106 108 114 138 124 128 132 132 129
December 107 111 111 104 106 110 116 136 126 129 132 134 131
YEAR 110 112 112 109 109 110 113 134 135 128 135 133 132
JAPAN
2001 2002 2003 2004 2005 2006 2007 2008 2009 2010 2011 2012 2013
( Yen kg )
January 218 225 235 232 243 222 236 217 224 225 221 207
February 224 239 241 249 239 230 236 226 235 228 220 201
March 237 260 243 248 242 240 238 229 238 232 225 207
April 237 257 241 257 238 251 244 226 255 229 227 211
May 262 262 242 260 245 250 240 226 252 236 218 205
June 282 258 229 262 250 253 240 231 248 227 216 200
July 278 254 229 262 252 246 229 232 240 226 220 200
August 308 246 219 261 241 229 232 232 241 222 210 202
September 295 257 229 257 240 230 232 231 239 230 215 205
October 279 259 230 259 239 235 227 228 238 219 225 194November 255 260 223 245 231 231 222 221 236 218 216 193
December 233 241 220 237 220 230 219 221 233 218 193
YEAR 259 252 232 252 240 237 233 227 240 226 219 202
USD kg 213 201 200 233 218 204 198 219 256 257 275 253
8102019 Banana Import Export Global Stats
httpslidepdfcomreaderfullbanana-import-export-global-stats 38393333
Table 9 - Retail prices in selected countries monthly Tableau 9 - Prix mensuels au detail dans certains paysCuadro 9 - Precios mensuales al por menor en algunos paiacuteses
THE PEOPLErsquoS REPUBLIC OF CHINA (MAILAND)
2001 2002 2003 2004 2005 2006 2007 2008 2009 2010 2011 2012 2013
( RMB kg )
January 325 350 385 335 345 365 415 410 365 495 55
February 410 375 395 350 365 395 435 415 420 545 595
March 420 335 365 345 385 425 450 425 435 58 58
April 435 340 375 350 410 435 460 465 490 67 54
May 395 365 385 365 425 325 455 510 530 63 53
June 320 380 365 370 430 290 425 490 565 5 51
July 295 305 365 360 370 260 400 485 587 46 48
August 285 315 345 365 325 280 410 465 490 45 45
September 290 335 350 385 390 285 425 430 510 49 485
October 310 355 368 390 335 360 438 425 480 53 52
November 305 376 370 375 315 340 465 390 450 575 49
December 310 395 375 380 320 375 350 385 470 59 495
YEAR 342 352 370 364 368 345 427 441 483 543 519
USD kg 041 043 045 044 046 045 061 065 071 084 082
8102019 Banana Import Export Global Stats
httpslidepdfcomreaderfullbanana-import-export-global-stats 3939
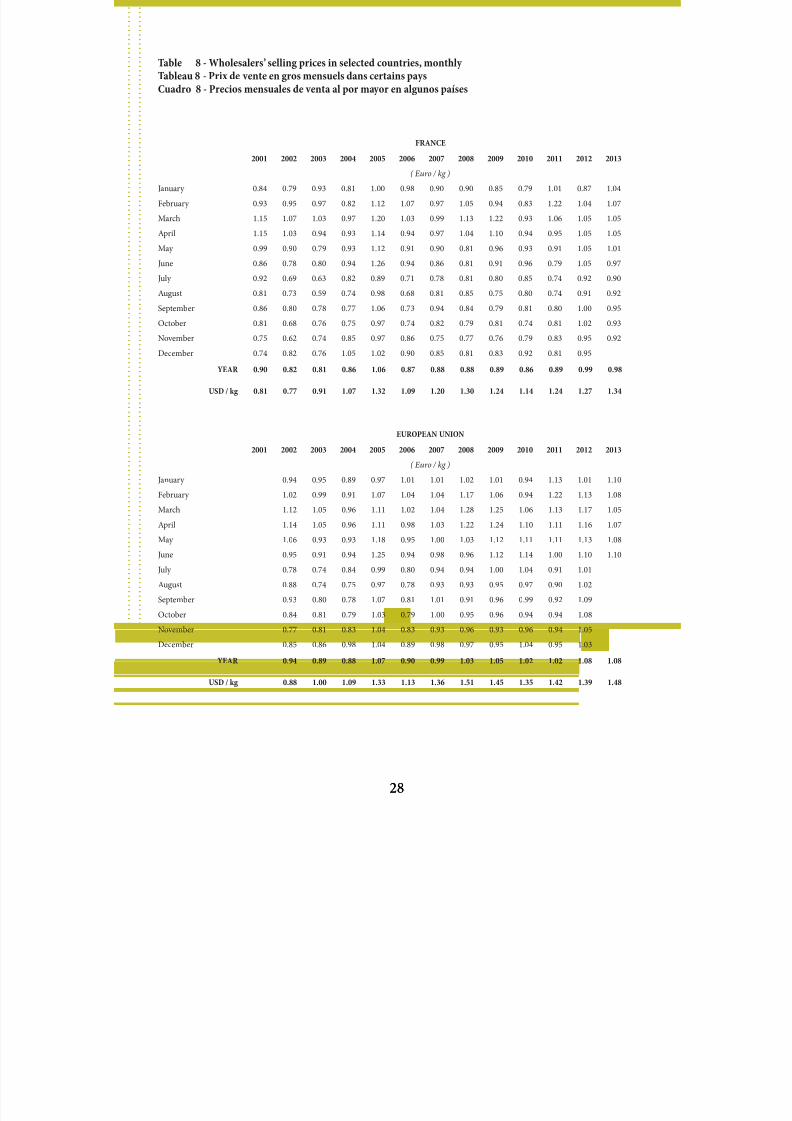
8102019 Banana Import Export Global Stats
httpslidepdfcomreaderfullbanana-import-export-global-stats 3939