baltimore's camden yards ballparks - economics · baltimore's camden yards ballparks by...
TRANSCRIPT

Baltimore's Camden Yards Ballparksby Bruce Hamilton and Peter Kahn
I INTRODUCTION
The accepted wisdom is that municipal professional sports stadiums are a bad economic
deal for cities --- except for Oriole Park at Camden Yards. Those who have studied the work of
Robert Baade and the other chapters in this volume (particularly that of Roger Noll and Andrew
Zimbalist) understand the basis for the first clause in Noll's quote above. But there is also a
widely held perception that the Baltimore experience breaks the mold, and indeed holds out the
possibility that if only other cities can replicate Camden Yards magic, they too can get rich from
professional sports.1
There is indeed something behind the feeling that Camden Yards is different. In the
decade before the 1992 opening of Camden Yards, Orioles attendance averaged 26,823 per game;
average annual attendance reached an all-time high of 29,457 in the last four years before the
move2. In the five years since the move, average attendance has been 45,129.3 The move to
Camden Yards appears to have propelled the Orioles from a team with a weak financial base to
one of the most financially successful teams in baseball. If a new stadium is economically justified
anywhere, that place must be Baltimore.
1Jacobs Field in Cleveland is also thought to be an exception to the string of failures.
2For a variety of reasons, it is not clear that the four years preceding the move to CamdenYards is typical (see Figure 1). It includes 1988, when the Orioles began the season with a 23-game losing streak, but also 1989, 1990, and 1991; in all three of those years attendance exceeded30,000, demolishing the previous all-time high of 26,918 in 1984. In 1988-1991, Oriolesattendance was 108% of the MLB average; in 1992-1995 it was 156%.
3Just as with the four years preceding the move, the 5 years following the move may beatypical. We will discuss the so-called "honeymoon effect" below.

2
Our main task in this chapter is to ask whether Oriole Park at Camden Yards is, or at least
might possibly be, an exception to the conventional wisdom that publicly financed sports stadiums
are bad deals for cities. Is the ballpark good for Baltimore and Maryland, or just for the Orioles?
Following that discussion, we present an abbreviated analysis of the Ravens' (NFL) stadium at
Camden Yards.
Taking account of all of the measurable benefits of the Camden Yards investment (i.e., job
creation and tax imports), we estimate that baseball at Camden Yards generates approximately
$3M in annual economic benefits to the Maryland economy, at an annual cost to the taxpayers of
Maryland of approximately $14M. The net annual cost is approximately $11M, or about $14.70
per year per Baltimore metro household.4 All of these identifiable benefits to the Maryland
economy are in the form of tax and job imports; thus these benefits occur at the expense of
neighboring economies. In addition, Maryland taxpayers bear only a portion of the true social
costs of the stadium; it is likely that non-Marylanders may incur as much as approximately another
$12M per year because investment funds were diverted from the private sector to the stadium and
distortions created by the taxation required to finance the stadium deficit.
Even at Camden Yards, public expenditure on the baseball stadium cannot be justified on
grounds of local economic development. If the public subsidy is justified at all, such justification
must rest on public consumption externalities which accrue to Baltimoreans as a result of the
presence of the Orioles.
4We state this in terms of Baltimore households because we assume Baltimoreans will
receive the majority of any benefits, even though the costs are absorbed by all residents of thestate of Maryland.
3
Section II is a narrative sketch of the Orioles' history in Baltimore and at Memorial
Stadium, and the events leading up to the move to Camden Yards. In section III we give the basic
financial picture for Oriole Park at Camden Yards, and translate this picture into the economic-
impact analysis described above. In section IV, with much sketchier data, we try to do for the
Baltimore Ravens stadium at Camden Yards (due to open in 1998) what we did for the Orioles
stadium in Section III.
II PREHISTORY
Beginning shortly after WWII, Baltimore's political leaders sought to attract major league
baseball and football teams to the city. As this was before the days of league expansion, the only
route open to them was to attract an existing franchise from another city. The idea of attracting
an existing franchise must also have seemed daunting; in the case of baseball, no major-league
franchise had changed cities since 1903 (see figure 1), when the minor league Baltimore Orioles
became the New York Yankees. The only route open was to find a team which was in financial
difficulty.
In 1947, the City of Baltimore began construction of Memorial Stadium, at a site on 33rd
Street which had housed a prior sports stadium, Municipal Stadium, originally constructed in the
1920s. The stadium was home to a minor-league baseball team, and seated approximately 30,000
fans. Minor-league Memorial Stadium had apparently been a financial boon to the City
government; According to Miller (1992, p. 189), through 1950 it had turned a profit of $329,659
($2.2M in 1996$) through rent and control of concessions.5 But in its effort to attract
5Neither Miller nor his source (The Baltimore Sun) tells us precisely what is measured in
this "profit;" most important, we are unable to determine whether the profit was measured grossor net of capital cost.

4
major-league franchises, the City invested heavily in the Stadium (most important, it added an
upper deck to bring seating capacity up to approximately 50,000).6 The City invested
approximately $7.5M ($46.2 in 1996$) in the early '50s when three separate $2.5M bond issues
were approved by voters.7
In 1953 the Dallas (Football) Texans/Colts, a bankrupt NFL team, moved to Baltimore
and Memorial Stadium, becoming the Baltimore Colts.8 The St. Louis (Baseball) Browns9, also in
poor financial and athletic condition, moved in 1953, and became the Baltimore Orioles. The
Browns had for years been underdog to the Cardinals in St. Louis, a town that was not big
enough to support two franchises.
After WWII, it was clear that major league baseball was out of line with the national
market, and that westward movement and expansion were both appropriate. Indeed, there
was real concern within the American and National leagues that one of the minor leagues would
become "major" and erode the then-majors' monopoly position.10 An obvious partial
solution was to move teams (such as the Browns) out of two team cities into western cities.11 But
6The original stadium had been built with the possibility of adding an upper deck in mind.
Miller, p. 188.
7Gershman, p. 173.
8Miller 1992, p. 188. Here we have conflicting reports. Gershman reports Dallas Texans,while Miller reports Dallas Colts.
9Is it coincidence that two of the three teams lured to Baltimore have been nicknamedBrowns?
10According to Miller (1990), the most serious threat was from the Pacific Coast League(pgs. 14.15)
11Indeed, the Browns attempted to move to Los Angeles in 1941. (Miller 1990, p. 23)

5
movement west required coordination; one west-coast team would be uneconomical. The
American league was unable to put forth a coordinated plan to move two teams west, and Browns
owner Bill Veeck was left to shop for a city on his own. As Baltimore was one of only two cities
with a municipal stadium (Milwaukee being the other)12, it was a leading candidate to receive the
Browns.13 After vetoing the move before the 1953 season, the American League approved the
move after the 1953 season on the condition that Veeck relinquish control of the team. The team
was bought by a group of Baltimore businessmen for $2.4 million ($14.1M in 1996$) and began
the 1954 season as the Baltimore Orioles.14 Thus began the era in which cities constructed
stadiums and leased them, generally at a loss, in order to attract or retain sports teams.
The Orioles gradually rose from the cellar of the league to become the dominant team in
baseball in the late 1960s and early 1970s. It remained a major power in the American League
through 1983, and then collapsed. The Orioles fielded consistently second-division teams for the
next decade, and not until 1996 did they return to the American League playoffs.
The team's playing-field success was not reflected in the box office. Through 1978 the
franchise was at best marginally profitable, drawing only a modest number of fans and television
revenue. In the late 1960s and early-to-mid 1970s, post-season revenue was the difference
between profit and loss.15 With a few gaps, Table 1 gives data on Orioles' profit, attendance,
12Miller 1990, p.16.
13Prior to the Browns' move to Baltimore, virtually all baseball stadiums had been ownedby the teams rather than municipalities. The Browns owned the baseball stadium in St. Louis, andsold it to the Cardinals when they moved to Baltimore (Miller 1990, p. 32 )
14Miller 1990, pgs 30,34-35.
15Miller 1990, p. 212

6
won/loss record, and rent, along with the city's subsidy. As a result of new-owner Edward
Bennett Williams' aggressive marketing, the Orioles became more profitable after 1979. The city's
rent, which at the time was a solely percentage of profit, also rose substantially.
[Table 1 Here]
With two teams in Philadelphia until the Athletics moved in 1955 and one thereafter, and one in
Washington until the second Senators moved in 1972, the Orioles' market was quite limited; this
limit was apparently exacerbated by three forces:
&� The Colts, who came to Baltimore at essentially the same time as the Orioles, moved to
playing-field respectability much more quickly than the Orioles.16 Thus the Colts were
the darlings of Baltimore in a way that the Orioles never were (even after the O's began
winning consistently) until the Colts left Baltimore in 1985.17
&� Again in contrast with the Colts, the Orioles did a poor job of attracting black fans. In
part this was calculated, out of fear that large numbers of black fans would deter whites.
In part, the Orioles lost any chance of black loyalty because the team itself was highly
segregated. The Orioles' first black impact player was Frank Robinson, who joined the
team in December, 1965, but prior to his arrival they had had a very small number of
black players, and most stayed only a season or two.18 This was in marked contrast to the
16The Colts won the NFL championship in 1958 and repeated in 1959.
17Miller 1990, p. 75.
18The American League generally lagged well behind the National League in attempts toattract black players. By the time the American League teams began to actively seek blackplayers, the National League had stripped the Negro League of its best talent. (Miller 1990, p. 65)

7
Colts, who had several black stars as early as the late 1950s.19
&� Memorial Stadium was not well suited to accommodating a large fan base.
The Memorial Stadium Setting
Memorial Stadium is approximately 5 miles north of Baltimore's downtown district,
occupying one city block in a largely residential neighborhood of two-story rowhouses.
Within several blocks of the stadium is a small commercial district, consisting of a few restaurants
and carry-out establishments.20 The stadium is bounded on the south and east by four-lane (but
not limited access) residential streets, and on the north and west by two-lane streets. There are no
expressways within 20 blocks of the stadium. On the stadium property there is parking for 2800
cars and an additional 2200 spaces available in the vicinity for a total of 5000 spaces.21 Access
from Washington is fairly difficult, as there are no thoroughfares from outside Baltimore to the
neighborhood of Memorial Stadium, and Baltimore's rail station is approximately 20 blocks
away.22
According to team officials23 the Memorial Stadium site could not accommodate more
than about 30,000 fans, because of limited parking. If attendance rose above that figure, fans
would still be cruising the streets during the third inning looking for parking.
19Miller 1990, p. 39
20None of these commercial establishments is adjacent to Memorial Stadium.
21Miller 1990, p. 20.
22Until the Senators left Washington, access to Washington was not a significant issue inany event.
23This information was received through a personal interview with a former Oriole frontoffice staff member who requested anonymity.

8
In terms of City finances, the arrival of major league sports at Memorial Stadium meant
two things:
&� The city's annual profits on the stadium turned to losses; and
&� The city entered a 40-year period in which the team owners almost continuously requested
either improvements at Memorial Stadium or replacement of the stadium.24
The pressure increased over the Memorial Stadium era largely due to three forces:
&� The mobility of franchises;25
&� Free agency and the attendant increase in the cost of operating a major-league team;26
&� The increasing obsolescence of Memorial Stadium.
Through most of the Memorial-stadium era, the city (which continued to own the facility)
lost money, but city officials continued to believe that the teams brought enough
24The first serious discussion of improvements came in 1957, when the city agreed to
replace wooden bleachers with individual seats.
25From 1903 through 1953 no major league baseball teams moved (see figure 1). Beginning in the 1950s many east coast cities that had two or more franchises saw one movewest. The 5 movers in the 1950s were: Boston to Milwaukee; St. Louis to Baltimore;Philadelphia to Kansas City; Brooklyn to Los Angeles; and New York to San Francisco. Thethree movers in the 1960s were: Washington to Minnesota; Milwaukee to Atlanta; and KansasCity to Oakland. The two movers in the 1970s were: Seattle to Milwaukee; and Washington toTexas. (Source: Dewey and Acocella, pgs. xvii & xviii)
26Of course, free agency is not sufficient to explain teams' rising payrolls. The "cost" offielding a competitive baseball team is largely rent; individual franchises "must" pay competitivesalaries, but the competitive level of salaries is determined by the sum of direct fan revenues andsubsidies paid by cities. Roughly speaking, if other comparable cities are willing to pay $10Msubsidies for sports franchises, then Baltimore must match this or lose its franchises. Withwell-informed cities, and a limited number of franchises, one would expect the subsidy to be bidup to the point where the marginal city achieves no surplus.
If there were collusion among the cities rather than among the teams, then in equilibriumall rent would go to the cities rather than the teams and players.

9
economic benefit and image to the city to justify the expense. Despite warnings from team
owners, City officials did not believe that either the Colts or the Orioles would leave Baltimore.
In the case of the Colts, Baltimore's league-enforced protection ended in winter 1983-84, when a
federal judge ruled that the NFL did not have the power to prevent the Oakland Raiders from
moving to Los Angeles.27 In spring, 1984, the Colts left Baltimore for Indianapolis.
As regards the Orioles, the team was locally owned from its arrival in 1953 until after the
1979 season, at which time it was sold to Edward Bennett Williams of Washington, D.C.
Williams repeatedly disavowed any intention of seeking MLB's permission to move the team to
Washington; however, the disavowals were rather muted and the threat hung in the air. There
seems to be little doubt that the league would have approved a move. Against this backdrop, the
City, the State, and the Orioles agreed to the construction of Oriole Park at Camden Yards, and
the State, through the Maryland Stadium Authority (MSA), ultimately lured the Cleveland
Browns (now the Baltimore Ravens) football team to Baltimore with the promise of a
football-only stadium also located at Camden Yards. The Orioles opened the 1992 season at
Oriole Park at Camden Yards28.
III THE ORIOLES AT CAMDEN YARDS
27Though teams had moved before 1984 (for example the Colts and the Orioles), the
leagues had successfully retained veto power over moves in the past. Until 1984 a city could besure of retaining its team unless the league approved a move. The Los Angeles court rulingdiminished the NFL's prerogative to interfere with franchise moves, but the extension to baseballis far from obvious because of baseball's continuing antitrust exemption.
28The official name of the stadium is a compromise between the Orioles (who wantedOriole Park) and the then- governor of Maryland, William Donald Schaefer, who wanted CamdenYards (the original name of the site from its railroad-terminal days).

10
The Orioles' spectacular athletic collapse in 1984 was due in substantial measure to the
team's precarious financial health over the previous two decades. The team's original rise to
dominance had been based heavily on a strong farm system, and paradoxically the weakness of the
farm system would also prove its downfall.29 In the 1950s, before the days of free agency,
established players could be obtained only through purchase or trade; the Orioles could afford
neither so they resigned themselves to the slow process of developing their own talent. But
playing-field success, when it came in the latter half of the 1960s, did not bring profits, and in the
'70s the team could not afford to maintain quality on both its flagship team and its farm system.
The problem was exacerbated by the rising cost of major league players and expansion drafts
which took rising players from the farm teams.30 The Orioles' difficult decision between the major
league team and the farm system would not have been necessary had the Orioles generated the
kind of profit that other top-quality teams were generating. To the extent that the Orioles' poor
attendance was due to deficiencies of Memorial Stadium, the future success of the franchise
required a new stadium. Thus the Orioles argued throughout the 1970s and '80s that they needed
a new stadium to attract more fans, in order to generate enough revenue to compete with the
more lucrative teams.
Of course, it is not necessary to invoke "need" to explain the Orioles' continued push for a
new stadium; it is sufficient to note (or assume) that the owners wished to maximize profit from
29Miller 1990, p. 289.
30Free agency also reduced the ability of clubs to reap the benefits of their farm systeminvestments. Whatever faults the Reserve Clause had, it did have the virtue of inducing teams tomake efficient investments in the human capital of their prospects. (Free agency, on the otherhand, gives established players added incentive to invest in themselves.)

11
whatever source. During the latter years of the Memorial Stadium era, the Orioles were in a
position to extract a larger subsidy, if not from Baltimore, then from another city. On the other
hand, it is true that one consequence of the Orioles' failure to extract the "market" subsidy from
the city is that they became increasingly unable to bid top dollar for talent.
Thus the Orioles had two objectives: (1) build a stadium which would attract more fans,
and (2) ensure that the new stadium had a substantial number of premium seats and luxury box
seats. The latter was important because revenue from luxury boxes (over and above the "base"
ticket price) are not shared with the league. After some political maneuvering, the Camden Yards
area just west of Baltimore's Inner Harbor was chosen as the site for the new baseball stadium
(and, when the time arrived, for the football stadium as well).
In the early 1970s, the Inner Harbor was a badly blighted section of the city made up
largely of abandoned warehouses which were relics of an earlier era when shipping had docked
there.31 Beginning in the late 1970s the Inner Harbor was the site of massive redevelopment; it
now houses a substantial number of high-class hotels and restaurants, upscale retail shopping,
legal and financial offices, and such tourist attractions as the National Aquarium, the Maryland
Science Center, and Harborplace.32 Most of these attractions are an easy walk from the stadium;
others such as Little Italy and Fells Point are a short drive or water-taxi ride away.
In sharp contrast with Memorial Stadium, the Inner Harbor/Camden Yards area is readily
accessible from all directions. In particular, Interstate 95 from Washington passes within easy
31The Inner Harbor is too shallow and confined for modern ships; Baltimore's port activity
is all located to the southeast of the Inner Harbor, away from downtown and where the harbor iswider and deeper.
32Miller 1990, pgs. 152,234.

12
access to stadium parking. In addition, there is rail access, with game-day trains stopping directly
in front of the stadium. Under the terms of the Orioles' lease with MSA, the Camden Yards
facility is to have 5,000 parking spaces. Prior to construction of the football stadium at Camden
Yards, there were approximately 5,400 spaces, but the football stadium will reduce this to
approximately 2,800.33 In addition, since virtually no baseball games are played during normal
business hours, a substantial part of Baltimore's CBD parking infrastructure is available for game
parking. Within a 1 mile walk of the stadium there are approximately 30,000 private off-street
parking spaces.34
The ballpark, dedicated to baseball, seats approximately 48,000, including 72 luxury
boxes.35 The backdrop for the stadium (beyond the right-field wall) is a renovated B&O Railroad
warehouse. This building, along with a view of the Baltimore skyline beyond center field, gives
the stadium a downtown-Baltimore feel.
Effect of Move to Camden Yards: Attendance
As noted, the Orioles felt a financial need to increase attendance (and presumably an
opportunity to extract more surplus from Baltimore). The thinking among planners was that the
Camden Yards site would attract fans from throughout the Baltimore/Washington area both
because of easy access and because of the other attractions at the Inner Harbor. The basic
rationale for selecting the site was that the presence of multiple attractions would induce more
33Numbers on actual parking were conveyed to us orally by Joseph Foss of the Orioles.
As of this writing, the Orioles and MSA are negotiating over resolution of the 5,000-parking-space provision in the Orioles lease.
34USA Today. The Complete Four Sport Stadium Guide. p. 9.
35Orioles 1996 Media Guide. pgs. 362-3.

13
attendance both at Orioles games and other downtown attractions than either could generate in
the absence of the other.
As shown in Figure 2, the Orioles enjoyed a massive increase in attendance when they
moved to Camden Yards. It is hard to attribute the Orioles' jump in attendance to anything other
than the move; there is no apparent positive effect of on-the-field performance upon attendance.
Average attendance was 45,036 in the four years since the move, and 29,457 in the prior four
years.36 Whereas average attendance rose throughout Major League Baseball during the late
1980s, this effect appears to be fully accounted for the final Memorial Stadium years. The
29,457 figure is already approximately 6,000 above average attendance during the previous
decade (during which the Orioles had two World Series appearances).37
It appears that approximately 70% of the incremental Camden Yards fans come from
outside the State of Maryland. The Orioles estimate that approximately 10% of their fans came
from out of state to Memorial Stadium. By contrast, a city of Baltimore fan survey estimates that
31% of 1992 fans came from out of state; and Joseph Foss, Vice Chairman, Business Operations
and Finance for the Orioles estimates that in 1996 approximately 35% of fans came from out of
state. If we accept the 10% (Memorial Stadium) and the 31% Camden Yards figures for out-of-
36One might argue that 1988 should be disregarded as an anomaly: After going 0-23 at
the beginning of the season they went on to lose 107 games that year, and they drew only 22,442per game. But throughout the 1980s they drew in the low- to mid-twenties. In 1983, when theywon the World Series, they drew 26,520. Average Attendance figures were calculated usinginformation obtained from the Orioles 1996 Media Guide, p. 368.
37In fact, regressing average annual attendance on winning percentage for the Oriolesyields a negative but insignificant relationship.

14
state fans, simple arithmetic tells us that 71% of the incremental fans came from out of state.38
The Honeymoon Effect
Several authors have suggested that a sports team has a "honeymoon" period with its fans
after moving to a new stadium. If this is true in the case of the Orioles (that is, if average
attendance in the range of 45,000 is not the steady state), then both the Orioles and the MSA will
do less well than indicated by our projections. Furthermore, of course, the import-driven job-
creation effect will be smaller than that which we calculate below.
The accepted wisdom regarding the honeymoon effect is that the honeymoon begins to
fade after three years and that the steady state is achieved in approximately 8 years.39 As of this
writing, the Orioles have just completed their 5th year (1996) at Camden Yards; average
attendance in 1996 was 45,587, virtually indistinguishable from the average of prior years at
Camden Yards40. At first blush, anyway, there is no fading honeymoon. On the other hand, 1995
could be influenced by the "Cal Ripken effect", and 1996 is the first Camden-Yards year in which
the Orioles made the playoffs, so one can speculate that there is a fading-honeymoon effect offset
by a team-quality effect.41
38Incremental fans = 45,000 - 29,000 = 16,000; out of state fans at Memorial Stadium = .1
x 29,000 = 2900; out of state fans at Camden Yards = 45000 x .31 = 13,500. Incremental out-of-state fans = 10,600. 10,600/16000 = 0.7.
39Roger G. Noll, "Attendance and Price Setting," in Government and the Sports Business,Washington: Brookings Institution, 1974.
40Data for 1996 was supplied by Joseph Foss of the Baltimore Orioles.
41Of course, if one attributes the team's playing-field improvement to the revenue fromCamden Yards, then arguably the net (reduced-honeymoon/improved-team) effect mayapproximate the steady state after all.

15
In private conversation, Joseph Foss of the Orioles indicated that he believes that there is
indeed a very modest honeymoon effect. In 1992 the Orioles did virtually no "hustling" to sell
groups of tickets. By 1996 they found it necessary to engage in very modest marketing in order
to maintain attendance in the 45,000 range.
All told, though average attendance of 45,000 may not be the steady state, to date it is
difficult to discern any evidence of a significant honeymoon effect.
Economic Impact: The Geographic Perspective
As Noll and Zimbalist point out, the magnitude of economic benefits of a stadium depends
heavily on the geographic boundary of analysis. The reason is that at the national level essentially
all baseball spending is diverted from other venues; i.e., it crowds out spending elsewhere. At the
local level this need not be true; some of the economic activity and tax revenue may be crowded
out not from the local economy but from a neighboring economy. Baltimore's gain is
Washington's loss, but it is a genuine gain for Baltimore nonetheless.
For a different set of reasons, measurement of cost is also influenced by line drawing. For
the nation as a whole, the true cost of a $200M stadium is the return to the investment that was
crowded out by the financing of the stadium, probably around 7%. Thus the annual loss of
national output resulting from a $200M stadium is approximately $14M.
From the perspective of Maryland taxpayers, however, investment funds can be had for
much less than a 7% real rate. The real (ex post) yield on tax exempt bonds is approximately 2%,
and Federal 30-year Treasury bonds that benefit from state exemption generally yield
approximately 1% above tax-exempts.42 Thus from the perspective of Maryland, the cost of
42see Federal Reserve Bank of Cleveland, Economic Trends, May, 1996, p. 5.

16
funds is approximately 2%, and another 1% is borne by the Federal treasury in the form of the
federal tax exemption. Perhaps as much as another 5% is borne by the American public at large
in the form of foregone output from the private alternative use of the funds.
A portion of the spread between the 7% opportunity cost of capital and the 2% real
borrowing rate faced by the State of Maryland represents costs borne not by outsiders but by
Marylanders themselves. First, Maryland is a part of the national economy (the Maryland
population is 0.0201 of the national population). Second, it is reasonable to assume that a
disproportionate share of the crowded-out investment would have occurred in Maryland, as
construction of the stadium likely discouraged other entertainment-related investment in
Baltimore. But Marylanders' share of the burden of the opportunity cost depends not on where
the alternative investment would have occurred but where the returns would have been realized.
If the returns would have been reaped by national capital owners, then only a relatively small
portion of the spread between the borrowing and opportunity-cost rates would be borne by
Marylanders. In the following discussion, we assume that Marylanders succeed in exporting the
entire spread to the rest of the nation.
It is likely that Marylanders also export a large fraction of the deadweight loss generated
by the tax financing of the MSA deficit. Taxation generates a deadweight loss by distorting the
price system and thereby compromising its ability to direct resources to their most efficient use.
Since most prices are determined in (at least) the national economy, the burden of much of this
distortion is exported to the national economy.
There is a great deal of uncertainty as to the magnitude of the deadweight loss from taxes;

17
one respected estimate43 places it at between 13 and 24% of the tax revenue. If this estimate is
approximately correct for the taxes which finance Camden Yards, then citizens (likely largely non-
Marylanders) incur approximately $2M in annual deadweight-loss cost.
At the national level, there seems little debate over the proposition that new stadiums cost
a lot and yield very little. The more contentious question is whether some stadiums are justified at
the local level. Accordingly, we will conduct our economic impact analysis from the perspective
of the State of Maryland (since it is the State which owns the stadium and incurs the financial
obligations). But the reader should bear in mind that all of the benefits we identify are beggar-
thy-neighbor benefits, and that there are substantial costs which are borne by non-Marylanders.
It is also worth noting that there is considerable redistribution within the state. The costs
take the form of incremental state taxes and lottery revenues, and are presumably borne evenly
geographically throughout the state. Benefits, as we will see, take two forms. The first
significant benefit is imports of state sales taxes, also accruing on a statewide basis. The second,
through the employment effect, is a rise in Baltimore property values. The latter effect, of course,
is localized and therefore subsidized by non-Baltimore state taxpayers.
Effect of the Move to Camden Yards: Internal Rate of Return
We begin our economic analysis of the Camden Yards stadium with the following
counterfactual: suppose that the Orioles had owned Memorial Stadium, and had constructed and
owned the Camden Yards stadium and had received no subsidy from the State of Maryland.
Suppose, in other words, that the pattern of ownership and rights to returns were like that of an
43Charles Ballard, John Shoven, and John Whalley, "The United States Tax System: A
General Equilibrium Approach," National Tax Journal 38, #2 (June, 1985), pp. 125-40.

18
ordinary business. Under this counterfactual, we calculate the internal rate of return to the move
to Camden Yards, as it would have appeared to the Orioles had they been a typical business.
According to a report published by Financial World magazine (published annually from
1991 to 1996, which includes data from 1990 through 1995), the Orioles basic gate receipts44
rose $11.6M (from $19.0M to $30.6M) between 1991 and 1992. If we average their last two
seasons at Memorial Stadium and their first four seasons at Camden Yards respectively, their gate
receipts have increased by $13.2M.45 More importantly, their stadium revenues increased by
$16.5M in 1992, and on average by $12.3M.46 Thus the Orioles' revenue (after remittance to
visiting teams but before rent) rose by approximately $25.5M as an apparent result of the move to
Camden Yards. In addition, admission-tax receipts (Maryland Stadium Authority's share of gate
receipts) rose by approximately $1.8M47 (approximately 1/3 of the $5M admission-tax receipts at
Camden Yards). Total stadium revenue therefore rose by approximately $27.3M, of which
$25.5M is private return.48
44These figures are net of the 20% of gate receipts which are remitted to the visiting team.
45In 1994 gate receipts of $25.6M and in 1995 of $35.4M were earned during the twostrike shortened seasons. On the other hand, in 1995, Cal Ripken broke Lou Gehrig's consecutivegame streak. In addition to the athletic achievement, this was a major media event in Baltimore.
46Stadium revenue includes suites, luxury seating, concessions, parking, and venueadvertising.
47Whether the admission tax should be counted as part of the "private" return to CamdenYards depends upon whether we think of it as an ordinary tax or the State's share of the gate. Infurther calculations in this section, we exclude the admissions tax.
48Both the "before" and "after" financial figures are somewhat suspect as bases for asteady-state comparison. The "after" figures might be high because of the honeymoon effect,which we discuss above. The "before" figures are likely high as well (tending to offset any errorsgenerated by ignoring the honeymoon effect). The last two years at Memorial were

19
Site acquisition and construction cost of Camden Yards was approximately $200M. We
have no data upon which to estimate the rate of depreciation of the new stadium, and there is
wide variation in the ex post lifetimes of prior stadiums. Memorial Stadium served as home of the
Orioles for 39 years; other older stadiums such as Yankee Stadium and Fenway Park continue to
operate, whereas some newer stadiums have already been retired. Lacking firm guidance, we
assume that the rate of economic depreciation is 5%.
Annual maintenance is approximately $6M.49 For purposes of the current calculation this
should be netted against the maintenance cost at Memorial Stadium; unfortunately we have been
unable to determine the level of maintenance expenditure at Memorial. For purposes of this
calculation we assume that maintenance cost is the same at Camden Yards as at Memorial
Stadium.
Finally, in keeping with our counterfactual, we should credit the Orioles with any salvage
value of Memorial Stadium. As a stadium, the economic value of Memorial Stadium is surely
very small or nil; though we are aware of no studies, it seems very likely that the best use of the
site is to demolish the stadium and sell the land. And it is highly unlikely that land value in the
Memorial Stadium neighborhood will more than cover demolition cost. Thus we provisionally
extraordinarily successful by historical standards; average attendance in the final two yearsexceeded the average over the final Memorial decade by 17%. Also note that the revenue datawere taken from 1990 through 1995; they are not (quite) all dollars of the same value. Offsettingthis, we have made no allowance for possible future rises in real ticket and concession prices.
49Camden Yards is maintained by the Maryland Stadium Authority. At present the Oriolesare asking the MSA to turn over maintenance to the Orioles. Joseph Foss of the Orioles believesthat the team can maintain the stadium for approximately $4M.

20
assume no salvage value for Memorial Stadium.50
Under the above assumptions the real internal rate of return on Camden Yards is equal to
the net revenue increase ($25.5M) less annual economic depreciation ($10M) divided by the cost
of the stadium ($200M). The real internal rate of return is estimated to be 7.75%.
If the Orioles were in the business of manufacturing automobiles, this would be the end of
the economic analysis; if the Orioles face a real borrowing rate of less than 7.75%, then the
corporation (would have) built a new facility which generated sufficient revenue to cover
depreciation, incremental maintenance, and real interest. There would simply be no debate over
the economic viability of the new stadium, any more than we debate the economic viability of
private investments in general.
Orioles' Actual Balance Sheet
Camden Yards is not owned by the Orioles; it is owned by the Maryland Stadium
Authority. If the MSA leased the stadium to the Orioles at a price which covered the capital and
maintenance cost of the facility, ownership would make no difference. But the terms of the lease
are much more favorable to the Orioles than that. Whereas the MSA bears annual operating and
capital cost of approximately $20M ($14M in real interest and depreciation and $6M in
maintenance), the Orioles pay only approximately $6M in rent; a modest increase from the $3.6M
50Row houses on 20x60 lots sell for approximately $90,000 in the Memorial Stadium
neighborhood. If we assume land constitutes 20% of house value and that lots cover 70% of theland, then land value per acre is $450,000. The Memorial Stadium site, at approximately 40acres, has residual value of $18M, less the (unknown) cost of demolition of Memorial Stadium. (Estimates of value of row houses were provided by Bill Cassidy, manager of the Fells Pointoffice of Long and Foster Realtors. The estimate of the size of the Memorial Stadium site wasprovided by Edward Cline, Deputy Director of the Maryland Stadium Authority.)

21
that they were paying in their last years at Memorial Stadium.51 Thus, as an apparent result of the
move to Camden Yards, the Orioles' net revenue rose by approximately $23M per year ($25.5
revenue less $2.4M incremental rent).
The move to Camden Yards enables the Orioles to do that which they could not do at
Memorial Stadium: spend competitively on the major league team. And indeed, the payroll for
the Orioles' roster rose by approximately the net revenue increase, $22M.52
As an interesting aside, at the time of the move to Camden Yards, the Orioles' reported
operating expenses fell by approximately $6M (by 23%). This coincides with replacement of the
Orioles' prior lease in which rent was based on profits to the current formula, based solely on
revenues, suggesting that costs were artificially inflated to avoid rental payments.53
There is of course nothing to ensure that the newfound $23M will enable the Orioles to
bid competitively for talent in the future: If the Orioles spend their money wisely and return to
dominance in the American League, other cities might increase their subsidies to their teams. This
will create greater rents for ballplayers and will leave some teams in financial peril.
Next we turn to the balance sheet from the perspective of the State and its subdivisions;
the fiscal account.
Fiscal Balance Sheet at Camden Yards
51As we will discuss in more detail below, MSA receives substantial revenue in addition to
this rent.
52Calculated using various Financial World reports.
53The period of high operating costs also coincides with the period when the Orioles' then-owner, Eli Jacobs, was facing bankruptcy.

22
We saw above that the move to Camden Yards generated $27.3M in incremental revenue
($25.5M to the Orioles and $1.8M to MSA in the form of incremental admission tax receipts).
Economic depreciation was estimated to be $10M. If we assume a real (tax-free) interest rate of
2%, real interest cost of the stadium is $4M; thus the net absolute return is $13.3M per year (less
any increase in operating cost).
We have already seen that the Orioles realized a net absolute return of approximately
$23M, indicating that they receive a subsidy of approximately $9.7M from the State. Essentially
the same subsidy appears, not surprisingly, when we examine the finances of the Maryland
Stadium Authority. As already noted, real interest faced by Maryland citizens and depreciation
are approximately $14M per year, and operating cost is approximately $6M per year. The total
cost to the state of carrying and operating the stadium is approximately $20M.
MSA recovers approximately $6M in rent and another $5M in admissions tax revenue; it
incurs a deficit of approximately $9M ($20M in costs to MSA less $11M in MSA revenue). The
Federal treasury incurs another $2M in interest subsidy. The private economy bears another $8M
in foregone return to crowded out investment and $2M in deadweight loss resulting from the
incremental taxes.54
MSA's deficit of $9M must be financed by taxes;55 assuming a deadweight loss of 20%,
then the dollar deadweight loss is approximately $1.8M. As discussed above, we have not
54Of course, if the investment that was crowded out was public rather than private, there is
no incremental taxation and therefore no deadweight loss.
55Actually, it is financed by lottery proceeds, but this has no bearing on the magnitude ofthe deadweight loss. Even if lotteries are less distortionary than taxes, Stadium lotteries crowdout other lotteries which otherwise could have been used to finance State expenditures.
23
estimated the distribution of this loss between Maryland and the rest of the nation.
Social Return on the Stadium56
If our original counterfactual were correct (i.e., if the Orioles had built and financed the
stadium), few would have bothered to address the question of the social return on the stadium.
Most economists would conclude that if the stadium passed the market test, then it likely passed
the cost-benefit test as well. Any debate over the social return to the stadium arises because the
public subsidy identified above is justified only if there are social benefits to the stadium which
exceed the private returns captured by the Orioles.
There seems little doubt that at the national level there are no such benefits, and thus that
there is no justification for the Federal tax subsidy previously identified. Indeed, the 1986
amendment to the Federal Tax Code was designed to eliminate the use of tax-exempt bonds to
finance stadiums, and legislation currently under consideration is designed to tighten these
restrictions.
There are three major avenues through which the economic benefits to the State of
Maryland might differ from those captured in the counterfactual private return calculated above:
(1) Crowding Out: Our estimated 7.75% internal rate of return on Camden Yards rests upon a
$23.5M increase in revenue. But, of course, to the extent that this $23.5M represents expenditure
which would have occurred elsewhere in the Maryland economy even without Camden Yards,
then the net effect on the local economy is correspondingly reduced. We can illustrate this by
extending our counterfactual from above:
56Recall that our first focus will be on the "social" return from the perspective of Maryland
taxpayers; where appropriate we will note in the text how this diverges from the national socialrate of return.

24
Assume now that before Camden Yards there were two stadiums in Baltimore: Memorial
Stadium and Stadium X. Memorial attracted 29,000 patrons per year and Stadium X attracted
16,000. In 1992 all 45,000 were diverted to Camden Yards; both Memorial and Stadium X
became worthless. Now suppose that the Orioles owned both Memorial Stadium and Stadium X
(and that maintenance on the two stadiums combined was equal to the $6M maintenance cost at
Camden Yards). Under this scenario, the move to Camden Yards is a $200M investment which
yields no revenue whatsoever. In this scenario, all of the "incremental" revenue generated at
Camden Yards is crowded out from Stadium X; it is simply a $200M white elephant.
In fact, from the perspective of Maryland citizens, it appears that the crowding out from
"Stadium X," i.e., from incremental fans to Camden Yards, is of only modest importance. We
noted above that approximately 70% of incremental fans come from out of state, suggesting in
turn that approximately 70% of the incremental revenue is generated by out-of-state fans. Thus
approximately $7M of the incremental revenue is crowded out from other venues in the state of
Maryland, and $16M is new spending in Maryland. Below we will discuss measurement of the
benefit from importing expenditure.
But we cannot lay crowding out to rest even for that 70% of the incremental revenue
which is due to out-of-staters' expenditure. Some out-of-staters' Camden Yards expenditure may
replace other expenditure they would have done in Baltimore (Stadium X expenditure). The
crucial question is not the increment to out-of-staters' baseball expenditure, but the increment to
out-of-staters' expenditure anywhere in the state. We have no specific evidence on this question,
unfortunately. In the remainder of our analysis we assume that all incremental baseball
expenditure by incremental out-of-staters represents expenditure diverted to Maryland; to the

25
extent that this is not correct, we understate the degree of crowding out reflected in the Camden
Yards revenue figures. Figure 3 shows the history of downtown Baltimore's hotel-tax receipts, in
constant (1996) dollars, since 1984. After approximately 10% annual growth from 1984 through
1990, there has been no trend whatsoever subsequently. This graph, at any rate, offers no support
for the conjecture that large numbers of incremental fans are coming to Baltimore to see the
Orioles; or at any rate, if they are coming, they appear not to be staying in downtown Baltimore.
(2) Importing Jobs and Taxes: If out-of-state residents pay more taxes in Maryland as a result
of Camden Yards (and if these taxes are not offset by incremental expenses) then Marylanders'
taxes are correspondingly reduced. Similarly, if out-of-staters spend money in Maryland and
generate an increase in Maryland (mostly Baltimore) employment, the Maryland economy benefits
in a manner we will describe below. We have already confronted the expenditure-importing
question in another guise: to the extent that baseball expenditure is not an import, it merely
reflects crowding out of other local expenditure.
In addition to sales-tax imports, holders of imported jobs pay income and property taxes.
However, as a first approximation, it is not appropriate to count the income and property taxes
generated by the job import as benefits to Maryland. These imported jobs are held by imported
people, who require incremental expenditure on education, police protection, and the like; the
incremental taxes approximately cover these expenses.
(3) Public Consumption Benefits: If the citizens of Maryland obtain pleasure from the
presence of the Orioles even when they neither attend the stadium nor listen to broadcasts, then
this external benefit to the presence of the Orioles is not reflected in any of the financial figures
discussed above. Note that it is the presence of the Orioles in Baltimore, most plausibly, that

26
generates such public consumption benefits. It is far from clear that such public consumption
benefits increase as a result of the team's move to Camden Yards. Thus, at first blush, it is
doubtful that any such benefits should be counted as benefits of the move to Camden Yards.
There are, however, two reasons to believe that at least some such benefits should be
attributed to the move.
(1) Had the Orioles remained at Memorial Stadium, it seems clear that they would not have been
financially able to field competitive teams; if public consumption benefits depend at least partially
upon team quality, then at least a part of such benefits should be attributed to Camden Yards.
(2) Had the Orioles not been given a new stadium (or some other way to generate an additional
$23M in revenue), it is likely that the team would eventually have left Baltimore. Under this
scenario, of course, the entire public consumption benefit to Marylanders is attributable to the
stadium at Camden Yards.
The Benefit of Importing Expenditure and Jobs
We rely upon a Baltimore City 1992 fan expenditure survey to estimate the magnitude of
non-ballpark expenditure imports generated by the Orioles at Camden Yards. According to
results of this survey, non-SMSA residents spent $46M before and after games, mostly in
Baltimore. The same survey reports that 46% of fans were from out of the SMSA, and that 31%
of fans were from out of state.57 Assuming the $46M is proportionally allocated between in-state
and out-of-state non-Baltimoreans, total before-and-after-game expenditure by out-of-state
57Joseph Foss, Vice Chairman for Business Operations and Finance of the Orioles, advises
us that as of 1996 at least 35% of Camden Yards fans are from out-of-state.

27
residents was $31M ($46M*(.31/.46)).58 As out-of-state attendance increased approximately 5-
fold as a result of the move to Camden Yards,59 we attribute 80% of the out-of-staters'
expenditure, or $25M, to Camden Yards. Total incremental out-of-staters' expenditure is thus
$41M ($25M in incremental non-stadium expenditure by out-of-staters plus $16M of the Orioles'
revenue increase) -- the share of the Orioles' revenue increase which is attributable to incremental
out-of-staters. In this section we discuss our method of converting this incremental expenditure
figure to economic benefit for Maryland.
We begin by assuming that Baltimore is open to migration to and from the rest of the
nation. This assumption carries the implication that in equilibrium nobody can increase utility by
migrating, which in turn implies that any inter-city wage differences must be offset by (indeed
caused by) inter-city differences in cost of living and amenities.60 The (assumed) openness of
migration between Baltimore and the rest of the nation means that, in equilibrium, real wage61 and
unemployment rates (within individual occupations) will be equalized across the country, and it
does not make sense to think of a sports team as enriching the citizens of Baltimore by reducing
unemployment or raising real wages. An influx of jobs (say, attendant to a rise in exports) does
raise wages in a city, but only because it raises the cost of living. Without the wage increase new
58This comes to approximately $30 per out-of-state fan.
5931% of 45,000 as opposed to 10% of 29,000.
60This does not mean, for example, that average wages should be the same in Baltimore asin Biloxi, even after correcting for cost of living and amenities. The job mix differs substantiallyacross regions, and some workers who earn high incomes in Baltimore would be virtuallyunemployable in Biloxi (to take a case germane to this symposium, most major-league baseballplayers would earn little outside a MLB city).
61Real wages correct for cost of living and amenities.

28
workers would be unwilling to migrate to the city to take the new jobs. Baltimore residents gain
from an influx of jobs not because steady state unemployment declines (any decline will be short-
lived) nor because real wages rise but because the present value of property values increase.
When the demand for a city's exports rises, the first consequence is an outward shift in the
city's demand curve for labor, which causes wages to be bid up because the supply curve of urban
labor is rising. As more workers are attracted to the city, the cost of living is driven up, primarily
through a rise in the price of housing (the price of housing rises with city size, for reasons that are
discussed in all major urban economics texts).62The inter-urban equalization of utility requires that
house value rise by the present value of the wage increase. The entire present value of the
economic benefit of an increase in exports (an increase in city size) is captured by local property
owners; the present value of the wage increase is capitalized into house values. Workers who do
not own houses see their entire wage increase disappear into rent increases. Thus the proper
(present-value) measure of the economic benefit realized by an increase in export demand is the
aggregate increase in property values generated by the export surge, which equals the present
value of the increase in the wages of the inframarginal workers. Consequently we can measure
the per-household benefit as either the annual per-household induced wage increase (annual
measure) or the average induced increase in house value (present value). Regardless, the
incidence of the benefit is the same; the entire present value of the benefit is captured by those
people (regardless of whether they are residents or whether they are employed) who own
property at the time of the capitalization.
62See for example Urban Economics, by Mills and Hamilton.

29
Baltimoreans receive economic benefit from incremental direct Orioles expenditures by
precisely the same mechanism: If the presence of the Orioles creates incremental jobs, the
equilibrium wage for inframarginal workers rises and the present value of this increase is
capitalized into property values. The winners are the holders of property at the time of the job
infusion.
Thus the steps required to estimate the economic benefit from incremental out-of-staters'
expenditure both inside and outside the ballpark are as follows:
(1) Determine the magnitude of incremental expenditure;
(2) Determine the number of jobs created directly by the incremental expenditure;
(3) Determine the appropriate multiplier via which to calculate the total employment effect;
(4) Determine the effect of this induced employment on metro property values. The aggregate of
this effect is the present value (measured by property value change) or the annual value (measured
by the change in the annual wage bill of inframarginal workers) of the economic benefit (to
Baltimoreans) of the Orioles' and out-of-staters' expenditures. We have discussed step (1) above;
incremental expenditure by out-of-staters before, during, and after games is estimated to be $41M
per year. We turn now to step (2), the number of jobs directly created by the Orioles and by out-
of-state expenditure.
(2): Direct creation of Jobs
Next we must determine the number of jobs directly created by the $41M in out-of-staters'
expenditures. We are aware of no estimates of this magnitude, so we proceed by making what we
hope are reasonable assumptions. First, we assume that half of the $41M is spent on labor in

30
Baltimore;63 under this assumption the local wage bill generated by the $41M is $20.5M. The
average salary of full-time employees in the United States in 1993 was $35,803 (inclusive of
fringe benefits; 1995 Statistical Abstract, p. 431); applying this arithmetic, we estimate that out-
of-staters' expenditure creates 575 new jobs ($20.5M/$35,803).
Whereas this calculation method may be reasonable for most expenditure imports, it surely
overstates job creation in this case. The Orioles spent virtually all of their incremental revenue on
the major-league roster payroll, and of course the number of players on the roster did not increase
at all. However, the Oriole ballplayers surely spent a portion of their incremental income in
Maryland, so assuming a zero employment effect from the Orioles' portion of the incremental
revenue would understate the job-creation impact. In this calculation we assume that all of the
non-ballpark spending creates jobs in the manner we have suggested, and that half of the ballpark
spending does. Based on this calculation, we estimate that the incremental out-of-state
expenditure is directly responsible for 460 new jobs in the Baltimore metro area.
(3) Size of Multiplier
Several authors have argued that the expenditure multiplier for professional sports is
likely to be quite small, even if the expenditure base is value added rather than gross expenditure.
But we have argued above that the calculation should be based on jobs; hence we have calculated
the number of local jobs directly due to the Orioles; and therefore we need to use an employment
multiplier. The most important reason for assuming a small multiplier when the base is a
professional sports payroll is that highly-paid athletes save a high fraction of their income and
63Labor's share of National Income is approximately 73% (compensation of
employees/national income; 1995 Statistical Abstract, p. 457); however, the fraction of thisexpenditure due to local labor is likely to be smaller.

31
spend much of the rest outside the local economy. But when using a jobs multiplier, this concern
is negated and if anything reversed.64 In our calculations we use an employment multiplier of 1.2,
though for reasons noted above that may be a bit conservative. If the incremental out-of-staters'
spending is directly responsible for 460 jobs in Baltimore, total job creation due to the Orioles'
presence is approximately 460 x 1.2 or 550 new jobs.
(4): Effect on Wages and Property Values
The best evidence on this question is due to Rosen (1979), who ran the following
regression:
where wi is the annual earnings in city i for a specified well-defined type of worker (such as
secretary). Xi is a vector of metro area characteristics, including city size and amenities. Rosen
points out that under the assumption of location equilibrium, the �'s can be interpreted as the
antilog of the workers' compensation for the X's. Thus he finds for example that the annual wage
rises by $15 ($32 in 1996$) with each additional rainy day per year, suggesting that the marginal
worker is willing to pay $32/year (in foregone wages) to live in a city with one more sunny day
per year; or that the shadow price of a sunny day is $32. The natural interpretation of the
coefficient on city size in this regression is the cost of an increment to city size. Mobility ensures
that workers are able to receive compensation for enduring this cost. Rosen's regressions tell us
64A baseball player with a large salary, even if he saves much of his income and spends
much of it outside the local economy, is likely to generate at least as much employment with hislocal spending as a steelworker who never leaves the city.
ln i i iw = X + β µ

32
that a 10% increase in the population of an urban area raises the average annual wage by $48
($100 in 1996$). Total employment in the Baltimore metro area is approximately 1.2M; applying
the Rosen coefficient to Baltimore, an increment of 1000 jobs raises the average annual wage by
$0.80.
If the move to Camden Yards generated 500 new jobs, the average annual wage in
Baltimore rose by about 40 cents as a result This is the effect which is capitalized into the value
of Baltimore houses. Assuming 1.6 workers per household (1.2M workers/750,000 households)
and a rent-to-value ratio of .1, the presence of the Orioles raises house values by approximately
$6.50 each.65
We can also calculate the aggregate annual benefit induced by the job creation; at $0.40
per worker times 1.2M workers, this benefit is approximately $480,000.
Note that the method we have worked out above is applicable to any job-creation activity
in an urban area. Given the size of Baltimore, and the parameter values we have assumed,
creation of 1000 incremental jobs generates approximately $0.80 in annual surplus per worker, for
an aggregate annual benefit of just under $1M. If an entrepreneur comes to Baltimore with an
offer to bring 1000 new jobs to town, then (on an aggregate costs-and-benefits basis) the city
should be willing to pay up to $1M to cement the deal.66
65For completeness, we note that this increase in property values generates an increase in
property tax revenues of approximately 2% of the value increase, or approximately $0.13 perhouse per year.
66The beneficiaries of such a scheme, as we have seen, are property owners, and theburden borne by taxpayers who cover the cost. If the job-import subsidy is financed by localproperty taxes, there is essentially no redistribution; otherwise there is redistribution from thebearers of the tax burden to the property owners.
33
Importing Tax Revenue
As we saw above, the move to Camden Yards generated few jobs and little multiplier
benefit to Maryland citizens. We now turn to direct importation of tax revenue.
If out-of-state fans pay taxes to Maryland or its subdivisions, and if these taxes are not
offset by incremental governmental expenditures, then the net drain on the state (plus
municipalities) treasury is reduced by this amount. Each dollar of taxes paid by out-of-staters
reduces, one for one, the tax liabilities of Marylanders. Here we examine such sources of
additional revenue.
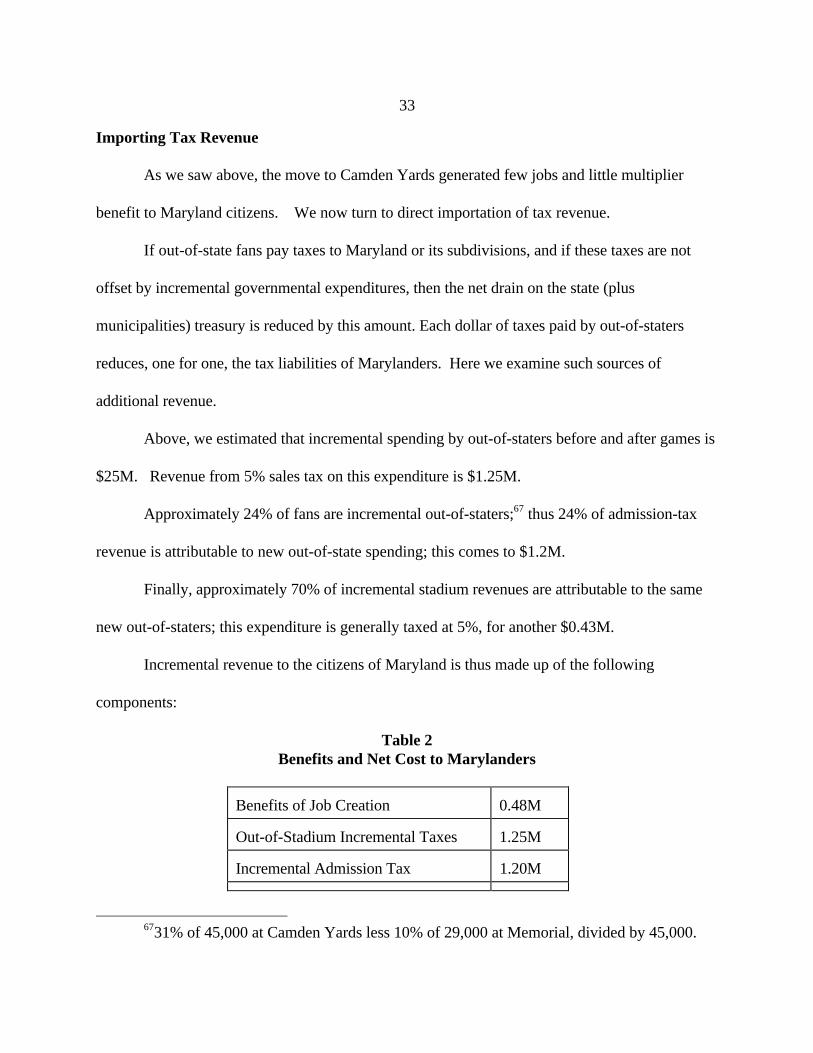
Above, we estimated that incremental spending by out-of-staters before and after games is
$25M. Revenue from 5% sales tax on this expenditure is $1.25M.
Approximately 24% of fans are incremental out-of-staters;67 thus 24% of admission-tax
revenue is attributable to new out-of-state spending; this comes to $1.2M.
Finally, approximately 70% of incremental stadium revenues are attributable to the same
new out-of-staters; this expenditure is generally taxed at 5%, for another $0.43M.
Incremental revenue to the citizens of Maryland is thus made up of the following
components:
Table 2Benefits and Net Cost to Marylanders
Benefits of Job Creation 0.48M
Out-of-Stadium Incremental Taxes 1.25M
Incremental Admission Tax 1.20M
6731% of 45,000 at Camden Yards less 10% of 29,000 at Memorial, divided by 45,000.

34
Sales Tax on Incremental Stadium Spending
0.43M
TOTAL 2.96M
Capital Cost 14M
Net Cost to Marylanders 11.04M
As summarized in the table above, the State of Maryland spends approximately $14M per year to
attract approximately $3M per year in job-creation and tax-import benefits. In addition the
Federal treasury absorbs a subsidy of approximately $2M; there is a deadweight loss of $2M, and
the excess of the opportunity cost of investment over the interest rate might be as high as another
$8M.
On some criteria, as we have seen, Camden Yards is indeed a success. The stadium
routinely sells out, and it generates enough incremental revenue to make the Orioles a competitive
ballclub. But it is most definitely not a success as a vehicle for job creation and economic
development. In addition to their spending at the ballpark, Marylanders pay approximately $11M,
or approximately $14.70 per Baltimore household, per year to keep the Orioles in town.
This $11M per year figure represents our best estimate of the subsidy borne by
Marylanders. Before moving on, we can very easily note the worst-case value of the subsidy.
Suppose that there is no tax or expenditure importing due to the Orioles' move; that all of the
identified incremental expenditure would otherwise have been spent in the Maryland economy.
Or equivalently, assume that despite their new stadium the Orioles leave Baltimore and that the
stadium remains vacant. In that case the State's financial loss from Camden Yards is simply the
carrying cost of the stadium, $14M per year, or $18.70 per household per year.

35
Intangible Benefits
The citizens benefit from the presence of the Orioles in two additional ways, over and
above any import of taxes and jobs discussed above.
1. The amenity value of the O's and the business climate: If the presence of the O's is an
amenity which attracts footloose businesses to Baltimore, then by the same reasoning as
applied above, every 1000 person increase in employment yields aggregate annual benefits
of approximately $1M.
2. Economic fan surplus: The identification of a sports team like the Orioles with a city
surely generates some pleasure for its citizens beyond that which is reflected in ticket
sales. In this respect the economics of sports is much different from the economics of,
say, apples. A fan can derive substantial pleasure from the Orioles, and identify with them
as "his" team, without ever attending a game, but gets no such pleasure from knowing
that somebody is eating apples in Baltimore. This is a standard externality; the Orioles
produce a service for which some beneficiaries pay nothing.
In fact, the two intangible benefits are simply different manifestations of the same benefit.
If the presence of the Orioles is a valuable amenity for Baltimore residents, they will accept lower
wages than they otherwise would to work there, and as a result employers will find that labor is
cheap in Baltimore, and the city will expand. In other words, these public-consumption benefits,
like job- and tax-import benefits, are capitalized into local property values.
In principle, it is possible to measure the magnitude of this amenity benefit, using the
technique that Rosen employed to measure the effect of city size and rainy days. Attempts to
estimate the amenity value of professional sports teams have not been successful, however,

36
because the number of sports teams is so highly correlated with city size. Inclusion of some index
of sports-team presence as a regressor generally either produces statistically insignificant
coefficients or renders other coefficients, such as city size, insignificant.68 These findings of
course do not mean that no sports-amenity effect exists, but rather that any such effect as does
exist cannot be statistically disentangled from other regressors such as city size.69 In the absence
of statistical evidence, there is little to do but to state that which is by now obvious: before
considering the present value of the amenities generated by the Orioles, cost of the subsidy is
approximately $14.70 per Baltimore SMSA household per year,70 assuming that the above
calculations are valid. It seems plausible (but not verifiable) that the externalities generated by the
Orioles are substantially larger than this figure.
Suppose, for example, that the citizens of Baltimore were faced with a choice of climate
change in the form of one additional rainy day per year or loss of the intangible benefits of the
Orioles. It seems plausible that most would prefer the extra rainy day; according to Rosen, the
disutility of this rainy day is approximately $45 per worker, or about $72 per household, per year.
As citizens are actually paying about $15 per household per year to keep the Orioles in town, it
68Telephone interview with Glenn Blomquist, July, 1996. Blomquist was reporting his
own research efforts which were published in "A Revealed Preference Ranking of Quality of Lifefor Metropolitan Areas."
69If NFL teams continue to move to second-tier cities (see the discussion by Noll andZimbalist in this volume), then in the future the correlation between city size and professionalsports activity might be weak enough to facilitate estimation of this effect.
70Though the burden of the subsidy is borne by citizens throughout the state, it seemsreasonable to assume that any public consumption benefits are concentrated in the Baltimoremetro area. However, it also seems unlikely that such public consumption benefits stop at themetro area boundary.

37
seems likely that they are getting a substantial net surplus.
Declining Cities
We calculated above that the Orioles at Camden Yards are directly and indirectly
responsible for at most approximately 550 jobs in the Baltimore metro area and that these jobs,
along with tax imports, generate economic benefit for Baltimore residents of approximately $3M
per year. As we discussed, the route through which the job-creation portion of this benefit is
achieved is city expansion, which raises property values. In this section we note that the effect of
incremental jobs on city welfare is likely to depend critically on whether the city is expanding or
shrinking; in other words, on whether the incremental jobs cause growth or diminish decline. This
consideration is potentially very important in Baltimore. Between 1950 and 1990 the central city's
population declined by 23%, from 950,000 to 736,000.
Much of a city's infrastructure is irreversible (putty-clay) past investment. When a city's
population declines, a portion of this capital becomes redundant. In the case of public
infrastructure such as watermains and schools, a city's shrunken population frequently has little
choice but to pay for upkeep on this excess capital. In the case of housing, the value of the stock
declines as the demand curve shifts inward. A population decline of the magnitude suffered by
Baltimore leaves the city with substantially more houses than households, and therefore a need to
retire some houses from the stock. Frequently the cheapest way to retire houses is to abandon
them.71 In short, shrinkage imposes significant costs on the residents of a city. It is not harmful to
be small; in equilibrium the same utility is available in small as in large cities, but becoming small
71Demolition, for example, is generally not an economically viable option. Demolition of
row houses generally costs between $500,000 and $900,000 per acre, and many acres inBaltimore are not worth this much. (Mills and Hamilton, p145.)

38
can be very harmful indeed. We are aware of no studies detailing the costs of shrinkage, nor of
the incidence of these costs. However, it seems clear that the costs are substantial. This in turn
suggests that capturing 540 jobs might be much more important for a shrinking than for an
expanding city.
If this line of reasoning is correct, it does not necessarily imply that the public investment
in Camden Yards was better than our prior calculations suggest. If the state has limited funds for
job attraction, then getting the biggest possible job-creation bang for the dollar is more important
for a shrinking than an expanding city.
The Political Economy of Camden Yards
We noted above that few in Baltimore were seriously concerned about the possibility of
the Orioles leaving town until after the team was sold to Washington attorney Edward Bennett
Williams and the Colts left town. During the 1970s, before either of these events, the teams'
efforts to get public subsidies for new stadiums were rebuffed. Only after the departure of the
Colts and sale of the Orioles did public officials accede to Oriole demands for a new public
stadium.
This history, along with the financial analysis presented above, is consistent with the
following story:
Public officials understood that Camden Yards was not an engine of economic
revitalization and thus saw no reason to support a move to Camden Yards when the only public
benefit was the capture of $3M in tax and job imports.72 But in the 1980s the stakes changed:
72Had the job-creation and tax-import benefits of Camden Yards been greater than the
deficit, then public officials should have immediately embraced the Orioles' earliest request for anew stadium.

39
With the Colts gone and the Orioles owned by a Washingtonian, the presence of the Orioles in
Baltimore and thus the public consumption benefits were at risk. This tipped the balance in favor
of the subsidy. This scenario (and we emphasize that it is but one of many scenarios consistent
with the facts) casts Maryland's public officials not as manipulative Romer-Rosenthal agenda
setters but as responsible keepers of the public trust.
THE RAVENS AT CAMDEN YARDS
The Ravens stadium at Camden Yards is projected to cost approximately $200M, plus
$24M in luxury-boxes to be paid by the Ravens out of PSL proceeds.73 The Ravens will be
responsible for all maintenance but will pay no rent. The "no-rent" clause in the Ravens' contract
led to considerable confusion in the Baltimore press. There is a clause in the Orioles' lease with
the MSA which entitles them to "parity"74 with any NFL team. As we will discuss below, rent is
not the only point at issue regarding the parity clause; it seems likely that the parity clause will
oblige the MSA to make substantial lease concessions to the Orioles.
As discussed above, the Orioles pay approximately $6M in rent; thus, the central rental
component of the Ravens' agreement75 is substantially different from that in the Orioles' lease.
73This $24M is to be paid over 15 years; thus the present value is substantially less.
Indeed, in the memorandum of agreement between the Ravens and the MSA under which theRavens moved to Baltimore, there is no repayment schedule for this $24M, nor any interestaccrual. (Interview with Joseph Foss).
74Prior to 1979 the city negotiated leases with the Orioles and Colts separately, generallyadjusting rent according to ability to pay. The Orioles, being less profitable, paid less rent thanthe Colts. But in 1979 the Colts got a clause in their lease tying their own rental payments tothose of the Orioles. (Sun 8/7/79).
75As of October, 1996, the Ravens and the MSA have not agreed upon final terms of thelease; rather there is a memorandum of understanding which leaves substantial room fornegotiation.

40
But unlike the Orioles, the Ravens will be responsible for maintenance (approximately $4M/year).
Thus one major difference is that under the Orioles' lease the O's pay maintenance indirectly (via
rent) and the Ravens pay it directly.76 This change was made because of a change in the United
States tax code in 1986; under the law as of the time of financing the Ravens' stadium, it is not
legal to use tax-exempt bonds to finance a stadium, if more that 10 percent of the service in those
bonds is secured by rent from the stadium.
As with the Orioles, there will be a 10% tax on all stadium tickets. Admission tax
revenue is estimated to be $2.6M.77 We have no history on the fraction of this tax that will be
paid by out-of-state residents, nor among those the fraction that will be incremental.78 Given the
presence of the Redskins in the Washington suburbs, it seems highly unlikely that the Ravens will
match the Orioles and draw 31% of their fans from out of state. Nevertheless, we will
provisionally assume that 30% of Ravens fans will come from out of state,79 and will discuss the
implications of this assumption at the end of the analysis. If 30% of the admission tax revenue is
76Another difference is that the Ravens' payment is due regardless of the team's financial
success. Or at least so the MSA believes (interview with Edward Cline, Deputy Director of theMSA). But as the final Ravens' lease is not yet signed, it is not clear whether this term will be apart of it. The Orioles' rent is a proportion of team revenue; thus in the event of poor attendance(or a strike) the team's rent will fall. (As Orioles' games are virtually all sold out, it is implausiblethat a revenue-based rent will rise.)
77This is to be split, with 80% or $2.1M going to the MSA and 20% or $.5M going to theCity of Baltimore.
78To the extent that Ravens' Washington fans would otherwise have attended Redskinsgames, such tax importing is not attributable to the Ravens, because the Redskins stadium will bein Maryland in any event.
79As we will see, this assumption has little bearing on the economic viability of the Ravens'stadium; even assuming 30% of fans are imported, the stadium is even more of an economic drainon Maryland than the baseball stadium.

41
attributed to incremental out-of-staters, then the Ravens import $0.8M in admission tax revenue.
For the other entries in Table 2, a reasonable upper bound for the Ravens analog to the
benefit generated by the Orioles is found by taking 15.6% of the Orioles benefit (on the grounds
that there will be 10% as many Ravens games as Orioles games, but 56% more fans per game)80.
On the basis of this simple assumption, Table 3 shows the Ravens analog to the Orioles net-cost
calculation of Table 2:
Table 3Economic Benefit from The Ravens
Benefits of Job Creation 0.07M
Out of Stadium Incremental Taxes 0.20M
Incremental Admission Tax 0.80M
Sales Tax on Incremental StadiumSpending
0.07M
TOTAL 1.14M
Economic projections81 prepared by various groups assume that part or all of the shortfall
(relative to the Orioles) will be made up from non-NFL events staged at the Ravens' stadium. The
MSA would receive the 10% admissions tax for all such events, and would receive in addition
50% of net (of staging cost) gate receipts for some but not all such events. In one of its
hypothetical scenarios, the Department of Fiscal Services estimates that total gate receipts from
80Average baseball attendance is approximately 45,000; the football stadium is projected
to hold 70,000 (Estimated Impact of a Football Stadium at Camden Yards, Maryland Departmentof Fiscal Services, January, 1996.
81One example is a January, 1996 projection by the Maryland Department of FiscalServices (DFS), which critiques earlier studies by the Maryland Department of Business and
42
non-NFL events will be $12.4M, plus $1.24M in admission taxes.82 Depending on staging costs,
and assuming MSA is entitled to 50% of the gate on all such events, MSA might receive up to
$5M on non-NFL events.
The fundamental problem with these projections is that these non-NFL events (if there is
truly a market for them in the first place) could easily be held in other venues around the state.
Many events could likely be staged at the baseball park at Camden Yards; thus the economic
benefit from such events cannot be used as a justification for building the football stadium. In the
five years since Oriole Park at Camden Yards opened, virtually no major non-baseball events have
been staged in the stadium, leading to the first-blush conclusion that somehow the stadium and its
primary (baseball) function is not well suited to concerts and the like. However, Joseph Foss of
the Orioles disputes this. Rather, he believes that the lack of non-baseball events in Camden
Yards is due to a peculiarity (another departure from parity with the Ravens) in the Orioles' lease.
Under this lease term, the Orioles receive no revenue from non-baseball events at Camden Yards,
but do have veto power over any proposed event. The result is that the Orioles have no incentive
to try to market the stadium or to even cooperate with the MSA. Mr. Foss suggests that with the
right incentives the Orioles could easily accommodate concerts and other such events while the
Orioles are on the road. As of this writing, the Orioles are negotiating with MSA for rights to
revenue to non-baseball events.
Economic Development.
82In their projection, DFS only assigns incremental attendance (estimated at 15,000) forfootball games, on the assumption that the games would have occurred anyway, but with lowerattendance.

43
Particularly if Oriole Park begins to compete for the concert trade, it seems most unlikely
that the football stadium will generate even a substantial fraction of the projected $12M in concert
revenue, and in any case almost all such revenue that is generated will be simply a relocation of
such activity from elsewhere in Maryland.
In the case of the Orioles, recall that we estimated a best-case fiscal deficit of
approximately $11M, or $14.70 per Baltimore household. For the Ravens' stadium, is a deficit of
approximately $13M, or $17.33 per household per year. The total cost of the stadium (to
Marylanders) is $14M in capital cost plus $4M in maintenance.
The $4M maintenance cost should count as a part of the cost of the Ravens only to the
extent that crowding out of alternative spending does not result in a reduction in maintenance
expenditure at other venues. Unfortunately we have no information on potential savings of
maintenance cost elsewhere. Thus the worst-case cost of the Ravens is between $14M and $18M
per year, or between $18.67 and $24 per household per year.
As with the Orioles, the subsidy is justified if the public consumption benefits exceed the
subsidy. And as with the Orioles, we have no adequate method of estimating the magnitude of
the public consumption benefit.
CONCLUSION
Regarding Oriole Park at Camden Yards, we draw the following conclusions:83
&� The new stadium generated sufficient new revenue to more than cover the capital and
83All of these conclusions hinge on one crucial intangible: Will attendance hold at its
historically phenomenal level? If an expansion team comes to Washington, or if poor playing-fieldperformance reduces fan support, the outlook for the Orioles and the MSA might be quitedifferent.

44
maintenance cost.
&� The Orioles' fiscal picture improved dramatically as a result of the move; they captured
much more than 100% of the surplus generated by the move.
&� Before considering the external public-consumption benefits from the presence of the
Orioles, the state and its subdivisions lose approximately $9M per year on Camden Yards.
This is approximately $12 per Baltimore household per year; the public subsidy to the
stadium is justified only if the public consumption benefits of the Orioles are at least this
large.
&� In addition to the deficit borne by the State, the national economy bears approximately
another $12M in costs. We are unable to determine what fraction of this burden is borne
by Marylanders, but it seems likely that the majority is borne by non-Marylanders.
As regards football in Baltimore,
&� In direct impact, the state and it subdivisions lose approximately $13M per year on the
Ravens stadium, depending upon the amount of non-NFL activity generated at the new
stadium, and upon the fraction of such activity which would not have happened but for the
stadium.
&� Since the Ravens play many fewer games, the state has fewer opportunities to recoup tax
revenue from out-of-state fans than for the Orioles. Induced-employment and out-of-state
tax benefits are estimated to be approximately $1M per year.
&� The costs absorbed by the economy as a whole are comparable to those attributable to the
baseball park; approximately $12M.
For both the Orioles and the Ravens, we are unable to estimate the value of the public

45
consumption benefits received by Marylanders. This is unfortunate, because each ballpark is, or is
not, worth the subsidy depending upon whether the public consumption benefits are greater than
the subsidy.

46
References
Arthur Andersen LLP. Economic and Fiscal Impact Analysis: Proposed Redskins Stadium inLandover, Maryland. January 16, 1996.
Baltimore City Department of Planning. The Economic Impact of Oriole Park at CamdenYards Results of a Fan Spending Survey for the 1992 Season. December, 1992.
Berger, Mark C., Glenn C. Blomquist, and Werner Waldner. "A Revealed-Preference Ranking ofQuality of Life for Metropolitan Areas." in Social Science Quarterly. vol 68, No. 4, December1987. pgs 761-78.
Dewey, Donald and Nicholas Acocella. The Ball Clubs Every Franchise, Pas and Present,Officially Recognized by Major League Baseball. Harper Perennial. NY. 1996.
Financial World Magazine. "Secrets of the Front Office What America's Pro Teams are Worth" February 9, 1991 pgs 28-43; "Big Leagues, Bad Business" July 7, 1992 pgs 34-51; "Foul Ball" May 25, 1993 pgs 18-40; "The $11 Billion Pastime" May 10, 1994 pgs 50-64; "Suite Deals Inside the New Stadium Booms" May 9, 1995 pgs 42-60; "Sports The High-Stakes Game ofTeam Ownership" May 20, 1996 pgs 53-70.
Gershman, Michael. Diamonds The Evolution of the Ballpark from Elysian Fields to CamdenYards. Houghton Mifflin Co. NY. 1993.
Johnson, Arthur. "Economic and Policy Implications of Hosting Sports Franchises: Lessonsfrom Baltimore." in Urban Affairs Quarterly. vol 21, No. 3, March 1986. pgs 411-34.
Miller, James Edward. The Baseball Business Pursuing Pennant and Profits in Baltimore. TheUniversity of North Carolina Press. Chapel Hill, NC. 1990.
_____. "The Dowager of 33rd Street: Memorial Stadium and the Politics of Big-Time Sports inMaryland, 1954-1991." in Maryland Historical Magazine. vol 87, No. 2, Summer 1992. pgs187-200.
Mills, Edwin S. and Bruce W. Hamilton. Urban Economics. 4th ed. Harper Collins Publishers1989.
Orioles 1996 Media Guide.
Patterson, Ted. The Baltimore Orioles Forty Years of Magic from 33rd Street to Camden Yards. Taylor Publishing Company. Dallas, Texas. 1994
Ritter, Lawrence S. Lost Ballparks A Celebration of Baseballs Legendary Fields. Viking Studio

47
Books, Penquin Group. New York, NY. 1994, pgs 111-120
Rosen, Sherwin "Wage Based Indexes of Urban Quality of Life." in Current Issues in UrbanEconomics. The Johns Hopkins University Press, 1979.
Shropshire, Kenneth L. The Sports Franchise Game Cities in Pursuit of Sports Franchises,Events, Stadiums, and Arenas. University of Pennsylvania Press. Philadelphia, PA. 1995.
USA Today. The Complete Four Sport Stadium Guide. Fodor's Sports. Fodor's TravelPublications. NY. 1994.
InterviewsBill Cassidy, Manager, Fells Point Office, Long and Foster RealtorsEdward Cline, Deputy Director, Maryland Stadium AuthorityJoseph Foss, Vice President, Business and Operations, Baltimore Orioles.