balsa rafts tupac yupanqui and rahiti tane · heidenstrøm, ola borgfjord, andrey chesnokov and...
TRANSCRIPT
Scientific Cruise Report – Kon-Tiki2
1
Kon-Tiki2 Expedition 2015-2016 Scientific Cruise Report
By Torgeir Higraff, Cecilie Mauritzen, Pedro de la Torre and Håkon Wium Lie February 1 2017
Balsa Rafts Tupac Yupanqui and Rahiti Tane
Leg 1: Peru – Easter Island November 7 – December 19 2015
Leg 2: Easter Island – 3933’S 09601’W January 6 – March 17 2016

Scientific Cruise Report – Kon-Tiki2
2
Executive Summary
The Kon-Tiki2 Expedition was partly an anthropogenic exploration and partly an interdisciplinary oceanic and atmospheric research expedition. As a research expedition it was unique for three reasons: 1) The type of vessel used, 2) the timing of the expedition, and 3) the geographical location. The scientific program was run onboard the ancient design balsa rafts, powered by solar power only, with almost no possibility of stopping the raft, during a year with the strongest El Niño recorded in human history, in the midst of the center of that El Niño, namely in the area between Peru, Easter Island and the Chilean mid-latitudinal coast. The scientific expedition planned and organized as a cooperation between the NIVA and NTNU in Norway. It was divided in two legs: the transect from Peru to Easter island and from Easter Island until the expedition concluded with the organized evacuation of the rafts. Instruments were brought on board the rafts and procedures were specifically developed for this cruise to study 1) climate change and ocean acidification, 2) marine litter, 3) El Niño and operational weather forecasting and 4) marine life. The rafts were built following the designs of archeological studies on an Ecuadorian maritime culture known as the Manteno. They were built in Peru, with help from volunteers from all over the world as well as from the national Peruvian Navy. Building efforts were delayed by logistic issues, but Leg 1 departed Callao on November 7th 2015 and reached the Easter Island as planned 6 weeks later, on December 19th 2015. After a change of crew and a full overhaul of the rafts and equipment in Easter Island, Leg 2 departed Easter Island January 6 and ended March 17 2016. The crew was multinational, gender-mixed, synergetic and multidisciplinary experienced. Each raft on each leg had 7 members on board. Only four members were present during both legs. There was a one scientist on board on each leg representing either of the organizing institutions. Both rafts were instrumented for research. Each had an electrical installation with capacity calculated according to the payload of instruments that would be operated from it. Wind was the main source of energy to transport the vessels while photovoltaic cells transformed solar into electric energy for the electronics onboard. The sensor payloads can be classified into three categories: atmospheric, oceanographic and ecological. Optical sensors to measure light, together with physical sensors to measure atmospheric conditions were combined with crew observations to describe the meteorological situation in the raft. A combination of echosounders and cameras were used to describe the macrofauna biodiversity present around the rafts. DNA and Chlorophyll a filtering aimed to study the microdiversity. The physical parameters like temperature, salinity, pH, levels of carbon dioxide described the climatic conditions in the region were the cruise sailed. Finally, both conventional and state-of-the-art technology were used to observe macro and micro plastics in this remote area of the world oceans. Currently, the material collected on the cruise is subject of analysis in different laboratories. Kon-Tiki2, due to its unique nature, has been the subject of interest to a wide range of audiences. In addition to the general scientific interest, the expedition has given a much louder voice to the oceans than any regular research expedition could have given. For instance, the expedition coincided with the Climate Summit in Paris in December 2015 (COP21), a coincidence that we utilized to its fullest. The outreach efforts of the expedition participants have raised awareness about the science as well as about the

Scientific Cruise Report – Kon-Tiki2
3
expeditions sponsors. Most importantly, it has promoted cultural awareness across many state borders. The Kon-Tiki2 Expedition combined science with adventure and challenge. Its organization was not simple, however, the outcome is of highest value, both from a professional scientific point of view, for the originator and sponsors of the expedition idea and for each and every project participant. Kon-Tiki2 aimed to double-down on Thor Heyerdahl's Kon-Tiki voyage (1947) by sailing two rafts from South America to Polynesia and then back. No one has done this in modern history. Kon-Tiki2 was an unparalleled voyage of survival, science and exploration.
Although one of the strongest El Niño ever recorded stopped us from sailing all the way to South America, Kon-Tiki2 substantiates the ancient Pacific pathway for both Polynesians and South Americans. We know both cultures had rafts. Polynesians probably used their superior double hulled canoe for exploration and rafts for migrations. Kon-tiki2 showed how Polynesians could have sailed to South America and back, and how South Americans could have done the same in the opposite direction.

Scientific Cruise Report – Kon-Tiki2
4
Acknowledgements
This report is prepared by Torgeir Higraff (who led the Tangaroa expedition in 2006, who originated the idea of the Kon-Tiki2 Expedition and planned, realized, led and sailed the expedition), Cecilie Mauritzen (Kon-Tiki2 Expedition scientific leader, Chief Scientist, Leg 1), Pedro de la Torre (Chief Scientist, Leg 2) and Håkon Wium Lie (Chief Technology Officer, Leg 1). Contact information is available at end of report. Scientific data is available upon request at the Norwegian Institute for Water Research. All photo credits of this report go to the Kon-Tiki2 Expedition.
The expedition would never have been possible without the generous, expert and volunteer help from the long list of people and institutions towards which we would like to express our sincere thanks:
The crew members of leg 1: Captain Kari Skår Dahl, Signe Meling, Pål Børresen, Boris Romanov, Gunvor Storaas and Esteban Contreras from Rahiti Tane, and Captain Øyvin Lauten, Jostein Alvær Heidenstrøm, Ola Borgfjord, Andrey Chesnokov and David Short from the Tupac Yupanqui raft.
The crew members of leg 2: Captain Signe Meling, Rasmus Erlandsson, Lisa Teheuheu, Sergeij Goltsov, Liv Arnesen and Evgenij Orlov from Rahiti Tane and Captain Ole Borgfjord, Andrey Chesnokov, Erik Clasen, Jimmy Blom, Erlend Koppergård and Roberto Sala from the Tupac Yupanqui raft.
The raft builders: Heidi and Heikki Niskanen (who also wrote the section about building the rafts, thank you!), Camote Herrera Masias, Kirstine Schøler Hjort, Wiggo Sten Larsen, Ida Selin Lillebostad, Bernhard Engelschiøn, Liana Ibimraei, Alexander Haug, Joakim Okkels, Pavel Shterlyaev, Katarina Kierulf, Morten Holtan, Steinar Midtbø, Anne Kirkeby, Adrian Kirkeby, Olav Tømmerstigen, Geir Sivertzen and Bjørn Kåre Kaldestad.
Helpers in Peru: Roberto Sala, Lilly Ceballos Coucillas, Yaneth Cisneros Nunez, Francisco Yabar, Andrea Yabar and consul general Lars Stimman.
Helpers on Easter Island: Jackeline and Ariki Rapu Tuki. And the mayor, Pedro Pablo Petero Edmunds Paoa.
Helpers in Chile: Andres Daroch and Gaby Vega from FoodCorp Chile S.A., who assisted in the monumental task of returning the instrumentation back to their owners after the expedition. Xavier Gutierrez, from NIVA-Chile, for their help in storing and sending scientific material to Norway. From Gearbulk we want to thank Eugenio Moreno and Phil Curran for shipping of 600kg technical equipment from Chile to Rotterdam, free of charge. We also would like to thank the Royal Norwegian Embassy in Chile, with Ambassador Hege Araldsen and Mary Bangstad, who helped us in every possible way, both in Peru and in Chile.
Helpers in Ecuador and Switzerland: The biggest logistic operation of the expedition was initiated by CEO Roman Thomassin and 3A Composites Core Materials, a global organizational unit within 3A Composites, part of Schweiter Technologies (SIX Swiss Exchange: SWTQ). Its AirexBaltekBanova brand provided the most essential part of the experiment: The balsa trees. We got huge support from their senior forestry experts Ramon del Pino, Carlos Giler Hidalgo, Ximena Erazo and Andres Egasin in the giant task to bring 44 fresh logs from the plantation and across the border to Peru.

Scientific Cruise Report – Kon-Tiki2
5
Helpers in Norway: Mona Sæverud Higraff, Karen Mosman, Hans-Petter Fagerli, Dag Asheim and Ian Naysmith.
The Norwegian Ministry of Foreign Affairs: Bjørnar Dahl Hotvedt, Senior Advisor in the section of Marine Resources, who helped us with financial support for the scientific program in general and the marine litter program in particular.
The Peruvian Navy: Admiral César Linares Roca, Admiral Eduardo Novoa, Capt Marco Percovic Bareti and the staff at The Peruvian Naval Shipyard SIMA, Rear Admiral Luis José Polar Figari and the staff at Escuela Naval, Capt. Also thanks to Vice Admiral Mauro Cacho de Armero, the Chief of the Peruvian Naval Staff, and the staff at the naval PR-department headed by Capt. John Rodriguez Asti.
The Chilean Navy: The commander-in-chief Enrique Larrañaga Martín, The crew of the OPV 81 “Piloto Pardo” with Captain José Marfull Canales. The Chilean director of security and maritime operations, Rear Admiral Mario Montejo, and Rear Admiral William Corthorn Rodriguez.
The Japanese rescue ship: The crew of MS Hokuetsu Ushaka with Capt Yun Sun Gug.
General Sponsors: AirexBaltekBanova, Opera Software and the Thor Heyerdahl Institute.
The scientific sponsors:
NASA/Goddard Space Flight Center: Alexander Smirnov at the international AERONET program generously supported us with his expertise and lent us a Microtops II and GPS for atmospheric aerosol loading monitoring.
The Norwegian Meteorological Institute: Aslaug Mariolijn van Nes generously supported us with her expertise and lent us the instrumentation for a fully operational weather station.
Kongsberg Maritime: Frank Reier Knudsen, Erlend Vågsholm and Rory Wood generously supported us with their expertise and lent us the EK80, 70kHz and 200kHz, echosounders for monitoring marine life in the water column.
Nortek AS: Tom Christian Ambrosius Mortensen and Jardar Maatje generously supported us with their expertise and lent us the Nortek Aquadopp current profiler for monitoring ocean currents.
NOAA: Shaun Dolk at the Global Drifter Program supplied the expedition with 16 surface drifters which we deployed along the cruise track.
UNESCO IOC: Martin Kramp at the JCOMMOPS office facilitated that the meteorological observations entered the operational forecasting centers for use real time, thus improving the weather forcasts for us and everyone else in the region.
Sperre: Fredrik Søreide and Robert Staven generously supported us with his expertise and lent us the Deepbot submersible camera.
NIVA: Kai Sørensen took the lead in supporting the expedition with a full-scala set of oceanographic instruments, including the Ferrybox system for continuously observing surface hydrography, pCO2, pH, chlorophyll and turbidity, as well as a deep CTD. Wenche Eikrem supplied the expedition with equipment for in-situ filtration of phytoplankton, zooplankton and DNA. Bert van Bavel supplied the microplast 3-stage pump and the near-infrared camera for measuring marine litter. Ian Allen supplied the equipment for passive sampling of marine contaminants. Special thanks go to Emanuele Roberto Reggiani who installed the scientific equipment on site in Callao, Peru and to Pierre Franqois Jaccard was always standby for software support during the expedition.

Scientific Cruise Report – Kon-Tiki2
6
NTNU: Geir Johnsen took the lead in supporting the expedition on behalf of NTNU. Asgeir Sørensen, Harald Ellingsen, Martin Ludvigsen, Sturla Haltbakk, Dorota Wesoly and Marit Nordtiller all provided generous support for the expedition.
Other sponsors: Jotron, Baker Hansen, Real Turmat, Kongsberg Seatex, Hansen Protection, Gylling Teknikk, Abu Garcia, Penn, Eterna, Stormberg, The Norwegian Society for Sea Rescue (Radio Medico Norway), Nexia, The Municipality of Asker, Meny Asker, Merem AS, EnkelW and Ruud Industrier AS. Special thanks to Jan Morten Ruud and Harald Wium Lie.

Scientific Cruise Report – Kon-Tiki2
7
Table of contents
Executive Summary ............................................................................................ 2
Acknowledgements ............................................................................................ 4
Table of contents ................................................................................................ 7
1 Raft design ...................................................................................................... 9
1.1 Building the rafts ......................................................................................10
1.2 Electrical system ......................................................................................13
1.3 Communication and navigation ..................................................................15
2 Cruise track ................................................................................................ 16
3 Life on board .............................................................................................. 18
3.1 Safety and watches ..................................................................................18
3.2 Food, sleep and leisure .............................................................................18
4 Sailing with "guara boards". Case studies from the expedition .................. 19
Case study A: daily sailing, high up towards the wind ............................................20
Case study B: daily sailing, semi-downwind ..........................................................20
Case study C: large change of course with sail up .................................................20
Case study D: 360 turn with sail down .................................................................21
5 Scientific investigations ............................................................................. 22
5.1 Scientific program in short.........................................................................22
5.2 Logistics ..................................................................................................23
5.3 Atmospheric observations .........................................................................23 Atmospheric aerosol optical depth (AOD) ..........................................................23 Light measurements ......................................................................................24 Weather reports .............................................................................................25
5.4 Physical properties of the sea surface .........................................................25 CTD ..............................................................................................................26 Carbon Dioxide ..............................................................................................26 pH ................................................................................................................26 Surface currents .............................................................................................27 Surface drifters ..............................................................................................27
5.5 Biological sampling from the surface ...........................................................28 Water transparency and color ..........................................................................28 Chlorophyll A and DNA sampling ......................................................................29 Surface plankton filtering ................................................................................29
5.6 Acoustic studies of fish and plankton ..........................................................30
5.7 Marine litter .............................................................................................31

Scientific Cruise Report – Kon-Tiki2
8
5.8 Marine contaminants ................................................................................32
5.9 Equipment that was not used during the expedition ......................................32
5.10 Data .......................................................................................................33
5.11 Publication plans ......................................................................................33
5.12 Kon-Tiki2 scientific presentations to date ....................................................35
6 Contact Informatio ..................................................................................... 36
6.1 Expedition contact information ...................................................................36
6.2 Science program contact information ..........................................................37
7 Appendices ................................................................................................. 38
7.1 Abbreviations list......................................................................................38
7.2 Cecilie Mauritzen’s log for leg 1 ..................................................................39
7.3 Pedro De La Torre’s log for leg 2. ...............................................................45
7.4 Meteorological observations, Rahiti Tane, leg 1 ............................................51
7.5 Statement of the expedition’s conclusion from www.Kon-Tiki2.com ................55
7.6 Statement of Fact for Rescue operation .......................................................56

Scientific Cruise Report – Kon-Tiki2
9
1 Raft design
The raft design is based on archaeological studies and historical sources. The Manteño were an Ecuadorian maritime culture that began around AD 800, and ended in AD 1526, when the Spanish Conquistadores arrived. The Manteño were a "league of merchants," using balsa wood raft to become a rich trading society. The Spaniards made drawings and written descriptions of the rafts and their sailing capabilities. The Kon-Tiki2 rafts were based on these designs.
Along the coast that was controlled by the Chincha people (1300 - 1500) archaeologists have found hundreds of wooden boards in graves. Typically, these are 150-200cm long boards made from hardwood. In the past 100 years, archaeologist and collectors have put them on display in numerous museums and one is displayed in the Metropolitan Museum of Art where they are labeled as ceremonial of funerary staffs, or wooden sculptures, and visited by millions. In fact, these are centerboards used to steer rafts, called "guaras" by the conquistadors. These guara boards, i.e. centerboards, were built based on those found in the desert of Peru, basically from two cultures: the maritime Sicán culture on the northern Peruvian coast, conquered by the Chimú kingdom around AD 1375 (which, in turn, was conquered by the Inca by AD 1470) and the Chincha culture on the southern Peruvian coast (conquered by the Inca by AD 1480).
The original 1947 Kon-Tiki raft was equipped with four such centerboards. However, they were fixed to the raft: Apparently, Heyerdahl had not seen sketches of people moving these guara boards up and down. He mentions that if he had known how to steer the raft with centerboards, he would never have smashed into the reef off the island of Raroia. But the whole point of this clever invention is to raise or lower the boards depending upon the winds and currents. When the wind is constant, the direction and course of the vessel can be changed if you move the boards to a higher or lower level. The guaras on the 2006 Tangaroa Expedition were installed and used based on observations Heyerdahl made after completing the Kon-Tiki expedition: In 1953, he carried out an experiment together with Emilio Estrada in Ecuador with a small raft, using the guaras to understand how this mechanism worked. Both rafts represented the cultures mentioned above. The rafts were named after the Inca Tupaq Yupanqui, with the logo of Thor Heyerdahl Institute on its sail, and after the Polynesian legend Rahiti Tane, with the AirexBaltekBanova logo on its sail (see front page photo). An arrangement of 11 logs tied parallel next to each other provided floatation to the raft. Ten logs perpendicular to these and distributed evenly from the aft to the bow worked as structural elements to hold the floating elements together. The 15m tall mast and 90 square meter big sail was placed in the central fore part of the vessel. Spanish seamen noted (in the 1520s) that the rafts "carried sails like that of our own ships, and of equal quality". We know the Spaniard had both triangular sails and square sails, depending on the type of voyage. Squared sails were installed on the Kon-tiki2 rafts for two reasons: the first one was insufficient knowledge on the Peruvian raft rig, and the second is that skippers Ola Borgfjord and Signe Meling took part in the rigging. They knew well how to work on Norwegian Viking rigs and thus this type of sailing and rigging were used at sea. The rafts also had a bamboo hut that functioned as home for the crew and for storage and laboratory.

Scientific Cruise Report – Kon-Tiki2
10
1.1 Building the rafts
The building should have been started in the end of September 2015, but due the delays of Peruvian custom, the actual building process started fully in the beginning of October 2015. It shortened the building time to a minimum and less. Instead of planned full six weeks the building team had approximately three and a half weeks to build both rafts. Working days started early in the morning and finished in the night every day. The rafts were built in SIMA military shipyard in Callao, Lima, Peru. The building team and crew had enormous help from SIMA’s workers, who were helpful and friendly thru the building process in SIMA. Builders had a small office changing room in SIMA and in the shipyard a container for equipment and supplies. The raft builders stayed nights at the Escuela Naval Del Peru in La Punta. The SIMA shipyard was in Callao, Lima, 5.6 km away. The building team was transported to SIMA and back with taxis and private buses. Refer to Figure 1 for an overview of the geographical location and installation of the building and deployment sites. The second part of building was made after the rafts were launched, at the end of October, in the dock of Escuela Naval Del Peru. Because the builders and crew lived as well in the Escuela Naval Del Peru no transportation to work was needed. At Escuela Naval Del Peru the personnel of the school were very helpful and friendly. Without them the project would not have stayed on the desirable timetable.
Figure 1 On the left, builders put logs together to build the rafts. On the right, a map shows the location of the accommodation of our team, at Escuela Naval, and the place where the rafts where built in La Punta, at the south end.
The building team had no major accidents during the construction. There was ongoing stomach disease circling on the group, which was probably caused by poor hygienic treatment of fruits and vegetables at the SIMA Shipyard. The actual building process began when tools, part of the lumber and bamboos where bought and transported to SIMA. Also some ropes where handled to the shipyard. The logs for masts where also transported to SIMA shipyard. Only the longitudinal balsa logs where missing. They were held at Peruvian customs. The building process is scripted with respect of used time by numbers below:
1. The first task was to make yards for sails from bamboo. The four bamboos were tied together with tar handled rope. Modification, planning and making of masts started at the same time, few days before the longitudinal balsa logs arrived. The total construction of masts took

Scientific Cruise Report – Kon-Tiki2
11
approximately two weeks. At the same time making of guara boards started. The total time required to make more than 20 guara boards was four weeks.
2. When the longitudinal balsa logs arrived, they were placed with the aid of SIMA´s shipyard cranes 1.5 m above ground on railroad steel bars. The bars were placed above big cement pillars as shown in Figure 1. Balsa logs were modified to fit as tight as possible side by side. Work was done mainly by chainsaws and with the help of cranes. When fitting was roughly done, lines for the bandage ropes were measured, drawn and cut. The notches were made with hand circular saw, chisel and wood club. Fitting and notching continued until all the logs were tied together.
3. Refer to Figure 2. The bamboo structured decks for balsa rafts planned after there were clear image of the whole raft (placement of hut, mast, etc.). Each part of the deck was measured individually and made in specific manner which suited to the purpose. At the beginning some testing were made and after couple of days the suitable building manner for bamboo decks was figured out. The building was made with hand saw, machete, club, chisel and knife also with help of some newly developed tools to help the building. Bamboo decks were tied with sisal rope. The process continued until the rafts sailed on the journey to Eastern Island. Some decks were made on the sea, during the journey, because of the tight schedule on land.
Figure 2 The floor of the deck was made of bamboo logs tied next to each other (left). Skilled knot tiers and a hard-working building team assembled both the deck and the cabin with the same material.
4. At this time also rope work started fully. There was a huge demand of spliced ropes. Hundreds
of different types of spliced rope were needed. The splicing was done in small groups and more people were instructed to do the work during the process. The biggest and strongest ropes were needed to tie the longitudinal and vertical balsa logs together. With ropes was also custom problems but it was avoided by buying ropes from local markets and shops. The ordered ropes arrived few weeks late to the shipyard.
When two longitudinal logs were fit the upper, vertical logs were placed, fitted and notched ready for roping. Also the vertical logs were compensated and leveled from the upper surface. This was done because decks should be at the same level, when placed over the log lines. Also it was made because the guara board and especially cabin floor mounting needed flat levels. The leveling was made roughly with a special chainsaw, club and chisel technique. At this period of time the rafts logs were cut to final size from fore, stern, port, starboard. On the fore also the fore angle of attack was made with chainsaw at estimation of 45 degrees. The heads of balsa logs on fore and stern were painted with tar and pitch.

Scientific Cruise Report – Kon-Tiki2
12
5. The rope work for sail, mast and rig started. Also necessary timbles and all parts of sail work were made on the spot. This work continued to the end of construction process and some work were also made on sea-journey. At this time many other different tasks started. It was possible because many new volunteers arrived. The longitudinal and vertical balsa logs were tied together by spliced ropes. Here the SIMA workers helped a lot on tying the logs together with ropes. Work was done in two shifts. The major woodwork for cabin (walls and roof) started. The spine of the cabin was made from natural wood. A hole was drilled to the upper balsa logs and the wood bars were fit to the hole. The cabin walls were strengthened by wood rods, which were tied to the main wood bars. The spine of the cabin roof was made from bamboo. The cabins were almost ready during the launching, but lot of work was done in Escuela Naval Del Peru´s dock.
Figure 3 On the left, Gunvor reinforces the sail of Tupac Yupanqui. Builders on the right test the guara setup on the deck of a raft.
6. Just a week before launching the building team started to tie up the sails. Also the Thor
Heyerdahl institute logo was painted in Escuela Naval Del Peru´s sports hall. After this the masts were ready and they were lifted to the rafts with help of the crane. The equipment for wind speed and direction measurement were mounted to the top of the masts. The yard and sail were attached together and then attached to the mast with suitable ropes and lines.
7. The cabin floors were made from straight wood blanks. The 10 guara boards were mounted to raft as follows: Between vertical balsa log a wooden blank is mounted and attached with wooden large nails. In the blank is a hole, where the guara board can be placed. Another support for the guara is between longitudinal balsa logs made from two wooden blanks which also are attached to logs with large wooden nails. On the deck started during this time mounting and preparing the safety fence to the outer sides of balsa rafts. Guardrail was done from wood bars (total height of approximately 1.80 m) and safety line (sisal rope). Also to Tupac Yupanqui was made and mounted mechanical winch as a backup for the electrical assembled winch. Ongoing operation was to modify ready/ unready bamboo decks because of diverse reasons (shroud, mast, rails, cabin, etc.)
8. At the end of October on SIMA Shipyard was held rafts launching ceremony. The rafts were moved to the Pacific and after the ceremony towed to Escuela Naval Del Peru´s Dock. The final building and modification was mainly made there. The moving was done by SIMA´s cranes and towing was done by tugboat.
Scientific Cruise Report – Kon-Tiki2
13
Figure 4 Launch of rafts at SIMA shipyard. The rafts are being lifted from the dock (left) into the sea (right).
9. The last tasks were made in Escuela Naval Del Peru´s dock. All the major work was already done in SIMA shipyard, but still numerous targets need modification, adding and finishing. One of the main tasks were electronics and electrics (solar panels, circuitry, batteries, measurement devices, computers, etc.). Also more bamboo decks had to made and modified. The attaching structures for scientific and communication devices also had to be made and partly change. The sail ropework was also finished on this dock. On the dock was noticed a termite problem, which was rapidly increasing and jeopardizing the bamboo and wood structures. The problem was solved quickly and effectively with sea water and insecticide.
10. The final part in building process was to move all the equipment, crew supplies, food and water to the rafts before leaving to Eastern Island. What could not be done in Escuela Naval Del Peru´s dock, due the extreme short timetable, was done during the sea journey.
1.2 Electrical system
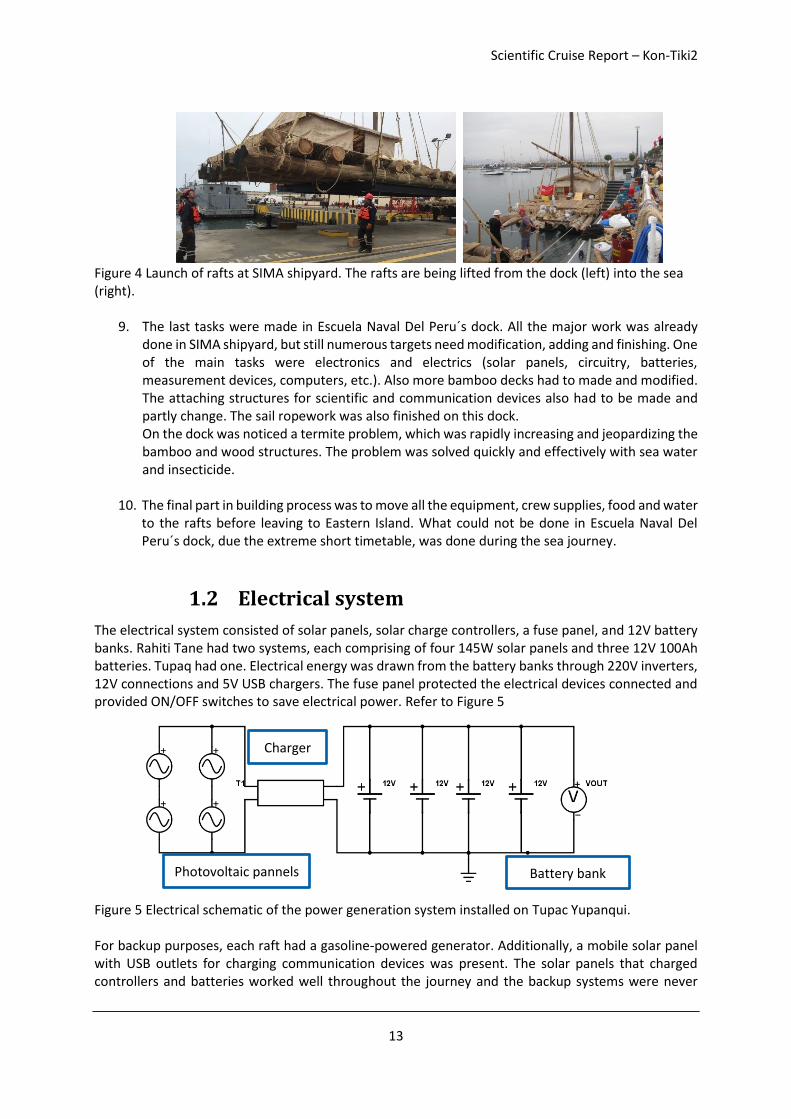
The electrical system consisted of solar panels, solar charge controllers, a fuse panel, and 12V battery banks. Rahiti Tane had two systems, each comprising of four 145W solar panels and three 12V 100Ah batteries. Tupaq had one. Electrical energy was drawn from the battery banks through 220V inverters, 12V connections and 5V USB chargers. The fuse panel protected the electrical devices connected and provided ON/OFF switches to save electrical power. Refer to Figure 5
Figure 5 Electrical schematic of the power generation system installed on Tupac Yupanqui. For backup purposes, each raft had a gasoline-powered generator. Additionally, a mobile solar panel with USB outlets for charging communication devices was present. The solar panels that charged controllers and batteries worked well throughout the journey and the backup systems were never
Photovoltaic pannels
Charger
Battery bank
Scientific Cruise Report – Kon-Tiki2
14
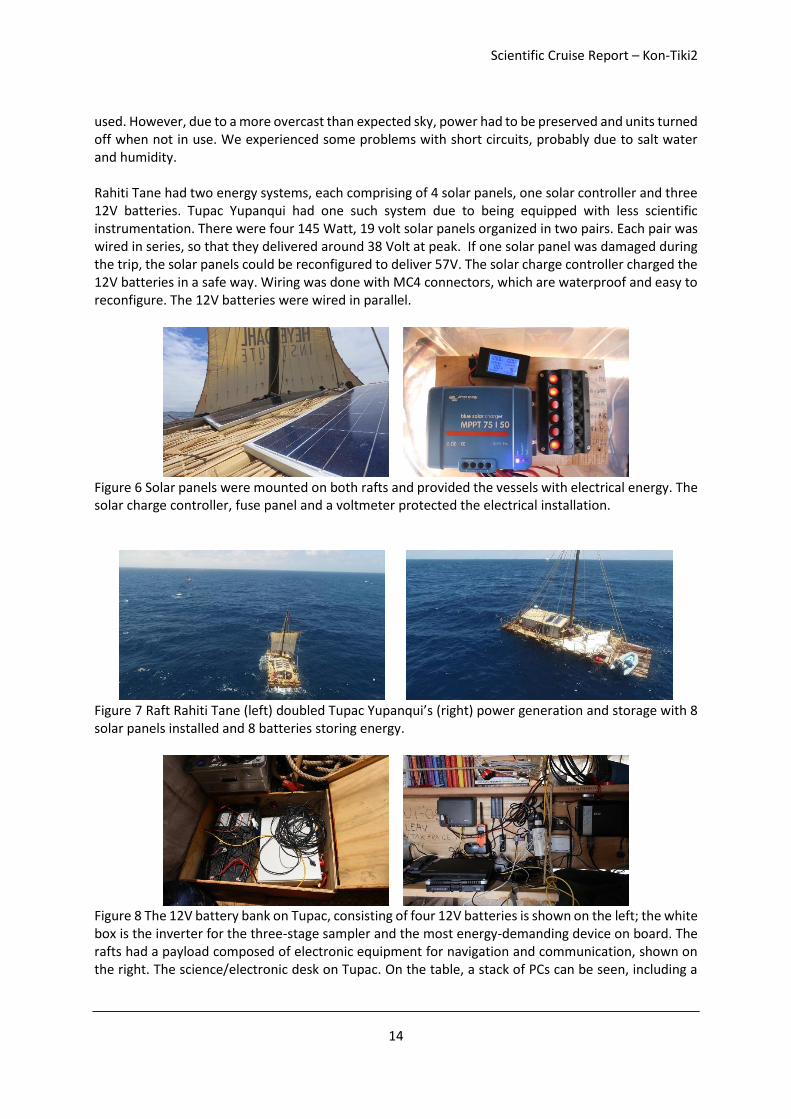
used. However, due to a more overcast than expected sky, power had to be preserved and units turned off when not in use. We experienced some problems with short circuits, probably due to salt water and humidity. Rahiti Tane had two energy systems, each comprising of 4 solar panels, one solar controller and three 12V batteries. Tupac Yupanqui had one such system due to being equipped with less scientific instrumentation. There were four 145 Watt, 19 volt solar panels organized in two pairs. Each pair was wired in series, so that they delivered around 38 Volt at peak. If one solar panel was damaged during the trip, the solar panels could be reconfigured to deliver 57V. The solar charge controller charged the 12V batteries in a safe way. Wiring was done with MC4 connectors, which are waterproof and easy to reconfigure. The 12V batteries were wired in parallel.
Figure 6 Solar panels were mounted on both rafts and provided the vessels with electrical energy. The solar charge controller, fuse panel and a voltmeter protected the electrical installation.
Figure 7 Raft Rahiti Tane (left) doubled Tupac Yupanqui’s (right) power generation and storage with 8 solar panels installed and 8 batteries storing energy.
Figure 8 The 12V battery bank on Tupac, consisting of four 12V batteries is shown on the left; the white box is the inverter for the three-stage sampler and the most energy-demanding device on board. The rafts had a payload composed of electronic equipment for navigation and communication, shown on the right. The science/electronic desk on Tupac. On the table, a stack of PCs can be seen, including a

Scientific Cruise Report – Kon-Tiki2
15
Panasonic Toughbook (which was used with the Kongsberg equipment) and a Lenovo Thinkpad (which connected to the internet). On the wall is the Iridum Pilot control box, the handheld Jotron VHF radio, the power supply for the Toughbook, the Iridium GO, various inverters and USB outlets, a silver WiFi router, the Iridium GO (over the silver box), and controllers for the Kongsberg sonars.
1.3 Communication and navigation
Communication was vital to ensure the safety and well-being of the expedition. State-of-the art satellite communication equipment was installed on both rafts, and VHF radio allowed voice communication between the two rafts. Both vessels were equipped with Iridium GO transceivers, which connected onboard smartphones and tablets to the internet through the Iridium satellite network. All crew members could read and write emails at no per-message charge. Each GO sent a message with the current position to the expedition web server every 30 minutes. The position was plotted on a map on the web site so that everyone could follow our progress. Several radio stations called the expedition on a regular basis, and we were also in phone contact with Chilean authorities during the voyage. The GO was lightweight and USB-powered, with a built-in battery so that in an emergency, it could be easily detach from the raft. The GO units enabled the crew members to send and receive text messages on a regular basis to the expedition email accounts. [email protected] was the designated address for divulgation of research on board. Pictures could be transmitted through Iridium GO although the bandwidth was very limited. As a rule of thumb, pictures up to 100kB were possible to transmit. The system was overall stable and only seldom down. In addition to the GO units, Rahiti Tane had the Isatphone 2 backup phone which uses the Inmarsat satellites. Tupac had an Iridium Pilot, which supports higher data speeds and was used to upload web pages, high-quality images and video snippets.
Figure 9 The Iridium Pilot antenna was installed on Tupac Yupanqui for faster satellite internet access VHF radio transceivers were used for voice communication between the expedition vessels. It had a range of about 20km and the crews could talk to each other regularly for most part of the trip. These radios were critical to communicate with the Armada vessels that towed the rafts out of port and the rescue aircraft and ship that helped in the evacuation process. Each raft had two automatic identification systems (AIS) on board (Kongsberg and Jotron). During leg 2, none of them were successful in providing constant, reliable positioning information due to hardware damage. The Jotron units provided GPS position, course over ground (COG) and indicated

Scientific Cruise Report – Kon-Tiki2
16
the position of the other vessel. The position transmitting function of the AIS on both rafts failed, due to lack of proper connectors between the antenna and the processing unit. The cables on both rafts were damaged by the mast motion.
2 Cruise track
The Kon-Tiki2-expedition was divided into two legs. The first one began at Callao, Peru, where both rafts were built. The rafts sailed from this port city to the Easter Island in 42 days, from November 7th 2015 to December 19th, 2015.
Figure 10 The crew members of the first leg about to set sail from Callao, Peru An interval of two weeks in between expeditions allowed for end of year celebrations, shipping samples to different laboratories and preparations for the next expedition part. The second leg departed from the Easter Island. Both rafts were towed away from the island by a Chilean Armada’s towboat and then they set sail on January 06th, 2016. After 72 days in the sea, without having reached the continent and after having sailed a distance that in total was more than 4000nm, the expedition was called to an end. The expedition concluded with the organized evacuation of the rafts. Several factors were discussed to come to an agreement among the expedition crew members. These included the expected time of arrival of the rafts to South America, water and food stocks and the rafts’ structural integrity among others. The decision of calling for help was made by consensus. The expedition leader T. Higraff had been in contact with the Chilean navy every day during the return voyage, as agreed during a meeting in Valparaiso in October 2015, a month before the voyage from Peru. On March 14th the expedition leader called the Armada for rescue. The distance to the nearest armada ship was several hundred nm. The nearest vessel available was the Japanese freighter Hokuetsu Ushaka, on its way to southern Chile. This ship was asked to assist. On March 17th, both crews climbed a 17m rope ladder onto the big ship. During this operation, Lisa’s foot
Scientific Cruise Report – Kon-Tiki2
17
was injured (the only major injury throughout the cruise), and she was treated immediately by expedition doctor Sergey Goltsov, and later, in Chile, doctors found no fractions in her leg.
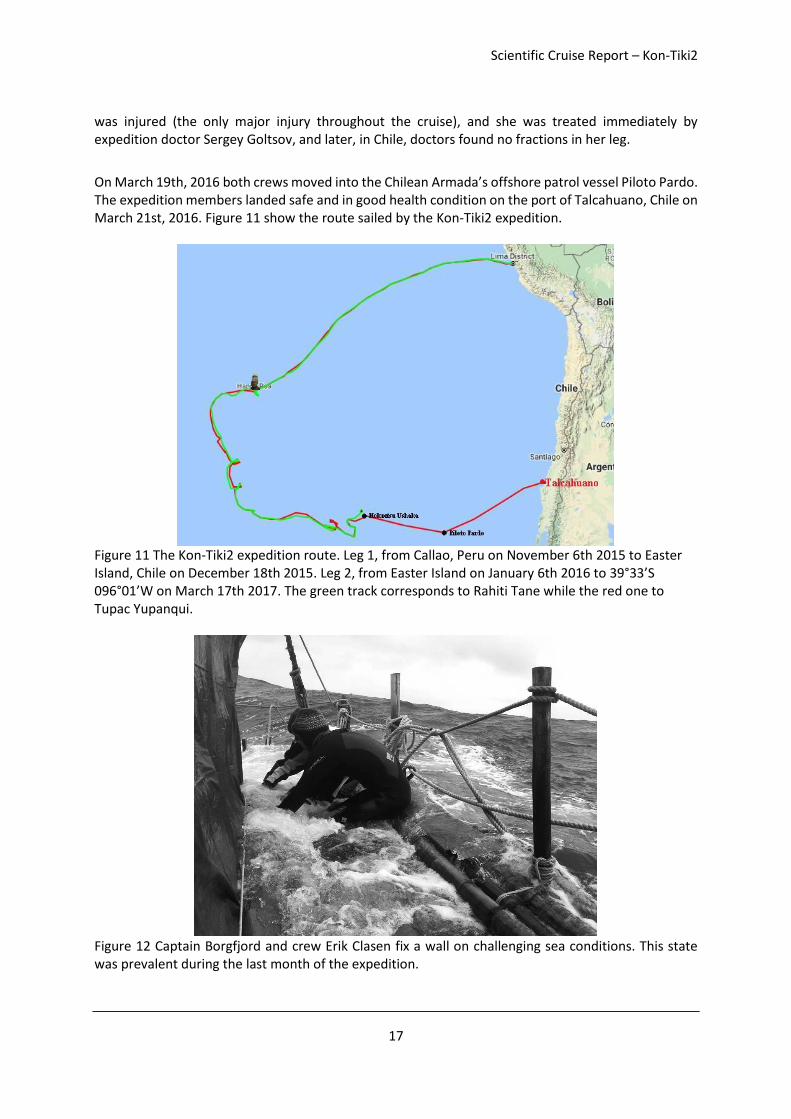
On March 19th, 2016 both crews moved into the Chilean Armada’s offshore patrol vessel Piloto Pardo. The expedition members landed safe and in good health condition on the port of Talcahuano, Chile on March 21st, 2016. Figure 11 show the route sailed by the Kon-Tiki2 expedition.
Figure 11 The Kon-Tiki2 expedition route. Leg 1, from Callao, Peru on November 6th 2015 to Easter Island, Chile on December 18th 2015. Leg 2, from Easter Island on January 6th 2016 to 39°33’S 096°01’W on March 17th 2017. The green track corresponds to Rahiti Tane while the red one to Tupac Yupanqui.
Figure 12 Captain Borgfjord and crew Erik Clasen fix a wall on challenging sea conditions. This state was prevalent during the last month of the expedition.

Scientific Cruise Report – Kon-Tiki2
18
Figure 13 On the right, the crew of MS Hokuetsu Ushaka assists in the evacuation process of the Kon-Tiki2 rafts. On the left, expedition leader Torgeir Higraff climbs the ladder to the safe deck of the rescue vessel.
3 Life on board
Although the main scope of this document is to report the scientific activities of the expedition, this section describes some of the daily life aspects relevant and related to performing such activities. They are mentioned because they affected in a great extent the way the expedition was performed. Some other factors that affected the program was weather and raft integrity state.
3.1 Safety and watches
The watch system depended on the raft and the weather conditions. Rahiti Tane ran a 4 hour on, 8 hours off watch system on both legs. A similar scheme was implemented on Tupac Yupanqui, except that the watching couple had the option to choose if they divide the 4hours period into two hours each. Safety procedures were observed always. Regulations varied depending on the raft. On Rahiti Tane, the use of life vests and life lines was compulsory when on watch or for everybody on rough weather conditions. Lines were to be attached to the vessel when swimming by the raft if sailing speeds could compromise the safety of the crew. Safety harnesses were used on both rafts when climbing the masts for maintenance. An extended 50m long line with a floating beacon at the end (on Rahiti Tane) and a floating buoy (on Tupac Yupanqui) were towed by the aft of the vessel always. This line was retrieved only for fishing purposes and the crew were notified every time.
3.2 Food, sleep and leisure
Skilled cooks on Rahiti Tane posted their weekly menus on the web site, and the content was also copied to Facebook. Eager readers therefore learnt about the Pacific delicacies prepared on the raft. For example, on Monday the 17th of November 2014, dinner on Rahiti Tane was quinoa with red pesto and mango salsa. The next day, falafel with pan fried bread and orange salad was served. The somewhat more relaxed attitude towards food preparation and preserving on Tupaq resulted in all peanuts being consumed during the first two weeks. On December 11th, 2014, the crew sent a

Scientific Cruise Report – Kon-Tiki2
19
request for help from onshore chefs; what could they make from the only remaining ingredients: peas, onions, garlic powder, wheat flour, ketchup, and boxes of tomato. No tasteful answers were found.
Figure 14 Kari making Ceviche from an unexpected barracuda (Sphyraena spp) catch by Esteban onboard Rahiti Tane.
4 Sailing with "guara boards". Case studies from the expedition
As noted above, the guara boards were the secret to the sailing successes of the old Chincha culture, and the key element in this expedition’s plan to sail westward from Easter Island to South America. Based on the 2006 Tangaroa expedition (Higraff, 2010) and the experiences from this expedition it can be reasonably assumed that if one of the boards in the aft is raised 20 centimeters, the course can change 20 degrees towards the wind. If we did the same with one board in front of the mast, the raft went 20 degrees from the wind. By lifting them up and down, we learned how to steer the raft the way ancient men did.
Figure 15 Signe sailing with the guaras. She and Gunvor mastered this skill and could outsail anyone else. Kon-Tiki2 also shows that the force is just as important below water as above. High sails need a representative keel area to be effective. Vessel speed is another major component. If it is doubled, the effect of the keel increases by a factor of four. If you have more speed you can raise the keels on the raft, which again gives you higher speed because of less friction, and then the remaining keel
Scientific Cruise Report – Kon-Tiki2
20
area is even more effective (optimized in the modern “trimaran-design”). The following case from the raft Rahiti Tane enlighten the description aforementioned.
Case study A: daily sailing, high up towards the wind
This is how raft Rahiti Tane sailed the first four weeks: with winds from southeast, and sailing southwest, as far up in the wind as possible. To sail this far up into the wind requires very active guara maneuvering. In general, guaras down in front, up in back, as far up as possible without getting the wind behind the sail. When the wind is about to go behind the sail, the helmsman must quickly lower the quaras in the back. The raft typically responds quickly to such a maneuver, and only very seldom is it necessary to work with the guaras in the front. Due to the constantly changing combination of winds, waves and ocean currents, the helmsman must constantly watch the sail, and keep the guaras in back as high up as the sail at any given time permits. Main lessons learned, Case Study A: 1) We can't sail closer than 100 degrees from the wind, 90 degrees is not possible, no matter how we position guaras and sails. 2) when guaras are down in front they may easily break if the wood is not strong enough, due to the enormous forces from the combination of waves and current). A solution, utilized by Rahiti Tane, was to lift the front guaras half way up.
Case study B: daily sailing, semi-downwind
This is the most relaxed form of guara sailing. No quick changes are necessary, and it is perfectly possible to bring the compass to the front deck and join the social activities there. One can even steer by the front guaras exclusively. The most common error is to fall off so much from the wind that the wind hits the sail from the back. In that case a quick guara response is required. But to fall so far off requires long-term lack of concentration on behalf of the helmsman.
Case study C: large change of course with sail up
Rahiti Tane, leg 1, December 6th, 2015, ~100° clockwise turn At the start: wind from east, raft headed southwest (200 deg), currents NA (probably westward), sail tied down on portside, elongated far back on starboard side. Our plan is to perform a jibe (“kuvending"), i.e. turn to the opposite direction by falling AWAY from the wind, i.e. towards starboard, i.e. clockwise.
Step 1: all guaras down in back (to lock down this part of the raft), all guaras up in front (to release this part of the raft to follow the wind. Within minutes, the raft points westward (270 deg), the wind directly from behind.
Step 2: fixed the sail to be symmetric across raft. Still wind from behind.
Step 3: took down guaras in front as well AND tightened the sail to starboard. Now raft was sailing northwest. Wind still in from the east.

Scientific Cruise Report – Kon-Tiki2
21
Rahiti Tane Leg 1, December 13th 2015, ~80° clockwise turn At the start, wind from east, raft heading southwest 235 deg
Step 1: All guaras down in back, up in front. Nothing happens. Direction still 240.
Step 2: switch sail ("hals") from port to symmetric. Now raft stabilizes at 270 deg, i.e. straight downwind.
Step 3: lower guaras in front half way. Stabilizes at 310-320 degrees
Step 4: attach sail ("hals") on starboard side: we keep sailing on new course 320 degrees.
Main lessons learned, Case Study C: We have a 160 deg sailing range, given any wind direction. From plus 100 degrees to minus 100 degrees, relative to the wind.
Case study D: 360 turn with sail down
Rahiti Tane, leg 1, Saturday December 12th, clockwise turn At the start (15.45 UTC): Wind from east, sailing towards southwest. Estimated the direction of the current to be roughly east-west (specifically 60-80 deg). Method: released limes, pieces of wood and paper, plus compass. Our plan is to perform a 360 turn, clockwise, starting with raft pointing southwards. The trial took 1 hour.
Step 1: lower the two guaras on port side front and aft (rest up). Raft turns to south. (NOTE: this is one of the few times we have noticed a left/right asymmetry)
Step 2: lower all guaras aft, all up in front. Raft turns to west (270, 280 deg)
Step 3: lower guaras starboard side both front and aft (rest up). Expected raft to turn to north, managed only 340 deg.
Step 4: To push further to north, we lifted the starboard-most aft guara. Now raft stabilized in north.
Step 5: Lower all guaras in front, lift all in aft. Raft stabilizes in direction 030 after 3 minutes, i.e. just a little bit eastward. but then falling back to north
Step 6: lift all guaras in front, lower all guaras in back. Now we reach 070, i.e. almost eastward.
Step 7: lift one guara portside aft. Then raft turns to 150, "almost" south.
Rahiti Tane, leg 1, Saturday, December 12th: Anticlockwise turn At start: wind from east (less strength than clockwise attempt), raft points southwards
Step 1: lower guaras on starboard side, both front and aft. No movement, stabilizes at 180 deg
Step 2: lift guaras front starboard. Raft stabilizes at 175 deg
Step 3: lower aft guara starboard side. It works, it stabilizes at 130. But not straight up to the wind.
Step 4: try drifting anchor in addition to help the turn. Works, stabilizes at 75 deg. But can't manage to get it further northward

Scientific Cruise Report – Kon-Tiki2
22
Step 5: last attempt to pass through the wind (from east) and move the raft towards north: lift guaras on port side both front and aft. Not even this works.
In summary, weak winds, or small guaras are not enough to maneuver. The largest range of possibilities is obtained when combining guaras with all the adjustment possibilities of the sail and using the drifting anchor actively.
5 Scientific investigations
5.1 Scientific program in short
The Scientific Program of the Kon-Tiki 2 expedition was developed as a collaborative work between the Norwegian University of Science and Technology (NTNU) and the Norwegian Institute for Water Research (NIVA), and it focused on four research themes: 1: Climate change and ocean acidification Oceans play an important role in global climate dynamics. Oceans have absorbed more than 90% of the heat that has accumulated in the atmosphere due to global warming. About a quarter of all the carbon dioxide (CO2) emitted from the burning of fossil fuels has been absorbed by oceans, making the oceans an efficient buffer of global warming. When the algae are done with their "carbon capture and storage" – absorbing CO2 to create oxygen, then dying and being buried at the sea floor – the remaining CO2 turn into its evil alter ego: ocean acidification. In addition, oxygen content in the oceans is dropping. All these changes pose risks for marine life and may affect the oceans' ability to perform the wide range of functions that are vitally important for environmental and human health. 2: Marine litter: Plastic and microplastic litter The expedition was to cross one of the five gigantic garbage accumulation zones of the world oceans (so-called "gyres"). High and low-tech instrumentation was brought along to identify and quantify macro and micro plastics. Micro plastics are regulated by UNEPs Stockholm convention, a global treaty to protect human health and the environment from persistent organic pollutants (POPs), and information from remote regions is highly valuable. 3: El Niño and operational weather forecasting In the equatorial Pacific, the ocean and atmosphere are strongly coupled. There is strong feedback between changes in the atmosphere and the ocean. The "normal" state can last for several years, but during an El Niño year, like the one the expedition sailed, the surface ocean in the eastern Pacific becomes significantly warmer and the winds, surface currents and precipitation patterns also change. The marine ecosystem responds strongly: collapse of the coastal fishery along the Peruvian and Chilean coasts was probably the first, ancient, indicator of this strong climate signal. To read more on El Niño, check this interesting article on Wikipedia: https://en.wikipedia.org/wiki/El_Ni%C3%B1o. The expedition depended on high-quality weather forecasts, so we transmitted data directly to the World Weather Watch, the core program of the World Meteorological Organization, from our own weather station every three hours. Weather forecasting centers around the world depend on meteorological observations from voluntary ships to make good forecasts, and considering how few ships sail in the southeast Pacific we felt certain we could make a difference.

Scientific Cruise Report – Kon-Tiki2
23
4: Marine Life The marine ecosystem is under tremendous threat due to the many changes happening to the marine environment: marine litter, toxic chemicals, ocean warming, ocean acidification, ocean de-oxygenation to name a few. This multitude of stressors is having a major impact on marine habitat all around the world and the Kon-Tiki2 expedition carried instrumentation to monitor the entire ecosystem, from the smallest phytoplankton to the grandest of sea animals. Standard procedures were adapted were necessary to facilitate the use of the instrument or the collection of the sample on a non-conventional research vessel.
5.2 Logistics
A special area of the cabin on each raft was dedicated to the scientific activities. Some of the instruments, literature and the scientific computer were located here. A Panasonic Toughbook provided by NIVA concentrated data from different instruments on board. The LabVIEW Data Center (LDC) software was designed at NIVA to concentrate the readings from multiple instruments and store them systematically in the computer’s storage drive. The following sections describe the scientific equipment used on the expedition to make observations or take samples in-situ. The rafts instruments can broadly be grouped into three categories: those that observed the physical characteristics of the atmosphere, those that monitored the physical state of the seawater and those that were used to sample biological activity. A combination of transducers and recorders were taken on board with the objective of better describe objectively the conditions present on the place where the rafts sailed.
5.3 Atmospheric observations
Among this set of instruments, optical sensors were used to measure the amount of sunlight reaching the surface, of atmospheric aerosols limiting the energy from reaching the surface and the conditions of the prevailing winds around the raft, i.e., wind temperature, strength and direction.
Atmospheric aerosol optical depth (AOD)
A Microtops II sun photometer was taken on board to measure marine atmospheric aerosol size distribution. It has five collimators that measure aerosol optical depth (AOD) in five wavelengths spread across the light spectrum [1]. Measurements with the Microtops were taken only on cloud free days. Each measurement consisted of 10 consecutive samples within 90 seconds. The data collected was regularly downloaded into a computer. The comma separated values files were small in size, less thank 100kb, and therefore it was possible to transmit them through the Iridium GO modem.

Scientific Cruise Report – Kon-Tiki2
24
Figure 16 Aerosol optical depth, size and distribution were monitored on the expedition. The map on the top shows how scarce measurements on the southeast Pacific are. The bottom map filters the contribution of the expedition to the knowledge of aerosol distribution and demonstrates a low content aerosol in the open sea that is slightly higher by the Easter Island, where there is anthropogenic activity.
Light measurements
There were two LiCOR units on Rahiti Tane. They measured light density reaching the Earth´s surface. One recorded automatically from the rooftop. Caution was taken to avoid the sail and rigging from shading that sensor. The other was used manually in connection with the 6-hour meteorological observations.

Scientific Cruise Report – Kon-Tiki2
25
Weather reports
The expedition depended on high quality weather forecasts. With the assistance of the Norwegian Meteorological Institute and JCOMMOPS at IOC data was transmitted directly to the World Weather Watch, the core program of the World Meteorological Organization, from Rahiti Tane´s weather station every six hours. Its call sign was LF5983. Observations were transmitted through the Iridium modem to the World Weather Watch. They were registered using a combination of instruments and bare eye observations. These include information on the conditions of the sky and the ocean. Date, time and GPS coordinates were read directly from the Jotron navigation unit. Air temperature and humidity values came from an environmental thermometer installed on the rooftop at the aft of the cabin, as shown in Figure 17. Atmospheric pressure and trend readings came from a barometer installed inside. The sea state was observed and compared to reference pictures while sea water temperature was measured from a CTD. The percentage of the sky covered by clouds, as well as their types, were estimated form direct observations. Levels of precipitation were included in the report on a regular basis. The software used to gather data was Turbowin. This produced a string of digits with the data encoded in it. This string was then sent to the WMO.
Figure 17 Weather station components are shown on the left. The equipment was provided by Aslaug Mariolijn van Nes from the Norwegian Meteorological Institute. The weather station installed on Rahiti Tane was used to report meteorological information every six hours.
5.4 Physical properties of the sea surface
NIVA has developed a system for automatic collection, analysis and presentation of water quality data from “ships of opportunity” called the Ferrybox System. This system is in place, for instance, on the ferries running from Oslo to Kiel, on the mailships running from Bergen to Kirkenes and on regular ship passages from Tromsø to Longyearbyen. Once every minute, the Ferrybox system measures temperature, salinity, oxygen, chlorophyll and particle content at a depth of four meters along the fixed route of a vessel and transmits the data to shore using the environmental satellite ENVISAT. Emanuele Roberto Reggiani (NIVA) installed the Ferrybox System on Rahiti Tane in Callao. These measurements include salinity, temperature, chlorophyll A levels, turbidity, pCO2, pH and oxygen. In addition, we observed the surface ocean current condition, using an acoustic current meter attached to the Rahiti Tane as well as autonomous surface drifters.

Scientific Cruise Report – Kon-Tiki2
26
CTD
A SAIV CTD was installed permanently on the bow port side of Rahiti Tane. A wooden housing was built around the instrument to protect it from impact and it hung from a 3m long rope. The depth of the instrument varied with the speed of the vessel between 1m at the maximum speed of the vessel and 3m when the vessel was stopped. This instrument logged data with a regular interval. During the leg 2 the CTD stopped transmitting data, the reason being low battery power. External power fi temporarily the issue, but we linked the instrument to the raft’s electric grid.
Figure 18 Cecilie demonstrates the wooden frame built to protect the surface CTD that was permanently deployed under the Rahiti Tane raft.
Carbon Dioxide
An in-situ partial carbon dioxide pressure sensor (Franatech pCO2) was towed on the aft of Rahiti Tane. The sensor was submerged between 2 to 3m under the raft in order to avoid turbulence caused by the wake of the vessel. Through a cable, the sensor transmitted measurements to the manufacturers data logger. This sensor required a warm up time of approximately 5 minutes before it was ready to take measurements. The instrument stopped working during the second leg of the expedition and, although the exact reason is unknown, it could be attributed to mechanical damage due to constant impact with the rafts aft or a broken wire.
pH
There were two instruments on Rahiti Tane to measure the pH of the water: Pharo (pH analyzer for oceanography) and a SeaFET Ocean pH Sensor (Satlantic). The former was an instrument in development stage that measures total pH based on the optical absorbance measurement from a sample of water reacting with a suitable indicator. Pharo is based on the Automated Flow-through Embedded Spectrophotometry (AFtES) layout developed by NIVA within EU projects like NexOS and supported by Skattefunn as a possible industrial product. The system is fully automated and has an internal memory, but it also transmitted data to the LDC. The part of the LDC software that stored pH data for this sensor was completed on the raft while leg 2 was ongoing, giving the chance to scientists on board to verify the status of the instrument. Both Pharo and the SeaFET sensors were connected to the seawater flow pipeline installed on the raft. Water pumping was activated regularly to enable measurements of pH were the raft was located. The SeaFET, however, could not transmit successfully any data into the LDV. When Pharo was brought back to NIVA laboratories in Oslo, it was in power down mode. When the instrument was switched on again it was able to communicate and perform sampling regularly. Data have been retrieved and provide the absorbance spectra of surface pacific water for the whole cruise. Data quality analysis in order to achieve a pH evaluation down to 0.005 uncertainty is ongoing. The cruise, despite the many difficulties,

Scientific Cruise Report – Kon-Tiki2
27
has confirmed the possibility to use such system for a reliable, unmanned, extensive remote monitoring of ocean surface pH using low power sources.
Figure 19 Preliminary results from the leg1 Ferrybox data, by Kai Sørensen (NIVA)
Surface currents
Seawater current speed and direction were measured with a Nortek Aquadopp current meter. The acoustic transducer was mounted on the aft port side of the raft Rahiti Tane. It was connected to a Nortek Autonomous Online System (AOS) that transferred regularly a data subset through its own Iridium satellite channel. Based at Nortek’s offices in Oslo, Jardar Maatje, provided technical support to operate the instrument.
Figure 20 Nortek Aquadopp instrument mounted on Rahiti Tane to measure seawater current strength and direction. It was installed inside a bamboo for protection.
Surface drifters
We deployed 16 surface drifters from the Global Drifter Program in pairs (see locations in appendix). Historical data collected by the drifter program, provided a fairly good idea of the mean surface currents before we left port (see below), though we were uncertain what El Niño would do to the system. The previous strongest El Niño occurred in 1997/1998 before the start of the drifter program.

Scientific Cruise Report – Kon-Tiki2
28
Figure 21 Mean surface current for November and December (left, relevant for Leg 1) and January and February, (right, relevant for Leg 2). Easter Island is indicated with the blue circle. Courtesy of the Global Drifter Program and Pål Erik Isachsen.
Figure 22 The surface drifters were stored under the walking deck until deployment. Kari is ready for deployment on the picture of the right.
5.5 Biological sampling from the surface
Water transparency and color
Measurements of water transparency in the Pacific Ocean were performed using a Secchi disc and a pallet with the Forel-Ule scale for water color. The disk was deployed when the raft sailed at very low speeds, i.e., under 0.5 knots. Otherwise, the drift of the disc with respect to the raft made it very difficult to observe the disc at the depths that were possible to attain, usually over 30m. A stone was attached under the disc to sink it as much as possible right under the vessel. Always two crew members helped in the determination of the depth at which the disc was not seen anymore. This depth was recorded as the Secchi depth. Then the disc was pulled up to half the Secchi depth and the Forel-Ule scale was obtained against the disc using the colors palette.

Scientific Cruise Report – Kon-Tiki2
29
Figure 23 On the left, Gunvor sets up the Forel-Ule Scala plate. On the right, the Secchi disc is deployed to quantify ocean transparency.
Chlorophyll A and DNA sampling
Water samples (phytoplankton) were collected and filtered on to polycarbonate filters and stored in ethanol along the way on both legs of the expedition for the purpose of DNA extraction and barcoding. Those samples collected in the first leg were shipped from the Easter Island to NIVA, Chile before the second part of the expedition sailed. They were transported from the freezer at the raft, to the island and further to the continent on a polystyrene box with 10kg dry ice. DNA was filtered out of the water using GFF filters. A constant amount of water was forced through these filters and aided by a vacuum. A similar procedure was followed to sample Chlorophyll A. Volumes of filtered water were adjusted to obtain a visible sample on the filter, i.e., a green stain. Chlorophyll A samples were fixed in alcohol. Both types were preserved in the freezer at -17C. At the end of Leg 1, the freezer content was transported to shore on Easter Island and flown to Chile mainland, then to NIVA Oslo on dry ice. On Leg 2 the freezer stopped working when it was immerged in water during a storm event. The samples were refrigerated once they reached the continent and transported to NIVA, Oslo afterwards.
Figure 24 On the left, Cecilie filters Chlorophyll A and DNA from sea water on the first leg of the expedition. Pedro De La Torre on the right continued this procedure and a sample with Chlorophyll A is shown in the middle.
Surface plankton filtering
Plankton was filtered from the water using a plankton net with a 10µm mesh. An average speed of 2kn was desired to ease the deployment of the net. The time of the trawl and how long the net was deployed for were adjusted to target higher concentrations and plankton biodiversity in the sample. Iodine was used to fix the collected material. Details on the trawl characteristics were logged.

Scientific Cruise Report – Kon-Tiki2
30
Figure 25 Pedro deploys the plankton net from the aft of Rahiti Tane to sample the upper 5m of the water column.
5.6 Acoustic studies of fish and plankton
Two echosounders were installed on the port aft of Tupac Yupanqui. They were Kongsberg EK80 systems for 70 and 200kHz. This is a broadband system. Operation of this equipment happened only after the second half of leg 2 as none of the crew members on the raft transporting the instrument were trained to operate it. Frank Reier Knudsen provided assistance in setting up the echosounders to optimize data gathering. Broad band processing produces larger amounts of data, in comparison with single frequency processing. Storage capacity became one limiting factor to use this instrument. This challenge was overcome by testing with different sampling rates and processing depths along the course. Another factor that prevented the continuous operation of the echosounders was power on the rafts batteries. Even after a sunny day of battery charge, the acoustic instrument will display a low voltage alarm during the night and stopped operating early in the morning. Voltages were under approximately 11V at these times. Diel Vertical Migrations were observed through the cruise, as shown in Figure 26 The diel vertical migration of plankton from a layer located at 400m ascends to 200m. Data was collected with two Kongsberg EK80 echosounders.. Biological activity moved in a vertical range exceeding 200m. The dataset contains wide band acoustic fingerprints for species in the Pacific Ocean. Considering that wide band technology in the field of marine biology research is relatively new, these fingerprints provide the basis for a modern library for acoustic identification of species. Although the procedure does not include ground proofing, the material gathered provides a reference point of the state of the ocean during the cruise.

Scientific Cruise Report – Kon-Tiki2
31
Figure 26 The diel vertical migration of plankton from a layer located at 400m ascends to 200m. Data was collected with two Kongsberg EK80 echosounders.
5.7 Marine litter
Bert van Bavel (NIVA, Oslo) provided Kon-Tiki2 with a Manta trawl and a three stage sampler (TSS). Both were transported as part of Tupac Yupanqui’s scientific equipment. Sampling happened in both legs. The 300 µm net was thrown from the aft of the raft and towed for 1 hour in every deployment. Andrey Chesnokov and Jimmy Blom at the end of leg two observed the samples and separated with tweezers what they considered was plastic. The sample was then stored. Deploying the trawl became more and more difficult as damage to the raft’s deck occurred and as algae grew on the deck rendering the area slippery and unsafe. The Three-Stage sampler had, as the name suggests, filters of three different sizes: 500 µm, 300 µm and 50-100 µm. It takes in a large volume sea water: 10 000 L/hour. Sampling with the Three-Stage sampler was a very demanding activity. The equipment was heavy and voluminous. Transporting it from the box inside the cabin, where it was stored, to the aft for deployment required the assistance of at least two crew members. Usually, E. Clasen and T. Higraff would perform this task. The sampler consumed a large amount of energy from the batteries. Electrical energy availability limited in a large extent the use of the sampler during leg2. However, when the sampling was successful, the filters contents were stored together with their metadata for post processing.

Scientific Cruise Report – Kon-Tiki2
32
Figure 27 The Manta Trawl (left) and the three-stage sampler were installed on Tupac Yupanqui to collect micro plastic samples throughout the cruise. In the right, Håkon assembles the filtering water pump for the sampler.
5.8 Marine contaminants
A passive sampler was used to study the type and concentration of contaminants in the sea. Ian Allan (NIVA, Oslo) was the point of contact regarding this equipment. An aluminum frame and a collection of low density polyethylene (LDPE) and silicon sheets were available on the raft. During the second leg, the frame was modified to include both LDPE and silicon elements to be deployed in a single exercise. Special care was taken to avoid contact between strips and raft at any point, to minimize the interaction with the wind and to assemble the sampler when no fumes were present (see Figure 28). Metadata and blank samples were put together and stored in the freezer. Samples collected during leg 1 were successfully transported to NIVA Chile at Easter Island and then to Oslo.
Figure 28 Deployment of passive sampler.
5.9 Equipment that was not used during the expedition
For the first leg, all instrumentation arrived safely, though this required two weeks of constant attention to the customs and shipping agencies at Lima Airport. The last piece of equipment, the three-stage sampler, arrived the evening before departure. An attempt was made to bring additional scientific instrumentation onboard for the second leg. However, transport logistics, local government customs and regulations, the remoteness of the island in terms of transport and communication, and departure dates that overlapped with Christmas and New Year’s celebrations, complicated the arrival of this equipment on time. Among the equipment that did not arrive were an underwater hyperspectral imaging camera (UHI, Ecotone), a Wetlabs ecotriplet sensor, spare parts for the Kongsberg AIS units and navigation maps, tools and parts to fix

Scientific Cruise Report – Kon-Tiki2
33
the electrical installation on the rafts. A Kongsberg underwater surveillance camera was taken on board Tupac Yupanqui. Nevertheless, lack of an appropriate monitor and connecting cable made it impossible to display what the camera could have observed. It was, therefore, never used.
5.10 Data
The scientific data are stored at NIVA and are available upon request. The AOD data are stored and publicly available at the Marine Aerosol Network (MAN, https://aeronet.gsfc.nasa.gov/ new_web/cruises_new/Kon-Tiki2_16.html), administered by the National Aeronautics and Space Administration (NASA). Likewise, the surface drifter data are available at NOAA’s Global Drifter Program Data Assembly Center: http://www.aoml.noaa.gov/phod/dac/dacdata.php.
5.11 Publication plans
The Kon-Tiki 2 research program was made on a volunteer basis, with many scientists and institutions providing instruments and expertise. In order to maximize the scientific output, Table 1 has been made to identify interesting interdisciplinary cross-institution and inter-scientist topics that can be pursued, namely distribution and circulation of plastic during the El Niño 2015/2016 (see orange field in Table 1); Carbon and aerosol loading in the Southeast Pacific (blue field); and Life in the Southeast Pacific during El Niño 2015/2016 (green field).

Scientific Cruise Report – Kon-Tiki2
34
Me
t
dri
fte
rs
curr
en
ts
pla
stic
pas
sive
Ferr
y b
ox
pH
Ae
roso
ls
DN
A a
nd
pla
nkt
on
chlo
rop
hyl
l a
ech
oso
un
de
r
Sech
i dis
k
Ligh
t
Met obs (T, P, humidity)
Asl
aug
Surface drifters
Shau
n
Surface currents
Mo
rte
n
Plastics & Microplastic
Be
rt
Passive contaminant sampling Ia
n
Ferrybox (T, CO2, S, P, O2, turbidity) K
ai
Ferrybox pH
Eman
ue
l
Aerosols
Ale
xan
de
r
Phytoplankton
We
nch
e
Chlorofyll
Mar
it
Echosounder
Fran
k
Sechi disk, camera
Pe
dro
Light
Kai
Table 1. Interdisciplinary publication plans.

Scientific Cruise Report – Kon-Tiki2
35
5.12 Kon-Tiki2 scientific presentations to date
The expedition has been of interest to general and scientific audiences. The following is a list of Kon-Tiki2 scientific presentations to date: Pedro De La Torre:
1. The crew of OPV Piloto Pardo, March 2016. 2. Welcome presentation to the employees and students at the Trondheim Biological
Station, March 2016. 3. The crew of R/V Gunnerus on May during the Integrated Autonomous Operations cruise
2nd May 2016. 4. The Plenary session of NTNU Oceans Week 2016, Thursday May 12th 2016. 5. The Department of Marine Technology (IMT) Miniseminar on Friday, May 27th 2016. 6. The crew of R/V Helmer Hanssen during the CAGE expedition on June 20th 2016. 7. European Union Hi Resolution Ocean Color meeting, Monday, September 19th 2016. 8. The Department of Biology (IBI), NTNU, “Forsker Lunsj” on Friday, October 21st 2016. 9. A presentation is planned for March 21st at Dokkhuset, Trondheim as part of the “NTNU
Kveld” program.
Cecilie Mauritzen: 1. Universitetet i Oslo, seksjon for meteorologi og oseanografi, Oslo, januar 2016 2. NIVAs instituttsamling, Sundvollen, februar 2016 3. NORMAN conference on marine contaminants, Oslo, mars 2016 4. CIENS, Oslo, mars 2016 5. Majorstuen Rotary, Oslo, mars 2016 6. The Plenary session of NTNU Oceans Week 2016, Thursday May 12th 2016. 7. United Nations Environmental Assembly - Side Event on Marine Litter, Nairobi, mai 2016 8. Norsk Bremuseums 25-års jubileum, Fjærland, juni 2016 9. Norway’s MIT Club, Oslo, juni 2016 10. Universitetet i Oslo, institutt for geofag, juni 2016 11. Utenriksdepartementet, klima og miljøseksjonen, Sundvollen, September 2016 12. Norges Rederiforbund, Oslo, September 2016 13. Thor Heyerdahl International Day, Oslo, oktober 2016
Bert van Bavel: 1. Hold Norge Rents konferanse om marin forsøpling, Oslo, 2. februar 2016 2. Norske Havforskeres Forenings Årsmøte, Bergen, november 2016

Scientific Cruise Report – Kon-Tiki2
36
6 Contact Information
6.1 Expedition contact information
Leg Name Role e-mail telephone
1 Øyvin Lauten Captain [email protected]
Tup
ac Y
up
anq
ui
Torgeir Higraff Expedition leader
[email protected] +4795762935
Andrey Chesnokov [email protected]
Ola Borgfjord [email protected]
Håkon Wium Lie Chief Technical Officer
Jostein Alvær Heidenstrøm
David Short [email protected]
2
Ola Borgfjord Captain [email protected]
Torgeir Higraff Expedition leader
[email protected] +4795762935
Erik Clasen [email protected]
Erlend Koppergård [email protected]
Roberto Sala [email protected]
Jimmy Blom [email protected]
Andrey Chesnokov [email protected]
Rah
iti T
ane
1
Kari Skår Dahl Captain [email protected]
Pål Børresen 1st Officer [email protected]
Signe Meling Steward signe [email protected] +4747086206
Cecilie Mauritzen Scientist [email protected] +4790912105
Boris Romanov Doctor [email protected]
Gunvor Storaas Crew [email protected]
Esteban Contreras Crew [email protected]
2 Signe Meling Captain signe [email protected] +4747086206
Liv Arnesen Executive Officer
Pedro De La Torre Scientist [email protected] +4795302127
Sergeij Goltsov Doctor [email protected]
Rasmus Erlandsson Crew [email protected]
Lisa Teheuheu Steward [email protected]
Evgenij Orlov Journalist [email protected]
Scientific Cruise Report – Kon-Tiki2
37
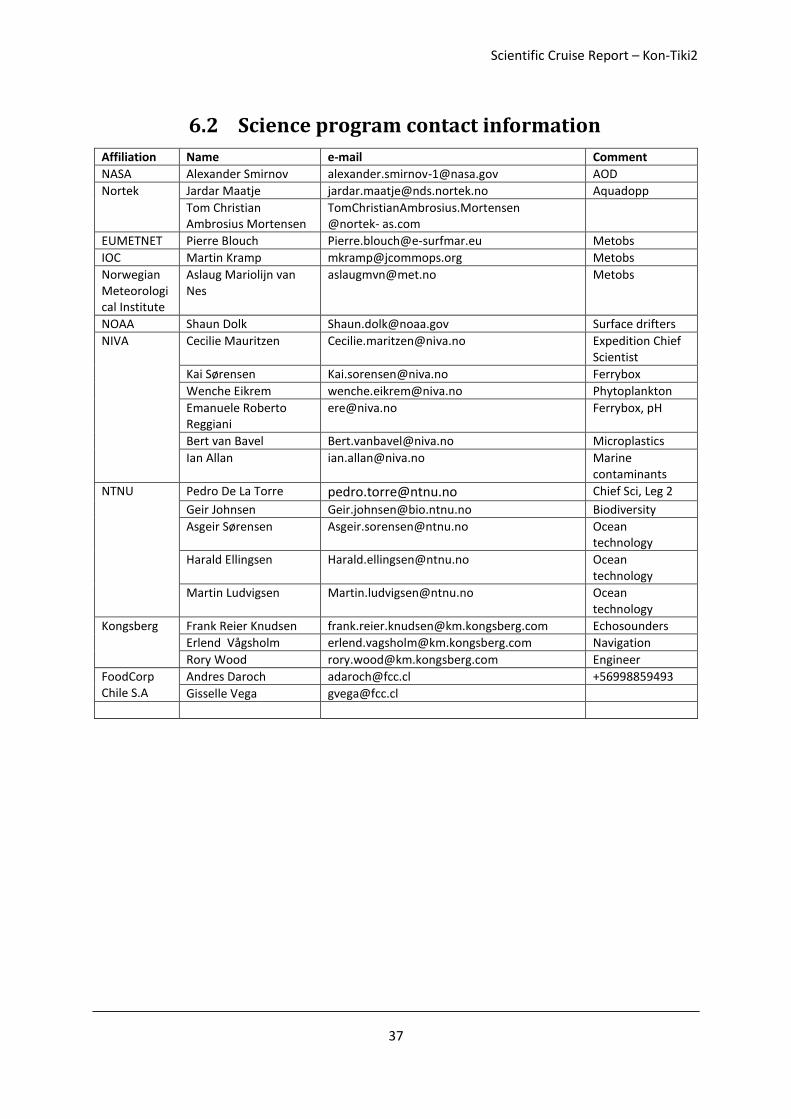
6.2 Science program contact information
Affiliation Name e-mail Comment
NASA Alexander Smirnov [email protected] AOD
Nortek Jardar Maatje [email protected] Aquadopp
Tom Christian Ambrosius Mortensen
TomChristianAmbrosius.Mortensen @nortek- as.com
EUMETNET Pierre Blouch [email protected] Metobs
IOC Martin Kramp [email protected] Metobs
Norwegian Meteorological Institute
Aslaug Mariolijn van Nes
[email protected] Metobs
NOAA Shaun Dolk [email protected] Surface drifters
NIVA Cecilie Mauritzen [email protected] Expedition Chief Scientist
Kai Sørensen [email protected] Ferrybox
Wenche Eikrem [email protected] Phytoplankton
Emanuele Roberto Reggiani
[email protected] Ferrybox, pH
Bert van Bavel [email protected] Microplastics
Ian Allan [email protected] Marine contaminants
NTNU Pedro De La Torre [email protected] Chief Sci, Leg 2
Geir Johnsen [email protected] Biodiversity
Asgeir Sørensen [email protected] Ocean technology
Harald Ellingsen [email protected] Ocean technology
Martin Ludvigsen [email protected] Ocean technology
Kongsberg Frank Reier Knudsen [email protected] Echosounders
Erlend Vågsholm [email protected] Navigation
Rory Wood [email protected] Engineer
FoodCorp Chile S.A
Andres Daroch [email protected] +56998859493
Gisselle Vega [email protected]

Scientific Cruise Report – Kon-Tiki2
38
7 Appendices
7.1 Abbreviations list
AOD - Aerosol Optical Depth LDC - LabVIEW Data Center LDPE - low density polyethylene
COG - Course over ground
CTD – conductivity, temperature and depth.
GPS – Global Positioning System
MAN - Marine Aerosol Network
NASA - National Aeronautics and Space Administration
NIVA - The Norwegian Institute for water research
NTNU - The Norwegian University of Science and Technology
OPV - Offshore Patrol Vessel
RV, R/V - Research vessel
TSS - three stage sampler
UN - The United Nations
WMO - World Meteorological Organization

Scientific Cruise Report – Kon-Tiki2
39
7.2 Cecilie Mauritzen’s log for leg 1
Date (ddmmyyyy)
Time (UTC)
Lat (degrees
south)
Lat (minutes)
Lon (degrees
west)
Lon (minutes)
Sea Surface Temperature
Sea Surface Salinity
CTD Pressure
CTD Oxygen
Flu Turb CO2 (fish
sensor)
Lys (Licor)
Notes
7112015 21:28 turn on CO2
10112015 19:15
CO2 franatech deployed behind vessel, measuring ~365
11112015 12:00
full reboot of ferrybox ctd. Wiring problem; Pharo up and running
12112015 13:00 11 29 80 38
Drifter deployment 1 & 2. Forgot to write down ID numbers.
14112015 23:00 11 44 82 53
Deployed first passive sampler, with chain as anchor. Some rust, but Ian says ok. Strips had to be folded when attached so we probably made some mistake in assembly. Deployed front, starboard. (in retrospect: possibly too close to crew's "spa site")
15112015 20:00
Took off main fuse for battery pack A (supplying ferrybox system) in attempt ot stop the regular fuse breakdown at sunset.
15112015 21:30 Lowered surface CTD 30 cm
16112015 02:35 11 52 84 0,3
Drifter deployment 3 & 4. ID numbers 139563 and 139799
16112015 Rewired battery packs A and B

Scientific Cruise Report – Kon-Tiki2
40
Date (ddmmyyyy)
Time (UTC)
Lat (degrees
south)
Lat (minutes)
Lon (degrees
west)
Lon (minutes)
Sea Surface Temperature
Sea Surface Salinity
CTD Pressure
CTD Oxygen
Flu Turb CO2 (fish
sensor)
Lys (Licor)
Notes
16112015
Discovered that turbowin dowsn't save data locally so started to religiously note down met data. Luckily conditions have been fairly steady: winds from south, southeast, sat ~21, wetbulb ~17, air pres~1013
18112015 14:42 12 11,4 86 1,6 20,8 35,5 0,26 101,07 0,09 0,02 315
Samles taken: chrol and DNA (used 1,15 l each), CO2, Tur, Oxy, phytoplankton, salinity
19112015
Tried the plankton net, messed up, no samples
20112015 00:00 12 41,66 87 28,5
Drifter deployment 5 and 6 (from Tupac). ID numbers 139895 & 139619
20112015 12:24 12 55 87 50 20,81 35,6 101,73 0,21 0,02
Plankton net in at 13.10. Took plankton net and plankton, with 1,5 ml iodine; Filtered chlor and DNA with 1,1 l each.
22112015 14:00 13 40 89 48 20,7 35,6 0,21 0,02 Filtered Chlor, 1,1 l
22:00
Discovered that aquadrop current meter had broken off. Brought on deck in lieu of new solution
23112015 14:00 Passive sampler up. Looked miserable
16:00 14 1 90 40
Passive sampler deployed. In front, middle to port side to avoid shampoo from crew members.

Scientific Cruise Report – Kon-Tiki2
41
Date (ddmmyyyy)
Time (UTC)
Lat (degrees
south)
Lat (minutes)
Lon (degrees
west)
Lon (minutes)
Sea Surface Temperature
Sea Surface Salinity
CTD Pressure
CTD Oxygen
Flu Turb CO2 (fish
sensor)
Lys (Licor)
Notes
17:00
Current meter deployed, this time only with rope
24112015 05:00 14 7,4 91 45
Drifters 7 & 8 deployed. ID numbers 139562 & 139617
16:00
Took debubbler off the pump system. It got broken because I took off hose to get water for filtering. The glue doesn't work. Hopefully not too much bubbles in pump system.
25112015 12:55 14 27 92 7
Plankton net deployed, brought in at 13.33 UTC
13:35 21 35,7 0,69 102,06 0,16 6,05 Took chlor & dna (1,1 l); CO2, turb, ox, chlor
14:22 14 28 92 5 20,99 35,7 0,82 101,95 0,19 0,03 End of water sampling 1 today
18:20 14 32 92 12 21,2 35,7 0,81 101,2 0,08 3,45 Filtering no 2: Chor & dna. End 18:45 UTC
22:00 14 34 92 20 Aeronet, 8-10 hits
23:00 14 35 92 22 21,37 35,7 0,46 102,68 0,16 0,02 24
Filtering no 3, just chlorophyll. Partly clear sky during the day, so satellites should be able to see something.
27112015 13:20 15 26 93 56 21,47 35,6 1,19 102,08 0,3 0,02 30 Chlor and DNA, 1,1 liter each
28112015 15:15 16 11 95 4
Surface drifters deployed. ID numbers 139565 & 139564
22:30
Aquadrop current meter on deck; it was hanging by a rope
23:20 16 20 95 25 CO2 water sample

Scientific Cruise Report – Kon-Tiki2
42
Date (ddmmyyyy)
Time (UTC)
Lat (degrees
south)
Lat (minutes)
Lon (degrees
west)
Lon (minutes)
Sea Surface Temperature
Sea Surface Salinity
CTD Pressure
CTD Oxygen
Flu Turb CO2 (fish
sensor)
Lys (Licor)
Notes
29112015 14:30 16 53 95 59 21,71 35,9 0,6 101,95 0,29 0,02 95
CHl and DNA filtered, 1,1 liter for each. DNA fell down on floor by mistake
30112015 13:14 17 19 96 46 21,56 35,9 0,6 101,2 0,22 0,02 65
Plankton net out at 13:14 UTC. CTD values read at 13:30 . Chl & DNA (1,1 liter each). Water samples: OX, CO2, Turb, plankton, plankton net. Done at 14:26. Light 38 @ 12UTC; 65 @ 14:30
1122015 15:30
Cleaned CTD, tightened rope 20 cm; Tried CO2 sensor with new invertor, worked for a few hours, then started blinking; Mounted aquadrop current meter for the fourth time, this time inside a bamboo.
1122015 2 drifters deployed on Tupac
2122015 14:45 18 35 98 45 21,94 35,9 0,59 101,06 0,12 4,98 52
Chl (1,1 Liter); DNA (1 liter), CO2, Turb; done qt 15:10 UTC
3122015 13:30 19 15 99 21
Passive sampler turnaround. Only silicone strips came back, no LDPE. Used blanks (handled like the others but not deployed). Redeployed with rig (strip-attachment) only on one side
5122015 12:55 20 13 100 1 Plankton net out
13:25 Plankton net back in
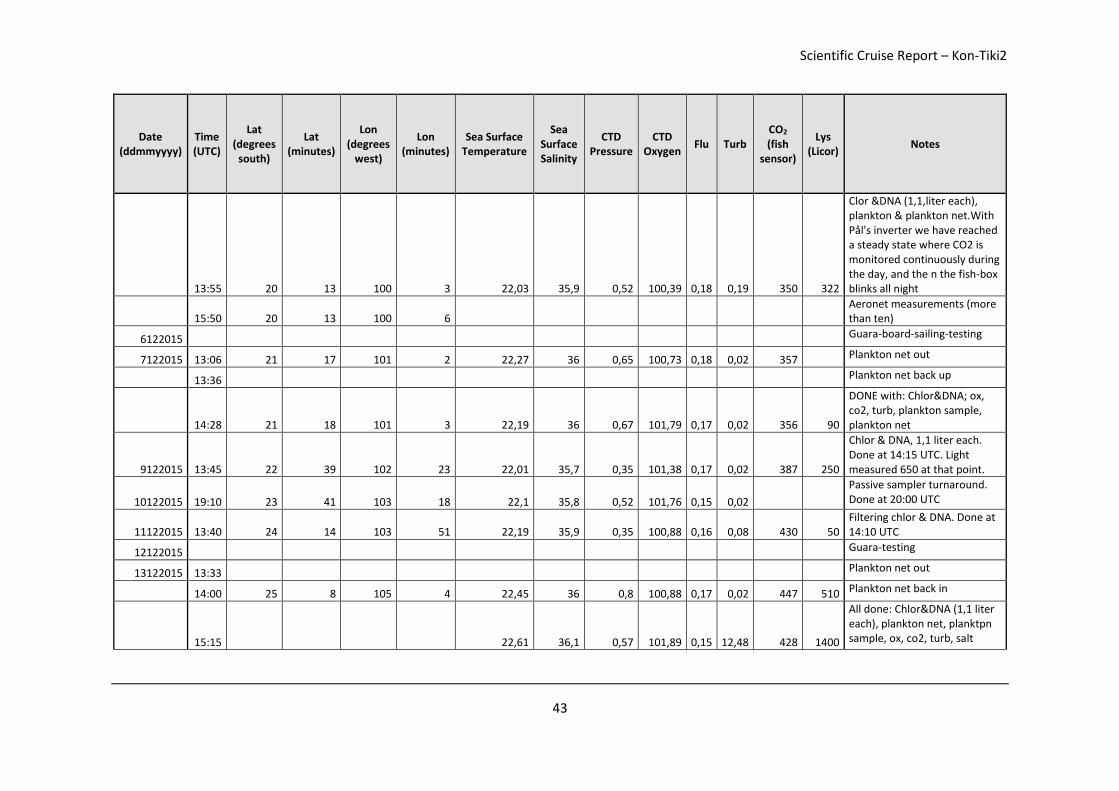
Scientific Cruise Report – Kon-Tiki2
43
Date (ddmmyyyy)
Time (UTC)
Lat (degrees
south)
Lat (minutes)
Lon (degrees
west)
Lon (minutes)
Sea Surface Temperature
Sea Surface Salinity
CTD Pressure
CTD Oxygen
Flu Turb CO2 (fish
sensor)
Lys (Licor)
Notes
13:55 20 13 100 3 22,03 35,9 0,52 100,39 0,18 0,19 350 322
Clor &DNA (1,1,liter each), plankton & plankton net.With Pål's inverter we have reached a steady state where CO2 is monitored continuously during the day, and the n the fish-box blinks all night
15:50 20 13 100 6 Aeronet measurements (more than ten)
6122015 Guara-board-sailing-testing
7122015 13:06 21 17 101 2 22,27 36 0,65 100,73 0,18 0,02 357 Plankton net out
13:36 Plankton net back up
14:28 21 18 101 3 22,19 36 0,67 101,79 0,17 0,02 356 90
DONE with: Chlor&DNA; ox, co2, turb, plankton sample, plankton net
9122015 13:45 22 39 102 23 22,01 35,7 0,35 101,38 0,17 0,02 387 250
Chlor & DNA, 1,1 liter each. Done at 14:15 UTC. Light measured 650 at that point.
10122015 19:10 23 41 103 18 22,1 35,8 0,52 101,76 0,15 0,02
Passive sampler turnaround. Done at 20:00 UTC
11122015 13:40 24 14 103 51 22,19 35,9 0,35 100,88 0,16 0,08 430 50 Filtering chlor & DNA. Done at 14:10 UTC
12122015 Guara-testing
13122015 13:33 Plankton net out
14:00 25 8 105 4 22,45 36 0,8 100,88 0,17 0,02 447 510 Plankton net back in
15:15 22,61 36,1 0,57 101,89 0,15 12,48 428 1400
All done: Chlor&DNA (1,1 liter each), plankton net, planktpn sample, ox, co2, turb, salt

Scientific Cruise Report – Kon-Tiki2
44
Date (ddmmyyyy)
Time (UTC)
Lat (degrees
south)
Lat (minutes)
Lon (degrees
west)
Lon (minutes)
Sea Surface Temperature
Sea Surface Salinity
CTD Pressure
CTD Oxygen
Flu Turb CO2 (fish
sensor)
Lys (Licor)
Notes
18:20 25 11 105 12
Aeronet sampling. All done at 18:30 UTC. Guara board testing
16122015 13:05 25 59 106 54 22,57 36 0,9 97,64 0,52 8,37 122 Chl & DNA, 1,1 liter each
17:13 26 4 107 3 22,63 36 0,72 98,67 0,17 12,48 415 21 Chl, 1,1 liter
21:00 22,9 35,9 0,87 98,34 0,18 0,11 419 1900 Chl, 1,1 liter
21:10 26 9,18 107 11,3 7-10 aeronet samples
17122015 00:50 26 12,6 107 18,4 Chl, 1,1 liter
14:00 26 27 107 47 Passive sampler on board, samples frozen
16:00 26 28,12 107 50,9 7-10 aeronet samples
18122015 22:30 26 53 108 59 409 Turning off CO2 fishsensor
22:45 Turning off pharo and seafet
23:00 Turning off CTD
23:15 Turning off ferrybox computer
19122015 Arrival Easter Island

Scientific Cruise Report – Kon-Tiki2
45
7.3 Pedro De La Torre’s log for leg 2. En
try
no
.
DA
TE
TIM
E
lati
tud
e
lon
gitu
de
CO
2
alka
linit
y
YYMMDD UTC S W pH
1 160104 2123 27°08.304' 109°26.078' 700.2
2 160107 2106 27°15.163'
3 1954 27°15.163' 947
4 160108 1600 27°15.163' 109°17.372'
5 1716 2716.10698 10918.26037 550.3
6 2217 2720.23071 10919.8026 553
7 160109 0746 2725.148 10913.44309 542
8 1346 2724.47768 10911.37238 457.2
9 1553 27°24.76' 109°11.01'
10 1846 2726.4803 10910.48021 488.7
11 160110 1319 27°34.289' 108°57.75'
12 160110 1401 27°34.234' 108°57.794' 511
13 160115 1648 27°38.15' 112°09.83'
14 160116 0245
15 1751 27°26.57' 112°38.02'
16 160117 1000 411
17 160118 1228 27°31' 113°49'
18 1422
19 1430
20 160119 1440 479.1
21 160120 0000 477.6
22 1100 28°36.62' 114°47.33'
23 1813 28°54.57' 114°54.94'
24 160121 1510 481.4
25 2050 427
26 160122 1136 29°56' 114°43'
27 1345 30°05.01' 114°42.87'
28 1942 521.1
29 160123 421.7
30 160124 2347 465.3
31 160125 1553 32°12.34' 113°29.38'
32 160126 1600 8.01

Scientific Cruise Report – Kon-Tiki2
46
Entr
y n
o.
wat
er
tem
per
atu
re
oxy
gen
turb
idit
y
Salin
ity
Pre
ssu
re
Flu
ore
sce
nce
LI1
89
LI1
00
0
air
tem
pe
ratu
re
hu
mid
ity
Atm
osp
he
ric
pre
ssu
re
Secc
hi d
ep
th
Fore
l Ule
°C PSU dbar umol umol °C % mbar m
1 23.68 104.04 0.25 36.05 3.51 0.01 1894.7 25.7 86 1016
2 24.266 99.22 0.1 36 3.32 0
3
4 1523 1260
5 24.61 100.22 0.16 36.04 3.26 0 2038 1188
6 24.562 98.71 0.17 36.02 3.31 0 381.5 386
7 24.977 98.21 0.11 36.04 3.44 0
8 25.075 98.29 0.11 36.06 3.42 0 572.2 450
9 44.7 1
10 24.942 99.29 0.12 36.08 3.23 0 1370.9 1324
11
12 96.13 0.02 36.02
13
14
15
16
17 168.37
18
19
20 604.5 440.4
21
22
23
24
25
26
27
28
29
30 22.58 94.77 35 1.95
31
32 28 3
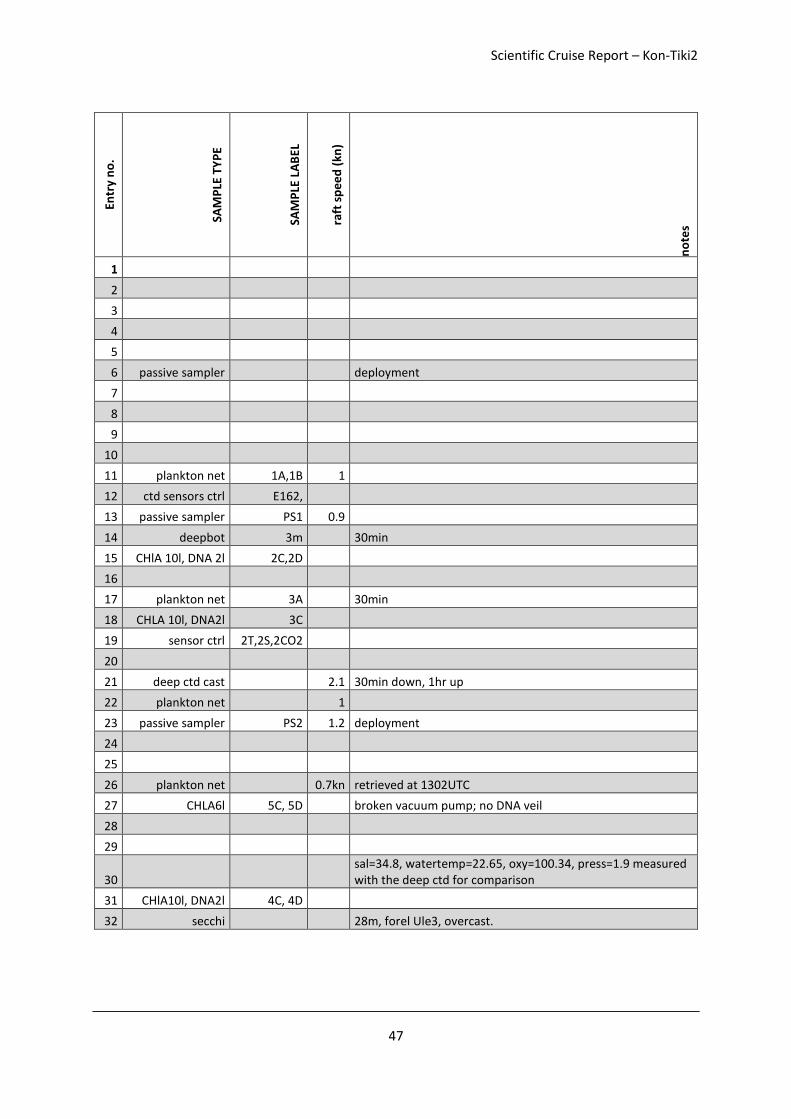
Scientific Cruise Report – Kon-Tiki2
47
Entr
y n
o.
SAM
PLE
TY
PE
SAM
PLE
LA
BEL
raft
sp
ee
d (
kn)
no
tes
1
2
3
4
5
6 passive sampler deployment
7
8
9
10
11 plankton net 1A,1B 1
12 ctd sensors ctrl E162,
13 passive sampler PS1 0.9
14 deepbot 3m 30min
15 CHlA 10l, DNA 2l 2C,2D
16
17 plankton net 3A 30min
18 CHLA 10l, DNA2l 3C
19 sensor ctrl 2T,2S,2CO2
20
21 deep ctd cast 2.1 30min down, 1hr up
22 plankton net 1
23 passive sampler PS2 1.2 deployment
24
25
26 plankton net 0.7kn retrieved at 1302UTC
27 CHLA6l 5C, 5D broken vacuum pump; no DNA veil
28
29
30 sal=34.8, watertemp=22.65, oxy=100.34, press=1.9 measured with the deep ctd for comparison
31 CHlA10l, DNA2l 4C, 4D
32 secchi 28m, forel Ule3, overcast.

Scientific Cruise Report – Kon-Tiki2
48
Entr
y n
o.
DA
TE
TIM
E
lati
tud
e
lon
gitu
de
CO
2
alka
linit
y
YYMMDD UTC S W pH
33 160127 1634
34 160128 0110 33°27.71' 113°35.59'
35 160130 1748 34°41.28' 112°22.47'
36 160131 0100 34° 45.69' 112°11.76'
37 2000 34°40.65' 111°20.04'
38 2143
39 160201 1800
40 160203 1500 35°06.8' 112°44.81'
41 160209 0530 36°58.17' 111°23.63'
42 2130
43 160210 1500
44 2143 36°57.57' 111°17.4'
45 160211 0538 37°03.56' 111°13.68'
46 160213 0515 38°38.59' 111°43.6'
47 1730 38°51.85' 111°37.25'
48 160214
49 1627
50 1900
51 160215 0021 39°24' 110°43'
52 0609 39°27.17' 110°32.85'
53 1800 39°27 110°01'
54 39°31' 109°46'
55 160216 0003 39°30' 109°24'
56 0618
57 1400
58 39°29.8' 109°16.41'
59 160217 0745
60 1607
61 1823 39°37.81' 109°46.24'

Scientific Cruise Report – Kon-Tiki2
49
Entr
y n
o.
wat
er
tem
per
atu
re
oxy
gen
turb
idit
y
Salin
ity
Pre
ssu
re
Flu
ore
sce
nce
LI1
89
LI1
00
0
air
tem
pe
ratu
re
hu
mid
ity
Atm
osp
he
ric
pre
ssu
re
Secc
hi d
ep
th
Fore
l Ule
°C PSU dbar umol umol °C % mbar m
33 1311.3 517.6
34
35
36
37
38 98.56 0.09 34.58
39 21.774 97.95 0.08 34.78 2.97
40 375.4 215.8
41
42 32 3
43
44
45
46
47
48 19.02 97.6 0.02 33.82 3.31 0.34
49 18.58 83.91 0.1 33.79 2.75 0.38
50 88.58 0.07 33.79
51
52 18.7
53 18.4 90.91 1.51 33.82 2.45 0.04
54 18.5
55 18.93 90.91 0.2 33.79 2.4 0.3
56 18.95 91.2 0.12 33.79 2.52 0.24
57 19.01 91.78 0.12 33.75 3.07 0.08
58 18.8
59 18.617 93.78 0.14 34.15 3.35 0.34
60 18.596 98.88 0.03 34.09 3.45 0.15
61 18.539

Scientific Cruise Report – Kon-Tiki2
50
SAM
PLE
TY
PE
SAM
PLE
LA
BEL
vess
el s
pe
ed
no
tes
kn
33
34 deep ctd cast and deepbot, 2411.51m, retrieval at 0515
35
36 plankton net ChlA10l,DNA2l 5A, 6C, 6D retrieved 0252UTC, 1hr 50min
37 passive sampler PS2 retrieval, 3LDPE, 4silicion packed in 2 and 2
38 ctd sensors ctrl 2O2,3T,3S,3CO2
39 sal=34.66, watertemp=21.8, press=3.13, Oxy=100.54
40 plankton net, chlA,DNA 7A, 7C, 7D 1 1hr30min trawl, NOTE, I skipped 6A so that it matches the filtering samples numbering.
41 deepbot 30m deep deployment, low wind
42 deep ctd cast 1.5
1.5hr down, 2hr up NOTE Fvalue 0.2 at 0m, 0.9 at approx 100m, 2nd peak at approx 250m, 0.4
43
44 deepbot bait and water splash
45 plankton net, chlA10l,DNA2l 8A,8C,8D 1.5hr tow
46 plankton net 9A
3 tows 10min each into 600ml bottle covered w black plastic, note, carved 8a erroneusly but crossed in the bottles cap
47 passive sampler PS3 deployment, line entanglement during Tupac exchange *was never retrieved
48
49
50 ctd sensors ctrl 2O2,3T,3S,3CO2 microtops backup
51 1.5
52 1.5 air temperature 19.2C, wet bulb 18.6C, 1025.14hPa
53 2
54 2.5 air temp 19.4, wetbulb 19.0, atm pressure 1021.4hPa, tendency -1.4, 7
55 2.5 ait temp 19C, wetbulb 18.9, atm pressure 1021.11hPa,
56
57
58 2.2 air temp 16.6C, wet bulb 15.6C, 1020.4hpa tendency 1.8
59
60
61 1.8 ait temp 18.2, wet bulb 14.2, 1026.55hPa, *
transferred to Tupac

Scientific Cruise Report – Kon-Tiki2
51
7.4 Meteorological observations, Rahiti Tane, leg 1
Date (ddmmyyyy)
Time (UTC)
Lat (degrees south)
Lat (minutes)
Lon (degrees west)
Lon (minutes)
Air pres
Air Temperature
Wetbulb T
Cloud cover (x/8) SST Salinity pressure oxygen Flu Turb
CO2 (fish) Lys
18112015 00:00 12 1.0 85 32 1010,6 19,8 17,9 7 20,6 324
06:00 12 5 85 50 1012 20,3 17,3 8 20,6 319
12:00 12 7 85 52 1012,5 20,1 17,8 8 20,8 305
18:00 12 14 86 8 1012,9 21,4 18,1 6 21,3 35,62 101,7 0,07 0,54 300
19112015 00:00 12 14 86 8 1012,3 20,4 18 7 21,2 35,6 0,87 101,6 0,3 0,28 310
12:00 12 29 86 48 1015,4 19,4 17,7 21 35,63 0,6 101,4 0,26 0,02 291
18:00 12 30 86 51 1016 20,7 17,8 7 20,9 35,57 0,6 99.9 0,07 0,02 309
20112015 00:00 12 38 87 17 1013,8 20,2 18,2 8 21,3 35,54 0,4 100,1 0,33 0,96 296
12:00 12 44 87 31 1014,1 20,6 16,9 7 20,8 35,57 0,34 101,8 0,34 0,02 330 100
18:00 12 56 87 51 1013,8 21,3 18,6 8 21,46 35,52 0,72 101 0,08 0,47 363 94
21112015 00:00 13 10 88 15 1011,6 20,8 17,9 7 21,6 35,53 0,75 102,2 0,27 0,02 330 9
12:00 13 19 88 42 1013,6 19,7 17,4 7 21,4 35,56 1,15 101,1 0,27 0,88 343 70
18:00 13 23 88 54 1014,6 19,5 17,8 7 21,4 35,54 0,78 101,8 0,14 0,02 313 120
22112015 00:00 13 28 89 9 1012,5 20,2 17,9 4 21,2 35,52 0,58 102,6 0,36 0,11 22
12:00 13 38 89 42 1014,1 19,4 17,5 8 20,7
14:00 13 40 89 48 1015,4 20 20,8 35,63 102,4 0,23 0,03 449 60
18:00 13 44 89 56 1015 21,2 18,2 4 21 35,61 0,69 102,36 0,07 3,62 294 20
23112015 00:00 13 49 90 8 1013,3 19,4 18,2 21,1 35,59 0,34 103,1 0,36 1,22 301 40
12:00 13 58 90 34 1013,9 20,5 17,5 8 21,2 35,55 0,5 101,6 0,32 0,65 305 90
18:00 14 0 90 43 1014,5 21,4 18,6 8 21,3 35,54 0,42 101,9 0,07 0,02 317 115
24112015 00:00 14 4 90 56 1012,6 20,1 17,9 2 21,4 35,54 0,63 102,6 0,25 0,02 280 60

Scientific Cruise Report – Kon-Tiki2
52
Date (ddmmyyyy)
Time (UTC)
Lat (degrees south)
Lat (minutes)
Lon (degrees west)
Lon (minutes)
Air pres
Air Temperature
Wetbulb T
Cloud cover (x/8) SST Salinity pressure oxygen Flu Turb
CO2 (fish) Lys
12:00 14 12 91 20 1014,4 20,2 17,6 6 21,1 35,6 1,1 101,7 0,26 0,02 304 83
18:00 14 17 91 29 1014,2 21,5 18,3 1 21,1 35,67 1,31 102,2 0,07 2,53 20
25112015 00:00 14 19 91 38 1012,6 20,7 17,4 5 21,2 35,68 1,1 102,5 0,32 3,99 40
12:00 14 26 92 0 1014,1 20,2 17,8 7 21 35,71 1,05 101,8 0,32 4,94 50
18:00 14 32 92 11 1015,4 20,7 18,2 4 21,2 35,69 0,88 102,33 0,12 6,06 100
26112015 00:00 14 36 92 23 1013,6 20,5 18,6 5 21,3 35,69 0,83 102,63 0,21 0,02 70
12:00 14 49 92 52 1015,6 21,3 17,4 7 21,2 35,7 0,56 101,7 0,29 0,03 46
18:00 14 59 93 7 1017,4 21,8 18,9 21,3 35,6 0,94 101,83 0,09 0,04 25
27112015 00:00 15 7 93 22 1014,7 20,9 18,7 21,4 35,61 0,72 102,7 0,3 0,35 100
12:00 15 24 93 53 1015,8 19,7 18,3 7 21,4 35,61 0,58 102,8 0,41 0,04 33
18:00 15 34 94 9 1016,8 21,9 18,6 5 21,6 35,61 0,12 103,2 7,49 1,58 170
28112015 00:00 15 45 94 24 1014,9 21 18,3 5 21,6 35,64 0,18 103,1 0,29 0,02 72
12:00 16 6 94 56 1015,2 20,7 18,4 8 21,5 35,78 0,28 102,2 0,31 0,02 21
18:00 16 14 95 13 1016,9 20,7 18,7 7 21,6 35,71 0,19 102,3 2,49 0,12 150
29112015 00:00 16 21 95 25 1013,7 21,1 18,8 1 21,7 35,85 1,03 102,5 0,31 0,02 42
12:00 16 39 95 53 1014,5 20,3 18,1 8 21,7 35,89 0,59 101,57 0,46 0,06 14
18:00 16 47 96 6 1015,6 21,9 18,9 8 21,8 35,9 0,27 102,3 0,23 0,02
30112015 00:00 16 57 96 17 1013,9 20,8 18,1 21,9 35,91 0,45 102,4 0,39 0,02 110
12:00 17 18 96 43 1014,9 21,4 17,9 8 21,6 35,87 0,74 101,1 0,27 0,02 38
18:00 17 28 97 0 1016,6 19,9 18,5 8 21,6 35,86 0,29 101,4 0,23 0,02 110
1122015 00:00 17 38 97 15 1014,8 21,2 18,3 21,6 35,85 0,19 102,42 0,29 0,02 185
12:00 17 54 97 47 1016,3 21,3 17,9 8 21,6 35,82 0,54 101,3 0,3 0,02 47
18:00 18 1 98 1 1016,9 20 18,5 8 21,8 35,89 0,1 101,25 0,27 9,3 369 120
2122015 00:00 18 12 98 14 1014,8 21,2 18,6 21,9 35,83 0,53 101,3 0,16 2,76 122
12:00 18 30 98 39 1015,8 21,3 19 7 21,9 35,97 0.026 100,8 0.22 0,02 52

Scientific Cruise Report – Kon-Tiki2
53
Date (ddmmyyyy)
Time (UTC)
Lat (degrees south)
Lat (minutes)
Lon (degrees west)
Lon (minutes)
Air pres
Air Temperature
Wetbulb T
Cloud cover (x/8) SST Salinity pressure oxygen Flu Turb
CO2 (fish) Lys
18:00 18 41 98 52 1016,8 22 19,2 8 22 35,94 0,32 101,2 0,14 0,32 76
3122015 00:00 18 52 99 1 1015,5 21,6 19,3 7 22 35,93 0,71 101,1 0,25 0,29 370 145
12:00 19 12 99 18 1018 19,3 18,7 8 21,9 35,9 0,76 100,6 0,15 0,17 33
18:00 19 24 99 26 1018,2 21,7 19,3 5 21,9 35,92 0,51 100,9 0,1 0,13 400 1300
4122015 00:00
12:00 19 51 99 47 1017,5 18,9 18,2 7 21,8 35,88 1,14 99,94 0,18 0,23 26
18:00 19 53 99 51 1018,4 22 18,9 2 22 35,88 1,22 99,38 0,21 0,23 354 22
5122015 00:00 19 59 99 54 1016,2 20,6 19,1 5 22,2 35,9 1,3 100,14 0,19 0,43 385 80
12:00 20 12 100 0 1016,1 20,8 18,7 5 22,1 35,89 1 100,1 0,19 0,24
18:00 20 16 100 9 1018,2 20,9 18,9 6 22,3 35,86 0,26 101,16 0,16 0,37 366 21
6122015 00:00 20 26 100 12 1016,6 21,4 19,5 2 22,5 35,88 1,14 101,2 0,19 0,26 351 650
12:00 20 40 100 23 1018,3 20,1 19,2 7 22,5 35,98 0,99 100,1 0,2 0,27 29
18:00 20 50 100 33 1019,4 22,5 18,9 5 22,5 36 0,66 100,48 0,15 0,66 385 20
7122015 00:00 20 57 100 40 1017,3 21,9 18,9 6 22,5 35,97 0,76 101,09 0,21 0,26 389 70
12:00 21 15 100 59 1017,2 21,6 18,6 7 22,3 36,01 0,92 100,73 0,18 0,02 389 14
18:00 21 24 101 9 1018,5 23,7 19,7 22,4 36 0,83 100,89 0,17 0,56 375 155
8122015 00:00 21 35 101 20 1017,2 22,2 19,1 22,5 36,03 0,57 100,8 0,2 0,22 370 88
12:00 21 51 101 38 1017,2 21,8 19,7 22,1 35,9 0,61 101,13 0,19 0,02 9
18:00
9122015 00:00 22 14 102 0 1017,6 22,1 20,3 1 22,2 35,73 1,09 101,5 0,19 0,07 410 85
12:00 22 36 102 19 1019,2 20,8 19,4 3 22 35,72 0,28 101,7 0,19 0,05 27
18:00 22 50 102 31 1021 22,6 20,2 4 22 35,73 0,34 101,6 0,14 0,03 394 25
10122015 00:00 23 3 102 41 1019,4 22,1 20 3 22,1 35,73 0,48 101,63 0,17 0,02 386 250
12:00 23 28 103 4 1019,9 21,8 19,8 22,3 35,92 0,46 101,29 0,16 0,18 1,5
18:00 23 38 103 16 1021,8 22,4 20,1 22,2 35,87 0,31 101,5 2,46 0,03 400 19

Scientific Cruise Report – Kon-Tiki2
54
Date (ddmmyyyy)
Time (UTC)
Lat (degrees south)
Lat (minutes)
Lon (degrees west)
Lon (minutes)
Air pres
Air Temperature
Wetbulb T
Cloud cover (x/8) SST Salinity pressure oxygen Flu Turb
CO2 (fish) Lys
11122015 00:00 23 51 103 27 1019,8 22,1 20,1 8 22,2 35,82 0,58 101,31 0,17 0,02 425 180
12:00 24 11 103 48 1020,4 21,6 19,1 7 22,1 35,81 0,73 100,73 0,15 0,02
18:00 24 21 103 59 1021,3 22,9 19,8 7 22,4 35,96 0,48 100,68 0,13 0,15 460 1130
12122015 00:00 24 32 104 10 1019,2 22 18,1 5 22,4 35,92 0,75 101,42 0,16 0,22 456 50
12:00 24 52 104 30 1019,9 21,4 19,1 3 22,4 35,93 0,75 101,26 0,15 0,25 444 9
18:00 24 55 104 38 1021,7 22,7 18,2 7 22,5 35,96 1,01 99,62 0,15 0,02 441 1490
13122015 00:00 24 57 104 44 1019,6 22 18,6 7 22,7 35,94 1,2 99,76 0,18 0,02 455 35
12:00 25 6 105 1 1020,6 21,4 18,1 7 22,5 36,03 0,65 101,16 0,16 0,02 435 9
18:00 25 11 105 12 1021,8 22,2 18,1 1 22,1 35,74 0,42 101,15 0,19 9,11 445 22
14122015 00:00 25 6 105 18 1019,7 23 19,6 3 23 36,06 1,16 101,11 0,17 0,71 442 70
12:00 25 12 105 33 1019,7 21,7 19,8 7 22,7 36,09 0,81 100,15 0,17 0,14 452 1,6
18:00 25 18 105 41 1021,4 22,6 19 6 23 36,11 1,09 100,72 0,16 0,16 426 30
15122015 00:00 25 24 105 48 1019,9 21,9 19 7 22,8 36,11 1,08 98,31 0,2 0,16 433 35
12:00 25 32 106 4 1019,1 21,3 17,3 1 22,7 36,05 0,66 99,63 0,11 0,11 3,6
18:00
16122015 00:00 25 44 106 26 1019,6 22 18,2 3 23,2 36,14 0,87 99,17 0,18 0,11 440 195
12:00 25 58 106 52 1020,2 21,7 18,8 5 22,7 36,01 0,75 99,65 0,18 0,1 6,5
18:00 26 5 107 4 1022 23,1 19 1 22,7 35,95 0,75 97,68 0,16 3,08 419 22
171122015 00:00 26 12 107 17 1020,5 22,2 18,5 4 250
12:00 26 25 107 41 1021 21,8 19,1 3 0,4
18:00 26 30 107 56 1022,9 23,2 19,3 1 417 21
18122015 00:00 26 37 108 9 1022 22,6 19,6 3 439
12:00 26 43 108 33 1022 22 19,6 2 0
18:00 26 48 108 49 1022,6 23,2 20,8 3 23,1 35,75 0,93 100,72 0,22 0,22 400 23
19122015 00:00 26 55 109 1 1020,9 22,6 19,9 2

Scientific Cruise Report – Kon-Tiki2
55
7.5 Statement of the expedition’s conclusion from www.Kon-Tiki2.com
«(2016-03-17) The Kon-Tiki2 Expedition has decided to end the expedition after 114 days and 4500 nautical miles in the South-East Pacific. The goal of the expedition has been to show that balsa rafts can sail from South America to Easter Island, and back. The Expedition reached Easter Island after 43 days at sea, but the return voyage has proven more difficult due to atypical winds. We have shown that balsa rafts can sail to Easter Island. This is a first, in modern times. We have also made good progress on the return journey, but this is an El Niño year and the weather patterns we have encountered have been atypical. We realize that reaching South America will take too long and we prefer to evacuate to ensure safety for all, says Expedition leader Torgeir Higraff. The Expedition consists of two balsa rafts that left Lima in Peru on Nov 7th, 2015, and arrived on Easter Island just before Christmas. On Jan 6th, 2016, the rafts started the demanding return voyage. In a normal year, we would have reached South America by now. Instead, we are still 900 nautical miles from land and the weather forecasts are not promising. The crew is at good health and spirit, and there is no emergency situation. These rafts have proven to be exceptional vessels at sea. They have impressed us by their seaworthiness in all sorts of weather, over enormous and remote waters. Needless to say, it is sad to end the expedition without reaching South America, says Higraff. The Kon-Tiki2 Expedition has done important scientific research on climate change, marine life, plastics, and pollution in the Pacific. The rafts are rigged as floating research vessels through a unique collaboration between NIVA, NTNU, Kongsberg Maritime, Norwegian Meteorological Institute, Nortek, Sperre, Opera, and the American research organizations NASA and NOAA, says Cecilie Mauritzen, Chief Scientist of the Expedition. We have gathered large sets of data on climate change and pollution. From a scientific point of view, it has been particularly interesting that the expedition took place in one of the strongest El Niño years recorded, even if El Niño now contributes to the termination of the expedition. As research partners, we look forward to receiving and analyzing these data sets, says Mauritzen. The Expedition is supported by Thor Heyerdahl Institute, 3A Composites AirexBaltekBanova, and the Ministry of Foreign Affairs. The Expedition is discontinued in close collaboration with the Chilean Navy, which have assisted us in a highly professional manner. The Norwegian Embassy has also communicated closely with the Expedition, says Ambassador Hege Araldsen at the Norwegian Embassy in Santiago, Chile.»
Figure 29 Left. Hege Araldsen, Norway's Ambassador to Chile and Admiral Larrañaga met to express gratitude to the Chilean Navy for the rescue operation. On the right, the crew members of OPV Piloto Pardo and expedition leader Torgeir Higraff.

Scientific Cruise Report – Kon-Tiki2
56
7.6 Statement of Fact for Rescue operation

Scientific Cruise Report – Kon-Tiki2
57