ball milling final rep
TRANSCRIPT

7/27/2019 Ball Milling Final Rep
http://slidepdf.com/reader/full/ball-milling-final-rep 1/32
CH3510
MECHANICAL OPERATIONS LAB
CHEMICAL ENGINEERING
EXPERIMENT NO: 1
BALL MILLING
Subramanya T.A CH10B064
T.Manoj Kumar CH10B070
T.Venkat Rajesh CH10B069

7/27/2019 Ball Milling Final Rep
http://slidepdf.com/reader/full/ball-milling-final-rep 2/32
Aim:
To determine the particle size distribution and specific surface area of the givensample (calcite) and also study the effects of grinding rate using batch ball mill.
Apparatus :
Batch ball mill Set of sieves Sieve shaker Stop watch
Weighing balance (Digital)
Theory :
A ball mill, a type of grinder, is a cylindrical device used in grinding (or mixing)materials like ores, chemicals, ceramic raw materials and paints. Ball mills rotatearound a horizontal axis, partially filled with the material to be ground plus thegrinding medium. Different materials are used as media, including ceramic balls,flint pebbles and stainless steel balls.
Principle of grinding:
The size reduction in a ball mill is purely done by the impact of balls in thecylinder. When the mill is rotated, the balls are picked up by the mill wall andcarried nearly to the top, where they break contact with the wall and fall to the
bottom to be picked up again. Centrifugal force keeps the balls in contact with thewall and with one another during the upward movement. Most of the grindingoccurs at the zone of impact, where the free falling balls strike the bottom of the
mill.
Experimental procedure:
1. The sieve shaker is filled with the given sample of calcite of known weight.

7/27/2019 Ball Milling Final Rep
http://slidepdf.com/reader/full/ball-milling-final-rep 3/32
2. Sieve analysis should be performed for the given sample for 10 minutesusing the standard set of sieves.
3. Now, place the given calcite sample in the ball mill which is already filledwith steel balls (20mm) up to 50% of its volume.
4. The ball is should be rotated with the speed which is equal to 75% of thecritical speed which is calculate from the formula given below:
where,
Nc- critical speed (rps)
R- Radius of the ball mill(m)
r- Radius of the ball (m)
g- Gravitational constant (m/sec 2 )
5. On substituting the values of g=9.8 m/sec 2, R=75 mm, r = 6.872 mm in theabove equation, we will get N c as 114.53 rpm. So, the ball mill will be operatedat a speed of 85.89 rpm.
6. After running the ball mill, operated at the power 0.08 kw/hr, for specifictime (first time run the ball mill for 2 min), place the sample on a paper and
perform sieving again for a specific time of 10 mins.
7. Now, again repeat the above procedure by placing the sample in the ball millfor two more times (time intervals being 2 min (at t= 4 min) and 5 mins(at t= 9min) respectively), and then perform sieve analysis.
8. The surface area of the given sample has to be calculated for each timeinterval using the sieve analysis data.
9. A graph is plotted between specific surface areas with time of grinding.Calculate the rate of grinding from the slopes of the curve.
10. Plot grinding rate with time of grinding.

7/27/2019 Ball Milling Final Rep
http://slidepdf.com/reader/full/ball-milling-final-rep 4/32
11. Plot grinding rate vs. specific surface area
Calculations:
Initial amount of calcite taken : 200 g
Density of calcite : 1.9 g/cc
Sphericity of the sample : 0.78
Diameter of the ball mill vessel : 150 mm
Diameter of the ball : 6.872 mm
RPM of the ball mill : 85.90
Specific surface area S = ∑
Assuming that all particles are spherical,
Ø p =0.78
Average diameter = Average diameter of two adjacent sieve
Initial Sieve Analysis data for the given sample:
At t =0 min
Sieve No Sieve Size(mm)
Weightretained(g)
Weightfraction(x i)
Averagediameter [D i] (mm)
X i/D i(mm -1)
I 3.15 mm 73.4 0.3681 3.15 0.11687II 1.6 mm 117.09 0.5873 2.375 0.26394II 630 µm 7.53 0.0378 1.115 0.03914IV 315 µm 1.08 5.4x10 -3 0.4725 0.01146V 90 µm 0.15 8 x10 -4 0.2025 0.00372Pan <90 µm 0.13 7 x 10 -4 0.045 0.01449Total 199.38 1 0.4496
The total Specific surface area of the given sample calculated by using the abovedata is

7/27/2019 Ball Milling Final Rep
http://slidepdf.com/reader/full/ball-milling-final-rep 5/32
Scal = 1.8203 m 2/kg
Error analysis:
The error in the specific surface area calculated is given by
∆S/S = ∆W/W + ∑∆x i / x i
∆xi = ∆( w i/ w total) = ∆ w
w= 200 g (assumed to be given hence has no error in its measurement)
∆w= (1/2)* Least count = 0.5*0.01 gm
= 5*10 -6 Kg
∆S/S = ∆w {(1/ w) + ∑(1/x i)} ------------- ( 1 )
∑(1/x i) = 30784
∆S/S = 5*10 -6 (5+30784) = 0.154
∆S = 1.547 * 0.154
= 0.238 m 2/kg
Actual S = S cal ± ∆S = (1.8203 ± 0.238) m2
/kgAt t = 2 min
Sieve No Sieve Size(mm)
Weightretained(g)
Weightfraction(x i)
Averagediameter [D i] (mm)
X i/D i(mm -1)
I 3.15 mm 54.04 0.27153 3.15 0.08620II 1.6 mm 77.6 0.38991 2.375 0.17524II 630 µm 28.72 0.14431 1.115 0.14954
IV 315 µm 9.11 0.04577 0.4725 0.09688V 90 µm 14.25 0.07160 0.2025 0.32358Pan <90 µm 15.3 0.07688 0.045 1.70837Total 199.02 1 1.0021
S = 10.404 m 2/kg

7/27/2019 Ball Milling Final Rep
http://slidepdf.com/reader/full/ball-milling-final-rep 6/32
∆S/S = ∆w {(1/ w) + ∑ (1/x i)}
∑(1/x i) = 37.73
∆S/S= 5*10 -6 (5+37.73) = 2.1365x10 -2
∆S = 10.404 * 2.1365x10 -2= 0.2223 m 2/kg
Actual S = S cal ± ∆S = (10.404 ± 0.2223) m 2/kg
At t= 4 minutes
Sieve No Sieve Size(mm)
Weightretained(g)
Weightfraction(x i)
Averagediameter [D i] (mm)
X i/D i(mm -1)
I 3.15 mm 44.95 0.2263 0.22628 0.07183II 1.6 mm 59.6 0.30 0.30003 0.13484II 630 µm 25.83 0.13 0.13003 0.13474IV 315 µm 8.58 0.0432 0.04319 0.09141V 90 µm 23.69 0.1193 0.11925 0.58851Pan <90 µm 36 0.1812 0.18122 4.02718Total 198.65 1
S = 20.441 m2/kg
∆S/S = ∆w {(1/ w) + ∑ (1/x i)}
∑(1/x i) = 46.6445
∆S/S= 5*10 -6 (5+46.6445) = 2.58x10 -4
∆S = 20.441 * 2.58x10 -4 = 5.278x10 -3 m2/kg
Actual S = S cal ± ∆S = (20.441±5.278X10 -3) m2 /kg

7/27/2019 Ball Milling Final Rep
http://slidepdf.com/reader/full/ball-milling-final-rep 7/32
At t= 9 minutes
Sieve No Sieve Size(mm)
Weightretained(g)
Weightfraction(x i)
Averagediameter [D i] (mm)
X i/D i(mm -1)
I 3.15 mm 34.15 0.17250 3.25 0.05476II 1.6 mm 37.65 0.19018 2.375 0.08547II 630 µm 15.52 0.07840 1.117 0.08124IV 315 µm 4.35 0.02197 0.4725 0.04650V 90 µm 28.74 0.14517 0.2025 0.71691Pan <90 µm 77.56 0.39178 0.045 8.70615Total 197.97 1
Specific Surface area = 39.235 m2/kg
∆S/S = ∆w {(1/ w) + ∑ (1/x i)}
∑(1/x i) = 65.28
∆S/S= 5*10 -6 (5+65.28) = 3.51x10 -4
∆S = 39.235 * 3.51x10 -4= 0.018m 2
Actual S = S cal ± ∆S = 39.235 ± 0.018
m2
At time = 0 min 2 min 4 min 9 min
Specific Surface area
(m2/kg)
1.8203 10.4041 20.441 39.2349
Grinding rate ds/dt(m2/kg.min)
4.2919 5.0184 3.7588

7/27/2019 Ball Milling Final Rep
http://slidepdf.com/reader/full/ball-milling-final-rep 8/32
Graphs:
Specific surface area (S) vs. Time (t)
Here Y axis represents specific surface area in units of m 2/kg and X-axisrepresents time in units of minutes. It clearly shows that amount of surfacearea increases monotonically as the period of milling increases. It is because
during milling size of the particle is reduced which results in increasedsurface area.
0
5
10
15
20
25
30
35
40
45
0 2 4 6 8 10
S p e c i f i c s u r f a c e a r e a
time (min)
Specific surface(m 2/kg.min) area vs time(min)
Surface area

7/27/2019 Ball Milling Final Rep
http://slidepdf.com/reader/full/ball-milling-final-rep 9/32

7/27/2019 Ball Milling Final Rep
http://slidepdf.com/reader/full/ball-milling-final-rep 10/32
Cumulative Distribution
SIEVE SIZE(mm) Range (mm) T=0 T=2min T=4 min T=9 min
0 0 - 0.09 0.07% 7.69% 18.12% 39.18%0.09 0.09-0.315 0.14% 14.85% 30.05% 53.70%
0.315 0.315 - 0.63 0.68% 19.43% 34.37% 55.89%0.63 0.63 - 1.3 4.46% 33.86% 47.37% 63.73%
1.3 1.3 - 3.15 63.19% 72.85% 77.37% 82.75%3.15 > 3.15 100.00% 100.00% 100.00% 100.00%
Here mass fraction are given in terms of percentage for better visual representation.
Mass fraction data obtained from experiment
Sieve Size(mm) Di(mm) X i at t =0 X i at t = 2min X i at t = 4min X i at t = 9min3.15 3.15 0.368141238 0.27153 0.22628 0.17250
1.3 2.225 0.587270539 0.38991 0.30003 0.190180.63 0.965 0.037767078 0.14431 0.13003 0.07840
0.315 0.4725 0.005416792 0.04577 0.04319 0.021970.09 0.2025 0.000752332 0.07160 0.11925 0.14517
pan0.045 0.000652021 0.07688 0.18122 0.39178
0
0.1
0.2
0.3
0.4
0.5
0.6
0.7
0 2 4 6 8 10
3.15 mm
1.6 mm
630 µm
315 µm
90 µm
< 90 µm
7/27/2019 Ball Milling Final Rep
http://slidepdf.com/reader/full/ball-milling-final-rep 11/32
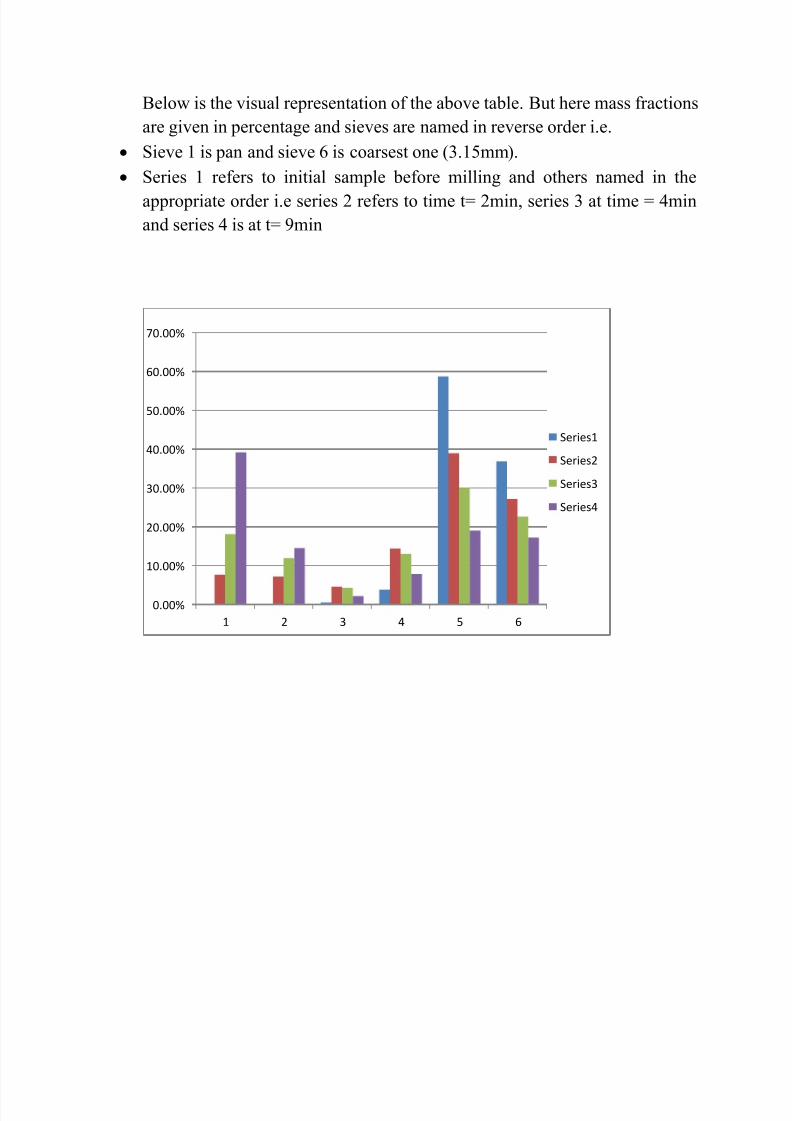
Below is the visual representation of the above table. But here mass fractionsare given in percentage and sieves are named in reverse order i.e.
Sieve 1 is pan and sieve 6 is coarsest one (3.15mm). Series 1 refers to initial sample before milling and others named in the
appropriate order i.e series 2 refers to time t= 2min, series 3 at time = 4minand series 4 is at t= 9min
0.00%
10.00%
20.00%
30.00%
40.00%
50.00%
60.00%
70.00%
1 2 3 4 5 6
Series1
Series2
Series3
Series4

7/27/2019 Ball Milling Final Rep
http://slidepdf.com/reader/full/ball-milling-final-rep 12/32
Variation with respect to sieves at a specific instance
1) t = 0 initially before milling
It can be seen most of the material is in coarser sieves.
2) At t = 2 minutes
0.00%
10.00%
20.00%
30.00%
40.00%
50.00%
60.00%
70.00%
1 2 3 4 5 6
0.00%
5.00%
10.00%
15.00%
20.00%
25.00%
30.00%
35.00%
40.00%
45.00%
1 2 3 4 5 6
Series1

7/27/2019 Ball Milling Final Rep
http://slidepdf.com/reader/full/ball-milling-final-rep 13/32
3) At t = 4 minutes
4) At t = 9 minutes
0.00%
5.00%
10.00%
15.00%
20.00%
25.00%
30.00%
35.00%
1 2 3 4 5 6
Series1
0.00%
5.00%
10.00%
15.00%
20.00%
25.00%
30.00%
35.00%
40.00%
45.00%
1 2 3 4 5 6
Series1

7/27/2019 Ball Milling Final Rep
http://slidepdf.com/reader/full/ball-milling-final-rep 14/32
SIMULATION OF BALL MILLING
AIM : To determine the breakage function rate for the batch ball mill usinga power law type breakage function (B) assumed in theoryDATA REQUIRED The product size analysis data collected from batch grinding experiments atthree or four different time intervals and the starting feed size
THEORY Size reduction can be simulated if input feed is completely specified;
depends on mass balance on a particular size class. Let N number of sievesin a set n sieve numberu no.of screens coarser than n (i.e. above screen no.n)FUNCTIONS 1. Grinding rate function S n – fraction of material broken in a given time
coarser than that on screen n If x n be mass fraction on screen n, thendx n/dt = -S nxn
2. Breakage function ΔB n,u – fraction of particles entering the nth size class
resulting from breakage of particles of uth
size classBn,u=(D n/Du)β
where D n = average particle diameter of particles retained on nth screenβ= constant
ΔB n,u=B n-1,u – Bn,u Grinding function depends on D u
k , where k is a constant (often k = 3)Sn=Sn-1(Dn/D n-1)k
Mass Balance gives the equation:
dxn/dt = -S nxn+ Σx uSuΔB n,u3. Using Euler – Newton method to solve
xn,t+1 = x n,t(1-S nΔt) + Δt Σx u,tSuΔB n,u
PROCEDURE Breakage rate function is assumed as a power function.

7/27/2019 Ball Milling Final Rep
http://slidepdf.com/reader/full/ball-milling-final-rep 15/32
Aim is to determine the value of the exponent which matchesexperimental data. Done by non linear parameter estimation
procedure Assume an initial grinding rate S 1= 0.0001 and β=1.3 .
Assume exponent of 2.5 for variation of grinding rate function and predict the batch grinding product at various time intervals testedusing the assumed values of B from simulation.
Compare it with observed product using graph. Repeat withexponents of 2.75, 3, 3.25, and 3.5.
Determine which of the 4 experiments predicts closer results toobserved values by comparing the values of net error obtained ineach case and choosing the least
Grinding rate S n has function of parameter K
SIEVE SIZE(mm) Average value of Diameter(mm)
Dn/Dn-1
1 0 0.045 0.1052 0.09 0.2025 0.4285714293 0.315 0.4725 0.4896373064 0.63 0.965 0.4337078655 1.3 2.225 0.7063492066 3.15 3.15 0.01
Now calcuating (D n/Dn-1)k for various k values we get
SIEVE SIZE(mm) K = 2.5 K=2.75 k = 3.0 k =3.25 k = 3.5
0 2.43924E-07 1.97849E-06 0.000514714 8.8153E-10 2.52676E-10
0.09 1.04782E-05 0.00097289 0.444629453 1.3377E-06 6.73598E-07
0.315 8.71421E-05 6.68269E-05 0.00003375 2.1004E-05 1.30713E-05
0.63 0.000519448 0.000476208 0.000287508 0.0002139 0.000159132
1.3 0.00419323 0.003844178 0.003524182 0.00323082 0.002961884
3.15 0.01 0.01 0.01 0.01 0.01

7/27/2019 Ball Milling Final Rep
http://slidepdf.com/reader/full/ball-milling-final-rep 16/32
2) Breakage function B n,u in a matrix B(m,n) = B n,u
Column 1 1 2 3 4 5 6
1 0 0 0 0 0 0
2 0.636392862 0 0 0 0 0
3 0.2148235 0.337564282 0 0 0 0
4 0.08490214 0.133411521 0.395218121 0 0 0
5 0.028219468 0.044342841 0.131361176 0.3323764 0 0
6 0.003993673 0.006275484 0.018590487 0.047038548 0.141521927 0
MATLAB CODE:
1. Breakage function calculationfunction [b,s] = breakage(~) % b is breakage function
d = [3.150000000000000;2.225;0.965;0.4725;0.2025;0.0450000000000l = length(d);b = -eye(l);b(l,l) = 0;s = grinding();for m = 2:6for n = 1:6
if n < mb(m,n) = -((d(m,1)./d(n,1)).^1.3)+((d(m-1,1)./d(n,1)).^1
end
end end for m = 1:l
for n = 1:l;b(m,n) = b(m,1)*s(1,n);
end
7/27/2019 Ball Milling Final Rep
http://slidepdf.com/reader/full/ball-milling-final-rep 17/32
end
end
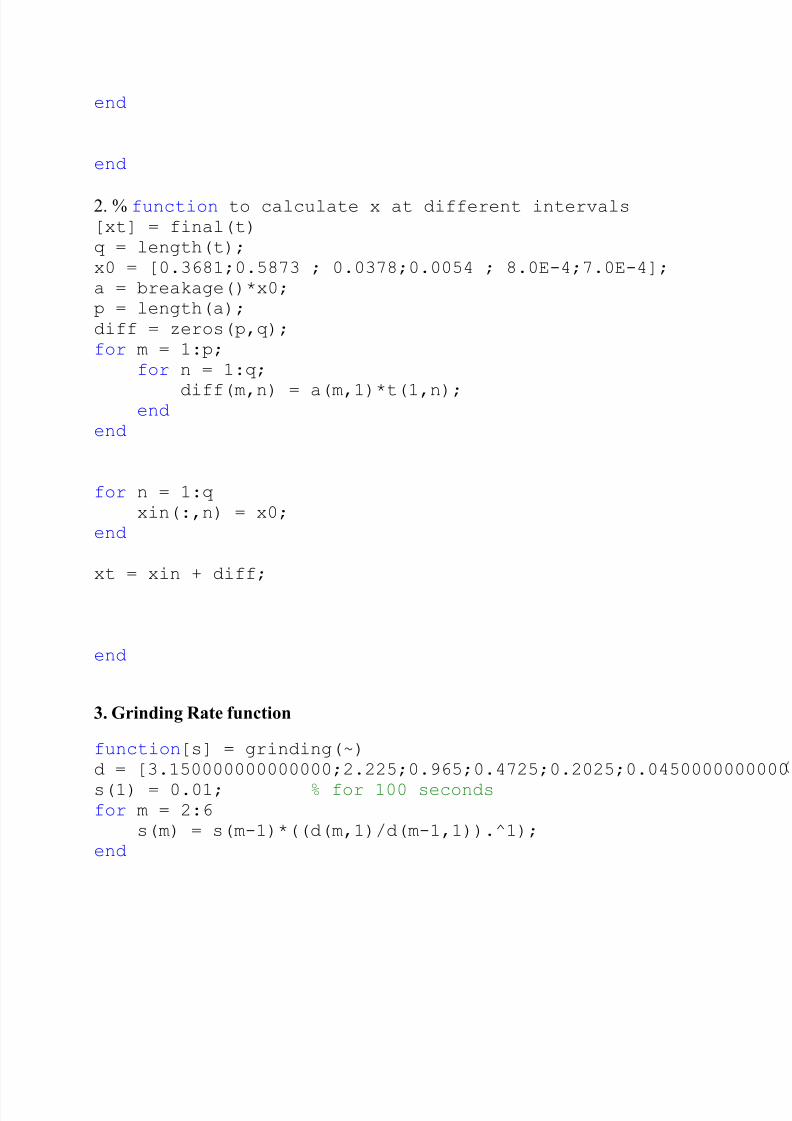
2. % function to calculate x at different intervals[xt] = final(t)q = length(t);x0 = [0.3681;0.5873 ; 0.0378;0.0054 ; 8.0E-4;7.0E-4];a = breakage()*x0;p = length(a);diff = zeros(p,q);for m = 1:p;
for n = 1:q;
diff(m,n) = a(m,1)*t(1,n);end
end
for n = 1:qxin(:,n) = x0;
end
xt = xin + diff;
end
3. Grinding Rate function
function [s] = grinding(~)d = [3.150000000000000;2.225;0.965;0.4725;0.2025;0.0450000000000s(1) = 0.01; % for 100 seconds for m = 2:6
s(m) = s(m-1)*((d(m,1)/d(m-1,1)).^1);end

7/27/2019 Ball Milling Final Rep
http://slidepdf.com/reader/full/ball-milling-final-rep 18/32
Simulated data for K= 2.5
Sieve size dX i/dt X i at t = 0 min X i at t =2 min X i at t =4 min X i at t = 9 min
3.15 mm -0.003681412 36.81% 36.37% 35.49% 33.50%
1.6 mm 8.52519E-05 58.73% 58.74% 58.76% 58.77%
630 µm 0.002296062 3.78% 4.05% 4.60% 5.02%
315 µm 0.00094593 0.54% 0.66% 0.88% 1.05%
90 µm 0.000413885 0.08% 0.12% 0.22% 0.30%
<90 µm 0.000175332 0.07% 0.09% 0.13% 0.16%
SIMULATED DATA
DATA K = 2.75
Sieve size dX i/dt X i at t = 0 min X i at t =2 min X i at t =4 min X i at t = 9 min
3.15 mm -0.003681412 36.81% 36.37% 35.49% 33.50%1.6 mm 8.52519E-05 58.73% 58.74% 58.76% 58.77%
630 µm 0.002296062 3.78% 4.05% 4.60% 5.02%
315 µm 0.00094593 0.54% 0.66% 0.88% 1.05%
90 µm 0.000413885 0.08% 0.12% 0.22% 0.30%
<90 µm 0.000175332 0.07% 0.09% 0.13% 0.16%

7/27/2019 Ball Milling Final Rep
http://slidepdf.com/reader/full/ball-milling-final-rep 19/32
simulated data
k = 3
Sieve size dX i/dt X i at t = 0 min X i at t =2 min X i at t =4 min X i at t = 9 min
3.15 mm -0.003681412 36.81% 36.37% 35.49% 34.83%
1.6 mm 0.000273176 58.73% 58.76% 58.83% 58.87%
630 µm 0.002239752 3.78% 4.05% 4.58% 4.99%
315 µm 0.000904927 0.54% 0.65% 0.87% 1.03%
90 µm 6.14299E-05 0.08% 0.08% 0.10% 0.11%
<90 µm 0.000216536 0.07% 0.09% 0.14% 0.18%
SIMULATED DATA
K= 3.25
Sieve size dX i/dt X i at t = 0 min X i at t =2 min X i at t =4 min X i at t = 9 min
3.15 mm -0.003681412 36.81% 36.37% 35.49% 34.83%1.6 mm 0.000445457 58.73% 58.78% 58.87% 58.97%
630 µm 0.002191661 3.78% 4.04% 4.57% 4.96%
315 µm 0.000868726 0.54% 0.65% 0.86% 1.01%
90 µm 0.000379837 0.08% 0.12% 0.17% 0.28%
<90 µm 0.000162324 0.07% 0.08% 0.13% 0.15%

7/27/2019 Ball Milling Final Rep
http://slidepdf.com/reader/full/ball-milling-final-rep 20/32
SIMULATED DATA K = 3.5
Sieve size dX i/dt X i at t = 0 min X i at t =2 min X i at t =4 min X i at t = 9 min
3.15 mm -0.003681412 36.81% 36.37% 35.49% 34.83%
1.6 mm 0.000603397 58.73% 0.587805087 58.90% 59.05%
630 µm 0.002138646 3.78% 0.040397071 4.56% 4.93%
315 µm 0.000835707 0.54% 0.006459263 0.85% 0.99%
90 µm 0.000365755 0.08% 0.001208136 0.17% 0.27%
<90 µm 0.000156078 0.07% 0.00084681 0.13% 0.15%
Graph of simulated data :
The data obtained from simulations is represented in graphical form below. Since thevalues differ widely in magnitude between sieves two graphs are drawn to better representthe data.
Here X-axis Represents amount of time balling milling is done in units of minutes Y-axis represents mass fraction in different sieves in terms of percentage

7/27/2019 Ball Milling Final Rep
http://slidepdf.com/reader/full/ball-milling-final-rep 21/32
1) K = 2.5 S n = S n-1* (D n/Dn-1)2.5
a) Sieves 3.15mm , 1.3mm , 0.63mm
b) Sieves 315 m, 90 m and Pan (<90 m)
0.00%
10.00%
20.00%
30.00%
40.00%
50.00%
60.00%
70.00%
0 1 2 3 4 5
3.15mm
1.3mm
0.63mm
0.00%
0.20%
0.40%
0.60%
0.80%
1.00%
1.20%
0 1 2 3 4 5
0.315mm
90micrometer
Pan

7/27/2019 Ball Milling Final Rep
http://slidepdf.com/reader/full/ball-milling-final-rep 22/32

7/27/2019 Ball Milling Final Rep
http://slidepdf.com/reader/full/ball-milling-final-rep 23/32
3) K= 3 S n = S n-1* (D n/Dn-1)3
a) Sieves 3.15mm , 1.3mm , 0.63mm
b) Sieves 315 m, 90 m and Pan (<90 m)
0.00%
10.00%
20.00%
30.00%
40.00%
50.00%
60.00%
70.00%
0 1 2 3 4 5
3.15mm
1.3mm
0.63mm
0.00%
0.20%
0.40%
0.60%
0.80%
1.00%
1.20%
0 1 2 3 4 5
0.315mm
90 micrometer
Pan

7/27/2019 Ball Milling Final Rep
http://slidepdf.com/reader/full/ball-milling-final-rep 24/32
4) K = 3.25 S n = S n-1* (D n/Dn-1)3.25
a) Sieves 3.15mm , 1.3mm , 0.63mm
b) Sieves 315 m, 90 m and Pan (<90 m)
0.00%
10.00%
20.00%
30.00%
40.00%
50.00%
60.00%
70.00%
0 1 2 3 4 5
3.15mm
1.3mm
0.63
0.00%
0.20%
0.40%
0.60%
0.80%
1.00%
1.20%
0 1 2 3 4 5
0.315mm
90 micrometer
Pan

7/27/2019 Ball Milling Final Rep
http://slidepdf.com/reader/full/ball-milling-final-rep 25/32
5) K = 3.5 S n = S n-1* (D n/Dn-1)3.5
a) Sieves 3.15mm , 1.3mm , 0.63mm
b) Sieves 315 m, 90 m and Pan (<90 m)
0.00%
10.00%
20.00%
30.00%
40.00%
50.00%
60.00%
70.00%
0 1 2 3 4 5
3.15mm
1.3mm
0.63mm
0.00%
0.20%
0.40%
0.60%
0.80%
1.00%
1.20%
0 1 2 3 4 5
0.315mm
90 micrometer
Pan
7/27/2019 Ball Milling Final Rep
http://slidepdf.com/reader/full/ball-milling-final-rep 26/32
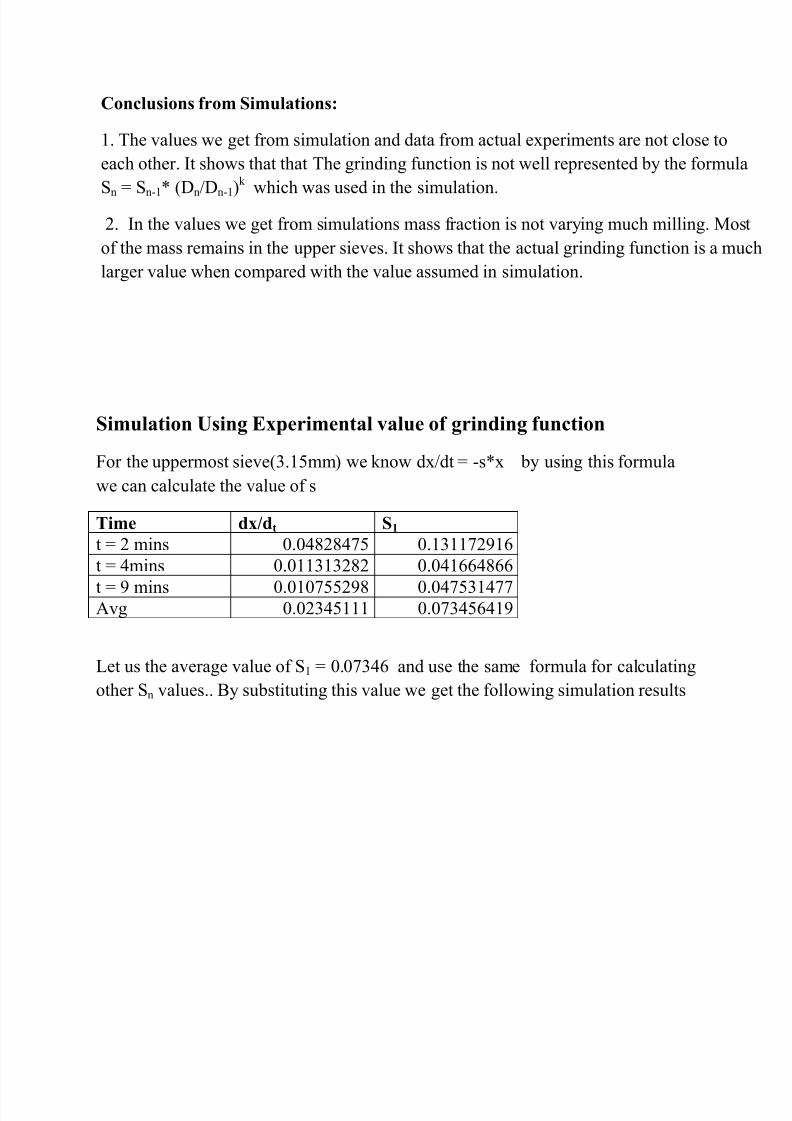
Conclusions from Simulations:
1. The values we get from simulation and data from actual experiments are not close toeach other. It shows that that The grinding function is not well represented by the formula
Sn = S n-1* (D n/Dn-1)k
which was used in the simulation.2. In the values we get from simulations mass fraction is not varying much milling. Most
of the mass remains in the upper sieves. It shows that the actual grinding function is a muchlarger value when compared with the value assumed in simulation.
Simulation Using Experimental value of grinding function
For the uppermost sieve(3.15mm) we know dx/dt = -s*x by using this formulawe can calculate the value of s
Time dx/d t S1 t = 2 mins 0.04828475 0.131172916t = 4mins 0.011313282 0.041664866
t = 9 mins 0.010755298 0.047531477Avg 0.02345111 0.073456419
Let us the average value of S 1 = 0.07346 and use the same formula for calculatingother S n values.. By substituting this value we get the following simulation results

7/27/2019 Ball Milling Final Rep
http://slidepdf.com/reader/full/ball-milling-final-rep 27/32
Sieve sizemm
dx/dt TIME t= 0 2 min 4 min 9 min
3.15 -0.027039308 36.81% 33.57% 23.83% 9.23%
1.3 -0.000881463 58.73% 50.62% 44.41% 31.13%
0.63 0.017361066 3.78% 5.86% 10.03% 23.40%
0.315 0.007259407 0.54% 3.31% 5.16% 6.02%
0.09 0.003182949 0.08% 2.46% 6.02% 9.94%
Pan0.001360901 0.07% 4.18% 10.56% 20.28%
0.00%
10.00%
20.00%
30.00%
40.00%
50.00%
60.00%
70.00%
0 2 4 6 8 10
m a s s
f r a c t i o n
time (min)
For k = 2.5
3.15mm
1.3mm
0.63 mm0.315 mm
0.09 mm
pan

7/27/2019 Ball Milling Final Rep
http://slidepdf.com/reader/full/ball-milling-final-rep 28/32
SIMULATED DATA
K = 2.75
Sieve size
mm
dx/dt Time t = 0
min
2 min 4 min 9 min
3.15 -0.027039308 36.81% 33.57% 27.08% 17.47%
1.3 0.000624302 58.73% 50.20% 44.83% 40.37%
0.63 0.016864769 3.78% 5.80% 9.85% 12.88%
0.315 0.006948068 0.54% 2.38% 3.04% 4.79%
0.09 0.003045457 0.08% 3.44% 7.17% 11.72%
Pan 0.001303342 0.07% 4.61% 8.03% 12.77%
FOR K =2.75
0.00%
10.00%
20.00%
30.00%
40.00%
50.00%
60.00%
70.00%
0 2 4 6 8 10
3.15mm
1.3mm
0.63mm
0.315mm
0.09mm
pan

7/27/2019 Ball Milling Final Rep
http://slidepdf.com/reader/full/ball-milling-final-rep 29/32
SIMULATED DATA
K = 3
Sieve size
mm
dx/dt initial t = 2min t = 4min t = 9min
3.15 -0.027039308
36.81% 33.57% 27.08% 22.21%
1.3 0.002004726 58.73% 42.77% 35.39% 24.81%
0.63 0.016451137 3.78% 5.75% 9.70% 12.65%
0.315 0.006646877 0.54% 7.34% 9.33% 9.13%
0.09 0.002516892 0.08% 4.38% 5.97% 11.43%
Pan0.001299153 0.07% 6.20% 12.53% 19.77%
0.00%
10.00%
20.00%
30.00%
40.00%
50.00%
60.00%
70.00%
0.00 2.00 4.00 6.00 8.00 10.00
m a s s
f r a c t i o n
time (min)
For K= 3.0
3.15mm
1.3mm
0.63 mm
0.315 mm
0.09 mm
pan

7/27/2019 Ball Milling Final Rep
http://slidepdf.com/reader/full/ball-milling-final-rep 30/32
SIMULATED DATA
K= 3.25
Sieve size
mm
dx/dt initial t = 2min t = 4min t = 9min
3.15 -0.027039308
36.81% 33.57% 27.08% 24.21%
1.3 0.00327024 58.73% 52.76% 49.26% 32.26%
0.63 0.016097879 3.78% 7.73% 9.61% 11.45%
0.315 0.006380955 0.54% 1.31% 2.87% 3.99%
0.09 0.002789972 0.08% 2.46% 3.62% 6.44%
Pan0.00119329 0.07% 1.74% 7.50% 21.24%
0.00%
10.00%
20.00%
30.00%
40.00%
50.00%
60.00%
70.00%
0.00 2.00 4.00 6.00 8.00 10.00
M a s s F r a c t i o n
time (min)
For k = 3.25
3.15mm
1.3mm
0.63 mm
0.315 mm
0.09 mm
pan

7/27/2019 Ball Milling Final Rep
http://slidepdf.com/reader/full/ball-milling-final-rep 31/32
SIMULATED DATA K = 3.5
Sieve size mm dx/dt 0 2 4 9
3.15 -0.027039308 36.81% 33.57% 27.08% 22.21%
1.3 0.004430411 58.73% 53.80% 48.03% 42.12%
0.63 0.015708448 3.78% 5.71% 9.56% 14.60%
0.315 0.006138414 0.54% 1.31% 3.81% 4.86%
0.09 0.002686536 0.08% 3.41% 5.02% 7.53%
Pan 0.001147412 0.07% 2.21% 6.50% 8.68%
For k= 3.5
0.00%
10.00%
20.00%
30.00%
40.00%
50.00%
60.00%
70.00%
0 2 4 6 8 10
3.15mm
1.3mm
0.63mm
0.315mm
0.09mm
pan

7/27/2019 Ball Milling Final Rep
http://slidepdf.com/reader/full/ball-milling-final-rep 32/32
Conclusion
The values obtained from simulation is comparable to experimentalvalues atleast in terms of general trends.
By comparing values obtained for different values of k we can concludethat for k=3 simulated and experimental values are highly comparable.So we can conclude that K =3 is the best possible value among the givenset of values.
Sources of Error:
There might be loss in the amount of sample as we keep transferring samplefrom and to ball mill for different intervals of time.
Even we use the digital weighing machine for measuring different samplesat different intervals of time and also D i is also assumed exact due to whichthere is an inherent error.
As particles gets finer and finer, during sieve analysis particles get struck inthe pores, due to which proper screening is not possible.