balancing virtual land imports by a shift in the diet ... - meier et al... · balancing virtual...
TRANSCRIPT

Appetite 74 (2014) 20–34
Contents lists available at ScienceDirect
Appetite
journal homepage: www.elsevier .com/locate /appet
Research report
Balancing virtual land imports by a shift in the diet. Using a land balanceapproach to assess the sustainability of food consumption. Germany asan example q
0195-6663/$ - see front matter � 2013 Elsevier Ltd. All rights reserved.http://dx.doi.org/10.1016/j.appet.2013.11.006
q Acknowledgements: We thank the German Environmental Foundation (DBU) andthe Max-Rubner Institute for supporting this research. Further, we thank Prof.Christian Barth of the University Potsdam and the three anonymous reviewers forconstructive feedback. This research was partially founded as a PhD scholarship bythe German Environmental Foundation (DBU).⇑ Corresponding author.
E-mail address: [email protected] (T. Meier).URLs: http://www.nutrition-impacts.org, http://www.landw.uni-halle.de (T.
Meier).
Toni Meier a,⇑, Olaf Christen a, Edmund Semler a, Gerhard Jahreis b, Lieske Voget-Kleschin c,Alexander Schrode d, Martina Artmann e
a Institute of Agricultural and Nutritional Sciences, University Halle-Wittenberg, Betty-Heimann-Str. 5, 06120 Halle (Saale), Germanyb Institute of Nutritional Sciences, University Jena, 07743 Jena, Germanyc Department of Philosophy, University Kiel, 24118 Kiel, Germanyd Environmental Policy Research Center (FFU), University Berlin (FU), 14195 Berlin, Germanye Department Geography and Geology, University Salzburg, 5020 Salzburg, Austria
a r t i c l e i n f o a b s t r a c t
Article history:Received 12 July 2013Received in revised form 25 October 2013Accepted 4 November 2013Available online 20 November 2013
Keywords:Virtual land importsLand takeDietary recommendationsFood losses/wastageEnvironmentally extended input–outputanalysisSustainable nutrition
Nutrition is considered as one of the main drivers of global environmental change. Dietary patterns inparticular, embedded in the international trade of foods and other biomass based commodities, deter-mine the dimension of beneficial or harmful environmental impacts of the agri-food sector – both domes-tically and abroad. In this study we analysed different dietary scenarios from a virtual land flowperspective, based on representative consumption data for Germany in the years 2006 and 1985–89. Fur-ther we identified the consumer groups that would have to adapt most to balance Germany’s virtual landimport and analysed the impact reduced food wastage. For the study, official data sets concerning pro-duction, trade and consumption were used. We derived land use data from environmentally extendedinput–output data sets and FAO statistics. The conversion of agricultural raw products to consumed com-modities is based on official processing and composition data. Subgroup-specific intake data from the lastrepresentative National Nutrition Survey in Germany were used. We analysed 42 commodities,aggregated into 23 product groups, seven land use types and six nutrition scenarios. The results showthat in the baseline scenario the average nutrition in the year 2006 leads to a virtual land import of707 m2 p�1 a�1, which represents 30% of the total nutrition-induced land demand of 2365 m2 p�1 a�1.On the other hand, the German agri-food sector exports virtual land, in the form of commodities, equiv-alent to 262 m2 p�1 a�1. In this paper we calculate that the resulting net import of virtual land could bebalanced by way of a shift to an officially recommended diet and a reduction in the consumption ofstimulants (cocoa, coffee, green/black tea, wine). A shift to an ovo-lacto-vegetarian or vegan diet wouldeven lead to a positive virtual land balance (even with maintained consumption of stimulants). Moreover,we demonstrate that a shift in the average diet profile could lead to maintained or even expanded exportcompetitiveness and simultaneously enable environmental benefits. Since such a diet shift complies withofficial dietary recommendations, it follows that public health benefits may well result. We show furtherthat a reduction of avoidable food losses/wastage would not be sufficient to level out the virtual land bal-ance of the average nutrition in Germany. Regarding the dietary developments in the last 20 years, weargue that a dietary shift resulting in a zero land balance is within reach. The population groups thatwould have to be addressed most are younger and middle-aged men. Nevertheless, women’s land savingpotentials should not be ignored neither. Due to the fact that a western-style diet prevails in Germany, weargue that our basic findings are applicable to other industrialised and densely populated countries.
� 2013 Elsevier Ltd. All rights reserved.
Introduction
In the current debate concerning land competition and largescale foreign land acquisitions (informally known as land grab-bing), international trade and thus trade in virtual land, in particu-lar trade flows to industrialised countries, are discussed as

T. Meier et al. / Appetite 74 (2014) 20–34 21
influencing factors on environmental degradation and societal dis-turbance in developing nations (EC, 2013; Lenzen et al., 2012;Pearce, 2012; Smith, Gorddard, House, McIntyre, & Prober, 2012).In the EU several proposals have been put forward to include inthe reform of the Common Agricultural Policy (CAP, 2014–2020)also measures to decrease Europe’s import dependency from cropswith a high land occupation abroad, mainly leguminous proteinplants (ARC, 2012; EP, 2011; WWF, 2011). Positive effects of reduc-ing the virtual land import encompass less environmental pressureon deteriorating ecosystems in main producer countries – e.g., Bra-zil, Argentina (EC, 2013; Fearnside, 2001; Lenzen et al., 2012; Mor-ton et al., 2006) – as well as positive equity effects in thesecountries, if corresponding land and nutrition policies are managedproperly (Lipton, 2009; Wahlqvist, McKay, Chang, & Chiu, 2012).
Furthermore, reducing virtual land import necessitates increas-ing domestic production of protein crops. In Germany the FederalMinistry of Food, Agriculture and Consumer Protection launcheda corresponding ‘Protein crops strategy’ (BMELV, 2012). This aimsat stimulating the domestic production of protein plants, namelysoya, beans, peas, lentils, lupines, chick peas, alfalfa/lucerne andclover, and thus at diminishing virtual land imports. Besides a re-duced import dependency doing so features further environmentalas well as economic benefits. In environmental terms, potentialbenefits result from inclusion of leguminous protein plants in croprotation (Crews & Peoples, 2004; Deike, Pallutt, Melander, Strasse-meyer, & Christen, 2008; Köpke & Nemecek, 2010; Nemecek et al.,2008; Sinclair & Vadez, 2012). Economic benefits are linked todecreasing dependency on volatile world market prices (Richtho-fen et al., 2006; Schäfer & Lütke Entrup, 2009) as well as the crea-tion of new income opportunities for European farmers throughmarketing of GMO-free products as part of a product qualityscheme (JRC EC, 2012). However, contra these arguments industryand business associations have expressed concerns that promotingthe domestic production of leguminous protein plants may pushthe production of established high-yield crops in Europe (mainlymaize, grains and oilseed rape) aside, leading to less productivityand competitiveness on the world market due to an underutilizedpotential of relative cost advantages (OVID, 2012; UECBV, 2012).
Finally, in so far as domestic production of protein crops cannotcompletely substitute current imports, reducing virtual land im-ports involves replacing consumption of animal protein (e.g. meat,milk, eggs) with consumption of plant protein. This, in particularthe reduction of red meat, comes along with positive health im-pacts, like a reduced chronic disease risk and a lower overall mor-tality (Aiking, Boer, & Vereijken, 2006; Belski et al., 2010; Darmadi-Blackberry et al., 2004; Fechner, Schweiggert, & Hasenkopf, 2011;Fleddermann et al., 2013; Messina, 2010; Weiße et al., 2010).
By applying a theoretical framework of sustainable develop-ment (SD) and inter-/intra-generational justice we reconsider theviews mentioned from a broader perspective and present a possi-ble solution, which combines their advantages while relativisingcorresponding criticism. SD globally functions as a leading rolemodel for shaping (future) development. However, besides thisgeneral agreement it is not at all evident what claims for SD actu-ally imply. In line with the Brundtland-definition we conceive ofSD as development ‘‘that meets the needs of the present withoutcompromising the ability of future generations to meet their ownneeds’’ (WCED, 1987). We understand this definition to encompasstwo kinds of claims (Voget-Kleschin, 2013):
� Direct claims for justice ask that all contemporary and futurehuman beings should be able to live a decent human life.� Indirect claims for justice encompass claims for a handling of
our social and natural environment that qualifies as not under-mining contemporary and future humans’ ability to live such adecent human life.
Thus conceptualizing sustainability allows framing the abovementioned arguments: Positive health effects, positive equity ef-fects as well as the economic benefits of reducing virtual land im-port can be framed as contributions towards meeting direct claimsfor justice. By contrast, a diminishment of productivity and com-petitiveness of European agriculture violates direct claims for jus-tice. Similarly, environmental degradation and societal disturbancelinked to virtual land ex- and imports violates indirect claims forjustice. By contrast, ecological benefits correspond to demandsfor avoiding negative repercussions on our natural and social envi-ronment and thus to indirect claims for justice. In terms of ourunderstanding of sustainability direct and indirect claims for jus-tice are equally important and mutually constraining each other.This means that a certain process or measure, such as promotionof domestic protein crops or an expanded export strategy does onlyqualify as contributing to SD if it contributes to meeting direct andindirect claims for justice.
In the study we calculated a net import of virtual land associ-ated with the current production and consumption patterns. Sim-ilar effects for Germany were also shown by Witzke, Noleppa, andZhirkova (2011) and for Europe by Steger (2005) and Sleen (2009).To the best of our knowledge, this study is the first to link dietaryrecommendations and dietary styles with virtual land flows on thebasis of a complete diet model. We propose a dietary regime allow-ing for a balanced trade of virtual land in Germany. Other studieswith a similar scope focused either on the current nutrition regimeand related environmental impacts in a particular country andabroad – for Switzerland Jungbluth, Nathani, Stucki, and Leuenber-ger (2011), for the Netherlands Gerbens-Leenes and Nonhebel(2005), for the Philippines Kastner and Nonhebel (2010) – or ana-lysed additionally the possible effects of different dietary changes –for the EU Tukker et al. (2011), for the US-state New York Peters,Wilkins, and Fick (2007), for Germany Wiegmann, Eberle, Fritsche,and Hünecke (2005) and Meier and Christen (2013). In contrast tothe study by Wiegmann et al. (2005), which is mainly based onenvironmental data from single-case studies (bottom-up), wecould use statistically more reliable data from representative sur-veys (top-down).
In contrast to Meier and Christen (2012a,b, 2013) we were ableto combine the production specific top-down data with represen-tative and subgroup-specific intake data, which allowed for a moredetailed assessment on the demand side. We show which popula-tion groups would have to adapt most to reach the land-balancedscenario in contrast to the dietary recommendations and dietarystyles. Further, we included the last published data concerningfood losses/wastage in the agri-food sector in Germany (Kranertet al., 2012) and investigated the corresponding impact on landrequirements and the virtual land balance. Finally, we extendedthe diet model by adding further products (cocoa, coffee, green/black tea, herbal tea, wine) and provide detailed feed compositiontables of related animal-based products (see supplementarymaterial).
Materials and methods
Virtual land versus the concept of the Ecological Footprint (EF)
Methodologically this paper refers to the virtual land approach.Allan (1993, 1994) initially developed the concept of virtual inputsfor water. The underlying concept is as follows: Any goods beingproduced require inputs (water, land etc.). The inputs used in pro-duction are considered as virtual inputs (virtual water, virtual landetc.). If the commodity is traded internationally, then the virtual in-put is also traded (Hoekstra, 2003; Witzke & Noleppa, 2012). Thisconcept should be distinguished from that of the ‘Ecological

22 T. Meier et al. / Appetite 74 (2014) 20–34
Footprint’ (Wackernagel, White, & Moran, 2004; Wackernagelet al., 2005). This methodology already includes an environmentalimpact assessment and uses a so-called ‘global hectare’ as a func-tional unit. This ‘global hectare’ is anaggregated impact indicator of various weighted inputs, therefore
normally resulting in higher values than those of the ‘virtual land’(Koellner & Sleen, 2011).
Methodological approach
The analytical part in this study is in line with the ISO standard14040/14044 (2006) concerning an attributional life cycle assess-ment (LCA). In contrast to this standard we considered just oneinventory indicator (land use) and did not perform an impactassessment. The following steps were completed: (i) goal andscope definition/system boundaries, (ii) life cycle inventory and(iii) life cycle interpretation. By using representative land use fac-tors from environmental-economic accounts, the method can bedescribed as an ‘environmentally extended input–output LCA’(Suh, 2003, see also section ‘land use factors’ below).
Goal
The goal of the study was to propose a diet that would, on amacro level in Germany, result in a reduction of the net virtual landimports to zero. To this end we analysed different dietary scenariosand compared the corresponding land demands with the area thatwould allow a balanced trade of virtual land. In a further step, pop-ulation subgroups were analysed according to gender and agegroups to determine their specific impact. Finally we analysedthe impact of avoidable food losses/wastage and its relevanceachieving a balanced trade of virtual land.
Scope (system boundaries)
We considered the agricultural land required to produce cropsfor direct human consumption, as feed and for usage in industryand the energy sector. Furthermore, we considered the areaneeded to produce the commodities’ packaging material. The areademand of other activities in the agri-food sector (bedding, hous-ing, manufacturing, trade) as well as in the consumption and wastestage of the products (dining-related space, sewage plants) wereomitted due to data gaps and a presumably negligible share inthe whole life cycle. Concerning aquatic foods (fish, shrimps, algaeetc.) solely the land requirements of terrestrial feeds used in aqua-culture production (mainly grains, soy) were taken into account.
Functional unit
On the product level, the functional unit refers to the areaneeded to produce 1 kg of product. On the diet level, the functionalunit refers to a diet with an energy uptake of 2121 kcal person�1 day�1.This energy uptake was calculated as weighted average meanbased on the average energy uptake of men with 2413 person�1 day�1
and women with 1833 person�1 day�1 in the age of 14–80 years(MRI, 2008).
Allocation
In accordance with the ISO standard 14040/14044 (2006), in thecase of co-product splitting (milk/meat, rapeseed oil/cake, sugar/molasses, etc.) we have applied an allocation based on the prod-ucts’ mass.
Life cycle inventory, intake and supply data
We analysed the inventory indicator land use, distinguishingbetween seven terrestrial land use categories: arable land (domes-tic/abroad), pastures (domestic/abroad), permanent culture(domestic/abroad) and forest (wood production for pallets, paperproduction for packaging material). Area requirements related toaquatic precincts (freshwater, marine water) were not consideredin the study. To determine the land demand of complete diets cor-responding intake amounts were decomposed to the level of 23main ingredients (food groups). These main ingredients were ad-justed by related supply amounts, documented in official food bal-ance sheets, and linked to commodity specific land use factors. Adetailed description of this approach and the algorithm appliedcan be found in Meier and Christen (2013). Data concerning thesupply/consumption amounts, the energy content and related datasources are provided in the supplementary material. In comparisonto Meier and Christen (2012a,b, 2013) the scope of the analysedproducts was extended by five stimulants (cocoa, coffee, black/green tea, herbal tea, wine) to cover whole diets more realistically.
Adjustment of the food groups analysed
In the assessment 42 different commodities were considered:10 animal-based foods, 14 plant-based foods and 18 feeds (Table 1).To enable a comparison of the diets in 2006 and in 1985–1989 withdietary recommendations (Table 2), these were aggregated into thefollowing 23 food groups (Table 3): dairy products (including but-ter, high-fat dairy products like cheese and cream, and low-fatdairy products like milk and yoghurt), meat products (includingpork, beef/veal, poultry, other meat), egg products, fish/shellfishproducts, grain products, vegetables, legumes, vegan milk prod-ucts, fruits, nuts and seeds, potato products, vegetal oils/margarineand sugar. Although entries concerning alcoholic beverages (beer,wine, spirits) as well as coffee, tea and cocoa do not exist in mostof the recommendations and diets, these product groups wereadditionally considered.
As far as statistically reliable information about the compositionof heterogeneous and complex food groups in the National Nutri-tion Surveys was available, the related food groups were takenapart and the raw products reallocated to the corresponding maingroup. This taking apart and reallocation was done in the case ofgrain products, vegetal oils/margarine, sugar/sweets as well as ofdrinks (beer, soft drinks, juices). To give an example: Besides breadand pasta, grain products include pastries and sweet bakery prod-ucts (and therefore sugar). In the year 2005/2006, to produce a to-tal of 8585 kt grain products 524 kt sugar was also used (BMELV,2009). In the mass flow matrix which underlies this study, these524 kt were taken from the grain products group and reallocatedto the product group ‘sugar, sweets’. Limitations are caused byingredients for which no statistically reliable information wasavailable (e.g., nut/seed usage in sweet bakery production).
Food losses, food wastage
In the literature ‘food losses’ refer to spoilage and weight losseson the producer level (on the farm and food industry level). To re-late to retailers’ and consumers’ behaviour, corresponding foodlosses at these stages in the supply chain are denominated as ‘foodwastage’. Further a distinction between avoidable and not-avoid-able food losses/wastage can be made (FAO, 2011; Lundquist, deFraiture, & Molden, 2008; Parfitt, Barthel, & Macnaughton, 2010).To analyse the land savings of avoidable food losses/wastage weused the last published data for the German agri-food sector (Kran-ert et al. 2012). Although food losses on farm level were not consid-ered due to lacks of statistical data, Kranert et al. (2012)

Table 1Degree of self-sufficiency and land use factors.
Highlighted in grey: Foods/feeds with a degree of self-suffociency far below 100%.1) For documentation of the feed composition of animal-based foods due to animal species see the supplemental material.2) Of land use relevance are solely Salmonidae products from aquaculture, which receive a plant-based diet according to Nielsen et al. (2003).3) Schmidt and Osterburg (2010)4) FAO Stat (2012)
T. Meier et al. / Appetite 74 (2014) 20–34 23

Table 2Dietary recommendations and dietary styles analysed.
Description Reference
Dietary recommendations D-A-CH (official nutrition recommendations for Germany, Austria and Switzerland) DGE (2008),SGE (2012)
UGB (alternative recommendations by the Federation for Independent Health Consultation with lessmeat, but more legumes and vegetables)
UGB (2011)
Dietary styles Ovo-lacto-vegetarian (plant-based diet with egg and milk products, without meat and fish) USDA, USDHHS(2010)
Vegan (totally plant-based diet, without meat, milk, fish and egg products and instead more fortifiedsoy-based milk products, more legumes, nuts and seeds
USDA, USDHHS(2010)
24 T. Meier et al. / Appetite 74 (2014) 20–34
distinguished between food losses in the food industry as well asfood wastage in the retail and catering sector and on householdlevel.
Imports, exports and degree of self-sufficiency
Due to the manifold trade relations of the German agri-foodsector it was impossible to include all imports and exports, includ-ing their related virtual land flows, in the assessment. Neverthe-less, to deal with this issue in a pragmatic manner we usedorigin-specific production data from FAO Stat (2012) for the year2003 for commodities where the degree of self-sufficiency is farbelow 100% (highlighted in grey in Table 1). The land use factorsshown were calculated as weighted average means using the cor-responding degree of self-sufficiency and related yields in domes-tic and/or foreign production. Although self-sufficiency for butterand egg products is also below 100%, we did not consider relatednet imports. We assume for the exporting countries (for butter:mainly Ireland and the Netherlands; for eggs: mainly the Nether-lands) the same production conditions as in Germany. Due to a lackof statistical information for fish and the composition of fish feedwe used the Danish LCA Food database (Nielsen, Nielsen, Weidema,Dalgaard, & Halberg 2003). The low self-sufficiency for oil cakes(mainly from soy and palm fruit) is considered indirectly in thefeed compositions and thus influences the net trade balance oflivestock products.
Land use factors
Based on the aforementioned points, related agrarian raw prod-ucts were converted into the area needed to produce them. ForGerman production, data were provided by the System of Environ-mental and Economic Accounting (SEEA, Schmidt & Osterburg,2010). Yields of imported products were provided according to ori-gin mainly by FAO Stat (2012) (for exceptions see details in Ta-ble 1). The reference year for both data sets was 2003.Concerning German production, both data sets are comparable asthey are based on the Farm Accountancy Data Network (FADN).For all European countries the FADN represents the main datacompiler of agricultural statistics. The land use factors of animal-derived foods were based on the feed composition data in Leipet al. (2010) – see supplementary material.
Table 1 gives an overview of the product groups analysed, thedegree of self-sufficiency and related land use factors.
Intake data for the year 2006, for 1985–89 and for the nutritionscenarios
Nutritional intake data for the years 1985–89 and the year 2006were provided by the two National Nutrition Surveys, NNS I andNNS II (Kübler, Balzter, Grimm, Schek, & Schneider, 1997; MRI,2008). Whereas the NNS I (1985–89) is based on a sample size of25,000 persons (4–94 years) in the former Federal Republic of West
Germany, the NNS II (2006) is based on a sample size of 19,000 per-sons (14–80 years) in the whole reunified Germany. While the NNSI was representative of 59 million people, the NNS II is representa-tive of 68 million people, or 83% of the total population. In this pa-per we focused on the results of the NNS II, but also refer to theNNS I for comparative purposes.
In the scenario analysis we compared the average nutrition pat-tern in the year 2006 with dietary recommendations and dietstyles. The following quantifiable food-related dietary profileswere examined (Table 2). In contrast to nutrient-based dietary rec-ommendations (NBDR), food-based dietary recommendations(FBDR) are more consumer-friendly and could be, if sufficientlydetermined (comprehensive, consistent and standardized productcategories), compared and analysed from a virtual land flow per-spective. Moreover FBDRs claim to be ‘‘developed in a specificsociocultural context, and [therefore] need to reflect relevant so-cial, economic, agricultural and environmental factors affectingfood availability and eating patterns.’’ (FAO, 1996).
Most of these recommendations do not feature entries concern-ing alcoholic beverages (beer, wine, spirits) as well as coffee, teaand cocoa. The DGE (2008) and USDA, USDHHS (2010) define anupper intake level of 10–20 g alcohol or 1–2 drinks person�1 day�1,respectively. In terms of wine this would result in an amount of125–250 grams person�1 day�1. As this is a recommendation foran upper intake level, deducing an average recommended level isarbitrary. To circumvent this discussion, we included wine (assource of alcohol) and the other stimulants in the analysis of thenutrition scenarios, assuming the same intake amounts of theseproducts as for the intake in the year 2006. With an average intakeof 39 grams wine person�1 day�1 this is a very conservative inter-pretation of the corresponding recommendation. Table 3 gives anoverview of the intake amounts analysed based on 2121 kcal per-son�1 day�1. For meat products in the scenarios of D-A-CH andUGB, we assumed the same composition according to animal spe-cies as in the year 2006. Although all diets and dietary scenarioswere based on an average daily supply of 2121 kcal p�1, the totalweight of the products varies considerably. In the case of theovo-lacto-vegetarian and vegan diet, these differences are mainlydue to the fact that the entry for milk and vegan milk productsin USDA, USDHHS (2010) refers to (vegan) milk equivalents. A gen-erally higher intake in the scenarios is also due to a higher intake ofvegetables and legumes. In comparison to 2006, the intake of fruitsin the scenarios is reduced. Intake amounts for juices, soft drinksand beer, which contain the fruit and sugar products consideredas well as barley (for beer production), were reallocated to the cor-responding group. Hops used in beer production were omittedfrom the assessment.
Determining a diet with a zero land balance
To determine the nutrition-related area that would ensure abalanced trade of virtual land (zero balance), we subtracted the ob-served imports from the land demand in the year 2006 and then

Table 3Intake amounts analysed, based on the average diet with 2,121 kcal person�1 day�1.
D-A-CH: official recommendations in Germany (D), Austria (A) and Switzerland (CH) (DGE, 2008).UGB: alternative recommendations of the Federation for Independent Health Consultation (UGB, 2011).a In whole milk equivalents (FPCM, fat 3.5%, protein 3.3%).b As the recommendations of D-A-CH & UGB recommend low-fat meat products a reduced energy content of 131 kcal 100 g-1 product was assumed.c If not indicated legumes are subsumed under vegetables.d In soya milk equivalents (fat 2.2%, protein 3.7%).e D-A-CH and UGB do not have quantifiable recommendations for nuts and seeds.
T.Meier
etal./A
ppetite74
(2014)20–
3425

26 T. Meier et al. / Appetite 74 (2014) 20–34
added the observed exports. Concerning imports, commoditieswith a non-nutritional purpose (industry, energy sector) were con-sidered separately. The following algorithm was applied.
AreaZLB ¼ areaintake 2006 � areaimports 2006ðfood;feedÞ
� areaimportsðindustry;energyÞ þ areaexports2006 ð1Þ
AreaZLB: Nutritional land demand with a zero land balance.Areaintake 2006 = Area needed for nutritional purposes in 2006.Areaimports 2006 (food, feed) = Area needed abroad for nutritionalpurposes in 2006.Areaimports (industry, energy) = Area needed abroad for non-nutri-tional purposes in 2006.Areaexports 2006 = Area domestically used for exports in 2006.
Results
Figure 1 gives an overview of the considered land use and landuse flows relating to the German agri-food sector in the year 2006.The total human consumption leads to an area use of 194,600 km2,mainly due to the consumption of animal-based foods like meatand dairy products (69%). The consumption of plant-based prod-ucts accounted for 31% of the area needed. The industry and energysectors depended on 19,800 km2. Taking all net trade flows to-gether they result in a virtual land import of 64,100 km2 and a vir-tual land export of 21,600 km2. From the perspective of virtual landimports it is necessary to distinguish between land imports for hu-man consumption via plant-based and animal-based products(accounting for 58,200 km2) and land imports for the industryand energy sectors (accounting for 5900 km2). If both these virtualimport flows are considered and the virtual land export subtracted,the net balance of the German agri-food sector results in an area of42,500 km2 of land that was virtually imported as a result ofdomestic consumption.
The virtual land imports are related to following commodities:feed (37% – incl. 29% for soy-derived products, 1% for palm cake, 7%for other feed), vegetal oils/fats (21% – incl. 7% for soy oil, 5% forrape oil, 3% for palm oil, 6% for other oil), fruits (13%), cocoa(10%), coffee (8%), vegetables (4%), wine (3%), nuts/seeds (1%) andother products (3%). Imported and domestically consumed soyproducts accounted for 36% of all imports alone, correspondingto a land use of 22,900 km2 or 278 m2 p�1 a�1 (82% as soy cakeand oil as feed and 18% as oil for human consumption).
The virtual net land exports were composed of grain products(62%), milk products (17%), meat products (10%), sugar (8%) andother products (3%).
Feed export accounts for a virtual land export of 2900 km2
(Fig. 1). This number is based on the official feed statistics for theyear 2006 (BMELV, 2009). Nevertheless it could not be ruled outthat commodities considered in the main export flow may alsobe used as feed in foreign countries.
A balanced diet in comparison with nutrition scenarios
Figure 2 gives an overview of the aforementioned land use andland use flows in the year 2006 in comparison with the land de-mand of the nutrition scenarios analysed. To determine the nutri-tion-related area necessary to ensure a balanced trade of virtualland, the land demand of the intake in the year 2006 was adjustedbased on the observed imports and exports. Regarding imports,commodities with a non-nutritional purpose (for the industryand energy sectors) were considered separately (formula (1)).
The resulting area of 152,100 km2 represents the nutrition-re-lated land demand that would allow a balanced trade of virtualland. Compared with the nutrition scenarios, the diet closest to thisboundary would be a diet in between the recommendation of the
UGB and an ovo-lacto-vegetarian one. A diet in accordance withthe recommendations of D-A-CH would result in a higher land de-mand. Just an ovo-lacto-vegetarian and in particular a vegan dietwould result in a positive land balance, leading to domestic netland savings.
Is such a diet achievable?
To answer the question of whether shifting an entire country’spopulation to a diet with an equated land balance is achievable, weanalysed food and beverage intake in the years 1985–89 equallyfrom a land use perspective. Levelled on the average energy intakeof 2121 kcal p�1 d�1, which was also applied for the year 2006 andin the scenarios, we calculated an average nutrition-induced landdemand of 2686 m2 p�1 a�1. That is 320 m2 or 14% higher thanthe land use of the average diet in the year 2006 (Fig. 3). AsFig. 4 shows, this decline is mainly due to a decreased consumptionof beef and veal compared to 1985–89. This decrease was partlycompensated by an increase in the consumption of dairy products,fruits, vegetables and grain products as well as cocoa and wine.
For the conversion of the consumed products into land-equiva-lents we assumed the same land use factors and degrees of self-sufficiency as were used for the year 2006 (Table 1). Taking yieldgains and a rise in production efficiencies within the last 20 yearsin the German agricultural sector into consideration, the land de-mand for nutrition in the years 1985–89 could be even higher.Nevertheless, the effects of efficiency improvements have not beenanalysed in this study.
Summarised, the results show that within 20 years a shift in theaverage diet led to a significantly lower land demand of at least14%. To achieve the nutrition-related land demand which wouldensure a balanced trade flow of virtual land, a further reductionof 22% would be necessary (from 2365 m2 p�1 a�1 to 1848 m2 p�1 a�1,Fig. 3) Taking dietary developments within the last 20 years intoaccount, we argue that such a shift is possible. The main questionsarising from this reduction gap are as follows:
(1) Which population groups would need to change their nutri-tion most to reach a diet that would allow an equated landbalance?
(2) Could an equated land balance also be reached by takingpossible food waste reductions into account?
(3) Which measures would be applicable to reach the aspiredgoal more quickly?
The first and the second question will be answered in the fol-lowing. Answering the third question was not part of this study,but this topic and related implications will be briefly addressedin the conclusions.
Population groups
For this working step we used subgroup-specific intake datafrom the National Nutrition Survey II (NNSII, MRI, 2008) and ana-lysed the related land demand with the same method. The only dif-ference was that we used age group-specific energy intakes on thebasis of the documented intake amounts. The related land use inthe year 2006 was compared with the related ones of the dietaryrecommendations (D-A-CH, UGB) and dietary styles (ovo-lacto-vegetarian, vegan). In another step the results were extrapolatedon a national level based on the population in the correspondingage groups in the year 2006 (Destatis, 2007). The distribution ofthe age groups was provided by the NNS II (MRI, 2008). In Table 4and Fig. 5 we show the land area that would be freed up if thenutritional behaviour in the age groups would be in accordancewith the official recommendations or diet styles. Here, it is

Fig. 1. Land use of Germany’s food supply in the year 2006 (in km2).
Fig. 2. Nutrition-related land demand of the intake in 2006 and of different dietary scenarios (incl. the area with a zero land balance) according to land use types.
T. Meier et al. / Appetite 74 (2014) 20–34 27
necessary to bear in mind that the age span analysed (14–80 yrs)represents just 83% of the total population. Therefore the sum ofthe potential land savings is lower than in Fig. 2. As the intake ofcocoa, coffee, tea and wine was assumed to be the same in the sce-narios as in the year 2006, related entries do not appear in Fig. 5.For meat products, the same composition according to animal spe-cies was assumed in the scenarios as in the year 2006.
The results show that in all scenarios the highest land-savingpotentials exist by shifting the average diets of younger and mid-dle-aged men. Compared across all age groups, men’s land-savingpotentials are roughly twice as high as women’s.
The role of food losses/wastage
For answering the question whether possible food waste reduc-tions would be sufficient to balance Germany’s trade of virtualland, we used data from Kranert et al. (2012). Based on a compre-hensive data analysis of the German agri-food sector Kranert et al.(2012) calculated per person and year an avoidable amount of foodlosses/wastage of 105.3 kg – including 22.5 kg in the food industry,6.7 kg in the retail sector, 23.1 kg in the catering sector and 53.1 kgon household level. Applying this data and corresponding landrequirements to the scenarios analysed in this study the diet re-

Fig. 3. Nutrition-related land demand of the intake in 1985–89, 2006 and of different dietary scenarios according to land use types.
Fig. 4. Nutrition-related land demand of the intake in 1985–89, 2006 and of different dietary scenarios according to food groups.
28 T. Meier et al. / Appetite 74 (2014) 20–34
lated land demand would decrease by 13% – intake 2006: from2365 to 2059 m2 p�1 a�1, D-A-CH: from 2013 to 1753 m2 p�1 a�1,UGB: from 1944 to 1693 m2 p�1 a�1, ovo-lacto-vegetarian: from1707 to 1486 m2 p�1 a�1, vegan: from 1331 to 1158 m2 p�1 a�1.
The results show, taking possible land savings by reduced foodlosses/wastage into account, that besides the ovo-lacto-vegetarianand vegan diet also the recommendations of D-A-CH and UGBwould lead to a positive virtual land balance. A reduction of foodlosses/wastage, regarding the average nutrition in the year 2006(scenario ‘intake 2006’) with 2059 m2 p�1 a�1, would not be en-ough to reach the goal of 1848 m2 p�1 a�1, a diet resulting in a bal-anced trade of virtual land.
Discussion
In this study national and international land use statistics werecombined with representative trade and consumption data relatingto the German agri-food sector as well as representative subgroup-
specific intake data in the year 2006. In this section we compareour results with the outcomes of other studies and discuss the lim-itations of the method applied.
Comparison to other studies
Taking different approaches, reference years and referencecountries into consideration, our results are comparable to thosefrom other, similar studies. Wiegmann et al. (2005) calculated anaverage land demand of nutrition in Germany in the year 2000to be 2396 m2 p�1 a�1. The difference to the 2365 m2 p�1 a�1 wedetermined could be explained by the fact that Wiegmann et al.used different production data (referring to the years 1990–2000), their reference year was 2000 and the approach was a clas-sical bottom-up LCA. A distinction between foreign and domesticland use was not made.
On a three-year basis (2008–10) Witzke et al. (2011) calculateda virtual land import of 79,700 km2 a�1 for Germany, including

Table 4Energy intake, land use and related land savings in population groups.
T. Meier et al. / Appetite 74 (2014) 20–34 29
25,800 km2 for soy products, 11,200 km2 for cocoa, 10,800 km2 forcoffee, 1900 km2 for cotton and 400 km2 for tobacco. Besides thefact that in our study cotton and tobacco were not considered,the difference compared to 64,100 km2 – the virtual land importthat we determined in this study – could be explained by a smallerarea needed to produce the domestically consumed soy products(22,700 km2), cocoa (6600 km2) and coffee (5000 km2) as well asdifferent reference years. An increased import of virtual land in2008–10 might be attributable to the fact that in recent years Ger-many’s production capacities for meat products have been succes-
sively expanded (with an increased demand for feeds). In 2006 thesupply of meat products reached a self-sufficiency level of 100% forthe first time since 1961. From this point onwards production andexport capacities were expanded continuously, amounting up to adegree of self-sufficiency of 113% in the last documented year 2010(BMELV, 2011; FAO Stat, 2012). On an individual level, for meatconsumption in the years 2008–10 Witzke et al. (2011) calculateda land use of 1,030 m2 p�1 a�1. Taking only meat products into ac-count we calculated 953 m2 p�1 a�1 for the year 2006. This differ-ence could be explained by a slightly higher consumption of
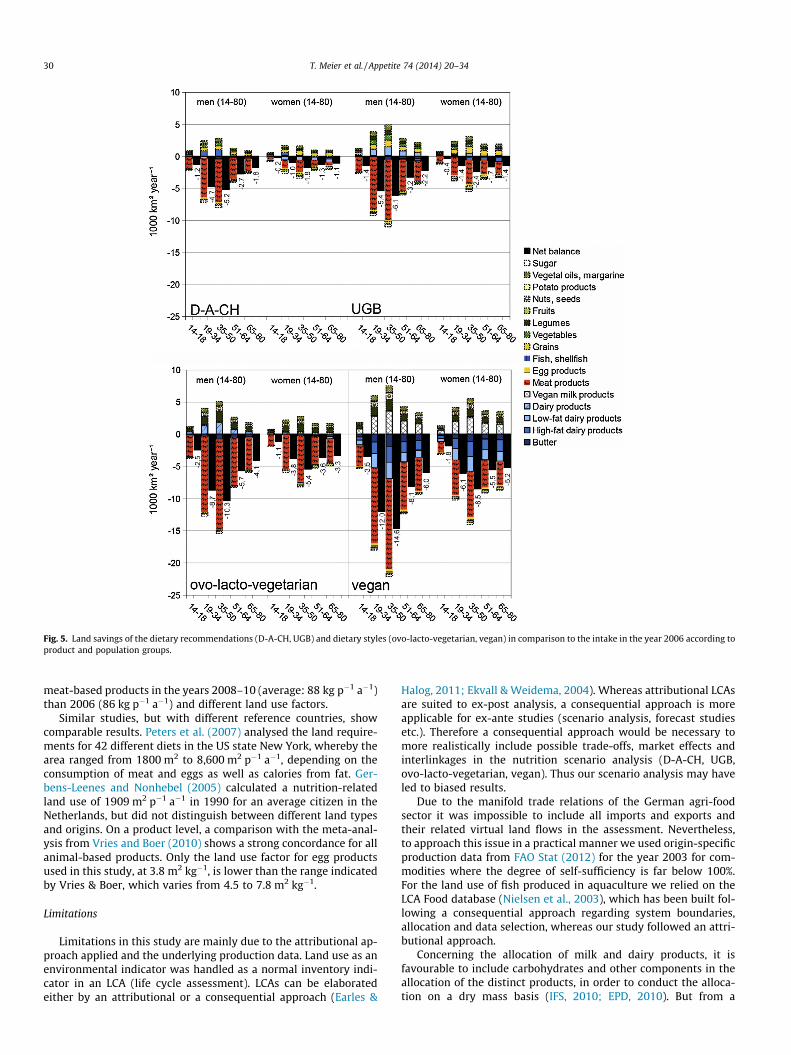
Fig. 5. Land savings of the dietary recommendations (D-A-CH, UGB) and dietary styles (ovo-lacto-vegetarian, vegan) in comparison to the intake in the year 2006 according toproduct and population groups.
30 T. Meier et al. / Appetite 74 (2014) 20–34
meat-based products in the years 2008–10 (average: 88 kg p�1 a�1)than 2006 (86 kg p�1 a�1) and different land use factors.
Similar studies, but with different reference countries, showcomparable results. Peters et al. (2007) analysed the land require-ments for 42 different diets in the US state New York, whereby thearea ranged from 1800 m2 to 8,600 m2 p�1 a�1, depending on theconsumption of meat and eggs as well as calories from fat. Ger-bens-Leenes and Nonhebel (2005) calculated a nutrition-relatedland use of 1909 m2 p�1 a�1 in 1990 for an average citizen in theNetherlands, but did not distinguish between different land typesand origins. On a product level, a comparison with the meta-anal-ysis from Vries and Boer (2010) shows a strong concordance for allanimal-based products. Only the land use factor for egg productsused in this study, at 3.8 m2 kg�1, is lower than the range indicatedby Vries & Boer, which varies from 4.5 to 7.8 m2 kg�1.
Limitations
Limitations in this study are mainly due to the attributional ap-proach applied and the underlying production data. Land use as anenvironmental indicator was handled as a normal inventory indi-cator in an LCA (life cycle assessment). LCAs can be elaboratedeither by an attributional or a consequential approach (Earles &
Halog, 2011; Ekvall & Weidema, 2004). Whereas attributional LCAsare suited to ex-post analysis, a consequential approach is moreapplicable for ex-ante studies (scenario analysis, forecast studiesetc.). Therefore a consequential approach would be necessary tomore realistically include possible trade-offs, market effects andinterlinkages in the nutrition scenario analysis (D-A-CH, UGB,ovo-lacto-vegetarian, vegan). Thus our scenario analysis may haveled to biased results.
Due to the manifold trade relations of the German agri-foodsector it was impossible to include all imports and exports andtheir related virtual land flows in the assessment. Nevertheless,to approach this issue in a practical manner we used origin-specificproduction data from FAO Stat (2012) for the year 2003 for com-modities where the degree of self-sufficiency is far below 100%.For the land use of fish produced in aquaculture we relied on theLCA Food database (Nielsen et al., 2003), which has been built fol-lowing a consequential approach regarding system boundaries,allocation and data selection, whereas our study followed an attri-butional approach.
Concerning the allocation of milk and dairy products, it isfavourable to include carbohydrates and other components in theallocation of the distinct products, in order to conduct the alloca-tion on a dry mass basis (IFS, 2010; EPD, 2010). But from a

T. Meier et al. / Appetite 74 (2014) 20–34 31
statistical point of view sugar/carbohydrates contents are notavailable for all dairy products on national level (BLE, 2010). There-fore the allocation applied in this study was conducted accordingto the monitored fat and protein content of the different dairyproducts. A detailed description of this method can be found inMeier and Christen (2012a).
Although different intake, consumption and supply data wereused, for the years 1985–1989 the same production conditions(and therefore production efficiencies) as well as the same importshares and import countries were assumed as for the year 2006.Furthermore, it must be recalled that the basic population of bothNational Nutrition Surveys (NNS) was adjusted to the same agegroup (14–80 years), but that the first NNS (1985–1989) was com-piled in the former West Germany – with just 80% of the total Ger-man population (Destatis, 2007). Therefore the specificity of foodconsumption in the former East Germany was not considered inthe comparison. Besides the fact that specific intake data for theEast were not available, the official supply data vary dependingon the food group considered. Whereas the consumption of ani-mal-derived products (exception: fish) and margarine was almostequal, the consumption of grain products and potatoes was higherand the consumption of fruits was lower in the East. Nonetheless,due to methodological differences the comparability of the supplydata of both countries is limited. Presumably the actual consump-tion of grain products and potatoes in the East was lower, sincetheir usage as feed was included in the food consumption (Karg,Gedrich, & Steinel, 1996).
Nuts and seeds were omitted in the scenario analysis of the rec-ommendations (D-A-CH, UGB), since related recommendations donot exist.
Besides dietary shifts a reduced land use in the year 2006 ascompared to 1985–89 can be explained by further reasons: As de-scribed in Meier and Christen (2013) from a land use perspectivealterations in food losses/wastage in 2006, as compared to 1985–89, were of minor relevance. Nevertheless, related effects wereimplicitly considered in this study. The impact of efficiency gainswas not considered due to the challenging task of modelling prop-erly the technical status of the agri-food sector in the years 1985–89. Therefore for the years 1985–89 the same production condi-tions were assumed as for the year 2006. Taking yield gains anda rise in production efficiencies within the last 20 years in the Ger-man agricultural sector into consideration, the land demand for thenutrition in the years 1985–89 could be even higher. A third drivermight be due to demographical reasons. For the group of the14–80 years-old, official demographical data show an arithmeticaverage age of 42.6 years in 1985–89 compared to 45.3 years in2006 (Destatis, 2007). Thus, within 20 years the population grewroughly three years older. To what extent this influences the re-sults was not quantified. If a declining intake of land use intensiveproducts (mainly meat, dairy products) is assumed, this could leadto an overestimation of the achieved land use savings in 2006,compared to 1985–89.
Conclusions
In this study we show that in the year 2006 as a result ofdomestic consumption Germany virtually imported an additionalarea of 42,500 km2, mainly used abroad for the production of soybased products, fruits, cocoa, coffee and vegetables. This roughlyequals 30% of the agricultural area domestically available. As dis-cussed in the introduction, such virtual land imports are stronglylinked to negative social and environmental repercussions andthus violates claims for sustainable development (SD), namelyindirect claims for justice. Accordingly, balancing virtual land tradecontributes to SD. However, this only holds in so far as such bal-ancing does not result in significant economic disadvantages which
could be conceived as violating direct claims for justice. In this re-gard, we presented different strategies for coping with virtual landimports, import dependency and export competitiveness. We dem-onstrated that a diet shift allows achieving the ecological benefitsof a protein crop strategy such as less virtual land imports and astronger pronunciation of protein plants in the domestic crop rota-tion while concurrently maintaining or even expanding exportcompetitiveness. Furthermore, such a dietary shift would bemostly in accordance with recommendations, and would thereforelead to public health gains (though this was not considered explic-itly in the study). Such health benefits can in turn be conceived as afurther contribution towards meeting direct claims for justice. Weshow further that a reduction of avoidable food losses/wastagewould not be sufficient to level out the virtual land balance ofthe average nutrition in Germany. We therefore conclude that acombination of all measures – the promotion of the domestic pro-duction of leguminous protein plants, a broader encouragement ofconsumers to increase consumption of plant protein whiledecreasing consumption of animal protein as well as a stronger ef-fort to decrease food losses/wastage - constitutes a valuable andnecessary contribution towards more sustainable food productionand consumption.
However, we need to highlight two important caveats:First, an evaluation from a sustainability perspective needs to
take into account how a dietary shift could be institutionallyimplemented (Eyles, Ni Mhurchu, Nghiem, Blakely, & Stuckler,2012; Reisch, Lorek, & Bietz, 2011). Instruments that directly orindirectly increase prices of animal products could be especiallyeffective (Caraher & Cowburn, 2005; Schösler, de Boer, & Boersema,2012; Wirsenius, Hedenus, & Mohlin, 2011). However, there is stillneed for comprehensive research about combinations, legitimacyand design of such measurements (Cash & Lacanilao, 2007; Dellav-a, Bulik, & Popkin, 2010; Mytton, Clarke, & Rayner, 2012). With re-gard to consumer groups, the largest environmental benefitsexpected would result in altered consumption patterns mainly ofyounger and middle-aged men. Nevertheless, women’s land savingpotentials should not be ignored neither. In further studies, it maybe of interest to investigate which instruments are most applicablefor addressing individual consumer groups specifically. From a sus-tainability perspective, the issue of legitimacy is especially impor-tant, because to contribute to sustainable development measuresaiming at dietary changes themselves need to avoid violating di-rect claims of justice (Voget-Kleschin, 2012, in press). This meansthey should allow citizens to participate in creating and shapingadequate policy measures.
Second, to set Germany’s virtual import of land to zero, the con-sumption of imported stimulants, like cocoa, coffee, tea (FAO Stat,2012), and wine would need to be taken into account. From a landuse perspective, the consumption of cocoa and coffee products ismost relevant. To level out the land balance using a diet basedon the recommendations (D-A-CH, UGB), the consumption of stim-ulants and wine may have to be cut by half. In Germany, a positivevirtual land balance would be reached if the population shifted toan ovo-lacto-vegetarian or a vegan diet (even if consumption ofstimulants was maintained). Clinical studies have shown that witha well-balanced ovo-lacto vegetarian diet no adverse public healtheffects are expected (ADA, 2009; Temme et al., 2013; USDA,USDHHS, 2010). Conversely, an ovo-lacto vegetarian diet is associ-ated with a decreased prevalence of adiposity, hypertonia, strokeand type 2 diabetes (Craig, 2010) as well as a lower all-cause mor-tality (Orlich et al., 2013). By contrast, a purely vegan diet, whichwould be most beneficial in land use terms, could lead to an insuf-ficient supply of essential nutrients, like vitamin B12, iron calcium,zinc, iodine (DGE, 2011; Dror & Allen, 2008; Millward & Garnett,2010). Finally, nutritional studies have shown that an increased in-take of stimulants (cocoa, coffee, tea, wine) is beneficial from a
32 T. Meier et al. / Appetite 74 (2014) 20–34
health perspective (Corti, Flammer, Hollenberg, & Luscher, 2009;Guilford & Pezzuto, 2011; Higdon & Frei, 2003, 2006). Consideringthis, it might be interesting for further studies to investigate,whether from a health perspective a meat-including diet with a re-stricted intake of stimulants is preferable or a vegetarian diet withan increased intake of stimulants. Generally, if diet shifts are pur-sued politically, then research should focus on broad and compre-hensive health impact assessments to ensure that alterations indiets do not lead to disadvantageous side effects. Particular atten-tion and further research should focus on potentially undernour-ished subgroups (such as toddlers, children, pregnant women,sick people, the elderly, etc.).
A reduction of avoidable food losses/wastage represents an-other way to balance the trade of virtual land. This approach ap-plied to the recommendations of D-A-CH and UGB would allow,besides the ovo-lacto-vegetarian and vegan diet, also a positivebalance of virtual land. Nevertheless, in case of the average diet(scenario ‘intake 2006’), a reduction of avoidable food losses/wast-age would not suffice to level out the virtual land balance.
Besides lower virtual land imports, described dietary changeswould lead to significant domestic land savings, too. These areascould be used for (i) the intensified cultivation of energy crops,(ii) feed production for the increased export of meat and dairyproducts, (iii) a more extensive cultivation of food for direct humanconsumption, or (iv) forestry. They could also be (v) set aside forcompletely natural development. Choosing between these optionsis ultimately a political task. On the other hand, a diminished pres-sure on foreign countries by a balanced trade of virtual land with adecreased import dependency, not automatically leads to the dis-appearance of negative social and environmental repercussionsin this countries. To address them necessitates effective policies– like land reforms but also nutrition and environmental policies– that are pro-poor, connecting community and household food-based strategies with fair distribution schemes of property rightsand a regulated access to natural resources (Lipton, 2009; Wahlq-vist et al., 2012).
Finally, to stabilize a reduced import dependency on the longterm national and European initiatives dealing with the mitigationof soil sealing by settlement and industry expansion must be takenmore thoroughly into account (EC, 2012). Prokop, Jobstmann, andSchönbauer (2011) analysed that in the EU detected land take be-tween 1990 and 2006 was around 1000 km2 a�1 (or 275 ha d�1). Inthis period, the total settlement area increased by 9%, while thepopulation increased by only 5% (the so called ‘paradox of decou-pled land take’). Land takes on agricultural soils are most relevantin Spain, France, Germany and Italy, varying from 20 to 50 ha d�1
(Gardi, Panagos, Bosco, & Brogniez, 2012). However, no quantita-tive goals exist on EU level nor in most member states. By contrast,in 2002 Germany committed to decrease the daily rate of built-uparea and transport infrastructure expansion to 30 ha d�1 in 2020(FG, 2002). In 2010, the last documented year, an area of 77 ha d�1
was affected by soil sealing. The corresponding progress report ofthe Federal Government (FG, 2012) states that ‘‘Continuing theaverage annual trend of the last few years would, however, stillnot be sufficient to reach the proposed reduction goal by 2020.’’
Appendix A. Supplementary material
Supplementary data associated with this article can be found, inthe online version, at http://dx.doi.org/10.1016/j.appet.2013.11.006.
References
ADA (2009). Position of the American Dietetic Association. Vegetarian diets. Journalof the American Dietetic Association, 109(7), 1266–1282.
Aiking, H., Boer, J., & Vereijken, J. (2006). Sustainable protein production andconsumption. Pigs or Peas? Environment & policy. Netherlands, Dordrecht:Springer.
Allan, J. (1993). Fortunately there are substitutes for water otherwise our hydro-political futures would be impossible (pp. 13–26).
Allan, J. (1994). Overall perspectives on countries and regions. In P. Rogers, P. Lydon,(Eds.), Water in the Arab world. Perspectives and prognoses (pp. 65–100).
ARC (2012). ARC2020’s reaction to the EU Commission’s legislative proposals for thefuture CAP. Agricultural and Rural Convention 2020 (ARC), Brussels.
Belski, R., Mori, T. A., Puddey, I. B., Sipsas, S., Woodman, R. J., Ackland, T. R., et al.(2010). Effects of lupin-enriched foods on body composition and cardiovasculardisease risk factors. A 12-month randomized controlled weight losstrial. International Journal of Obesity and Related Metabolic Disorders, 35(6),810–819.
Birgersson, S., Karlsson, B.-S., & Söderlund, L. (2009). Soy Milk. An attributional LifeCycle Assessment examining the potential environmental impact of soy milk.Sweden: KTH Royal Institute of Technology.
BLE (2009). Anlandungen, Einfuhr und Konsum von Fisch nach Fischarten 2006.Bundesanstalt für Landwirtschaft und Ernährung (BLE), Bonn, Germany.
BLE (2010). Marktordnungswaren-Meldeverordnung der Milchwirtschaft.Bundesanstalt für Landwirtschaft und Ernährung (BLE), Bonn, Germany.
BMELV (2009). Statistical yearbook on food, agriculture and forestry of the FederalRepublic of Germany 2009 (Vol. 53). Federal Ministry for Food, Agriculture andConsumer Protection, Bonn, Germany.
BMELV (2011). Statistical yearbook on food, agriculture and forestry of the FederalRepublic of Germany 2011 (Vol. 55). Federal Ministry for Food, Agriculture andConsumer Protection, Bonn, Germany.
BMELV (2012). Eiweißpflanzenstrategie des BMELV. Federal Ministry for Food,Agriculture and Consumer Protection, Berlin, Germany.
Caraher, M., & Cowburn, G. (2005). Taxing food. Implications for public healthnutrition. Public Health Nutrition, 8(8), 1242–1249.
Cash, S., & Lacanilao, R. (2007). Taxing food to improve health. Economic evidenceand arguments. Agricultural and Resource Economics Review, 36(2), 174–182.
Corti, R., Flammer, A. J., Hollenberg, N. K., & Luscher, T. F. (2009). Cocoa andcardiovascular health. Circulation, 119(10), 1433–1441.
Craig, W. J. (2010). Nutrition concerns and health effects of vegetarian diets.Nutrition in Clinical Practice, 25(6), 613–620.
Crews, T., & Peoples, M. (2004). Legume versus fertilizer sources of nitrogen.Ecological tradeoffs and human needs. Agriculture, Ecosystems & Environment,102(3), 279–297.
Darmadi-Blackberry, I., Wahlqvist, M. L., Kouris-Blazos, A., Steen, B., Lukito, W.,Horie, Y., et al. (2004). Legumes. The most important dietary predictor ofsurvival in older people of different ethnicities. Asia Pacific Journal of ClinicalNutrition, 13(2), 217–220.
Deike, S., Pallutt, B., Melander, B., Strassemeyer, J., & Christen, O. (2008). Long-termproductivity and environmental effects of arable farming as affected by croprotation, soil tillage intensity and strategy of pesticide use. A case-study of twolongterm field experiments in Germany and Denmark. European Journal ofAgronomy, 29(4), 191–199.
Dellava, J. E., Bulik, C. M., & Popkin, B. M. (2010). Price changes alone are notadequate to produce long-term dietary change. Journal of Nutrition, 140(10),1887–1891.
Destatis (2007). Bevölkerung und Erwerbstätigkeit, Bevölkerungsfortschreibung 2006,Fachserie 1, Reihe 1.3. Statistisches Bundesamt, Wiesbaden.
DGE (2008). Vollwertig essen und trinken nach den 10 Regeln der DGE (23rd ed.). AidInfodienst und Deutsche Gesellschaft für Ernährung DGE, Bonn.
DGE (2011). Vegane Ernährung. Nährstoffversorgung und Gesundheitsrisiken imSäuglings-und Kindesalter. DGE-Info 04/2011. Deutsche Gesellschaft fürErnährung, Bonn.
Dror, D. K., & Allen, L. H. (2008). Effect of vitamin B12 deficiency onneurodevelopment in infants. Current knowledge and possible mechanisms.Nutrition Reviews, 66(5), 250–255.
Earles, J. M., & Halog, A. (2011). Consequential life cycle assessment. A review.International Journal of Life Cycle Assessment, 16(5), 445–453.
EC (2012). Guidelines on best practice to limit, mitigate or compensate soil sealing.European Commission, Luxembourg (ec.europa.eu/environment/soil/pdf/soil_sealing_guidelines_en.pdf).
EC (2013). The impact of EU consumption on deforestation. Comprehensive analysisof the impact of EU consumption on deforestation. Final report, Technical report –2013-063. European Commission, Brussels.
Ekvall, T., & Weidema, B. P. (2004). System boundaries and input data inconsequential life cycle inventory analysis. International Journal of Life CycleAssessment, 9(3), 161–171.
EP (2011). The EU protein deficit. What solution for a long-standing problem? (2010/2111(INI)). Report. Committee on Agriculture and Rural Development of theEuropean Parliament, Brussels.
EPD (2010). Product category rules. Processed liquid milk (CPC Class 2211, PCR2010:12). The international EPD system, Sweden.
Eyles, H., Ni Mhurchu, C., Nghiem, N., Blakely, T., & Stuckler, D. (2012). Food pricingstrategies, population diets, and non-communicable disease. A systematicreview of simulation studies. PLoS Medicine, 9(12), 1–22.
FAO (2011). Global food losses and food waste. Extent, causes and prevention. Foodand Agriculture Organization of the UN, Rome.
FAO Stat (2012). FAO Statistics database, production, trade, supply. Food andAgriculture Organisation of the UN (FAO), Rome <http://faostat.fao.org/default.aspx>.

T. Meier et al. / Appetite 74 (2014) 20–34 33
FAO, WHO (1996). Preparation and use of food-based dietary guidelines. Report of ajoint FAO/WHO consultation Nicosia, Cyprus, WHO/NUT/96.6. FAO, WHO,Geneva.
Fearnside, P. M. (2001). Soybean cultivation as a threat to the environment in Brazil.Environmental Conservation, 28(1), 23–28.
Fechner, A., Schweiggert, U., & Hasenkopf, K. J. G. (2011). Lupine kernel fiber.Metabolic effects in human intervention studies and use as a supplement inwheat bread. In Victor R. Preedy, Ronald R. Watson, & Vinood B. Patel (Eds.),Flour and breads and their fortification in health and disease prevention(pp. 463–473). Amsterdam, Oxford: Academic.
FG (2002). Perspektiven für Deutschland. Unsere Strategie für eine nachhaltigeEntwicklung. The Federal Government of Germany, Berlin.
FG (2012). National Sustainable Development Strategy. 2012 Progress Report. TheFederal Government of Germany, Berlin.
Fleddermann, M., Fechner, A., Rößler, A., Bähr, M., Pastor, A., Liebert, F., et al. (2013).Nutritional evaluation of rapeseed protein compared to soy protein for quality,plasma amino acids, and nitrogen balance. A randomized cross-overintervention study in humans. Clinical Nutrition, 32(4), 519–526.
Gardi, C., Panagos, P., Bosco, C., Brogniez, D. de (submitted for publication). SoilSealing, Land Take and Food Security. Impact assessment of land take in theproduction of the agricultural sector in Europe.
Gerbens-Leenes, W., & Nonhebel, S. (2005). Food and land use. The influence ofconsumption patterns on the use of agricultural resources. Appetite, 45(1),24–31.
Guilford, J. M., & Pezzuto, J. M. (2011). Wine and Health. A review. American Journalof Enology and Viticulture, 62(4), 471–486.
Higdon, J. V., & Frei, B. (2003). Tea catechins and polyphenols. Health effects,metabolism, and antioxidant functions. Critical Reviews in Food Science andNutrition, 43(1), 89–143.
Higdon, J. V., & Frei, B. (2006). Coffee and health. A review of recent human research.Critical Reviews in Food Science and Nutrition, 46(2), 101–123.
Hoekstra, A. Y. Virtual water. An introduction. In A.Y. Hoekstra, (Ed.). Virtual watertrade. Proceedings of the international expert meeting on virtual water trade (pp.25–47). Value of water research report series (11), Delft: IHE.
IDF (2010). The IDF guide to standard LCA methodology for the dairy sector (Vol.445). Bulletin of the International Dairy Federation, 1–40.
ISO 14040/14044 (2006). Environmental management, life cycle assessment,principles and framework; 14044. Environmental management, life cycleassessment, requirements and guidelines; TR 14047; TS 14048. InternationalOrganisation for Standardization, Genf, Switzerland.
JRC EC (2012). In Proceedings of a workshop on ‘‘Market for non-Genetically ModifiedIdentity Preserved crops and derived products’’. JRC Scientific and Policy Reports.Joint Research Center (JRC) of the European Commission (EC), Seville.
Jungbluth, N., Nathani, C., Stucki, M., & Leuenberger, M. (2011). Environmentalimpacts of Swiss consumption and production. A combination of input–outputanalysis with life cycle assessment. Bern, Switzerland: Federal Office for theEnvironment.
Karg, G., Gedrich, K., Steinel, M. (1996). Verfügbare Lebensmittelmengen (1950–1995). In DGE (Ed.), Ernährungsbericht 1996. Deutsche Gesellschaft für Ernährung(DGE) (pp. 18–24). Frankfurt a. M: Henrich Druckerei U. Vlg.
Kastner, T., & Nonhebel, S. (2010). Changes in land requirements for food in thePhilippines. A historical analysis. Land Use Policy, 27(3), 853–863.
Koellner, T., & Sleen, M. v. (2011). Ecosystem impacts of virtual land use embodiedin traded goods and services. In Thomas Koellner (Ed.), Ecosystem services andglobal trade of natural resources. Ecology, economics, and policies. London, NewYork: Routledge.
Köpke, U., & Nemecek, T. (2010). Ecological services of faba bean. Field CropsResearch, 115(3), 217–233.
Kranert, M., Hafner, G., Barabosz, J., Schuller, H., Leverenz, D., Kölbig, A., et al. (2012).Ermittlung der weggeworfenen Lebensmittelmengen und Vorschläge zurVerminderung der Wegwerfrate bei Lebensmitteln in Deutschland. Institut fürSiedlungswasserbau, Wassergüte und Abfallwirtschaft, Stuttgart: UniversitätStuttgart.
Kübler, W., Balzter, H., Grimm, R., Schek, A., Schneider, R. (1997). National foodconsumption survey (NVS) and cooperative study. Nutrition survey and riskfactors analysis (VERA); synopsis and perspectives, Niederkleen, Germany.
Leip, A., Weiss, F., Wassenaar, T., Perez, I., Fellmann, T., Loudjani, P., Tubiello, F.,Grandgirard, D., Monni, S., Biala, K. (2010). Evaluation of the livestock sector’scontribution to the EU greenhouse gas emissions (GGELS). Annex to the finalreport, European Commission, Joint Research Centre. Ispra, Italy.
Lenzen, M., Moran, D., Kanemoto, K., Foran, B., Lobefaro, L., & Geschke, A. (2012).International trade drives biodiversity threats in developing nations. Nature,486(7401), 109–112.
Lipton, M. (2009). Land reform in developing countries. Property rights and propertywrongs. London, New York: Routledge.
Lundquist, J., de Fraiture, C., & Molden, D. (2008). Saving water. From field to fork.Curbing lossess and wastage in the food chain. SIWI, Stockholm: SIWI Policy Brief.
Meier, T., Christen, O. (2012a). Umweltwirkungen der Ernährung. Ökobilanzierungdes Nahrungsmittelverbrauchs tierischer Produkte nach Gesellschaftsgruppenin Deutschland. Schriften der Gesellschaft für Wirtschafts-undSozialwissenschaften des Landbaus (GEWISOLA) (pp. 315–327), Band 47,Landwirtschaftsverlag, Münster.
Meier, T., & Christen, O. (2012b). Gender as a factor in an environmental assessmentof the consumption of animal and plant-based foods in Germany. InternationalJournal of Life Cycle Assessment, 17(5), 550–564.
Meier, T., & Christen, O. (2013). Environmental impacts of dietary recommendationsand dietary styles. Germany as an example. Environmental Science andTechnology, 47(2), 877–888.
Messina, M. (2010). Insights gained from 20 years of Soy Research. Supplement. SoySummit—Exploration of the Nutrition and Health Effects of Whole Soy. Journalof Nutrition, 140(12), 2289S–2295S.
Millward, J. D., & Garnett, T. (2010). Food and the planet. Nutritional dilemmas ofgreenhouse gas emission reductions through reduced intakes of meat and dairyfoods. Proceedings of the Nutrition Society, 69(01), 103.
Morton, D. C., DeFries, R. S., Shimabukuro, Y. E., Anderson, L. O., Arai, E., Espirito-Santo, F., et al. (2006). Cropland expansion changes deforestation dynamics inthe southern Brazilian Amazon. Proceedings of the National Academy of Sciences,103(39), 14637–14641.
MRI (2008). Nationale Verzehrsstudie II. Ergebnisbericht, Teil 2. Die bundesweiteBefragung zur Ernährung von Jugendlichen und Erwachsenen. Max Rubner-Institut, Karlsruhe.
Mytton, O.T., Clarke, D., Rayner, M. (2012). Taxing unhealthy food and drinks toimprove health (pp. 30–33). In BMJ 344 (May 15 2).
Nemecek, T., Richthofen, J.-S. v., Dubois, G., Casta, P., Charles, R., & Pahl, H.(2008). Environmental impacts of introducing grain legumes intoEuropean crop rotations. European Journal of Agronomy, 28(3), 380–393.
Nielsen, P. H., Nielsen, A. M., Weidema, B. P., Dalgaard, R., Halberg, N., 2003. LCA fooddata base. <www.lcafood.dk> Retrieved 09.09.11.
Orlich, M. J., Singh, P. N., Sabate, J., Jaceldo-Siegel, K. F. J., Knutsen, S., Beeson, L. W., &Fraser, G. E. (2013). Vegetarian dietary patterns and mortality in adventisthealth Study 2. JAMA Internal Medicine, E1–E8.
OVID (2012). Eiweißstrategie Futtermittel. Die Rolle von Soja und Raps alsProteinfuttermittel in Deutschland und Europa. Positionspapier. Verband derölsaatenverarbeitenden Industrie in Deutschland (OVID), Berlin.
Parfitt, J., Barthel, M., & Macnaughton, S. (2010). Food waste within food supplychains. Quantification and potential for change to 2050. PhilosophicalTransactions of the Royal Society B. Biological Sciences, 365(1554), 3065–3081.
Pearce, F. (2012). The land grabbers. The new fight over who owns the Earth. Boston:Beacon Press.
Peters, C. J., Wilkins, J. L., & Fick, G. W. (2007). Testing a complete-diet model forestimating the land resource requirements of food consumption andagricultural carrying capacity. The New York State example. RenewableAgriculture and Food Systems, 22(02), 145–154.
Prokop, G.,Jobstmann, H., Schönbauer, A., 2011. Overview on best practices forlimiting soil sealing and mitigating its effects in EU-27. Technical Report – 2011-50. Environment Agency Austria (<http://ec.europa.eu/environment/soil/sealing.htm>).
Reisch, L. A., Lorek, S., Bietz, S., 2011. Policy Instruments for Sustainable FoodConsumption. CORPUS Discussion Paper 2. CORPUS. The SCP Knowledge Hub(<http://www.scp-knowledge.eu/sites/default/files/> Reisch et al. 2011.Sustainable Food – Policies.pdf).
Richthofen, J. v., Pahl, H., Casta, P., Dubois, G., Lafarga, A., Nemecek, T., et al. (2006).Economic impact of grain legumes in European crop rotations. Grain Legumes(45), 16–19.
Schäfer, B. C., & Lütke Entrup, N. (2009). Ökonomische Bewertung vonBodenbearbeitungssystemen in Fruchtfolgen mit Körnerleguminosen. Journalfür Kulturpflanzen, 9(61), 309–311.
Schmidt, T., & Osterburg, B. (2010). Berichtsmoduls Landwirtschaft und Umwelt in denUmweltökonomischen Gesamtrechnungen II. Braunschweig: Tabellenband,Thünen-Institut (TI).
Schösler, H., de Boer, J., & Boersema, J. J. (2012). Can we cut out the meat of the dish?Constructing consumer-oriented pathways towards meat substitution. Appetite,58(1), 39–47.
SGE (2012). Swiss food pyramid. Recommendations for a healthy and enjoyableadult diet. Schweizerische Gesellschaft für Ernährung (SGE), Bern, Switzerland.
Sinclair, T. R., & Vadez, V. (2012). The future of grain legumes in cropping systems.Crop Pasture Science, 63(6), 501–512.
Sleen, M. v. (2009). EU virtual land flows. An assessment of EU agricultural and land usethrough international trade. Groningen: Rijksuniversiteit.
Smith, F. P., Gorddard, R., House, A. P., McIntyre, S., & Prober, S. M. (2012).Biodiversity and agriculture. Production frontiers as a framework forexploring trade-offs and evaluating policy. Environmental Science & Policy, 23,85–94.
Steger, S. (2005). Der Flächenrucksack des europäischen Außenhandels mitAgrarprodukten. Welche Globalisierung ist zukunftsfähig? Wuppertal Paper Nr.152. Wuppertal Institute for Climate, Environment and Energy, Wuppertal.
Suh, S. (2003). Input–output and hybrid life cycle assessment. The InternationalJournal of LCA, 8(5), 257.
Temme, E. H. M., van der Voet, H., Thissen, J. T., Verkaik-Kloosterman, J., vanDonkersgoed, G., & Nonhebel, S. (2013). Replacement of meat and dairy byplant-derived foods. Estimated effects on land use, iron and SFA intakes inyoung Dutch adult females. Public Health Nutrition, 1–8.
Tukker, A., Goldbohm, R. A., de Koning, A., Verheijden, M., Kleijn, R., Wolf, O., et al.(2011). Environmental impacts of changes to healthier diets in Europe.Ecological Economics, 70(10), 1776–1788.
UECBV (2012). Position Paper of UECBV after the publication of the Reform proposalsfor the Common Agricultural Policy (CAP). Union Européenne du Commerce deBétail et de la Viande (UECBV), Brussels.
UGB (2011). Recommendations for a whole food nutrition. Verband für UnabhängigeGesundheitsberatung e.V. (UGB), Wettenberg/Gießen, Germany.

34 T. Meier et al. / Appetite 74 (2014) 20–34
USDA, USDHHS (2010). Dietary Guidelines for Americans 2010 (7th ed.). U.S.Department of Agriculture, U.S. Department of Health and Human Services,Washington, DC.
Voget-Kleschin, L. (2012). Employing a normative conception of sustainability toreason and specify green consumerism. In T. Potthast & S. Meisch (Eds.), Climatechange and sustainable development. Ethical perspectives on land use and foodproduction (pp. 361–366): Wageningen Academic Pub.
Voget-Kleschin, L. (2013). Large-scale Land acquisition. Evaluating itsenvironmental aspects against the background of strong sustainability. Journalof Agricultural and Environmental Ethics, 25.
Voget-Kleschin, L. (in press). Employing a normative conception of sustainability toreason and specify sustainable food consumption. In Journal of Agricultural andEnvironmental Ethics.
Vries, de M., & Boer, de I. (2010). Comparing environmental impacts for livestockproducts. A review of life cycle assessments. Livestock Science, 128(1–3), 1–11.
Wackernagel, M., Monfreda, C., Moran, D., Wermer, P., Goldfinder, S., Deumling, D.,et al. (2005). National footprint and biocapacity accounts 2005. The underlyingcalculation method. Oakland: Global Footprint Network.
Wackernagel, M., White, S., & Moran, D. (2004). Using Ecological Footprint accounts.From analysis to applications. International Journal of Environment andSustainable Development, 3, 293–315.
Wahlqvist, M. L., McKay, J., Chang, Y.-C., & Chiu, Y.-W. (2012). Rethinking the foodsecurity debate in Asia. Some missing ecological and health dimensions andsolutions. Food Security, 4(4), 657–670.
WCED (1987). Our common future. World Commission on Environment andDevelopment, New York, Oxford.
Weiße, K., Brandsch, C., Zernsdorf, B., Nkengfack Nembongwe, G. S., Hofmann, K.,Eder, K., et al. (2010). Lupin protein compared to casein lowers the LDLcholesterol. HDL cholesterol-ratio of hypercholesterolemic adults. EuropeanJournal of Nutrition, 49(2), 65–71.
Wiegmann, K., Eberle, U., Fritsche, R., Hünecke K. (2005). Umweltauswirkungen vonErnährung. Stoffstromanalysen und Szenarien. BMBF-Forschungsprojekt‘‘Ernährungswende’’, Diskussionspapier Nr. 7. Institute for Applied Ecology,Darmstadt.
Wirsenius, S., Hedenus, F., & Mohlin, K. (2011). Greenhouse gas taxes on animal foodproducts. Rationale, tax scheme and climate mitigation effects. Climatic Change,108(1–2), 159–184.
Witzke, H. v., Noleppa, S. (2012). EU agricultural production and trade. Can moreefficiency prevent increasing´ land-grabbingoutside of Europe? Research Report.Humboldt University Berlin, AGRIPOL network for policy advise, Berlin.
Witzke, H., Noleppa, S., Zhirkova, I. (2011). Fleisch frisst Land. Ernährung,Fleischkonsum, Flächenverbrauch. Studie im Auftrag des WWF. World WildlifeFoundation (WWF), Berlin.
WWF (2011). Consultation for the impact assessment on the ‘‘Common AgriculturalPolicy towards 2020’’. Responses of the Eurpean WWF Working Group on the CAPReform. World Wildlife Foundation (WWF), Brussels.