balancing energy options in stehekin, washington
TRANSCRIPT

REPORT BY THE UNIVERSITY OF WASHINGTON
Balancing Energy Options in Stehekin, Washington
June 2003
PREPARED FOR:
University National Park Energy Partnership Program and
National Park Service
PREPARED BY:
Jessica G. Kirchhoffer and Philip C. Malte Department of Mechanical Engineering
University of Washington Seattle, Washington 98195-2600
Phone: 206.543.5486 E-mail: [email protected]

ii
BALANCING ENERGY OPTIONS IN STEHEKIN, WASHINGTON
Jessica G. Kirchhoffer and Philip C. Malte Department of Mechanical Engineering
University of Washington Seattle, Washington 98195-2600
Executive Summary This report is based on the Masters of Science (Mechanical Engineering) Thesis of Ms. Kirchhoffer completed June 2003. The report covers a two years study of the energy options available in Stehekin, Washington, a remote and isolated community not served by a major electrical grid. Stehekin lies at the northern tip of Lake Chelan, in a valley set between peaks of the North Cascades Mountains. Stehekin is a gateway to North Cascades National Park and is itself a National Recreation Area administered by the National Park Service. Electricity is provided by a local hydroelectricity facility and three diesel generators operated by the Chelan Public Utility District (PUD). Although the electricity rate paid by the Stehekin community is about double that paid on the main parts of Chelan PUD grid, the PUD indicates an annual loss of about $50,000 on its Stehekin operation. Part of this loss is caused by the remoteness of Stehekin, through much of it arises from the high cost of running and maintaining the diesel generators. Typically, the diesel generators run a couple times of day during the summer and almost constantly during the winter. In addition to the high cost of running the generators, the diesel generators are a source of noise and air pollution. The purpose of this study is the exploration and analysis of energy options for Stehekin that would allow the diesel generator use to be curtailed. The study has been conducted by considering the electricity use patterns for Stehekin, followed by the examination of both demand-side and supply-side solutions. Demand-side solutions involve energy conservation and fuel switching. Switching to propane for domestic water heating and space heating would decrease the demand for electricity. Additionally, space heating with low-emission certified wood stoves would reduce the demand for electricity. Although wood is the traditional heating fuel of Stehekin, ups and downs in National Park Service policy on woodcutting may have diminished enthusiasm for this fuel. Supply-side solutions involve both central and distributed electricity storage, upgrading the existing hydroelectricity plant, solar PV, and wind turbines. Central electricity storage using flow batteries or upgrading of the existing hydroelectric plant, coupled with conservation and fuel switching may offer the best long term solution for Stehekin. Both the flow battery system and the hydroelectric upgrades carry a price tag in the low $200,000 range.

iii
Electricity load information for Stehekin is taken from a 1992 report prepared for the NPS, in which 1988 and 1989 data were used. These data used a sample day from each month. For season from April to October, termed the high season, the averaging of the 1988-89 data indicates a base load of 95 kw and the peak load of 200 kw. However, it is also known that for a busy holiday weekend, the load can significantly exceed the 200 kw value. For the season from November to March, termed the low season, the base and peak loads obtained from the averaging of 1988-89 sample days are about 115 and 180 kw, respectively. February, however, exhibited peak load exceeding 200 kw. Although these data are 15 years old, they should reflect the present electricity load situation. The permanent population of Stehekin has been relatively steady, and though more tourists appear to be visiting Stehekin, fuel switching may be providing a countering effect with respect to electricity use. This view is supported by the decline in diesel fuel consumption between the 1992-95 and 2000-01 periods. The hydroelectric plant is rated at 205 kw. However, based on typical actual water flow rates, the hydroelectric power output varies from 183 kw in the summer (early) to 108 kw in the winter. This hydroelectric output is unable to meet the summer and winter load peaks. Additionally, it is not quite able to meet the winter base load. Thus, a significant part of this study has been focused on upgrades to the hydroelectric facility. First, it is noted that the hydroelectricity plant is unable to provide a constant 60 cycles per second (cps) frequency in the electricity. On one of our visits, the frequency fluctuated to a value of around 59 cps. The variation in the frequency essentially eliminates the tying of distributed generation and storage systems into the Stehekin grid. It also prevents modern energy efficient appliances with microprocessor controls from being fully utilized in Stehekin. A new water jet deflector and control system on the Pelton wheel turbine of the hydroelectric plant should bring the frequency into compliance. The cost is about $30,000. Second, it is noted that the efficiency of the Pelton wheel turbine / electrical generator system is 63%, which is quite low. By upgrading the Pelton wheel to a two-jet system, from the present single jet system, the efficiency could be brought up to 76%. This would increase the typical winter and summer power outputs to 130 and 221 kw, respectively. Cost would be about $200,000. This includes the upgrade of the jet deflector / control system. An upgrade to a four-jet system, costing about an additional 10%, would bring the winter and summer power outputs up to about 135 and 230 kw, respectively. These upgrades would appear to cover the winter base load and all of the summer loads except possibly those occurring on busy tourist days. Adding conservation and fuel switching into the picture improves the ability of the upgraded hydroelectricity system to meet the load. Conservation, including building insulation upgrades and the use of efficient appliances, is estimated to reduce the average load by about 10%, or 15 kw. Based on results on energy use in the 1992 report, we have estimated that fuel switching could reduce the winter load by about 30 kw and the summer load by about 50 kw. The greater

iv
value is assigned to the summer, because of significant use of hot water by tourists in the summer and its switch from electricity to propane. If these demand-side energy reductions could be realized, favorable margins would exist between the upgraded hydroelectricity output and the Stehekin load. For the summer the situation would be a hydroelectric output of either 221 or 235 kw for normal maximum stream flow (17 ft3/s) versus an average peak load of 135 kw based on conservation and fuel switching, while for the winter the output would be either 130 or 135 kw for normal minimum water flow (10 ft3/s) which just matches the average peak load. A supply-side approach with a total price tag of about $300,000 is the flow battery for central storage of electricity. This could store 100 kwh of electrical energy, which could be used to cover the load during peak demand periods. The battery system would be charged during the base load time of day. An additional power output of 50 kw for 2 hours, when added to the present hydroelectric outputs, would bring the winter output to 158 kw and the summer (early) output to 233 kw. The main drawback of the flow battery appears to be its lack of establishment, that is, it is an emerging commercial technology. The remoteness of Stehekin may work against its use there at this time. This study also focused significantly on the potential of solar PV for Stehekin. An off-grid solar PV system rated at 960 watts was purchased and installed on the roof of the Stehekin Visitors’ Center. The system, consisting of eight 120-watt panels, panel mounting framework, combiner box, charge controller, eight 98 amp-hour gel deep cycle batteries, a 24 volt / 2.5 kw inverter, and battery rack with DC disconnects, had a price tag of $9280. The NPS installed the system, so that cost is not included in the $9280. From July of 2002 to February of 2003, the system was monitored for the solar flux input, the PV voltage and current output, and the battery voltage. Based on the 120 watt power rating of each panel and the panel total area, the solar-to-electric energy conversion efficiency is 12.3%. However, as the panels heat up on a sunny day, their power drops by about 0.5% for every degree C of temperature rise above 25 degrees C. Additionally, losses occur in the power electronics and battery pack. Our measurements showed the system could nearly reach 10% efficiency when connected to a significant load. If the load is too small, the capacity of the solar PV system is not well utilized and the controller commands the PV panels to run near the open circuit condition with low current (and low power) output. Our measurements for the month of August indicate a daily solar energy input to each of the 1 m2 panels of 5900 watt-hours. Using this value and assuming the 10% system efficiency leads to daily electrical energy generation of 4.7 kwh for the 8-panel (8 m2) array. With the array tilt angle set near optimum for each period of the year, solar energy input to the panels should vary between 4000 and 7000 watt-hours/m2 over the months of April to October, corresponding to a daily electrical energy generation of 3.2 to 5.6 kwh for the 8-panel array.

v
The addition of about ten 1 kw solar PV systems could overcome the present shortfall of the hydroelectric system in meeting the average peak load in the (early) summer. These systems would require battery storage, since the time of the peak load (morning) does not coincide with peak solar flux (early afternoon). Cost would be about $10,000 per system, or about $100,000 for the 10 arrays. These figures assume installation by the purchaser. Finally, we examined wind energy. This was done based on data available from the fire weather station located at the Stehekin airport. These data indicate a wind resource inadequate to justify the installation of wind turbines in the Stehekin Valley. However, wind data were not available for the lake shore, where summer afternoon winds can be brisk. Ridgelines above the valley probably offer a good wind resource, but the installation of wind turbines there could carry significant view shed impacts and unwanted construction impacts. Recommendations reached from this study are as follows:
• Solving the problem of the fluctuations in the frequency of the electricity should be tackled as soon as possible, since this problem prevents other solutions, such as distributed generation and storage, and efficient appliances.
• Demand-side conservation and fuel switching should be strongly promoted, since they need to be part of any long term solution.
• The National Park Service should stick to a stable policy on woodcutting. Additionally, a short study should be commissioned comparing the air pollution impacts of business-as-usual diesel generator use against increased burning in low-emission certified wood stoves.
• Solar PV should be considered part of the solution, since the Stehekin solar energy resource appears to be very good (except in deep winter). Especially, solar PV should be encouraged for new summer loads, particularly those for cooling and daytime work activities. Additionally, solar PV could be attractively coupled to the charging of electric utility vehicles.
• Perhaps most important, the National Park Service and the Chelan Public Utility District should strive to reach an agreement whereby it becomes feasible to upgrade the hydroelectric plant, increasing its efficiency from the current 63% into the 76-79% range. This would enhance the environment of Stehekin Valley by curtailing diesel noise and pollution. It would not add impact to Company Creek. The cost of $200,000+ is not all that high, especially if energy solution burdens could be shared. The benefits are significant. The hydroelectric upgrade, if coupled with conservation and fuel switching, and with well sited solar PV and distributed storage, could eliminate the use of the diesel generators except for emergency use.

vi
Table of Contents
Page Executive Summary .......................................................................ii
Table of Contents ..........................................................................vi
List of Figures ............................................................................. viii
List of Tables ................................................................................. x
Acknowledgements ......................................................................xi
Part 1: Stehekin’s Energy: Past and Present............................. 1
Introduction ................................................................................... 1
Chapter 1: Stehekin History ......................................................... 6
Chapter 2: Stehekin’s Presnt Energy Situation ........................ 11
2.1 Electric Load .................................................................... 11 2.2 Load Timing ..................................................................... 13 2.3 Present Generation Capabilities..................................... 16
2.3.1 The Stehekin Hydro Facility ........................................ 16 2.3.2 Stehekin Diesel Generators ........................................ 23
Chapter 3: Energy Solutions ...................................................... 27
Chapter 4: Extending the Chelan Grid to include Stehekin..... 29
Part 2: Demand-side Management............................................. 31
Chapter 5: Conservation............................................................. 32
Chapter 6: Fuel Switching .......................................................... 36
Part 3: Supply-side Management ............................................... 46
Chapter 7: Centralized Storage .................................................. 47
7.1 Flow Batteries .................................................................. 50 7.2 Sodium Sulfur (NaS) Batteries........................................ 53 7.3 Centralized Storage Summary ........................................ 55
Chapter 8: Distributed Storage .................................................. 57
Chapter 9: Hydroelectric Facility Upgrades.............................. 59

vii
9.1 New Governor and Jet-Deflector .................................... 60 9.2 Two-Jet Pelton Wheel...................................................... 61 9.3 Two-Runner, Four-Jet Hydroelectric Plant .................... 66 9.4 Increase the Effective Head of the System .................... 67 9.5 Relocation to a River with Greater Stream Flow ........... 68 9.6 Summary of Hydroelectric System Upgrades ............... 68
Chapter 10: Application of Solar Photovoltaic ......................... 70
10.1 Solar Photovoltaic Background.................................... 70 10.2 PV Technology and Cost............................................... 73 10.3 Design of Stehekin PV System ..................................... 79
10.3.1 Design Constraints ..................................................... 79 10.3.2 Photovoltaic Array Design Process ............................ 79 10.3.3 Design Solutions ........................................................ 80
10.4 System Components ..................................................... 81 10.4.1 Solar Panels ............................................................... 81 10.4.2 Batteries ..................................................................... 83 10.4.3 Inverter and Charge Controller ................................... 84
10.5 Photovoltaic Array Physical Setup............................... 85 10.6 Photovoltaic Array Electrical Setup ............................. 86 10.7 Measurement of the Stehekin Solar Resource ............ 87 10.8 Functioning of the Stehekin System ............................ 95 10.9 Potential of Solar PV at the Visitors’ Center.............. 103 10.10 Potential for PV Use in Stehekin............................... 104
Chapter 11: Wind Energy.......................................................... 109
Chapter 12: Conclusions .......................................................... 116
End Notes .................................................................................. 120
References................................................................................. 123
Appendices................................................................................ 126 Appendix A: Map of Stehekin ...................................................... 127 Appendix B: Hydroelectric Facility Calculations .......................... 128 Appendix C: Electrical Schematic of Visitors' Center PV System 130 Appendix D: Reference Cell Circuit Diagram .............................. 131 Appendix E: Reference Cell Data.................................................. *** Appendix F: Comparing Stehekin with Spokane ......................... 132 Appendix G: Visitors' Center PV System Calculations .................. *** Appendix H: Visitors' Center PV System Data ............................ 133 *** not included in this version

viii
List of Figures
Figure Numbers and Abbreviated Titles Page 1. View of Stehekin Valley from Lake Chelan.................................. 1 2. Energy Use in Stehekin by Season........................................... 13 3. Hourly Changes in Electric Load ............................................... 14 4. Company Creek Penstock Entrance ........................................ 17 5. Company Creek Penstock......................................................... 18 6A. Company Creek Flow in June................................................. 19 6B. Company Creek Flow in February .......................................... 19 7. Summer Electric Load and Hydro Output.................................. 21 8. Winter Electric Load and Hydro Output ..................................... 22 9. Diesel Use by Month ................................................................. 25 10. Electricity Consumption by End Use ....................................... 33 11. Change in Electric Load in High-Season by Fuel Switching.... 41 12. Change in Electric Load in Low-Season by Fuel Switching..... 42 13. Low-Season Change by Fuel Switching and Conservation..... 44 14. Discharge Time and Power of Energy Storage Technologies . 48 15. Cost per Energy and Power of Energy Storage Technologies 49 16. Cost per Cycle of Energy Storage Technologies..................... 50 17. Inner Workings of Flow-Battery ............................................... 51 18. Diagram of NaS Battery .......................................................... 54 19. Diagram of Pelton Turbine System ......................................... 59 20. Effect of Hydro Upgrade in High-Season ................................ 64 21. Effect of Hydro Upgrade in February....................................... 64 22. Effect of Hydro Upgrade in Low-Season ................................. 65 23. Annual Solar Resource in the Western US ............................. 71 24. July Solar Resource in US ...................................................... 72 25. February Solar Resource in US .............................................. 72 26. Single Crystal Solar PV Panels ............................................... 74 27. Multi Crystal Solar PV Panels ................................................. 75 28. Thin Film Solar PV Panels ...................................................... 76 29. Economic Trends in Solar PV Panels ..................................... 77 30. AP120 Power versus Voltage Curves ..................................... 82 31A. Solar PV Array on the Visitors’ Center .................................. 86 31B. Battery and Inverter System in the Visitors’ Center .............. 86 32. Reference Cell Calibration ...................................................... 88 33. Reference Cell Placement....................................................... 89 34. July Marblemount and Stehekin Sunny Comparison............... 90 35. October Spokane and Stehekin Sunny Comparison ............... 92 36. February Spokane and Stehekin Sunny Comparison ............. 94 37. Visitors’ Center Solar PV July Performance ............................ 96 38. Visitors’ Center Solar PV August Performance ....................... 98 39. Data Points on Performance Curves for the AP120 ................ 99 40. Visitors’ Center Solar PV November Performance................ 101 41. Visitors’ Center Solar PV February Performance .................. 102

ix
42. Solar Pathfinder .................................................................... 105 43. Visitors' Center Solar Pathfinder Chart.................................. 106 44. Maintenance Center Solar Pathfinder Chart.......................... 107 45. Washington State Wind Resource ........................................ 109 46. Stehekin Airport Wind Data ................................................... 111 47. Stehekin Aear Wind Map....................................................... 113

x
List of Tables
Table Numbers and Abbreviated Titles Page 1. Diesel Fuel Use by Month ......................................................... 24 2. Energy Costs in Stehekin .......................................................... 37 3. Comparison of PV Panel Costs................................................. 78 4. Comparison of PV System Costs .............................................. 79 5. Solar Radiation and PV Array Output...................................... 104 6. Comparison of Stehekin Energy Solutions .............................. 117

xi
Acknowledgements
We would like to recognize all of the people whose support and guidance helped in the accomplishment of this study. First, we would like thank the University National Park Energy Partnership Program (UNPEPP), under the direction of Dr. Jamie Winebrake, for the financial support of the study. Special thanks go to the people of the National Park Service: Joe Dunstan, Steve Bufferworth, and Hoa Lam of the Columbia Cascades Support Office, Tom Belcher and Dennis Stanchfield of North Cascades National Park Headquarters, and Mike Miles and Tom Langley of the Stehekin operations of North Cascade National Park. Without the understanding and guidance of Joe Dunstan, Tom Belcher, and Mike Miles, this study might not have been possible, and without Tom Langley’s enthusiasm and long hours, the solar PV installation at the Stehekin Visitor’s Center would not have gone nearly so well. Special thanks also go to Dr. James White of the Chelan PUD for time and information provided on the energy situation and potential solutions for Stehekin, and to Karl Fellows of the Stehekin operations of Chelan PUD. Thanks also go to David Love of the Olympia, Washington office of Sunwize Technologies, Inc. for interest in our project and answers to our questions on solar PV. Finally, thanks to the other members of Ms. Kirchhoffer’s Masters of Science Committee: Professor John Kramlich of the Department of Mechanical Engineering of the University of Washington and Professor Teodora Shuman of the Department of Mechanical Engineering of Seattle University.

1
Part 1: Stehekin’s Energy: Past and Present
Introduction
Figure 1: A view of the Stehekin Valley as seen from Lake Chelan
At the very northern tip of Lake Chelan, in a valley set between the peaks
of the North Cascade Mountains, lies the community of Stehekin. It is a
community whose character has been formed by both its natural beauty and
isolation. Stehekin is a gateway to the North Cascades National Park, and is
itself a National Recreation Area. While its early history was written by miners
and homesteaders, its recent history has been heavily influenced by the National

2
Park Service (NPS). As such it has been an experiment in the coexistence of a
private community and the federal government.
Stehekin's unique geographical and political situation influences all
aspects of the community's daily life. There is very rarely an easy way to
accomplish any task. Most of the tools of daily living, such as food staples or
appliances, must be shipped to Stehekin from towns "down-lake". At the same
time, many of the activities of daily living, such as cutting firewood or building a
new shed, are restricted by regulations set by the NPS.
These difficulties also apply to Stehekin's energy situation. The closest
large energy grid ends 20 miles from the community. Since the early 20th
century the majority of Stehekin's electricity has been produced by a
hydroelectric power plant located on a tributary of the Stehekin River. In 1962
the Chelan Public Utility District (PUD), the utility that administers the energy for
the communities at the southern end of Lake Chelan, accepted responsibility for
Stehekin's electricity.1
Since 1965 Chelan PUD has upgraded the hydro facility and added three
diesel generators to keep the Stehekin community supplied with electricity. It has
also lost money on its Stehekin venture nearly every year.2 The reason for this
loss comes in the use of the diesel generators. When the hydroelectric plant
does not supply enough electricity to meet the load, the diesel generators are
used as a supplement. This situation occurs a couple of times a day during the
summer months, and almost constantly during the winter months. The cost of

3
running the diesel generators far exceeds the rate which Stehekin residents pay
for their electricity. Such a state of affairs is not acceptable to Chelan PUD. In
trying to improve the situation the PUD has investigated energy management
and supply options. Some of these options have been tried, and failed, others
require a capital investment that the PUD is reluctant to make for such a small
segment of its customers. As of now the situation remains unresolved.
The National Park Service also has a stake in the Stehekin energy
system. The NPS has a large presence in the valley. Commuting to this remote
location is not a possibility, so all of the park rangers and maintenance and
administrative staff work and live in Stehekin. The NPS uses half of the
electricity produced in the valley.3 As an organization devoted to preserving the
natural environment, the NPS frowns upon use of the polluting and fossil fuel
consuming diesel generators. At the same time, new energy installations or
upgrades must not incur any additional damage to the physical environment of
Stehekin. These restrictions make permitting very difficult.
There is another twist to NPS electricity use in Stehekin. Chelan PUD
loses money on its Stehekin electricity sales; it cannot charge the actual cost of
electricity production due to its agreement with Stehekin residents. Stehekin
electricity is, therefore, subsidized by the rest of Chelan PUD’s customers. NPS
standards require the park service to implement energy conservation measures,
but these are not enough to offset diesel generator use. This means that a
government organization is being subsidized by a public utility, which is not an

4
acceptable situation. The NPS, while recognizing this fact, maintains that it is a
land management organization, and will not participate in energy production.
The final stakeholder group in this energy situation is the Stehekin
community. While electricity rates are not high enough to cover production costs,
they are nearly three times as high as the rates paid by the rest of Chelan PUD’s
customers.4 In 2003, electricity rates for residents of Stehekin are $0.0388 per
kWh for the first 400 kWh per month, $0.0538 per kWh for the next 350 kWh per
month, and $0.1075 for each kWh over 750 kWh used each month. In
comparison, the 2003 residential rates for the rest of Chelan PUD’s customers
are as follows: $0.0218 per kWh for the first 1000 kWh each month, $0.027 for
the next 1000 kWh, and $0.0285 for any energy over 2000 kWh each month.
With the average household using 48 kWh per day, a Stehekin household pays
$108.53 each month compared to $33.68 for other Chelan PUD residential
customers. Not only are their monthly rates much higher than the rest of Chelan
County, Stehekin residents must cope with frequent power outages due to diesel
generator hiccups and downed power lines, and low-quality electricity that can
damage computerized appliances. They must also deal with the noise and air
pollution produced by the diesel generators.
Yet, even with these energy-related issues, residents have been resistant
to energy conservation and efficiency measures. The capital cost of energy
efficient appliances is increased by the transport involved in getting them to
Stehekin. Also contributing to this reluctance is the “character” of Stehekin.

5
Most residents live in this isolated area because they prize their independence.
They may be resistant to anything that can be construed as coercion by the PUD
or NPS.
Finally, the NPS’s forest management tactics have made residents wary of
relying on wood as their heating source. Electric heaters consume a large
amount of electricity, but are a reliable source of heat. Originally, residents in the
valley depended on wood as their heat source. However, the NPS began
restricting wood use in an attempt to preserve the local environment, and
residents no longer had access to an unlimited fuel supply. A new forest
management plan is currently providing ample wood to residents, but they may
now be wary of depending on the continuation of this supply.
The confluence of all these factors has created an engineering and
political stalemate in the Stehekin energy situation. Use of the diesel generators
must be significantly diminished, or ideally, stopped in order to satisfy each of the
above stakeholders. This report addresses the engineering aspects of the
problem. A viable energy solution must be cost-effective, environmentally
benign, provide high-quality electricity, and not require a lot of maintenance.
Ideally, the solution will make use of renewable fuels. By investigating the
technical possibilities of different demand and supply-side options and the
economic and environmental costs of these solutions, this report will provide
Stehekin’s stakeholders with a guide for their energy management decisions.

6
Chapter 1: Stehekin History
Renowned for its scenic beauty, Stehekin Valley first drew settlers with the
promise of riches mined from the surrounding mountains. George and John
Rouse first discovered gold, silver, and lead ore in the valley in 1886.5 As was
the case in many parts of the country, with mining came roads, stores, mills, and
all the accoutrements necessary to transport the ore and supply the miners.
In the 1890s a road was built from the north end of Lake Chelan farther up
the valley to Horseshoe Basin. Twenty-three miles of this road still serve as the
main road through the Stehekin Valley today. While the road was used to
transport ore from the mines to the lake, boats transported the ore down-lake to
Chelan and more populated areas. These first boats were steamships that ran
on wood taken from the local forests.
The trip up-lake on one of the steamships took so long that the
steamships were unable to complete a round trip in one day. Early visitors to the
Stehekin Valley could spend the night in M.E. Field’s first hotel, the Argonaut,
which opened in 1892. Also in 1892, the population in the village of Stehekin
became large enough to justify the opening of the valley’s first school.
The mines did not remain the basis of Stehekin life for long. It was not
economically feasible to transport the low-grade ore they found out of the valley.
The community of Stehekin continued to thrive even after the majority of the
mines closed. Residents prized, and still do, the rural and independent lifestyle
enforced by Stehekin’s isolated location as well as the beauty of the valley. M.E.

7
Field built a much larger hotel in the early 20th century which, sitting on the
shores of Lake Chelan, became renowned throughout the Pacific Northwest.
Tourists brought cash into the region, but for many years, locals continued to
obtain their goods and services through trade with residents up and down-lake.
Eventually, Stehekin residents had to forego this system of trading, in favor
of a more general use of currency. One of the main factors contributing to a
more general use of currency was the introduction of electricity to the region.
Until Art Peterson built his hydroelectric plant in the 1940s, the majority of
Stehekin residents heated and cooked with wood and used kerosene lamps.
Once electricity was available, at relatively low prices thanks to the Chelan PUD,
it became far easier to plug in a space heater than to chop down the necessary
wood. Now, cash was necessary to pay for the electricity and all of the
appliances that could run off of this new energy source. According to Grant
McConnell’s history of the area, Stehekin: A Valley in Time6, the advent of
electricity brought with it new levels of spending and new levels of debt.
“No study was ever made, but it is fair to guess that the increase of consumer debt in Stehekin was enormous. This was when some of those families that had come uplake to escape their problems and stay forever decided to move out. Others, including some of the longstanding residents, looked for ways to get more money.” (pg. 183)
With the arrival of electricity came many of the social issues that most of the US
had been facing for years. Stehekin was no longer the idyllic oasis it had been
touted as, free from social and economic conflict. Instead, it was a rather typical
rural town, with the added complication of isolation from the surrounding areas.

8
While this isolation was welcome for many aspects of Stehekin living, its impact
on the energy situation was not so amenable.
Art Peterson’s hydroelectric plant, located on Company Creek, was the
first electricity source in the Stehekin Valley. He provided electricity to several
residences near his facility and still had power left over. Other residents wanted
access to this power, and petitioned the newly created Public Utility District
(PUD) to take on Stehekin as part of its district.
In 1930 the State of Washington passed Initiative #1, which gave
individual counties the authority to operate electric and water utilities that would
provide services at cost. Chelan County organized its PUD in 1936. One of the
perks it promised to customers was rural electrification. Stehekin is one of
Washington State’s most remote towns and, as such, a good candidate for rural
electrification. Residents managed to eventually convince the PUD to include
Stehekin in its district even though administrators realized they would not be able
to recoup the money it would take to electrify the valley.7
Until Chelan PUD came into Stehekin in 1962 the main source of
electricity was Art Peterson’s hydroelectric system supplemented by individual
generators. The hydroelectric system was rated at only 65 kW and, due to its
age (the machinery dated from 1917), was no longer reliable. In 1963 the PUD
added a war-surplus diesel generator to supplement the power from the
hydroelectric facility. In 1967 Chelan PUD began construction of a larger hydro
facility on Company Creek. This plant was finished in 1968 and is capable of

9
producing 205 kW. Two diesel generators were installed to supplement the new
hydroelectric plant. In 1975 one of the generators was replaced with a 250 kW
generator, bringing the total capacity, including hydroelectric and diesel
generator facilities, to 600 kW.8
Since then Stehekin has not experienced any shortage of power, per se,
but residents dislike using the diesel generators and the system is not completely
reliable. Power outages are frequent, caused by fallen tree limbs and hiccups in
the generators. The diesel generators are quite expensive to run, as the diesel
fuel has to be barged up the lake. The engines are noisy enough that they can
be heard for a long way during the quiet winter months, and the pollution
produced is not compatible with the green philosophy embraced by many of the
residents. Unfortunately, during low-water times of the year the hydroelectric
facility does not produce enough power to satisfy the load, and even in the
summer the diesel generators are needed to meet peak loads. Options to
increase the capacity of the system are limited by the restrictions placed by the
National Park Service in an effort to preserve the local environment.
The first whispers about creating a national park in the North Cascades
were generated in 1910 by Portland’s mountaineering club, but the park did not
come into being until 1968, when President Lyndon Johnson signed the
legislation that created the national park and two recreation areas.9 At that point,
the Stehekin Valley and surrounding mountains first came under the
management of the National Park Service. Management by the NPS has been a

10
mixed blessing for Stehekin. On the one hand, the top priority of the NPS is to
preserve the scenic beauty of the valley, thereby ruling out development on any
large scale. On the other hand, the NPS now controls certain activities that
residents see as historical rights--in particular, the right to remove wood from
local land to use for space heating. These clashes of interest have caused some
friction, but so many of Stehekin’s residents have become involved with the NPS
in some form that the relationship has become a good one.
The land management requirements imposed by the NPS prevent the
possibility of creating a small reservoir that could store water to be used by the
hydro facility during peak power usage and low water times. The environmental
alteration required to create a reservoir is prohibited by the NPS. Such a
reservoir could solve the energy storage problem in Stehekin, but NPS rules
require us to look elsewhere.
Another of the NPS’s regulations prohibits disturbing a historical view
shed. A view shed is the land area that can be seen from a certain locale. In
order to preserve the historical integrity of Stehekin, no modern conveniences
should be visible from certain historical areas. This means that any alterations to
the energy infrastructure must not be visible from the National Park. In certain
areas, even solar panels are considered obstacles within the historical view
shed. While conducting this study these regulations had to be kept in mind. Any
realistic proposals could not significantly alter the environment or the view shed
of the Stehekin Valley.

11
Chapter 2: Stehekin’s Present Energy Situation
The information in this report regarding current energy usage in Stehekin
was taken from an energy study completed in 1992 for the National Park
Service.10 The energy situation has most likely changed in the last ten years
due to increased visitation to the North Cascades National Park, but the report
provides a good basis. Population growth in Stehekin is quite slow. The year-
round population is nearly steady while the number of seasonal visitors is slowly
rising. New construction is limited by the finite amount of private land and the
expense of building in a remote area. As an example, there have been only six
new structures, public or private, built in the valley over the last two years. Of
these six, not all of them are electrified. There has also been a movement away
from electric heat to the use of propane heat by the National Park Service and
the Stehekin Lodge. Rather than repeat the energy-use study of 1992, this
report focuses on energy solutions.
2.1 Electric Load
Chelan PUD reports Stehekin residents and visitors using an average of
1.2 million kWh of electricity each year.11 This number includes the electricity
used in residences, commercial buildings, and NPS buildings, and for processes
such as sewage treatment. It does not include buildings powered by individual
generators such as the Courtney Ranch.
The electricity is used to run appliances such as refrigerators and
microwaves, lighting, water heating, and some space heating. A survey

12
conducted by Chelan PUD reveals some of the energy use patterns of Stehekin
residents.12 All of the 24 year-round residences participating in the survey
heated primarily with wood. Of these residences, eighteen supplemented with
baseboard electric heat or portable electric heaters. While the majority of
seasonal residents also used wood as the primary heat source, 23% did use
electricity as their primary heat source. Most of the seasonal residents also
supplemented with baseboard or portable electric heaters. None of the private
residences used propane as a heat source at the time of the survey.
In contrast to the predominance of wood for space heating, most
residential water heaters used electricity. When the Chelan PUD survey was
taken in 1989, 88% of the residences had electric water heaters. Those water
heaters not using electric resistance heat were wood or propane-fired. Since this
survey, there has reportedly been some amount of fuel switching to propane for
space and water heating. The North Cascades Lodge, for example, recently
began using propane. Such a switch significantly decreases the 70,000 kWh of
electricity the lodge had previously used each year for space and water heating.
When the 1992 report was written, it was estimated that the private sector
used 42% of the electrical energy, the NPS 36%, and the concessionaire 22%.
An estimated 20% of all of the electricity went to space and water heating. Less
than 10% went to process electricity use such as the sewage plant and the solid
waste facility. If we conclude that the process electric use is indispensable there

13
is still quite a bit of room for conservation or fuel switching measures that would
significantly decrease the electric load.
2.2 Load Timing
The amount of energy used per day in Stehekin does not vary with the
seasons as much as expected for such a cold climate, according to the 1992
energy study. In the spring and fall, energy use is at its lowest and hovers in the
2000-3000 kWh/day range.13 The average power use in the spring and fall is
104 kW. In the summer and winter energy use is higher, generally somewhere
between 3000 and 4000 kWh/day, for an average power use of 146 kW.
Figure 2: Average energy use in Stehekin by season14
It is the load timing and magnitude, in conjunction with the water flow
available, that change from season to season, and these changes control
Stehekin’s dependency on the diesel generators. Below is the average electric
Seasonal Energy Use
0
500
1000
1500
2000
2500
3000
3500
4000
Average Daily Kilowatt-hours
kWh/
day Winter
SpringSummerFall

14
load in the high-season, defined by the tourist season from April to October, and
the low-season from November to March. These data were taken in 1988-89
using a sample day for each month. We have averaged the data. For both
seasons, the peak load occurs in the morning, with another upswing in the
evening.
Figure 3: Hourly changes in average electric load in winter and in summer15
In the low-season a good portion of the electric load is used for space
heating. This load does not significantly decrease during the night, placing a
larger base load on the system. The number of residents, however, does
decrease significantly. Visitors are few and far between in the winter, and
seasonal residents are generally only in Stehekin in the warmer months. As a
Energy Load in Stehekin (high-season and low-season)
0
50
100
150
200
250
0 6 12 18 24
Hour
kW
Low-seasonHigh-season

15
result of the diminished population, load increases due to lights, appliances, and
hot water usage do not spike as dramatically as they do in the summer. During
the low-season, the hydroelectric plant could, if running at its 205 kW capacity,
sustain the full load. Unfortunately, the flow rate in Company Creek, the stream
that supplies the hydroelectric plant, is diminished during the winter. In the
penstock, the typical spring/early summer flow of 17 ft3/s decreases to a typical
low of 10 ft3/s in the winter.16 Such a low flow rate means that the power plant
cannot meet the winter-time loads. The 205 kW rating is based on a flow rate of
19 ft3/s.17 With the lower flow rate of 10 ft3/s the hydroelectric system can
produce only 108 kW, which is below the winter load during much of the day.
During the early summer months the stream flow sustains the
hydroelectric plant, but increased loads still prevent the plant from meeting
Stehekin’s electricity needs. The summer population in Stehekin can, on
weekends, be five times the winter population. North Cascades National Park
draws more visitors every year, and Stehekin itself has become a popular tourist
destination. According to the 1992 report, the campgrounds, rental properties,
lodges, and summer residents add another 1500 kWh to the daily energy
requirement.18 This influx of people also produces large spikes in the electric
load in the morning and evening as people cook, shower, and turn on the lights.
If there were some way to store energy produced by the hydroelectric facility at
night, these peak loads would not be a problem. As with many renewable energy

16
applications, the main issue is one of energy storage. Possible solutions to this
problem are addressed later in the report.
2.3 Present Generation Capabilities
As noted above, Stehekin currently relies on the combination of the small
hydroelectric plant and three diesel generators for its grid electricity. The
hydroelectric plant is rated at 205 kW, but produces varying amounts of power
dependent on stream flow conditions. The diesel generators consist of one 75
kW induction generator and two 250 kW synchronous generators. The induction
generator is used to meet peak loads not covered by the hydroelectric plant. The
synchronous generators are used only when the hydroelectric plant is closed for
maintenance or producing very little power due to stream flow conditions. As of
the 1992 energy study, the hydroelectric plant was producing approximately 80%
of the electricity over the year, with the diesel generators producing the
balance.19
2.3.1 The Stehekin Hydro Facility
Stehekin’s hydroelectric plant was installed, in 1967, on Company Creek, a
tributary of the Stehekin River, to replace the 65 kW plant put in by Art
Peterson.20 Company Creek begins on Company Glacier on Dark Peak and runs
down the mountain to the Stehekin River losing approximately 2,000 feet of head
along the way. The entrance to the penstock is located about three quarters of a
mile from the confluence of Company Creek and the Stehekin River. At this
point, a grating spanning one third of the creek feeds water into the penstock.

17
A. B.
Grating Penstock Penstock Grating Figure 4: Photos and diagrams of the penstock entrance on Company Creek. Photos taken in September 2003. A: Side-view of the entrance. B: Top-view of the entrance
Even during the winter, when stream flow is at its lowest, a good portion of
the creek is diverted past the penstock entrance to maintain local habitat. The
penstock runs alongside the creek for the better part of its half-mile length.

18
Figure 5: The Company Creek Penstock
This water runs through the power plant before being released back into
Company Creek just before it meets the Stehekin River. When the water
reaches the power plant it has lost 240 feet (73.15m) of height from the
beginning of the penstock.21
The penstock itself is 24 inches (0.61m) in diameter and runs above ground.22
According to Mr. Karl Fellows, the plant caretaker, during the spring melt the
penstock carries 17 ft3/s (0.481 m3/s). In the middle of winter the penstock flow
can be as low as 10 ft3/s.

19
Figure 6A: June 2002 stream flow Figure 6B: Feb 2003 stream flow
The rated power of the hydroelectric system (205 kW) is based on a flow rate
of 19 ft3/s (0.54 m3/s), a value which rarely, if ever, occurs. Stream flow
variations are not the only factors affecting the power output of the facility. Pipe
friction lowers the actual head from 240 feet (73.15 m) to an effective head of
200 feet (61 m).23 These factors take effect before the water reaches the plant.
The turbine is a single-nozzle Pelton wheel supplied by the James Leffel
Company.24 The Pelton wheel is an impulse turbine, which means that it
responds to a jet of water hitting the cups placed along the wheel. It is the force
of the water hitting the cups that turns the wheel. Impulse turbines are
appropriate for systems with a relatively high head and low flow, such as this
one. In this case, the Pelton wheel works in conjunction with a 450 RPM Ideal
Electric synchronous generator capable of producing 285 kW of power.
According to a 1999 report done for Chelan PUD by Canyon Industries, there
is a fundamental flaw with the system. 25 The representative from Canyon

20
Industries recommends that a Pelton wheel have a wheel diameter to nozzle
diameter ratio of no less than 9:1. The Stehekin system has a ratio of
approximately 5:1. This results in a slower wheel velocity and, consequently, a
loss of efficiency. In fact, the system has an efficiency of only 63%. This
efficiency was found by dividing the electrical power output of the turbine at a
flow rate of 19 ft3/s by the total kinetic energy leaving the jet per second. If the
efficiency is calculated by dividing the potential energy per second of the water at
the top of the penstock by the electrical power output it becomes only 52%
efficient. It is quite difficult to prevent the losses due to pipe friction, so this report
will focus on the Pelton wheel losses.
The inefficiencies inherent in the system, along with stream flow variations,
prevent the system from meeting Stehekin’s electricity needs. By overlapping
the output of the hydroelectric facility at different times of year with the electric
load, the need for the diesel generators is revealed. In the summer, the
hydroelectric facility runs at 183 kW with a 17 ft3/s stream flow, but the increased
peak loads still trigger the diesel generators.

21
Figure 7: Stehekin hydro output compared to electric load
In this graph it becomes obvious that, on a typical summer day, the induction
diesel generator is required to meet the load during the morning peak. The data
for this graph were taken during random days during each month of the high
season. The resulting average does not display the peak loads that occur during
busy tourist weekends. For instance, in May of 1989 the evening peak load
reached 285 kW. Such a high peak load would probably require the entire load
to be switched to the synchronous diesel generators.
The average winter stream flow is approximately 10 ft3/s. With such a low
stream flow the hydroelectric plant can only produce 108 kW of electricity. Even
with the diminished load the system cannot meet the loads as is exemplified in
Figure 8.
High-season Hydropower Output vs. Load
0
50
100
150
200
250
0 6 12 18 24
Hour
kW
Maximum Hydro OutputHigh-season Load

22
Figure 8: Comparison of winter hydro output and electric load
Here it is obvious that the hydroelectric facility cannot meet even the base
load. While these conditions will vary from year to year, in winter the diesel
generators are in nearly constant use. (Note: The numbers for load used to
make this graph are nearly ten years old, and fuel switching to propane heat and
hot water has alleviated some of the winter load.)
There is another serious problem with this hydroelectric system other than its
inability to meet the electric load. The governor controls the power output of the
generator by changing the water jet deflector position in response to changes in
the load. Either due to age or inappropriate technology the governor process is
too slow to maintain the system at the electrical frequency of 60 Hz.26
Consequently, Stehekin’s electricity does not run at a “clean” 60 cycle. During a
visit to the power plant, the frequency ranged from 59.2 to 59.8 Hz. The
Low-season Hydropower Output vs. Load
0
20
40
60
80
100
120
140
160
180
200
0 6 12 18 24
Hour
Pow
er (k
W)
Winter Hydro OutputLow-season Load
23
fluctuating frequency causes problems with many of the electrical appliances
used by Stehekin residents. Clocks can lose up to an hour a week, kitchen
appliances controlled by internal computers malfunction, and personal computers
must be hooked up to uninterruptible power supplies. All of these problems are
manageable; battery-operated clocks, non-computerized appliances, and the
ready availability of UPS’s reduces them to a minor irritant. The problem
becomes serious when trying to add alternative power sources to the grid. As an
example, consider power produced by an array of solar panels. The direct
current created by the panels runs through an inverter which converts it to
alternating current. Inverters are programmed to produce a specific frequency of
electricity and are unable to match the fluctuations of the Stehekin grid. The
system will be unable to run the electricity from the solar panels into the main
grid. This same problem presents itself when using battery storage systems or
other generators. It must be solved before additions to the grid can be made.
2.3.2 Stehekin Diesel Generators
The diesel generators at Stehekin were installed between 1968 and 1975.
They are noisy and emit particulate matter and NOx into the air. Compared to
the price consumers pay for electricity, an average of $0.075/kWh, they are also
expensive to run.27 The cost of diesel along with the cost of barging the diesel
uplake and maintaining the generators brings the price of electricity from the
diesel generators to $0.15/kWh. The diesel prices are from several years ago,

24
so it can be assumed that with the increases in the cost of diesel, the generators
are even more expensive to run today.
The fuel delivery and use log of the Stehekin Power Plant allows
examination of trends in diesel use along with a calculation of generator
efficiency. In the early 1990s the diesel generators produced 20% of the
electricity in Stehekin.28 Based on this percentage, for 1.2 million kWh of
electricity produced each year, the generators are responsible for 240,000 kWh.
The log below shows a decline in the total amount of diesel used per year.
Presumably this is due to the propane use encouraged by the NPS. In 2001,
however, there was a jump in diesel usage close to the level of the early 1990s.
This may be due to a one-time energy use in February, as the amount of diesel
used then was beyond any amount previously used in one month, or it may be
due to the dry winter experienced that year.
Table 1: Stehekin diesel usage29
Stehekin power plant diesel usage in gallonsYear Jan Feb Mar Apr May Jun Jul Aug Sep Oct Nov Dec Total
1992 820 150 0 90 290 950 1510 1350 2230 1780 1110 3570 138501993 3180 2350 770 90 200 790 1690 1600 1235 1935 1620 2490 179501994 520 2510 530 130 150 430 1520 1080 2710 3060 2730 3040 184101995 4350 1360 360 190 70 190 390 1200 50 1280 3910 750 141001996 990 260 150 180 140 100 810 830 190 1670 370 3560 92501997 730 370 790 0 390 650 260 80 560 980 340 730 58801998 50 160 30 0 40 690 28601999 790 60 0 80 1240 160 620 2130 800 2202000 270 270 90 150 60 0 90 420 850 2620 1090 2360 82702001 1886 4764 2250 150 10 0 170 150 700 1230 1110 360 12780
Average 1359 1225 497 106 150 389 853 763 1016 1854 1377 1994 12561

25
Even with the reduction trend, Stehekin is still very dependent on diesel.
A chart of average monthly diesel usage shows high use in the fall and winter,
some use in the summer, and almost no use in the spring.
Figure 9: Diesel use in Stehekin
This pattern seen in Figure 9 follows from the combination of population
and stream flow fluctuations. In January and February diesel use is relatively
high. During these months stream flow is low, and the low temperatures
increase the electric load for space and water heating. Even with the diminished
winter-time population, the diesel generators are heavily used. In March diesel
use decreases, in part due to increased stream flow from thawing snow.
Temperatures are also higher, and less electricity is required for heating.
Average Diesel use by Month
0
500
1000
1500
2000
2500
1 2 3 4 5 6 7 8 9 10 11 12
Month
Die
sel U
se (g
allo
ns)

26
Starting in May the number of visitors increases and the generators are
necessary to meet the load. As the summer progresses more visitors come to
the valley at the same time as stream flow is decreasing. This leads to ever
increasing use of the diesel generators. The peak in July could be due to an
influx of visitors over July 4th weekend. The dip in November is most likely due to
the dwindling population. Through the months of September and October the
NPS gradually loses its seasonal employees. By November, the population in
Stehekin has hit its low point. There is another peak in December, most likely
due to visitors over the winter holidays.
There is no time of year when the diesel generators are not used to some
extent. It is a year-round problem with varying severity. From this information it
is possible to draft strategies that will address Stehekin’s unique energy situation.

27
Chapter 3: Energy Solutions
There are several options that would relieve the Stehekin energy problem.
None of these options, however, comes without a price. The price of an energy
solution has both economic and environmental components. This universal truth
takes on new importance in the case of Stehekin. Chelan PUD has lost money
on its operations in the valley almost every year since it took over the
hydroelectric plant. The PUD is very hesitant to commit resources to such an
unprofitable sector of its district. The NPS, on the other hand, places a high
value on the Stehekin environment, and will accept no solution that endangers
this natural resource. New energy infrastructure wouldl have an impact, so the
most environmentally friendly options must be considered. These options tend to
have a higher economic cost, which makes them less desirable to the PUD. In
order to meet the needs of the residents, PUD, and NPS, a workable solution
must be both affordable and environmentally friendly.
Another factor that must be considered when choosing an energy option is
who will pay the cost. The cost of changes to the centralized energy system
would most likely fall to Chelan PUD. Fuel switching measures or distributed
generation additions would be paid for by consumers with the help of incentives
from the utility. The cost of these solutions would not necessarily fall to the NPS
beyond its role as an electricity consumer. As a major consumer of Stehekin
electricity, and as the organization placing restrictions on new energy
infrastructure, it makes sense that the NPS would assume some responsibility for

28
the cost of updating the electric system. Whether it is willing to do this could
determine the viability of the following solutions. The willingness of all of the
parties involved to invest in Stehekin’s energy future will be as important as the
engineering aspect of a successful solution.
Many of the solutions that follow could essentially completely relieve the
need to use the diesel generators. The economic or environmental cost of using
just one of these solutions is often higher than using a combination. The most
workable solution is a combination of several of those in the following chapters.
The following solutions are sorted into three categories. The first category
has only one solution, and would solve the Stehekin energy problem by
connecting the Stehekin grid to the rest of the Chelan grid, effectively ending the
electric isolation of the area. The second category is demand-side management.
Before investing in new energy infrastructure it is advisable to examine the ways
the electric load can be reduced. Solutions in this category include conservation
and measures such as fuel-switching. The final category is supply-side
management. One way to control the electricity supply to better meet the needs
of the Stehekin community is to provide energy storage to help meet peak
demand with energy stored from low-demand times. Other methods to increase
the electricity supply include upgrading the hydroelectric facility and adding in
new methods of sustainable electricity generation. All of these solutions will be
discussed in the following chapters.
29
Chapter 4: Extend the Chelan Grid to include Stehekin
When Stehekin residents first petitioned the Chelan PUD to provide
electrical service to the area, the PUD investigated the possibility of extending an
existing transmission line to connect Stehekin to the Chelan grid. This extension
would involve construction of 15 miles of new transmission line through national
forest, and the rehabilitation of 35 miles of an abandoned line that still connects
to the existing grid. At the time the estimate was made (1959-1962) the cost of
the new line and rehabilitation was $186,000. This price, however, increased
tremendously when modified to meet the Forest Service’s requirement that the
line be placed in an inaccessible location to keep it out of view. Instead, the PUD
bought and rehabilitated the Peterson hydroelectric plant and installed two diesel
generators at a cost of $284,566.30
In 1965, when the Peterson plant was no longer sufficient to meet
demand, the PUD again investigated the possibility of connection to the larger
grid. The original estimate of $252,000 grew to an unmanageable $450,000 due
to Forest Service restrictions. Again, this possibility was dropped in favor of a
new local power supply. The new hydroelectric plant and some additional
distribution upgrades cost the PUD approximately $200,000.31
If the estimated cost of $450,000 was accurate in 1965, the cost of
extending the grid today would be $2.5 million.32 By imposing restrictions on the
placement of the lines, the Forest Service sought to minimize the environmental
impact of such an extension. While the line would, when completed, be nearly

30
invisible to park visitors, the environmental damage done during its construction
would be sizeable. Roads would have to be built through large sections of
previously undisturbed habitat. Access to the line would also have to be
maintained in case of damage to the line due to falling branches, wind, or fire.
The cost of maintaining such a line must be added to the construction and
environmental costs. If the frequency of line problems currently experienced in
Stehekin can be taken as an indication of the frequency of such problems along
the extension, maintenance would not be cheap. Whether the cost of
maintenance would be offset by the reduction in the current cost of maintaining
the isolated grid and power plant is unknown.
At time, the Chelan PUD does not believe the potential revenue from the
Stehekin Valley justifies the expenditure of such a large amount of capital. When
the PUD gave serious consideration to this plan the NPS had not yet been
established in the area. The development of the valley for recreational purposes
was seen as a real possibility.33 Since that time the NPS has imposed limits on
the development of Stehekin, thereby significantly diminishing potential growth.
Without this growth the demand for electricity will not increase enough to make
Stehekin a considerable source of revenue for the PUD.
Unless the situation in the valley changes drastically, solving the energy
problem by connecting Stehekin to the main Chelan grid is not a viable solution.
The economic and environmental costs are both intolerably high. It remains to
look elsewhere for a workable solution.

31
Part 2: Demand-side Management
In addressing the energy situation in Stehekin, the goal is to meet the
energy demands of the community, without using the diesel generators, and to
do so in as cost-efficient a manner as possible. Often, the best way to
accomplish this goal is by decreasing the demand for energy rather than
increasing the supply. Such a tactic is known as demand-side management.
There are several ways this could be done in Stehekin. Conservation through
the use of more efficient appliances and lighting could diminish the need for
electricity. Better equipping the built environment to cope with the climate of
Stehekin through the addition of insulation and high quality windows would
further reduce the load. Fuel-switching also has the potential to significantly
decrease the electric load.

32
Chapter 5: Conservation
In an area as isolated as Stehekin it is often easier to make do with what is
there rather than invest in new goods and buildings. While this means that
Stehekin residents are often less wasteful than the average American, it also
means that they are less likely to have the most technologically advanced
products. Newer buildings may have good insulation, energy efficient windows
and compact fluorescent lights, but many of the older buildings lack these energy
saving features. In the 1992 survey, 63% of those asked thought their ceiling
insulation was fair while only 30% thought it was excellent and 2 households had
no ceiling insulation.34 Seventy one percent of those surveyed felt their wall
insulation was below standard and 67% had little or no floor insulation.
Retrofitting buildings with more insulation would require some capital, but would
reduce the electric heating load. Unfortunately the statistics of Stehekin buildings
are not specific enough to allow quantification of the savings available through
added insulation.
The same is true for lighting. The switch from incandescent to compact
fluorescent light bulbs can save 76% of the energy used for lighting. A 14 Watt
compact fluorescent light bulb produces the same amount of light as a 60 Watt
incandescent light bulb. A survey by the Energy Information Administration
found that, on average, 9.4% of the electricity used in a household goes to
lighting. This amount is probably higher in Stehekin as most residents do not use

33
Figure 10: Electricity consumption by end use35
air conditioning and use wood for at least some of their space heating. This
means that the electric load at Stehekin could be decreased by more than 7%
through the use of energy efficient lighting.
The use of energy efficient appliances could further decrease the load.
Many of the newer and more efficient appliances use internal computers to
regulate energy use. These appliances have a tendency to fail in Stehekin due
to the frequency fluctuations in the electricity. Better management of the
frequency is necessary before the most efficient appliances can be used.
Finally, lifestyle changes could further decrease the electric load. Below is
a list of simple steps residents can take to reduce their energy consumption
without any capital investment:

34
• Turn down thermostats at night and when the building is unoccupied.
• Set thermostat temperatures higher in summer and lower in winter.
• Set water heaters to 120 degrees.
• Take shorter showers.
• Let dishes and clothes air dry when possible.
• Use lower temperature settings on clothes washers.
• Turn off lights when rooms are empty.
• Shut off computers when not in use.
• Use curtains to help control heat flow. During the winter open the curtains
on south-facing windows during the day to let in sun, and close them at
night to prevent heat loss. During the summer keep curtains on south and
west facing windows closed to prevent solar gain.
• Keep freezers full, to minimize unnecessary cooling.
• Close fireplace dampers when the fireplace is not in use to prevent heat
loss
It is not possible to quantify the reduction in electric load that could be
accomplished through conservation with the available information, but 10% (as
assumed herein) would be a low-end estimate. Some output of capital would be
necessary to accomplish these changes, and the electricity savings would
depend somewhat on the amount residents are willing to spend on more efficient
appliances and more insulation. It would also depend on the residents’
willingness to adopt a more energy efficient lifestyle. This solution is the most

35
economically and environmentally sound way to reduce the electric load. The
utility would not have to invest any capital, unless it was in the form of discounts
and incentives for more efficient appliances and to those residents willing to
upgrade the insulating properties of their homes. Residents would have smaller
electric bills. There are no environmental impacts related to reducing energy
use. The only possible problem would be the disposal of old appliances.
Stehekin residents have been known to simply place unused items in the woods
rather than pay for shipping them down-lake. This solution should be
implemented no matter what other tactics are taken to alleviate the Stehekin
energy problem.

36
Chapter 6: Fuel Switching
Stehekin residents could reduce the use of the diesel generators through
more use of the available fuels. As previously mentioned, 20% of the electric
load in Stehekin is met by the diesel generators. More than 20% of all of the
electricity produced is used for space and water heating.36 The process of using
electricity for space and water heating is much less efficient than directly burning
fuels to provide the heat. If electricity is used to heat, the fuel is burnt in the
generator, which produces the electricity, which is then transmitted to the location
at which it is needed, where it is transformed back into heat. Efficiency is lost at
every step in this process. Burning the fuel at the location to provide the heat
involves fewer steps, thereby decreasing the loss of efficiency. Modern gas
furnaces can be upwards of 90% efficient. This increases the efficiency from
about 30-40% with the diesel generated electric heating to 90% for the propane
heater. Wood stoves can also be used for space heating. While they are not as
efficient as gas furnaces, the fuel source is both sustainable and available locally.
The table below lists equivalent costs for the use of various fuels to heat a
Stehekin home for a year. It assumes that the average household requires the
equivalent of 14 million BTUs (MMBTU) of energy each year to meet space
heating needs.37 Average conversion efficiencies of the technologies used to
produce the heat are employed to estimate the amount of fuel required to fulfill
heating needs. The cost is then broken down into equivalent kWh and equivalent
MMBTU for purposes of comparison. This table makes it clear that wood is the

37
least expensive fuel, followed by #2 fuel oil and propane. It is most expensive to
heat with electricity, a practice that is all too common in Stehekin.
Table 2: This table was developed by Mark Longmeier of Northwest Energy Services for the 1992 energy study.38 The prices are updated for inflation.
The least expensive alternative fuel is wood, at $140/cord. This price
assumes that the wood is barged to Stehekin. Generally, the NPS supplies
firewood permits for a nominal cost of $15.00, and allows residents to take
enough wood from the surrounding area to heat for the entire year.39 This means
that it is not necessary to barge in wood to use for space heating. At the price of
$15.00 a year for a permit, wood is by far the most economical alternative. It has
the added advantage of being the traditional heating fuel for the area.
Wood was the first fuel used in the valley, and is still the primary heat source
for most of the full-time residents. When the mines were in use and the ferry was
steam-powered, an estimated 1650 acres of forest were logged in the Stehekin
Valley. Much of the old-growth Ponderosa Pine forest was replaced by faster
growing, but less fire-resistant Douglas and Grand Fir.40 Suppression of forest
fires caused these trees to form dense stands, making fires ever more likely.
Equivalent Equivalent EquivalentGross Input Efficiency Net Output Useful Heat Cost per Cost per
Amount Weight MMBTUs Conversion (avg.) MMBTUs Cost Cost kWh MMBTUWoodconventional 1.00 cord 2.00 Tons 28 50% 14 $140/cord $140 $0.03 $10.00new technology .75 cord 1.51 Tons 21.21 66% 14 $140/cord $105 $0.03 $7.40catalytic .67 cord 1.34 Tons 18.67 75% 14 $140/cord $93.80 $0.02 $6.60pellet 52 40#bags 1.04 Tons 17.5 80% 14 $190/ton $197.60 $0.05 $14.00
#2 fuel oil 124 gallons 938 lbs 17.5 80% 14 $1.50/gallon $186.00 $0.05 $12.70
Electrichydro 4,000 kWh 0 14 100% 14 $.08/kWh $320 $0.08 $24.00diesel 625 gallons 4,690 lbs 98.59 14% 14 $1.25/gallon $781.25 $0.20 $56.00average 4,000 kWh 0 16.9 83% 14 $0.1/kWh $400.00 $0.12 $31.00
LPGMarket 191 810 lbs 17.5 80% 14 $1.75/gallon $334.25 $0.08 $23.88NPS 191 810 lbs 17.5 80% 14 $1.20/gallon $229.20 $0.06 $17.00

38
When the NPS took over management of the valley, it also took control of the
cutting of wood for fuel. On principle, the NPS did not approve of Stehekin
residents taking wood from public land. Stehekin residents, on the other hand,
resented being told they could not take firewood from areas they have used for
generations. In 1987 the NPS implemented a firewood management plan that
set aside woodlots from which residents could cut their wood.41 In doing so, they
allowed the cutting of live wood, caused environmental problems due to the
necessity of roads to the lots, and failed to mitigate the fire hazard. To address
the fire issue, they began a series of controlled burns, starting in 1990.
By the mid 1990’s it was obvious that the firewood management plan was not
working. Residents were unhappy about having to use proscribed woodlots, and
the NPS was inadvertently causing environmental damage while not sufficiently
decreasing the risk of forest fire. In 1995 a new forest fuel reduction/firewood
management plan was implemented.42 This plan calls for manual thinning as
well as proscribed fires. The wood obtained through the manual thinning is sold
to a contractor, who, in turn, sells the wood to residents. It is ironic that the areas
that now require manual thinning, near roads and built structures, are the same
areas from which the residents previously took the majority of their firewood.
These areas, that are now referred to as fire corridors are easily reached and
were, therefore, more often used to provide firewood than sites farther away from
the community. Under this plan, an estimated 200 cords of wood are removed

39
each year, 60 cords more than the annual average amount of wood used by
residents between 1968 and 1986.
While wood heat is the best option based on local availability and cost, it does
have its drawbacks. Traditional wood stoves emit 37 pounds of particulates into
the environment for every ton of wood burnt.43 These particulates reduce air
quality, and may present a health danger. It is important to maintain air quality in
the pristine environment of North Cascades National Park, so emissions from
wood stoves must be controlled. Since 1992, the NPS has required that
residents convert to wood stoves meeting EPA emission guidelines before they
are allowed to buy firewood permits.44 These modern wood stoves use catalytic
converters or secondary combustion chambers to burn the particulates before
they are released into the air. The additional burning step also increases the
efficiency of the stoves. Modern wood stove technology has reduced particulate
emissions to 12 or 13 pounds per ton of wood burnt.45 Pellet stoves are even
more efficient than modern wood stoves, but their application in Stehekin is
limited by the availability of wood pellets. These would have to be shipped up-
lake, which would push their cost well above that of the locally available firewood.
The NPS would like the wood thinned from the Stehekin Valley to be used
locally. Local use avoids wasting the wood and the cost incurred in barging the
wood down-lake. As such, utilizing wood locally for space heat is the most
economical option. Until the availability of wood cut for thinning purposes

40
decreases, or the air quality in the area begins to suffer, wood should continue to
be used as the primary source of space heat.
In terms of price, the next fuel to consider for space heating is #2 fuel oil.
Fuel oil furnaces are quite efficient, and at $1.50/gallon the fuel itself is relatively
inexpensive. There are two major problems associated with the use of fuel oil.
The first is the pollution associated with fuel oil. Fuel oil emissions include sulfur
dioxide and particulates. The particulates correlated to fuel oil may have
hazardous chemicals adsorbed on to them. Second, and no less important, is
that fuel oil is a nonrenewable fuel. Use of this fuel contributes to the depletion of
a finite resource, a situation the NPS would like to avoid. The cost factor is the
only attractive aspect of this option.
Propane, or LPG, has many qualities that make it an attractive fuel for use
in Stehekin. It is significantly cheaper than heating with electricity, and has
reduced environmental impacts. While it is still a fossil fuel, and therefore, non-
renewable, its use produces fewer pollutants than either wood or oil. Both
furnaces and water heaters that run on LPG are readily available. They require
little maintenance, and LPG storage tanks already exist in Stehekin.
The switch to LPG space heating and water heating has the potential to
significantly reduce the electric load. The 1992 energy study provides estimates
for the amount of electricity used for space and water heating. By using an
average value for the electric load in the low and high seasons, it is possible to
estimate the reduction in electric load provided by the switch from electricity to

41
LPG. Data collected by the NPS and Chelan PUD between 1988 and 1992 were
used to determine the primary and secondary space and water heating uses in
Stehekin. A demand factor determined by Mark Longmeier was used to
calculate an average load for these systems.46 For this report, it is assumed that
all electric water heaters would be switched to LPG. Only those electric heaters
used for primary heat are assumed switched to LPG. Portable electric heaters
are probably a supplement to another heat source, such as wood. It is doubtful
that residents would add an LPG-fired furnace as a supplement to their primary
heat source. The graphs below show the relation of the current electric load, by
season, to the potential reduction with the use of LPG.
Figure 11: Comparison of the average high-season load with and without fuel switching
Effect, from April to October, of switching primary space heating and water heating to LPG
0
50
100
150
200
250
1 2 3 4 5 6 7 8 9 10 11 12 13 14 15 16 17 18 19 20 21 22 23 24
Hour
Load
(kW
)
Hydro ProductionHigh-season Avg. with fuel switchingHigh-season Avg.

42
Figure 12: Comparison of the average low-season load with and without fuel switching
In the high season the average load is cut enough to eliminate the need
for the diesel generators. There is, however, more to the story. The electric load
and the hydroelectric production vary over the seven months of the high season,
and not necessarily in parallel. There are more tourists, and a corresponding
increase in the use of water heaters, in the months of July and August when the
hydro production is starting to fall off from its spring high. The diesel generators
could still be necessary to meet peak loads at times during the high-season.
In the low season, the reduction in electric load does not eliminate the
need for the diesel generators, but it does lower the base load enough that it can
be met by the hydroelectric facility. With the base load met by the hydroelectric
Effect, from November to March, of switching primary space heating and water heating to LPG
0
20
40
60
80
100
120
140
160
180
200
1 2 3 4 5 6 7 8 9 10 11 12 13 14 15 16 17 18 19 20 21 22 23 24
Hour
Load
(kW
)
Hydro ProductionLow-season Avg. w/ fuel switchLow-season Avg.
43
plant, other technologies and conservation efforts could be used to meet the
peak load.
The promise of LPG becomes less certain when its history in Stehekin is
taken into consideration. In 1990 the NPS began changing out the wood stoves
in its facilities with LPG heating appliances. The purpose of this exercise was to
reduce the use of firewood without increasing the electric load.47 The NPS did
not, however, replace existing electric heaters with LPG. In 1992, Chelan PUD
offered a $500 grant to any resident willing to switch from an electric water heater
to a LPG water heater. Only 5 out of 112 customers took advantage of this
offer.48 It would appear that, despite its apparent advantages, the residents of
Stehekin, including the NPS, are reluctant to switch to LPG. There are several
possible reasons for this reluctance. First, while the difference in cost between
heating with electricity and heating with LPG is significant, it may not be enough
of an incentive when the capital cost of a new heating system is added in.
Second, the environmental implications of LPG use include some air pollution
and a significant amount of carbon dioxide. It would be ideal if all of the primary
energy sources used in Stehekin could be renewable. Third, electric heaters
require virtually no maintenance, while propane heaters have to be refueled and
adjusted occasionally. This combination of economic, environmental, and
upkeep issues, thus far, appears to have been enough to deter Stehekin
residents from switching their space and water heating appliances.

44
There are other opportunities for fuel switching in Stehekin, although they
are not as considerable as space and water heating. Electric stoves, ovens, and
refrigerators could be replaced by propane appliances. Electric clothes driers
could also be replaced by propane counterparts. Replacing these appliances,
however, would require a significant capital investment, which is a disincentive to
residents. On the other hand, all appliances and heaters running on alternative
fuels would be unaffected by failures in the electric grid.
With proper financial incentives, fuel switching could be a valuable tool to
cut the electric load. If enough of the population undertook this course, use of
the diesel generators could be nearly eliminated for more than half of the year.
Figure 13: Effect of fuel switching and conservation on the low-season load
Assuming a load reduction of 10% due to conservation efforts, then
switching space and water heating to LPG, the diesel generators would only be
Effect, from November to March, of conservation efforts and fuel switching
0
20
40
60
80
100
120
140
160
1 2 3 4 5 6 7 8 9 10 11 12 13 14 15 16 17 18 19 20 21 22 23 24
Hour
Load
(kW
) Hydro Production
Low-season Avg. w/ fuel switching andconservation efforts

45
required in the mornings during the low-season and periods of maintenance on
the hydroelectric system. This is shown in Figure 13.
The benefits derived from fuel switching and conservation are many.
Environmentally, reductions in diesel generator use, through increased use of
LPG, would be beneficial. The use of LPG produces very few particulates
compared to the use of diesel. The use of wood, while not necessarily reducing
the particulate emissions, would reduce the emission of the carcinogenic
components of diesel particulate matter. Economically, such a switch would
benefit Stehekin residents, as well as Chelan PUD. The cost of heating with
either wood or LPG is less than using electrical resistance heaters. Residents
would see energy bills decrease. The PUD would not incur the costs of running
diesel generators, and would, thereby, significantly decrease its yearly losses.
There remain, however, questionable aspects of such a course. Use of
wood heat has the potential to reduce air quality. While the toxicity of the emitted
particulate matter would decrease, an increase in the use of wood stoves could
cause an increase in the actual amount of particulate matter emitted. The NPS
may change its forest fuels management plan yet again, making firewood more
difficult to obtain. LPG is not a renewable resource. The price of this fuel could
increase above its current level. It also contributes to global climate change,
although less than frequent use of the diesel generators. As with all of these
possible solutions, some forethought and flexibility is necessary to apply fuel
switching in as productive a manner as possible.

46
Part 3: Supply-side Management
It is not clear that Stehekin residents are willing or able to implement the
fuel switching and conservation measures discussed in the previous sections.
Demand-side management, while the most cost-effective method of dealing with
the energy situation, may not be politically feasible. There is also the possibility
that demand for electricity will increase in the future. In order to address both of
these issues it is valuable to discuss supply-side management. The
requirements of the NPS, as well as the green ideology of many of Stehekin's
residents, mean that additional electricity production facilities should be
environmentally friendly and renewable whenever possible. The electricity
production technologies discussed in the next five chapters meet these
conditions. The cost of these solutions varies and may fall to a different extent
on each of the three stakeholder groups: the residents, the NPS, and the utility.
In the end, the technical feasibility of each solution, as laid out in this report, will
be only one factor in determining which energy solution will be implemented. It
is, however, an important factor, and it is the purpose of this report to provide an
adequate discussion of each possible solution. In the next five chapters the
addition of centralized and distributed storage facilities, an upgrade to the
hydroelectric plant, the addition of solar PV panels, and the potential for the use
of wind turbines in Stehekin are discussed.

47
Chapter 7: Centralized Storage
One of the appeals of using fossil fuels to generate electricity is the control
one has over the quantity and timing of the power produced. Electricity from
renewable resources is often less predictable. One cannot cause the wind to
blow harder at peak load times or, in the case of Stehekin, control stream flow to
match load patterns. The hydroelectric plant may be capable of producing 1.2
million kWh/year, but not all of these kWh’s are produced when they are needed.
The problem is one of energy storage. If the potential energy production of the
plant during the night, when load demands are low, were to be stored, the plant
would be able to meet more of the power demand during peak hours.
There are many energy storage technologies, but not all of them are
appropriate for Stehekin’s energy situation. The Electricity Storage Association
provides charts with comparative information about current electricity storage
technologies.49 Using these ESA charts and data about Stehekin’s electric load,
the appropriate technologies can be chosen.
In looking at the charts, the first consideration is the scale of the storage
system. To meet the needs of Stehekin, a storage system needs to be able to
discharge at a rate of 50 to 100 kW for a few hours.

48
Figure 14: Discharge times and powers of energy storage technologies50
This condition provides the first narrowing of the field. Pumped hydro
storage and compressed air energy storage (CAES) systems provide too much
power. Superconducting magnetic energy storage systems (SMES), high power
fly wheels, and high power super capacitors are not capable of providing power
for a long enough time period. Finally, metal air batteries, and long duration fly
wheels do not provide enough power. As previously stated, an appropriate
energy storage system for Stehekin must be able to provide between 50 and 100
kW for a few hours. This condition points to flow batteries and NaS batteries as
the most appropriate. To make certain that these technologies are feasible other
conditions were considered.

49
The next condition considered is cost. The EAS provides comparisons of
cost per unit energy and unit power.
Figure 15: Capital cost per unit energy and unit power of energy storage
techniques.51
The Stehekin application of a centralized storage system would be for
energy management. The technologies lower on the Y-axis of the above chart
are more cost-effective for such an application. This chart confirms that flow and
NaS batteries, as two of the energy management technologies in the mid-cost
range, could be appropriate for Stehekin.
Finally, life-cycle costs were taken into consideration. The chart below
compares the cost per cycle of the various energy storage technologies.

50
Figure 16: Capital cost per cycle of energy storage technologies.52
The capital cost per kWh over the lifetime of the appropriate technologies
is lowest for flow and NaS batteries. With this final condition met by these two
technologies it was decided to additionally investigate their suitability for
Stehekin.
7.1 Flow Batteries
Flow batteries differ from the more common lead-acid battery in the complete
reversibility of their processes and their high energy density. In the ZnBr flow
battery, the anolyte and catholyte are stored in separate tanks on either side of
the electrode complex. During the charging process, zinc is deposited as a thin
film on one of the electrodes, while the bromine reacts to form a dense solution in
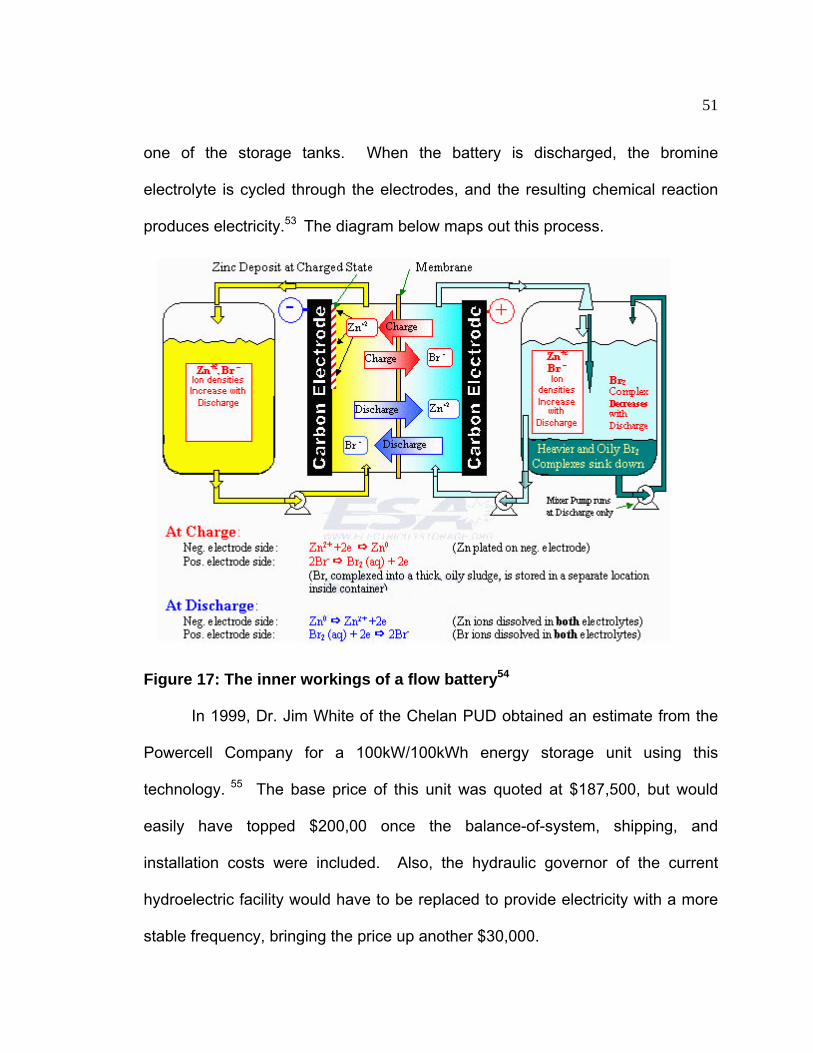
51
one of the storage tanks. When the battery is discharged, the bromine
electrolyte is cycled through the electrodes, and the resulting chemical reaction
produces electricity.53 The diagram below maps out this process.
Figure 17: The inner workings of a flow battery54
In 1999, Dr. Jim White of the Chelan PUD obtained an estimate from the
Powercell Company for a 100kW/100kWh energy storage unit using this
technology. 55 The base price of this unit was quoted at $187,500, but would
easily have topped $200,00 once the balance-of-system, shipping, and
installation costs were included. Also, the hydraulic governor of the current
hydroelectric facility would have to be replaced to provide electricity with a more
stable frequency, bringing the price up another $30,000.

52
If this centralized storage system was applied to the current Stehekin
energy situation, it would not provide enough power to eliminate the need for the
diesel generators. During the (early) summer months about 37 kWh is necessary
to make up for the deficit between the average electric load and the hydroelectric
output during the morning peak. This is well within the energy a 100kW/100kWh
system can provide. However, in the winter months the electric load is
consistently higher than the hydropower output. There is currently no excess
energy for the storage system to store. Until the base load is reduced below the
hydropower output, no centralized storage system will work.
If such a system were combined with the conservation and fuel switching
measures discussed in the previous section, it could alleviate the Stehekin
energy problem. The summer months would not require the use of the storage
system, except for power boosting during holiday peak loads. The maximum
peak load recorded during the summer months is 285 kW. Using the same
reductions as used in Chapters 5 and 6, conservation and fuel switching
measures would bring this load down to about 220 kW. If the hydro output is 183
kW, the storage system would need to provide 37 kW of power. This would not
be a problem for a 100kW/100kWh system. In the winter months with
conservation and fuel switching measures implemented, there is a daily, average
deficit of about 40 kWh, which could be met by the storage system. The winter
maximum peak load is 164 kW after conservation and fuel switching measures.

53
If the hydro output is 108 kW, the most power the battery system would need to
provide is 56 kW, again possible with the proposed system.
When trying to contact the Powercell Company for an updated price, it
was found the company is no longer in business. An internet search revealed
ZBB Energy Corporation that produces a commercially available 500kWh ZnBr
battery system.56 The system they are selling is available for $250,000.
Shipping and installation costs are not included. This system would be quiet, and
have virtually no environmental effects during its useful lifetime. However, due to
the low energy density of the batteries, the system would take up quite a bit of
room. The 500kWh model is mounted on a 30 ft. truck trailer, and would be
visible to anyone near the power station. This system is also much larger than
required by Stehekin, and smaller units may not be currently available. These
factors must be considered when choosing an energy storage system.
While the proposed centralized storage system will not alleviate the
Stehekin energy problem on its own, in conjunction with load-reducing measures,
it is a valid solution. ZnBr batteries are the least expensive, commercially
available large storage system. The chemicals in the batteries are corrosive, but
as long as proper precautions are taken, they should pose no safety hazard.
Such a system would have virtually no environmental consequences during use.
7.2 Sodium Sulfur (NaS) Battery
The NaS battery is a relatively new technology, which has been cultivated
by the Tokyo Electric Power Company (TEPCO) for large users in the Japanese

54
market. After testing and demonstration projects spanning two decades, the
company has come out with a commercial product. The U.S. company,
American Electric Power (AEP), is now testing this product in the domestic
market with several demonstration projects.57 While these products are not
readily available commercially, Stehekin could apply for a demonstration model,
or wait until NaS batteries come onto the market.
NaS batteries use sulfur as the cathode material and sodium as the anode
material. The electrolyte is a solid beta-aluminum tube with sodium ion
conductivity.58
Figure 18: Diagram of NaS cell and module59
During discharge the Na ions cross the electrolyte and react with the S to
form sodium polysulfide. This process is reversed during charging. For these
reactions to occur, the cells must be kept at 300 degrees C, a task which is
accomplished using the heat produced by the cells themselves.

55
The advantages of NaS technology are the high energy density, long
lifetime, and low amount of maintenance required. NaS batteries can provide
upwards of 100 kWh per ton. They require less space and weigh less than an
equivalently rated ZnBr battery. During its lifetime an NaS system should have
no adverse environmental effects. They are still in the demonstration phase,
however, so the cost of a system is a relative unknown. It is expected that the
capital cost per rated kWh will be about the same as that for ZnBr batteries, but
this could be several years away. The lifetime of an NaS battery is similar to that
of a ZnBr battery. If the NaS system is used 60% of the year, it will last for
approximately 12 years.60
7.3 Centralized Storage Summary
The idea of adding a centralized storage unit to Stehekin’s power system
has definite merit. It would allow the hydroelectric facility to be used at capacity
for almost the entire year. If the base load in winter could be decreased
sufficiently, such a system could essentially eliminate the need for the diesel
generators. The capital cost of approximately $200,000 for the 100 kW unit
proposed by PowerCell is high, but with Chelan PUD suffering a $48,000 loss
each year, it would pay for itself within five years. A combination of a centralized
storage unit with demand-side management is one option that would cost-
effectively solve the Stehekin energy problem.
There are a number of risks associated with the systems indicated in the
previous sections. The chemicals in the batteries are corrosive, and without

56
proper care could cause damage. The technologies are new and relatively
untested. Unforeseen maintenance issues could arise. These risks must be
balanced against the possible benefits of an energy storage system.
In applying this solution, there would need to be a number of intermediate
steps. The electricity at Stehekin would need to be regulated to a constant 60 Hz
by replacing the existing governor on the hydroelectric plant. Also, the wintertime
base load would need to be decreased below 108 kW so that it could be met by
the hydroelectric facility. Once these objectives are accomplished, the
centralized storage unit could be expected to provide the load-leveling that
Stehekin requires.

57
Chapter 8: Distributed Storage
Rather than provide one large energy storage unit, it is possible to place
smaller storage units throughout the grid. In this solution, individual buildings
such as private residences or NPS offices would house battery/inverter systems.
During non-peak hours the battery systems would charge, and release the power
as needed. The advantage of such a system over a centralized storage unit is
two-fold. Firstly, a distributed system would be more reliable than a centralized
system. If the centralized storage unit breaks down, there is no replacement,
except perhaps the diesel generators. If one or more of the distributed systems
goes off-line, chances are the rest of the systems could provide enough power to
prevent the need for the diesel generators. Secondly, and more importantly,
distributed battery/inverter systems would allow households to add their own
power generation sources to the grid. The residents of Stehekin value their
independent lifestyle. The idea of having their own sources of electricity is more
palatable than it would be to persons living in a less isolated area. The dubious
reliability of Stehekin power might also act as an incentive to install distributed
storage and electricity generation systems. With more power installed, the
system will become more reliable, and the entire valley will benefit.
Due to their isolation, Stehekin Valley residents have been forced to show
a good deal of ingenuity when approaching problems. It could only be beneficial
to allow them the opportunity to apply this ingenuity to their energy situation. As
long as the battery/inverter systems are compatible with the Stehekin grid,

58
residents’ energy production experiments will not interfere with the base
generating capacity.
It is difficult to quantify the cost of implementing this solution. Before it
could be done the frequency of the electricity must be regulated to allow the
distributed inverters to properly synchronize. This entails replacing the existing
governor at a cost of $30,000. It would then be up to the utility as to the amount
of financial support to provide to the residents for the purchase of the
battery/inverter systems. Based on the cost of the storage and inverter system
used at the Visitors’ Center, a system designed for a house that uses an average
of 2 kW, with a storage capacity large enough for one full day of off-grid power,
would cost between $6000 and $7000.61 The utility could obtain these systems
at a wholesale price and provide incentives to decrease the price for customers.
Alternatively, the utility could pay for a number of the systems in entirety, and
residents could scale back their storage to just meet the requirements for load-
leveling.
The environmental cost of these systems would be minimal as long as the
batteries were properly handled. The direct environmental cost would come in
the life-cycle of the systems. Lead-acid batteries contain harsh chemicals that
need to be properly disposed of once the batteries are no longer in use. During
the useful lifetime of the batteries, however, they should cause no significant
environmental degradation.
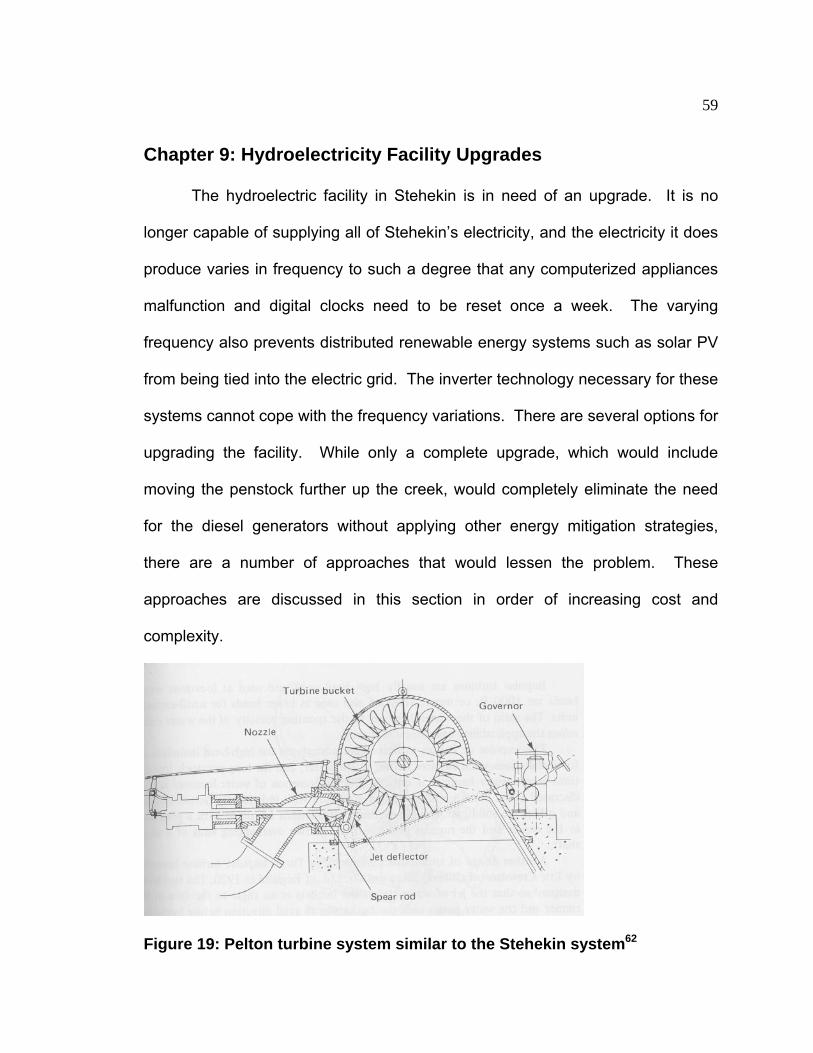
59
Chapter 9: Hydroelectricity Facility Upgrades
The hydroelectric facility in Stehekin is in need of an upgrade. It is no
longer capable of supplying all of Stehekin’s electricity, and the electricity it does
produce varies in frequency to such a degree that any computerized appliances
malfunction and digital clocks need to be reset once a week. The varying
frequency also prevents distributed renewable energy systems such as solar PV
from being tied into the electric grid. The inverter technology necessary for these
systems cannot cope with the frequency variations. There are several options for
upgrading the facility. While only a complete upgrade, which would include
moving the penstock further up the creek, would completely eliminate the need
for the diesel generators without applying other energy mitigation strategies,
there are a number of approaches that would lessen the problem. These
approaches are discussed in this section in order of increasing cost and
complexity.
Figure 19: Pelton turbine system similar to the Stehekin system62

60
9.1 New Governor and Jet-Deflector
In the Stehekin hydroelectric system, an electrohydraulic governor
controls the speed of the turbine by deflecting part of the water jet hitting the
runner in response to the changing load. If the load decreases without proper
controls, the momentum of the jet will cause the turbine wheel to spin faster. The
increase in angular velocity will cause a rise in the frequency of the electricity
generated. Conversely, if the load increases the frequency will decrease. Such
variation in the frequency will cause electrical appliances to run incorrectly. To
avoid the fluctuations, the governor deflects part of the jet, thereby maintaining a
constant angular velocity. When the load increases the governor will move the
jet deflector out of the path of the water jet to provide more power. As the load
changes throughout the day the governor responds by altering the jet deflector to
the proper position.
In Stehekin, the governor does respond to changes in load, but it does not do
so quickly enough to prevent changes in the angular velocity of the turbine
wheel. This is partly because the governor is an old model, and simply not fast
enough. Another factor is the size of the system relative to the size of the load.
In a larger system, a few appliances turning on or off do not make a substantial
difference in the overall load. In Stehekin a few microwaves turning off or on do
make enough of a difference that the governor has to adjust the water jet. If
appliances are turning off and on fairly frequently the governor cannot respond

61
quickly enough to control the angular velocity of the turbine wheel, and thus, the
frequency of the electricity fluctuates.
Installing a new governor and upgrading the jet deflector would provide
Stehekin with essentially constant frequency electricity. The new system would
respond more quickly to changes in the load, thereby limiting fluctuations in the
frequency. This modification would be necessary for the implementation of many
of the energy solutions discussed in this report. A 1999 quote provided to
Chelan PUD estimated a cost of $24,800 dollars to replace the governor,
deflector, and associated components.63 Incorporating inflation and the shipping
costs into the estimate gives a total cost of around $30,000. It will be almost
impossible to expand Stehekin’s electricity production capabilities without a
system capable of producing electricity with a steady frequency. The cost of this
modification is relatively inexpensive, and is justified by the potential benefits of
the steady frequency of the electricity.
9.2 Two-Jet Pelton Wheel
The efficiency of Stehekin’s hydroelectric facility is compromised by the low
runner to jet diameter ratio. In a standard system, this ratio is no less than 9:1.
The Stehekin plant has a runner diameter to jet diameter ratio of approximately
5:1 when the plant is running at designed capacity. With such a ratio there are
still methods to increase the efficiency to a certain extent, but the system will
never be as efficient as one more appropriately designed.64

62
Replacing the existing jet assembly with a twin jets could increase the
efficiency to 76%.65 Twin jets placed at opposing points on the turbine wheel
move the wheel more effectively than a single jet. Each jet would have a smaller
diameter, bringing the runner to jet diameter closer to 9:1. This efficiency level
would bring the rated power at 17 cfs to 221 kW, an addition of 40 kW. The
winter power level would be brought up from 108 kW to 130 kW. Such a change
would nearly eliminate the need for the diesel generators during the summer
months, and reduce the power required from them in the winter months. Another
advantage of these alterations would be the mechanization of the jet system.
Currently, the plant overseer must adjust the nozzle manually, depending on the
stream flow. In the winter, low flow levels can mean making daily adjustments.66
The cost of the alterations would be significant. A 1999 estimate of $86,300
includes a new runner, new jets, and a new governor-deflector assembly, but
does not include the cost of piping, valving, modifications to the powerhouse,
electrical work or freight. The addition of these elements more than doubles the
estimated cost, bringing the total to $193,800.67 This cost does include the
governor-deflector upgrade. This represents a serious capital output for Chelan
PUD with a questionable return. Chelan PUD engineer Dr. Jim White estimates
that these measures would save the PUD $15,000 per year. Currently the PUD
loses $48,000 per year due to its Stehekin holdings.68 This hydropower upgrade
would cut Chelan PUD’s loss to $33,000 per year, still a substantial loss. The

63
PUD is not eager to put out a large amount of capital on an upgrade that will only
partially reduce their yearly loss.
Techniques to increase the efficiency of the current hydroelectric system are
important, but the benefits of such an overhaul must be weighed against costs.
Since the diesel generators would still be necessary during several months of the
year, this alteration does not appear to be justified as the sole energy mitigation
technique. There is, however, merit to increasing the efficiency of existing
energy systems as much as possible. If this hydroelectric upgrade was coupled
with a fuel switching and conservation, the energy situation at Stehekin would be
much improved. The graphs below compare the winter and summer loads, after
fuel switching and conservation have been implemented, to the hydroelectric
output from the upgraded unit. February is also shown, because of its high peak
load.
The hydroelectric upgrade, when coupled with fuel switching and
conservation efforts, eliminates the need for use of the diesel generators in the
summer. In fact, the system is capable of producing far more energy than is
currently required by the Stehekin community. During February, when stream
flow is at its lowest and energy use quite high, the diesel generators would still be
necessary to meet the peak morning load. The reduction in diesel use, however,
is tremendous. This becomes even more obvious when the average winter load
is compared to the output from the upgraded hydroelectric system.

64
Figure 20: Reduced high-season load relative to increased hydroelectric output
Figure 21: Reduced February load relative to increased hydroelectric output
Effect, In High-season, of conservation efforts, fuel switching, and hydro upgrade
0
50
100
150
200
250
0 1 2 3 4 5 6 7 8 9 10 11 12 13 14 15 16 17 18 19 20 21 22 23 24
Hour
Load
(kW
)
Hydro OutputLoad with Fuel switching and conservation
Effect, in February, of conservation efforts, fuel switching and hydro upgrade
0
20
40
60
80
100
120
140
160
180
1 2 3 4 5 6 7 8 9 10 11 12 13 14 15 16 17 18 19 20 21 22 23 24
Hour
Load
(kW
) Hydro Production
Low-season Avg. w/ fuel switching andconservation efforts
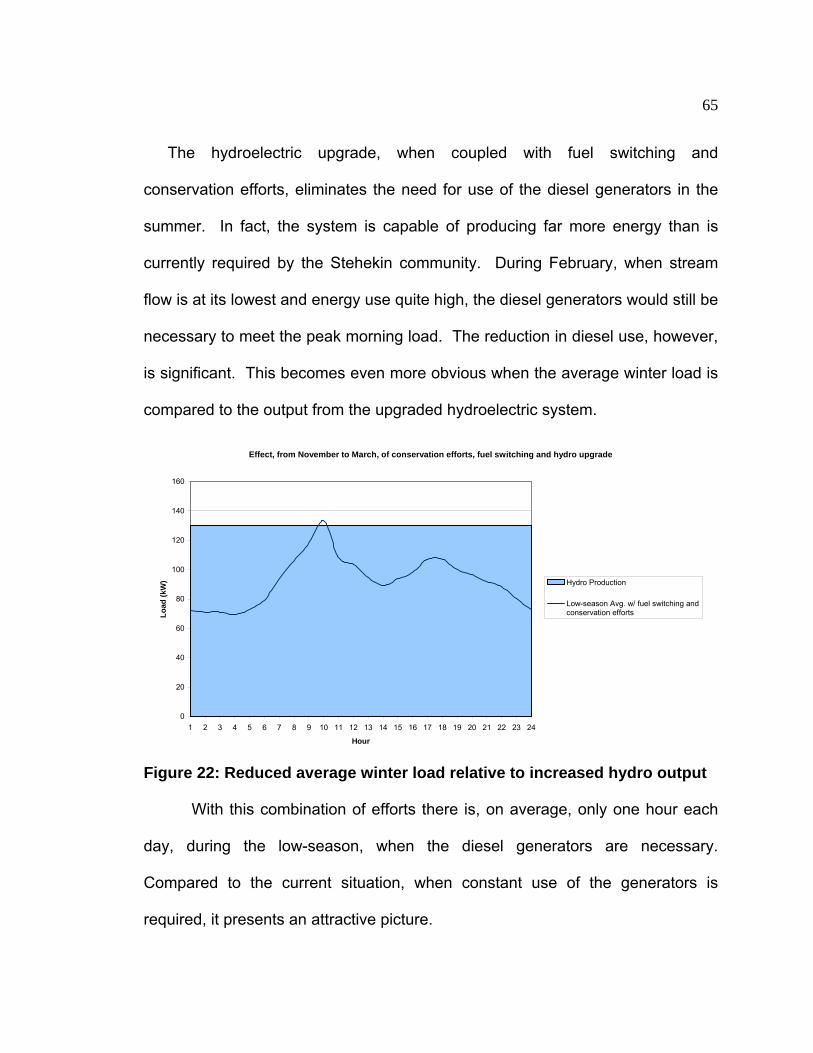
65
The hydroelectric upgrade, when coupled with fuel switching and
conservation efforts, eliminates the need for use of the diesel generators in the
summer. In fact, the system is capable of producing far more energy than is
currently required by the Stehekin community. During February, when stream
flow is at its lowest and energy use quite high, the diesel generators would still be
necessary to meet the peak morning load. The reduction in diesel use, however,
is significant. This becomes even more obvious when the average winter load is
compared to the output from the upgraded hydroelectric system.
Figure 22: Reduced average winter load relative to increased hydro output
With this combination of efforts there is, on average, only one hour each
day, during the low-season, when the diesel generators are necessary.
Compared to the current situation, when constant use of the generators is
required, it presents an attractive picture.
Effect, from November to March, of conservation efforts, fuel switching and hydro upgrade
0
20
40
60
80
100
120
140
160
1 2 3 4 5 6 7 8 9 10 11 12 13 14 15 16 17 18 19 20 21 22 23 24
Hour
Load
(kW
) Hydro Production
Low-season Avg. w/ fuel switching andconservation efforts

66
Such a solution has positive aspects for all the parties involved in the
Stehekin energy situation. Using the combination of a hydroelectric upgrade and
conservation and fuel switching Chelan PUD would no longer have to take a
large yearly loss on its Stehekin power system, and the residents and the NPS
would reap the environmental benefits associated with curtailed diesel use.
9.3 Two-Runner, Four-Jet Hydroelectric Plant
This option would increase the ratio of the runner to jet diameter to 8.3:1 by
aiming two smaller jets at each of two turbine wheels. The jets would be
positioned similarly to the two-jet system, but there would be two runner/jet
assemblies. The same turbine housing would be used, but the wheels would
have a diameter of 25 inches and the nozzles would produce 3 inches jets. The
efficiency of the Stehekin hydroelectric facility would increase to 79% if the
current single nozzle, single runner assembly was replaced by such a system.
Each nozzle would be designed to accept a flow of 5.5 ft3/s, increasing the total
flow to 22 ft3/s. At such a flow rate the new system would be able to produce 297
kW.69 Unfortunately, the hydropower system at Stehekin does not often see flow
rates this high. When the flow is less some of the nozzles would be blocked.
The 1999 estimate for the above modifications along with replacing the
governor and jet deflector was $102,500.70 The balance-of-system modifications
and the freight bring the price up to $210,000 in 1999 dollars.71 Without other
energy management measures, this solution would eliminate the use of the
diesel generators in the summer, but not in the winter months. When added to a

67
conservation and fuel switching program, the added efficiency would be enough
to eliminate the need for the diesel generators for almost the entire year.
This upgrade of the hydroelectric system increases its efficiency to 79%,
at an estimated price of $210,000. For $20,000 more than the cost of the
previous solution, there is a 3% efficiency gain. The cost of each point gain in
efficiency is $210,000/16 or $13,125. In the previous solution the cost per
efficiency point was $14,615. According to this calculation, the extra $20,000 is
well spent. While it would not eliminate the need for the diesel generators during
peak winter loads, it would meet the average summer and winter loads.
9.4 Increase the Effective Head of the System
In order to wholly meet the present electric load with the hydroelectric
plant, without taking additional water from the stream, the effective head would
have to be increased. The addition of another 1000 feet to the current penstock
would double the effective head to 122 m and, when combined with a new
turbine assembly, increase the available power to over 500 kW. The cost of such
an addition would be considerable, and it is uncertain whether it would be
allowed under NPS restrictions. A very rough estimate, using the cost of the
original system installation as a base price and accounting for inflation, gives a
cost of $900,000 for the upgrade.72 To this substantial economic cost must be
added the environmental cost of the new penstock and the construction thereof.
Currently, a dirt road follows the penstock for most of its length. A hundred yards
or so from the water intake site, the penstock crosses Company Creek veering

68
away from any visible access road. The installation of the new penstock would
necessitate a new road, thereby interrupting habitat. It would also alter stream
flow. While the difference is unlikely to be substantial, the stream flow further up
the creek will be lower as a result of a smaller runoff area. Removing the same
amount of water for the use of the power plant could interrupt local Kokanee
salmon migration, and negatively influence other flora and fauna. With both a
high economic and environmental cost this is solution that may not be acceptable
to the parties involved.
9.5 Relocation to a River with Greater Stream Flow
Company Creek is by no means the largest river in the valley. The
Stehekin River stream flow is six times as great as that of Company Creek, and
would certainly be able to meet all of Stehekin’s current and future electricity
needs. There is no doubt that the NPS will categorically forbid the disruption of
one of the larger rivers by a new hydroelectric facility. Unless the NPS leaves
the valley and development increases exponentially, this option will remain
unfeasible.
9.6 Summary of Hydroelectric System Upgrades
Of the five possible renovations to the hydroelectric facility discussed in
this section, there is only one that is essential. The current governor-deflector
assembly must be replaced in order to stabilize the frequency of Stehekin
electricity. Once this is accomplished the number of potential methods for
mitigating the use of the diesel generators increases. The other renovations

69
involve large investments of capital and, in some cases, the continued use of the
diesel generators. Stehekin is more a thorn in the side than a valuable asset to
Chelan PUD. Options that do not significantly reduce the yearly loss of revenue
in the Stehekin Valley will not be contemplated. On the other side of the issue is
the NPS. Any of the above options that would endanger the surrounding
environment cannot be considered. Under these restrictions the first three
solutions discussed in this section, involving upgrades to the Pelton wheel
system, remain viable. The optimum solution is to alter the system to a twin-
runner, four-jet system. The minimum that Chelan PUD must undertake for
many of the other energy solutions discussed in this report to be possible is the
upgrade of the hydroelectric governor-deflector system.

70
Chapter 10: Addition of Solar Photovoltaic Capacity
10.1 Solar Photovoltaic Background Energy from the sun drives most of the processes on which human life
depends. Without its energy, life on earth would quickly come to a halt. Humans
have harnessed the sun’s radiation to heat themselves and their homes for
centuries, but it is only recently that humans have been able to directly convert
this energy into electricity through photovoltaics. This technology has rekindled
interest in the solar resource. Instead of looking for sunny areas in which to grow
crops, people now look for sunny areas in which to place solar panels.
The Pacific Northwest is not an area often associated with a large solar
resource. Its image of incessant rain is, however, misleading. Those same
mountains that hold the clouds over western Washington and Oregon, prevent
that weather from traveling over their peaks into Eastern Washington and
Oregon. The eastern slopes of the Cascade Mountains are the beginning of a
climate region entirely different from that of western Washington and Oregon.
Summers are hot and dry, and winters bring snow pack that can last until April.
Eastern Washington and Oregon have a very different solar resource than
western Washington and Oregon. According to the map below, the area in which
Stehekin lies receives solar energy between 4.1 and 5.0 kWh/m2/day as an
annual average, while the average in western Washington is only 3.5 to 4.0
kWh/m2/day. This average is for a flat plate collector tilted at the local latitude
angle.73

71
= Stehekin
Figure 23: Map of the annual solar resource of the western US74
Stehekin’s annual solar resource is less than that of more southern states.
Parts of Arizona have an annual solar potential of 6.6 to 7.0 kWh/m2/day, more
than 1½ times the potential in Stehekin. The story changes somewhat if one
compares the average daily solar radiation by month rather than over the entire
year. Due to the tilt of the earth, the more northern parts of the United States
receive direct sunlight for more than 12 hours a day during the summer. The
difference this makes in the solar resource for time of year is visible in the
following maps.

72
Figure 24: Map of the US solar resource in July75
Figure 25: Map of the US Solar resource in February76

73
In Stehekin in July, a flat plate oriented south and tilted at 48°, Stehekin’s
latitude, will receive between 6 and 7 kWh/m2/day. This is the same amount that
a similar collector will receive in Arizona. The case is very different in February
when a flat plate in the same position will receive only 2 to 3 kWh/m2/day. In
Arizona, the same plate will still receive between 5 and 6 kWh/m2/day. This
difference explains the lower yearly solar potential of eastern Washington
compared to Arizona. It also suggests that it may be possible to successfully use
solar energy in the summer. Local levels of radiation can also vary due to small-
scale weather patterns and reflections off bodies of water or snow. Based on the
general data, as well as personal accounts from NPS employees, the NPS
decided to further investigate the possibilities for solar PV in Stehekin. This
section gives results from the investigation of Stehekin’s solar resource.
10.2 PV Technology and Cost
Solar photovoltaic panels have advanced tremendously since their
invention in the 1950s77. The early solar cells manufactured in Bell Labs had an
efficiency of 6% and were too expensive to be practical for common use. Solar
panels were first successfully used to power satellites. For such an application,
their cost was not an issue. Once there was a market for the panels, research on
photovoltaic materials accelerated. As the technology improved and the cost
decreased, use of PV panels became practical for more than just space
applications. With more efficient panels, it became possible to power remote
radios and other pieces of equipment located at a significant distance from the

74
electricity grid. Increased electricity prices and concerns for the environment
have further promoted the use of PV panels.
Purchasers of PV panels currently have three panel types to choose from:
single-crystalline silicon, multi-crystalline silicon, and thin-film panel.
The most efficient is the single-crystalline silicon panel. Large silicon
crystals are grown in the Czochralski process, which is quite expensive. The
crystals are then sliced into silicon wafers 200 µm thick. The wafers are doped
with boron and phosphorous to create a p-n junction, and are then treated with
an antireflective coating. The final step involves creating the conducting contacts
on the solar cells, and connecting them together to form a solar panel.
Figure 26: Single-crystal solar PV panels, Astropower 120 and Siemens SR5079
The solar cells on this type of panel are either round as they are grown in
crystal form, or cut into squares. The panels with round solar cells have an
unfortunate amount of blank space between the cells, while those whose cells
are cut into squares end up wasting a portion of the crystal. This spatial difficulty

75
is one of the drawbacks of the single-crystalline silicon solar panel, however, the
spatial drawbacks are offset by the high efficiency of such panels. In the
laboratory single-crystalline silicon cells have reached an efficiency of 24%. The
commercial panels of this type can have an efficiency 15% or slightly greater. 78
The second type of panel is multi-crystalline silicon. This technology
allows the use of less expensive manufacturing processes to produce the solar
cells. Multi-crystalline solar cells are sliced from a block of cast silicon. The
solar cells are then treated in the same way as the single-crystalline cells to form
modules. The casting allows for better control of the shape of the cells. The
rectangular shape means that there is no wasted space on the panels.
Figure 27: Multi-crystalline solar PV panels80
The disadvantage of multi-crystalline panels comes in the lower efficiency.
The haphazard growth of the crystals interferes with the process by which the

76
panels create electricity. By controlling the orientation and size of the crystals
the efficiency of these panels has been brought up to nearly 14%.
The final type of commercially available solar panel is less efficient than
the crystalline silicon panels, but can also be less expensive. Thin film panels
rely on a coating of photoactive material just a few microns thick. This material
can be amorphous silicon, copper indium diselenide, or cadmium telluride. The
last two materials have toxic properties which, thus far, have made them less
attractive to manufacturers despite their greater efficiency. The amorphous
materials are capable of capturing more light than the crystalline silicon. These
absorption properties lead to the use of less material and decrease the cost.
Figure 28: Thin-film solar PV modules81

77
Unfortunately, these panels are not as efficient as their crystalline
counterparts. Most thin-film panels made today use amorphous silicon and have
an efficiency of only 5 to 7%.
Application often determines the appropriate PV technology. If space is
an issue, it is desirable to use the most efficient panels, i.e. single-crystal silicon.
Fewer of these panels will be required to produce the same amount of power.
Multi-crystalline panels will take up slightly more space for a given rated power.
Thin-film panels can be produced on different substrates, such as roof tiles or
even windows. For building-integrated solar, thin-film panels have a decided
advantage. They can also be less expensive per rated watt than the other
technologies, although these savings can be lost in the extra installation costs
caused by the additional panel area per rated watt. .
The cost of PV panels has been dropping steadily. Increased demand will
encourage PV producers to employ mass production techniques which will
further decrease prices.
Figure 29: PV shipments increasing and PV prices decreasing over time82

78
Current prices can vary significantly depending on the panel-type, size,
and supplier. Below is a table providing some sample prices.
Table 3: Prices per rated watt of panels by several manufacturers.83 Monocrystalline Polycrystalline Thin film Siemens $5.79-$11.77
per rated watt
UniSolar $6.55-$9.29 per rated watt
Astropower $5.40-$5.59 per rated watt
Kyocera $5.71-$5.81 per rated watt
Evergreen $5.08-$5.44 per rated watt
Another factor that decreases the cost of a PV system is the possibility of
tying the system into the local electricity grid. When the panels are producing
more electricity than is used at the site, the electricity is fed into the grid, and the
utility pays for the extra power it receives. When the panels are not producing
enough power, electrical equipment at the site can draw from the grid. This
setup decreases the cost of the balance-of-system equipment necessary to
utilize the PV panels. In a system not tied into the grid, i.e. a stand-alone
system, batteries are necessary to store electrical energy and to provide power
when the electric load does not match the electricity production of the panels.
Batteries are expensive, and depending on the amount of storage necessary,
can significantly increase the cost of a PV system. Below is a table listing the
price of various grid-tied and stand-alone systems from a coop. These prices
include the panels, batteries, inverters, charge-controllers, and the other

79
components that are necessary for a functional PV system. Please note that the
price for the BP 1200 W stand-alone system is quite exceptional and includes
special rebate offers.
Table 4: Prices per rated watt of stand-alone and grid-tied PV systems84
BP 600 Watt BP 1200 Watt
BP 1120 Watt AP 1200 Watt
Panels Multi-crystalline
Multi-crystalline
Multi-crystalline
Single-Crystal
Stand alone/ Grid-connected
Stand-alone Stand-alone Grid-connected Grid-connected
Cost per Watt $8.95 $6.31 $5.41 $6.62
10.3 Design of Stehekin PV System
10.3.1 Design Constraints
In order to investigate the application of photovoltaic power at Stehekin, a
960-watt solar array was purchased and installed on the roof of the Visitors’
Center at Purple Point. This site was chosen for its southern orientation as well
as its visibility to both residents and visitors. The array and a previously
calibrated reference cell were monitored from July 2002 to February 2003. The
data collected from the photovoltaic panels, reference cell, and batteries have
been analyzed to provide a study of PV power in the Stehekin Valley.
10.3.2 Photovoltaic Array Design Process
There were several goals to accomplish in the design and use of the PV
system at Stehekin. First, the system needs to provide a significant amount of
power. To convince the NPS and the residents that solar energy is a viable

80
option in Stehekin, the system should be able to carry some important parts of
the electrical load of the building. Second, the system needs to be visible and
attractive to residents and visitors. Conspicuous and successful use of solar
panels is meant to prod others towards the use of PV power. Third, the system
needs to be expandable. Depending on the operation of the system during the
testing period, the NPS could further expand the system to provide most of the
power for the Visitors’ Center. Finally, and most important, the system needs to
be reliable and easily maintained. In order to obtain a fair assessment of the
resource it was necessary to design a system that could be easily maintained.
10.3.3 Design Solutions
The final design accomplishes all of the original goals. Rated at 960
watts, the solar array can run about half of the electrical equipment in the
Visitors’ Center. The panels angling up from the Visitors’ Center roof are quite
visible, and their uniform coloring is not unattractive. These panels are single-
crystalline silicon, and are efficient enough to provide the necessary power while
covering less than half of the roof. The inverter chosen for the system is rated at
2500 watts. This means that the NPS could expand this system to provide almost
all of the power for the Visitors’ Center. The inverter is set to control when and
how much power is going to the batteries and the load. The only maintenance
required is to change the tilt of the panels seasonally, and send the data card to
the UW once a month. During the design process it became clear that the
original system design would need to be modified in one important way. Initially,

81
the system was to be grid-tied, supplying power to the grid when not used by the
Visitors’ Center. The grid intertie had to be cancelled after the frequency
fluctuations in the Stehekin electricity came to light. The PV system inverter
would not be able to match the varying frequency causing the system to
malfunction. It was then decided to add battery storage, and to set up the
system as off-grid. This modification prevents the inverter from malfunctioning,
and provides power to dedicated equipment in the Visitors’ Center.
10.4 System components
The system installed at the Visitors’ Center was provided by Mr. David
Love of SunWize Technologies, Inc.85 It includes 8 solar panels, rated at 120
watts each, a mounting structure for the solar panels, a combiner box, eight 98Ah
gel deep cycle batteries, a 2500 watt inverter, a charge controller, and all of the
cables and breakers associated with the system. The total price of the system,
including freight, came to $9280. For a 960 watt system, this is $9.67/watt.
10.4.1 Solar Panels
The panels are Astropower 120 watt single-crystalline silicon. These were
chosen for their combination of high efficiency, acceptable price, and
appearance. The panel power rating of 120 watts applies when their
temperature is 25° C and they are exposed to 1000 W/m2 of solar flux.86 The
efficiency of the panels, based on their total area (including framing) and power
rating, is 12.3%. As the temperature of the panels increases above 25° C, the
efficiency decreases.

82
The graph below demonstrates how the power curves of the panels
change with increasing temperature and decreasing incident solar radiation. The
data for generation of these curves were supplied by the manufacturer.87
Figure 30: Power versus voltage curves for the AP120 panels at varying incident radiation levels and temperatures88
The maximum output of the panels at 1000 W/m2, 600 W/m2, and 400 W/
m2 respectively is 120 watts, 72 watts, and 47 watts. When the temperature of
the panel increases to 45°C the maximum power output decreases to 107 watts,
64 watts, and 42 watts. This represents a decrease of slightly more than 10% of
the possible power output in each case, or a 0.5% loss per each °C of panel
temperature rise.
Power vs. Voltage
0
20
40
60
80
100
120
140
0 5 10 15 20 25
Voltage (Volts)
Pow
er (W
atts
)
1000 W/m^2, 25C1000 W/m^2, 45C600 W/m^2, 25C600 W/m^2, 45C400 W/m^2, 25C400 W/m^2, 45C

83
The power output of the panels depends upon more than the incident
radiation and temperature of the panels, it also depends on the load attached to
the panel. For the panels to work at maximum efficiency, the load must draw all
the available power. If the load is not large enough the panel voltage will
increase and the current decrease. In this situation the panel is producing heat
to offset the difference between the load and power output. To use these panels
at their maximum efficiency a properly sized load must be attached.
10.4.2 Batteries
The power from the PV panels goes into a battery bank. The panels
charge the 24 Volt battery bank, from which the electrical load draws its power.
The battery bank consists of 8 East Penn Gel Deep Cycle batteries with a
storage capacity of 98Ah each.89 The 12V batteries are wired two in series and
four in parallel. Assuming a conservative cycle of charging between 20% and
80%, the storage capacity of the system is 5645 Watt-hours, enough to hold the
maximum energy the panels could produce in 5.7 hours of full sunlight. It is also
enough to run a building with a 2 kW load for 2.8 hours.
Gel batteries were chosen for their long life and low maintenance
requirements. Liquid batteries need to be vented every so often to prevent a
buildup of gas. Such venting could be dangerous in the enclosed closet used to
hold the batteries, inverter, charge controller, and associated equipment. Gel
batteries do not form gas in the same way, and do not need to be vented.90
These batteries have the characteristics required for the Stehekin system.

84
10.4.3 Inverter and Charge Controller
The Xantrex inverter and charge controller came as part of the Outback
Power System. They were sized to fit the system, but allow for expansion in the
load and number of panels. The PS2524 inverter can accept up to 2.5 kW of
power. This rating will allow the NPS to add 12 more panels to the system. The
inverter has several operating modes to correspond to different power generation
and load setups. The present system operates in float mode, which uses the
power from the panels to charge the batteries, which in turn are used to run the
load. For the Stehekin system, the inverter was set to hold the charge of the
batteries at 28.2 volts. Unfortunately, the inverter resets to the default setting of
28.8 volts, which is not ideal for this battery type, whenever it loses power. This
setting needs to be carefully monitored for proper battery maintenance. If the
hydroelectric facility is upgraded so that the frequency of Stehekin electricity
becomes stable, the inverter mode can be changed to put the extra power from
the panels into the grid. It can also charge the batteries from the grid when there
is not enough sunlight to keep them charged via the panels. These modes will
also change the operation of the charge controller whose purpose is to ensure
that the batteries are properly charged. The many functions this inverter can
perform provide the NPS with flexibility in the future use of the system. There is,
however, one issue with the PS2524 inverter that may limit its future use. When
the inverter is running it produces a very loud buzz that could be quite disturbing
to anyone in the vicinity of the system. Currently, the inverter is located in a

85
closet of the building being used as the Visitors’ Center. When the Visitors’
Center is moved to another location, an event which is supposed to take place in
the summer of 2003, this building will become a residence for NPS employees. It
is unlikely that the occupant of the room in which the inverter closet is located will
relish the buzz as background noise.
10.5 Photovoltaic Array Physical Setup
The photovoltaic array was installed with the help of Mr. Tom Langley of
the National Park Service. The Visitors’ Center faces 15 degrees west of true
south and has a roof pitch of 14.4 degrees. On this roof are placed the eight
panels on two panel mounts with adjustable tilt. The calibrated reference cell,
consisting of a single Astropower photovoltaic cell, is mounted on one of the
panel frames. This allows the panels to be tilted at different angles in the
summer and winter to maximize the incident radiation and prevent damage from
snow pack and ice. When the panels were installed the intention was to tilt the
panels to between 55 and 65 degrees only from Octobter to April. This would
serve to catch more of the beam radiation while preventing ice and snow from
building up behind panels and damaging them. After installation it was found that
a pipe coming out of the roof cast a shadow on one of the panels during the
morning. It was decided to raise the panels to avoid this shadow. For this
reason the panel tilt during the summer is 34.6 degrees. The wiring from the
panels and reference cell passes through the roof into a supply closet in the
Visitors’ Center. The supply closet houses the control panels, batteries, inverter,

86
charge controller, and data logger. From here power cords are strung to two
different points on the lower floor of the Visitors’ Center. The outlets are used to
run a large television monitor and a swamp cooler during the summer. During
the winter the load is switched to incandescent light bulbs of varying wattages.
Figure 31A: The PV panels mounted on Figure 31B: The inverter/battery Visitors’ Center roof before they were rack located in the Visitors’ Center tilted to 34.6 degrees closet 10.6 Photovoltaic Array Electrical Setup
As previously mentioned, the system has been set up as an off-grid
system with battery storage to run the loads for several hours. An electrical
schematic of the system is located in Appendix C. The system is wired for 24 V
DC and 120 V AC. The maximum power voltage of each panel is 16.9 V.91 In
order to create a 24 V DC system every two panels are wired in series. The
resulting four panel blocks are wired in parallel after running through a circuit
breaker in the supply closet. At this point a 60 amp-50 mv shunt is wired into the

87
system to permit measurement of the current coming from the panels. Another
set of wires is used to record the voltage coming from the panels. A data logger
is used to store the voltage and amperage data. The panels are then wired into
the inverter where the power produced goes into the batteries. The eight
batteries are also wired two in series, four in parallel to produce a 24 V system.
The power from the photovoltaic panels is used to charge the batteries while the
batteries run the system load. Wires from the batteries to the data logger are
used to record the battery voltage. The charge controller, hooked into the
inverter, maintains the batteries at the proper voltage and prevents overcharging.
10.7 Measurement of the Stehekin Solar Resource
As part of the experimental setup at Stehekin a reference cell was
calibrated to measure the solar radiation hitting the panels. The reference solar
cell is wired in a short circuit arrangement and was calibrated in Seattle against a
pyranometer during the spring of 2002. A data logger records the voltage across
a current shunt that varies with the solar radiation. The data are then converted
using the calibration graph to provide a measurement of the solar radiation.
The manufacturer’s short circuit temperature coefficient is applied to the
data to correct for temperature variation of the reference cell.

88
Figure 32: The diamonds represent data points taken from the reference cell at varying incident radiation. A trend-line was then used to extrapolate to other levels of incident radiation. The reference cell is enclosed in a clear, watertight box made of lexan
with its associated current shunt and thermocouple. The calibration was done
with the reference cell enclosed in the box to ensure uniformity of signal. The
box is bolted onto the same rack as the solar panels. When the panels are tilted
the angle of the reference cell also changes. This ensures that the reference cell
records the amount of solar radiation hitting the panels.
Reference Cell
y = 10.292x
0
200
400
600
800
1000
1200
0 20 40 60 80 100
mV
W/m
^2

89
Figure 33: Placement of the reference cell in relation to the PV panels
In order to confirm the radiation measurements of the reference cell, and
to compare the Stehekin solar resource to other areas in Washington, the
collected data were compared to data taken at the nearby ranger station at
Marblemount and in Spokane.92,93 Marblemount is in the North Cascades
National Park approximately 40 miles northwest of Stehekin, as the crow flies.
This is the closest site with solar data spanning a number of years. The
Marblemount data are a measurement of the incident radiation on a horizontal
surface. This measurement is useful to validate the summer data taken at
Stehekin when the panels were first installed and were at a tilt of 14.4 degrees.
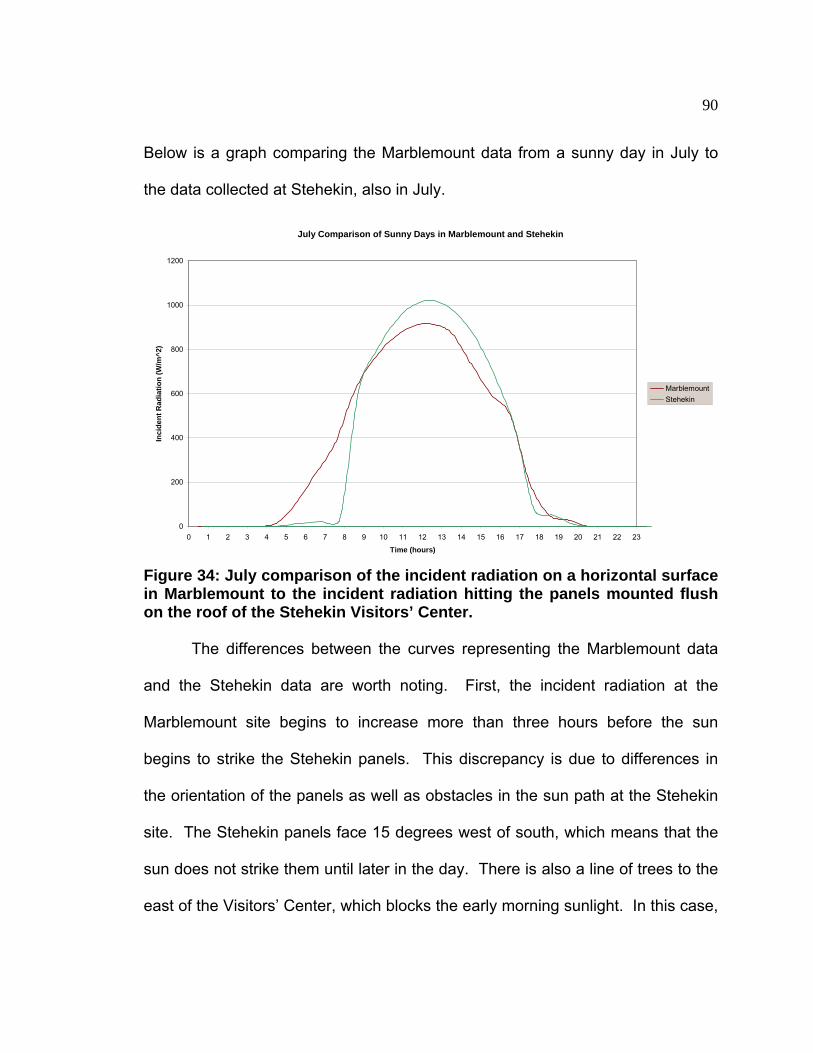
90
Below is a graph comparing the Marblemount data from a sunny day in July to
the data collected at Stehekin, also in July.
Figure 34: July comparison of the incident radiation on a horizontal surface in Marblemount to the incident radiation hitting the panels mounted flush on the roof of the Stehekin Visitors’ Center. The differences between the curves representing the Marblemount data
and the Stehekin data are worth noting. First, the incident radiation at the
Marblemount site begins to increase more than three hours before the sun
begins to strike the Stehekin panels. This discrepancy is due to differences in
the orientation of the panels as well as obstacles in the sun path at the Stehekin
site. The Stehekin panels face 15 degrees west of south, which means that the
sun does not strike them until later in the day. There is also a line of trees to the
east of the Visitors’ Center, which blocks the early morning sunlight. In this case,
July Comparison of Sunny Days in Marblemount and Stehekin
0
200
400
600
800
1000
1200
0 1 2 3 4 5 6 7 8 9 10 11 12 13 14 15 16 17 18 19 20 21 22 23
Time (hours)
Inci
dent
Rad
iatio
n (W
/m^2
)
MarblemountStehekin

91
the trees are responsible for most of the difference. Later in the year, when the
panels are at a greater angle the orientation will play more of a role.
The next aspect of this graph to note is the difference between the peak
incident radiation levels at the Marblemount and Stehekin sites. The data used
to make the Marblemount curve are from one of the sunniest days to occur in the
six years data were collected. While the Marblemount data do show a few
values over 1000 W/m2, these points occur only during sun breaks on partially
cloudy days. The Stehekin data, on the other hand, show the incident radiation
going over 1000 W/m2 on 11 of the 19 days in July during which data were
collected. As the sites are so close to each other there must be some technical
or site-specific characteristic to account for the difference. One possibility is that
the measuring device at the Marblemount site is miscalibrated and the readings
are too low. Conversely, the reference panel at the Stehekin site could be giving
readings that are too high. Assuming that the measuring devices at both sites
are functioning properly, the difference could be due to the topography of the
Stehekin Valley. Stehekin lies at the north end of Lake Chelan, hemmed in by
mountains on the east and west. The reflective surface of the lake, in
conjunction with the surrounding mountains, could act as a sort of parabolic
trough collector, focusing the radiation into the valley.
The Marblemount data proved difficult to use as a comparison to the
Stehekin data for the fall and winter months. No measurements of the diffuse
and beam components of the radiation were taken at Marblemount, forcing a

92
rather arbitrary calculation of the diffuse to beam ratio to be used when
accounting for the winter tilt of the Stehekin panels. Rather than use these
arbitrary procedures it was decided to compare the Stehekin data to data taken
in Spokane. The Spokane data include the diffuse and beam components of the
incident radiation. Using these data it is possible to calculate the incident
radiation on a tilted surface. The following figure compares the incident radiation
on a surface tilted at 55 degrees in October in Stehekin and in Spokane.
Figure 35: Spokane sunny day in October compared to Stehekin sunny day
In October, the incident radiation hitting the Visitors’ Center system is
more strongly affected by site-specific characteristics than in July when the tilt
angle is lower and the sun following a higher path. One result of these
October Comparison of Sunny Days at a Tilt Angle of 55 Degrees
0
200
400
600
800
1000
1200
0 1 2 3 4 5 6 7 8 9 10 11 12 13 14 15 16 17 18 19 20 21 22 23
Time (hours)
Inci
dent
Rad
iatio
n (W
/m^2
)
StehekinSpokane

93
characteristics is to make the Stehekin curve much narrower than the Spokane
curve. In the morning this is the result of the trees and mountains to the east of
the Visitors’ Center. In the evening it is the result of the mountains on the west
side of Lake Chelan.
To explore the idea of reflected radiation hitting the panels of the Visitors’
Center, the Spokane data were adjusted to find the percentage of reflected
radiation necessary to make the peak radiation values of both curves equal. It
was found that, in October, 14% of the radiation hitting a horizontal surface must
be reflected in order to make the peaks equal. This amount of reflection is
insufficient to make the peaks meet during the month of February. In the figure
below it was necessary to assume a 40% reflectivity to make the high value of
the Spokane curve match that of the Stehekin curve.
In February, the sun hits the panels for only 6 hours each day. The site-
specific characteristics, i.e. the mountains and trees, that narrow the Stehekin
curve in October continue to restrict daylight in February.

94
Figure 36: Spokane sunny day in February compared to Stehekin sunny day
One difference between this graph and earlier graphs is the shape of the
curve in the afternoon. Stehekin continues to receive large amounts of incident
radiation through the early part of the afternoon. The azimuthal angle, as
discussed earlier, does not account for the shape of this portion of the curve.
When the Spokane data are adjusted to find the incident radiation on a panel
facing 15 degrees west, the resulting curve (not shown) keeps the same shape
but is shifted to the right. There is some other factor responsible for the shape of
the Stehekin curve. It is likely that this factor is the reflection of the sun off
surrounding mountains hitting the panels. In mid-winter the valley and the
mountains are covered in snow. This bright white surface increases the amount
February Comparison of Sunny Days at a Tilt Angle of 55 Degrees
0
200
400
600
800
1000
1200
0 1 2 3 4 5 6 7 8 9 10 11 12 13 14 15 16 17 18 19 20 21 22 23
Time (hours)
Inci
dent
Rad
iatio
n (W
/m^2
)
SpokaneStehekin

95
of radiation hitting the panels during the few short hours of daylight. At the angle
at which the panels sit they could receive quite a bit of reflected radiation. The
combination of the azimuthal angle and the location of the panels exposed to the
snowy mountains is responsible for the sustained incident radiation hitting the
panels during the afternoon. According to a comparison with the Spokane data,
this reflectivity may be as much as 40%.
It is evident from these graphs that while Stehekin receives a large
amount of incident radiation on sunny days throughout the year, the surrounding
mountains and trees reduce the actual solar resource. During the winter months
the solar resource is constrained, not by the peak amount of incident radiation,
but by the short amount of time the sun's rays hit the valley. During the summer
months this solar resource translates into photovoltaics being a real possibility for
power production. In the next section the power produced during the summer
and fall of 2002, and the winter of 2003-2003 further explores this possibility.
10.8 Functioning of the Stehekin System
With the strong summer solar resource of the Stehekin Valley, the PV
array at the Visitors’ Center should produce a substantial amount of power. In
fact, the biggest problem encountered with the system was finding enough load
to push it to its maximum during the summer. During July and part of August in
2002, the main load on the system was a multi-media setup used to show a
video to visitors. This setup was left on 24 hours a day, and even so, did not use
the system to its potential. Figure 37 includes the solar radiation incident on the

96
system, the power produced by the PV panels, and the battery voltage. When
these data were taken, the panels were at a tilt of 14.4 degrees. The three days
shown are a sunny day, a day with some clouds, and a cloudy day. In each case
the power produced by the PV panels drops off after the batteries have been
charged. The graph shows how the charging of the batteries increases in the
morning to the maximum charge of 28.8 volts, floats during the rest of the
sunlight hours, and decreases during the night.
Figure 37: Tracking the system over three consecutive days in July 2002
As this graph illustrates, with the small load of the media center, the
system did not run near its capacity. On the cloudy day the panels were used
most efficiently, as evidenced by the way the power output of the PV panels
more closely tracks the incident radiation, but even on this day, the power drops
off as the batteries gain enough charge in the afternoon. In fact, the overall
July Incident Radiation, Power Output, and Battery Voltage
0
200
400
600
800
1000
1200
Rad
iatio
n (W
/m^2
)
20
21
22
23
24
25
26
27
28
29
30
Volta
ge (V
olts
) Incident Solar RadiationCalculated Data PV-PowerBattery Voltage

97
efficiency of the system during daylight hours in July is only 4.7% under this load.
This efficiency takes into account the power decrease due to increase in panel
temperature. To calculate the efficiency, the manufacturers short circuit and
open circuit temperature coefficients were applied to the current and voltage
measurements respectively. The use of these coefficients made it possible to
find how much power the panels would have produced at a given time if their
temperature was 25 degrees C. The rated panel area efficiency is 12.3% at 25
degrees C, so this represents a loss of 62% of the possible power due to load
mismanagement, not temperature increases.
The 1200 W/m2 incident radiation level on the partially cloudy day
deserves some explanation. It appears that incident radiation levels are highest,
not on perfectly sunny days, but on days with a mixture of sun and clouds. A
pattern of clouds with sun breaks increases the levels of diffuse radiation while
still letting through the beam radiation. Such a pattern is visible on several days
in Stehekin and was noted in both the Marblemount and Spokane data.
In August 2002, a swamp cooler was added to the load on the PV array.
The panels were also raised to a tilt angle of 34.6 degrees in order to avoid
shadowing by the conduit stand-pipe on the roof. The swamp cooler is used only
during daylight hours, and placed a significant load on the PV panels. This
increase in load improved the efficiency of the system to 9.7%, which is 78% of
the rated efficiency. The following graph, figure 38, shows the functioning of the
system with the increased load for three consecutive days. The first and third
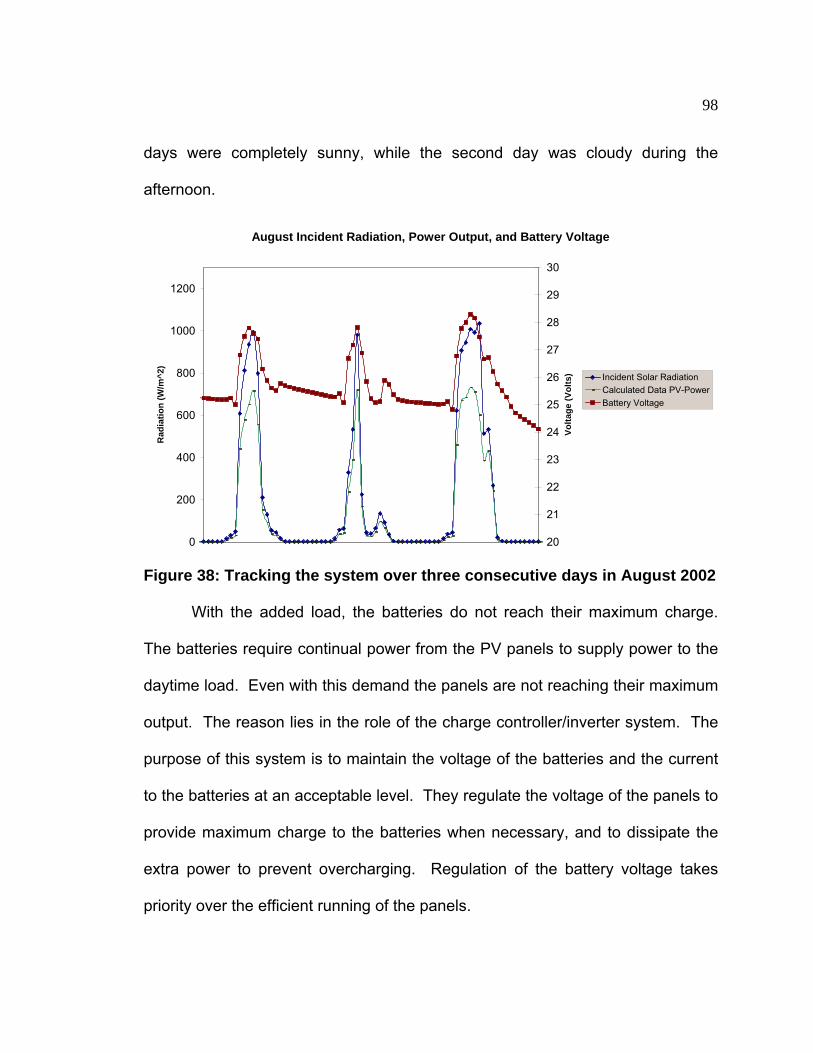
98
days were completely sunny, while the second day was cloudy during the
afternoon.
Figure 38: Tracking the system over three consecutive days in August 2002
With the added load, the batteries do not reach their maximum charge.
The batteries require continual power from the PV panels to supply power to the
daytime load. Even with this demand the panels are not reaching their maximum
output. The reason lies in the role of the charge controller/inverter system. The
purpose of this system is to maintain the voltage of the batteries and the current
to the batteries at an acceptable level. They regulate the voltage of the panels to
provide maximum charge to the batteries when necessary, and to dissipate the
extra power to prevent overcharging. Regulation of the battery voltage takes
priority over the efficient running of the panels.
August Incident Radiation, Power Output, and Battery Voltage
0
200
400
600
800
1000
1200
Rad
iatio
n (W
/m^2
)
20
21
22
23
24
25
26
27
28
29
30
Volta
ge (V
olts
) Incident Solar RadiationCalculated Data PV-PowerBattery Voltage

99
When graphing the data collected from the system over the power curves
of the panels, as obtained by the panel manufacturer, the functioning of the
system becomes obvious.
Figure 39: Collected data points from PV array compared to the manufacturer’s estimated power curves94
This graph shows the power curves for the panels when they are receiving
1000 W/m2 of incident radiation and are at 35˚C and 45˚C respectively, and data
points collected from the PV panels when the incident radiation was between 950
W/m2 and 1050 W/m2 and the panel temperature was between 35˚C and 45˚C.
There is a cluster of data points close to the open circuit voltage of the panels.
This situation occurs when there is insufficient load on the panels and they must
Power Curves for 1000 W/m^2 and Data Points
0
20
40
60
80
100
120
0 5 10 15 20 25
Voltage (V)
Pow
er (W
)
35C45CData 35C-45C

100
release the extra solar energy in the form of heat. The rest of the points show
increasing power with decreasing voltage, but the points only approach the
maximum power point. This condition occurs due to the management of the
panels by the charge controller/inverter system. This system maintains the panel
voltage at the voltage best suited to the batteries. It manages the current going
to the batteries in the same way. This voltage does not always coincide with the
point at which the most power is obtained from the panels.
In September of 2002, the tilt of the PV system was changed to 55
degrees above the horizontal to ready the system for winter. This added tilt
serves to catch more of the winter sun, and help to prevent snow build-up on the
system. In October of 2002, the Stehekin weather continued to be very dry and
sunny. The same loads were kept on the system, but the swamp cooler was
used less often due to the cooler temperatures. In November, as winter set in,
the Visitors’ Center was closed. As the media center was no longer needed, the
load was switched to incandescent lights of various wattages. The data recorder
was also run off of the solar panels. The data, therefore, show blanks when the
batteries reached their minimum charge of 22.2 volts and the system shut down.
Once the batteries reached the cut-in charge of 25.5 volts the system turned
back on.

101
Figure 40: Tracking the system over three consecutive days in November 2003
As is evident from the close tracking of the incident radiation and the
power output, the system is used to capacity during the winter months when
used to run a small lighting load. This loading of the system keeps the overall
efficiency at 9.0%. While the peak incident radiation is still quite high, the days
are too short to allow the batteries to fully charge. The inverter is set to charge
the batteries to 28.2 volts. During these three days the batteries only reached a
charge of 26.3 volts before the sun set. With this charge they could not maintain
the lighting load through the entire night.
The load in December 2002 follows the same pattern as that of
November. In January the load consisted of one 52 watt light bulb. Even with
such a small load, the panels could not maintain charge of the batteries, and the
system shut down after three days of overcast skies. In January the data logger
November Incident Radiation, Power Output, and Battery Voltage
0
200
400
600
800
1000
1200
Rad
iatio
n (W
/m^2
)
20
21
22
23
24
25
26
27
28
29
30
Volta
ge (V
olts
) Incident Solar RadiationCalculated Data PV-PowerBattery Voltage

102
was placed on utility electricity rather than making up part of the system’s load.
This allowed continued collection of data, even when the inverter shut down.
The overall efficiency of the system during January was 9.2%. In February the
52 watt load was maintained and the data logger plugged into the utility. The
second week of February brought clear skies, charging up the batteries enough
to run the 52 watt load. The following graph examines the functioning of the
Stehekin system during winter conditions.
Fig. 41: Tracking the system over three consecutive days in February 2002
The overall system efficiency for February is quite low, at 4.2%. This low
efficiency is partly due to the load being turned off manually several times to
prevent the inverter from going into a low battery charge error mode. When the
52 watt load was on, the efficiency increased to 6%. As evidenced by the above
February Incident Radiation, Power Output, and Battery Voltage
0
200
400
600
800
1000
1200
Radi
atio
n (W
/m2̂)
20
21
22
23
24
25
26
27
28
29
30
Vol
tage
(Vol
ts) Incident Solar Radiation
Calculated Data PV-Pow er
Battery Voltage

103
graphs, the 52 watt load was not enough to push the system to maximum power
for the length of a sunny day. This situation prevents the efficiency from being
higher. In this graph the function of the charge controller/inverter system
becomes clear. The batteries are temperature sensitive and are capable of
maintaining a higher charge when the temperature is lower.95 During February
the Visitors’ Center is not used and the building heat turned off. At such a low
temperature the batteries were able to charge up to 29.8 volts. The behavior of
the system during the winter months makes it clear that, even with the extra
charge, the battery bank would need to be larger and the load quite small for the
system to continue functioning properly.
10.9 Potential of Solar PV at the Visitors’ Center
While the efficiency of the Stehekin Visitors’ Center array has been less
than expected, the potential for use of solar energy during the summer months is
promising. The following table maps the solar potential and function of the
Stehekin system during the months it was monitored.
When calculating the efficiency temperature effects were accounted for as
previously discussed. The efficiency increased substantially when there was a
sufficient load. A correctly sized load would enhance the functioning of this
system.
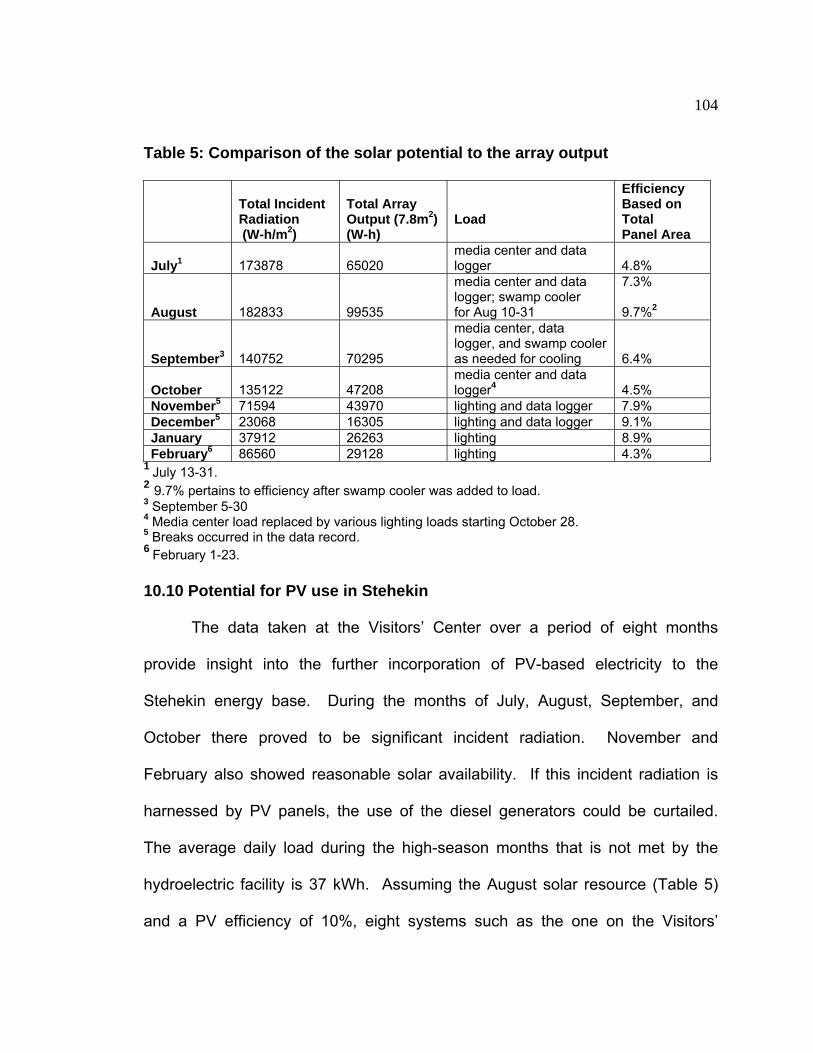
104
Table 5: Comparison of the solar potential to the array output
Total Incident Radiation (W-h/m2)
Total Array Output (7.8m2) (W-h)
Load
Efficiency Based on Total Panel Area
July1 173878 65020 media center and data logger 4.8%
August 182833 99535
media center and data logger; swamp cooler for Aug 10-31
7.3% 9.7%2
September3 140752 70295
media center, data logger, and swamp cooler as needed for cooling 6.4%
October 135122 47208 media center and data logger4 4.5%
November5 71594 43970 lighting and data logger 7.9%
December5 23068 16305 lighting and data logger 9.1% January 37912 26263 lighting 8.9% February6 86560 29128 lighting 4.3%
1 July 13-31. 2 9.7% pertains to efficiency after swamp cooler was added to load. 3 September 5-30 4 Media center load replaced by various lighting loads starting October 28. 5 Breaks occurred in the data record. 6 February 1-23.
10.10 Potential for PV use in Stehekin
The data taken at the Visitors’ Center over a period of eight months
provide insight into the further incorporation of PV-based electricity to the
Stehekin energy base. During the months of July, August, September, and
October there proved to be significant incident radiation. November and
February also showed reasonable solar availability. If this incident radiation is
harnessed by PV panels, the use of the diesel generators could be curtailed.
The average daily load during the high-season months that is not met by the
hydroelectric facility is 37 kWh. Assuming the August solar resource (Table 5)
and a PV efficiency of 10%, eight systems such as the one on the Visitors’

105
Center roof would be needed to produce 37 kWh of energy each day. At a cost
of $9280 for a system, this option would require an investment of $74,000.
During the winter months, these eight systems would not be able to make up the
difference between the electric load and the hydroelectric output, but they would
still provide between about 150 kWh and 600 kWh of electricity each month.
The solar PV systems would be spread throughout the Stehekin Valley.
With this in mind, a Solar Pathfinder was used to identify other possible sites for
the PV panels.
Figure 42: The Solar Pathfinder. Notice the reflections on the left and right side of the chart that would block the sun in the morning and evening.96

106
The Solar Pathfinder consists of a piece of reflective glass placed over a
solar chart. With the Pathfinder placed on a level surface it is possible to trace
the outline of any obstacles to the sun’s light over the course of a day. The solar
charts are drawn to accommodate the sun’s path at different latitudes. Once the
obstacles have been traced, the information on the chart allows a calculation of
the percentage of available sunlight that will hit a surface over the course of a
year. This calculation is not based on the percentage of sunlight making it
through the atmosphere, but on the percentage of the horizon blocked by natural
or man-made structures. The Visitors’ Center roof receives 88% of the possible
incident radiation in June and July, but only 57% in December.
Figure 43: Chart of the obstacles blocking the sun at the Visitors’ Center
Of the other potential sites for PV systems, the NPS Maintenance Center
is a good possibility. The Maintenance Center receives 87% of the possible

107
incident radiation in June and July, but only 53% in December. The Solar
Pathfinder chart for the Maintenance Center roof shows a pattern of obstacles.
Figure 44: Chart of obstacles blocking the sun at the Maintenance Center
The only site surveyed which receives more of the incoming radiation than
the Visitors’ and Maintenance Centers is the airport. Unfortunately, the airport is
not connected to the utility grid, so a transmission line would need to be installed
before a PV system could be located there. This extra expense must be taken
into consideration when deciding on future PV locations.
Other potential sites are located on private property, and could not be
surveyed. Support of PV installations on private property would be necessary to
successfully site the number of panels needed to make up the difference
between the hydroelectric production and the high-season electric load.

108
Use of Stehekin’s solar resource is one way to address the energy
problem in a sustainable fashion, but it does have its drawbacks. The daily solar
resource peaks during the middle of the day, while the electric load peaks in the
morning. For this reason battery storage systems are necessary. Such systems
add cost, and the lead-acid batteries can be hazardous if not handled correctly.
On a longer time-scale, the solar resource is greatest during the summer months,
while the difference between hydroelectric production and electric load is
greatest during the winter months.
One more factor needs to be addressed when discussing the solar
resource. The data taken from the PV system were collected over the course of
a single year. By chance, this year was one of the driest and sunniest years
experienced by the valley in some time. During the months of July, August, and
September of 2002, Stehekin received only 0.7 inches of rain, just 30% of the
normal 2.37 inches. Due to the below normal amount of precipitation, estimates
of the amount of solar resource may be overstated.
Even with these mitigating factors, solar PV presents an attractive picture
for the Stehekin Valley. The solar resource is available, and is a sustainable
option for reducing the use of the diesel generators. The unit expense is large
compared to other options discussed in this thesis, but the NPS has shown an
interest in PV systems. Installation of PV systems in Stehekin may make more
sense from a political standpoint than an engineering standpoint, but whatever
the justification it is still be a step away from use of the diesel generators.

109
Chapter 11: Wind Energy
Washington does not have the wind resource of other western states such
as Montana, but it does have isolated areas with a good wind resource. The
map below shows those areas with relatively high average wind speeds.
Figure 45: A map of the wind resource in Washington State. The darker colors have more of a wind resource.97
The areas of blue-green to maroon represent the windiest areas in the
state. The southern region near the Columbia River is quite windy, as is the
coastal region and the mountain ridges. Some of these areas are already being
developed by utilities and energy companies for the production of electricity from
wind turbines. The areas already under development have a number of
characteristics in common, and it is this combination of site characteristics that
makes them economically viable for wind power.

110
The first, and most important, characteristic is a high average wind speed.
The power in the wind is proportional to the cube of the wind speed, so small
increases in wind speed are correlated to large increases in power output. The
second characteristic is the geography of these areas. These areas consist of
rolling hills and large, flat ridgelines or other areas with approachable terrain.
Such terrain provides easy access for the construction and maintenance vehicles
necessary to a wind energy project. It may be quite windy on mountaintops, but
it would be extremely difficult to get a wind turbine to the summit. Finally, sites
selected are all close to existing transmission lines. Laying transmission line is a
costly endeavor, which quickly reduces the profit margin of a wind energy site.
Larger installations can afford to lay a couple miles of line, but small-scale wind
installations must be within a few hundred yards of existing lines.
In Stehekin, there are sites that have each of these characteristics, but no
individual site has all of these characteristics. The wind resource in Stehekin
was measured in two ways. First, an anemometer attached to a Fire Service fire
weather station located at the airport was used to collect data.98 This weather
station collects hourly data of wind speed and direction, along with air
temperature, and precipitation. The data collected over two summers were used
to graph the direction and velocity of the wind, in the hopes that the airport would
provide a good site for a wind turbine installation. These hopes proved
unfounded. The average wind speed at approximately 6 m elevation (the height
of the weather station), at the airport, is only 4 mph. The following graph displays

111
the percentage of time that the wind blows at various speeds from June through
September. The wind speed with the largest bar is 0 to 2 mph.
Figure 46: Percentage of time the wind blows at increasing speeds, Stehekin airport, summer 2001 and 2002.
According to this chart and the calculated average wind speed, the airport
at Stehekin is not a viable site for wind energy. A simple calculation was done to
see if the wind speed would be significantly greater at 20 or 40 meters elevation,
rather than 6 meters. With the assumption that the roughness of the airport was
similar to a grassy field, the average wind speed increased to 5 and 5.8 mph,
respectively. Small wind turbines, rated at 25 kW or below, become feasible at
average wind speeds of approximately 13 mph at a height of 20 m.99 Larger
wind turbines require even higher average wind speeds. The Stehekin airport
Wind Speed Percentages
0
5
10
15
20
25
30
35
Wind Speed
Perc
ent a
t win
d sp
eed 0-2 mph
2-4 mph4-6 mph6-8 mph8-10 mph10-12 mph12-14 mph14-16mph

112
does not have a large enough wind resource to support even a small wind
turbine.
There are no other weather centers in Stehekin, so the wind data collected
for the airport could not be compared to data collected from different sites. This
incomplete data set was supplemented by wind maps covering the area of
interest. Stehekin’s location at the foot of the mountains places it in the path of a
daily mountain/valley wind pattern. During the day the hot air rises off the
mountains pulling the valley air up. This process reverses during the night. On a
visit to Stehekin, the University of Washington team experienced stiff breezes in
the afternoon by the lake. Without data from an anemometer, wind maps created
by NWSEED were used to get an idea of the wind resource.100 These maps use
a wind modeling program to obtain average wind speeds. The wind resource
map of the Stehekin area is provided below.

113
Figure 47: Map of the Stehekin wind resource. Areas with darker colors have a better resource.101
The map of Stehekin’s wind resource shows the airport having a slightly
higher average wind speed than measured by the weather station. This
discrepancy could be due to over-prediction by the model or lower than average
winds during the period measured at the airport. The results by both methods
do, however, agree that the wind resource is not enough to sustain even a small
wind turbine. The wind map does show several areas that are potentially windy
enough to justify a wind turbine. Closer examination, however, reveals that the
windy areas follow the ridge lines above the valley. This presents a problem for
wind turbine installation, maintenance, and infrastructure. As previously
mentioned, successful wind energy sites are located on terrain that is not too

114
steep for machinery, and is close to existing transmission lines. Deviations from
this pattern incur significant increases in costs. Placing wind turbines on the
ridge lines around Stehekin would be prohibitively expensive in almost every
case. There is a ridge line very near to Company Creek, the creek on which the
hydropower facility is located. If the terrain at this location is not too steep, this
area would be the closest viable site to existing transmission lines.
Unfortunately, the University of Washington team did not investigate the site
while in Stehekin.
Even if the site were viable, the NPS could still present a significant
obstacle to the installation of a wind turbine. The turbines would be visible from
many parts of the park, including all of the surrounding mountains. As such, they
would disrupt the view shed, a situation that the NPS would like to avoid. This
might cause the NPS to cancel any plans to install a wind turbine.
If the NPS does not oppose the idea of wind turbine installation, the next
step would be to place anemometers and a recording device on the site at
varying heights. Such a device would record the average wind speed, and verify
the predicted resource before the large capital investment necessary for an
actual turbine is made. If the resource were verified, the governor/jet-deflector at
the hydroelectric facility would still need to be replaced before the electricity from
the wind turbine(s) could be added to the grid. Many turbines use an inverter to
match the electricity of the turbine and the grid. Once these steps are

115
accomplished the wind resource of Stehekin could be utilized to fill the gap
between the current electricity production and load.
In summary, there are a number of barriers to the use of wind energy in
Stehekin. First is the lack of verified wind resource in the valley. The only valley
data do not show enough wind to justify a turbine. Second is the location of
possible viable sites. These are located on ridge lines that could be difficult to
reach and require the laying of large amounts of transmission line. This situation
would increase the capital investment tremendously. Third, the governor at the
hydroelectric facility needs to be replaced in order to stabilize the frequency of
Stehekin’s electricity for the wind turbine inverters. Finally, the NPS would need
to sign off on the installation of wind turbines into the North Cascades National
Park view shed. As of yet they have been very resistant to the idea of any
interruption in the view shed. Without their approval, the inspection of possible
sites is not worthwhile.

116
Chapter 12: Conclusions
This report has investigated possible ways to decrease the electric load
and increase the electricity supply in Stehekin. While fuel switching would incur
use of non-renewable fuels, the rest of the solutions investigated make use of
renewable technologies. Not all of these technologies would be well applied to
the Stehekin situation. The wind resource is not large enough and it would be
prohibitively expensive to connect Stehekin to the Chelan grid. However, there
are several viable solutions to the Stehekin energy situation. These solutions
would not harm the pristine environment of the North Cascades. They would
provide high-quality electricity to all of Stehekin, and require little additional
maintenance. The table below lists the relevant characteristics of the solutions
presented in this report.
All of the solutions are based on three steps: an upgrade of the
hydroelectric governor/jet-deflector system and a combination of conservation
efforts and fuel switching. These three steps are Solution #1 in Table 6; they are
prerequisites for any effective and economic solution. However, Solution #1 will
not completely eradicate the need for the diesel generators. As this is a priority
for any energy solution, Solution #1 is not complete on its own. The addition of
energy storage or energy supply measures completes the other solutions offered
in Table 6.

117
Table 6: Comparison of possible energy solutions for Stehekin Solution #1 Solution #2 Solution #3 Solution #4 Components of Solution
-Hydroelectric Governor Upgrade -Conservation -Fuel Switching
-Hydroelectric Governor Upgrade -Conservation -Fuel Switching -Energy Storage System
-Full Hydroelectric Upgrade (with Governor Upgrade) -Conservation -Fuel Switching
-Hydroelectric Governor Upgrade -Conservation -Fuel Switching -Solar PV (ten 1-kW systems with batteries)
Summer/Winter Base Load
30 kW / 70 kW 30 kW / 70 kW 30 kW / 70 kW 30 kW / 70 kW
Summer/Winter Base Output
183 kW / 108 kW 183 kW / 108 kW 221-230 kW / 130-135 kW
183 kW / 108 kW
Summer/Winter Ave Peak Load
132 kW / 133 kW 132 kW / 133 kW 132 kW / 133 kW 132 kW /133 kW
Summer/Winter Peak Output
183 kW / 108 kW 233 kW / 158 kW (based on 50 kW x 2 hr system)
221-230 kW / 130-135kW
191 kW/ 115 kW
Maintenance Requirements
-no new requirements
-low requirement for storage system
-less hydro maintenance required
-low requirement for battery maintenance - 5 to 6 year battery replacement cycle
Environmental Issues
-use of non-renewable fuel -possible increase in particulates from increased wood use
-same as solution #1 -same as solution #1
-same as solution #1 -battery recycling
Diesel Use -still needed for peak winter and hydroelectric maintenance periods -possibly also for summer holidays
-probably only needed for hydroelectric maintenance periods
-only needed for peak loads in winter and hydroelectric maintenance periods
-same as solution #1
Estimated Cost to PUD
~$30,000 + cost of incentives
~$300,000 ~ $200,000 to $220,000
~$30,000 + cost of incentives
Estimated Capital Cost to Stehekin Energy-Users
~$1500 per water heater (lifecycle) -cost of other fuel switching and conservation dependent on household energy use and insulation -all costs dependent on PUD incentives
-same as solution #1 -same as solution #1
-balance of $100,000 plus installation costs

118
Solution 3 appears to be the most comprehensive and effective. The
PUD, perhaps in agreement with the NPS, would need to invest approximately
$200,000 to $220,000, depending on whether the 2-jet or 4-jet (2-runner) hydro
upgrade was chosen, with Stehekin energy-users investing in conservation and
fuel switching measures. These solutions are equitable in that both the PUD and
the energy-users are investing capital to alleviate the Stehekin energy problem.
As dollars per kW added, the cost of hydro upgrade is about $5000/kW based on
early summer stream flow, and $8000-$9000 per kW based on winter stream
flow.
Solution 2 appears to more expensive than Solution 3 when the cost of
hydro governor/jet-deflector system is added in and shipping and installation
costs are considered. However, the solution could eliminate the need for diesel
generator use except in cases of maintenance (and emergency). Table 6
assumes a two hour per day running of the battery system to provide peak
electricity. On this basis, the cost is about $6000/kW.
Solution 4 assumes the addition of 10 solar PV systems, each rated at 1
kW output. These systems, with battery storage, would have enough capacity to
overcome the summer shortfall between average peak load and hydroelectric
output (assuming early summer stream flow). Each system is assumed 10%
efficient in converting solar energy into electricity, meaning peak output is 0.8 kW
per system. (For winter, the peak output is assumed 0.7 kW.) The unit cost of

119
solar PV is higher than the other supply technologies: based on peak output of
0.8 kW, the unit cost is $12,500/kW.
Solar PV’s appeal lies in its simplicity and relative ease of installation, and
in the possibility of the NPS investing in solar PV installations for its facilities.
The NPS has done just this at other sites in Washington such as Mt. Rainier
National Park and Hozomeen in the North Cascades. A NPS investment in solar
PV in Stehekin would reduce the electric load on the hydroelectric facility and
spread the cost of Stehekin’s energy over all of the stakeholders. The downside
to this solution is that without the addition of energy storage or an upgrade to the
hydroelectric facility, the diesel generators would still be necessary at times.
At this point the engineering possibilities for Stehekin’s energy situation
have been explored. It is obvious that an upgrade of the governor/jet-deflector
system at the hydroelectric facility and the implementation of conservation and
fuel switching measures are the first steps. Beyond these first steps, Solution 3
appears more feasible, since it is based on proven, well established technology.
However, the decision may be a political one. The three stakeholders, Chelan
PUD, the NPS, and Stehekin residents, must reach a consensus as to who is
responsible for the energy situation. While the proposed options suggest ways in
which each stakeholder group can hold some responsibility for the Stehekin
energy situation, until a consensus is reached there will be no energy solution.
Stehekin has the potential to be a model for cooperation between disparate
stakeholders. The opportunity is there.

120
Endnotes 1McConnell. 2Longmeier. 3Ibid. 4Chelan PUD, Rate Schedules 5McConnell, pg. 5. 6McConnell, pg. 183 7Chelan PUD, Cultural Resources and McConnell 8Grant, Gordon, Personal Communication to Chelan PUD, 1970. 9Darvil, pg. 12 10Longmeier. 11Longmeier. 12Longmeier. 13Longmeier. 14Longmeier. 15Longmeier. 16Fellows, Karl, Personal Communication, 2002. 17New, Daniel Personal Communication to Jim White, Chelan PUD, 1999. 18Longmeier. 19Longmeier. 20Grant, Gordon, Personal Communication to Chelan PUD, 1970. 21New, Daniel Personal Communication to Jim White, Chelan PUD, 1999. 22Ibid. 23Ibid. 24Fulton, Doris, Personal Communication, 2003. 25New, Daniel Personal Communication to Jim White, Chelan PUD, 1999. 26Fellows, Karl, Personal Communication, 2002. 27Chelan PUD, Rate Schedules. 28Longmeier. 29Fellows, Karl, Personal Communication, 2002. 30Grant, Gordon, Personal Communication to Chelan PUD, 1970. 31Ibid. 32Friedman, S. 33Chelan PUD, Cultural Resources. 34Longmeier. 35EIA. 36Longmeier. 37EIA, household info 38Longmeier. 39Ibid. 40NPS. 41Ibid. 42Ibid.

121
43EPA, Emission Study. 44Longmeier. 45EPA, Emission Study. 46Longmeier. 47Longmeier. 48Longmeier. 49http://www.electricitystorage.com. 50http://www.electricitystorage.org/tech/technologies_comparisons_ratings.htm. 51http://www.electricitystorage.org/tech/technologies_comparisons_ratings.htm. 52http://www.electricitystorage.org/tech/technologies_comparisons_ratings.htm. 53http://www.zbbenergy.com/index.html. 54http://www.electricitystorage.org/tech/technologies_technologies_znbr.htm. 55Winter, Rick, Powercell, Personal Communication to Jim White, Chelan PUD, 1999. 56ZBB, Personal Communication, 2003. 57Transmission and Distribution World, 2002. 58http://www.tepco.co.jp/index-e.html. 59http://www.electricitystorage.org/tech/technologies_technologies_znbr.htm. 60http://www.electricitystorage.com 61Love, David, SunWize, Personal Communication to Philip Malte, 2001. 62Warnick, pg. 13. 63 New, Daniel, Personal Communication to Jim White, Chelan PUD, 1999. 64Ibid 65Ibid 66Fellows, Karl, Personal Communication, 2002. 67 New, Daniel Personal Communication to Jim White, Chelan PUD, 1999. 68White. 69 New, Daniel Personal Communication to Jim White, Chelan PUD, 1999. 70Ibid. 71White. 72New, Daniel Personal Communication to Jim White, Chelan PUD, 1999. 73NWSEED, Energy Atlas Viewer. 74Ibid. 75http://rredc.nrel.gov/solar/old_data/nsrdb/redbook/atlas/. 76Ibid. 77Boyle. 78Ibid. 79Astropower and Shell Solar. 80http://www.kyocerasolar.com/products/ksimodule.htm. 81http://www.uni-solar.com/PDF%20Files/US_32_42_64_Spec_Sheet.pdf. 82Holihan. 83http://www.realgoods.com. 84http://www.westernsun.org 85 Love, David, SunWize, Personal Communication to Philip Malte, 2001.

122
86Astropower, AP-120. 87Johnston, Michael, Astropower, Personal Communication, 2003. 88Ibid. 89http://www.eastpenn-deka.com. 90Ibid. 91Astropower, AP-120. 92http://www.epa.gov/castnet/metdata.html. 93http://rredc.nrel.gov/solar/old_data/nsrdb/hourly/. 94Astropower, AP-120. 95http://www.eastpenn-deka.com. 96Solar Pathfinder 97http://www.truewind.com/PDFWindMaps/Washington%20Wind%20Speed%20 Map%20-%20Final%20Revised.pdf. 98http://www.wrh.noaa.gov/missoula/nwsomso.sfcrgl.html. 99Twidell and Weir 100http://216.119.103.55/website/atlas/viewer.htm. 101Ibid.

123
References AstroPower, AP-120 Photovoltaic Module, www.astropower.com, 2002. AstroPower, AstroPower Products and Solutions,
http://www.astropower.com/Products.htm, 2003. Boyle, Godfrey (Ed.), Renewable Energy: Power for a Sustainable Future, Oxford
University Press, Walton St., Oxford, 1996. Chelan PUD, Chelan County PUD Electric Rate Schedule, Public Utility District
No. 1 of Chelan County, http://www.chelanpud.org/, 2003. Chelan PUD, Cultural Resources: Overview for the Lake Chelan Hydroelectric
Relicensing Project, Chelan County PUD Licensing Department, 2001. Darvill, Fred, Stehekin: A Guide to the Enchanted Valley, Darvill Outdoor
Publications, Mount Vernon, Washington, 1996. DOE, Small Wind Electric Systems: A Washington Consumers Guide, National
Renewable Energy Laboratory, 2002. East Penn-Deka, Valve-Regulated Lead-Acid (VRLA): Gelled Electrolyte (gel)
and Absorbed Glass Mat (AGM) Batteries, Technical Manual, http://www.eastpenn-deka.com, East Penn Manufacturing Co., 2003.
EIA, Household Energy Consumption and Expenditures 1993, Energy
Information Administration, 1993. (Table 3.1 for figure) EPA, CASTNET Hourly Meteorological Data,
http://www.epa.gov/castnet/metdata.html, 2003. EPA, Compilation of Air Pollutant Emission Factors, AP-42, Fifth Edition, Volume
I: Stationary Point and Area Sources, Environmental Protection Agency, 1998. (wood stoves: section 1.10).
ESA, Electricity Storage, http://www.electricitystorage.org/index.html, Electricity
Storage Association, 2003. ESA, Technologies: ZnBr,
http://www.electricitystorage.org/tech/technologies_technologies_znbr.htm, Electricity Storage Association, 2003.

124
ESA, Technology Comparisons, http://www.electricitystorage.org/tech/technologies_comparisons_ratings.htm, Electricity Storage Association, 2003.
Friedman, S. The Inflation Calculator. http://www.westegg.com/inflation/, 2000. Georgette, S., Harvey, Ann, Ten Years of National Park Service Administration in
the Stehekin Valley, WA: A Case Study, Publication No. 4 Environmental Field Program, U of C, Santa Cruz, 1980.
Holihan, Peter, Technology, Manufacturing, and Market Trends in the U.S. and
International Photovoltaics Industry, http://www.eia.doe.gov/cneaf/solar.renewables/rea_issues/solar.html, Energy Information Administration, 2003. (solar production and sale graphs)
Kyocera Solar, http://www.kyocerasolar.com/products/ksimodule.htm, 2003. Longmeier, Mark, Stehekin Energy Study and Strategy Recommendations
(Preliminary Draft), Northwest Energy Services, Inc, Spokane, WA, 1992. McConnell, G., Stehekin: A Valley in Time, The Mountaineers, Seattle, WA,
1988. National Weather Service Forecast Office,
http://www.wrh.noaa.gov/missoula/nwsomso.sfcrgl.html, National Oceanic and Atmospheric Administration, 2003.
NPS, Forest Fuel Reduction/Firewood Management Plan, Stehekin Valley Lake
Chelan, Denver, CO, 1995. NREL, National Solar Radiation Data Base Hourly Data Files,
http://rredc.nrel.gov/solar/old_data/nsrdb/hourly/, 2003. NREL, U.S. Solar Radiation Resource Maps,
http://rredc.nrel.gov/solar/old_data/nsrdb/redbook/atlas/, National Renewable Energy Laboratory, 2003. (us solar maps)
NWSEED, Energy Atlas Viewer, http://216.119.103.55/website/atlas/viewer.htm,
NREL Energy Lab, 2002. NWSEED, Renewable Energy Atlas,
http://216.119.103.55/website/atlas/viewer.htm, Northwest Sustainable Energy for Economic Development, 2003.

125
Real Goods, http://www.realgoods.com/renew/index.cfm, Real Goods Renewable Energy Catalog, 2003.
Schimmoller, Brian, Flexibility of emerging energy storage technologies offers
commercial promise, Power Engineering, November 2002. Shell Solar (previously Siemens Solar),
http://www.shell.com/home/Framework?siteId=shellsolar, 2003. TEPCO, NaS Battery for Energy Storage System, Tokyo Electric Power
Company, http://www.tepco.co.jp/index-e.html, 2003. Transmission and Distribution World, AEP Demonstrates NaS Battery Storage
Technology in the United States, http://tdworld.com/ar/power_aep_demonstrates_nas/, Oct. 2002.
True Wind,
http://www.truewind.com/PDFWindMaps/Washington%20Wind%20Speed%20Map%20-%20Final%20Revised.pdf, 2003.
Twidell, J., Weir, T., Renewable Energy Resources, St Edmundsbury Press Ltd,
Bury St Edmunds, Suffolk, 2000. Unisolar, Unisolar Specification Sheet, http://www.uni-
solar.com/PDF%20Files/US_32_42_64_Spec_Sheet.pdf, 2003. Warnick, C., Hydropower Engineering, Prentice-Hall, Inc., Englewood Cliffs, NJ,
1984. Western Regional Climate Center, Stehekin 3 NW, Washington,
http://www.wrcc.dri.edu/cgi-bin/cliMAIN.pl?wasteh, 2000. WesternSUN, http://www.westernsun.org, PV Systems, 2003. White, Jim, Stehekin Power Plant Options, Report for Metering and Technology
Committee, 2000. ZBB Energy Corp., http://www.zbbenergy.com/index.html, ZBB Energy
Corporation, 2003.

126
Appendices

127
Appendix A: Map of Stehekin*

128
Appendix B: Hydroelectric Facility Calculations Spring Flow = 17 ft3/s = 0.418 m3/s Winter Flow = 10 ft3/s = 0.283 m3/s Actual Head of System = 240 ft = 73.15 m Effective Head of System = 200 ft = 61 m Present System: Rated Flow of Present System = 19 ft3/s = 0.54 m3/s Rotor Diameter = 28 in = 0.711 m Jet Diameter = 5.6 in = 0.142 m Pitch:Jet = 5:1 Efficiency of Present System: η = Electrical Output/ Mechanical Input = 205 kW / ρQgH = (205 kW) / (1000 kg/m3 x .54 m3/s x 9.81 m/s2 x 61 m x 1 kW / 1000 W) = 0.63 High-Season Power Production: Phs = 205 kW x (17 ft3/s / 19 ft3/s) = 183 kW Low-Season Power Production: Pls = 205 kW x (10 ft3/s / 19 ft3/s) = 108 kW
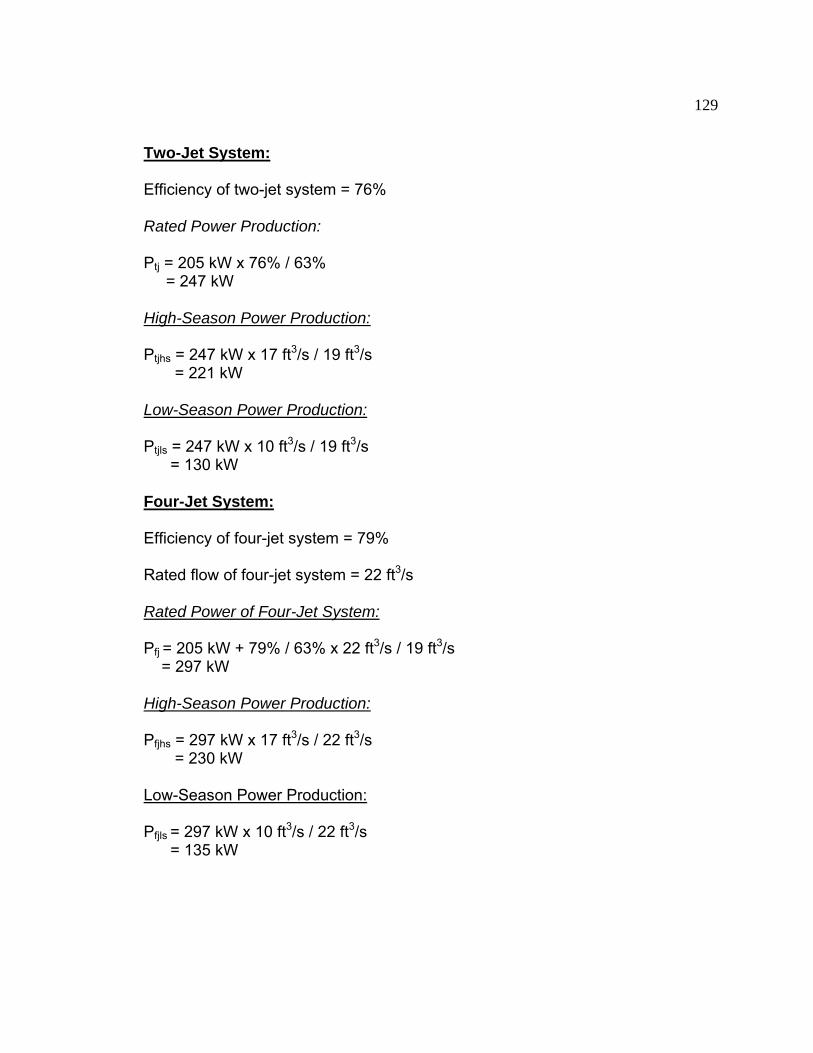
129
Two-Jet System: Efficiency of two-jet system = 76% Rated Power Production: Ptj = 205 kW x 76% / 63% = 247 kW High-Season Power Production: Ptjhs = 247 kW x 17 ft3/s / 19 ft3/s = 221 kW Low-Season Power Production: Ptjls = 247 kW x 10 ft3/s / 19 ft3/s = 130 kW Four-Jet System: Efficiency of four-jet system = 79% Rated flow of four-jet system = 22 ft3/s Rated Power of Four-Jet System: Pfj = 205 kW + 79% / 63% x 22 ft3/s / 19 ft3/s = 297 kW High-Season Power Production: Pfjhs = 297 kW x 17 ft3/s / 22 ft3/s = 230 kW Low-Season Power Production: Pfjls = 297 kW x 10 ft3/s / 22 ft3/s = 135 kW

130
Appendix C: Electrical Schematic of
Visitors' Center PV System

131
Appendix D: Reference Cell Circuit Diagram

132
Appendix F: Comparing Stehekin with Spokane
October:
1. Stehekin solar data were measured using the reference cell attached to
the PV array on the roof of the Visitors’ Center. Tilt angle = 55 degrees,
and azimuth angle = 15 degrees west of true south.
2. Spokane solar data were taken from the NREL Hourly Solar Radiation
Database.
3. Sunny day Spokane data applied to Stehekin setup using the tilt angle of
Stehekin array, azimuth angle of zero, and reflectivity of 0.14 for the
surface in front of the array. [The reflectivity was picked so that the peak
solar flux found using the Spokane data matched the Stehekin peak
measurement.]
February:
1. Same as October.
2. Same as October.
3. Same as October, except reflectivity increased to 0.40 to account for
reflection of sunlight off snow covered terrain seen by the array.

133
Appendix H: Visitors’ Center PV System Data
Azimuth Angle:
15 degrees west of true south
Tilt Angle:
July 13 (first day of data collection) to July 26, 2002: 14.4 degrees
July 26 to September 15, 2002: 34.6 degrees
September 15 to February 23, 2003 (last day of data collection): 55 degrees
Load:
July 13 to August 10, 2002: television and VCR
August 10 to October 28, 2002: television, VCR, and swamp cooler
October 28 to February 23, 2003: various lighting
Note 1: the load also included the data logger until January, when the data logger
was switched to the building grid electricity.
Note 2: the swamp cooler was used significantly during August, with use falling
off in the autumn. By October little if any use occurred.