balanced score card review of october 2015 data€¦ · · 2015-11-25• cuh /smoh actual...
TRANSCRIPT
Balanced Score Card Review of October 2015 Data
Balanced Scorecard
Finance Patient Access
Quality
&
Safety
Human Resource
Management

Finance

Finance Report – October 2015
Actual outturn YTD - October 2015
• Group budget €235.2m (2014 €228.3m)
• Group actual expenditure €236.5m (2014 €235.8m)
• Group actual deficit €1.3m ( 2014 : €7.5m) • Less: Additional bad debts provision re MOU €1.1m
• Loss of earnings –Radiation therapists €150k
• Waiting list penalties €170K
• Adjusted group surplus –YTD Oct €0m
• CUH Budget €220.8m (2014:€212.5m)
• CUH /SMOH actual expenditure €222.6m (2014 €219.6m)
• CUH /SMOH actual deficit €1.8m (2014 €7.1m)
• Adjusted deficit (excl bad debt/LOE)–ytd Oct €0.4m
• Mallow Budget €14.4m (2014:€13.9m)
• Mallow actual expenditure €13.9m (2014 €14.3m) • Mallow actual surplus €460k ( 2014 deficit €372k)
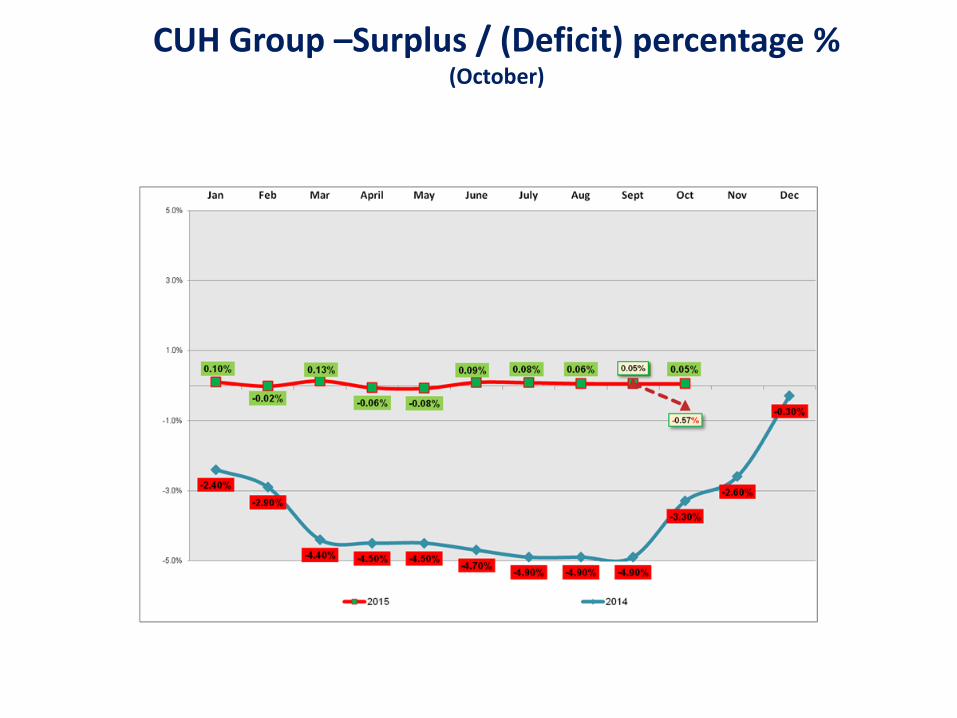
CUH Group –Surplus / (Deficit) percentage %
(October)
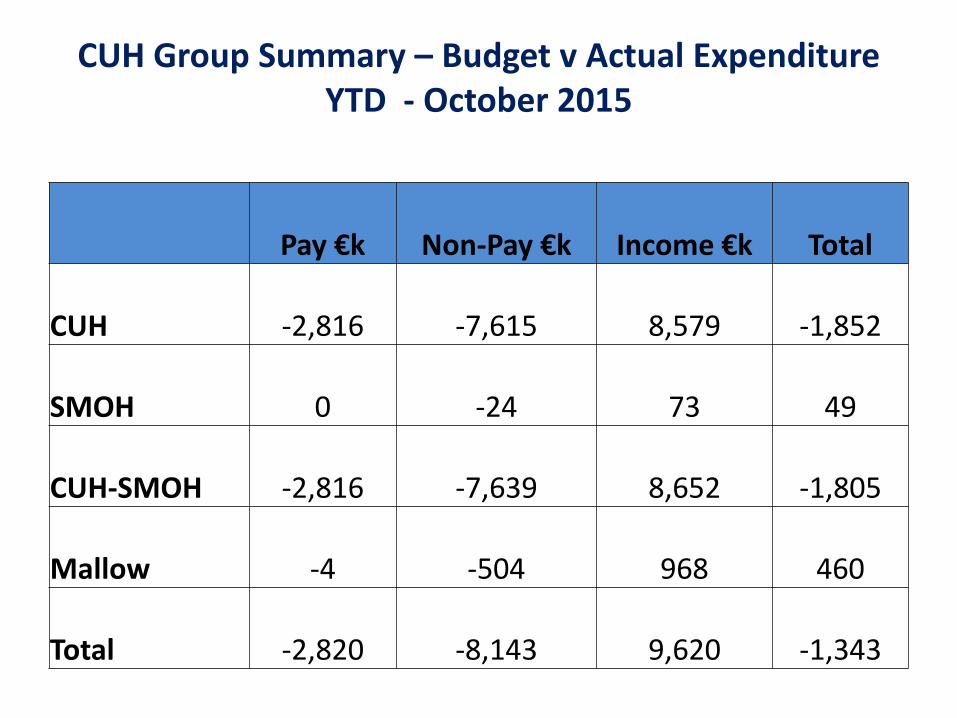
CUH Group Summary – Budget v Actual Expenditure YTD - October 2015
Pay €k Non-Pay €k Income €k Total
CUH -2,816 -7,615 8,579 -1,852
SMOH 0 -24 73 49
CUH-SMOH -2,816 -7,639 8,652 -1,805
Mallow -4 -504 968 460
Total -2,820 -8,143 9,620 -1,343
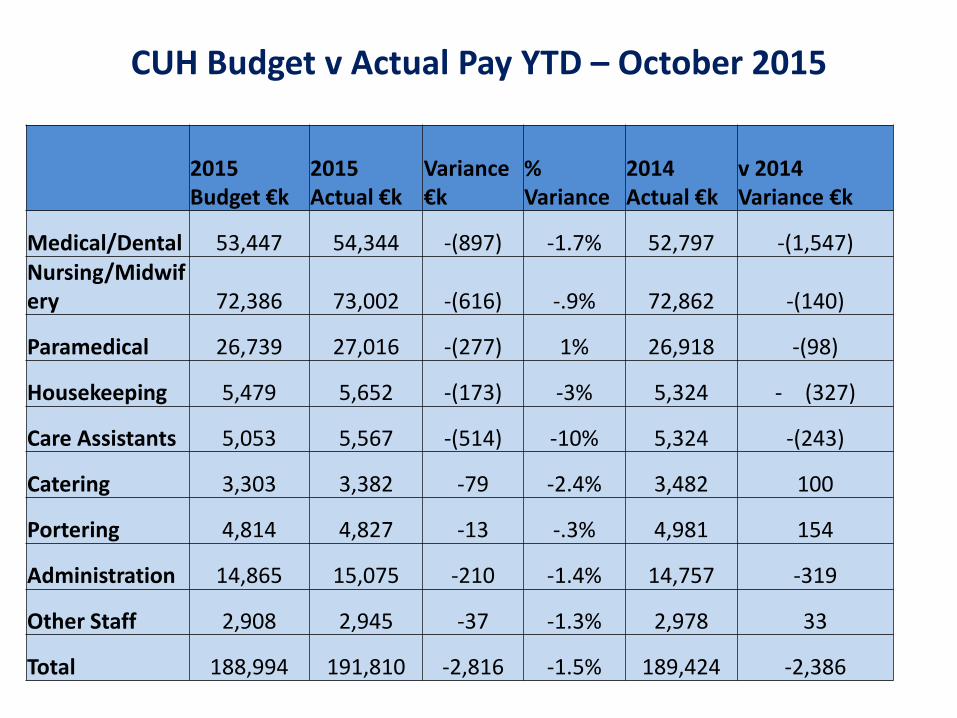
CUH Budget v Actual Pay YTD – October 2015
2015 Budget €k
2015 Actual €k
Variance €k
% Variance
2014 Actual €k
v 2014 Variance €k
Medical/Dental 53,447 54,344 -(897) -1.7% 52,797 -(1,547) Nursing/Midwifery 72,386 73,002 -(616) -.9% 72,862 -(140)
Paramedical 26,739 27,016 -(277) 1% 26,918 -(98)
Housekeeping 5,479 5,652 -(173) -3% 5,324 - (327)
Care Assistants 5,053 5,567 -(514) -10% 5,324 -(243)
Catering 3,303 3,382 -79 -2.4% 3,482 100
Portering 4,814 4,827 -13 -.3% 4,981 154
Administration 14,865 15,075 -210 -1.4% 14,757 -319
Other Staff 2,908 2,945 -37 -1.3% 2,978 33
Total 188,994 191,810 -2,816 -1.5% 189,424 -2,386
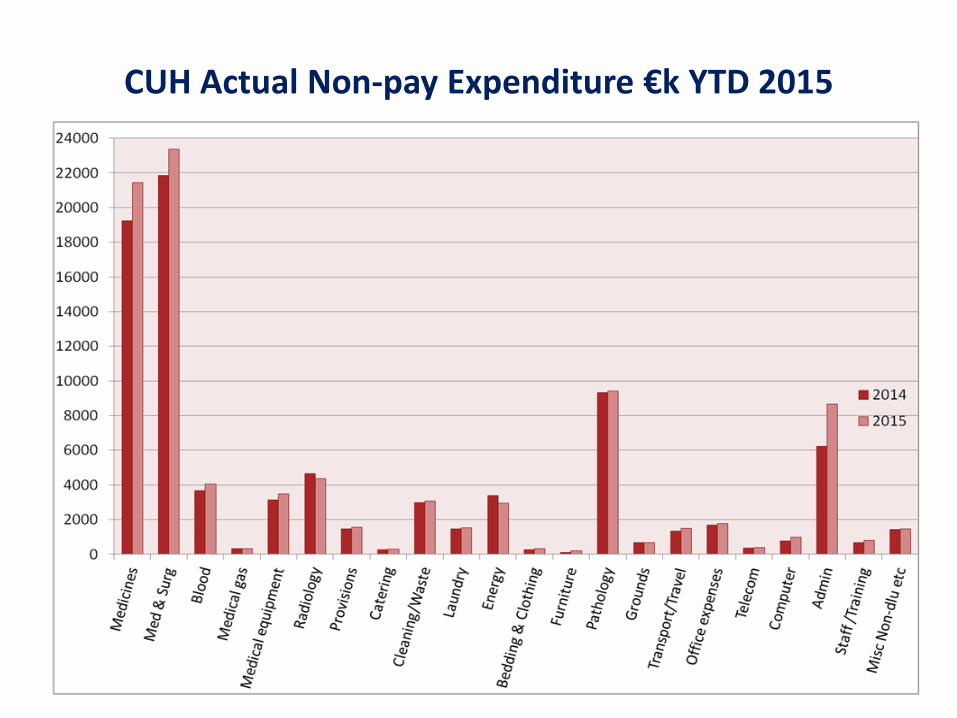
CUH Actual Non-pay Expenditure €k YTD 2015
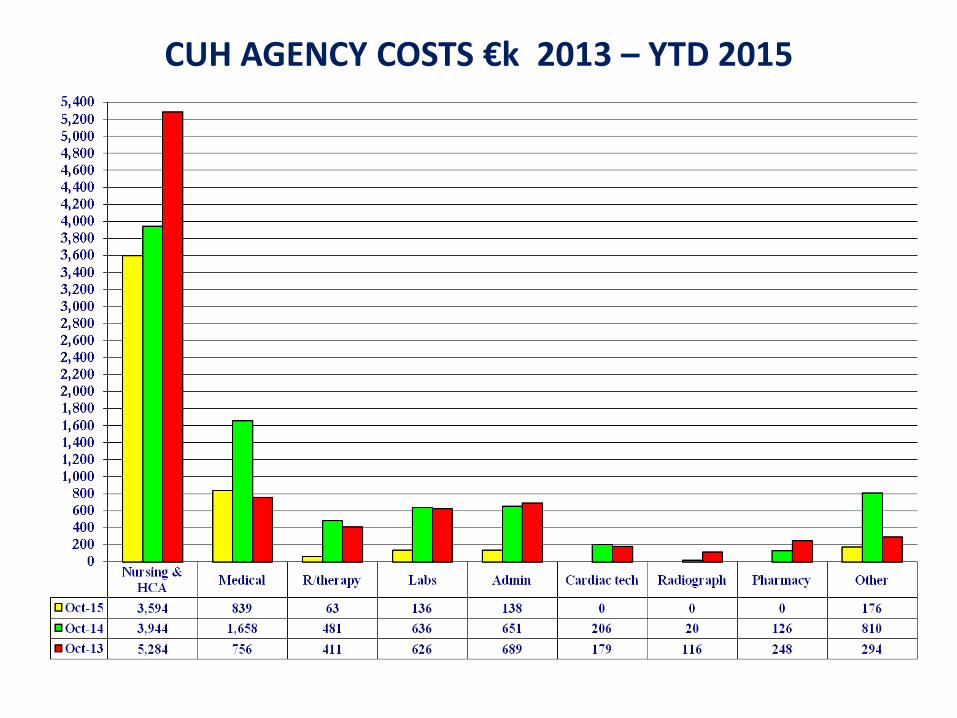
CUH AGENCY COSTS €k 2013 – YTD 2015
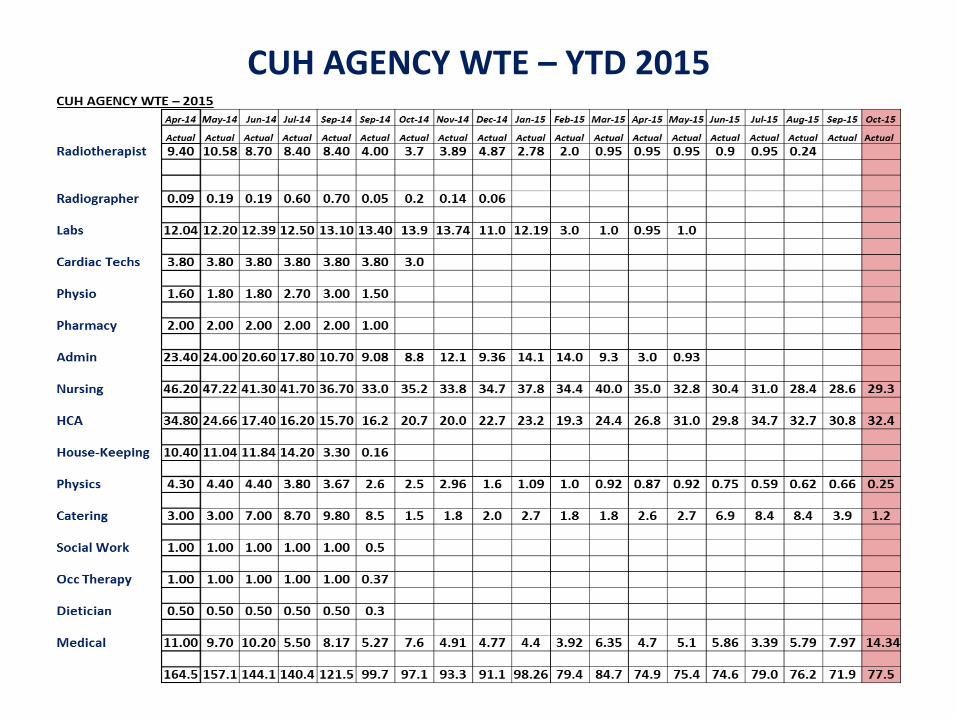
CUH AGENCY WTE – YTD 2015
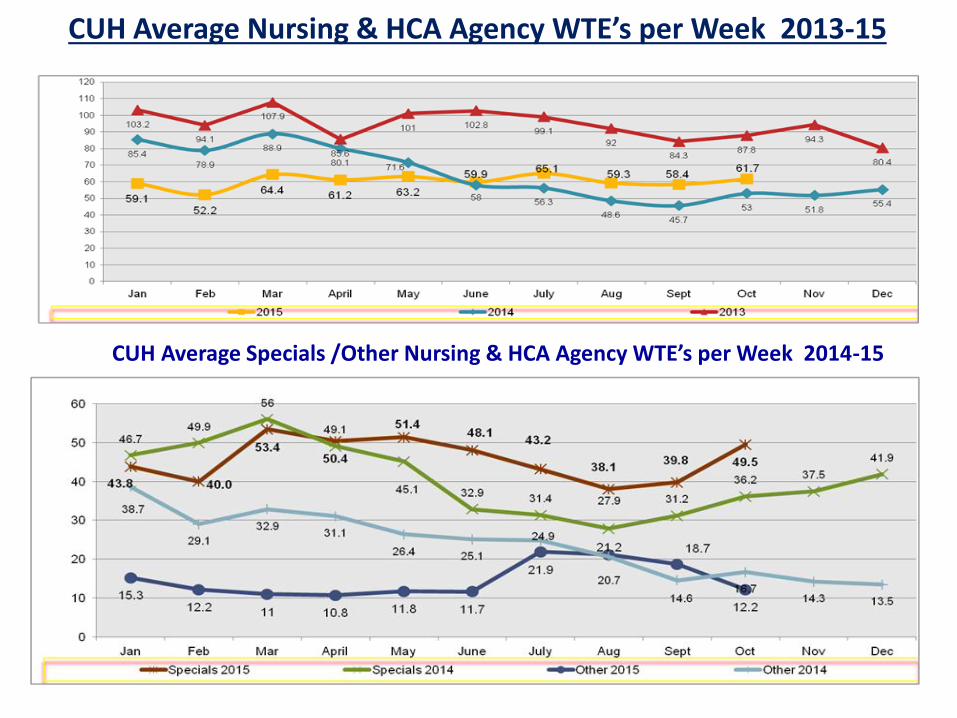
CUH Average Nursing & HCA Agency WTE’s per Week 2013-15
CUH Average Specials /Other Nursing & HCA Agency WTE’s per Week 2014-15
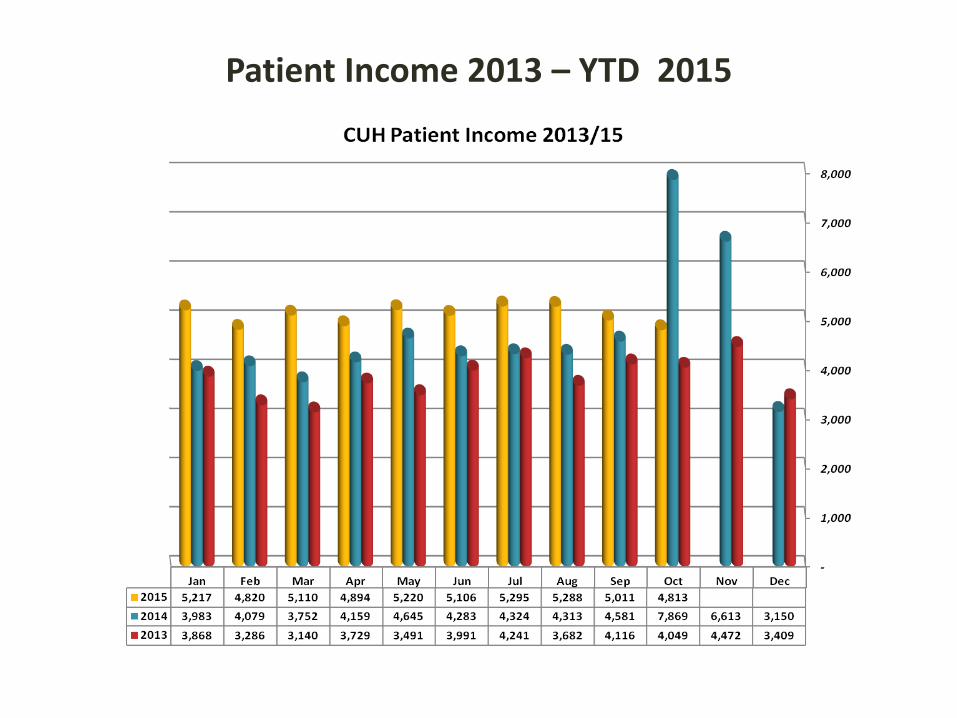
Patient Income 2013 – YTD 2015

Consultant Claims
Consultant claims at 30th October 2015
Consultants at 12th Nov
No of claims Value €k
HARTY, JAMES 121 573,471
MCSWEENEY, NIAMH 61 208,003
GILLIGAN, OONAGH 77 180,309
KEARNEY, PETER 69 177,116
O'BROIN, EOIN 56 168,571
O'SHEA, DERVILLE 49 167,750
TAYLOR, COLM 92 159,486
FULTON, GREG 34 158,960
O'HALLORAN, D. J. 34 142,658
MCFADDEN, EUGENE 36 138,026
HINCHION, JOHN 12 116,032
REIDY, DECLAN 35 110,067
MANNING, BRIAN 17 106,815
GUERIN, SHANE 12 105,999
POWER, DEREK 99 103,178
CARROLL, JENNIFER 31 98,292
HARNEDY, NORMA 8 96,991
SWEENEY, BRIAN 92 96,754
ANDREWS, EMMET J. 37 94,488
KELLY, LOUISE 30 92,118
PLANT ,BARRY 10 90,798
TOTAL 3,185,882
Directorate Value €k Prev
Value €k Current
Diagnostics 45 38
Medicine 3,411 3,020
Surgery 2,266 2,109
Women and Children CUH 477 488
Total-CUH Primary 6,200 5,655
Women & Children CUMH est
950 1,000
Total-CUH /CUMH Primary
7,150 6,655

CUH Debtor days –YTD 2015
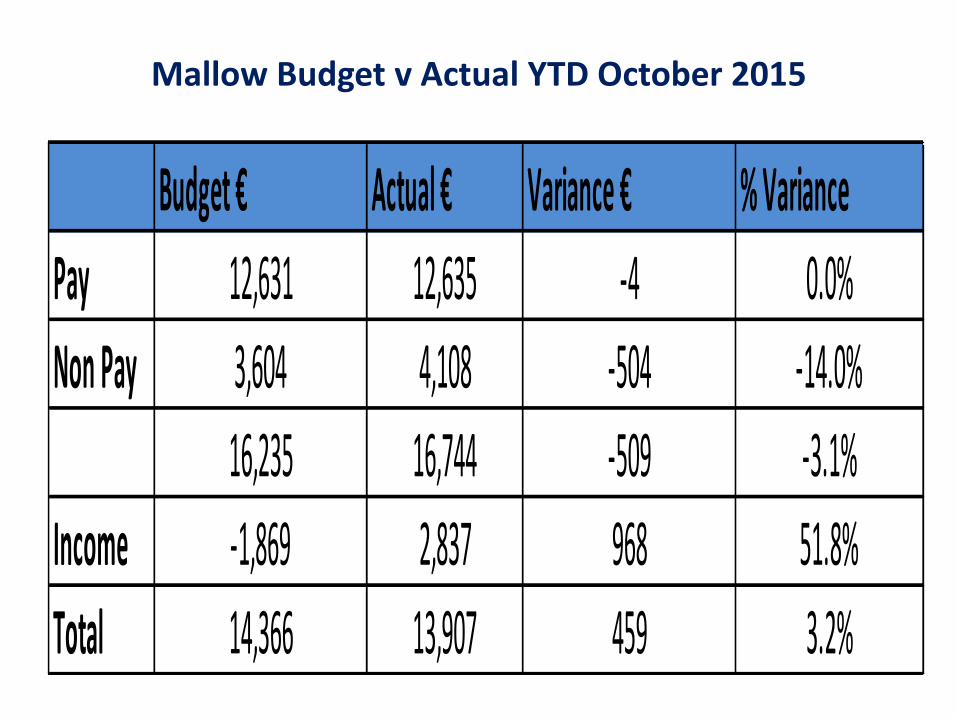
Mallow Budget v Actual YTD October 2015
Budget € Actual € Variance € % Variance
Pay 12,631 12,635 -4 0.0%
Non Pay 3,604 4,108 -504 -14.0%
16,235 16,744 -509 -3.1%
Income -1,869 2,837 968 51.8%
Total 14,366 13,907 459 3.2%
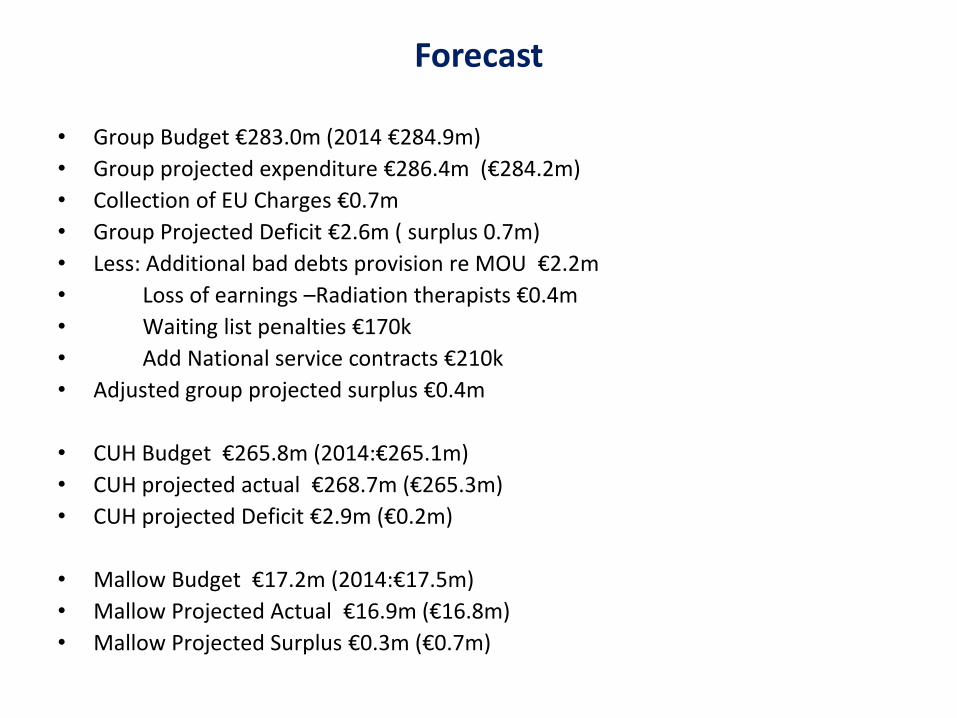
Forecast
• Group Budget €283.0m (2014 €284.9m)
• Group projected expenditure €286.4m (€284.2m)
• Collection of EU Charges €0.7m
• Group Projected Deficit €2.6m ( surplus 0.7m)
• Less: Additional bad debts provision re MOU €2.2m
• Loss of earnings –Radiation therapists €0.4m
• Waiting list penalties €170k
• Add National service contracts €210k
• Adjusted group projected surplus €0.4m
• CUH Budget €265.8m (2014:€265.1m)
• CUH projected actual €268.7m (€265.3m)
• CUH projected Deficit €2.9m (€0.2m)
• Mallow Budget €17.2m (2014:€17.5m)
• Mallow Projected Actual €16.9m (€16.8m)
• Mallow Projected Surplus €0.3m (€0.7m)

Patient Access
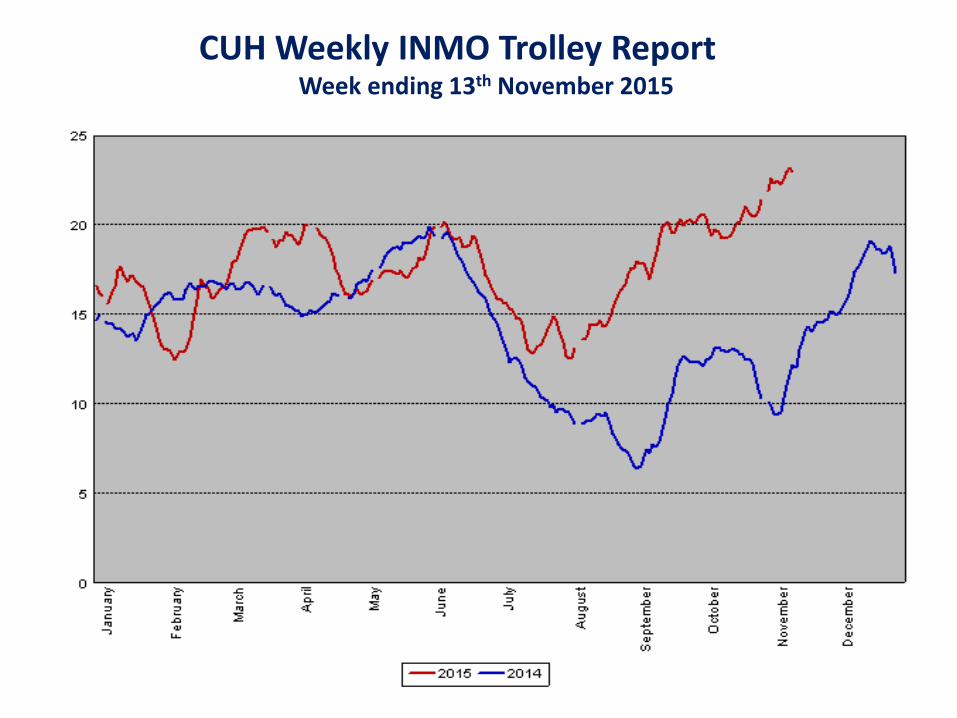
CUH Weekly INMO Trolley Report
Week ending 13th November 2015
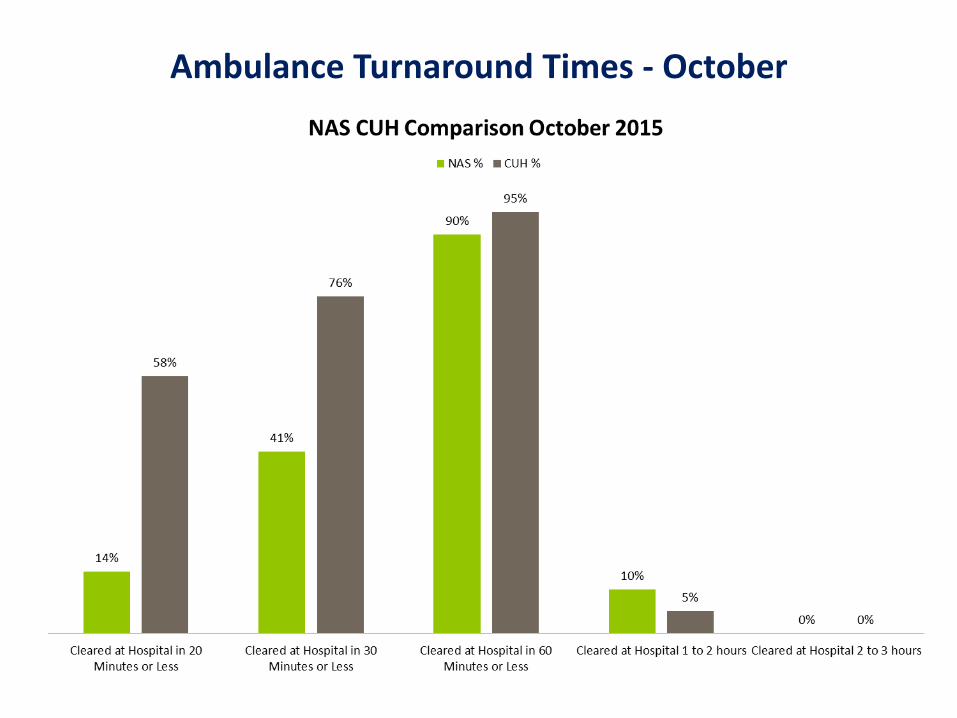
Ambulance Turnaround Times - October
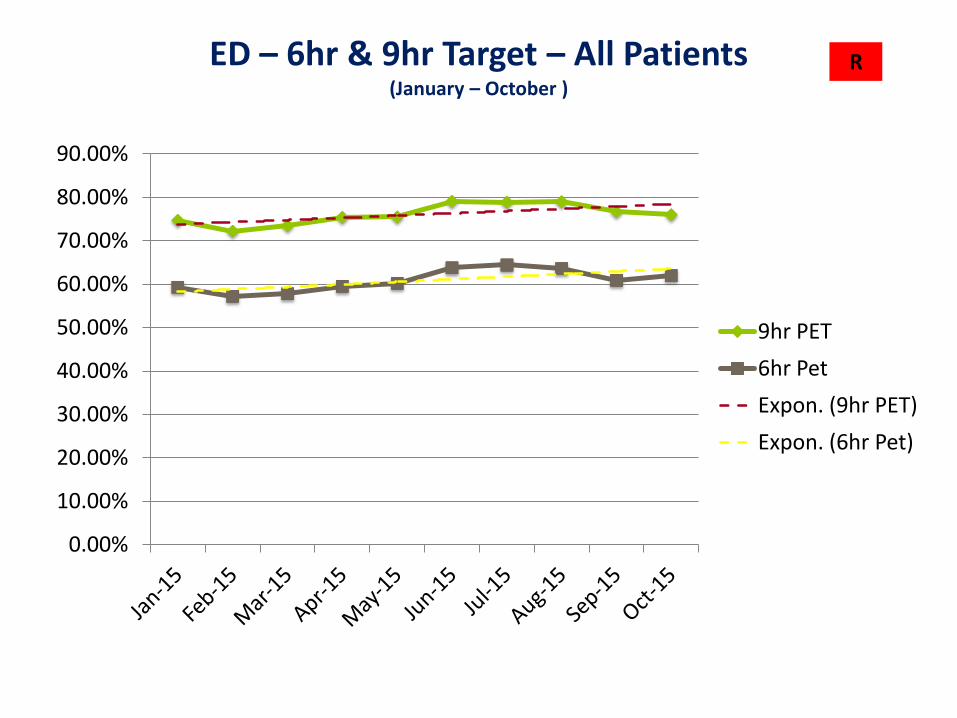
ED – 6hr & 9hr Target – All Patients (January – October )
R
0.00%
10.00%
20.00%
30.00%
40.00%
50.00%
60.00%
70.00%
80.00%
90.00%
9hr PET
6hr Pet
Expon. (9hr PET)
Expon. (6hr Pet)
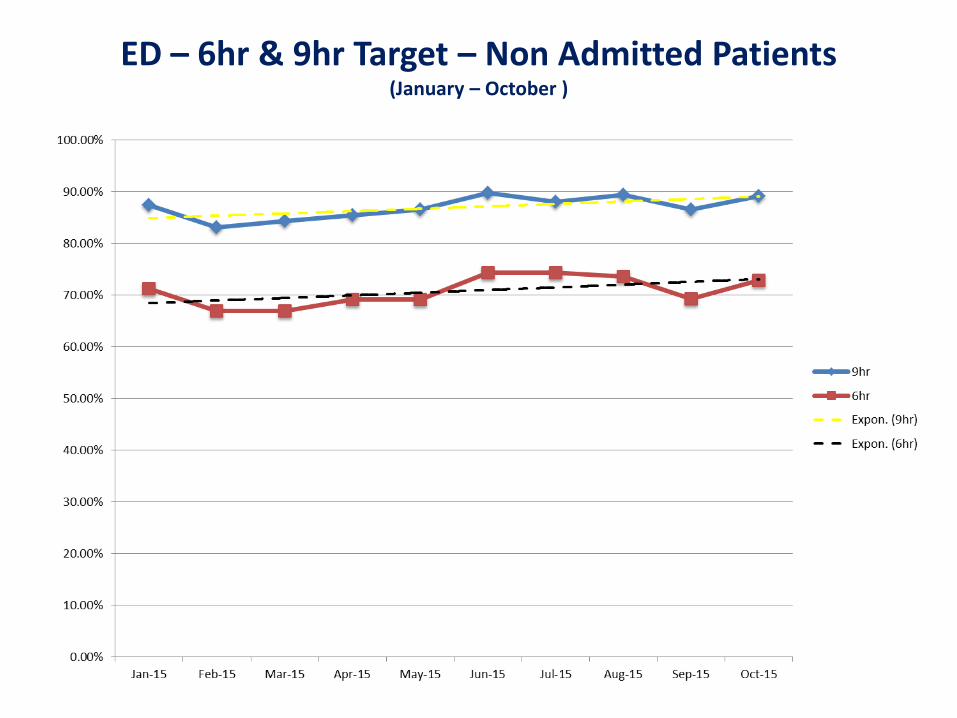
ED – 6hr & 9hr Target – Non Admitted Patients (January – October )
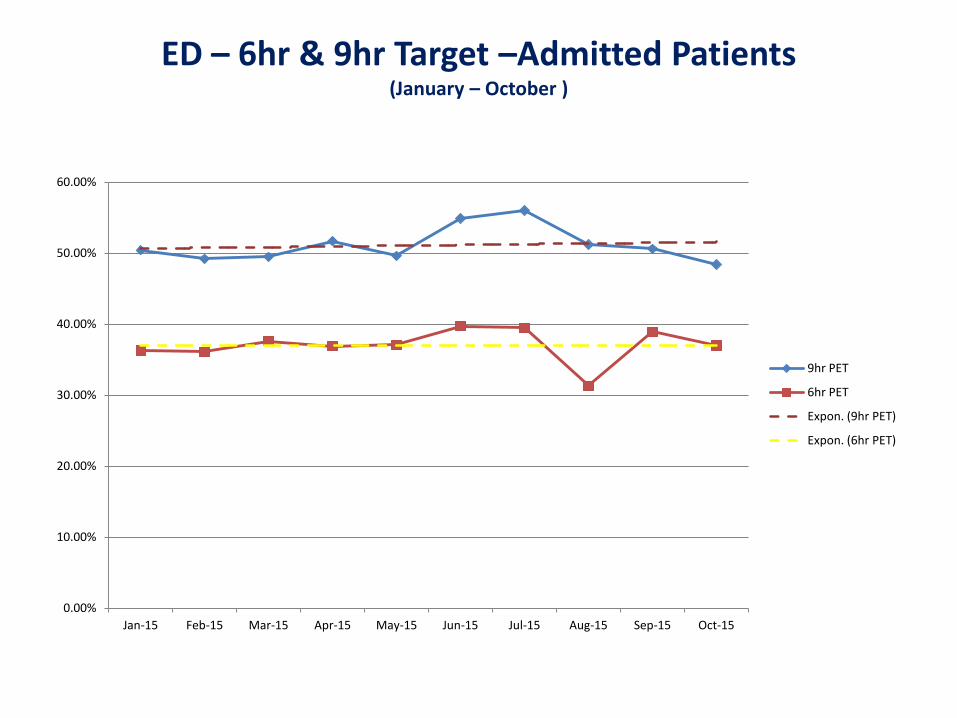
ED – 6hr & 9hr Target –Admitted Patients (January – October )
0.00%
10.00%
20.00%
30.00%
40.00%
50.00%
60.00%
Jan-15 Feb-15 Mar-15 Apr-15 May-15 Jun-15 Jul-15 Aug-15 Sep-15 Oct-15
9hr PET
6hr PET
Expon. (9hr PET)
Expon. (6hr PET)

Delayed Discharges - 2015 January - October (10th November)
Inpatient – Day case Waiting Lists
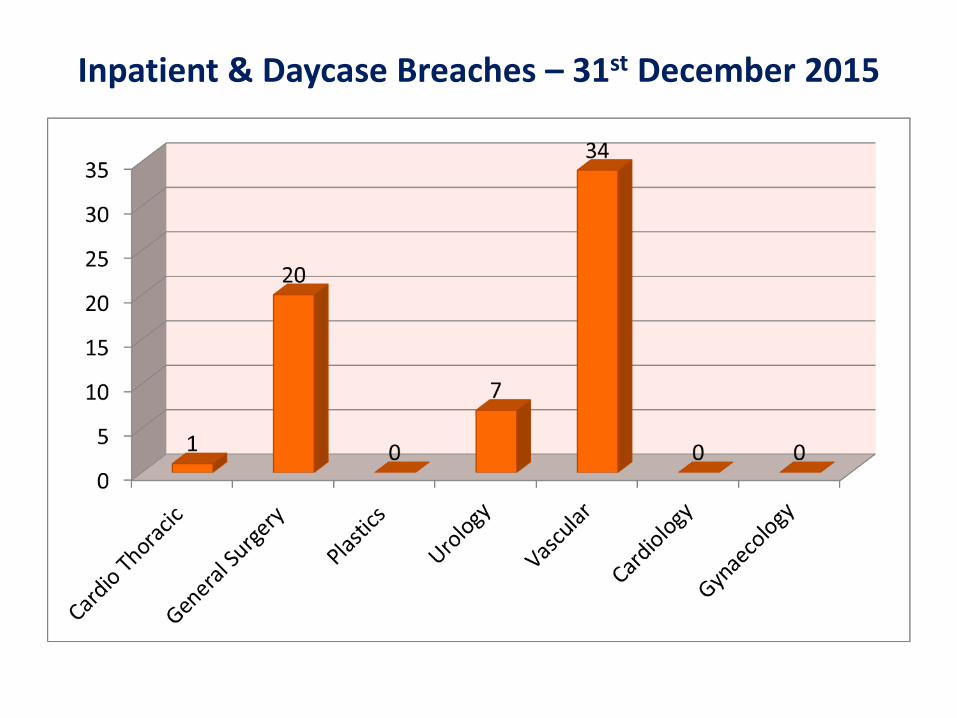
Inpatient & Daycase Breaches – 31st December 2015
Outpatient Waiting Lists
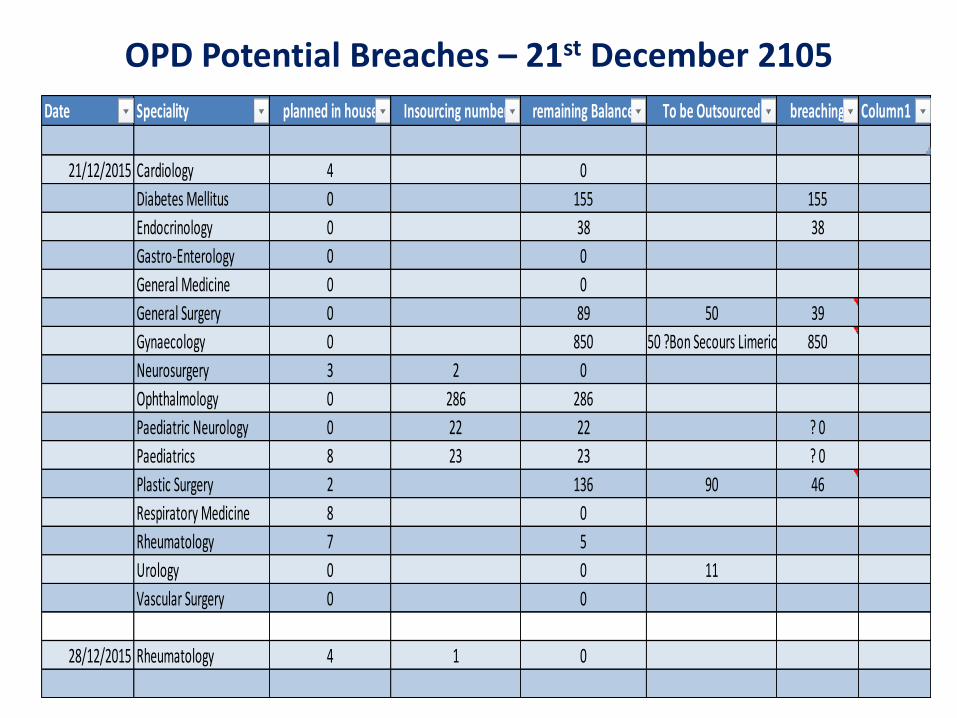
OPD Potential Breaches – 21st December 2105
Date Speciality planned in house Insourcing number remaining Balance To be Outsourced breaching Column1
21/12/2015 Cardiology 4 0
Diabetes Mellitus 0 155 155
Endocrinology 0 38 38
Gastro-Enterology 0 0
General Medicine 0 0
General Surgery 0 89 50 39
Gynaecology 0 850 850 ?Bon Secours Limerick 850
Neurosurgery 3 2 0
Ophthalmology 0 286 286
Paediatric Neurology 0 22 22 ? 0
Paediatrics 8 23 23 ? 0
Plastic Surgery 2 136 90 46
Respiratory Medicine 8 0
Rheumatology 7 5
Urology 0 0 11
Vascular Surgery 0 0
28/12/2015 Rheumatology 4 1 0

Scope Waiting List
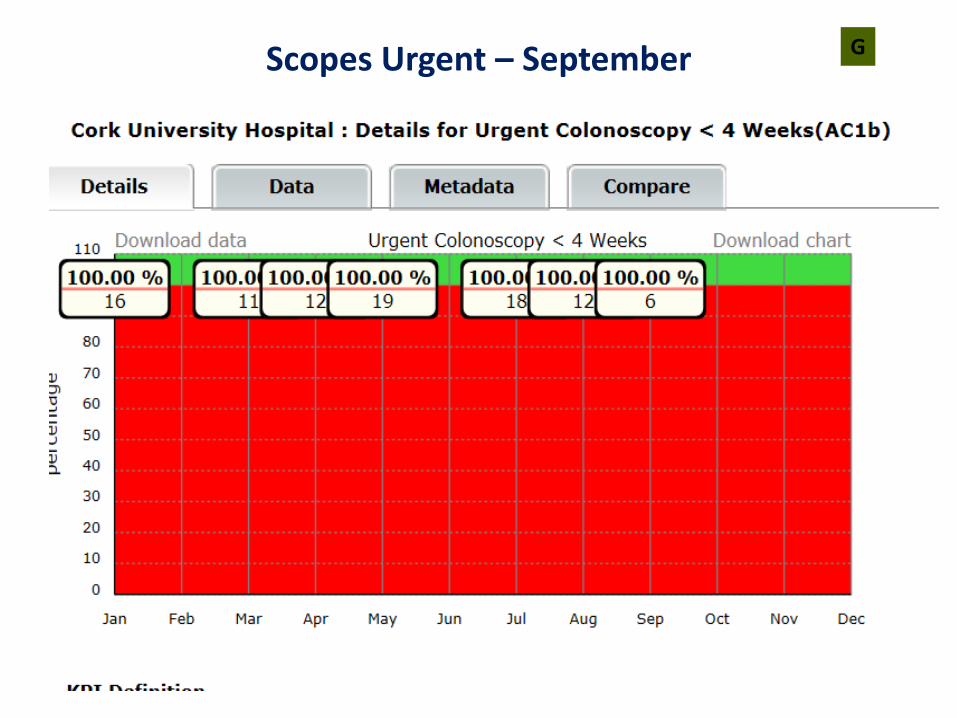
Scopes Urgent – September G
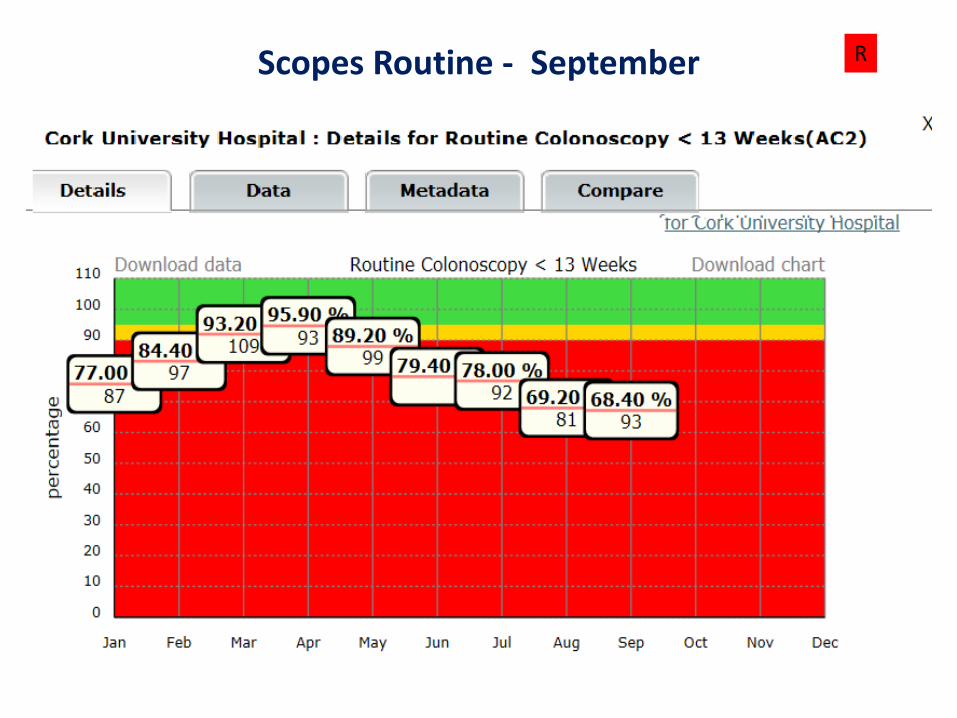
Scopes Routine - September R
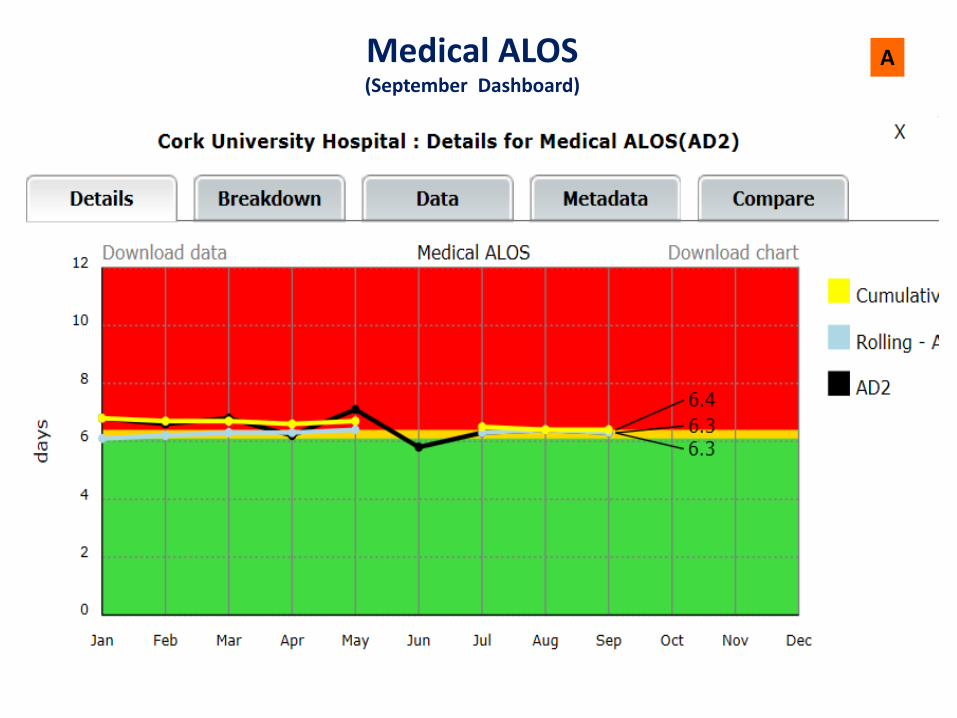
Medical ALOS (September Dashboard)
A
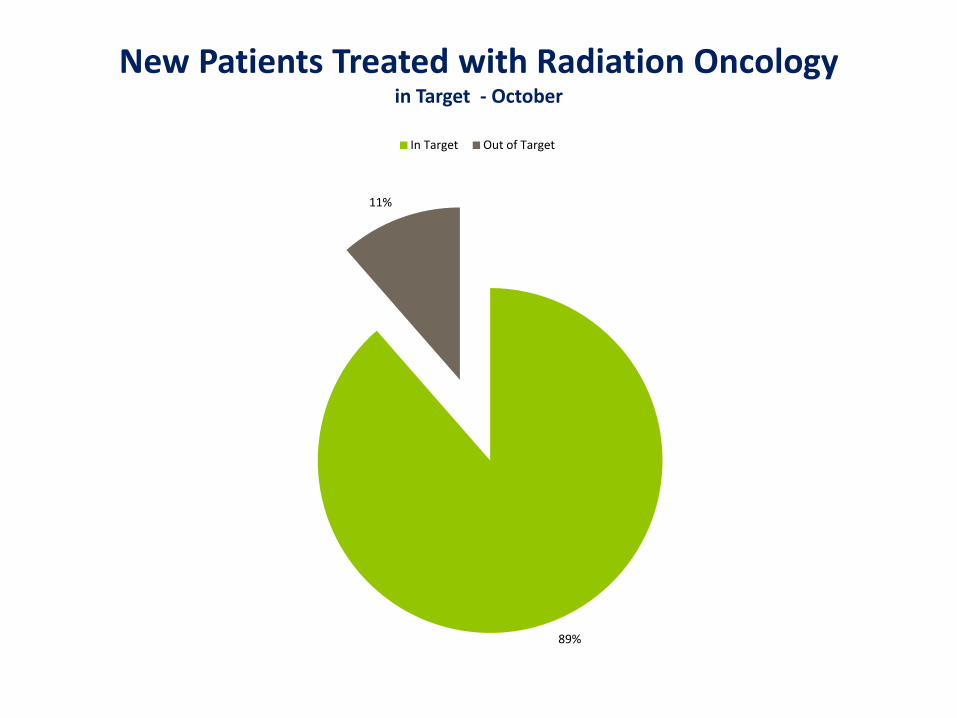
New Patients Treated with Radiation Oncology in Target - October
89%
11%
In Target Out of Target
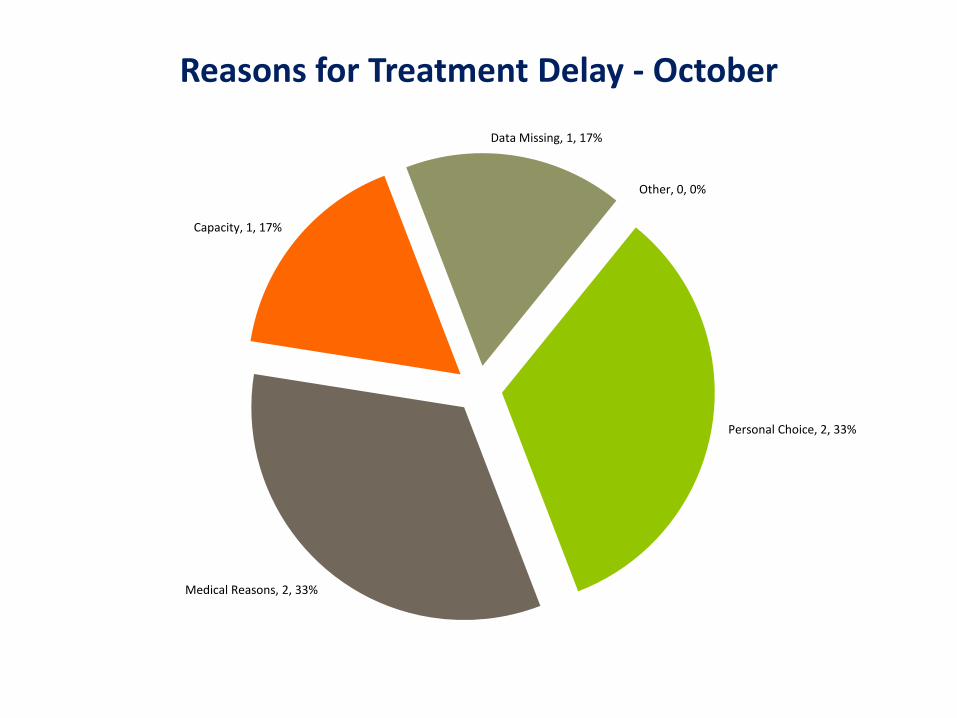
Reasons for Treatment Delay - October
Personal Choice, 2, 33%
Medical Reasons, 2, 33%
Capacity, 1, 17%
Data Missing, 1, 17%
Other, 0, 0%
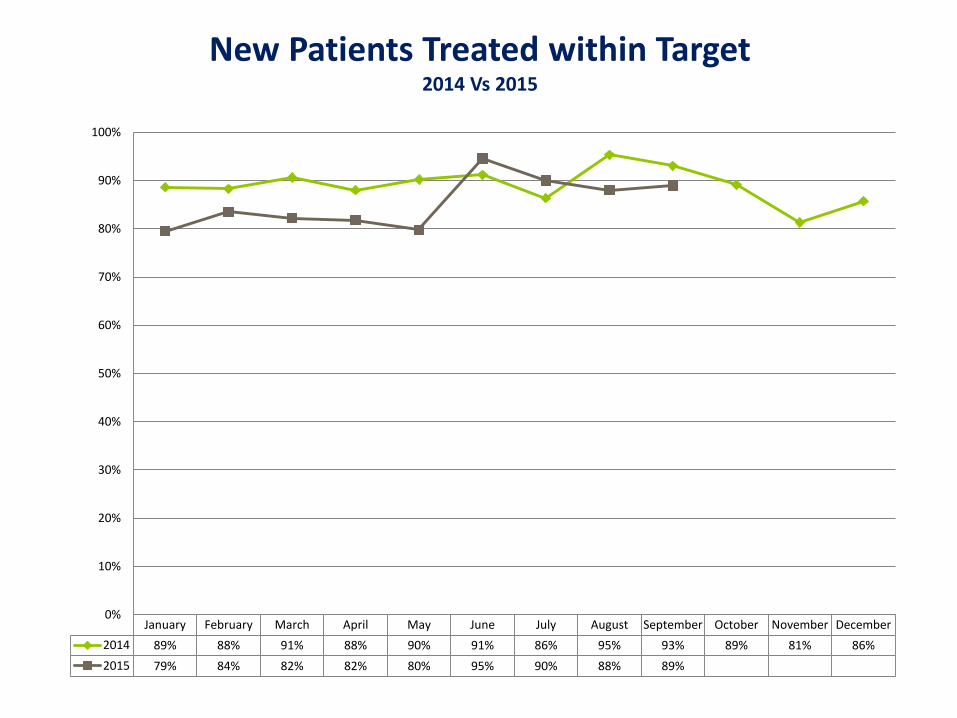
New Patients Treated within Target
2014 Vs 2015
January February March April May June July August September October November December
2014 89% 88% 91% 88% 90% 91% 86% 95% 93% 89% 81% 86%
2015 79% 84% 82% 82% 80% 95% 90% 88% 89%
0%
10%
20%
30%
40%
50%
60%
70%
80%
90%
100%
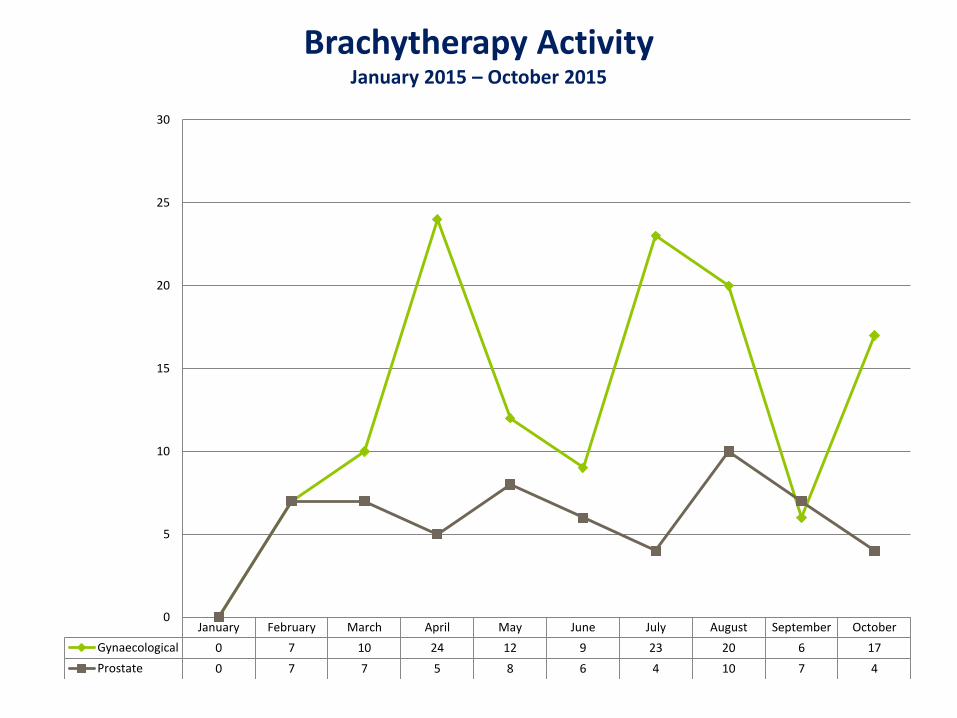
Brachytherapy Activity January 2015 – October 2015
January February March April May June July August September October
Gynaecological 0 7 10 24 12 9 23 20 6 17
Prostate 0 7 7 5 8 6 4 10 7 4
0
5
10
15
20
25
30

Quality & Safety

Day Surgery Admission Rate (September Dashboard)
G
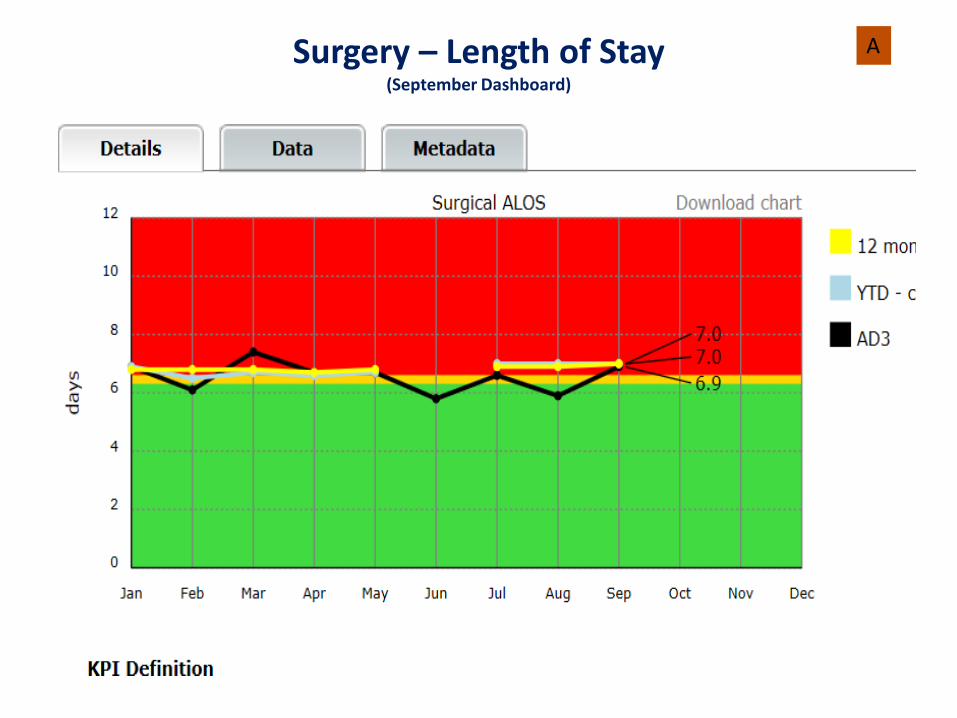
Surgery – Length of Stay (September Dashboard)
A

ALOS – Excluding LOS over 30 days (September Dashboard) A

Cancer KPI – Breast-Lung-Prostate –January – October

OPAT
Outpatient Parenteral Antimicrobial Therapy
– IV antibiotics/antifungals/antivirals given at home
• Reduces patients length of stay in hospital
• Avoids Admission for long period
• Reduces healthcare associated infection risk
• Patients can return to work
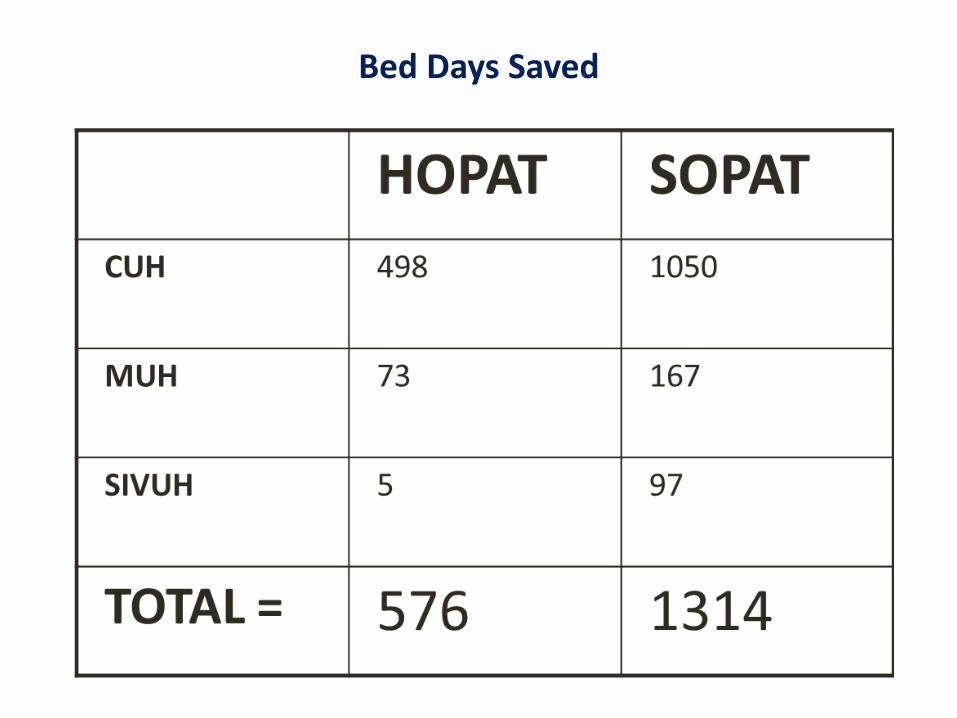
Bed Days Saved
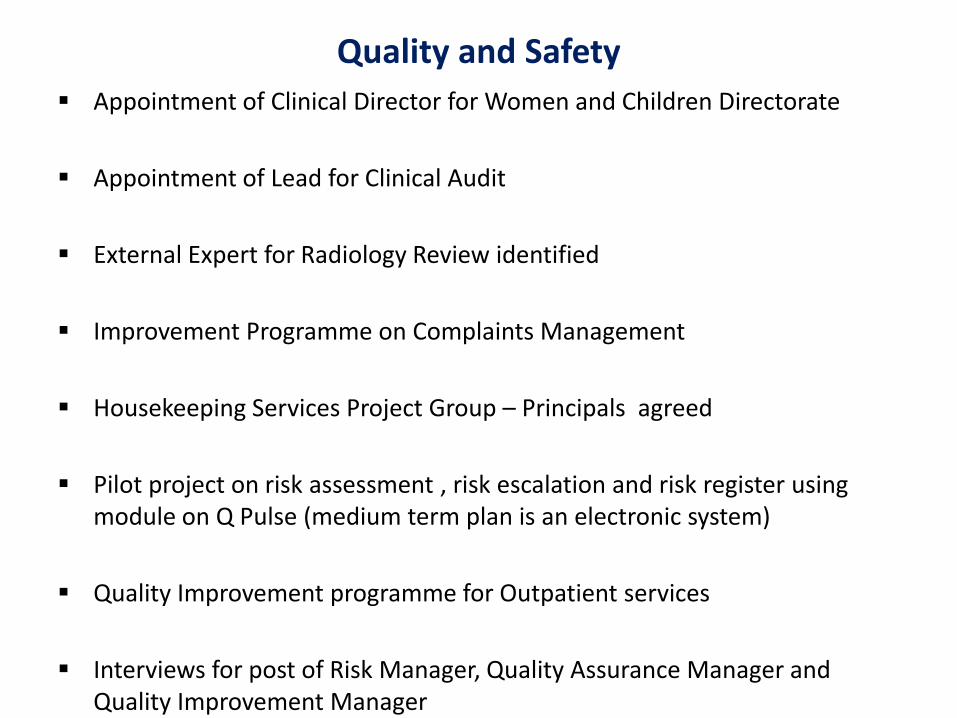
Quality and Safety
Appointment of Clinical Director for Women and Children Directorate
Appointment of Lead for Clinical Audit
External Expert for Radiology Review identified
Improvement Programme on Complaints Management
Housekeeping Services Project Group – Principals agreed
Pilot project on risk assessment , risk escalation and risk register using module on Q Pulse (medium term plan is an electronic system)
Quality Improvement programme for Outpatient services
Interviews for post of Risk Manager, Quality Assurance Manager and Quality Improvement Manager

Patient Experience Report Jan – June 2015
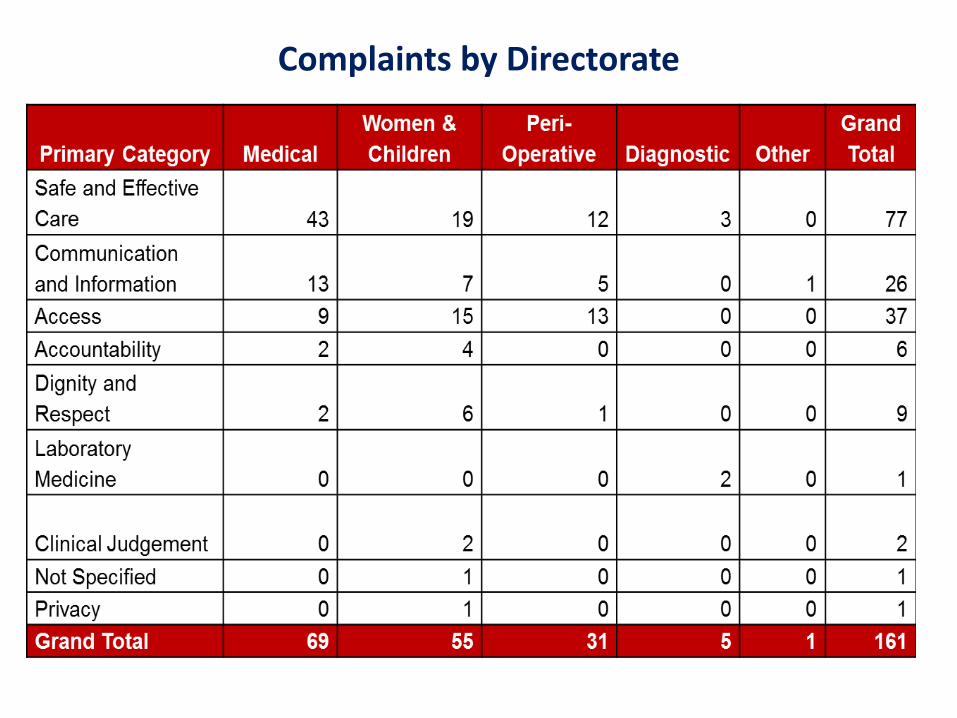
Complaints by Directorate
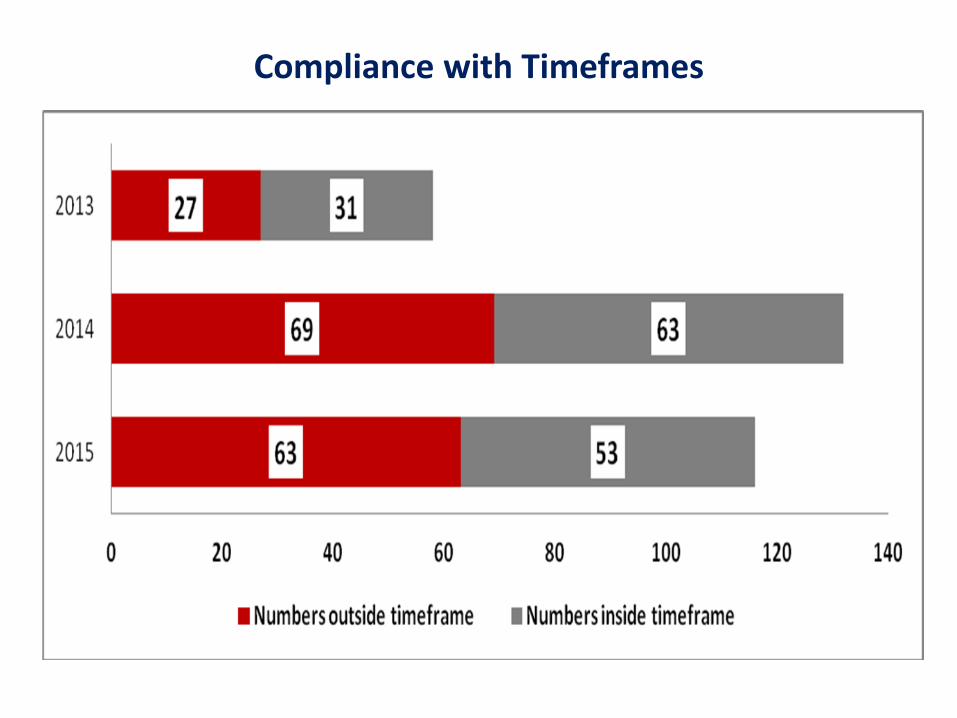
Compliance with Timeframes
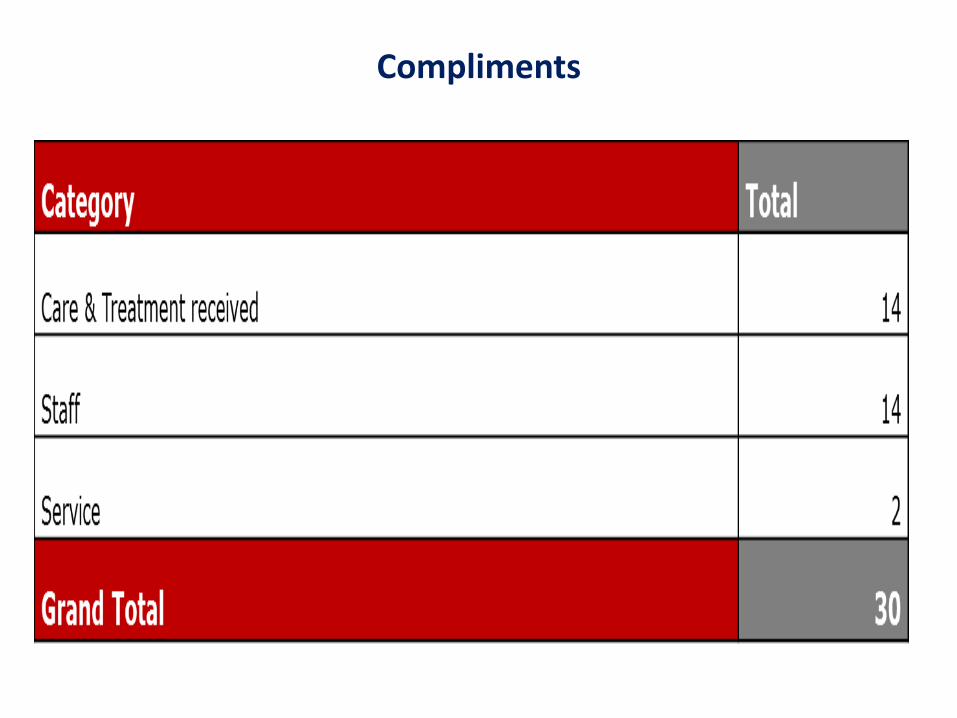
Compliments
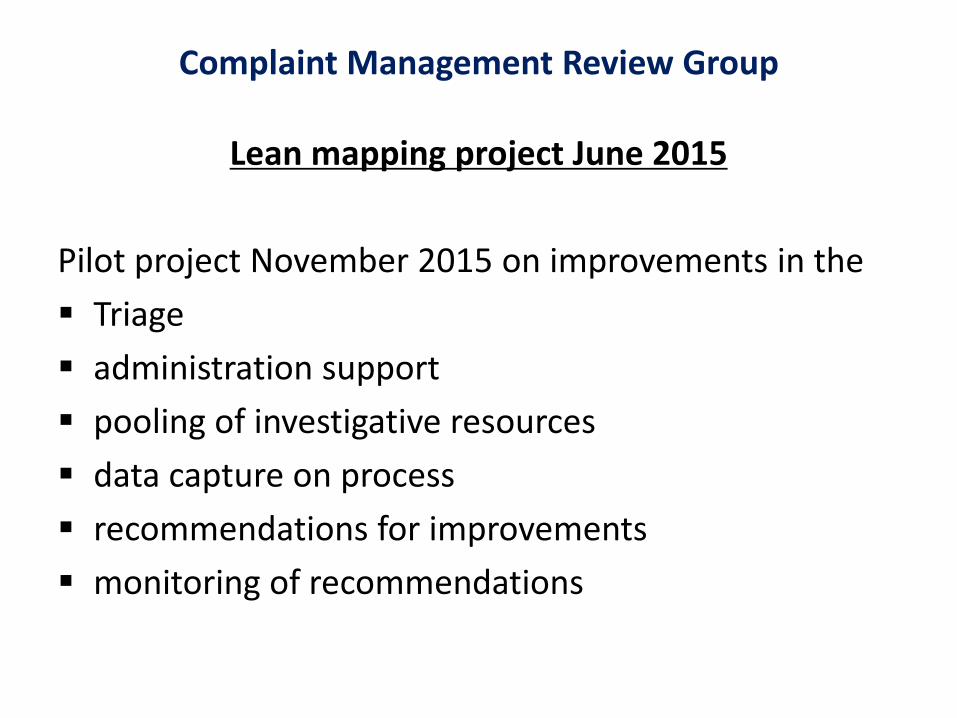
Complaint Management Review Group
Lean mapping project June 2015
Pilot project November 2015 on improvements in the
Triage
administration support
pooling of investigative resources
data capture on process
recommendations for improvements
monitoring of recommendations
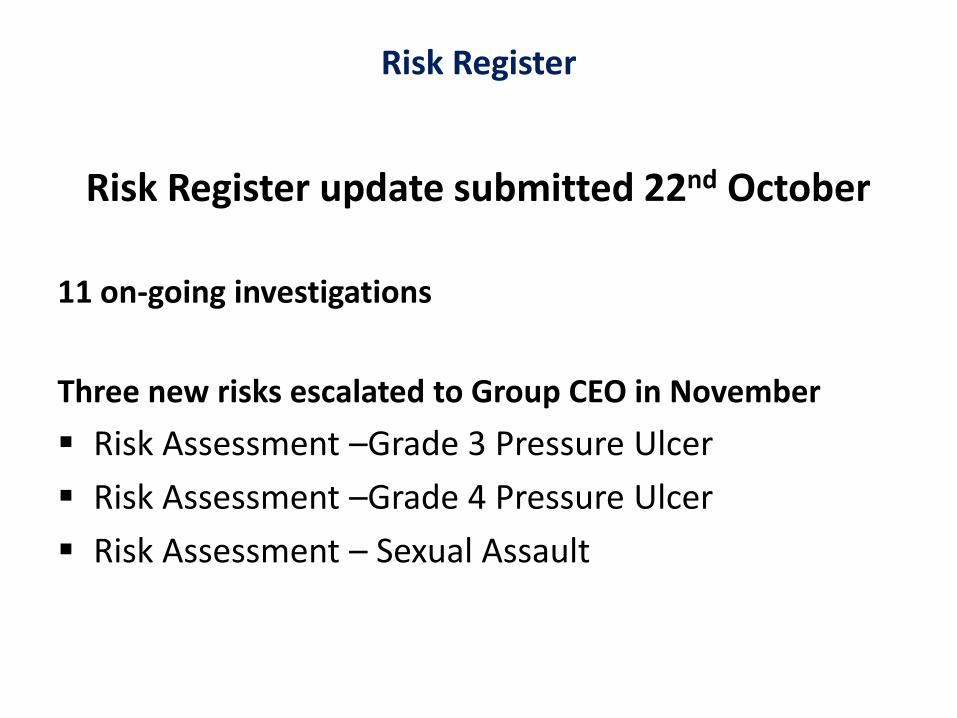
Risk Register
Risk Register update submitted 22nd October
11 on-going investigations
Three new risks escalated to Group CEO in November
Risk Assessment –Grade 3 Pressure Ulcer
Risk Assessment –Grade 4 Pressure Ulcer
Risk Assessment – Sexual Assault
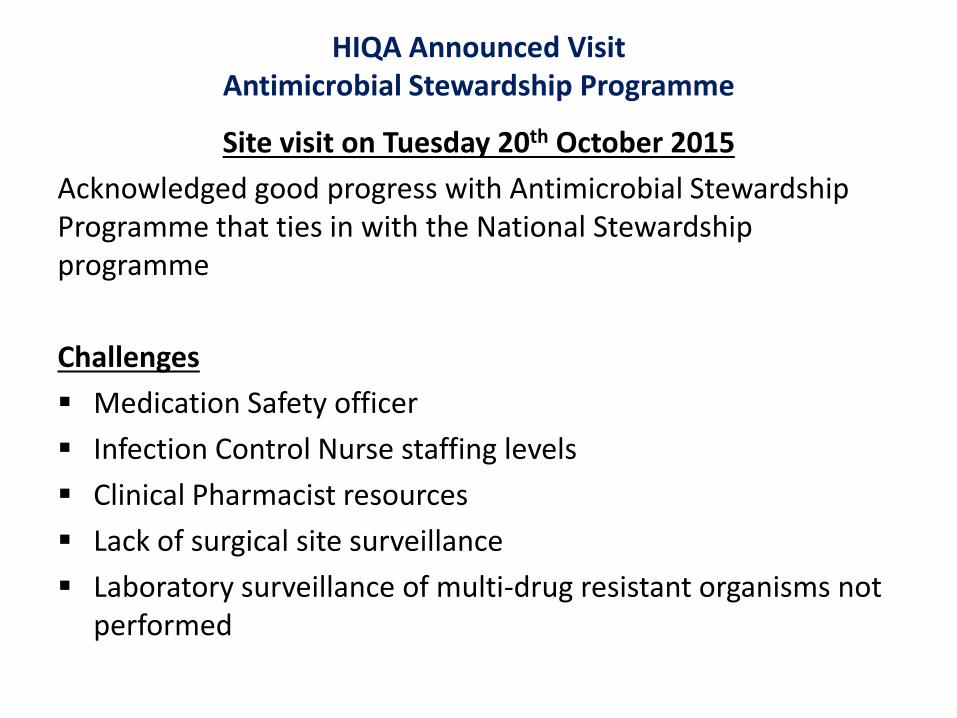
HIQA Announced Visit Antimicrobial Stewardship Programme
Site visit on Tuesday 20th October 2015
Acknowledged good progress with Antimicrobial Stewardship Programme that ties in with the National Stewardship programme
Challenges
Medication Safety officer
Infection Control Nurse staffing levels
Clinical Pharmacist resources
Lack of surgical site surveillance
Laboratory surveillance of multi-drug resistant organisms not performed
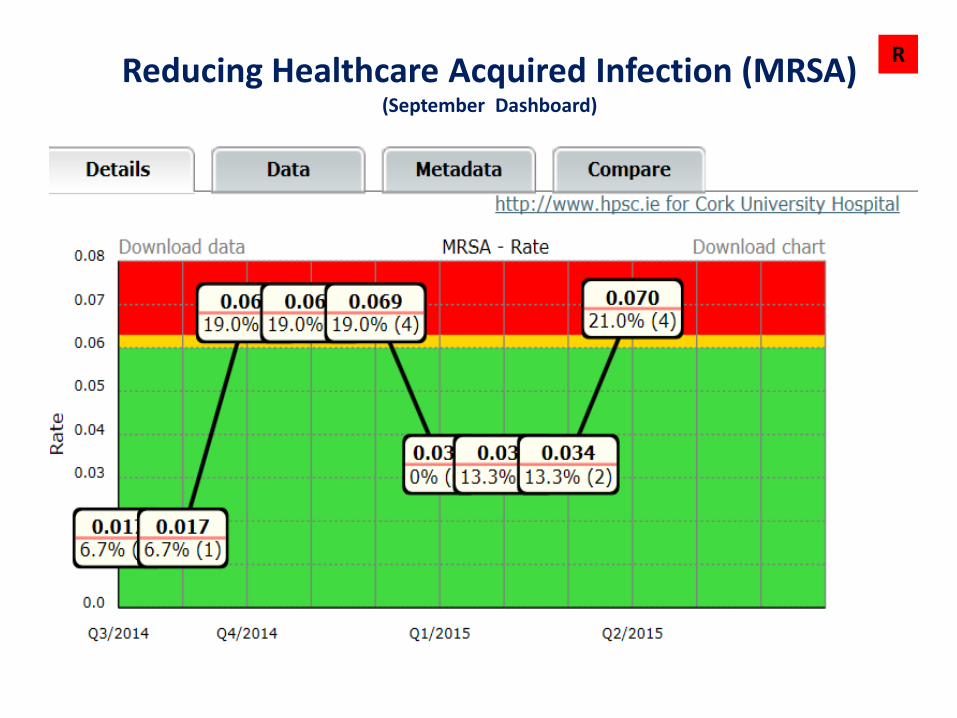
Reducing Healthcare Acquired Infection (MRSA)
(September Dashboard)
R
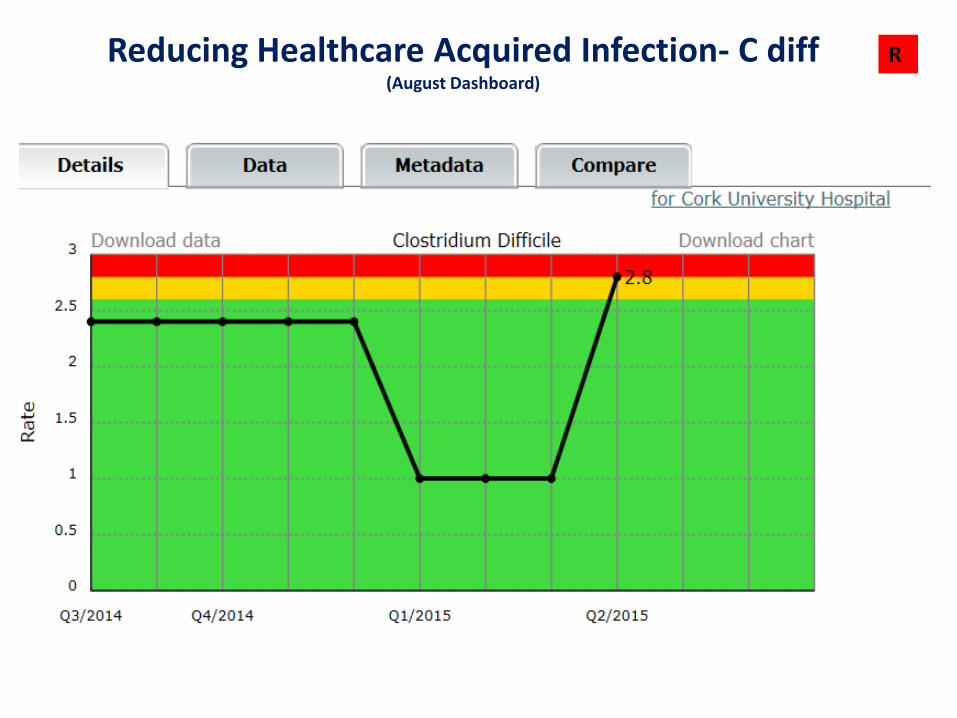
Reducing Healthcare Acquired Infection- C diff (August Dashboard)
R
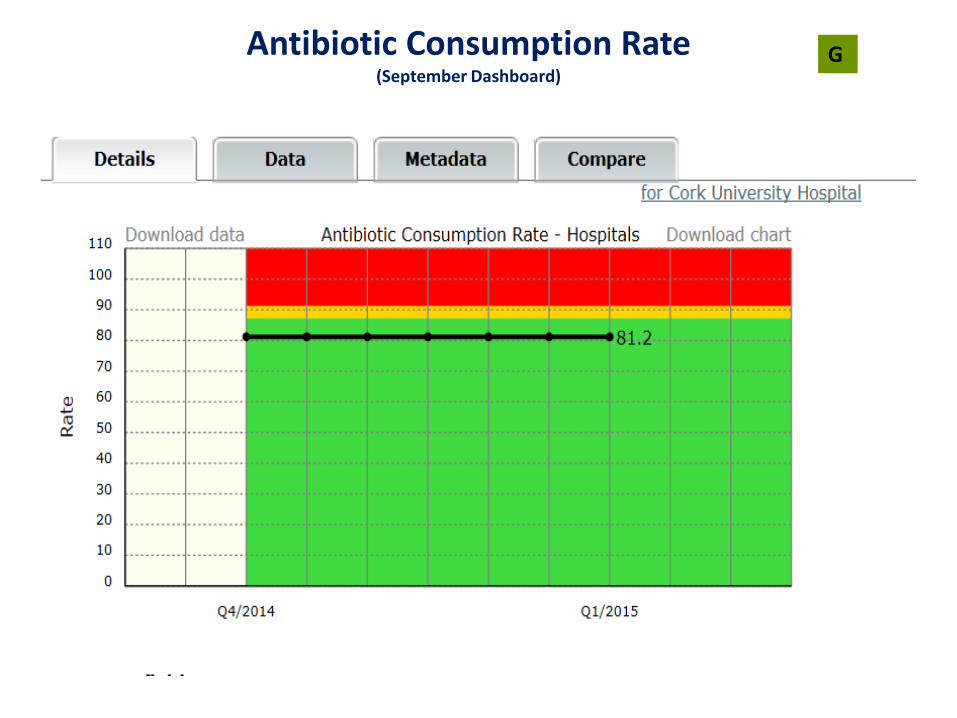
Antibiotic Consumption Rate (September Dashboard)
G

Human Resource Management
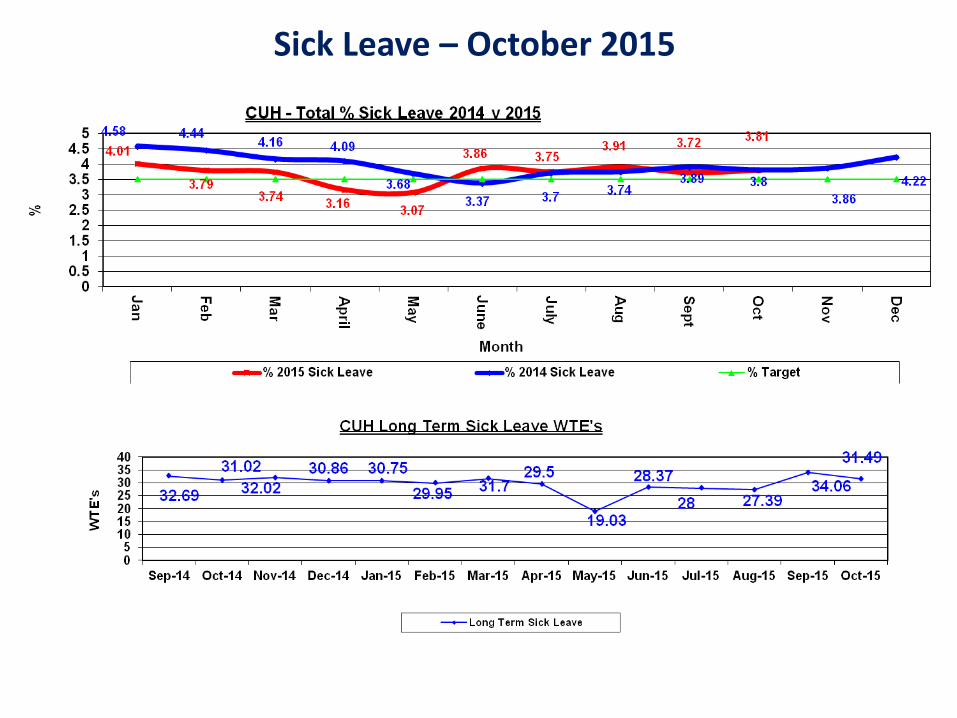
Sick Leave – October 2015

Staffing & Costs October 2015
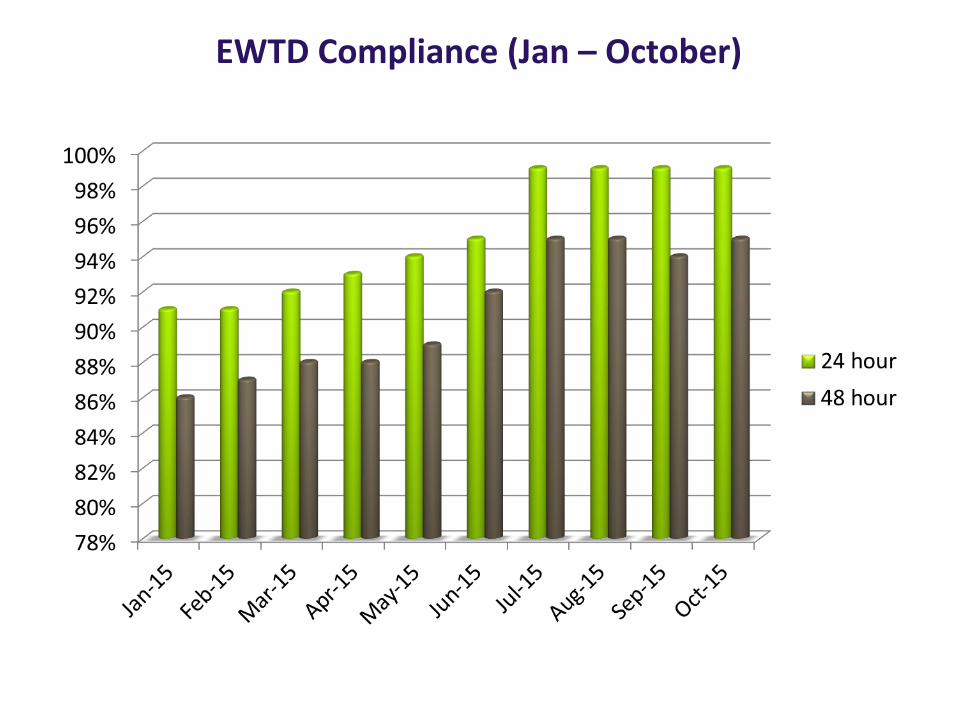
EWTD Compliance (Jan – October)

Nursing - Starters/Leavers 2015
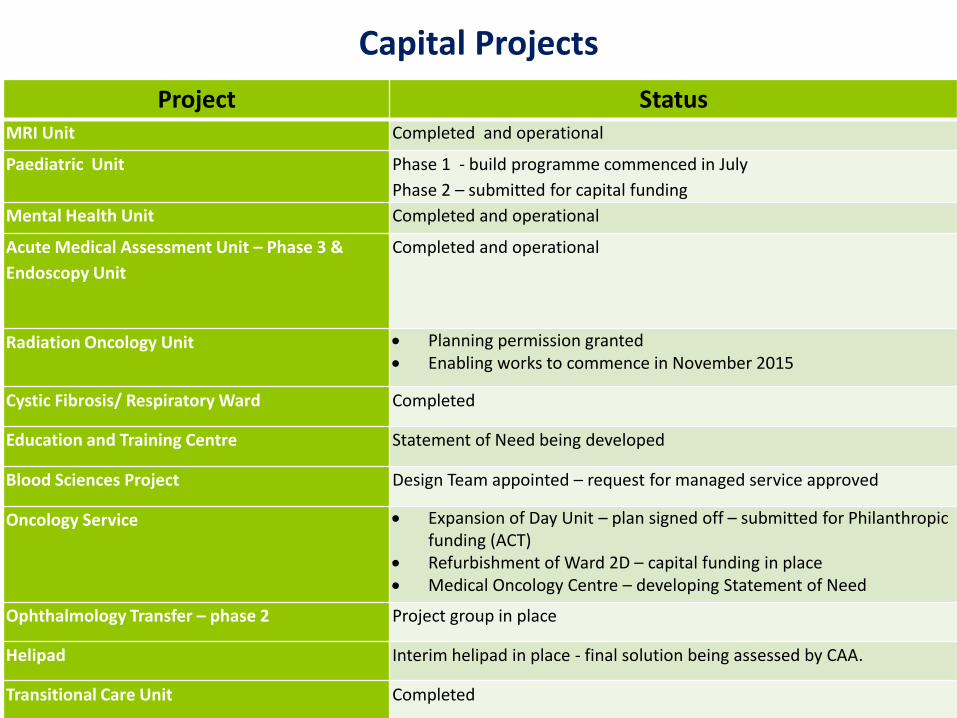
Capital Projects
Project Status MRI Unit Completed and operational
Paediatric Unit Phase 1 - build programme commenced in July
Phase 2 – submitted for capital funding
Mental Health Unit Completed and operational
Acute Medical Assessment Unit – Phase 3 &
Endoscopy Unit
Completed and operational
Radiation Oncology Unit Planning permission granted Enabling works to commence in November 2015
Cystic Fibrosis/ Respiratory Ward Completed
Education and Training Centre Statement of Need being developed
Blood Sciences Project Design Team appointed – request for managed service approved
Oncology Service Expansion of Day Unit – plan signed off – submitted for Philanthropic funding (ACT)
Refurbishment of Ward 2D – capital funding in place Medical Oncology Centre – developing Statement of Need
Ophthalmology Transfer – phase 2 Project group in place
Helipad Interim helipad in place - final solution being assessed by CAA.
Transitional Care Unit Completed
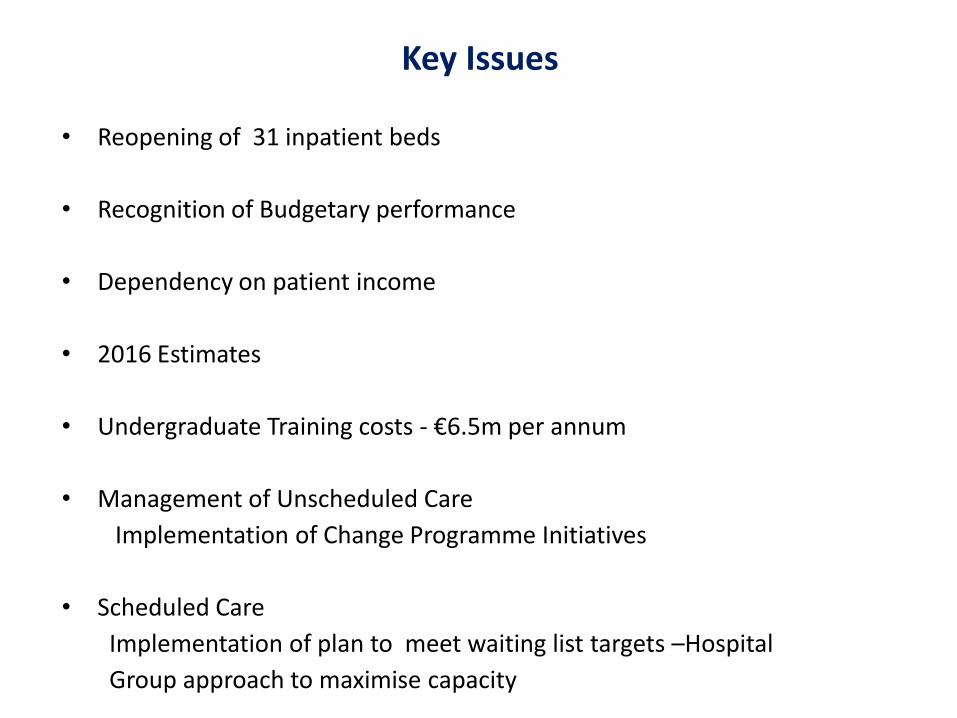
Key Issues
• Reopening of 31 inpatient beds
• Recognition of Budgetary performance
• Dependency on patient income
• 2016 Estimates
• Undergraduate Training costs - €6.5m per annum
• Management of Unscheduled Care
Implementation of Change Programme Initiatives
• Scheduled Care
Implementation of plan to meet waiting list targets –Hospital
Group approach to maximise capacity