balance sheet as at march 31, 2011 - indusind bank · for m.p. chitale & co. chairman director...
TRANSCRIPT


1
BALANCE SHEET AS AT MARCH 31, 2011
Rupees in '000s
SCHEDULE As at 31.03.11 As at 31.03.10
CAPITAL AND LIABILITIESCapital 1 465,96,59 410,64,67
Employee Stock Options Outstanding 18(10) 7,97,96 2,19,77
Reserves and Surplus 2 3576,26,63 1984,38,69
Deposits 3 34365,37,12 26710,16,88
Borrowings 4 5525,42,39 4934,28,97
Other Liabilities and Provisions 5 1694,83,45 1327,83,46 __________ __________
TOTAL 45635,84,14 35369,52,44ASSETSCash and Balances with Reserve Bank of India 6 2456,03,89 2099,18,49
Balances with Banks and Money at Call and Short Notice 7 1568,56,00 504,00,00
Investments 8 13550,81,41 10401,83,98
Advances 9 26165,64,71 20550,58,87
Fixed Assets 10 596,45,91 644,83,06
Other Assets 11 1298,32,22 1169,08,04__________ __________
TOTAL 45635,84,14 35369,52,44
Contingent Liabilities 12 82455,07,04 47200,01,51 Bills for Collection 5052,47,60 4013,47,52
Significant Accounting Policies 17 Notes on Accounts 18 The schedules referred to above form an integral part of Balance Sheet.The Balance Sheet has been prepared in conformity with Form "A" of the Third Schedule to the Banking Regulation Act, 1949.
As per our report of even date. For INDUSIND BANK LTD.
R. Seshasayee T. Anantha NarayananFor M.P. Chitale & Co. Chairman DirectorChartered Accountants
Romesh SobtiManaging Director
Ashutosh Pednekar Partner
S. V. Zaregaonkar Haresh Gajwani Chief Financial Officer Company SecretaryPlace : MumbaiDate : April 18, 2011

2
PROFIT AND LOSS ACCOUNT FOR THE YEAR ENDED MARCH 31, 2011Rupees in '000s
SCHEDULE Year ended Year ended31.03.11 31.03.10
I. INCOME Interest Earned 13 3589,35,74 2706,99,49
Other Income 14 713,66,15 553,47,76 _________ _________
TOTAL 4303,01,89 3260,47,25II. EXPENDITURE Interest Expended 15 2212,86,49 1820,57,87
Operating Expenses 16 1008,48,31 736,00,10
Provisions and Contingencies 504,34,56 353,58,53 _________ _________
TOTAL 3725,69,36 2910,16,50
III.PROFIT 577,32,53 350,30,75 Profit brought forward 391,51,40 246,99,94
________ ________ AMOUNT AVAILABLE FOR APPROPRIATION 968,83,93 597,30,69IV. APPROPRIATIONS Transfer to a) Statutory Reserve 144,33,13 87,57,69 b) Capital Reserve 1,10,04 31,91,43 c) Investment Reserve Account 69,12 14,91 d) Dividend (Proposed) 93,22,97 73,88,18 e) Corporate Dividend Tax 15,12,45 12,27,08________ ________
254,47,71 205,79,29 Balance transferred to Balance Sheet 714,36,22 391,51,40________ ________
TOTAL 968,83,93 597,30,69 V. EARNING PER EQUITY SHARE (Face value of Rs.10/- per share)(Rupees) Basic 18(11.6) 13.16 9.01 Diluted 18(11.6) 12.88 8.80 Significant Accounting Policies 17 Notes on Accounts 18The schedules referred to above form an integral part of Profit & Loss Account.The Profit & Loss Account has been prepared in conformity with Form "B" of the Third Schedule to the Banking RegulationAct, 1949.
As per our report of even date. For INDUSIND BANK LTD.
R. Seshasayee T. Anantha NarayananFor M.P. Chitale & Co. Chairman DirectorChartered Accountants
Romesh SobtiManaging Director
Ashutosh Pednekar Partner
S. V. Zaregaonkar Haresh Gajwani Chief Financial Officer Company SecretaryPlace : MumbaiDate : April 18, 2011

3
Rs. in '000sYear ended 31.3.2011
Year ended 31.3.2010
A. Cash Flow from Operating Activities
Net Profit after taxes 577,32,53 350,30,75Adjustments for non-cash charges/other activities :Depreciation on Fixed assets 60,54,98 45,28,70Depreciation on Investments 7,61,85 (29,14)Tax Provisions (Income Tax/Wealth Tax/Deferred Tax) 302,45,80 182,74,37Employees Stock Option expenses 5,78,19 1,04,67Loan Loss and Other Provisions 194,26,91 171,13,30Interest on Tier II/ Upper Tier II bonds 112,64,50 82,75,39(Profit)/Loss on sale of fixed assets 2,85,92 3,64,71
Operating Profit before Working Capital changes 1263,50,68 836,62,75Adjustments for :Increase in trade and Other Receivables (Advances and Other Assets) (5929,07,50) (4931,33,69)Increase in Inventories (Investments) (3156,59,28) (2318,14,29)Increase in Trade Payables (Deposits,Borrowings and Other Liabilities) 8743,21,19 6656,23,39Cash generated from Operations 921,05,09 243,38,16Direct Taxes paid (311,95,23) (157,81,99)
Net Cash from Operating Activities 609,09,86 85,56,17
B. Cash Flow from Investing ActivitiesPurchase of Fixed Assets (101,87,03) (78,50,86)Sale of Fixed Assets (Proceeds) 80,54,73 3,93,91Net Cash used in Investing Activities (21,32,30) (74,56,95)
C. Cash Flow from Financing ActivitiesProceeds from fresh Issue -- Capital 55,31,92 55,45,46 -- Share Premium 11,291,938 416,17,91Dividends paid (93,22,97) (73,88,18)Proceeds from Issue of Unsecured Non-Convertible Redeemable Subordinated Tier-II Bonds - 420,00,00Redemption of Sub-ordinated Tier II capital (145,00,00) (66,50,00)Interest on Tier II/ Upper Tier II Bonds (112,64,50) (82,75,39)
Net Cash used in Financing Activities 833,63,83 668,49,80
Net Increase in Cash and Cash Equivalents 1421,41,39 679,49,02
Cash and Cash Equivalents as on the first day of the year 2603,18,49 1923,69,47Cash and Cash Equivalents as on the last day of the year 4024,59,89 2603,18,49Notes:
1 The above Cash Flow Statement has been prepared under the indirect method as set out in Accounting Standard 3 on CashFlow Statement issued by the Institute of Chartered Accountants of India (ICAI).
2 Figures in bracket indicate cash outflow.3 Refer to note 15 under Schedule No.17.4 Previous year's figures have been regrouped and recast to conform to the current year's classification.
As per our report of even date. For INDUSIND BANK LTD.
For M.P. Chitale & Co. R. Seshasayee T. Anantha NarayananChartered Accountants Chairman Director
Romesh Sobti Managing Director
Ashutosh Pednekar Partner S. V. Zaregaonkar Haresh Gajwani Chief Financial Officer Company Secretary
Place : MumbaiDate : April 18, 2011
CASH FLOW STATEMENT FOR THE YEAR ENDED MARCH 31, 2011

4
Rupees in '000sAs at 31.03.11 As at 31.03.10
SCHEDULE - 1 CAPITAL
Authorised Capital50,00,00,000 (Previous year 50,00,00,000) equity shares of Rs.10/- each 500,00,00 500,00,00
Issued, Subscribed and Called Up Capital46,57,73,835 (Previous year 41,04,54,640) equity shares of Rs.10/- each 465,77,38 410,45,46
Paid up Capital 46,57,73,835 (Previous year 41,04,54,640) equity shares of Rs.10/- each 465,77,38 410,45,46
Add : Forfeited 3,84,200 (Previous year 3,84,200) equity shares of Rs. 10/- each 19,21 19,21
2010-11On September 24,2010,Bank issued 5,00,00,000 equity shares of Rs. 10/- eachthrough a Qualified Institutional Placement(QIP). Accordingly as at March31,2011,the paid-up share capital and share premium account under reserves ofthe Bank stand increased by Rs.50,00,00 and Rs.1122,75,00 respectively2009-10On August 17,2009,Bank issued 5,48,97,140 equity shares of Rs. 10/- eachthrough a Qualified Institutional Placement(QIP).Accordingly as at March31,2010,the paid-up share capital and share premium account under reserves ofthe Bank stand increased by Rs.54,89,71 and Rs.425,45,28 respectively
________ ________465,96,59 410,64,67
SCHEDULE - 2 RESERVES AND SURPLUSI Statutory Reserve Opening balance 223,47,00 135,89,31 Additions during the year 144,33,13 87,57,69________ ________
367,80,13 223,47,00II Share Premium Account Opening balance 1016,14,13 599,96,22 Additions during the year 1143,30,09 427,21,12 Deduction during the year 14,10,71 11,03,21________ ________
2145,33,51 1016,14,13III General Reserve Opening balance 1,35,57 1,35,57_______ _______
1,35,57 1,35,57IV Capital Reserve Opening balance 117,59,09 85,67,66 Additions during the year 1,10,04 31,91,43
_______ _______118,69,13 117,59,09
V Investment Allowance Reserve Opening balance 1,00,00 1,00,00
_______ _______1,00,00 1,00,00
VI Investment Reserve Account Opening Balance 1,68,14 1,53,23 Additions during the year 69,12 ,14,91_______ _______
2,37,26 1,68,14VII Revaluation Reserve Opening balance 231,63,36 235,63,18 Deduction during the year 6,28,55 3,99,82 _______ _______
225,34,81 231,63,36VIII Balance in Profit & Loss Account 714,36,22 391,51,40
TOTAL 3576,26,63 1984,38,69

5
Rupees in '000sAs at 31.03.11 As at 31.03.10
SCHEDULE - 3 DEPOSITSA I Demand Deposits i) From Banks 61,86,51 59,54,41 ii) From Others 6210,26,53 4347,23,44 II Savings Bank Deposits 3058,79,06 1914,96,20 III Term Deposits i) From Banks 1516,11,55 2274,60,90 ii) From Others 23518,33,47 18113,81,93
TOTAL 34365,37,12 26710,16,88
B Deposits of Branches I In India 34365,37,12 26710,16,88 II Outside India - -
TOTAL 34365,37,12 26710,16,88
SCHEDULE - 4 BORROWINGSI Borrowings in India i) Reserve Bank of India 20,00,00 - ii) Other Banks 194,70,89 531,97,82 iii) Other Institutions and Agencies 3339,00,50 2685,41,26 iv) Unsecured Non-Convertible Redeemable Debentures/Bonds 860,10,00 1005,10,00 (Subordinated Tier-II Bonds) v) Unsecured Non-Convertible Redeemable Non-Cumulative Subordinated Upper Tier II Bonds 308,90,00 308,90,00 II Borrowings outside India 802,71,00 402,89,89
TOTAL 5525,42,39 4934,28,97Secured borrowings included in I & II above - - SCHEDULE - 5 OTHER LIABILITIES AND PROVISIONSI Inter-office Adjustments (Net) 92,62,94 5,70,83II Bills Payable 359,95,14 383,01,14
III Interest Accrued 258,61,95 236,50,47IV Others [(including Standard Asset Provisions of Rs.103,02,30) 983,63,42 702,61,02 (Previous year Rs.80,12,30)]
TOTAL 1694,83,45 1327,83,46SCHEDULE - 6 CASH AND BALANCES WITH RESERVE BANK OF INDIAI Cash in hand (including foreign currency notes) 207,03,97 189,57,74II Balances with Reserve Bank of India i) In Current Accounts 2248,99,92 1909,60,75 ii) In Other Accounts - -
TOTAL 2456,03,89 2099,18,49
SCHEDULE 7 BALANCES WITH BANKS AND MONEY AT CALL AND SHORT NOTICEI In India i) Balances with Banks a) In Current Accounts 153,38,77 202,56,10 b) In Other Deposit Accounts 376,03,00 165,14,55 ii) Money at Call and Short Notice - With Others 50,32,16 -
TOTAL 579,73,93 367,70,65
II Outside India i) In Current Accounts 77,29,89 10,34,90 ii) In Other Deposit Accounts - - iii) Money at Call and Short Notice 911,52,18 125,94,45
TOTAL 988,82,07 136,29,35__________ __________
GRAND TOTAL 1568,56,00 504,00,00

6
Rupees in '000sAs at 31.03.11 As at 31.03.10
Schedule - 8 INVESTMENTSI Investments in India Gross Value 13562,26,78 10405,67,50 Less : Aggregate of provision/depreciation 11,45,37 3,83,52
Net value of Investments in India 13550,81,41 10401,83,98 Comprising : i) Government securities 10021,86,17 8521,51,28 ii) Other approved securities - 3,56,08 iii) Shares 36,97,82 36,16,92 iv) Debentures and bonds 103,42,67 13,54,46 v) Subsidiaries and/ or Joint Ventures 50,00 50,00 vi) Others - Deposits under RIDF scheme with NABARD 1679,54,03 1739,77,54 Security Receipt, Mutual Fund and Others 1708,50,72 86,77,70II Investments Outside India - -
TOTAL 13550,81,41 10401,83,98
SCHEDULE - 9 ADVANCESA i) Bills Purchased and Discounted 2295,82,55 2385,33,61 ii) Cash Credits, Overdrafts and Loans Repayable on Demand 7554,31,69 6287,18,52 iii) Term Loans 16315,50,47 11878,06,74
__________ __________TOTAL 26165,64,71 20550,58,87
B i) Secured by Tangible Assets (includes advances against book debts) 21271,19,23 15954,70,59 ii) Covered by Bank/ Government Guarantees (includes advances against L/Cs issued by Banks) 1180,16,77 1758,70,07 iii) Unsecured 3714,28,71 2837,18,21
__________ __________TOTAL 26165,64,71 20550,58,87
C I Advances in India i) Priority Sector 9356,97,35 6326,62,96 ii) Public Sector 99,23,53 451,32,20 iii) Banks 1,78,84 2,05,95 iv) Others 16707,64,99 13770,57,76
__________ __________TOTAL 26165,64,71 20550,58,87
II) Advances Outside India - - __________ __________
TOTAL 26165,64,71 20550,58,87
SCHEDULE - 10 FIXED ASSETSI PREMISES i) At cost as at the beginning of the year 405,65,30 406,06,34 ii) Revaluation during the year - - iii) Additions during the year - 6,85
405,65,30 406,13,19 iv) Less : Deductions during the year 6,71,25 47,89 v) Less : Depreciation to date 34,18,37 28,54,99
TOTAL 364,75,68 377,10,31II Other Fixed Assets (including furniture & fixtures) i) At cost as at the beginning of the year 648,36,26 600,59,03 ii) Additions during the year 94,72,57 74,40,23 [includes Assets given on lease Rs.82,82,02 743,08,83 674,99,26 (Previous year Rs. 225,71,92)] iii) Less : Deductions during the year 170,77,36 26,63,00 iv) Less : Depreciation to date 365,02,07 398,46,72
TOTAL 207,29,40 249,89,54
III Capital Work in Progress 24,40,83 17,83,21
GRAND TOTAL 596,45,91 644,83,06

7
Rupees in '000sAs at 31.03.11 As at 31.03.10
SCHEDULE - 11 OTHER ASSETSI Interest Accrued 259,12,85 291,90,42II Tax Paid in Advance / tax deducted at source (net of provision) 206,47,48 223,52,25III Stationery & Stamps 2,46,16 169,34IV Others 830,25,73 651,96,03
_________ _________TOTAL 1298,32,22 1169,08,04
SCHEDULE - 12 CONTINGENT LIABILITIES
I Claims against the Bank not acknowledged as debts 309,59,72 297,32,62II Liability on account of outstanding Forward Exchange Contracts 47587,32,43 28180,48,64III Liability on account of outstanding Derivative Contracts 21021,35,95 11740,34,41IV Guarantees given on behalf of constituents a) In India 9128,96,85 4699,66,80 b) Outside India ,, ,,V Acceptances, Endorsements and Other Obligations 2807,82,09 1882,19,04VI Other Items for which the Bank is contingently liable 1600,00,00 400,00,00
_________ _________TOTAL 82455,07,04 47200,01,51
Year ended Year ended31.03.11 31.03.10
SCHEDULE - 13 INTEREST EARNED
I Interest/ Discount on Advances/ Bills 2834,60,39 2112,94,80II Income on Investments 733,29,74 559,15,24III Interest on Balances with RBI and Other Inter-Bank Funds 10,64,42 10,94,44IV Others 10,81,19 23,95,01
_________ _________TOTAL 3589,35,74 2706,99,49
SCHEDULE - 14 OTHER INCOME
I Commission, Exchange and Brokerage 256,95,33 193,55,00II Profit on Sale of Investments / Derivatives (Net) 40,40,37 111,03,47III Profit/ (Loss) on Sale of Land, Buildings and Other Assets (2,85,92) (33,99,97)IV Profit on exchange transactions (Net) 154,16,00 84,45,14V Income earned by way of dividend from companies in India 2,87,40 2,91,43VI Miscellaneous Income 262,12,97 195,52,69
_________ _________TOTAL 713,66,15 553,47,76

8
Rupees in '000sYear ended Year ended
31.03.11 31.03.10
SCHEDULE - 15 INTEREST EXPENDED
I Interest on Deposits 1828,50,25 1560,06,13II Interest on Reserve Bank of India/ Inter-Bank Borrowings 84,47,07 48,29,08III Others (including interest on Subordinate Debts and Upper Tier II bonds) 299,89,17 212,22,66
_________ _________TOTAL 2212,86,49 1820,57,87
SCHEDULE - 16 OPERATING EXPENSES
I Payments to and Provisions for Employees 382,64,97 290,55,77II Rent, Taxes and Lighting (includes operating lease rentals) 89,33,24 68,83,49III Printing and Stationery 18,15,27 13,97,44IV Advertisement and Publicity 16,48,26 6,26,39V Depreciation on Bank's Property 60,54,98 45,28,70VI Directors' Fees, Allowances and Expenses 71,15 61,06VII Auditors' Fees and Expenses (includes branch auditors) 1,06,54 1,05,83VIII Law Charges 18,60,81 14,81,84IX Postage, Telegrams, Telephones, etc. 39,38,08 34,76,62X Repairs and Maintenance 52,35,86 47,80,00XI Insurance 33,21,87 29,86,85XII Service Provider Fees 80,42,05 61,34,32XIII Other Expenditure 215,55,23 120,81,79
________ ________TOTAL 1008,48,31 736,00,10

9
Schedule 17 SIGNIFICANT ACCOUNTING POLICIES 1) General:
1.1 The accompanying financial statements have been prepared on the historical cost convention, except where otherwise stated, and in accordance with the accounting standards referred to in Section 211(3C) of the Companies Act, 1956, and notified by the Companies (Accounting Standards) Rules, 2006, read with guidelines issued by the Reserve Bank of India (‘RBI’) and conform to the statutory provisions and practices prevailing within the banking industry in India.
1.2 The preparation of the financial statements, in conformity with generally
accepted accounting principles requires management to make estimates and assumptions that affect the reported amounts of assets, liabilities, revenues, expenses and disclosure of contingent liabilities in the financial statements. Management believes that the estimates used in the preparation of the financial statements are prudent and reasonable. Any revisions to the accounting estimates are recognised prospectively in current and future periods.
2) Transactions involving Foreign Exchange:
2.1 Monetary assets and liabilities denominated in foreign currency are translated at the balance sheet date at the exchange rates notified by the Foreign Exchange Dealers’ Association of India (‘FEDAI’) and the resulting gains or losses are recognised in the profit and loss account.
Non-monetary items which are carried in terms of historical cost
denominated in a foreign currency are reported using the exchange rate at the date of the transaction; and non-monetary items which are carried at fair value or other similar valuation denominated in a foreign currency are reported using the exchange rates that existed when the values were determined.
2.2 All Foreign Exchange contracts outstanding at the balance sheet date are
re-valued at the rates of exchange notified by the FEDAI for specified maturities and the resulting gains or losses are recognised in the profit and loss account.
2.3 The Swap Cost arising on account of foreign currency swap contracts to
convert foreign currency funded liabilities into rupee liability is charged to Profit and loss account as ‘Interest –Others’ by amortizing over the underlying swap period.
2.4 Income and Expenditure items are translated at the rates of exchange
prevailing on the date of the transaction.

10
2.5 Contingent liability at the balance sheet date on account of outstanding forward foreign exchange contracts, guarantees, acceptances, endorsements and other obligations denominated in foreign currency is stated at the closing rates of exchange notified by FEDAI.
3) Investments:
The significant accounting policies in accordance with the RBI guidelines and subsequent circulars issued by the RBI are as follows: 3.1 Categorisation of investments:
In accordance with the guidelines issued by RBI, the Bank classifies its investment portfolio into the following three categories:
i) ‘Held to Maturity’ (HTM) – Securities acquired by the Bank with
the intention to hold till maturity. ii) ‘Held for Trading’ (HFT) – Securities acquired by the Bank with the
intention to trade. iii) ‘Available for Sale’ (AFS) – Securities which do not fall within the
above two categories are classified as ‘available for sale’. 3.2 Classification of Investments:
For the purpose of disclosure in the Balance Sheet, investments have been classified under six groups as required under RBI guidelines - Government Securities, Other Approved Securities, Shares, Debentures and Bonds, Investments in Subsidiaries/ Joint Ventures and Other Investments.
3.3 Valuation of Investments:
(i) ‘Held to Maturity’ – These investments are carried at their acquisition cost. Any premium on acquisition is amortised over the balance period to maturity. The amortised amount is deducted from Interest earned – Income on investments (Item II of Schedule 13). The book value of security is reduced to the extent of amount amortised during the relevant accounting period. Diminution other than temporary, if any, in the value of such investments is determined and provided for on each investment individually.
(ii) ‘Held for Trading’ – Each scrip in this category is re-valued at the
market price or fair value and the resultant depreciation of each scrip in this category is recognised in the Profit and Loss account. Appreciation, if any, is ignored. Market value of government securities is determined on the basis of the prices/ YTM published by RBI or the prices/ YTM periodically declared by Primary Dealers Association of India (PDAI) jointly with Fixed Income Money Market and Derivatives Association (FIMMDA) for valuation at year-end. In case of unquoted government securities, market price or fair value is determined as per the prices/ YTM published by FIMMDA.

11
(iii) ‘Available for Sale’ – Each scrip in this category is re-valued at the
market price or fair value and the resultant depreciation of each scrip in this category is recognised in the Profit and Loss account. Appreciation, if any, is ignored.
Market value of government securities (excluding treasury bills) is determined on the basis of the price list published by RBI or the prices periodically declared by PDAI jointly with FIMMDA for valuation at year-end. In case of unquoted government securities market price or fair value is determined as per the rates published by FIMMDA.
Market value of other debt securities is determined based on the yield curve and spreads provided by FIMMDA.
Equity shares are valued at cost or the closing quotes on a recognised stock exchange, whichever is lower. Treasury bills are valued at carrying cost, which includes discount amortised over the period to maturity. Units of mutual funds are valued at the lower of cost and net asset value provided by the respective mutual funds.
(iv) Investments in Equity Shares held as Long-term investments by
erstwhile IndusInd Enterprises & Finance Ltd. and Ashok Leyland Finance Ltd. (since merged) are valued at cost. Provision towards diminution in the value of such Long-term investments is made only if the diminution in value is not temporary in the opinion of management.
(v) Settlement Date accounting method is followed for recording purchase and sale of transactions in Government securities.
(vi) Broken period interest on debt instruments is treated as a revenue
item. Brokerage, commission, etc. pertaining to investments paid at the time of acquisition is charged to revenue.
(vii) In line with the RBI guidelines on uniform accounting methodology, with effect from 1st April 2010, Repurchase (Repo) / Reverse Repurchase (Reverse Repo) transactions are accounted for as Borrowing / Lending respectively. On completion of the second leg of the Repo / Reverse Repo transaction, the difference between the consideration amounts is reckoned as Interest Expenditure / Income. Amounts outstanding in Repo / Reverse Repo account as at the Balance Sheet date is shown as a part of Borrowings / Money at Call and at Short Notice respectively, and only the accrued expenditure / income till the Balance Sheet date is taken to Profit and Loss account. Outstanding Repo transactions are marked to market as per the investment classification of the security.

12
(viii) Profit in respect of investments sold from “HTM” category is included in Profit on Sale of Investments and an equivalent amount (net of taxes if any, and transfer to Statutory Reserves as applicable to such profits) is transferred out of P & L Appropriation account after tax to Capital Reserve account.
(ix) Security Receipts (SR) are valued at the lower of redemption value of
the security or the Net Asset Value (NAV) obtained from Securitization Company/ Reconstruction Company.
(x) In the event, provisions created on account of depreciation in the
‘AFS’ or ‘HFT’ categories are found to be in excess of the required amount in any year, the excess is credited to Profit and Loss account and an equivalent amount (net of taxes , if any and net of transfer to Statutory Reserves as applicable to such excess provision) is appropriated to an Investment Reserve account (IRA) in Schedule 2 – “Reserves & Surplus” under the head ‘Revenue & Other reserves’. The balance in IRA account is included under Tier II within the overall ceiling of 1.25% of total Risk Weighted Assets prescribed for General Provisions / Loss reserves.
The balance in IRA account is used to meet provision on account of depreciation in AFS and HFT categories by transferring an equivalent amount to Profit and Loss account as and when required.
4) Derivatives
Derivative contracts are designated as hedging or trading and accounted for as follows: (i) The hedging contracts comprise forward rate agreements, interest rate
swaps and currency swaps undertaken to hedge interest rate risk on certain assets and liabilities. The net interest receivable/ payable is accounted on an accrual basis over the life of the swaps. However, where the hedge is designated with an asset or liability that is carried at market value or lower of cost and market value in the financial statements, then the hedging is also marked to market with the resulting gain or loss recorded as an adjustment to the market value of designated assets or liabilities.
(ii) The trading contracts comprise proprietary trading in interest rate swaps and currency futures. The gain/ loss arising on unwinding or termination of the contracts, is accounted for in the Profit and Loss account. Trading contracts outstanding as at the balance sheet date are re-valued at their fair value and resulting gains / losses are recognised in the Profit and Loss account.
(iii) Premium paid and received on currency options is accounted up-front in the
Profit and Loss account as all options are undertaken on a back-to-back basis.
(iv) Provisioning of overdue customer receivable on derivative contracts, if any,
is made as per RBI guidelines.

13
(v) In accordance with the Prudential Norms for Off-balance Sheet Exposures issued by RBI, provisioning against outstanding credit exposure as at the balance sheet date is made, as is applicable to the assets of the concerned counterparties under ‘standard’ category. Credit exposures are computed as per the current marked to market value of the contract arising on account of interest rate and foreign exchange derivative transactions.
5) Advances:
5.1 Advances are classified as per the RBI guidelines into standard, sub-standard, doubtful and loss assets after considering subsequent recoveries to date.
5.2 Provision for non-performing assets is made in conformity with the RBI
guidelines.
5.3 In accordance with RBI guidelines, general provision on standard assets has been made as under: a) At 1% of standard advances to Commercial Real Estate Sector b) At 0.25% of standard direct advances to SME and Agriculture c) And at 0.40% of the balance outstanding standard advance.
5.4 Advances disclosed under Schedule 9 of the Balance Sheet are net of
provisions and interest suspended for non-performing advances. Provision made against standard assets is included in ‘Other Liabilities and Provisions’.
5.5 Advances include the Bank’s participation in/ contributions to Pass Through
Certificates (PTCs) and /or to the asset-backed assignment of loan assets of other banks / financial institutions where the Bank has participated on risk-sharing basis.
5.6 Advances exclude derecognised securitised advances, inter-bank
participation and bills rediscounted. 5.7 Amounts recovered against bad debts written off in earlier years are
recognised to the Profit and Loss account.
5.8 Provisions no longer considered necessary in context of the current status of the borrower as a performing asset, are written back to the Profit and Loss account to the extent such provisions were charged to the Profit and Loss account.
5.9 Restructured / rescheduled accounts:
In case of restructured / rescheduled accounts provision is made for the sacrifice against erosion/ diminution in fair value of restructured loans, in accordance with RBI guidelines. The erosion in fair value of the advances is computed as the difference between fair value of the loan before and after restructuring.

14
Fair value of the loan before restructuring is computed as the present value of cash flows representing the interest at the existing rate charged on the advance before restructuring and the principal, discounted at a rate equal to the Bank’s BPLR / Base Rate as on the date of restructuring plus the appropriate term premium and credit risk premium for the borrower category on the date of restructuring. Fair value of the loan after restructuring is computed as the present value of cash flows representing the interest at the rate charged on the advance on restructuring and the principal, discounted at a rate equal to Bank’s BPLR / Base Rate as on the date of restructuring plus the appropriate term premium and credit risk premium for the borrower category on the date of restructuring. In cases restructured under CDR, the amount of sacrifice is generally as per the CDR package. The restructured accounts have been classified in accordance with RBI guidelines, including special dispensation wherever allowed.
6) Securitisation Transactions:
6.1 The Bank transfers loans through securitisation transactions. The Bank securitises its loan receivables both through Bilateral Direct Assignment route as well as transfer to Special Purpose Vehicles (‘SPV’) in securitisation transactions.
6.2 The securitisation transactions are without recourse to the Bank. The
transferred loans and such securitised-out receivables are de-recognised in the balance sheet as and when these are sold (true sale criteria being fully met) and the consideration has been received by the Bank. Gains / losses are recognised only if the Bank surrenders the rights to the benefits specified in the loan contracts.
6.3 In respect of certain transactions, the Bank provides credit enhancements in
the form of cash collaterals / guarantee and/or by subordination of cashflows to senior Pass Through Certificates (PTC). Retained interest and subordinated PTCs are disclosed under “Advances” in the balance sheet.
6.4 Recognition of gain or loss arising out of Securitisation of Standard Assets :
In terms of RBI guidelines, profit/premium arising on account of sale of standard assets, being the difference between the sale consideration and book value, is amortised over the life of the securities issued by the Special Purpose Vehicles (‘SPV’).
Any loss arising on account of the sale is recognized in the Profit and Loss Account in the period in which the sale occurs.

15
7) Fixed Assets:
7.1 Fixed assets (including assets given on operating lease) have been stated at cost (except in the case of premises which were re-valued based on values determined by approved valuers) less accumulated depreciation and impairment, if any. Cost includes incidental expenditure incurred on the assets before they are ready for intended use. The carrying amount of fixed assets is reviewed at each balance sheet date if there are any indications of impairment based on internal / external factors.
7.2 The appreciation on revaluation is credited to Revaluation Reserve.
Depreciation relating to revaluation is adjusted against the Revaluation Reserve.
7.3 Depreciation has been provided pro rata for the period of use, on Straight
Line Method at such rates that are reflective of management’s estimate of the useful life of the related fixed assets. These rates are as prescribed under Schedule XIV to the Companies Act, 1956, except in respect the following where the rates adopted are higher than the prescribed rates:
(a) Computers at 33.33% p.a. (b) Furniture and Fixtures at 10% p.a. (c) Electrical Installations at 10% p.a. (d) Other Office Equipment at 10% p.a. (e) Vehicles at 20% p.a.
Taking into account various criteria such as changes in technology, changes in business environment, utility and efficacy of an asset class to meet with intended user needs, etc., the useful life of an asset class is periodically assessed. Whenever there is a revision in the estimated useful life of an asset, the unamortised depreciable amount will be charged over the revised remaining useful life of the said asset.
8) Revenue Recognition:
8.1 Income by way of interest and discount on performing assets is recognised on accrual basis and on non-performing assets the same is recognised on realisation.
8.2 Interest on Government securities, debentures and other fixed income
securities is recognised on accrual basis. Income on discounted instruments is recognised over the tenor of the instrument on a straight-line basis.
8.3 Dividend income is accounted on accrual basis when the right to receive
payment is established. 8.4 Commission (except for commission on Deferred Payment Guarantees
which is recognised on accrual basis), exchange and brokerage are recognised on realisation.

16
8.5 Lease income and service charges earned on the Consumer Finance Advances are recognised on accrual basis.
8.6 Income from distribution of third party products is recognised on the basis
of business booked. 9) Operating Leases:
Lease rental obligations in respect of assets taken on operating lease are charged to profit and loss account on straight-line basis over the lease term. Initial direct costs are charged to profit and loss account. Assets given under leases in respect of which all the risks and benefits of ownership are effectively retained by the Bank are classified as operating leases. Lease rentals received under operating leases are recognized in the profit and loss account on accrual basis as per contracts.
10) Retirement and Other Employee Benefits :
10.1 Payment obligations under the Group Gratuity scheme are managed through purchase of appropriate insurance policies. The Gratuity scheme of the Bank is a defined benefit scheme and the expense for the year is recognized on the basis of actuarial valuation as at the balance sheet date.
10.2 Provident fund contributions are made under trusts separately established
for the purpose and the scheme administered by Regional Provident Fund Commissioner (RPFC), as applicable.
10.3 Provision for compensated absences has been made in the accounts on the basis of actuarial valuation as at the balance sheet date. The actuarial valuation is carried out as per the projected unit credit method.
10.4 The Bank has applied the intrinsic value method to account for the
compensation cost of ESOP granted to the employees of the Bank. Intrinsic value is the amount by which the quoted market price of the underlying shares on the grant date exceeds the exercise price of the options. Accordingly, the compensation cost is amortized over the vesting period.
11) Segment Reporting:
In accordance with the guidelines issued by RBI, Bank has adopted Segment Reporting as under:
1. Treasury includes all investment portfolio, profit/ loss on sale of
investments, profit/loss on foreign exchange transactions, equities, income from derivatives and money market operations. The expenses of this segment consist of interest expenses on funds borrowed from external sources as well as internal sources and depreciation / amortisation of premium on Held to Maturity category investments.

17
2. Corporate/ Wholesale Banking includes lending and deposits from
corporate customers and identified earnings and expenses of the segment. 3. Retail Banking includes lending and deposits from retail customers and
identified earnings and expenses of the segment. 4. Other Banking Operations includes all other operations not covered under
Treasury, Wholesale Banking and Retail Banking.
12) Income-tax:
Tax expenses comprise current and deferred taxes. Current income tax is measured at the amount expected to be paid to the tax authorities in accordance with the Income Tax Act, 1961. Deferred income taxes reflect the impact of current year timing differences between taxable income and accounting income for the year and reversal of timing differences of earlier years. Deferred tax is measured based on the tax rates and the tax laws enacted or substantively enacted at the balance sheet date. Deferred tax assets are recognised only to the extent that there is reasonable certainty that sufficient future taxable income will be available against which such deferred tax assets can be realized. Unrecognized deferred tax assets of earlier years are re-assessed and recognised to the extent that it has become reasonably certain that future taxable income will be available against which such deferred tax assets can be realized.
13) Earnings per Share:
Earnings per share are calculated by dividing the net profit or loss for the period attributable to equity shareholders by the weighted average number of equity shares outstanding during the period. Diluted earnings per equity share have been computed using the weighted average number of equity shares and dilutive potential equity shares outstanding as at end of the year.
14) Provisions: A provision is recognised when there is an obligation as a result of past event, and it is probable that an outflow of resources will be required to settle the obligation, and in respect of which a reliable estimate can be made. Provisions are not discounted to their present value and are determined based on best estimate required to settle the obligation at the balance sheet date. These are reviewed at each balance sheet date and adjusted to reflect the current best estimates.
15) Others:
Cash and cash equivalents in the cash flow statement comprise cash in hand and balances with RBI (Schedule 6) and balances with banks and money at call and short notice (Schedule 7).

18
Schedule 18 NOTES ON ACCOUNTS
1. Capital Adequacy Ratio: The Bank computes Capital Adequacy Ratio as per RBI guidelines. The prudential norms laid down by RBI, for capital adequacy under Basel I framework (Basel I) require the Bank to maintain a Capital to Risk weighted Assets Ratio at a minimum of 9%, covering credit risk and market risk. As per RBI directions, the Bank has migrated to the New Capital Adequacy Framework (Basel II) with effect from March 31, 2009. Under the Basel II guidelines, the Bank is required to maintain Capital to Risk weighted Assets Ratio, at a minimum of 9% on an on-going basis covering, credit risk, market risk and operational risk. Further, the minimum capital to be maintained by the Bank is subjected to a prudential floor which is the higher of : (a) Minimum capital to be maintained under the New Capital Adequacy
Framework (Basel II); and (b) 80% of the minimum capital to be maintained under Basel I guidelines
The capital adequacy ratio of the Bank, calculated as per RBI guidelines is set out below:
(Rs. in crores)
As per Basel I Framework
As per Basel II Framework
Items March 31, 2011
March 31, 2010
March 31, 2011
March 31, 2010
Tier I Capital 3774.06 2139.99 3774.06 2139.99 Tier II Capital 1108.21 1259.46 1108.21 1259.46 Total Capital 4882.27 3399.45 4882.27 3399.45 Total risk weighted assets 33918.87 25376.24 30716.03 22179.61 i) Capital Adequacy Ratio (%) 14. 39% 13.40% 15.89% 15.33% ii) CRAR - Tier I Capital (%) 11.13% 8.43% 12.29% 9.65% iii) CRAR - Tier II Capital (%) 3.26% 4.97% 3.60% 5.68% iv) Amount of subordinated debt
raised as Tier-II capital Nil 420.00 Nil 420.00
(of which Upper Tier II capital)
- - - -
The Bank’s capital funds are higher than the minimum requirements prescribed under the Basel I and Basel II framework.

19
2. Investments:
2.1 Details of Investments: (Rs. in crores) 2010-2011 2009-2010 (1) Value of Investments : (i) Gross Value of Investments
(a) In India (b) Outside India
(ii) Provision / Depreciation (a) In India (b) Outside India
(iii) Net Value of Investments (a) In India (b) Outside India
13562.27 13562.27
- 11.46 11.46
- 13550.81 13550.81
-
10405.68 10405.68
- 3.84 3.84
- 10401.84 10401.84
-
(2) Movements in provision held towards depreciation on Investments : (i) Opening Balance (ii) Add: Provision made during the year (iii)Less: Write-off / write-back of excess
provision during the year (iv) Closing Balance
3.84 9.00
(1.38)
11.46
4.93 0.18
(1.27)
3.84
2.2 Category wise details of Investments (Net): (Rs. in crores)
31/03/2011 31/03/2010 HTM AFS HFT HTM AFS HFT i) Government
securities 8040.48 1981.38 - 6865.97 1655.54 -
ii) Other approved securities
- - - 3.56 - -
iii) Shares 5.35 31.63 - 5.35 30.82 - iv) Debentures and
bonds - 103.43 - - 13.54 -
v) Subsidiaries and/ or Joint Ventures
0.50 - - 0.50 - -
vi) Others - Deposits under RIDF scheme with NABARD, SR/PTC, MF, etc.
1679.54 1,708.50 - 1739.78 86.78 -
Total 9725.87 3824.94 - 8615.16 1786.68 -

20
2.3 Details of Repo/ Reverse Repo (including liquidity adjustment facility) deals:
(Rs. in crores)
Minimum outstanding during the
year
Maximum outstanding during the
year
Daily average
outstanding during the
year
Balance as on
year end
Year ended March 31, 2011 Securities sold under repos i) Government Securities ii) Corporate Debt Securities
5.31
-
1600.00
-
276.98
-
1000.00
- Securities purchased under reverse repos i) Government Securities ii) Corporate Debt Securities
10.07 -
500.00 -
20.93 -
50.32 -
Year ended March 31, 2010 Securities sold under repos iii) Government Securities iv) Corporate Debt Securities
5.08
-
886.04
-
71.67
-
100.00
- Securities purchased under reverse repos iii) Government Securities iv) Corporate Debt Securities
14.66 -
1400.00 -
129.00 -
- -
2.4 a) Issuer composition of Non-SLR investments as at March 31, 2011:
(Rs. in crores)
No. Issuer
Amount
Extent of private placement
Extent of ‘below investment grade’ securities
Extent of ‘unrated’ Securities*
Extent of ‘unlisted’ securities**
1 PSUs - - - - - 2 FIs 1679.54 *** - - - - 3 Banks 10.04 10.04 - - - 4 Private
corporates 133.33 - 1.31 1.31
5 Subsidiaries/ Joint Ventures
0.50 - - -
6 Others 1717.00 17.00 - - 7 Provision held
towards depreciation
(11.46) - (0.55) (0.55)
Total 3528.95 27. 04 - 0.76 0.76 Note
Central Government Security Pledge with CCIL for SGF and Pledge with MCX and NSCCL for Currency Derivative Segment
is not considered as Non SLR Investment Holding
*Excludes investments in NABARD RIDF and equity shares
**Excludes investments in NABARD RIDF
*** Includes deposits placed with NABARD RIDF.

21
No.
b) Issuer composition of Non-SLR investments as at March 31, 2010: (Rs. in crores)
Issuer
Amount
Extent of private placement
Extent of ‘below investment grade’ securities
Extent of ‘unrated’ Securities*
Extent of ‘unlisted’ securities**
1 PSUs - - - - - 2 FIs 1739.78 *** - - - - 3 Banks 62.75 62.75 - - - 4 Private
corporates 38.15 - - - -
5 Subsidiaries/ Joint Ventures
0.50 - - - -
6 Others 39.43 39.43 - 21.31 1.36 7 Provision held
towards depreciation
(3.84) - - - -
Total 1876.77 102.18 - 21.31 1.36 Note: Central government 8.07 GOI 2017 Security pledged with CCIL is not considered as Non SLR investment holding.
*Excludes investments in NABARD RIDF and equity shares
**Excludes investments in NABARD RIDF
Particulars
*** Includes deposits placed with NABARD RIDF.
c) Non-performing Non-SLR investments: (Rs. in crores)
Year ended March 31, 2011
Year ended March 31, 2010
Opening balance 3.14 1.78 Additions during the year since 1st - April
1.36
Reductions during the above period 1.36 - Closing balance 1.78 3.14 Total provisions held 1.78 3.14
3. Derivatives:
3.1 Forward Rate Agreement/Interest Rate Swap/Cross Currency Swaps: (Rs. in crores)
Items March 31, 2011
March 31, 2010
1) The notional principal of swap agreements
2) Losses which would be incurred if counter-parties failed to fulfill their obligations under the agreements
3) Collateral required by the bank upon entering into swaps
4) Concentration of credit risk arising from the swaps (with banks)
5) The fair value of the swap book
18792.71
109.49
-
74.81%
3.07
10609.67
84.22
-
64.91%
1.85

22
The Nature and Terms of the IRS (including IRS denominated in foreign currency and done on back to back basis) as on 31 March 2011 are set out below:
(Rs. in crores)
Nature Nos. Notional Principal
Benchmark Terms
Merchant and Cover
2 150.00 MIBOR Fixed Payable V/s Floating Receivable
Merchant and Cover
2 150.00 MIBOR Fixed Receivable V/s Floating Payable
Merchant and Cover
11 326.87 LIBOR Fixed Receivable V/s Floating Payable
Merchant and Cover
11 326.87 LIBOR Fixed Payable V/s Floating Receivable
Trading 172 6450.00 MIBOR Fixed Receivable V/s Floating Payable
Trading 168 6400.00 MIBOR Fixed Payable V/s Floating Receivable
Hedging 13 400 MIBOR Fixed Receivable V/s Floating Payable
The Nature and Terms of the IRS (including IRS denominated in foreign currency and done on back-to-back basis) as on 31 March 2010 are set out below:
(Rs. in crores)
Nature Nos. Notional Principal
Benchmark Terms
Merchant and Cover
2 53.90 MIBOR Fixed Payable V/s Floating Receivable
Merchant and Cover
2 53.90 MIBOR Fixed Receivable V/s Floating Payable
Merchant and Cover
11 347.10 LIBOR Fixed Payable V/s Floating Receivable
Merchant and Cover
11 347.10 LIBOR Fixed Receivable V/s Floating Payable
Trading 122 4325.00 MIBOR Fixed Receivable V/s Floating Payable
Trading 115 4225.00 MIBOR Fixed Payable V/s Floating Receivable

23
The Nature and Terms of the FRAs as on 31 March 2011 are set out below: (Rs. in crores)
Nature Nos. Notional Principal
Benchmark Terms
Merchant and Cover 142 1749.18 LIBOR FRA Purchased Merchant and Cover 142 1749.18 LIBOR FRA Sold
The Nature and Terms of the FRAs as on 31 March 2010 are set out below:
(Rs. in crores) Nature Nos. Notional
Principal Benchmark Terms
Merchant and Cover 22 435.21 LIBOR FRA Purchased Merchant and Cover 22 435.21 LIBOR FRA Sold
The Nature and Terms of the Options as on 31 March 2011 are set out below:
(Rs. in crores) Nature Nos. Notional Principal Terms
Merchant and Cover 514 2228.65 Options The Nature and Terms of the Options as on 31 March 2010 are set out below:
(Rs. in crores) Nature Nos. Notional Principal Terms
Merchant and Cover 45 1130.67 Options
The Nature and Terms of the CCS (including CCS denominated in foreign currency and done on back to back basis) as on 31 March 2011 are set out below:
(Rs. in crores) Nature Nos Notional
Principal Benchmark Terms
Merchant and Cover
13 278.97 LIBOR
Fixed Payable V/s Floating Receivable (Cross Currency swap)
Merchant and Cover
3 128.29 LIBOR
Fixed Payable V/s Floating Receivable (Cross Currency swap)
Merchant and Cover
7 128.79 LIBOR
Fixed Payable V/s Floating Receivable (Cross Currency swap)
Merchant and Cover
13 290.79 LIBOR
Fixed Receivable V/s Floating Payable (Cross Currency swap)
Merchant and Cover
3 130.10 LIBOR
Fixed Receivable V/s Floating Payable (Cross Currency swap)
Merchant and Cover
7 133.68 LIBOR
Fixed Receivable V/s Floating Payable (Cross Currency swap)

24
The Nature and Terms of the CCS (including CCS denominated in foreign currency and done on back to back basis) as on 31 March 2010 are set out below:
(Rs. in crores) Nature Nos. Notional
Principal Benchmark Terms
Merchant and Cover 2 177.76 LIBOR
Fixed Payable V/s Floating Receivable (Cross Currency swap)
Merchant and Cover 2 12.03 LIBOR
Fixed Payable V/s Floating Receivable (Coupon only swap)
Merchant and Cover 2 184.38 LIBOR
Fixed Receivable V/s Floating Payable (Cross currency swap)
Merchant and Cover 2 13.09 LIBOR
Fixed Receivable V/s Floating Payable (Coupon only swap)
3.2 Exchange Traded Interest Rate Derivatives:
The Bank has not undertaken exchange traded interest rate derivative transactions
during the year.
3.3 Disclosures on Risk Exposure in Derivatives
The Risk Management Department of the Bank is responsible for measuring, reporting and monitoring risk arising from Derivatives transactions. Risk Management Department functions independent of the Treasury. The risk management methods generally applied are quantitative like Value at Risk, PV01, stop-loss limits, counterparty limits, deal sizes and overnight positions.
The Risk Management function undertakes the following activities:
Monitors daily derivatives operations against the set out policies and limits Reviews daily profitability, product-wise, and activity reports for derivatives
operations Reports MIS and exceptions to the Top Management on a daily basis Ensures monitoring of effectiveness of derivative deals identified as hedges
against the terms of the hedging instruments and underlying hedged risk.
Bank undertakes derivative transactions for hedging of customer’s exposure, hedging the Bank’s exposure and for trading purposes wherever permitted by RBI. Derivative trades are done both for the Bank’s balance sheet hedging requirements and also for the customer hedging requirements. The Customers use these products offered to hedge their forex and interest rate exposure. All the trades with customers are covered on a back to back basis with other market makers.

25
The Derivatives policy, approved by Board of Directors, define the framework for carrying out the derivatives business and lays down policies and processes adopted to measure, monitor and report risk arising from derivative transactions. Derivatives Policy provides : Appropriate risk limits for different derivatives products Authority for review of limit breaches and to take appropriate actions.
Derivatives policy prescribes ‘Product Suitability and Customer Appropriateness’ policy which is used to classify the clients depending on their understanding of the derivative products. The following table presents summarized data relating to Derivatives:
(Rs. in crores) March 31, 2011 March 31, 2010
Sr. No
Particulars Currency Derivatives
Interest rate
Derivatives
Currency Derivatives
Interest rate Derivatives
1 Derivatives (Notional Principal Amount)
- 13250.00 - 10609.67
a) For hedging - 400.00 - - b) For trading - 12850.00 - 10609.67 2 Marked to Market Positions- a) Asset (+) - 3.07 - 1.85 b) Liability (-) - - - - 3 Credit Exposure - 178.37 - 196.28 4 Likely impact of one percentage change in interest rate (100*PV01) (Note
1) a) on hedging
derivatives - 0.15 - -
b) on trading derivatives
- 0.02 - 0.01
5 Maximum and Minimum of 100*PV01 observed during the year (Note 2) (Rs. in lacs)
a) on hedging* - Max: 19.57 Min: 0.00
- Max: 4.53 Min: 0.00
b) on trading - Max: 20.26 Min: 0.03
- Max: 6.66 Min: 0.00
* During the tenor of the hedge minimum PV01 was 15.15 lacs Note 1: Based on the PV01 of the outstanding derivatives as at March 31, 2011. Note 2: Based on the absolute value of PV01 of the derivatives outstanding during the year.
Derivative contracts that are “back-to-back” have not been included herein. Note 3: Mark to Market positions above includes interest accrued on the swaps. Note 4: Forward Exchange Contracts are not included in the Currency derivates above. Note 5: There were no outstanding currency futures as on March 31, 2011. Foreign Currency exposure not hedged by derivative instruments (Net Open Position) as on March 31, 2011 is Rs. (5.69) crores (previous year Rs. (0.20) crores).

26
4. Asset Quality:
4.1 Non-Performing Assets:
(Rs. in crores)
Items 2010-2011 2009-2010 (i) Net NPAs to Net Advances (%) (ii) Movement in Gross NPAs
a) Opening Balance b) Additions during the year c) Reductions during the year
(i) Upgradations (ii) Recoveries (excluding recoveries
made from upgraded accounts)* (iii) Write-offs
d) Closing Balance
(iii) Movement in Net NPAs a) Opening Balance b) Additions during the year c) Reductions during the year d) Closing Balance
(iv) Movement in provisions for NPAs
(excluding provisions on standard assets) a) Opening Balance b) Provisions made during the year c) Write-off/write-back of excess provisions d) Closing Balance
0.28%
255.47 190.38
30.71
38.55
110.73 265.86
101.83 17.97 46.98 72.82
153.64 172.41 133.01 193.04
0.50%
255.02 221.60
81.65
69.99 69.51
255.47
179.13 48.66
125.96 101.83
75.89 172.94 95.19
153.64 * Recoveries include sale to ARC
4.2 Sector-wise NPAs
Sl. No. Sector
% of NPAs to Advances in that sector as on
March 31, 2011 March 31, 2010 1 Agriculture & allied
activities 0.94% 1.17%
2 Industry (Micro & Small, Medium and Large)
0.56% 0.52%
3 Services 0.69% 0.71% 4 Personal Loans 72.41% 54.69%

27
4.3 Details of Loan Assets subjected to Restructuring as on March 31, 2011 (Rs. in crores)
CDR
Mechanism SME Debt
Restructuring
*Others incl. Consumer/
Vehicle loans
Standard Advances Restructured
No. of Borrowers
6 (3)
1 (1)
44 (81)
Amount Outstanding
67.75 (33.74)
9.16 (11.59)
3.71 (8.03)
Sacrifice (diminution in the fair value)
7.98 (5.41)
0.17 (0.17)
0.41 (0.56)
Substandard Advances Restructured
No. of Borrowers
1 - -
1 (1)
Amount Outstanding
8.97 - -
3.95 (5.88)
Sacrifice (diminution in the fair value)/ NPA provision held
8.97 - -
3.26^ -
Doubtful Advances Restructured
No. of Borrowers
1 - -
1 -
Amount Outstanding
10.00 - -
5.83 -
Sacrifice (diminution in the fair value) / NPA provision held
10.00 - -
5.83 -
TOTAL
No. of Borrowers
8 (3)
1 (1)
46 (82)
Amount Outstanding
86.72 (33.74)
9.16 (11.59)
13.49 (13.91)
Sacrifice (diminution in the fair value) / NPA provision held
26.95 (5.41)
0.17 (0.17)
9.50 (0.56)
^ Bank holds NPA provision of Rs. 3.11 crores Note: Amounts in brackets represent previous year figures
4.4 Details of financial assets sold to Securitisation / Reconstruction Company for
asset reconstruction: (Rs. in crores) Items 2010-2011 2009-2010 1) No. of accounts 2) Aggregate value (net of provisions) of
accounts sold to SC/ RC 3) Aggregate consideration 4) Additional consideration realized in respect of
accounts transferred in earlier years 5) Aggregate gain/ (loss) over net book value
- -
- 1.30
-
1046 21.27
21.00
-
(0.27)

28
4.5 During the year, there has been no purchase / sale of non-performing financial
assets from /to other banks.
4.6 During the year, there was no securitization transaction pertaining to Standard Advances (previous year Nil).
4.7 Provision on Standard Assets :
Items March 31, 2011 March 31, 2010 Cumulative Provision held for Standard Assets
103.02 80.12
Provision towards Standard Assets has not been netted off from Advances but included in ‘Other Liabilities and Provisions – Others’ in Schedule 5.
5. Business ratios:
March 31, 2011 March 31, 2010 i) Interest income as a percentage to
working funds 9.05% 8.80%
ii) Non-interest income as a percentage to working funds
1.80% 1.80%
iii) Operating profit as a percentage to working funds
2.73% 2.29%
iv) Return on assets 1.46% 1.14% v) Business (deposits plus gross
advances) per employee including trainees (Rs. in lacs)
843.98 837.46
vi) Profit per employee including trainees (Rs. in lacs)
8.24 6.51
vii) Provision coverage ratio 72.61% 60.14% Note: (1) Working funds are calculated at the average of working funds as per the Bank’s monthly returns
(Form X) filed with the RBI. (2) Business per employee (deposits plus gross advances) is computed excluding Inter-bank
deposits. (3) Returns on Assets are computed with reference to average working funds.

29
6. Asset Liability Management:
Maturity Pattern of Assets and Liabilities: (a) As at March 31, 2011:
(Rs. in crores)
Day 1 2 to 7 Days
8 to 14 Days
15 to 28 Days
29 days to 3
months
Over 3 months
to 6 months
Over 6 months to
1 year
Over 1 year to 3
years
Over 3 years to 5 years
Over 5 years
Total
Deposits 260.32 1,281.81 1,099.05 1,219.63 7,502.35 3,164.75 7,988.27 10,658.49 612.12 578.58 34,365.37
Loans & Advances 461.34 870.87 341.77 1,376.28 4,323.50 2,448.60 4,549.77 9,907.60 1,353.46 532.46 26,165.65
Investment Securities 750.32 - - - 253.66 880.56 1,058.62 491.51 1,363.34 8,752.80 13,550.81
Borrowings 3.82 1,005.49 76.49 101.19 1,083.00 946.63 - 521.91 1,477.99 308. 90 5,525.42
Foreign currency assets
- - - - - - - - - 37.18 37.18
Foreign currency liabilities
141.29 - - - - - - - - -
141.29
(b) As at March 31, 2010: (Rs. in crores)
Day 1 2 – 7 Days
8 – 14 Days
15-28 Days
29 days to 3
months
Over 3 months to 6 months
Over 6 months to
1 year
Over 1 year to 3
years
Over 3 years to 5
years
Over 5 years
Total
Deposits 163.96 703.96 749.75 749.67 3626.83 5354.04 6157.17 8164.29 525.85 514.65 26710.17
Loans & Advances 752.41 819.23 655.89 1063.44 3339.32 2084.27 5324.24 5436.87 771.02 303.90 20550.59
Investment Securities - - - - 183.42 593.11 935.52 550.86 1256.28 6882.65 10401.84
Borrowings - 1140.97 11.30 19.20 629.31 517.96 - 342.43 1425.23 847.89 4934.29
Foreign currency assets
- - - - - - - - - 43.02 43.02
Foreign currency liabilities
142.49 - - - - - - - - - 142.49

30
7. Exposures: 7.1 Exposure to Real Estate Sector :
(Rs. in crores) Items March
31, 2011 March
31, 2010 a) Direct Exposure
(i) Residential Mortgages [of which individual housing loans upto Rs.20 lacs is Rs. 121.16 crores (previous year Rs.99.92 crores)]
(ii) Commercial Real Estate *
(iii) Investments in Mortgage Backed Securities (MBS) and other securitised Exposures : a) Residential, b) Commercial Real Estate
b) Indirect Exposure Fund based and non-fund based exposures on National Housing Bank (NHB) and Housing Finance Companies (HFCs) Total Real Estate Exposure
214.12
882.79
- -
409.56
1506.47
146.68
452.96
- -
300.55
900.19 * Does not include corporate lending backed by mortgage of land and building.
7.2 Exposure to Capital Market:
(Rs. in crores) Items March
31, 2011 March
31, 2010 (i) Direct investment in equity shares, convertible bonds,
convertible debentures and units of equity oriented mutual funds the corpus of which is not exclusively invested in corporate debt;
7.15
7.15
(ii) Advances against shares/bonds/ debentures or other securities or on clean basis to individuals for investment in shares (including IPOs/ESOPs), convertible bonds, convertible debentures, and units of equity-oriented mutual funds;
22.73
23.79
iii) Advances for any other purposes where shares or convertible bonds or convertible debentures or units of equity oriented mutual funds are taken as primary security;
NIL
NIL
(iv) Advances for any other purposes to the extent secured by the collateral security of shares or convertible bonds or convertible debentures or units of equity oriented mutual funds i.e. where the primary security other than shares / convertible bonds/convertible debentures/units of equity oriented mutual funds `does not fully cover the advances;
72.26
135.00

31
(v) Secured and unsecured advances to stockbrokers and
guarantees issued on behalf of stockbrokers and market makers;
718.08
505.69
vi) Loans sanctioned to corporates against the security of shares / bonds/debentures or other securities or on clean basis for meeting promoter’s contribution to the equity of new companies in anticipation of raising resources;
NIL
NIL
(vii) Bridge loans to companies against expected equity flows/issues;
NIL
NIL
viii)Underwriting commitments taken up by the banks in respect of primary issue of shares or convertible bonds or convertible debentures or units of equity oriented mutual funds;
NIL
NIL
(ix) Financing to stockbrokers for margin trading;
NIL NIL
(x) All exposures to Venture Capital Funds (both registered and unregistered)
NIL
NIL
Total Exposure to Capital Market 820.22 671.63
7.3. Risk Category-wise exposure to country risk:
(Rs. in crores) Risk category Exposure
(net) as at March 31,
2011
Provision held as at March 31,
2011
Exposure (net) as at March 31,
2010
Provision held as at March 31,
2010 Insignificant 881.37 - 346.10 - Low 415.03 - 111.59 - Moderate 44.48 - 4.68 - High 4.89 - 15.39 - Very High 2.03 - 122.00 - Restricted 1.68 - - - Off Credit 0.00 - - -
Total 1349.48 - 599.76 -
7.4 Single borrower limit and Group Borrower Limit: During the year the Bank has not exceeded the prudential credit exposure
limit in respect of Single Borrower and Group Borrowers.
7.5 Unsecured advances The Bank has not extended any project advances where the collateral is an intangible asset such as a charge over rights, licences, authorizations etc. As such, the Unsecured Advances of Rs. 3,714.28 crores (previous year Rs. 2,837.18 crores) as given in Schedule 9B(iii) are without any collateral or security.

32
8. Concentration of Deposits, Advances, Exposures and NPAs
8.1 Concentration of Deposits (Rs. in crores)
As on March 31, 2011
As on March 31, 2010
Total Deposits of twenty largest depositors 10,029.11 8,444.45 Percentage of Deposits of twenty largest depositors to Total Deposits of the Bank
29.18% 31.62%
8.2 Concentration of Advances* (Rs. in crores)
As on March 31, 2011
As on March 31, 2010
Total Advances to twenty largest borrowers 8,135.08 5,152.27 Percentage of Advances to twenty largest borrowers to Total Advances of the Bank
20.64% 18.24%
*Advances computed as per definition of Credit Exposure including derivatives furnished in Master Circular on Exposure Norms DBOD.No.Dir.BC.15/13.03.00/2009-10 dated July 1, 2010.
8.3 Concentration of Exposures**
(Rs. in crores) As on March
31, 2011 As on March
31, 2010 Total Exposure to twenty largest borrowers / customers
8,135.08 5,152.27
Percentage of Exposure to twenty largest borrowers / customers to Total Exposure of the Bank on borrowers / customers
20.57% 18.18%
**Exposures computed based on credit and investment exposure as prescribed in Master Circular on Exposure Norms DBOD.No.Dir.BC.15/13.03.00/2009-10 dated July 1, 2010.
8.4 Concentration of NPAs
(Rs. in crores) As on March
31, 2011 As on March
31, 2010 Total Exposure to top four NPA accounts 36.74 43.98
9. Miscellaneous:
9.1 Amount of Provisions for taxation during the year : (Rs. in crores)
Particulars 2010-11 2009-10 Provision for Income Tax /deferred tax 302.06 182.34 Wealth tax 0.40 0.40 Total 302.46 182.74

33
9.2. Disclosure of penalties imposed by RBI : The Reserve Bank of India has not imposed any penalty on the Bank u/s 46(4) of the Banking Regulation Act, 1949.
9.3 Fixed Assets:
Cost of premises includes Rs.4.09 crores (previous year Rs. 4.09 crores) in respect of properties for which execution of documents and registration formalities are in progress. Of these properties, the Bank has not obtained full possession of one property having WDV of Rs.1.78 crores (previous year Rs. 1.81 crores) and has filed a suit for the same.
9.4 Changes in Accounting Estimates – Revision of estimated useful life of fixed
assets With effect from January 1, 2011, the estimated useful life of Furniture and Fixtures has been revised to 10 years from 15 years, Electrical Installation and Other Office Equipment to 10 years from 20 years, and Vehicles to 5 years from 10 years. Consequent to this revision, the depreciation charged to Profit and Loss account during the year is higher by Rs.12.66 crores with a corresponding decrease in the carrying amount of Other Fixed Assets under Schedule 10 as at the Balance Sheet date.
9.5 Other Assets:
Other assets include stock of gold on consignment basis of Rs. 10.96 crores (previous year Rs. 13.05 crores) and Net Deferred Tax Assets Rs. 47.88 crores (previous year Rs. 23.38 crores).
9.6 Other Liabilities and Provisions:
‘Other Liabilities – Others’ include credit balances in nostro accounts aggregating Rs. 66.86 crores crores (previous year Rs. 86.74 crores).
9.7 Contingent Liabilities:
Claims against the Bank not acknowledged as debts comprise tax demands in respect of which the Bank is in appeal of Rs.149.64 crores (previous year Rs. 151.41 crores) and the cases sub-judice Rs.159.96 crores (previous year Rs. 145.92 crores). The above are based on the management’s estimate, and no significant liability is expected to arise out of the same.
9.8 Other Income
9.8.1 Fees received in Bancassurance business
Commission, Exchange and Brokerage in Schedule 14 include the following fees earned on Bancassurance business:
(Rs. in crores) Nature of Income March 2011 March 2010 (1) For selling life insurance policies 71.42 55.25 (2) For selling non life insurance policies
66.94 44.87
(3) For selling mutual fund products 22.69 14.01 (4) Others - - Total 161.05 114.13
34
9.8.2 Miscellaneous income includes recovery from bad debts written off
Rs. 20.95 crores (previous year Rs. 22.23 crores), lease rentals Rs. 2.47 crores (previous year Rs. 19.68 crores) and others (processing charges, cheque return charges and depository services charges, etc.) Rs.238.71 crores (previous year Rs. 153.62 crores).
9.9 The Bank does not have any Overseas branches and hence the disclosure
regarding total assets, NPAs and revenue is not applicable.
9.10 The Bank does not have any Off-balance Sheet SPVs (which are required to be consolidated as per accounting standards).
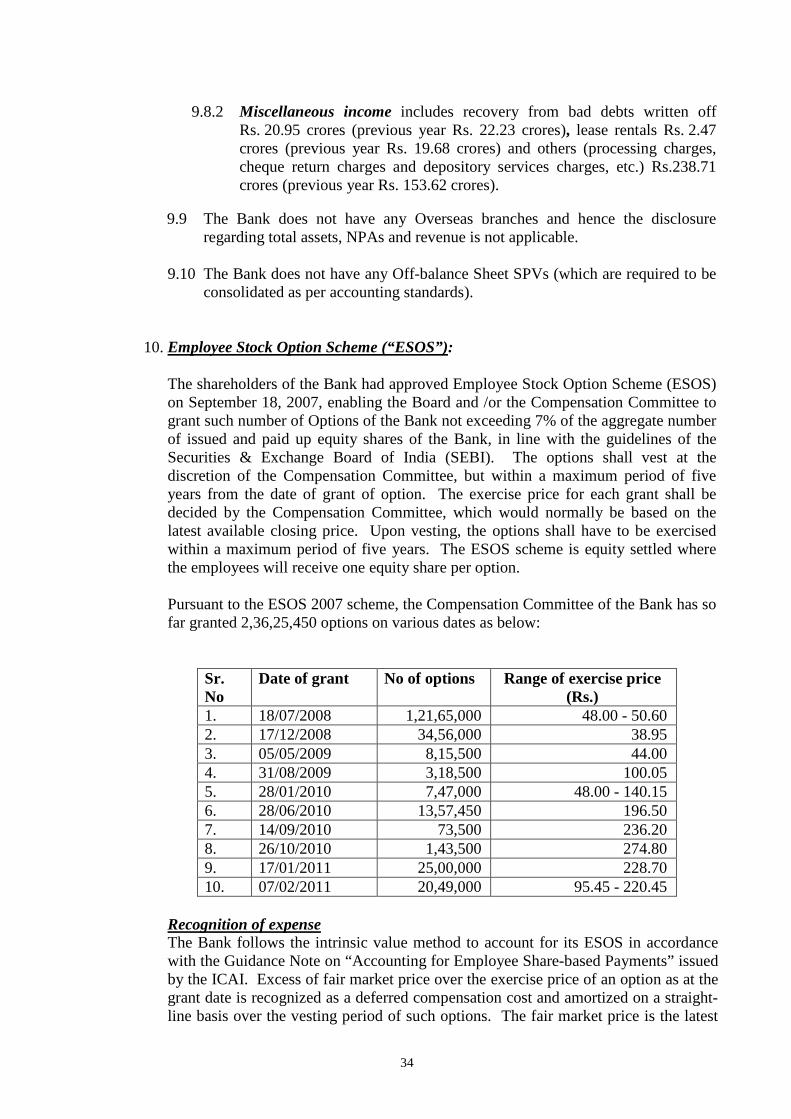
10. Employee Stock Option Scheme (“ESOS”): The shareholders of the Bank had approved Employee Stock Option Scheme (ESOS) on September 18, 2007, enabling the Board and /or the Compensation Committee to grant such number of Options of the Bank not exceeding 7% of the aggregate number of issued and paid up equity shares of the Bank, in line with the guidelines of the Securities & Exchange Board of India (SEBI). The options shall vest at the discretion of the Compensation Committee, but within a maximum period of five years from the date of grant of option. The exercise price for each grant shall be decided by the Compensation Committee, which would normally be based on the latest available closing price. Upon vesting, the options shall have to be exercised within a maximum period of five years. The ESOS scheme is equity settled where the employees will receive one equity share per option. Pursuant to the ESOS 2007 scheme, the Compensation Committee of the Bank has so far granted 2,36,25,450 options on various dates as below:
Sr. No
Date of grant No of options Range of exercise price (Rs.)
1. 18/07/2008 1,21,65,000 48.00 - 50.60 2. 17/12/2008 34,56,000 38.95 3. 05/05/2009 8,15,500 44.00 4. 31/08/2009 3,18,500 100.05 5. 28/01/2010 7,47,000 48.00 - 140.15 6. 28/06/2010 13,57,450 196.50 7. 14/09/2010 73,500 236.20 8. 26/10/2010 1,43,500 274.80 9. 17/01/2011 25,00,000 228.70 10. 07/02/2011 20,49,000 95.45 - 220.45
Recognition of expense The Bank follows the intrinsic value method to account for its ESOS in accordance with the Guidance Note on “Accounting for Employee Share-based Payments” issued by the ICAI. Excess of fair market price over the exercise price of an option as at the grant date is recognized as a deferred compensation cost and amortized on a straight-line basis over the vesting period of such options. The fair market price is the latest

35
available closing price, prior to the date of the meeting of Board of Directors, in which options are granted, on the stock exchange on which the shares of the Bank are listed. Since shares are listed in more than one stock exchange, the stock exchange where the Bank’s shares have been traded highest on the said date is considered. Stock option activity under the scheme during the year:
No. of options Weighted average exercise price (Rs.)
Outstanding at the beginning of the year
1,62,22,500 48.37
Granted during the year 67,23,450 199.34 Forfeited / surrendered during the year
1,36,300 108.09
Exercised during the year 53,19,195 47.34 Expired during the year Nil Nil Outstanding at the end of the year 1,74,90,455 106.25 Options exercisable at the end of the year
87,58,505 47.98
The weighted average market price of options exercised during the year is Rs. 259.21.
Following summarises the information about stock options outstanding as at March 31, 2011: Grant Exercise
Price Number of shares arising out of options
Weighted average life of options (in years)
18 July 2008 48.00 73,25,000 4.15 18 July 2008A 50.60 10,14,100 4.31 17 Dec 2008 38.95 15,54,130 4.73 5 May 2009 44.00 5,69,705 5.11 31 August 2009 100.05 2,45,570 5.43 28 Jan 2010 140.15 1,08,250 5.84 28 Jan 2010A 48.00 6,00,000 4.84 28 Jun 2010 196.50 13,16,700 6.26 14 Sep 2010 236.20 64,500 6.47 26 Oct 2010 274.80 1,43,500 6.59 17 Jan 2011 228.70 25,00,000 6.82 7 Feb 2011 95.45 2,84,000 5.86 7 Feb 2011A 220.45 17,65,000 6.87
Fair value methodology:
The fair value of options granted during the year has been estimated on the date of grant using the Black-Scholes option pricing model with the following assumptions: 2010-11 Average dividend yield 1.25% Expected volatility 66.15% - 73.33% Risk free interest rates 6.61% - 8.08% Expected life of options (in years) 3.50 - 4.51 Expected forfeiture Nil

36
Expected volatility is a measure of the amount by which the equity share price is expected to fluctuate during a period. The measure of volatility used in Black-Scholes option pricing model is the annualized standard deviation of the continuously compounded rates of return on the share over a period of time. Expected volatility has been computed by considering the historical data on daily volatility in the closing equity share price on NSE, over a prior period equivalent to the expected life of the options, till the date of the grant.
Bank has charged Rs 6.48 crores to P&L being the intrinsic value of stock options granted for the year ended March 31, 2011. Had the Bank adopted the Black-Scholes model based fair valuation, compensation cost for the year ended March 31, 2011, would have increased by Rs 25.20 crores and the proforma profit after tax would have been lower correspondingly. On a proforma basis, the basic and diluted earnings per share would have been Rs.12.58 and Rs. 12.32 respectively. The weighted average fair value of options granted during the year ended March 31, 2011 is Rs.126.87.
11. Disclosures - Accounting Standards :
11.1 Net Profit or Loss for the period, prior period items and changes in accounting
policies (AS-5): There has been no material change in Accounting Policies adopted during the
year ended March 31, 2011, from those followed for the year ended March 31, 2010.
11.2 Employee Benefits (AS-15):
Gratuity: The benefit of Gratuity is funded defined benefit plan. For this purpose the company has obtained two qualifying insurance policies from LIC of India and Aviva Life Insurance Company India Limited. The following table summarises the components of net expenses recognized in the profit and loss account and funded status and amounts recognized in the balance sheet, on the basis of actuarial valuation
(Rs. in crores)
March 31,
2011 March 31,
2010 Changes in the present value of the obligation
1 Opening balance of Present Value of Obligation
14.59 10.24
2 Interest Cost 1.11 0.77 3 Current Service Cost 3.97 2.25 4 Past Service Cost - - 5 Benefits Paid (1.81) (1.79) 6 Actuarial (gain) / loss on Obligation 1.81 3.12
7 Closing balance of Present Value of Obligation
19.67 14.59

37
Reconciliation of opening and closing balance of the fair value of the Plan Assets
1 Opening balance of Fair value of Plan Assets
14.67 10.97
2 Expected Return on Plan assets 1.38 1.04 3 Contributions 5.09 4.90 4 Benefits Paid (1.81) (1.79) 5 Actual Return on Plan Assets 0.56 (0.45) 6 Closing balance of Fair Value of Plan
Assets 19.89 14.67
Profit & Loss – Expenses 1 Current Service Cost 3.97 2.25 2 Interest Cost 1.11 0.77 3 Expected Return on Plan assets (1.38) (1.04) 4 Net Actuarial gain (loss) recognised in
the year 1.25 3.56
5
Expenses Recognised in the statement of Profit & Loss
4.95 5.54
Actuarial Assumptions 1 Discount Rate 8.00% 8.00% 2 Expected Rate of Return on Plan
Assets 8.00% -
9.30% 8.00%
3 Expected Rate of Salary Increase 4.50% - 6.00%
4.00% - 6.00%
Leave Encashment : The company provides benefits to its employees under the Leave Encashment pay plan, which is a non-contributory defined benefit plan. The employees of the company during the tenure of their employment are entitled to carry forward unutilized balance of Privilege Leave upto 180 days. Provision for Leave Encashment has been made in the accounts on the basis of actuarial valuation as at the balance sheet date.
(Rs. in crores)
Particulars March 31,
2011 March 31,
2010 1 Opening balance of Present Value of
Obligation (PVO) 10.96 7.97
2 Interest Cost 0.88 0.64
3 Service Cost 2.46 2.02
4 Benefits paid (2.23) (1.37)
5 Actuarial (gain) / loss on Obligation 0.75 1.70
6 Closing balance of Present Value of Obligation
12.82 10.96

38
Balance Sheet Statement 1 Present Value of Obligation as at
31.03.11 12.82 10.96
2 Un-funded Liability as at 31.03.11 12.82 10.96
3 Un-funded Liability recognised in Balance Sheet
12.82 10.96
Profit & Loss Account
1 Interest Cost 0.88 0.64
2 Service Cost 2.46 2.02
3 Gain (loss) recognised in the year 0.75 1.70
4 Net Gain / Loss 4.09 4.36
Actuarial Assumptions
1 Discount Rate 8.00% 8.00%
2 Expected Rate of Salary Increase 4.00% 4.00%
11.3 Segment Reporting (AS-17): The Bank operates in four business segments, viz. Treasury, Corporate/
Wholesale Banking, Retail Banking and Other Banking Operations. There are no significant residual operations carried by the Bank. Summary: Part A: Business Segments
(Rs. in crores)
Business Segment
Treasury Corporate/ Wholesale Banking
Retail Banking Other Banking Operation
Total
Particulars 31/03/11 31/03/10 31/03/11 31/03/10 31/03/11 31/03/10 31/03/11 31/03/10 31/03/11 31/03/10 Revenue 945.39 773.01 1560.00 1198.05 2360.13 1681.91 (1.00) 19.52 4864.52 3672.49 Inter-Segment Revenue (561.50) (412.02) Total Income 4303.02 3260.47 Result 162.62 92.08 291.31 211.45 688.58 440.49 (0.29) 5.16 1142.22 749.18 Unallocated Expenses 60.55
45.29
Operating Profit 1081.67 703.89 Income Taxes and Other Provisions 504.35 353.58 Extraordinary profit/ loss 0.00 0.00 Net Profit 577.32 350.31 Other Information:

39
Segment Assets 16839.75 12450.64 9802.00 9041.93 17954.90 12999.78 0.00 0.00 44596.65 34492.35 Unallocated Assets 1039.19 877.17 Total Assets 45635.84 35369.52 Segment Liabilities 5620.66 4997.85 20190.85 14291.89 14790.48 12979.94 0.00 0.00 40601.99 32269.68 Unallocated Liabilities 5033.85 3099.84 Total Liabilities 45635.84 35369.52
Geographic Segments: The business operations of the Bank are largely concentrated in India. Activities outside India are restricted to resource mobilization in the international markets. Since the Bank does not have material earnings emanating from foreign operations, the Bank is considered to operate only in domestic segment.
11.4 Related party transactions (AS-18): The following is the information on transactions with related parties: Key Management Personnel: Mr. Romesh Sobti, Managing Director Associates: IndusInd Information Technology Limited
IndusInd Marketing and Financial Services Private Limited IBL Services & Solutions Private Limited
Subsidiaries: ALF Insurance Services Private Limited
Summarized transactions with related parties for the year ended March 31, 2011:
(Rs. in crores)
Items / Related Party Subsidiaries* Associates/ Joint
ventures
Key Management personnel*
Relatives of key Management
Personnel
Total
Deposits - 2.93 (6.70)
- - 2.93 (6.70)
Advances - 9.32 (18.50)
- - 9.32 (18.50)
Investments - 0.60 (0.60)
- - 0.60 (0.60)
Interest Paid - 0.04 - - 0.04 Receiving of services - 64.21 - - 64.21 Other Liabilities (creditors for expenses, security deposits etc.)
- 3.10 - - 3.10
* As on March 31, 2011, there was only one related party in the said category; hence, in accordance RBI guidelines, there are no disclosure relating to the transactions with these related parties. Note: Figures in bracket represent maximum outstanding during the year.

40
Summarized transactions with related parties for the year ended March 31, 2010:
(Rs. in crores) Items / Related Party Subsidiaries* Associates/
Joint ventures
Key Management personnel*
Relatives of key Management
Personnel
Total
Deposits - 0.95 (4.07)
- - 0.95 (4.07)
Advances - 13.45 (13.45)
- - 13.45 (13.45)
Investments - 0.60 (0.60)
- - 0.60 (0.60)
Interest Paid - 0.06 - - 0.06 Receiving of services - 45.53 - - 45.53 Other Liabilities (creditors for expenses, security deposits etc.)
- 1.70 - - 1.70
* As on March 31, 2010, there was only one related party in the said category; hence, in accordance RBI guidelines, there are no disclosure relating to the transactions with these related parties.
Note: Figures in bracket represent maximum outstanding during the year.
11.5 The Bank does not have any non-cancelable operating leases during the year, where it is the lessee. The details of other operating leases where the Bank is the lessor, are as under :
Tranche– I (Rs. in crores) Particulars 2010-11 2009-10 Description of the asset Wind Turbine Generator–37 Nos. Gross carrying amount - 25.68 Accumulated depreciation - 9.51 Depreciation recognized during the current year
0.80 1.37
Contingent Rent recognized during the year
1.61 4.44
Minimum Lease Payments (MLP)
2010-11 : Nil 2009-10: MLP based on the actual consumption of electricity at the contracted rates by the lessee. Accordingly, future minimum lease payments are indeterminate.
Tranche – II (Rs. in crores) Particulars 2010-11 2009-10 Description of the asset Wind Turbine Generator – 88 Nos. Gross carrying amount - 72.45 Accumulated depreciation - 21.78 Depreciation recognized during the current year
2.23 3.82
Minimum Lease Payments (MLP) Not later than one year Later than one year and not
later than five years Later than five years
- -
-
12.00 12.25
-

41
The Wind Turbine Generators given on operating lease have been disposed off during the year, and hence, the gross carrying amount, accumulated depreciation and future minimum lease payments are Nil.
11.6 Earnings per share (AS 20):
The numerators and denominators used to calculate the earnings per share as per AS-20 are as under:
Year ended March 31,
2011
Year ended March 31,
2010 Net Profit as Reported (Rs. in crores) 577.32 350.31 Basic weighted average number of equity shares
43,87,64,163
38,88,10,470
Diluted weighted average number of equity shares
44,82,25,770 39,78,90,850
Nominal value of Equity Shares (Rs.) 10 10 Basic Earnings per Share (Rs.) 13.16 9.01 Diluted Earnings per Share (Rs.) (Reported) 12.88 8.80
11.7 Consolidated Financial Statements – Subsidiary(AS 21):
ALF Insurance Services Pvt. Ltd., subsidiary of the Bank, could not commence operations. Consequent to the resolution of Board of Directors, the process of winding up of the said company has since been initiated. Accordingly, no consolidated financial statements have been drawn up as per AS-21 “Consolidated Financial Statements”.
11.8 Taxation (AS 22):
(a). Provision for tax has been made after considering contingency provision as admissible deduction.
(b). Deferred Tax (AS-22): The major components of deferred tax assets/ liabilities, are as under:
(Rs. in crores) 31.03.2011
Deferred Tax 31.03.2010
Deferred Tax Timing difference on account of : Assets Liabilities Assets Liabilities Difference between book depreciation and depreciation under the Income Tax Act, 1961
7.96 30.83
Difference between Provisions for doubtful debts and advances and amount allowable under Section 36(1)(viia) of the Income Tax Act, 1961
95.04 75.51
Interest on securities 46.77 29.70 Others 7.57 8.40 Sub-total 102.61 54.73 83.91 60.53 Net closing balance carried to Balance Sheet (included in Sch. 11 – Others)
47.88 23.38

42
11.9 In the opinion of the Bank there is no impairment of its fixed Assets to any material extent as at March 31, 2010, requiring recognition in terms of Accounting Standard 28.
12. Additional Disclosures:
12.1 Provisions and Contingencies charged to Profit and Loss account for the year consist of: (Rs. in crores)
Particulars
Year ending March
31, 2011
Year ending March
31, 2010 Depreciation on Investments 7.62 (0.29) Provision for non-performing assets including bad debts written off net of write backs
161.24 131.28
Provision towards Standard Assets 22.90 21.00 Income Tax / Wealth Tax / Deferred Tax/ Fringe Benefit Tax
302.46 182.74
Others 10.13 18.85 Total 504.35 353.58
12.2 Disclosure of Complaints: A Customer Complaints:
No. Particulars 2010-11 2009-10 (a) No. of complaints pending at the
beginning of the year 272 60
(b) No. of complaints received during the year
15579 6846
(c) No. of complaints redressed during the year
15474 6634
(d) No. of complaints pending at the end of the year
377 272
B. Awards passed by the Banking Ombudsman :
No. Particulars 2010-11 2009-10 (a) No. of unimplemented Awards at the
beginning of the year Nil Nil
(b) No. of Awards passed by the Banking Ombudsmen during the year
1 Nil
(c) No. of Awards implemented during the year
1 Nil
(d) No. of unimplemented Awards at the end of the year
Nil Nil
(Compiled by management and relied by auditors)

43
12.3 Letters of Comfort Bank has not issued any letter of comfort during the year.
13. The Bank does not carry any floating provision in the books. 14. The Micro, Small and Medium Enterprises Development Act, 2006 that came into
force from October 2, 2006, provides for certain disclosures in respect of Micro, Small and Medium enterprises. There have been no reported cases of delays in payments to micro and small enterprises or interest payments due to delays in such payments
15. Previous year’s figures have been regrouped/ reclassified wherever necessary.

44
DISCLOSURES UNDER THE NEW CAPITAL ADEQUACY FRAMEWORK (BASEL II GUIDELINES)
I. Scope of Application IndusInd Bank Limited (‘the Bank’) is a commercial bank, which was incorporated on 31st January 1994. The Bank has only one subsidiary - Alfin Insurance Services Ltd. The financials of the subsidiary are not consolidated with the Bank’s financials as the said company could not commence business and CRAR is computed on the financial position of the Bank alone. The amount of capital held in this subsidiary is deducted from Capital funds, i.e. 50% Tier I and 50% Tier II. II. Capital Structure Equity Capital: The Bank has authorised share capital of Rs. 500.00 crores comprising 50,00,00,000 equity share of Rs. 10/- each. As on 31st March 2011, the Bank has issued, subscribed and paid-up capital of Rs. 465.97 crores, (including forfeited equity shares of Rs 0.19 crore), constituting 46,57,73,835 shares of Rs. 10/- each. The Bank’s shares are listed on the National Stock Exchange and the Bombay Stock Exchange. The GDRs issued by the Bank are listed on the Luxembourg Stock Exchange. During the year, Bank issued 5,00,00,000 equity shares of Rs 10/- each to Qualified Institutional Buyers through the Qualified Institutional Placement (QIP) route, at a premium of Rs. 224.55 per share. The provisions of the Companies Act, 1956, and other applicable laws and regulations govern the rights and obligations of the equity share capital of the Bank. Debt Capital Instruments: The Bank has been raising capital funds by means of issuance of Upper Tier II and Subordinated bonds. The details of Upper Tier II and Subordinated debt (Unsecured Redeemable Non-convertible Bonds), which are eligible as Tier II capital, are given below. Upper Tier II Capital: The aggregate value of Upper Tier II capital as on 31st
Sr. No.
March 2011 was Rs. 308.90 crores as per the table below:
Date of Allotment
Amount (Rs. in crs.)
Coupon (%)
Redemption Date
1. 31.03.2006 100.00 Payable semi-annually @ 9.60% p.a for first 10 years and @ 10% p.a. from 11th year till redemption
30.03.2021
2. 30.09.2006 80.20 Payable semi-annually @ 10.25% p.a for first 10 years and @ 10.75% p.a. from 11th year till redemption
30.09.2021
3 23.12.2006 128.70 Payable semi-annually @ 9.75% p.a for first 10 years and @ 10.25% p.a. from 11th year till redemption
23.12.2021
Total 308.90 The entire amount of Rs. 308.90 crores is eligible as Tier II capital.

45
Subordinated Debt As on 31st
Sr. No.
March 2011, the Bank had an outstanding subordinated debt (Unsecured Redeemable Non-convertible Bonds) aggregating Rs. 860.10 crores. The details are stated below:
Date of Placement
Amount (Rs. in crores)
Coupon (%)
Redemption Date
1. 30.06.2004 50.00 @7.00% p.a. payable annually 30.04.2014 2. 31.03.2005 75.10 @8.50% p.a. payable annually 30.06.2014 3. 30.12.2005 115.00 @8.40% p.a. payable annually 30.05.2015 4. 30.03.2007 50.00 @10% p.a. payable semi-annually 30.06.2012 5. 29.09.2007 50.00 @10.35% p.a. payable semi-annually 29.04.2013 6. 31.03.2009 100.00 @10.50% p.a. payable annually 30.06.2014 7. 31.03.2010 420.00 @ 9.50% p. a payable annually 30.06.2015 Total 860.10
Of this, Rs.593.06 crores qualified as Tier II capital. Composition of the Capital – Tier I and Tier II as on March 31, 2011 Rs. in crores Tier I Capital Paid up Share Capital 465.97 Reserves 3,356.52 Innovative Instruments - Other Capital Instrument - Gross Tier I Capital 3,822.49 Deductions 48.43 Investments in Subsidiaries and Associates 0.55 Credit enhancements under Securitisation - Deferred Tax Assets 47.88 Net Tier I Capital 3,774.06 Tier II Capital Upper Tier II Bonds 308.90 Sub-ordinated debts (eligible) 593.06 General Provisions / IRA and Revaluation Reserves 206.80 Gross Tier II Capital 1,108.76 Deductions 0.55 Investments in Subsidiaries and Associates 0.55 Credit enhancements under Securitisation - Net Tier II Capital 1,108.21 Total eligible capital 4,882.27 Debt Capital instruments eligible for inclusion in Upper Tier II Capital
Total amount outstanding 308.90 Of which amount raised during the current year NIL Amount eligible to be reckoned as Capital funds 308.90 Subordinated debt eligible for inclusion in Lower Tier 2 Capital Total amount outstanding 860.10 Of which amount raised during the current year NIL Amount eligible to be reckoned as Capital funds 593.06 Tier I Capital Funds 3774.06 Tier II Capital Funds 1108.21 Total Eligible Capital Funds 4882.27

46
III. Capital Adequacy The capital adequacy of the Bank is computed and monitored as per the norms stipulated by Reserve Bank of India (RBI) vide its circular no, DBOD.No.BP.BC.15 / 21.06.001 / 2010-11 dated July 01, 2010. This circular prescribes the risk weights for the balance sheet assets, non-funded items and other off-balance sheet exposures and the minimum capital funds to be maintained as ratio to the aggregate of the risk weighted assets and other exposures, as also, capital requirements in the trading book, on an ongoing basis and operational risk. The Basel II approach is risk sensitive wherein the capital is required to be maintained in relation to risk assumed. The Basel II norms requires holding of capital for Credit, Market and Operational risk. These guidelines also covers instructions regarding the components of capital and capital charge required to be provided for by the banks for credit and market risks. It deals with providing explicit capital charge for credit and market risk and addresses the issues involved in computing capital charges for interest rate related instruments in the trading book, equities in the trading book and foreign exchange risk (including gold and other precious metals) in both trading and banking books. Trading book for the purpose of these guidelines includes securities included under the Held for Trading category, securities included under the Available For Sale category, open gold position limits, open foreign exchange position limits, trading positions in derivatives, and derivatives entered into for hedging trading book exposures. As per the said guidelines, the Bank is required to maintain CRAR at a minimum level of 9%, of which Tier I CRAR should be atleast 6%. The minimum capital is subject to prudential floor which is higher of (i) minimum capital required to be maintained as per Basel II, (ii) 100%, 90% and 80% of the minimum capital required for Credit and Market risk under Basel I over the years March 2009, March 2010 and March 2011, respectively. Besides computing CRAR under the Pillar I requirement, the Bank also periodically undertakes stress testing in various risk areas to assess the impact of stressed scenario or plausible events on asset quality, liquidity, interest rate and forex on its profitability and capital adequacy. The assessment of future capital needs is effectively done based on the business projections, asset mix, dynamic operating environment, growth outlook, new business avenues and risk and return profile of the business segments. The future capital requirement is assessed by taking cognizance of all the risk elements viz. Credit, Market and Operational risk and mapping these to the respective business segments. The Summary of Capital requirements for Credit Risk, Market Risk and Operational Risk as on March 31, 2011, is mentioned below: Risk Type Rs. in crores Capital requirements for Credit Risk 2476. 29 Portfolio Subject to Standardised approach 2476. 29 Securitisation exposures - Capital requirements for Market Risk Standardised Duration Approach 71.44 Interest Rate Risk 61.22 Foreign Exchange Risk (including gold) 9.00 Equity Risk 1.22

47
Capital requirements for Operational Risk 216.71 Basic Indicator Approach 216.71 Total Capital requirements at 9% 2764.44 Total Capital Funds 4882.27 CRAR 15.89%
Under Basel II, Bank’s CRAR works out to be 15.89% as on March 31, 2011, which is higher by 1.50% as compared to 14.39% under Basel I. Integrated Risk Management: Objectives and Organisation Structure The Bank has established an Enterprise-wide Risk Management Department responsible for Bank-wide risk management covering Credit risk, Market risk (including ALM) and Operational risk, independent of the Business segments. The Risk Management Department focuses on identification, measurement, monitoring and controlling of risks across various segments. The Bank has been progressively adopting the best International practices so as to continually reinforce its Risk Management functions. Organisation Structure: The set up of Risk Management Department is hereunder: Separate Committees, as specified below, are set up to manage and control various risks:
• Risk Management Committee (RMC) • Credit Risk Management Committee (CRMC) • Market Risk Management Committee (MRMC) • Asset Liability Management Committee (ALCO) • Operational Risk Management Committee (ORMC)
Bank has articulated various risk policies which specify the risks, controls and measurement techniques. The policies are framed keeping risk appetite as the central objective. Against this background, the Bank identifies a number of key risk components. For each of these components, the Bank determines a target that represents the Bank’s perception of the component in question.
Managing Director
Chief Risk Officer
Head – Risk Mgmt
Credit Risk Management
Market Risk Management
Operational Risk Management
Asset Liability Management

48
The risk policies are vetted by the sub-committees, viz. CRMC, MRMC, etc. and are put forth to RMC, which is a sub-committee of the Board. Upon vetting of the policies by RMC, the same is placed for the approval of the Board and implemented. Bank has put in place a comprehensive policy on ICAAP, which presents a holistic view of the material risks faced, control environment, risk management processes, risk measurement techniques, capital adequacy and capital planning.
Policies are periodically reviewed and revised to address the changes in the economy / banking sector and Bank’s risk profile. Monitoring of various risks is undertaken at periodic intervals and a report is submitted to Top Management / Board. Credit Risk The Bank manages credit risk comprehensively; both at Transaction level and at Portfolio level. Some of the major initiatives taken are listed below :
• Bank uses a robust Risk rating framework for evaluating credit risk of the borrowers. The Bank uses segment-specific rating models which are equipped with transition matrix capabilities.
• Risks on various counter-parties such as corporates, banks, are monitored through counter-party exposure limits, governed by country risk exposure limits also in case of international trades.
• The Bank manages risk at the portfolio level too, with portfolio level prudential exposure limits to mitigate concentration risk.
• The Bank has a well-diversified portfolio across various industries and segments, as illustrated by the following data. o Retail and schematic exposures (which provide wider diversification benefits)
account for as much as 51 % of the total fund-based advances. o The Bank’s corporate exposure is fully diversified over 85 industries, thus insulated
from individual industry cycles. The above initiatives support qualitative business growth while managing inherent risks within the risk appetite. Market risk Key sources of Market risk are Liquidity Risk, Interest Rate Risk, Price Risk and Foreign Exchange Risk. The Bank has implemented a state-of-the-art Treasury system which supports robust risk management capabilities and facilitates Straight-through Processing. Market Risk is effectively managed through comprehensive policy framework which provides various tools such as Mark-to-Market, Duration analysis, Value-at-Risk, besides through operational limits such as stop-loss limits, exposure limits, deal-size limits, maturity ladder, etc.

49
Asset Liability Management (ALM) The Bank’s ALM system supports effective management of liquidity risk and interest rate risk, covering 100% of its assets and liabilities.
• Liquidity Risk is monitored through Structural Liquidity Gaps, Dynamic Liquidity position, Liquidity Ratios analysis and Behavioral analysis, with prudential limits for negative gaps in various time buckets.
• Interest Rate Sensitivity is monitored through prudential limits for Rate Sensitive Gaps and other risk parameters.
• Interest Rate Risk on the Investment portfolio is monitored through Modified Duration on a daily basis. Optimum risk is assumed through duration, to balance between risk containment and profit generation from market movements.
ALCO meetings were convened frequently during the financial year, wherein analytical presentations were made providing detailed analysis of liquidity position, interest rate risks, product mix, business growth v/s budgets, interest rate outlook, which helped to review the business strategies regularly and undertake new initiatives. The interest rate outlook projected in ALCO meetings have largely been in line with the actual interest rate trend taking place. Operational risk Operational risk is managed by addressing People risk, Process risk, Systems risk as well as risks arising out of external environment. The Bank has efficient audit mechanism, involving periodical on-site audit, concurrent audits, on the spot and off-site surveillance enabled by the Bank’s advanced technology and Core Banking System. The Bank has initiated the process of putting in place Operational Risk Management Framework, using sophisticated tools, such as: Key Risks Indicators Score Cards Risk Events Loss Data (Basel 8*7 matrix approach) Near Miss Events Risk and Control Self Assessment (RSCA)
The framework would help in mitigation of operational risks and optimization of capital requirement towards operational risks under Basel II norms.

50
Systems Risk As part of Systems-related Operational Risk Management initiatives, the Bank has achieved the following : The Bank has formulated and implemented a comprehensive Business Continuity Plan
(BCP) to ensure continuity of its critical business functions and extension of banking services to its customers.
The Bank has established an effective Disaster Recovery site at a distant location, with on-line, real-time replication of data, both in Mumbai and Chennai.
Comprehensive IT security framework has been put in place to ensure complete data security and integrity.
The Bank has housed its data center in a professionally managed environment, with sophisticated and fool-proof security features and assured supply of utilities.
The robust Risk Management framework created in the Bank supports rapid and qualitative growth with optimization of risks and maximization of shareholder value. IV. Credit Risk Exposures
“Credit Risk” is defined as the probability / potential that the borrower or counter-party may fail to meet its obligations in accordance with agreed terms. It involves inability or unwillingness of a borrower or counter-party to meet commitments in relation to lending, trading, hedging, settlement and other financial transactions. Credit Risk is made up of two components: 1. Transaction Risk (or Default Risk), which represents the risk arising from individual credit
exposures and 2. Portfolio Risk, which represents the risk inherent in the portfolio of credit assets
(concentration of assets, correlation among portfolios, etc.). Credit risk is found in a variety of transactions across the Bank’s portfolio including not only loans, off balance sheet exposures, investments and financial guarantees, but also the risk of a counterparty in a derivative transaction becoming unable to meet its obligations. Credit risk constitutes the largest risk to which the Bank is exposed. The Bank has adequate system support which facilitates credit risk management and measurement across its portfolio. The system support is strengthened and expanded as and when new exposures are added to the Bank’s portfolio. The Bank has articulated comprehensive guidelines for managing credit risk as outlined in Credit Policy, Credit Risk Policy and related Policies framework, Bank Risk Policy, Country Risk Policy, Loan Review Policy and Recovery Policy. The credit risk management systems used at the Bank have been implemented in accordance with these guidelines and best market practices. The credit risk management process focuses on both specific transactions and on groups of specific exposures as portfolios. The Bank’s credit risk policy and related policies and systems focus are framed to achieve the following key objectives: Monitoring concentration risk in particular products, segments, geographies etc thereby
avoiding concentration risk from excessive exposures to any particular products, segments, geographies etc.

51
Assisting in building quality credit portfolio and balancing risks and returns in line with
Bank’s risk appetite Tracking Credit quality migration Determining how much capital to hold against each class of the assets Undertaking Stress testing to evaluate the credit portfolio strength To develop a greater ability to recognize and avoid potential problems Alignment of Risk Strategy with Business Strategy Adherence to regulatory guidelines
Credit Risk Management at specific transaction level The central objective for managing credit risk at each transaction level is development of evaluation and monitoring system that covers the entire life cycle of the exposure, i.e. opportunity for transaction, assessing the credit risk, granting of credit, disbursement and subsequent monitoring, identifying the obligors with emerging credit problems, remedial action in event of credit quality deterioration and repayment or termination of the obligation. The Credit Policy of the Bank stipulates for applicability of various norms for managing credit risk at a specific transaction level and more relevant to the target segment of the obligors. The Credit Policy covers all the types of obligors, viz. Corporate, SME, Trader and Schematic Loans such as Home Loan, Personal Loan, etc. The major components of Credit Policy are mentioned below: The transaction with the customer/ prospective customer is undertaken with an aim to
build long term relationship. All the related internal and regulatory guidelines such as KYC norms, RBI prudential
norms, etc. are adhered to while assessing the credit request of the borrower. The credit is granted with due diligence and detail insight into the customer’s
circumstances and of specific assessments that provide a context for such credits. The facility is granted based on the customer’s creditworthiness, capital base or assets to
assure that the customer is able to substantiate the repayment. Due regard is also placed to the industry in which the customer is operating, the business specific risks and management capability and their risk appetite.
Regular follow-up in the overall health of the borrower is undertaken to assess whether the basis of granting credit has changed.
When loans and credits are granted to borrowers falling outside preferred credit rating, the Bank normally considers sufficient collateral. However, collaterals are not the sole criteria for lending, which is generally done based on assessing the adequacy of the cash flows.
The Bank has defined exposures limit on the basis of internal risk rating of the borrower. The Bank is particularly cautious when granting credits to businesses in affected or
seasonal industries. In terms of Bank’s country risk management, due caution is exercised when assuming
risk in countries with an unstable economic or political scenario. Beside the acceptability norms defined in the Credit Policy for an individual transaction, Bank has also implemented various credit related product programmes, for its Business Banking unit, which provides for criteria and framework from origination to termination/ repayment of loan obligations. The customers under this segment are evaluated using a scoring model developed based on the segment specific risk profile.
52
Credit Approval Committee The Bank has put in place the principle of ‘Committee’ or ‘Approval Grids’ approach while according sanctions to the credit proposals. This provides for an unbiased, objective assessment/evaluation of credit proposals. Such Committees include atleast one official from an independent department, which has no volume or profits targets to achieve. The official of the independent department is a compulsory member of the Credit Committee and a dissent by such member cannot be overridden by others. The spirit of the credit approving system is that no credit proposals are approved or recommended to higher authorities unless all the members of the ‘Committee’ or ‘Approval Grids’ agree on the acceptability of the proposal in all respects. In case of disagreement the proposal is referred to next higher Committee whose decision to approve or decline with conditions is then final. The following ‘Approval Grids’ are constituted: Corporate & Commercial Banking Segment
Branch Credit Committee (BCC) Zonal Credit Committee (ZCC) Corporate Office Credit Committee (COCC) – I Corporate Office Credit Committee (COCC) – II Executive Credit Committee (ECC)
Consumer Banking (CB) Segment :
The scheme of delegation under Consumer Banking Segment includes Vehicle financing, personal loans, housing loans and other schematic loans under multi-tier Committee based approach as under:
Branch Credit Committee – Consumer Banking (BCC – CB) Regional Credit Committee – Consumer Banking (RCC-CB) Corporate Office Credit Committee – Consumer Banking (COCC- CB I & II) Executive Credit Committee
The credit proposals which are beyond the delegated powers of ECC are placed to Committee of Directors (COD) or Board of Directors (BOD) for approval.
Risk Classification The Bank monitors the overall health of its customers on an on-going basis to ensure that any weakening of a customer’s earnings or liquidity is detected as early as possible. As part of the credit process, customers are classified according to the credit quality in terms of internal rating, and the classification is regularly updated on receipt of new information/ changes in the factors affecting the position of the customer. The Bank has operationalised the following risk rating/ scoring models depending on the target segment of the borrower:
• Large Corporate, Small & Medium Enterprises, NBFC, Business Banking • Trading entities, Capital Market Broker and Commodity Exchange Broker • Financial Institutions/Primary Dealers and Banks • Retail customers (Schematic Loans) – which are assigned credit scoring

53
Rating grades in each rating model, other than the segments driven by product programmes, is on a scale of 1 to 8, which are further categorised by assigning +/- modifiers to reflect the relative standing of the borrower within the specific risk grade. The model-specific rating grades are named distinctly. Each model-specific rating grade reflects the relative ratings of the borrowers under that particular segment. For instance, L4 indicates a superior risk profile of a Large Corporate, when compared to another Large Corporate rated L5. In order to have a common risk yardstick across the Bank, these model specific ratings are mapped to common scale ratings which facilitate measurement of risk profile of different segments of borrower by means of common risk ladder. The various purposes for which the rating/scoring models are used are mentioned hereunder: Risk based pricing i.e. higher premium for higher risk Capital allocation (under Basel II – IRB approaches) Portfolio Management Efficiency in lending decision To assess the quality of the borrower – single point reference of credit risk of the borrower Minimum rating norms for assuming exposures Prudential ceiling for single borrower exposures – linked to rating Frequency of review of exposures. Frequency of internal auditing of exposures To measure the portfolio quality Target for quality of advances portfolio is monitored by way of Weighted Average Credit
Rating (WACR).
Credit Quality Assurance: Bank has also adopted Loan Review Mechanism (LRM), which involves independent assessment of the quality of an advance, effectiveness of loan administration, compliance with internal policies of bank and regulatory framework and portfolio quality. It also helps in tracking weaknesses developing in the account for initiating corrective measures in time. LRM is carried out by Credit Quality Assurance team, which is independent of Credit and Business functions. Credit Risk Management at Portfolio level: The accumulation of individual exposures leads to portfolio, which creates the possibility of concentration risk. The concentration risk, ideally on account of borrowers/ products with similar risk profile, may arise in various forms such as Single Borrower, Group of Borrowers, Sensitive Sector, Industry–wise Exposure, Unsecured Exposure, Rating wise Exposure, Off Balance sheet Exposure, Product wise Exposure, etc. The credit risk concentration is addressed by means of structural and prudential limits stipulated in the Credit Risk Policy and other related policies. Concentration risk on account of exposures to counter-parties (both single borrower and group of borrowers), Industry-wise, Rating-wise, Product-wise, etc., is being monitored by Risk Management Dept (RMD). For this purpose, exposures in all business units, viz. branches, treasury, investment banking, etc., by way of all instruments (loans, equity/debt investments, derivative exposures, etc.) are being considered. Such monitoring is carried out at monthly intervals. Besides, respective business units are monitoring the exposure on continuous real-time basis.

54
The concentration risk is further evaluated in terms of statistical measures and benchmarks. Detail analysis of portfolio risk and control measures in place is carried out on a quarterly basis on various parameters. Direction of risks and controls (decreasing, stable, and increasing) and resultant net risk is also done. Further, a comprehensive Stress Testing framework based on several factors and risk drivers assessing the impact of stressed scenario on Credit quality, its impact on Bank’s profitability and capital adequacy, is placed to Top Management /Board every quarter. The framework highlights the Bank’s credit portfolio under 3 different levels of intensity across default, i.e. mild, medium and severe, and analyses its impact on the portfolio quality and solvency level. Impaired credit - Non Performing Assets (NPAs): The Bank has an independent Credit Administration Department that constantly monitors accounts for irregularities, identifies accounts for early warning signals for potential problems and identifies individual NPA accounts systematically. The guidelines as laid down by RBI Master Circular No. DBOD.No.BP.BC.21/21.04.048/2010-11 dated July 1, 2010, on Asset classification, Income Recognition and Provisioning to Advances portfolio are followed while classifying Non-performing Assets (NPAs). The guidelines are as under:
a) An asset, including a leased asset, becomes non-performing when it ceases to generate income for the bank
b) A non performing asset (NPA) is a loan or an advance where; i. interest and / or installment of principal remains overdue for a period of more than 90
days in respect of a term loan, ii. the account remains 'out of order', in respect of an Overdraft / Cash Credit (OD/ CC), iii. the bill remains overdue for a period of more than 90 days in the case of bills
purchased and discounted, iv. the installment of principal or interest thereon remains overdue for two crop seasons
for short duration crops, v. the installment of principal or interest thereon remains overdue for one crop season
for long duration crops, vi. the amount of liquidity facility remains outstanding for more than 90 days, in respect
of a securitisation transaction undertaken in terms of RBI guidelines on Securitisation dated February 1, 2006.
vii. in respect of derivative transactions, the overdue receivables representing positive mark-to-market value of a derivative contract, if these remain unpaid for a period of 90 days from the specified due date for payment.
Out of Order status: An account should be treated as 'out of order' if the outstanding balance remains continuously in excess of the sanctioned limit / drawing power. In cases where the outstanding balance in the principal operating account is less than the sanctioned limit / drawing power, but there are no credits continuously for 90 days as on the date of Balance Sheet or credits are not enough to cover the interest debited during the same period, these accounts should be treated as 'out of order'. Overdue: Any amount due to the bank under any credit facility is 'overdue' if it is not paid on the due date fixed by the bank.

55
Credit Risk Exposures (a) Total Gross Credit Risk Exposures
Rs. in crores Fund Based* 41532 Non Fund Based** 16705 Total Exposures 58237
* Includes all exposures such as Cash Credit, Overdrafts, Term Loan, Cash, SLR securities etc., which are held in banking book.
** Off-Balance items such as Letter of Credit, Bank Guarantee and credit exposure equivalent of Inter-bank forwards, merchant forward contracts and derivatives, etc.
(b) Geographical Distribution of Exposures (Rs. in crores)
Domestic Overseas Fund Based 41532 Nil Non Fund Based 16705 Nil Total Exposures 58237 Nil
(c) Industry-Wise Distribution of Exposures (Rs. in crores)
Industry Name FB NFB Construction Project Construction 18 381 Other Infrastructure 1 338 Contract Construction 706 196 Real Estate Real Estate Developers 436 47 Lease Rental Discounting - Real Estate 310 0 Housing Finance Companies 371 3 Loans against Property 94 1 Real estate - Residential 34 0 Real Estate-Commercial Const 1 0 Steel Steel-Long Products 8 132 Steel Flats-CR,GP/GC 174 91 Steel Flats- HR 25 0 Steel - Alloy 32 20 Sponge Iron 15 18 Stainless Steel 19 0 Iron and Steel Rolling Mills 2 10 Textiles Textiles - Readymade Garments 173 21 Textiles - Cotton fabrics 81 14 Textiles -Cotton fibre / yarn 43 1 Textiles - Synthetic Fabrics 7 0 Textile Machinery 0 5 Cotton ginning, Cleaning, Baling 0 0 Textile - Jute 1 7
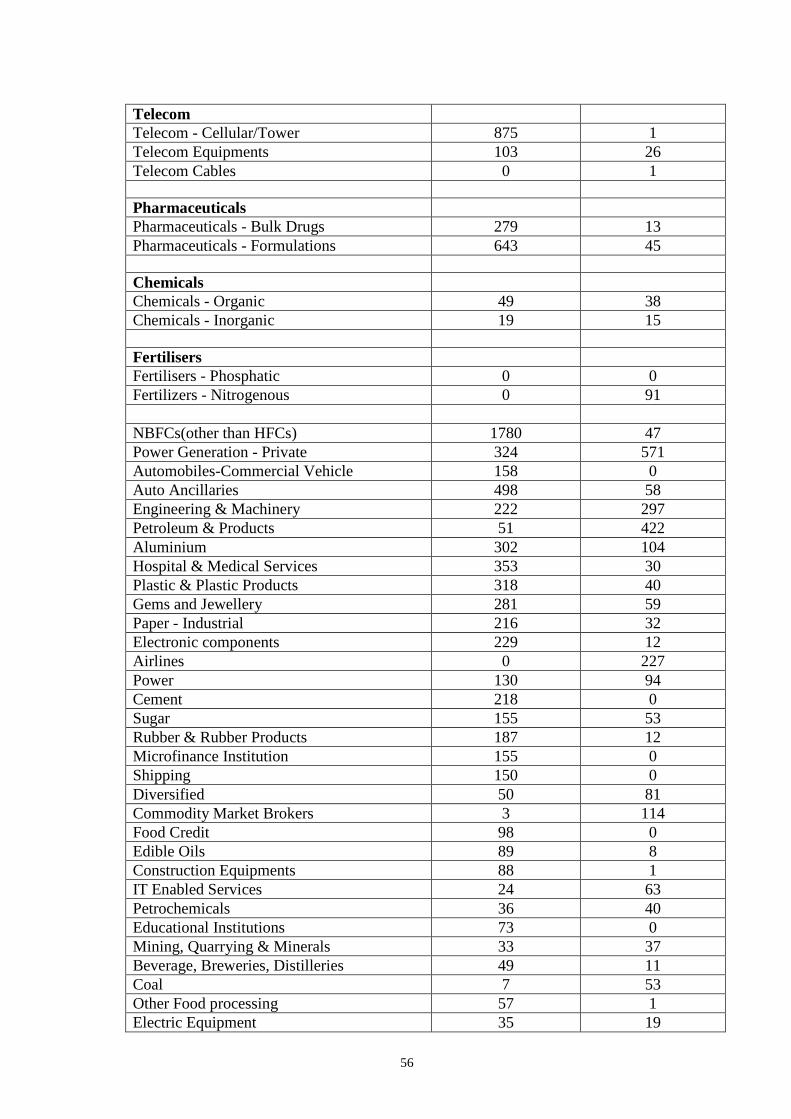
56
Telecom Telecom - Cellular/Tower 875 1 Telecom Equipments 103 26 Telecom Cables 0 1
Pharmaceuticals Pharmaceuticals - Bulk Drugs 279 13 Pharmaceuticals - Formulations 643 45
Chemicals Chemicals - Organic 49 38 Chemicals - Inorganic 19 15
Fertilisers Fertilisers - Phosphatic 0 0 Fertilizers - Nitrogenous 0 91 NBFCs(other than HFCs) 1780 47 Power Generation - Private 324 571 Automobiles-Commercial Vehicle 158 0 Auto Ancillaries 498 58 Engineering & Machinery 222 297 Petroleum & Products 51 422 Aluminium 302 104 Hospital & Medical Services 353 30 Plastic & Plastic Products 318 40 Gems and Jewellery 281 59 Paper - Industrial 216 32 Electronic components 229 12 Airlines 0 227 Power 130 94 Cement 218 0 Sugar 155 53 Rubber & Rubber Products 187 12 Microfinance Institution 155 0 Shipping 150 0 Diversified 50 81 Commodity Market Brokers 3 114 Food Credit 98 0 Edible Oils 89 8 Construction Equipments 88 1 IT Enabled Services 24 63 Petrochemicals 36 40 Educational Institutions 73 0 Mining, Quarrying & Minerals 33 37 Beverage, Breweries, Distilleries 49 11 Coal 7 53 Other Food processing 57 1 Electric Equipment 35 19

57
Power Cables 50 0 Automobiles-2/3 wheelers 50 0 Paper Newsprint 50 0 Paper - Writing and Printing 39 5 Hotels & Tourism 31 13 Wood and Wood Product 40 3 Tea 41 0 Glass & Glass Products 33 1 Casting & Forgings 32 0 Leather & leather Products 27 5 Media, Entertainment & Advt 20 10 Tyres 4 25 Computers - Hardware 23 4 Textiles-Texturising 24 0 Transport Services 11 12 Organised Retailing 23 0 Retail Chains 21 0 Electrical fittings 0 19 Textiles - Manmade fibres / yarn 1 17 Fast Moving Consumer Goods 14 0 Consumer Finance Division 11612 0 Other Industries 3132 8591 Residual Assets 15366 3999 Total Exposure 41532 16705
(d) Residual Contractual Maturity break down of assets (Rs. in crores)
Next Day 2 days to 7 days
8 Days to 14 Days
15 to 28 Days
29 days to 3
months
Over 3 months
to 6 months
Over 6 months
to 1 year
Over 1 year to 3
years
Over 3 years to 5
years
Over 5 years Total
Cash 207.04 - 207.04
Balances with RBI 44.98 112.45 67.47 67.47 607.23 382.33 967.07 2,249.00
Balances with other Banks 1200.45 24.58 62.59 99.22 173.73 7.99 1568.56
Investments 750.32 - - 253.66 880.56 1,058.62 491.51 1,363.34 8,752.80 13,550.81
Advances (Excl NPAs) 461.34 870.87 341.77 1,376.28 4,323.50 2,448.60 4,549.77 9,907.60 1,353.46 532.46 26,165.65
Fixed Assets 596.46 596.46
Other Assets 118.13 6.05 7.06 14.12 79.68 107.92 33.10 162.53 769.73 1,298.32

58
(e) Movement of NPAs and Provision for NPAs as on 31.03.11 Rs in crores
A Amount of NPAs (Gross) 265.86 Sub-standard 103.35 Doubtful 1 70.57 Doubtful 2 67.99 Doubtful 3 22.55 Loss 1.40
B Net NPAs 72.82 C NPA ratios Gross NPA to Gross advances (%) 1.01% Net NPA to Net advances (%) 0.28% D Movement of NPAs (Gross)
Opening Balance as on 01.04.10 255.47 Additions during the year 190.38 Reductions during the year 179.99 Closing Balance as on 31.03.11 265.86
E Movement of provision for NPAs Opening as on 01.04.10 153.64 Provision made in 2010-11 172.42 Write off / Write back of excess provisions 133.02 Closing as on 31.03.11 193.04
(f) Non Performing Investments and Movement of provision for depreciation on Non
Performing Investments (Rs. in crores)
A Amount of Non-Performing Investments 1.78 B Amount of provision held for non-performing investments 1.78 C Movement of provision for depreciation on investments Opening as on 01.04.10 3.84 Add: Provision made in 2010-11 9.00 Less: Write-off/ write-back of excess provision (1.38) Closing Balance as on 31.3.11 11.46
V. Credit risk: Disclosures for portfolios under the standardised approach As per the Basel II guidelines on Standardised approach, the risk weight on the certain categories of domestic counter parties is determined based on the external rating assigned by any one of the accredited rating agencies, i.e. CRISIL, ICRA, CARE and Fitch. For Foreign counterparties and banks, rating assigned by S&P, Moody’s and Fitch are used.
The Bank computes risk weight on the basis of external rating assigned, both Long Term and Short Term, for the facilities availed by the borrower. The external ratings assigned are

59
generally facility specific. The Bank follow below mentioned procedures as laid down in the Basel II guidelines for usage of external ratings:
• Ratings assigned by one rating agency are used for all the types of claims on the borrowing entity.
• Long term ratings are used for facilities with contractual maturity of one year & above. Short term ratings are applied for facilities with contractual maturity of less than one year.
• If either the short term or long term ratings attracts 150% risk weight on any of the claims on the borrower, the Bank assigns uniform risk weight of 150% on all the unrated claims, both short term and long term unless the exposure is subjected to credit risk mitigation.
• In case of multiple ratings, if there are two ratings assigned to the facility that maps to different risk weights, the rating that maps to higher risk weight is used. In case of three or more ratings, the ratings corresponding to the two lowest risk weights is referred to and the higher of those two risk weights is be applied. i.e., the second lowest risk weight.
• For securitised transactions, SO ratings assigned by the rating agency are applied for arriving at the risk weights.
Presently, the Bank does not assign any risk weight on the basis of proxy ratings.
Risk Weight-wise distribution of Gross Credit Exposures
Category Rs. in crores Below 100% Risk Weights 36840 100% Risk Weights 19261 More than 100% Risk Weights 2136 Deducted - Investments in subsidiaries (1.10)
VI. Credit risk mitigation: Disclosures for standardised approach The Bank mitigates credit exposure with eligible collaterals and guarantees to reduce the credit risk of obligors as stipulated under Basel II. In principle with mitigating credit risk, Bank has put in place a comprehensive policy on Credit Risk Mitigants and Collaterals for recognizing the eligible collaterals and guarantors for netting the exposures and reducing the credit risk of obligors. Basic procedures and descriptions of controls as well as types of standard collateral, guarantees necessary in granting credit, evaluation methods for different types of credit and collateral, applicable “haircuts” to collateral and revaluation of collateral are stipulated in the Bank’s credit policy and credit risk mitigant policy. The Bank uses net exposure for capital calculations after taking cognizance of on balance sheet/ off balance sheet netting as applicable for the category of eligible collaterals and guarantees. On Balance sheet netting is applied for facilities covered by deposits and after meeting the criteria as laid down under Basel II norms. All collaterals and guarantees are recorded and the details are linked to individual accounts. Perfection of security interest, date, currency and correlation between collateral and counterparty are also considered.
As lending is subject to default risk, Bank accepts collateral securities to minimize the impact of loss and consequently reducing the credit risk. The type of collaterals is determined based on the nature of facility, product type, counter party risk and its credit quality. However, as explained earlier, collateral is not the sole criteria for granting credit. For Corporate and SME clients, working capital facility is generally secured by charge on current assets and Term loan is secured by charge on fixed assets. In case of project financing, Bank stipulates for escrow of

60
receivables/project cash flows along with the charge on underlying project assets. The credit risk policy clearly defines the type of secondary securities and minimum percentage of it to the total exposures to be obtained in case of credit granted to obligors falling outside the preferred rating grade. Credit facilities are also granted against the security of assets such as as cash deposits, KVP, NSC, IVP, guarantee, mortgages, pledge of shares and commodities, bank guarantees, accepted bills of exchange, assignment of receivables etc. The credit facilities are secured by secondary collaterals such as cash deposits, KVP, NSC, IVP, guarantee, mortgages, etc. Bank also grants unsecured credit to the borrowers with high standing and low credit risk profile. For Business Banking clients, which are driven by product programmes and templated scoring models, the facilities are ordinarily secured by adequate collaterals. The programmes have a robust mechanism for collateral acceptance, valuation and monitoring. In case of schematic products such as Home Loan, Auto Loan, etc., Loan to value ratio, margin and valuation/revaluation of collaterals is defined in the respective product programme. The valuation is generally carried out by the empanelled valuer of the Bank. Bank has also put in place approved product paper on loan against warehouse receipts, shares and other securities. The margin, valuation and revaluation of the assets are specified in the product note. The credit approving authorities decides on the type and amount of collaterals for each type of facility on a case-to-case basis. For schematic loans and facilities offered under product programme, securities are obtained as defined in the product notes. Eligible financial asset collateral and guarantor For the purpose of credit risk mitigation, i.e. offsetting the amount of collateral/ basket of collaterals against the individual/ pool of exposures to which the collaterals are assigned, financial asset collateral types are defined by the Bank as per the New Capital Adequacy Framework to include Fixed deposits, KVP, IVP, NSC, Life Insurance Policies, Gold, Securities issued by Central and State Governments and units of Mutual Fund. On a similar note, the eligible guarantors are classified into the following categories: Sovereigns, Sovereign entities, Banks and Primary Dealers with lower risk weights than
the counterparty Other entities rated AA(-) or better including guarantee cover provided by parent,
subsidiary and affiliate companies when they have lower risk weight than the obligor. Rs. in crores
Particulars On/off balance sheet netting
Supported by guarantee
Exposure before applying eligible mitigants 7308 98 Exposure after applying eligible mitigants 1248 0
VII. Securitisation: Disclosure for standardised approach Securitisation "means a process by which a single performing asset or a pool of performing assets are sold to a bankruptcy remote Special Purpose Vehicle (SPV) and transferred from the balance sheet of the originator to the SPV in return for an immediate cash payment. SPV" means any company, trust, or other entity constituted or established for a specific purpose - (a) activities of which are limited to those for accomplishing the purpose of the company, trust or other entity as the case may be; and (b) which is structured in a manner intended to isolate the

61
corporation, trust or entity as the case may be, from the credit risk of an originator to make it bankruptcy remote. Bank had no exposure towards securitised assets, both purchased as well as retained. The Bank had carried out securitization transaction in past and such deals were done on the basis of ‘True Sale’, which provides 100% protection to the Bank from the default in case of assets originated by it. All risks in the securitised portfolio were transferred to the Special Purpose Vehicle (SPV). Post-securitisation, Bank continued to service the loans transferred under securitization. Bank had also provided for credit enhancements in the form of cash collaterals to a minimum extent. The Bank, in the past, had securitized its assets with the objectives of managing its funding requirements, improving liquidity, reducing credit risk and diversifying the portfolio risk, managing interest rate risk, and capital adequacy. The Bank has not securitised any of its portfolios for the past 5 years Apart from managing credit risk, Bank also considered different types of risks viz. interest rate risk and liquidity risk for the retained assets or acquired portfolio and ensure its adequate assessment and mechanism for mitigating the same. The securitized portfolio, both the retained part and acquired assets, were monitored regularly in terms of various risk parameters such as repayment, cash flows to service the interest, principal and other charges, counterparty risk, servicer’s capability, underlying asset risk profile and interest rate risk. Exposure details on account of securitization transactions (a) Securitisation exposures in Banking Book There are no outstanding under the securitization exposures as on 31st March, 2011. No securitization activities were undertaken by the Bank during financial year ended on 31st
(b) Amount of Assets intended to be securitized within a year:
March, 2011.
For the time being Bank does not have any plans to undertake securitization of its assets. However, for the purpose of balance sheet management and if the situation so warrants, securitization of exposure may be explored.
(c) Securitisation exposure in Trading Book:
Bank does not have any securitised exposure classified under Trading book category.
VIII. Market risk in Trading book
Market Risk may be defined as the possibility of loss to a bank caused by changes in the market variables. The market risk for the Bank is governed by the Market Risk Policy and Funds and Investment policy which are approved by the Board. These policies serve to outline the Bank’s risk appetite and risk philosophy in respect of Treasury / Forex / Equity / Derivatives / Bullion operations, and the controls that are considered essential for the management of market risks. The policies are reviewed periodically to update it with changed business requirements, economic environment and revised regulatory guidelines.

62
Sources of market risk: Market risks arise from the following risk factors:
Price risk for bonds, forex, equities and bullion Interest rate risk for investments, derivatives, etc Exchange rate risk for currencies; and Trading / liquidity risk.
Objectives of Market risk management: The broad objectives of Market Risk management are:
Management of interest rate risk and currency risk of the trading portfolio. Adequate control and suitable reporting of investments, Forex, Equity and Derivative
portfolios Compliance with regulatory and internal guidelines. Monitoring and Control of transactions of market related instruments.
Scope and nature of risk reporting and measurement systems: Reporting The Bank reports on the various investments, Foreign exchange positions and derivatives position with their related risk measures to the top management and the committees of the Board on a periodic basis. The Bank periodically reports the related positions to the regulators in compliance with regulatory requirements.
Measurement The Bank monitoring its risks through risk management tools and techniques such as are Value-at-Risk, Modified Duration, PV01, Stop Loss, amongst others. Based on the risk appetite of the Bank, various risk limits are placed which is monitored on a daily basis.
Capital requirements for Market risks @ 9%
(Rs. in crores)
Market Risk elements Amount of
capital required Interest Rate Risk 61.22 Foreign Exchange Risk (including gold) 9.00 Equity Risk 1.22
Operational Risk The Bank has framed Operational Risk Management Policy duly approved by the board. Other policies adopted by the Board that deals with management of operational risk are (a) Information System Security Policy (b) Policy on Know Your Customer (KYC) and Anti Money Laundering Policy (AML) process (c) IT business continuity and Disaster Recovery Plan and (d) Business Continuity Plan (BCP) (e) New Product Programme Policy and (f) A framework for Risk and Control Self Assessment (RCSA).

63
The Operational Risk Management Policy adopted by the bank outlines organization structure and detail process for management of Operational Risk. The basic objective of the policy is to closely integrate operational Management system to risk management processes of the Bank by clearly assigning roles for effectively identifying, assessing, monitoring and controlling / mitigating operational risk exposures, including material operational losses. Operational risks in the Bank are managed through comprehensive and well-articulated internal control frameworks. The Bank has initiated process of capturing, reporting and assessing risk events at the process level using RCSA framework. IX. Interest rate risk in the banking book (IRRBB) Interest Rate Risk is the risk of loss in the Bank’s net income and net equity value arising out of a change in level of interest rates and / or their implied volatility. Interest rate risk arises from holding assets and liabilities with different principal amounts, maturity dates and re-pricing dates. The Bank holds assets, liabilities and off balance sheet items across various markets with different maturity or re-pricing dates and linked to different benchmark rates, thus creating exposure to unexpected changes in the level of interest rates in such markets. Interest rate risk in the banking book refers to the risk associated with interest rate sensitive instruments that are not held in the trading book of the Bank.
Risk management framework The Board of the Bank has overall responsibility for management of risks and it decides the risk management policy of the Bank and set limits for liquidity, interest rate, foreign exchange and equity price risks. The Asset Liability Management Committee (ALCO) consisting of Bank’s senior management including Managing Director is responsible for ensuring adherence to the limits set by the Board as well as for deciding the business strategy of the Bank (for the assets and liabilities) in line with the Bank’s budget and decided risk management objectives. ALCO decides strategies and specifies prudential limits for management of interest rate risk in the banking book within the broad parameters laid down by Board of Directors. These limits are monitored periodically and the breaches, if any, are reported to ALCO. Monitoring and Control The Board of Directors has approved the Asset-Liability Management policy. The policy is intended to be flexible to deal with rapidly changing conditions; any variations from policy should be reported to the Board of Directors with recommendations and approval from the ALCO. The Bank has put in place a mechanism for regular computation and monitoring of prudential limits and ratios for liquidity and interest rate risk management. The Bank uses its system capability for limits and ratio monitoring. The ALCO support group generates periodic reports for reporting these to ALCO and senior management of the Bank. The ALM support group carries out various analyses related to assets and liabilities, forecast financial market outlook, compute liquidity ratios and interest rate risk values based on the earnings and economic value perspective.

64
Risk measurement and reporting framework: The estimation of interest rate risk involves interest rate sensitive assets (RSAs) and interest rate sensitive liabilities (RSLs). The techniques for managing interest rate risk include: Interest rate sensitivity gap Analysis Earning at Risk Analysis Stress Testing
Interest rate sensitivity gap: The gap or mismatch risk as at a given date, is measured by calculating gaps over different time intervals. Gap analysis measures mismatches between rate sensitive liabilities (RSL) and rate sensitive assets (RSA) (including off-balance sheet positions). The report is prepared by grouping liabilities, assets and off-balance sheet positions into time buckets according to residual maturity or next re-pricing period, whichever is earlier. The difference between RSA and RSL for each time bucket signifies the gap in that time bucket. The gap report provides a good framework for determining the earnings impact.
Earning at Risk: Any change in interest rate would impact Bank’s net interest income (NII) and the value of its fixed income portfolio (price risk). The interest rate risk is measured by EaR that is the sensitivity of the NII to a 100 basis points adverse change in the level of interest rates. Stress Testing: The Bank measures the impact on net interest margin (NIM) / EaR after taking into account various possible movement in interest rates across tenor and their impact on the earnings and economic value of the Bank is calculated for each of these scenarios. These reports are prepared on a monthly basis for measurement of interest rate risk With an upward rate shock of 1% across the curve, as per Rate Sensitive Gaps in INR as on 31.03.2011, the earning shows a decline of Rs 89.78 crores.
The impact of change in interest rate by 100 bps and 50 bps has been computed on open positions (as on Mar 31, 2011) and shown hereunder against the respective currencies.
Change in interest rates (in bps) Impact on NII (Rupees in crores)
Currency -100 -50 50 100 INR 89.768 44.884 (44.884) (89.768) USD 0.001 0.000 (0.000) (0.001) JPY 0.007 0.003 (0.003) (0.007) GBP 0.000 0.000 (0.000) (0.000) EUR 0.000 0.000 (0.000) (0.000) Others 0.000 0.000 (0.000) (0.000) Total 89.776 44.888 (44.888) (89.776)