balance of payments, international investment … book... · 2 days ago · legal basis for...
TRANSCRIPT
BALANCE OF PAYMENTS, INTERNATIONAL INVESTMENT POSITION, AND EXTERNAL DEBT OF THE RUSSIAN FEDERATION
Moscow2020
2019
This publication has been prepared by the Statistics and Data Management Department of the Central Bank of the Russian Federation. Address: 107016, Moscow, Neglinnaya str., 12 Tel./Fax: +7 (495) 771-44-60 E-mail: [email protected] The Central Bank of the Russian Federation Internet address: www.cbr.ru
© The Central Bank of the Russian Federation, 2020
LEGAL BASIS FOR COMPILATION OF BALANCE OF PAYMENTS, INTERNATIONAL INVESTMENT POSITION, AND EXTERNAL DEBT STATISTICS
The legislative and legal basis for compilation of balance of payments, international investment position, and external debt statistics is set out in:
- Federal Law of July 10, 2002 No. 86-FZ (as amended) «On the Central Bank of the Russian Federation (Bank of Russia)»;
- Federal Law of November 29, 2007 No. 282-ФFZ (as amended) «On Official
Statistical Accounting and the System of State Statistics in the Russian Federation»; - Federal Law of December 2, 1990 No. 395-1 (as amended) «On Banks and Banking
Activity»;
- Federal Law of July 27, 2006 No. 149-FZ (as amended) «On Information, Information Technologies, and Protection of Information»;
- Resolution of the Government of the Russian Federation of September 26, 1997
No. 1226 «On Adherence of the Russian Federation to the IMF’s Special Data Dissemination Standard»;
- Order of the Government of the Russian Federation of May 26, 2008 No. 671-р (as amended on October 23, 2019) «On Approval of the Federal Plan of Statistical Works».
CONTENTS
Balance of payments, international investment position, and external debt of the Russian Federation in 2019. Statistical commentary ...…………………………......………………….…...... 5
1. BALANCE OF PAYMENTS
Table 1.1. Balance of payments of the Russian Federation in 2019. Standard components ........ 14 Table 1.2. Balance of payments of the Russian Federation in 2013-2019. Main components .. 23 Table 1.3. Balance of payments of the Russian Federation in 2019. Analytical presentation .... 25 Table 1.4. Financial transactions of private sector in 2013-2019 (based on the balance of payments, flows data) ………………………………………………………………………………..… 26 Table 1.5. Current account of the balance of payments of the Russian Federation in 2013-2019, seasonally adjusted .………….………………………….……………………………………... 27 Table 1.6. Main components of the current account of the balance of payments of the Russian Federation in 2013-2019, seasonally adjusted …………….……….………….............................. 28
2. EXTERNAL MERCHANDISE TRADE
Table 2.1. External merchandise trade of the Russian Federation in 2018-2019 (under balance of payments methodology) ……………………………………………………………………………. 29 Table 2.2. Exports of goods from the Russian Federation by country group and major trade partner country in 2019 ………………………....……….……….……………………………………. 30 Table 2.3. Imports of goods in the Russian Federation by country group and major trade partner country in 2019 ………………………....……….…........................................................................ 31 Table 2.4. Commodity composition of merchandise trade balance of the Russian Federation in 2019 ………………...…………………………………………….…………….……………….………. 32
3. EXTERNAL TRADE IN SERVICES
Table 3.1. External trade of the Russian Federation in services within the Extended Balance of Payments Services Classification in 2019 …………………………………………………………… 33 Table 3.2. External trade of the Russian Federation in services by country group in 2019 …… 37
Table 3.3. Exports of services of the Russian Federation under the Travel item in 2013-2019 by country group………………………………………………………………………………………... 38 Table 3.4. Imports of services by the Russian Federation under the Travel item in 2013-2019 by country group ………………………………………………………………………………………... 39 Supplement 3.1. Review of travel-related services’ exports and imports in 2019 …….………..… 40
4. CROSS-BORDER TRANSFERS OF INDIVIDUALS
Table 4.1. Cross-border transfers of individuals (residents and nonresidents) in 2018-2019 ....
45
Table 4.2. Cross-border remittances via payment systems in 2018-2019 ……..…….….………..
46
Table 4.3. Cross-border transfers of resident individuals by purposes in 2019 …………….…..…
47
Table 4.4. Cross-border transfers of individuals (residents and nonresidents) by country in the fourth quarter of 2019 .................................................................................................................. 48 Table 4.5. Cross-border remittances via payment systems by country in the fourth quarter of 2019 …………………………………………………………………………….………….….……..….. 51 Table 4.6. Personal remittances in 2018-2019 …….…………….…………………….....………… 52 Table 4.7. Personal remittances from the Russian Federation to CIS countries in 2018-2019...
53
Table 4.8. Personal remittances to the Russian Federation from CIS countries in 2018-2019...
53
5. INTERNATIONAL INVESTMENT POSITION
Table 5.1. International investment position of the Russian Federation in 2013-2019. Main components ………………………………………………………………….……….…………..….… 54 Table 5.2. International investment position of the Russian Federation in 2019. Standard component………………………………………………………..…..…….……….…….…….…….. 55 Table 5.3. Currency composition of foreign assets and liabilities of the banking sector of the Russian Federation in 2018-2019 .……….….….….…….…......…....….…......…...….….....…....
59 Table 5.4. International investment position on international reserves of the Russian Federation in 2019 .……………………...……..…………………………………..….…………..…. 60

6. EXTERNAL DEBT
Table 6.1. External debt of the Russian Federation in 2019 ……….…...………….…….….….. 61 Table 6.2. External debt of the Russian Federation in 2019 (by maturity and financial instrument) …………………..………..…….......…..…..…...……....…..……..…..….…….…........ 62 Table 6.3. External debt of the Russian Federation in 2019 (in national and foreign currency by maturity) .............................................................................................................................. 63 Table 6.4. Payment schedule of the external debt of the Russian Federation as of December 31, 2019: principal debt ………………………………………………………………………………. 64 Table 6.5. Payment schedule of the external debt of the Russian Federation as of December 31, 2019: interest …………………………………...………………………………………………… 65 Table 6.6. International investment position on external debt of the Russian Federation in 2019 ………………………………………….……………..……..…………………………………... 66 Table 6.7.General government external debt of the Russian Federation. Actual payments in 2019 ……………………………………………………………………………………………………. 67 Table 6.8. External debt sustainability ratios of the Russian Federation in 2013-2019 ........... 68
7. SUPPLEMENTARY MATERIALS TO EXTERNAL SECTOR STATISTICS
Supplement 7.1. List of principal changes introduced in the balance of payments data of the Russian Federation for preceding periods …………………………………………………………. 69 Supplement 7.2. List of principal changes introduced in the external debt of the Russian Federation data for preceding periods ……………………………….……..…….….….…….…... 72
Minor discrepancies between the total and the sum of components in some tables are due to the rounding
of data.
Symbols
- the phenomenon is absent

BALANCE OF PAYMENTS, INTERNATIONAL
INVESTMENT POSITION, AND EXTERNAL DEBT OF THE
RUSSIAN FEDERATION
IN 2019
In 2019, the current account surplus decreased in comparison to the previous year against the
background of declining prices for the Russia’s major export commodities. Net landing to the rest of
the world was made in a form of accumulation of international reserves with balancing other flows,
which are reflected in the financial accounts of the balance of payments. The positive balance of
private sector financial transactions was formed as a result of reduction of liabilities by banks, while
other sectors neutrally contributed to the formation of cross-border capital flows.
BALANCE OF PAYMENTS OF THE RUSSIAN FEDERATION
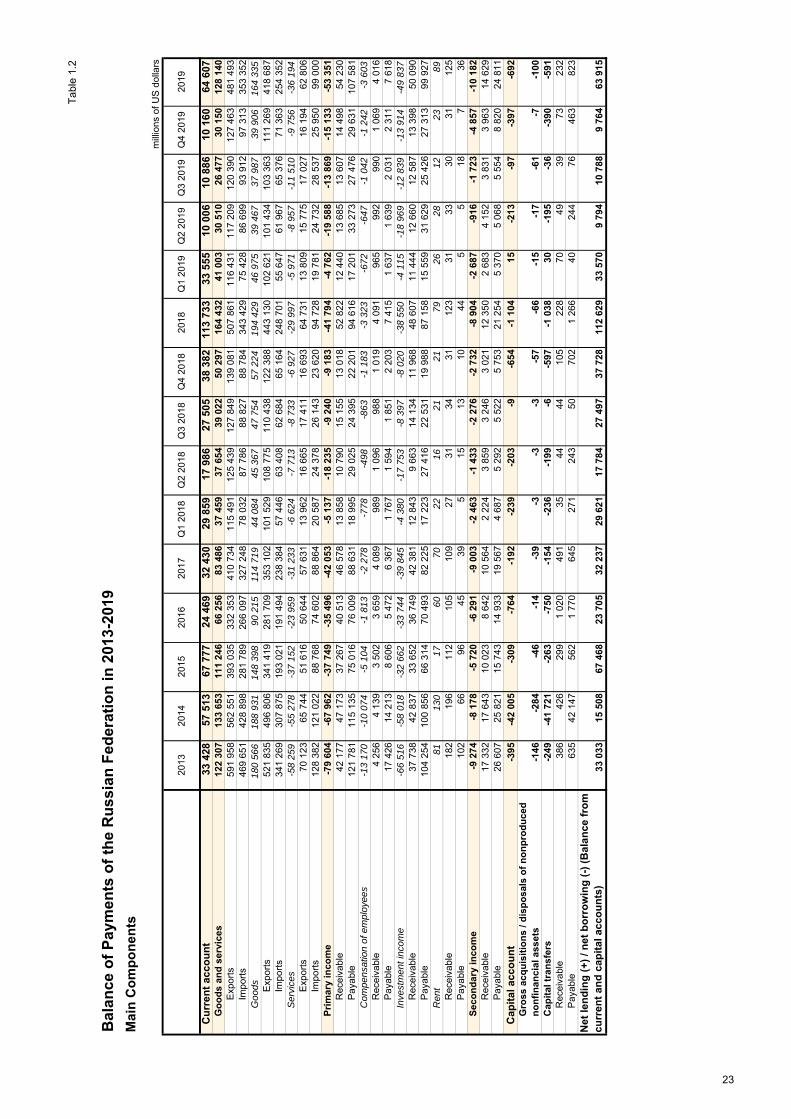
The surplus in current account for 2019
decreased to $64.6 billion (against $113.7 bil-
lion in 2018). The key role was played by the
decline of positive trade balance by $30.1 bil-
lion to $164.3 billion, with the increase in the
total deficit of other components.
External trade turnover decreased to
$418.7 billion, or by $24.4 billion, in comparison
to the previous year. The export dynamics was
33,4
57,567,8
24,532,4
113,7
64,6
-100
-50
0
50
100
150
200
2013 2014 2015 2016 2017 2018 2019
MAIN COMPONENTS OF THE CURRENT ACCOUNTIN 2013-2019billions of US dollars
Balance on merchandise trade Balance on trade in services
Balance on primary and secondary income Balance on current account
determined by the reduction in the value of im-
ports of four key fuel and energy commodities
by $24.0 billion to $237.9 billion due to de-
crease by 10.4% in their prices in the context of
worsening of international price environment.
The volume of key fuel and energy products in
natural terms increased by 1.3% as a result of
increased exports of oil and liquefied natural
gas, while the supplies of natural gas and
521,8
496,8
341,4
281,7
353,1
443,1418,7
2013 2014 2015 2016 2017 2018 2019
MERCHANDISE EXPORTS IN 2013-2019(billions of US dollars, per balance of payments methodology)
Crude oil Petroleum products Natural gas Other Exports
5
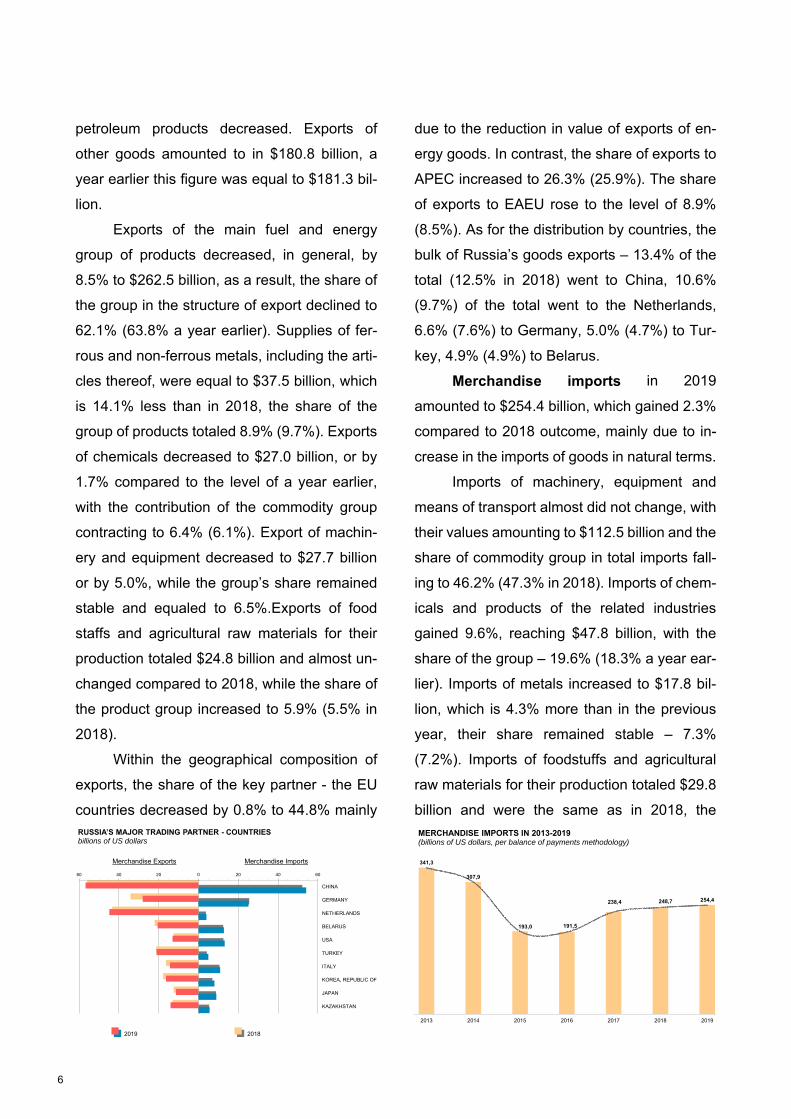
petroleum products decreased. Exports of
other goods amounted to in $180.8 billion, a
year earlier this figure was equal to $181.3 bil-
lion.
Exports of the main fuel and energy
group of products decreased, in general, by
8.5% to $262.5 billion, as a result, the share of
the group in the structure of export declined to
62.1% (63.8% a year earlier). Supplies of fer-
rous and non-ferrous metals, including the arti-
cles thereof, were equal to $37.5 billion, which
is 14.1% less than in 2018, the share of the
group of products totaled 8.9% (9.7%). Exports
of chemicals decreased to $27.0 billion, or by
1.7% compared to the level of a year earlier,
with the contribution of the commodity group
contracting to 6.4% (6.1%). Export of machin-
ery and equipment decreased to $27.7 billion
or by 5.0%, while the group’s share remained
stable and equaled to 6.5%.Exports of food
staffs and agricultural raw materials for their
production totaled $24.8 billion and almost un-
changed compared to 2018, while the share of
the product group increased to 5.9% (5.5% in
2018).
Within the geographical composition of
exports, the share of the key partner - the EU
countries decreased by 0.8% to 44.8% mainly
6040200204060
CHINA
GERMANY
NETHERLANDS
BELARUS
USA
TURKEY
ITALY
KOREA, REPUBLIC OF
JAPAN
KAZAKHSTAN
RUSSIA’S MAJOR TRADING PARTNER - COUNTRIESbillions of US dollars
2019
Merchandise ImportsMerchandise Exports
2018
due to the reduction in value of exports of en-
ergy goods. In contrast, the share of exports to
APEC increased to 26.3% (25.9%). The share
of exports to EAEU rose to the level of 8.9%
(8.5%). As for the distribution by countries, the
bulk of Russia’s goods exports – 13.4% of the
total (12.5% in 2018) went to China, 10.6%
(9.7%) of the total went to the Netherlands,
6.6% (7.6%) to Germany, 5.0% (4.7%) to Tur-
key, 4.9% (4.9%) to Belarus.
Merchandise imports in 2019
amounted to $254.4 billion, which gained 2.3%
compared to 2018 outcome, mainly due to in-
crease in the imports of goods in natural terms.
Imports of machinery, equipment and
means of transport almost did not change, with
their values amounting to $112.5 billion and the
share of commodity group in total imports fall-
ing to 46.2% (47.3% in 2018). Imports of chem-
icals and products of the related industries
gained 9.6%, reaching $47.8 billion, with the
share of the group – 19.6% (18.3% a year ear-
lier). Imports of metals increased to $17.8 bil-
lion, which is 4.3% more than in the previous
year, their share remained stable – 7.3%
(7.2%). Imports of foodstuffs and agricultural
raw materials for their production totaled $29.8
billion and were the same as in 2018, the
341,3
307,9
193,0 191,5
238,4 248,7 254,4
2013 2014 2015 2016 2017 2018 2019
MERCHANDISE IMPORTS IN 2013-2019(billions of US dollars, per balance of payments methodology)
6

weight of the commodity group decreased from
12.5% to 12.3%.
Within the geographical composition of
merchandise imports, the share of APEC coun-
tries increased to 41.4% (40.7% a year earlier),
while the contribution of the EU countries de-
clined by 1.1 percentage points to 36.3%; the
share of EAEU countries was at the level of
8.0% (7.8%). Among top Russia’s counterpar-
ties, China contributed 22.2% of total imports of
goods (21.9% in 2018), Germany accounted
for 10.3% (10.7%), the United States of Amer-
ica represented 5.4% (5.3%), the share of Bel-
arus was 5.3% (5.2%), and that of Italy consti-
tuted 4.5% (4.4%).
Deficit in the balance on external trade
in services expanded by 20.7% to $36.2 billion
mainly due to an increase in imports.
Exports of services fell to $62.8 billion
($64.7 billion in 2018). Value of transport ser-
vices provided to nonresidents was equal to
$21.6 billion against $22.1 billion in the previ-
ous year. The reduction of rendered travel ser-
vices by $0.6 billion to $11.0 billion is due to the
high value of this indicator in 2018, as the result
of hosting the world football championship. De-
crease of other services’ exports, provided to
34%
17%
21%
28%
Services Exports
COMPOSITION OF SERVICES EXPORTS AND IMPORTS IN 2019(% of the total)
Other business services
Other services
Transport services
Travel
16%
36%22%
26%
Services Imports
nonresidents, to $30.3 billion ($31.0 billion)
was driven, mainly, in construction sector.
Services’ imports increased to $99.0 bil-
lion, or by 4.5%. The volume of services ren-
dered by foreign carriers did not change signif-
icantly and amounted to $15.4 billion. Values of
imported travel services increased by 5.5% and
totaled $36.2 billion. Imports of other services
provided by the nonresidents rose to $47.4 bil-
lion against $45.2 billion in 2018, mainly, as a
result of increased consumption of construction
services, as well as in the segment of legal and
consulting services in the field of management.
The negative balance on compensa-
tion of employees expanded to $3.6 billion
(against $3.3 billion in 2018). The compensa-
tion of employees payable to nonresidents
changed from $7.4 to $7.6 billion. The value of
compensation of employees receivable by
Russia’s citizens working abroad remained at
the level of $4.0 billion.
Deficit in the balance on investment in-
come rose to $49.8 billion in 2019 from $38.6
billion in the previous year. These dynamics
were caused by the increase by $12.0 billion to
$50.3 billion of the negative balance on the in-
vestment income of other sectors, as the result
of the increase of volume of payments to non-
residents. The negative balance of investment
income in the banking sector fell down to $0.4
billion against $ 1.1 billion in the previous year
as a result of a reduction in income payable.
Combined investment income balance of gen-
eral government sector and central bank sector
showed a surplus of $0.9 billion, as it was in
2018.
7
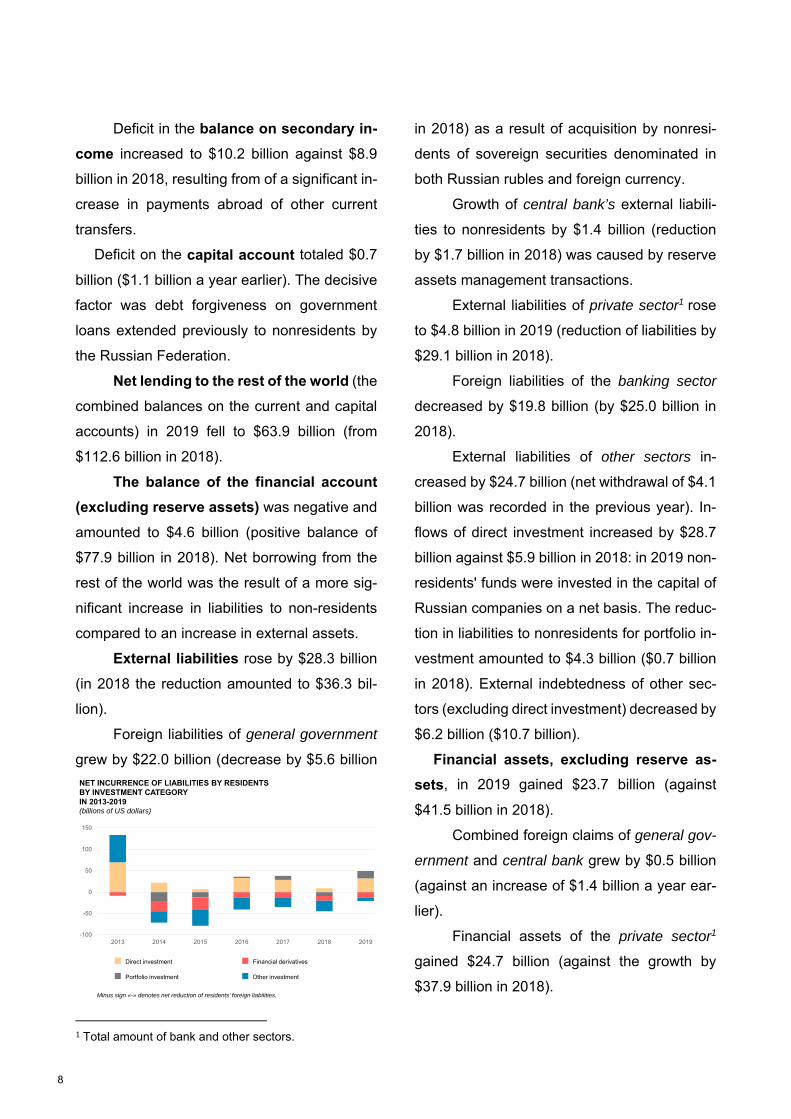
Deficit in the balance on secondary in-
come increased to $10.2 billion against $8.9
billion in 2018, resulting from of a significant in-
crease in payments abroad of other current
transfers.
Deficit on the capital account totaled $0.7
billion ($1.1 billion a year earlier). The decisive
factor was debt forgiveness on government
loans extended previously to nonresidents by
the Russian Federation.
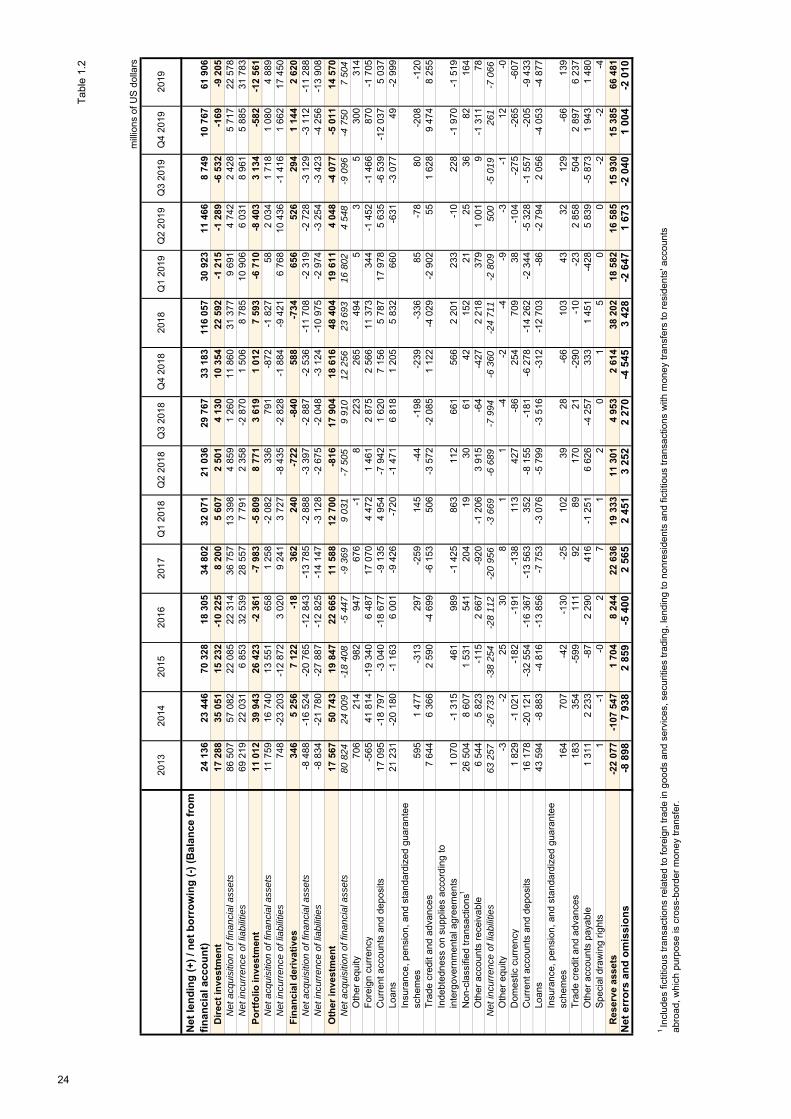
Net lending to the rest of the world (the
combined balances on the current and capital
accounts) in 2019 fell to $63.9 billion (from
$112.6 billion in 2018).
The balance of the financial account
(excluding reserve assets) was negative and
amounted to $4.6 billion (positive balance of
$77.9 billion in 2018). Net borrowing from the
rest of the world was the result of a more sig-
nificant increase in liabilities to non-residents
compared to an increase in external assets.
External liabilities rose by $28.3 billion
(in 2018 the reduction amounted to $36.3 bil-
lion).
Foreign liabilities of general government
grew by $22.0 billion (decrease by $5.6 billion
-100
-50
0
50
100
150
2013 2014 2015 2016 2017 2018 2019
NET INCURRENCE OF LIABILITIES BY RESIDENTSBY INVESTMENT CATEGORYIN 2013-2019(billions of US dollars)
Direct investment Financial derivatives
Portfolio investment Other investment
Minus sign «-» denotes net reduction of residents’ foreign liabilities.
1 Total amount of bank and other sectors.
in 2018) as a result of acquisition by nonresi-
dents of sovereign securities denominated in
both Russian rubles and foreign currency.
Growth of central bank’s external liabili-
ties to nonresidents by $1.4 billion (reduction
by $1.7 billion in 2018) was caused by reserve
assets management transactions.
External liabilities of private sector1 rose
to $4.8 billion in 2019 (reduction of liabilities by
$29.1 billion in 2018).
Foreign liabilities of the banking sector
decreased by $19.8 billion (by $25.0 billion in
2018).
External liabilities of other sectors in-
creased by $24.7 billion (net withdrawal of $4.1
billion was recorded in the previous year). In-
flows of direct investment increased by $28.7
billion against $5.9 billion in 2018: in 2019 non-
residents' funds were invested in the capital of
Russian companies on a net basis. The reduc-
tion in liabilities to nonresidents for portfolio in-
vestment amounted to $4.3 billion ($0.7 billion
in 2018). External indebtedness of other sec-
tors (excluding direct investment) decreased by
$6.2 billion ($10.7 billion).
Financial assets, excluding reserve as-
sets, in 2019 gained $23.7 billion (against
$41.5 billion in 2018).
Combined foreign claims of general gov-
ernment and central bank grew by $0.5 billion
(against an increase of $1.4 billion a year ear-
lier).
Financial assets of the private sector1
gained $24.7 billion (against the growth by
$37.9 billion in 2018).
8

Claims of banks on nonresidents de-
creased by $2.0 billion in comparison to the
growth by $7.6 billion in 2018.
Net acquisition of financial assets by
other sectors2 totaled $26.7 billion ($30.3 billion
a year earlier). Direct investments abroad rose
by $23.2 billion (against $29.6 billion in 2018):
the volume investment in nonresidents compa-
nies’ capital remained at the same level as in
2018. Portfolio investment abroad increased by
$2.3 billion against $1.4 billion a year earlier.
Trade credit and advances for $8.3 billion were
provided to nonresidents (net repayment of
$4.0 billion in the previous year). The volume of
foreign currency in cash resulting from transac-
tions of other sectors with nonresidents de-
clined by $7.7 billion (against a decrease of
$7.0 billion in 2018).
-50
0
50
100
150
200
2013 2014 2015 2016 2017 2018 2019
Direct investment Financial derivatives
Portfolio investment Other investment
Minus sign «-» denotes net reduction of residents’ foreign assets.
NET ACQUISITION OF FINANCIAL ASSETS BY RESIDENTSEXCLUSIVE OF RESERVE ASSETS, BY INVESTMENT CATEGORYIN 2013-2019(billions of US dollars)
The balance on financial transactions
of the private sector in the reporting year to-
taled $21.9 billion (against $63.6 billion in
2018). This dynamic was determined by the
banks ' transactions related to the reduction of
their foreign liabilities. The growth of external
assets and liabilities of other sectors was equal
and had a neutral impact on the total private
sector capital flows.
INTERNATIONAL RESERVES OF THE RUSSIAN FEDERATION
International reserves of the Russian
Federation rose by $85.9 billion in 2019
(against $35.8 billion a year earlier) and
amounted to $554.4 billion as of December 31,
2019.
The increase of international reserves as
a result of transactions recorded in the balance
of payments by $66.5 billion was mainly due to
the purchase of foreign currency on the domes-
tic market under the budget rule, as well as to
2 Excluding indebtedness on supplies under intergovern-mental agreements.
the crediting funds to the accounts of the Minis-
try of Finance of the Russian Federation from
the placement of Eurobonds.
A cumulative positive value of revalua-
tions totaled $14.4 billion and was determined
by the rise in price of gold; international re-
serves increased as well by $5.0 billion due to
other changes.
Value of monetary gold reached $110.4
billion as of December 31, 2019. The annual
growth of value of monetary gold by $23.5 bil-
9
lion resulted from significant positive revalua-
tion totaled $16.5 billion and replenishment of
Bank of Russia’s holdings in physical form (an
addition of $7.0 billion). As a result, gold’s share
in international reserves rose from 18.5% at the
beginning of 2019 to 19.9% as of December 31,
2019.
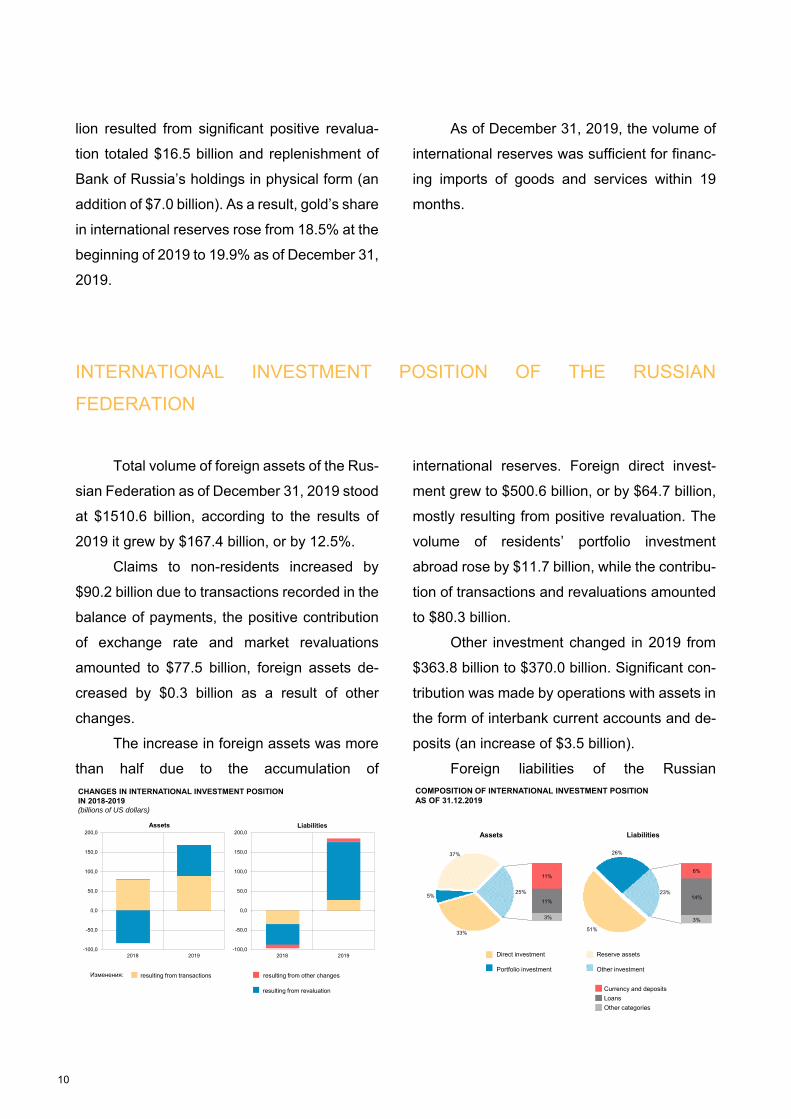
As of December 31, 2019, the volume of
international reserves was sufficient for financ-
ing imports of goods and services within 19
months.
INTERNATIONAL INVESTMENT POSITION OF THE RUSSIAN
FEDERATION
Total volume of foreign assets of the Rus-
sian Federation as of December 31, 2019 stood
at $1510.6 billion, according to the results of
2019 it grew by $167.4 billion, or by 12.5%.
Claims to non-residents increased by
$90.2 billion due to transactions recorded in the
balance of payments, the positive contribution
of exchange rate and market revaluations
amounted to $77.5 billion, foreign assets de-
creased by $0.3 billion as a result of other
changes.
The increase in foreign assets was more
than half due to the accumulation of
CHANGES IN INTERNATIONAL INVESTMENT POSITIONIN 2018-2019(billions of US dollars)
resulting from transactions resulting from other changes
resulting from revaluation
Изменения:
Assets Liabilities
-100,0
-50,0
0,0
50,0
100,0
150,0
200,0
2018 2019-100,0
-50,0
0,0
50,0
100,0
150,0
200,0
2018 2019
international reserves. Foreign direct invest-
ment grew to $500.6 billion, or by $64.7 billion,
mostly resulting from positive revaluation. The
volume of residents’ portfolio investment
abroad rose by $11.7 billion, while the contribu-
tion of transactions and revaluations amounted
to $80.3 billion.
Other investment changed in 2019 from
$363.8 billion to $370.0 billion. Significant con-
tribution was made by operations with assets in
the form of interbank current accounts and de-
posits (an increase of $3.5 billion).
Foreign liabilities of the Russian
33%
5%
37%
11%
11%
3%
25%
Assets
51%
26%
6%
14%
3%
23%
Liabilities
Direct investment
Portfolio investment
COMPOSITION OF INTERNATIONAL INVESTMENT POSITIONAS OF 31.12.2019
Currency and deposits
Loans
Other categories
Reserve assets
Other investment
10

Federation totaled $1154.1 billion as of Decem-
ber 31, 2019. Their growth by $184.9 billion, or
by 19.1%, in the course of 2019, mainly was
caused by positive exchange rate and market
revaluations in the amount of $147.9 billion. Ex-
ternal liabilities rose by $28.3 billion, resulting
from transactions recorded in the balance of
payments, due to other changes - by $8.7 bil-
lion.
A key role in the dynamics of liabilities to
non-residents was played by portfolio invest-
ment, the volume of which grew one and a half
times in 2019, or by $95.8 billion, to $302.7 bil-
lion, mostly due to revaluation of Russian debt
securities owned by non-residents. Liabilities
on direct investment expanded by $88.4 billion
to $585.8 billion, also predominantly due to the
positive contribution of revaluation, the indebt-
edness on other investment remained virtually
unchanged and amounted to $259.8 billion.
At the end of 2019, the increase in foreign
liabilities, which was mainly resulted from posi-
tive revaluation, exceeded the growth of exter-
nal assets, which led to a decline in the net in-
ternational investment position of the Russian
Federation by $17.5 billion to $356.5 billion.
EXTERNAL DEBT OF THE RUSSIAN FEDERATION
External debt of the Russian Federation
totaled $490.8 billion as of December 31, 2019,
increasing by $35.8 billion or by 7.9% from the
beginning of the year.
The volume of liabilities to non-residents
grew by $17.7 billion as a result of transactions
with non-residents. The amount of positive re-
valuations of $12.1 billion was a result, among
EXTERNAL DEBT OF THE RUSSIAN FEDERATION(billions of US dollars, end of period)
0
100
200
300
400
500
600
700
800
General government
Central bank
Banks
Other sectors
other, of the strengthening of the Russian ruble
vis-a-vis the US dollar. Other changes
amounted to $6.0 billion.
The weight of private sector as of Decem-
ber 31, 2019 stood at 82.9% (against 87.8% a
year earlier) within the composition of debt lia-
bilities, the share of general government’s exter-
nal indebtedness represented 14.3% (9.7%),
while that of central bank was equal to 2.8%
(2.7%).
The main growth of external debt
stemmed from the rise in general government’s
indebtedness to non-residents, which has
grown by $26.0 billion since the beginning of
2019, amounting to $70.0 billion. Increase in li-
abilities to non-residents in the form of sover-
11
eign debt securities denominated in Russian ru-
bles (by $20.6 billion) and in foreign currency
(by $5.7 billion) played a key role.
Liabilities of central bank to nonresidents
increased by $1.8 billion to $13.9 billion: the ris-
ing liabilities on repo transactions in the frame-
work of international reserves management was
partially offset by a decline in debt in the form of
cash Russian rubles, as well as accounts and
deposits.
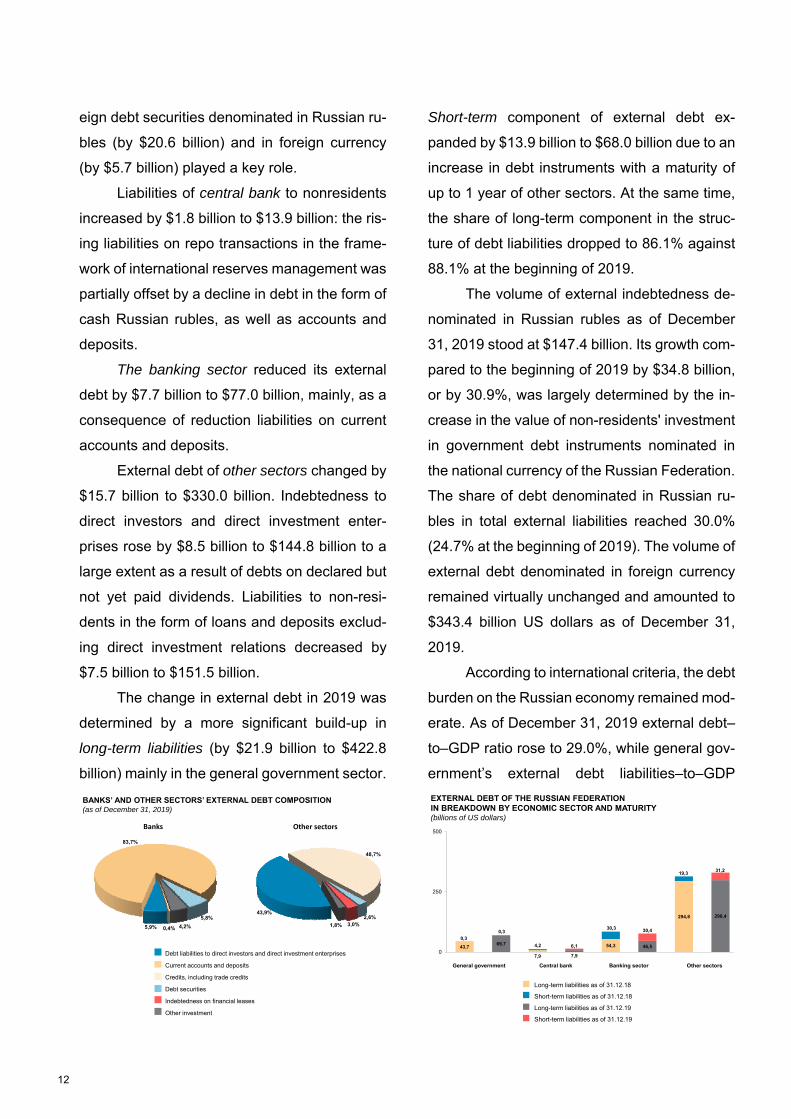
The banking sector reduced its external
debt by $7.7 billion to $77.0 billion, mainly, as a
consequence of reduction liabilities on current
accounts and deposits.
External debt of other sectors changed by
$15.7 billion to $330.0 billion. Indebtedness to
direct investors and direct investment enter-
prises rose by $8.5 billion to $144.8 billion to a
large extent as a result of debts on declared but
not yet paid dividends. Liabilities to non-resi-
dents in the form of loans and deposits exclud-
ing direct investment relations decreased by
$7.5 billion to $151.5 billion.
The change in external debt in 2019 was
determined by a more significant build-up in
long-term liabilities (by $21.9 billion to $422.8
billion) mainly in the general government sector.
BANKS’ AND OTHER SECTORS’ EXTERNAL DEBT COMPOSITION(as of December 31, 2019)
Debt liabilities to direct investors and direct investment enterprises
Current accounts and deposits
Credits, including trade credits
Debt securities
Indebtedness on financial leases
Other investment
43,9%
48,7%
2,6%3,0%1,8%
Other sectors
5,9%
83,7%
5,8%
4,2%0,4%
Banks
Short-term component of external debt ex-
panded by $13.9 billion to $68.0 billion due to an
increase in debt instruments with a maturity of
up to 1 year of other sectors. At the same time,
the share of long-term component in the struc-
ture of debt liabilities dropped to 86.1% against
88.1% at the beginning of 2019.
The volume of external indebtedness de-
nominated in Russian rubles as of December
31, 2019 stood at $147.4 billion. Its growth com-
pared to the beginning of 2019 by $34.8 billion,
or by 30.9%, was largely determined by the in-
crease in the value of non-residents' investment
in government debt instruments nominated in
the national currency of the Russian Federation.
The share of debt denominated in Russian ru-
bles in total external liabilities reached 30.0%
(24.7% at the beginning of 2019). The volume of
external debt denominated in foreign currency
remained virtually unchanged and amounted to
$343.4 billion US dollars as of December 31,
2019.
According to international criteria, the debt
burden on the Russian economy remained mod-
erate. As of December 31, 2019 external debt–
to–GDP ratio rose to 29.0%, while general gov-
ernment’s external debt liabilities–to–GDP
43,769,7
7,9 7,9
54,3 46,5
294,8 298,4
0,3
0,3
4,2 6,1
30,3 30,4
19,331,2
0
250
500
EXTERNAL DEBT OF THE RUSSIAN FEDERATIONIN BREAKDOWN BY ECONOMIC SECTOR AND MATURITY(billions of US dollars)
Long-term liabilities as of 31.12.18
Short-term liabilities as of 31.12.18
Long-term liabilities as of 31.12.19
Short-term liabilities as of 31.12.19
General government Central bank Banking sector Other sectors
12

ratio rose to 4% (as of the beginning of 2019 –
27% and 3%, respectively).
29,031,831,832,6
30,428,9 29,632,5
36,0 37,939,241,4
41,139,537,536,034,8
32,932,029,7
28,227,328,629,428,428,8
9,3 10,210,110,3 9,2 8,6 7,3 8,8 9,0 9,3 9,7 10,910,510,310,910,510,28,7 8,5 8,1 7,3 6,6 6,9 7,1 6,6 7,1
0,0
2,0
4,0
6,0
0,0
20,0
40,0
60,0
31.
12.
20
12
31.
12.
20
13
31.
03.
20
14
30.
06.
20
14
30.
09.
20
14
31.
12.
20
14
31.
03.
20
15
30.
06.
20
15
30.
09.
20
15
31.
12.
20
15
31.
03.
20
16
30.
06.
20
16
30.
09.
20
16
31.
12.
20
16
31.
03.
20
17
30.
06.
20
17
30.
09.
20
17
31.
12.
20
17
31.
03.
20
18
30.
06.
20
18
30.
09.
20
18
31.
12.
20
18
31.
03.
20
19
30.
06.
20
19
30.
09.
20
19
31.
12.
20
19
in p
erc
en
t
tho
usa
nds o
f US
do
llars
EXTERNAL DEBT OF THE RUSSIAN FEDERATION SUSTAINABILITYINDICATORS’ DYNAMICS(as of the end of the period)
External debt payments/GDP (left scale)
External debt/GDP (left scale)
External debt per capita (right scale)
13

Table 1.1
Balance of Payments of the Russian Federation in 2019
Standard Components
millions of US dollars
Q1 2019 Q2 2019 Q3 2019 Q4 2019 2019
Current account 33 555 10 006 10 886 10 160 64 607Credit 131 554 135 046 137 828 145 924 550 352Debit 97 999 125 040 126 942 135 764 485 744
Goods and services 41 003 30 510 26 477 30 150 128 140Credit 116 431 117 209 120 390 127 463 481 493Debit 75 428 86 699 93 912 97 313 353 352
Goods 46 975 39 467 37 987 39 906 164 335 Credit 102 621 101 434 103 363 111 269 418 687 Debit 55 647 61 967 65 376 71 363 254 352
General merchandise on a balance of payments basis 47 702 38 765 37 830 39 624 163 920 Credit 103 349 100 731 103 206 110 987 418 272 Debit 55 647 61 967 65 376 71 363 254 352
Net exports of goods under merchanting -727 702 157 282 414Goods acquired under merchanting -2 085 -1 303 -1 358 -1 618 -6 364Goods sold under merchanting 1 358 2 006 1 515 1 901 6 778
Services -5 971 -8 957 -11 510 -9 756 -36 194 Credit 13 809 15 775 17 027 16 194 62 806 Debit 19 781 24 732 28 537 25 950 99 000
Manufacturing services on physical inputs owned by others 339 285 236 146 1 007 Credit 373 322 282 193 1 170 Debit 34 37 46 46 163
Goods for processing in reporting economy – Goods returned (credit), Goods received (debit) 336 254 136 463 1 189 Credit 702 579 421 741 2 445 Debit 367 325 285 279 1 256Goods for processing abroad - Goods sent (credit), Goods returned (debit) -26 -16 -27 -32 -100 Credit 45 55 64 54 219 Debit 71 71 91 86 319
Maintenance and repair services -10 190 -129 -100 -49 Credit 467 629 391 413 1 900 Debit 476 439 520 513 1 949Transport 1 575 1 427 1 777 1 335 6 115 Credit 4 857 5 317 5 914 5 469 21 557 Debit 3 282 3 890 4 137 4 134 15 442
Passenger 577 583 843 323 2 326 Credit 1 522 1 736 2 047 1 480 6 785 Debit 946 1 153 1 204 1 157 4 459Freight 41 -255 -5 92 -127 Credit 1 669 1 688 2 011 2 187 7 554 Debit 1 627 1 942 2 016 2 095 7 681Other 957 1 099 939 920 3 916 Credit 1 666 1 894 1 857 1 802 7 219 Debit 709 795 917 882 3 303Sea transport 429 304 289 377 1 400 Credit 1 318 1 329 1 322 1 420 5 389 Debit 889 1 026 1 033 1 042 3 990
Passenger -1 0 -2 -2 -5 Credit 0 0 0 0 0 Debit 1 0 2 2 5Freight -333 -462 -454 -408 -1 658 Credit 339 341 358 423 1 460 Debit 672 803 812 831 3 118
The presentation of Russia's balance of payments data is prepared by the Bank of Russia in accordance with the standard components recommended inthe 6th edition of the IMF's Balance of Payments and International Investment Position Manual (BPM6) and is used to report country's data to the IMF.
A few of the standard components remain in Russia's circumstances either insignificant or are not captured in the data collection for the time being.The standard BPM6 presentation employs a commonly accepted use of the mathematical signs "+" and "-" to denote respectively net increase and netdecrease of financial assets and liabilities. The negative sign is not used in the current and capital accounts for representing imports of goods andservices, as well as primary and secondary income payable and capital transfers payable.The sum of the balances on the current and capital accounts represents the net lending "+" or net borrowing "-" by the economy with the rest of the world.This is conceptually equal to the net balance on the financial account. The residual difference between the sum of net lending/net borrowing derived fromthe financial account, on one hand, and the same item derived from the current and capital accounts, on the other, is stated in the balance of payments asnet errors and omissions item.Reserve assets are presented as standard components of the financial account.
14
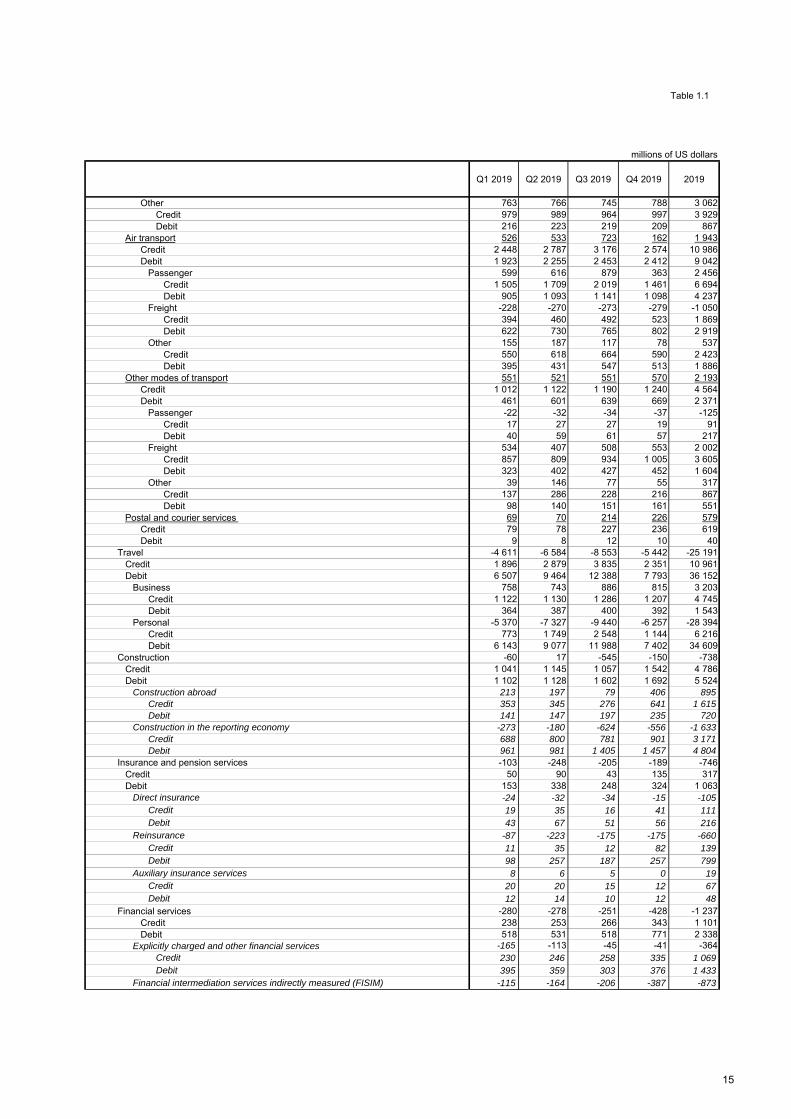
Table 1.1
millions of US dollars
Q1 2019 Q2 2019 Q3 2019 Q4 2019 2019
Other 763 766 745 788 3 062 Credit 979 989 964 997 3 929 Debit 216 223 219 209 867
Air transport 526 533 723 162 1 943 Credit 2 448 2 787 3 176 2 574 10 986 Debit 1 923 2 255 2 453 2 412 9 042
Passenger 599 616 879 363 2 456 Credit 1 505 1 709 2 019 1 461 6 694 Debit 905 1 093 1 141 1 098 4 237Freight -228 -270 -273 -279 -1 050 Credit 394 460 492 523 1 869 Debit 622 730 765 802 2 919Other 155 187 117 78 537 Credit 550 618 664 590 2 423 Debit 395 431 547 513 1 886
Other modes of transport 551 521 551 570 2 193 Credit 1 012 1 122 1 190 1 240 4 564 Debit 461 601 639 669 2 371
Passenger -22 -32 -34 -37 -125 Credit 17 27 27 19 91 Debit 40 59 61 57 217Freight 534 407 508 553 2 002 Credit 857 809 934 1 005 3 605 Debit 323 402 427 452 1 604Other 39 146 77 55 317 Credit 137 286 228 216 867 Debit 98 140 151 161 551
Postal and courier services 69 70 214 226 579 Credit 79 78 227 236 619 Debit 9 8 12 10 40
Travel -4 611 -6 584 -8 553 -5 442 -25 191 Credit 1 896 2 879 3 835 2 351 10 961 Debit 6 507 9 464 12 388 7 793 36 152
Business 758 743 886 815 3 203 Credit 1 122 1 130 1 286 1 207 4 745 Debit 364 387 400 392 1 543Personal -5 370 -7 327 -9 440 -6 257 -28 394 Credit 773 1 749 2 548 1 144 6 216 Debit 6 143 9 077 11 988 7 402 34 609
Construction -60 17 -545 -150 -738 Credit 1 041 1 145 1 057 1 542 4 786 Debit 1 102 1 128 1 602 1 692 5 524
Construction abroad 213 197 79 406 895 Credit 353 345 276 641 1 615 Debit 141 147 197 235 720Construction in the reporting economy -273 -180 -624 -556 -1 633 Credit 688 800 781 901 3 171 Debit 961 981 1 405 1 457 4 804
Insurance and pension services -103 -248 -205 -189 -746 Credit 50 90 43 135 317 Debit 153 338 248 324 1 063
Direct insurance -24 -32 -34 -15 -105 Credit 19 35 16 41 111 Debit 43 67 51 56 216Reinsurance -87 -223 -175 -175 -660 Credit 11 35 12 82 139 Debit 98 257 187 257 799Auxiliary insurance services 8 6 5 0 19 Credit 20 20 15 12 67 Debit 12 14 10 12 48
Financial services -280 -278 -251 -428 -1 237 Credit 238 253 266 343 1 101 Debit 518 531 518 771 2 338
Explicitly charged and other financial services -165 -113 -45 -41 -364 Credit 230 246 258 335 1 069 Debit 395 359 303 376 1 433
Financial intermediation services indirectly measured (FISIM) -115 -164 -206 -387 -873
15

Table 1.1
millions of US dollars
Q1 2019 Q2 2019 Q3 2019 Q4 2019 2019
Credit 8 7 9 8 32 Debit 123 171 215 395 905
Charges for the use of intellectual property -1 163 -1 360 -1 613 -1 716 -5 852 Credit 213 276 250 275 1 014 Debit 1 376 1 637 1 863 1 991 6 866
Telecommunications, computer, and information services 189 189 75 -206 246 Credit 1 236 1 347 1 363 1 543 5 489 Debit 1 048 1 159 1 288 1 749 5 244
Telecommunications services -62 -63 -85 -99 -309 Credit 210 209 202 232 853 Debit 272 272 286 332 1 162Computer services 319 340 247 -7 899 Credit 992 1 107 1 129 1 261 4 488 Debit 673 767 882 1 268 3 590Information services -68 -89 -87 -100 -344 Credit 35 31 33 50 148 Debit 103 120 120 150 492
Other business services -1 545 -2 214 -1 988 -2 616 -8 363 Credit 3 111 3 142 3 207 3 534 12 994 Debit 4 656 5 356 5 195 6 150 21 357
Research and development services 73 64 82 65 284 Credit 103 102 111 122 439 Debit 30 38 29 57 154
Professional and management consulting services 308 -237 -154 -206 -288 Credit 1 472 1 440 1 502 1 642 6 056 Debit 1 164 1 677 1 657 1 848 6 345
Technical, trade-related, and other business services -1 926 -2 041 -1 916 -2 475 -8 359 Credit 1 536 1 600 1 594 1 770 6 499 Debit 3 462 3 641 3 510 4 245 14 858
Personal, cultural, and recreational services -203 -298 -234 -313 -1 048 Credit 99 109 183 133 524 Debit 302 406 417 446 1 572Audiovisual and related services -75 -168 -178 -185 -607
Credit 47 54 64 74 239 Debit 121 222 242 260 845
Other personal, cultural, and recreational services -129 -129 -56 -127 -441 Credit 52 55 119 59 285 Debit 181 184 175 186 727
Government goods and services n.i.e. -99 -82 -79 -78 -338 Credit 228 265 236 263 993 Debit 328 348 315 341 1 331
Primary income -4 762 -19 588 -13 869 -15 133 -53 351 Credit 12 440 13 685 13 607 14 498 54 230 Debit 17 201 33 273 27 476 29 631 107 581
Compensation of employees -672 -647 -1 042 -1 242 -3 603 Credit 965 992 990 1 069 4 016 Debit 1 637 1 639 2 031 2 311 7 618
Investment income -4 115 -18 969 -12 839 -13 914 -49 837 Credit 11 444 12 660 12 587 13 398 50 090 Debit 15 559 31 629 25 426 27 313 99 927
Direct investment -4 713 -10 917 -10 087 -9 784 -35 502 Credit 7 681 8 920 8 903 10 002 35 506 Debit 12 395 19 837 18 990 19 786 71 008
Income on equity and investment fund shares -4 225 -9 117 -8 670 -8 479 -30 491 Credit 6 799 8 204 8 258 8 863 32 124 Debit 11 024 17 320 16 928 17 343 62 615
Dividends and distributed profits -3 126 -9 564 -7 790 -4 997 -25 477 Credit 1 941 4 346 4 475 6 781 17 543 Debit 5 067 13 911 12 265 11 778 43 020
Direct investor in direct investment enterprises -3 126 -9 564 -7 790 -4 997 -25 477 Credit 1 941 4 346 4 475 6 781 17 543 Debit 5 067 13 911 12 265 11 778 43 020
Reinvested earnings -1 100 448 -880 -3 482 -5 014 Credit 4 858 3 858 3 783 2 083 14 581 Debit 5 958 3 410 4 663 5 565 19 595
Interest -488 -1 801 -1 418 -1 305 -5 011 Credit 882 716 645 1 138 3 382 Debit 1 370 2 517 2 063 2 443 8 393
16

Table 1.1
millions of US dollars
Q1 2019 Q2 2019 Q3 2019 Q4 2019 2019
Direct investor in direct investment enterprises 294 -75 -153 94 160 Credit 563 339 241 710 1 853 Debit 268 413 394 616 1 692
Direct investment enterprises in direct investor (reverse investment) -578 -1 011 -411 -666 -2 666 Credit 118 125 203 169 614 Debit 695 1 136 614 835 3 280
Between fellow enterprises -204 -715 -853 -732 -2 505 Credit 202 253 201 259 915 Debit 406 968 1 054 991 3 420
Portfolio investment -385 -8 990 -4 197 -4 303 -17 876 Credit 766 776 645 732 2 919 Debit 1 152 9 766 4 842 5 036 20 796
Investment income on equity and investment fund shares -266 -8 500 -3 667 -3 767 -16 200 Credit 39 73 34 37 182 Debit 305 8 573 3 701 3 804 16 382
Dividends on equity excluding investment fund shares -260 -8 499 -3 665 -3 758 -16 181 Credit 39 73 34 37 182 Debit 298 8 572 3 699 3 795 16 364
Investment income attributable to investment fund shareholders -6 -1 -2 -9 -19 Credit 0 0 0 0 0 Debit 6 1 2 9 19
Dividends -6 -1 -2 -9 -19 Credit 0 0 0 0 0 Debit 6 1 2 9 19
Interest -119 -490 -530 -536 -1 676 Credit 728 703 611 696 2 737 Debit 847 1 193 1 141 1 232 4 414
Short-term -2 15 21 14 49 Credit 2 16 23 17 59 Debit 4 1 2 2 10Long-term -118 -505 -551 -551 -1 725 Credit 725 687 587 679 2 679 Debit 843 1 192 1 139 1 230 4 404
Other investment 39 24 528 -634 -42 Credit 2 052 2 049 2 123 1 857 8 081 Debit 2 013 2 025 1 594 2 491 8 123
Interest 39 24 528 -634 -42 Credit 2 052 2 049 2 123 1 857 8 081 Debit 2 013 2 025 1 594 2 491 8 123
Reserve assets (Credit) 944 915 917 807 3 583Interest (credit) 944 915 917 807 3 583
Other primary income 26 28 12 23 89 Credit 31 33 30 31 125 Debit 5 5 18 7 36
Rent 26 28 12 23 89 Credit 31 33 30 31 125 Debit 5 5 18 7 36
Secondary income -2 687 -916 -1 723 -4 857 -10 182 Credit 2 683 4 152 3 831 3 963 14 629 Debit 5 370 5 068 5 554 8 820 24 811
General government -235 1 289 751 287 2 092 Credit 808 2 194 1 758 1 826 6 586 Debit 1 043 905 1 008 1 539 4 494
Current taxes on income, wealth, etc. (credit) 354 1 681 1 235 1 295 4 565Of which: payable by border, seasonal, and other short-term workers (credit) 79 86 88 94 346
Social contributions (credit) 133 145 148 160 586Of which: payable by border, seasonal, and other short-term workers (credit) 133 145 148 160 586
Social benefits (debit) 55 118 84 101 358Current international cooperation -619 -378 -492 -992 -2 481
Credit 0 0 0 0 0 Debit 619 378 492 992 2 481
Miscellaneous current transfers of general government -49 -41 -57 -73 -220 Credit 321 367 375 372 1 435 Debit 370 408 432 445 1 655
Financial corporations, nonfinancial corporations, households, and NPISHs -2 452 -2 205 -2 474 -5 144 -12 274 Credit 1 875 1 958 2 073 2 137 8 043 Debit 4 327 4 163 4 546 7 281 20 317
Personal transfers (Current transfers between resident and nonresident households) -1 546 -2 134 -2 480 -2 023 -8 182
Credit 1 525 1 619 1 603 1 670 6 417 Debit 3 070 3 753 4 083 3 693 14 599
17
Table 1.1
millions of US dollars
Q1 2019 Q2 2019 Q3 2019 Q4 2019 2019
Of which: Workers' remittances -1 270 -1 726 -2 334 -1 980 -7 310 Credit 510 550 566 584 2 210 Debit 1 780 2 277 2 900 2 564 9 521
Other current transfers -906 -71 7 -3 121 -4 092 Credit 350 339 470 467 1 626 Debit 1 256 410 464 3 588 5 718Current taxes on income, wealth, etc.(debit) 59 58 58 68 245Social benefits -2 -2 -2 -3 -9
Credit 0 0 0 0 0 Debit 2 2 2 3 9
Net nonlife insurance premiums -60 -125 -102 -94 -381 Credit 8 28 9 52 97 Debit 67 153 111 146 477Nonlife insurance claims -21 7 105 -33 58 Credit 45 61 190 139 434 Debit 66 54 85 171 376Current international cooperation -9 -14 6 -24 -41 Credit 1 1 11 0 13 Debit 9 15 5 24 54Miscellaneous current transfers -755 121 59 -2 899 -3 474 Credit 297 249 260 276 1 082 Debit 1 052 128 201 3 175 4 557
Of which: Current transfers to NPISHs 89 112 84 90 376 Credit 134 155 141 158 588 Debit 45 43 57 68 212
Capital account 15 -213 -97 -397 -692 Credit 103 67 90 84 345 Debit 88 280 188 481 1 037
Gross acquisitions (debit) / disposals (credit) of nonproduced nonfinancial assets -15 -17 -61 -7 -100 Credit 33 18 51 11 113 Debit 48 36 112 18 213
Capital transfers 30 -195 -36 -390 -591 Credit 70 49 39 73 232 Debit 40 244 76 463 823
General government -13 -214 -18 -418 -663 Credit 0 4 0 1 5 Debit 13 218 18 419 668
Debt forgiveness -4 -208 -4 -381 -598 Credit 0 0 0 0 0 Debit 4 208 4 381 598
Other capital transfers -8 -6 -13 -37 -65 Credit 0 4 0 1 5 Debit 8 10 14 38 70
Financial corporations, nonfinancial corporations, households, and NPISHs 43 19 -19 28 72 Credit 70 45 39 72 227 Debit 27 26 58 44 155
Debt forgiveness 11 8 6 16 41 Credit 11 8 6 16 41 Debit 0 0 0 0 0
Other capital transfers 32 11 -24 12 31 Credit 59 37 34 56 186 Debit 27 26 58 44 155
Net lending (+) / net borrowing (-) (balance from current and capital accounts) 33 570 9 794 10 788 9 764 63 915Financial account
Net lending (+) / net borrowing (-) (balance from financial account) 30 923 11 466 8 749 10 767 61 906Direct investment -1 215 -1 289 -6 532 -169 -9 205
Net acquisition of financial assets 9 691 4 742 2 428 5 717 22 578Equity and investment fund shares 7 218 6 718 3 781 4 120 21 838
Equity other than reinvestment of earnings 2 360 2 861 -1 2 038 7 257Direct investor in direct investment enterprises 2 350 2 855 -2 2 013 7 217Direct investment enterprises in direct investor (reverse investment) 8 4 1 4 16Between fellow enterprises 2 2 0 20 24
if ultimate controlling parent is resident 0 0 0 0 0if ultimate controlling parent is nonresident 0 0 0 0 0if ultimate controlling parent is unknown 2 2 0 20 24
Reinvestment of earnings 4 858 3 858 3 783 2 083 14 581 Of which: Investment fund shares or units -2 0 0 0 -2
Debt instruments 2 473 -1 976 -1 353 1 596 740Direct investor in direct investment enterprises 1 631 88 -869 -167 683Direct investment enterprises in direct investor (reverse investment) 612 -1 156 -273 221 -595Between fellow enterprises 230 -908 -212 1 543 652
18

Table 1.1
millions of US dollars
Q1 2019 Q2 2019 Q3 2019 Q4 2019 2019
if ultimate controlling parent is resident 1 18 6 35 61if ultimate controlling parent is nonresident 20 18 -324 304 19if ultimate controlling parent is unknown 209 -945 106 1 203 573
Of which: Debt securities 135 -1 355 -363 -45 -1 629Direct investor in direct investment enterprises 25 0 0 0 25Direct investment enterprises in direct investor (reverse investment) 0 0 0 0 0Between fellow enterprises 111 -1 355 -363 -46 -1 653
if ultimate controlling parent is resident 0 0 0 0 0if ultimate controlling parent is nonresident 24 16 -321 301 21if ultimate controlling parent is unknown 86 -1 371 -42 -347 -1 674
Net incurrence of liabilities 10 906 6 031 8 961 5 885 31 783Equity and investment fund shares 6 749 6 631 5 830 9 635 28 845
Equity other than reinvestment of earnings 791 3 221 1 167 4 070 9 249Direct investor in direct investment enterprises 868 3 225 2 451 4 312 10 855Direct investment enterprises in direct investor (reverse investment) -20 -4 -1 284 0 -1 308Between fellow enterprises -57 0 1 -242 -298
if ultimate controlling parent is resident -57 0 0 -242 -298if ultimate controlling parent is nonresident 0 0 0 0 0if ultimate controlling parent is unknown 0 0 0 0 0
Reinvestment of earnings 5 958 3 410 4 663 5 565 19 595 Of which: Investment fund shares or units -10 34 17 -59 -19
Debt instruments 4 158 -600 3 131 -3 750 2 939Direct investor in direct investment enterprises 125 1 408 470 -2 666 -663Direct investment enterprises in direct investor (reverse investment) 569 335 2 677 -1 210 2 372Between fellow enterprises 3 464 -2 343 -17 126 1 230
if ultimate controlling parent is resident -81 -15 89 -149 -156if ultimate controlling parent is nonresident 84 44 -709 855 275if ultimate controlling parent is unknown 3 460 -2 372 603 -580 1 111
Of which: Debt securities 0 18 0 15 33Direct investor in direct investment enterprises 0 18 0 15 33Direct investment enterprises in direct investor (reverse investment) 0 0 0 0 0Between fellow enterprises 0 0 0 0 0
if ultimate controlling parent is resident 0 0 0 0 0if ultimate controlling parent is nonresident 0 0 0 0 0if ultimate controlling parent is unknown 0 0 0 0 0
Portfolio investment -6 710 -8 403 3 134 -582 -12 561Net acquisition of financial assets 58 2 034 1 718 1 080 4 889
Equity and investment fund shares 52 -20 193 252 478Central bank 0 0 0 0 0Deposit-taking corporations, except central bank 14 -51 -26 37 -26General government 0 0 0 0 0Other sectors 38 31 219 216 504
Other financial corporations 77 -26 235 320 606Nonfinancial corporations, households, and NPISHs -39 57 -16 -105 -102
Equity securities other than investment fund shares 33 -106 83 59 70 Investment fund shares or units 19 86 110 193 408Debt securities 5 2 053 1 524 828 4 411
Central bank -17 5 -1 1 -12Short-term 2 3 2 0 8Long-term -19 3 -3 1 -19
Deposit-taking corporations, except central bank -433 2 330 1 410 -706 2 601Short-term 156 2 531 653 -2 071 1 269Long-term -589 -201 757 1 365 1 332
General government 0 -2 46 0 45Short-term 0 0 0 0 0Long-term 0 -2 46 0 45
Other sectors 455 -280 69 1 532 1 776Short-term -1 -23 -195 -309 -527Long-term 456 -257 264 1 841 2 304
Other financial corporations 88 -147 123 1 368 1 433Short-term 1 -22 -196 -307 -525Long-term 87 -125 319 1 676 1 957
Nonfinancial corporations, households, and NPISHs 367 -134 -53 164 344Short-term -2 -1 1 -1 -3Long-term 369 -133 -54 165 346
Net incurrence of liabilities 6 768 10 436 -1 416 1 662 17 450Equity and investment fund shares -245 81 -2 788 -1 373 -4 325
Deposit-taking corporations, except central bank 63 165 -451 -33 -257General government 0 0 0 0 0
19
Table 1.1
millions of US dollars
Q1 2019 Q2 2019 Q3 2019 Q4 2019 2019
Other sectors -308 -83 -2 337 -1 340 -4 068Other financial corporations -26 -28 29 78 53Nonfinancial corporations, households, and NPISHs -281 -55 -2 367 -1 418 -4 121
Equity securities other than investment fund shares -245 90 -2 799 -1 379 -4 333 Investment fund shares or units 0 -9 11 7 8Debt securities 7 013 10 355 1 372 3 034 21 774
Central bank 0 0 0 0 0Deposit-taking corporations, except central bank -75 7 -67 -87 -222
Short-term 22 25 -35 -69 -57Long-term -97 -18 -32 -18 -165
General government 7 225 10 229 1 396 3 404 22 253Short-term 0 0 0 0 0Long-term 7 225 10 229 1 396 3 404 22 253
Other sectors -136 119 43 -283 -257Short-term 0 0 0 0 0Long-term -136 119 43 -283 -257
Other financial corporations -44 -48 39 -215 -267Short-term 0 0 0 0 0Long-term -44 -48 39 -215 -267
Nonfinancial corporations, households, and NPISHs -93 166 5 -68 10Short-term 0 0 0 0 0Long-term -93 166 5 -68 10
Financial derivatives (other than reserves) and employee stock options 656 526 294 1 144 2 620Central bank 0 0 0 0 0Deposit-taking corporations, except central bank 537 520 319 1 124 2 501Other sectors 119 6 -25 20 120
Other financial corporations 32 6 -35 3 6Nonfinancial corporations, households, NPISHs 87 0 10 16 114
Financial derivatives (other than reserves) 656 526 294 1 144 2 620 Options 182 116 150 149 598 Forward-type contracts 473 410 144 995 2 022
Net acquisition of financial assets -2 319 -2 728 -3 129 -3 112 -11 288Central bank 0 0 0 0 0Deposit-taking corporations, except central bank -2 267 -2 670 -2 935 -2 986 -10 859Other sectors -52 -57 -194 -127 -429
Other financial corporations -4 -12 -111 -75 -202Nonfinancial corporations, households, NPISHs -48 -45 -82 -52 -226
Financial derivatives (other than reserves) -2 319 -2 728 -3 129 -3 112 -11 288 Options 128 51 207 128 515 Forward-type contracts -2 447 -2 779 -3 336 -3 241 -11 803
Net incurrence of liabilities -2 974 -3 254 -3 423 -4 256 -13 908Central bank 0 0 0 0 0Deposit-taking corporations, except central bank -2 804 -3 191 -3 255 -4 110 -13 359Other sectors -170 -63 -169 -146 -548
Other financial corporations -36 -18 -76 -78 -208Nonfinancial corporations, households, NPISHs -134 -45 -93 -68 -340
Financial derivatives -2 974 -3 254 -3 423 -4 256 -13 908 Options -54 -65 58 -21 -83 Forward-type contracts -2 920 -3 189 -3 481 -4 235 -13 825
Other investment 19 611 4 048 -4 077 -5 011 14 570Net acquisition of financial assets 16 802 4 548 -9 096 -4 750 7 504Net incurrence of liabilities -2 809 500 -5 019 261 -7 066
Other equity 14 6 6 288 314Net acquisition of financial assets 5 3 5 300 314Net incurrence of liabilities -9 -3 -1 12 0
Currency and deposits 20 627 9 614 -6 174 -10 696 13 372Net acquisition of financial assets 18 322 4 182 -8 006 -11 167 3 332
Central bank -2 2 4 -25 -21Short-term -2 2 4 -25 -21Long-term 0 0 0 0 0
Deposit-taking corporations, except central bank 10 280 7 679 -1 688 -6 783 9 488Of which: Interbank positions 8 683 7 024 -3 005 -9 236 3 465
Short-term 10 528 7 995 75 -4 373 14 225Long-term -248 -316 -1 762 -2 410 -4 737
General government 0 0 0 0 0Other sectors 8 044 -3 498 -6 321 -4 359 -6 135
Short-term 8 044 -3 498 -6 321 -4 359 -6 135Long-term 0 0 0 0 0
Other financial corporations 6 433 -768 -59 -3 724 1 882Short-term 6 433 -768 -59 -3 724 1 882Long-term 0 0 0 0 0
20

Table 1.1
millions of US dollars
Q1 2019 Q2 2019 Q3 2019 Q4 2019 2019
Nonfinancial corporations, households, NPISHs 1 611 -2730 -6263 -635 -8017Short-term 1 611 -2 730 -6 263 -635 -8 017Long-term 0 0 0 0 0
Net incurrence of liabilities -2 306 -5 432 -1 832 -470 -10 040Central bank 34 -108 -282 -273 -630
Short-term 34 -108 -282 -273 -630Long-term 0 0 0 0 0
Deposit-taking corporations, except central bank -2 372 -5 347 -1 795 -23 -9 537Of which: Interbank positions -3 825 -1 112 -769 462 -5 243
Short-term -1 167 -1 130 -515 1 474 -1 338Long-term -1 205 -4 217 -1 280 -1 497 -8 199
General government 0 0 0 0 0Other sectors 33 23 246 -175 128
Short-term 33 23 246 -175 128Long-term 0 0 0 0 0
Other financial corporations 33 23 246 -175 128Short-term 33 23 246 -175 128Long-term 0 0 0 0 0
Loans 746 2 163 -5 133 4 102 1 879Net acquisition of financial assets 660 -631 -3 077 49 -2 999
Central bank 0 0 0 0 0Deposit-taking corporations, except central bank 257 -1 030 -379 -1 100 -2 252
Short-term 332 1 083 399 803 2 617Long-term -75 -2 114 -778 -1 903 -4 869
General government 462 291 -1 471 679 -38Credit and loans with the IMF (other than reserves) 0 0 0 0 0Other short-term 0 0 0 0 0Other long-term 462 291 -1 471 679 -38
Other sectors -60 108 -1 227 470 -710Short-term 26 -622 197 295 -105Long-term -85 730 -1 424 175 -605
Other financial corporations 113 -204 -380 734 263Short-term 40 -435 -134 203 -326Long-term 74 231 -246 531 590
Nonfinancial corporations, households, and NPISHs -173 312 -847 -264 -973Short-term -14 -187 331 91 221Long-term -159 499 -1 178 -356 -1 194
Net incurrence of liabilities -86 -2 794 2 056 -4 053 -4 877Central bank 2 134 -2 667 600 1 944 2 011
Credit and loans with the IMF 0 0 0 0 0Other short-term 2 134 -2 667 600 1 944 2 011Other long-term 0 0 0 0 0
Deposit-taking corporations, except central bank -137 -491 33 78 -517Short-term -137 -491 33 78 -517Long-term 0 0 0 0 0
General government -13 -97 -10 -94 -213Credit and loans with the IMF 0 0 0 0 0Other short-term 0 0 0 0 0Long-term -13 -97 -10 -94 -213
Other sectors -2 070 460 1 432 -5 981 -6 158Short-term -17 21 4 -81 -73Long-term -2 052 439 1 428 -5 900 -6 085
Other financial corporations -119 -24 47 76 -19Short-term -51 -32 130 249 296Long-term -67 8 -83 -172 -315
Nonfinancial corporations, households, and NPISHs -1 951 484 1 385 -6 058 -6 139Short-term 34 53 -126 -330 -369Long-term -1 985 431 1 511 -5 727 -5 771
Insurance, pension, and standardized guarantee schemes 42 -110 -49 -142 -259Net acquisition of financial assets 85 -78 80 -208 -120
Central bank 0 0 0 0 0Deposit-taking corporations, except central bank 0 0 0 0 0General government 0 0 0 0 0Other sectors 85 -78 80 -208 -120
Other financial corporations 85 -78 80 -208 -120Nonfinancial corporations, households, NPISHs 0 0 0 0 0
Nonlife insurance technical reserves 76 -89 72 -219 -160Life insurance and annuity entitlements 9 12 8 11 40
Net incurrence of liabilities 43 32 129 -66 139Central bank 0 0 0 0 0Other sectors 43 32 129 -66 139
Other financial corporations 43 32 129 -66 139Nonfinancial corporations, households, NPISHs 0 0 0 0 0
21

Table 1.1
millions of US dollars
Q1 2019 Q2 2019 Q3 2019 Q4 2019 2019
Nonlife insurance technical reserves 44 31 125 -65 134Life insurance and annuity entitlements -1 2 4 0 4
Trade credit and advances -2 647 -2 813 1 352 4 607 499Net acquisition of financial assets -2 669 45 1 856 7 504 6 735
General government 0 0 0 0 0Short-term 0 0 0 0 0Long-term 0 0 0 0 0
Other sectors -2 669 45 1 856 7 504 6 735Short-term -2 669 45 1 856 7 504 6 735Long-term 0 0 0 0 0
Nonfinancial corporations, households, and NPISHs -2 669 45 1 856 7 504 6 735Short-term -2 669 45 1 856 7 504 6 735Long-term 0 0 0 0 0
Net incurrence of liabilities -23 2 858 504 2 897 6 237General government 0 0 0 0 0Other sectors -23 2 858 504 2 897 6 237
Short-term -23 2 858 504 2 897 6 237Long-term 0 0 0 0 0
Nonfinancial corporations, households, and NPISHs -23 2 858 504 2 897 6 237Short-term -23 2 858 504 2 897 6 237Long-term 0 0 0 0 0
Other accounts receivable/payable 828 -4 813 5 918 -3 172 -1 238Net acquisition of financial assets 400 1 026 45 -1 229 242
Central bank 0 0 1 -2 0Short-term 0 0 1 -2 0Long-term 0 0 0 0 0
Deposit-taking corporations, except central bank 666 81 503 -1 517 -267Short-term 831 3 597 2 938 1 871 9 237Long-term -165 -3 517 -2 435 -3 388 -9 505
General government -333 881 -528 177 197Short-term -333 881 -528 177 197Long-term 0 0 0 0 0
Other sectors 67 64 69 113 313Short-term 67 64 69 113 313Long-term 0 0 0 0 0
Other financial corporations -8 10 7 39 48Short-term -8 10 7 39 48Long-term 0 0 0 0 0
Nonfinancial corporations, households, NPISHs 75 54 62 74 265Short-term 75 54 62 74 265Long-term 0 0 0 0 0
Net incurrence of liabilities -428 5 839 -5 873 1 943 1 480Central bank 0 0 0 0 0Deposit-taking corporations, except central bank 1 580 1 251 -2 487 627 970
Short-term 1 689 2 258 -1 487 1 236 3 696Long-term -109 -1 007 -1 001 -609 -2 726
General government 5 -3 -10 5 -3Short-term 5 -3 -10 5 -3Long-term 0 0 0 0 0
Other sectors -2 013 4 591 -3 376 1 311 513Short-term -2 013 4 591 -3 376 1 310 512Long-term 0 0 0 1 1
Other financial corporations -203 -41 -12 -114 -369Short-term -203 -41 -12 -115 -370Long-term 0 0 0 1 1
Nonfinancial corporations, households, NPISHs -1 810 4 632 -3 365 1 425 882Short-term -1 810 4 632 -3 365 1 425 882Long-term 0 0 0 0 0
Special drawing rights (Net incurrence of liabilities) 0 0 -2 -2 -4Reserve assets 18 582 16 585 15 930 15 385 66 481
Monetary gold 0 0 0 0 0Special drawing rights 5 5 4 4 18Reserve position in the IMF 293 309 304 -38 869Other reserve assets 18 284 16 270 15 621 15 419 65 594
Currency and deposits -8 674 7 488 -2 925 31 113 27 002Claims on monetary authorities -6 314 5 120 -251 24 353 22 908Claims on other entities -2 361 2 367 -2 673 6 760 4 094
Securities 22 662 10 644 19 102 -17 418 34 989Debt securities 22 662 10 644 19 102 -17 418 34 989
Short-term 20 102 -6 381 12 243 -18 566 7 398Long-term 2 560 17 025 6 858 1 148 27 591
Other claims 4 296 -1 861 -556 1 724 3 603Net errors and omissions -2 647 1 673 -2 040 1 004 -2 010
22
Tab
le 1
.2
Mai
n C
om
po
nen
ts
mill
ions
of U
S d
olla
rs
2013
2014
2015
2016
2017
Q1
2018
Q2
2018
Q3
2018
Q4
2018
2018
Q1
2019
Q2
201
9Q
3 20
19Q
4 20
1920
19
Cu
rren
t ac
cou
nt
33 4
2857
513
67 7
7724
469
32 4
3029
859
17 9
8627
505
38 3
8211
3 73
333
555
10 0
0610
886
10 1
6064
607
Go
od
s an
d s
ervi
ces
122
307
133
653
111
246
66 2
5683
486
37 4
5937
65
439
022
50 2
9716
4 43
241
003
30 5
1026
477
30 1
5012
8 14
0E
xpor
ts59
1 95
856
2 55
139
3 03
533
2 35
341
0 73
411
5 49
112
5 43
912
7 84
913
9 08
150
7 86
111
6 43
111
7 20
912
0 39
012
7 46
348
1 49
3Im
port
s46
9 65
142
8 89
828
1 78
926
6 09
732
7 24
878
032
87 7
8688
827
88 7
8434
3 42
975
428
86 6
9993
912
97 3
1335
3 35
2G
oods
180
566
188
931
148
398
90 2
1511
4 71
944
084
45 3
6747
754
57 2
2419
4 42
946
975
39 4
6737
987
39 9
0616
4 33
5E
xpor
ts52
1 83
549
6 80
634
1 41
928
1 70
935
3 10
210
1 52
910
8 77
511
0 43
812
2 38
844
3 13
010
2 62
110
1 43
410
3 36
311
1 26
941
8 68
7Im
port
s34
1 26
930
7 87
519
3 02
119
1 49
423
8 38
457
446
63 4
0862
684
65 1
6424
8 70
155
647
61 9
6765
376
71 3
6325
4 35
2S
ervi
ces
-58
259
-55
278
-37
152
-23
959
-31
233
-6 6
24-7
713
-8 7
33-6
927
-29
997
-5 9
71-8
957
-11
510
-9 7
56-3
6 19
4E
xpor
ts70
123
65 7
4451
616
50 6
4457
631
13 9
6216
665
17 4
1116
693
64 7
3113
809
15 7
7517
027
16 1
9462
806
Impo
rts
128
382
121
022
88 7
6874
602
88 8
6420
587
24 3
7826
143
23 6
2094
728
19
781
24 7
3228
537
25 9
5099
000
Pri
mar
y in
com
e-7
9 60
4-6
7 96
2-3
7 74
9-3
5 49
6-4
2 05
3-5
137
-18
235
-9 2
40-9
183
-41
794
-4 7
62-1
9 58
8-1
3 86
9-1
5 13
3-5
3 35
1R
ecei
vabl
e42
177
47 1
7337
267
40 5
1346
578
13 8
5810
790
15 1
5513
018
52 8
2212
440
13 6
8513
607
14 4
9854
230
Pay
abl e
121
781
115
135
75 0
1676
009
88 6
3118
995
29 0
2524
395
22 2
0194
616
17
201
33 2
7327
476
29 6
3110
7 58
1C
ompe
nsat
ion
of e
mpl
oyee
s-1
3 17
0-1
0 07
4-5
104
-1 8
13-2
278
-778
-498
-863
-1 1
83-3
323
-672
-647
-1 0
42-1
242
-3 6
03R
ecei
vabl
e4
256
4 13
93
502
3 65
94
089
989
1 09
698
81
019
4 09
196
599
299
01
069
4 0
16P
ayab
l e17
426
14 2
138
606
5 47
26
367
1 76
71
594
1 85
12
203
7 41
51
637
1 63
92
031
2 31
17
618
Inve
stm
ent i
ncom
e-6
6 51
6-5
8 01
8-3
2 66
2-3
3 74
4-3
9 84
5-4
380
-17
753
-8 3
97-8
020
-38
550
-4 1
15-1
8 96
9-1
2 83
9-1
3 91
4-4
9 83
7R
ecei
vabl
e37
738
42 8
3733
652
36 7
4942
381
12 8
439
663
14 1
3411
968
48 6
0711
444
12 6
6012
587
13 3
9850
090
Pay
abl e
104
254
100
856
66 3
1470
493
82 2
2517
223
27 4
1622
531
19 9
8887
158
15
559
31 6
2925
426
27 3
1399
927
Ren
t81
130
1760
7022
1621
2179
2628
1223
89R
ecei
vabl
e18
219
611
210
510
927
3134
3112
331
3330
3112
5P
ayab
l e10
266
9645
395
1513
1044
55
187
36S
eco
nd
ary
inco
me
-9 2
74-8
178
-5 7
20-6
291
-9 0
03-2
463
-1 4
33-2
276
-2 7
32-8
904
-2 6
87-9
16-1
723
-4 8
57-1
0 18
2R
ecei
vabl
e17
332
17 6
4310
023
8 64
210
564
2 22
43
859
3 24
63
021
12 3
502
683
4 1
523
831
3 96
314
629
Pay
abl e
26 6
0725
821
15 7
4314
933
19 5
674
687
5 29
25
522
5 75
321
254
5 37
05
068
5 55
48
820
24 8
11
Cap
ital
acc
ou
nt
-395
-42
005
-309
-764
-192
-239
-203
-9-6
54-1
104
15-2
13-9
7-3
97-6
92G
ross
acq
uis
itio
ns
/ dis
po
sals
of
no
np
rod
uce
d
no
nfi
nan
cial
ass
ets
-146
-284
-46
-14
-39
-3-3
-3-5
7-6
6-1
5-1
7-6
1-7
-100
Cap
ital
tra
nsf
ers
-249
-41
721
-263
-750
-154
-236
-199
-6-5
97-1
038
30-1
95-3
6-3
90-5
91R
ecei
vabl
e38
642
629
91
020
491
3544
4410
522
870
4939
7323
2P
ayab
l e63
542
147
562
1 77
064
527
124
350
702
1 26
640
244
7646
382
3N
et le
nd
ing
(+
) / n
et b
orr
ow
ing
(-)
(B
alan
ce f
rom
cu
rren
t an
d c
apit
al a
cco
un
ts)
33 0
3315
508
67 4
6823
705
32 2
3729
621
17 7
8427
497
37 7
2811
2 62
933
570
9 79
410
788
9 76
463
915
Bal
ance
of
Pay
men
ts o
f th
e R
uss
ian
Fed
erat
ion
in 2
013-
2019
23
Tab
le 1
.2
mill
ions
of U
S d
olla
rs
2013
2014
2015
2016
2017
Q1
2018
Q2
2018
Q3
2018
Q4
2018
2018
Q1
2019
Q2
201
9Q
3 20
19Q
4 20
1920
19
Net
len
din
g (
+)
/ net
bo
rro
win
g (
-) (
Bal
ance
fro
m
fin
anci
al a
cco
un
t)24
136
23 4
4670
328
18 3
0534
802
32 0
7121
036
29 7
6733
183
116
057
30 9
2311
466
8 74
910
767
61 9
06
Dir
ect
inve
stm
ent
17 2
8835
051
15 2
32-1
0 22
58
200
5 60
72
501
4 13
010
354
22 5
92-1
215
-1 2
89-6
532
-169
-9 2
05N
et a
cqui
sitio
n of
fina
ncia
l ass
ets
86 5
0757
082
22 0
8522
314
36 7
5713
398
4 85
91
260
11 8
6031
377
9 69
14
742
2 42
85
717
22 5
78N
et in
curr
ence
of l
iabi
litie
s69
219
22 0
316
853
32 5
3928
557
7 79
12
358
-2 8
701
506
8 78
510
906
6 03
18
961
5 88
531
783
Po
rtfo
lio in
vest
men
t11
012
39 9
4326
423
-2 3
61-7
983
-5 8
098
771
3 61
91
012
7 59
3-6
710
-8 4
033
134
-582
-12
561
Net
acq
uisi
tion
of fi
nanc
ial a
sset
s11
759
16 7
4013
551
658
1 25
8-2
082
336
791
-872
-1 8
2758
2 03
41
718
1 0
804
889
Net
incu
rren
ce o
f lia
bilit
ies
748
-23
203
-12
872
3 02
09
241
3 72
7-8
435
-2 8
28-1
884
-9 4
216
768
10 4
36-1
416
1 66
217
450
Fin
anci
al d
eriv
ativ
es34
65
256
7 12
2-1
836
224
0-7
22-8
4058
8-7
3465
652
629
41
144
2 62
0N
et a
cqui
sitio
n of
fina
ncia
l ass
ets
-8 4
88-1
6 52
4-2
0 76
5-1
2 84
3-1
3 78
5-2
888
-3 3
97-2
887
-2 5
36-1
1 7
08-2
319
-2 7
28-3
129
-3 1
12-1
1 28
8N
et in
curr
ence
of l
iabi
litie
s-8
834
-21
780
-27
887
-12
825
-14
147
-3 1
28-2
675
-2 0
48-3
124
-10
975
-2 9
74-3
254
-3 4
23-4
256
-13
908
Oth
er in
vest
men
t17
567
50 7
4319
847
22 6
6511
588
12 7
00-8
1617
904
18 6
1648
404
19 6
11
4 04
8-4
077
-5 0
1114
570
Net
acq
uisi
tion
of fi
nanc
ial a
sset
s80
824
24 0
09-1
8 40
8-5
447
-9 3
699
031
-7 5
059
910
12 2
5623
693
16 8
024
548
-9 0
96-4
750
7 50
4O
ther
equ
ity70
621
498
294
767
6-1
822
326
549
45
35
300
314
For
eign
cur
renc
y-5
6541
814
-19
340
6 48
717
070
4 47
21
461
2 87
52
566
11 3
7334
4-1
452
-1 4
6687
0-1
705
Cur
rent
acc
ount
s an
d de
posi
ts
17 0
95-1
8 79
7-3
040
-18
677
-9 1
354
954
-7 9
421
620
7 15
65
787
17 9
78
5 63
5-6
539
-12
037
5 03
7Lo
ans
21 2
31-2
0 18
0-1
163
6 00
1-9
426
-720
-1 4
716
818
1 20
55
832
660
-631
-3 0
7749
-2 9
99In
sura
nce,
pen
sion
, and
sta
ndar
dize
d gu
aran
tee
sche
mes
59
51
477
-313
297
-259
145
-44
-198
-239
-336
85-7
880
-208
-120
Tra
de c
redi
t and
adv
ance
s 7
644
6 36
62
590
-4 6
99-6
153
506
-3 5
72-2
085
1 12
2-4
029
-2 9
0255
1 62
89
474
8 25
5In
debt
edne
ss o
n su
pplie
s ac
cord
ing
to
inte
rgov
ernm
enta
l agr
eem
ents
1 07
0-1
315
461
989
-1 4
2586
311
266
156
62
201
233
-10
228
-1 9
70-1
519
Non
-cla
ssifi
ed tr
ansa
ctio
ns1
26 5
048
607
1 53
154
120
419
3061
4215
221
2536
8216
4O
ther
acc
ount
s re
ceiv
able
6 54
45
823
-115
2 66
7-9
20-1
206
3 91
5-6
4-4
272
218
379
1 00
19
-1 3
1178
Net
incu
rren
ce o
f lia
bilit
ies
63 2
57-2
6 73
3-3
8 25
4-2
8 11
2-2
0 95
6-3
669
-6 6
89-7
994
-6 3
60-2
4 71
1-2
809
500
-5 0
1926
1-7
066
Oth
er e
quit y
-3-2
2530
81
1-4
-2-4
-9-3
-112
-0D
omes
tic c
urre
ncy
1 82
9-1
021
-182
-191
-138
113
427
-86
254
709
38-1
04-2
75-2
65-6
07C
urre
nt a
ccou
nts
and
depo
sits
16
178
-20
121
-32
554
-16
367
-13
563
352
-8 1
55-1
81-6
278
-14
262
-2 3
44-5
328
-1 5
57-2
05-9
433
Loan
s 43
594
-8 8
83-4
816
-13
856
-7 7
53-3
076
-5 7
99-3
516
-312
-12
703
-86
-2 7
942
056
-4 0
53-4
877
Insu
ranc
e, p
ensi
on, a
nd s
tand
ardi
zed
guar
ante
e sc
hem
es
164
707
-42
-130
-25
102
3928
-66
103
4332
129
-66
139
Tra
de c
redi
t and
adv
ance
s 18
335
4-5
9911
192
8917
021
-290
-10
-23
2 85
850
42
897
6 23
7O
ther
acc
ount
s pa
yabl
e1
311
2 23
3-8
72
290
416
-1 2
516
626
-4 2
5733
31
451
-428
5 83
9-5
873
1 94
31
480
Spe
cial
dra
win
g rig
hts
1-1
-02
71
20
15
00
-2-2
-4
Res
erve
ass
ets
-22
077
-107
547
1 70
48
244
22 6
3619
333
11 3
014
953
2 61
438
202
18 5
8216
585
15 9
3015
385
66 4
81N
et e
rro
rs a
nd
om
issi
on
s-8
898
7 93
82
859
-5 4
002
565
2 45
13
252
2 27
0-4
545
3 42
8-2
647
1 67
3-2
040
1 00
4-2
010
1 In
clud
es fi
ctiti
ous
tran
sact
ions
rel
ated
to fo
reig
n tr
ade
in g
ood
s an
d se
rvic
es, s
ecur
ities
trad
ing,
lend
ing
to n
onre
side
nts
and
fict
itiou
s tr
ansa
ctio
ns w
ith m
oney
tran
sfer
s to
res
iden
ts' a
ccou
nts
abro
ad, w
hich
pur
pose
is c
ross
-bor
der
mon
ey tr
ansf
er.
24
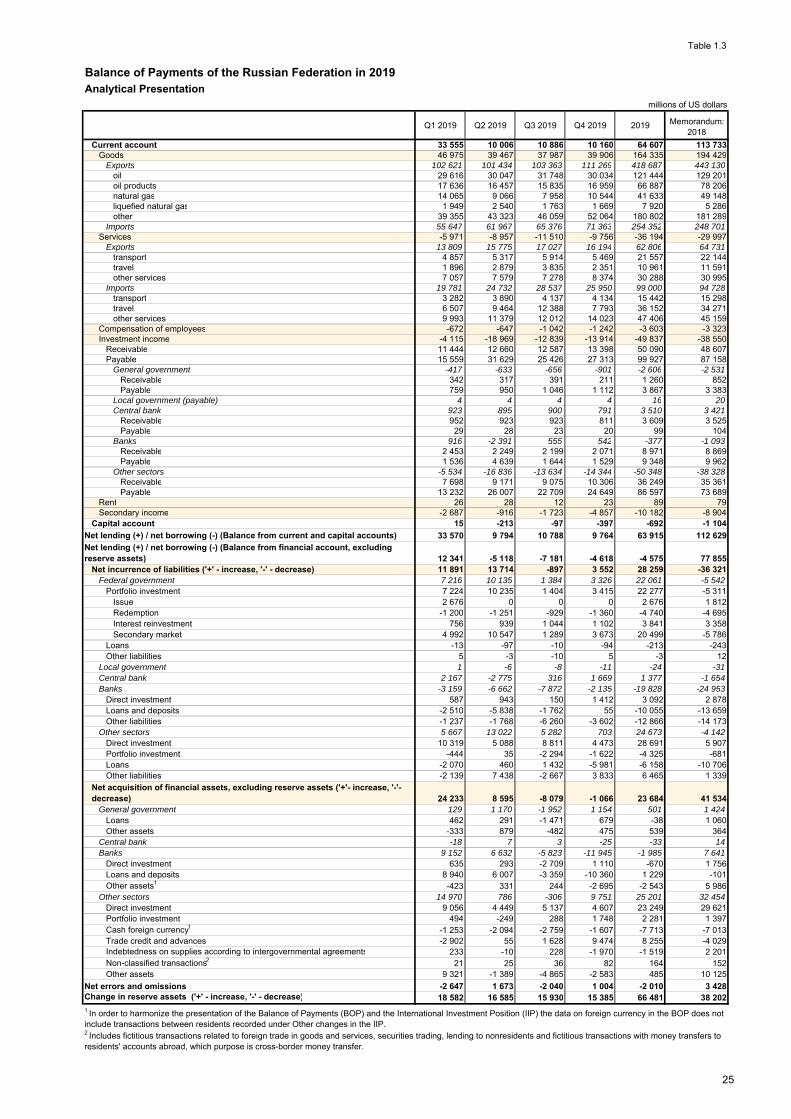
Table 1.3
Balance of Payments of the Russian Federation in 2019Analytical Presentation
millions of US dollars
Q1 2019 Q2 2019 Q3 2019 Q4 2019 2019 Memorandum: 2018
Current account 33 555 10 006 10 886 10 160 64 607 113 733Goods 46 975 39 467 37 987 39 906 164 335 194 429
Exports 102 621 101 434 103 363 111 269 418 687 443 130oil 29 616 30 047 31 748 30 034 121 444 129 201oil products 17 636 16 457 15 835 16 959 66 887 78 206natural gas 14 065 9 066 7 958 10 544 41 633 49 148liquefied natural gas 1 949 2 540 1 763 1 669 7 920 5 286other 39 355 43 323 46 059 52 064 180 802 181 289
Imports 55 647 61 967 65 376 71 363 254 352 248 701Services -5 971 -8 957 -11 510 -9 756 -36 194 -29 997
Exports 13 809 15 775 17 027 16 194 62 806 64 731transport 4 857 5 317 5 914 5 469 21 557 22 144travel 1 896 2 879 3 835 2 351 10 961 11 591other services 7 057 7 579 7 278 8 374 30 288 30 995
Imports 19 781 24 732 28 537 25 950 99 000 94 728transport 3 282 3 890 4 137 4 134 15 442 15 298travel 6 507 9 464 12 388 7 793 36 152 34 271other services 9 993 11 379 12 012 14 023 47 406 45 159
Compensation of employees -672 -647 -1 042 -1 242 -3 603 -3 323Investment income -4 115 -18 969 -12 839 -13 914 -49 837 -38 550
Receivable 11 444 12 660 12 587 13 398 50 090 48 607Payable 15 559 31 629 25 426 27 313 99 927 87 158
General government -417 -633 -656 -901 -2 606 -2 531Receivable 342 317 391 211 1 260 852Payable 759 950 1 046 1 112 3 867 3 383
Local government (payable) 4 4 4 4 16 20Central bank 923 895 900 791 3 510 3 421
Receivable 952 923 923 811 3 609 3 525Payable 29 28 23 20 99 104
Banks 916 -2 391 555 542 -377 -1 093Receivable 2 453 2 249 2 199 2 071 8 971 8 869Payable 1 536 4 639 1 644 1 529 9 348 9 962
Other sectors -5 534 -16 836 -13 634 -14 344 -50 348 -38 328Receivable 7 698 9 171 9 075 10 306 36 249 35 361Payable 13 232 26 007 22 709 24 649 86 597 73 689
Rent 26 28 12 23 89 79Secondary income -2 687 -916 -1 723 -4 857 -10 182 -8 904
Capital account 15 -213 -97 -397 -692 -1 104
Net lending (+) / net borrowing (-) (Balance from current and capital accounts) 33 570 9 794 10 788 9 764 63 915 112 629
Net lending (+) / net borrowing (-) (Balance from financial account, excluding reserve assets) 12 341 -5 118 -7 181 -4 618 -4 575 77 855
Net incurrence of liabilities ('+' - increase, '-' - decrease) 11 891 13 714 -897 3 552 28 259 -36 321Federal government 7 216 10 135 1 384 3 326 22 061 -5 542
Portfolio investment 7 224 10 235 1 404 3 415 22 277 -5 311Issue 2 676 0 0 0 2 676 1 812Redemption -1 200 -1 251 -929 -1 360 -4 740 -4 695Interest reinvestment 756 939 1 044 1 102 3 841 3 358Secondary market 4 992 10 547 1 289 3 673 20 499 -5 786
Loans -13 -97 -10 -94 -213 -243Other liabilities 5 -3 -10 5 -3 12
Local government 1 -6 -8 -11 -24 -31Central bank 2 167 -2 775 316 1 669 1 377 -1 654Banks -3 159 -6 662 -7 872 -2 135 -19 828 -24 953
Direct investment 587 943 150 1 412 3 092 2 878Loans and deposits -2 510 -5 838 -1 762 55 -10 055 -13 659Other liabilities -1 237 -1 768 -6 260 -3 602 -12 866 -14 173
Other sectors 5 667 13 022 5 282 703 24 673 -4 142Direct investment 10 319 5 088 8 811 4 473 28 691 5 907Portfolio investment -444 35 -2 294 -1 622 -4 325 -681Loans -2 070 460 1 432 -5 981 -6 158 -10 706Other liabilities -2 139 7 438 -2 667 3 833 6 465 1 339
Net acquisition of financial assets, excluding reserve assets ('+'- increase, '-'- decrease) 24 233 8 595 -8 079 -1 066 23 684 41 534
General government 129 1 170 -1 952 1 154 501 1 424Loans 462 291 -1 471 679 -38 1 060Other assets -333 879 -482 475 539 364
Central bank -18 7 3 -25 -33 14Banks 9 152 6 632 -5 823 -11 945 -1 985 7 641
Direct investment 635 293 -2 709 1 110 -670 1 756Loans and deposits 8 940 6 007 -3 359 -10 360 1 229 -101Other assets1 -423 331 244 -2 695 -2 543 5 986
Other sectors 14 970 786 -306 9 751 25 201 32 454Direct investment 9 056 4 449 5 137 4 607 23 249 29 621Portfolio investment 494 -249 288 1 748 2 281 1 397Cash foreign currency1 -1 253 -2 094 -2 759 -1 607 -7 713 -7 013Trade credit and advances -2 902 55 1 628 9 474 8 255 -4 029Indebtedness on supplies according to intergovernmental agreements 233 -10 228 -1 970 -1 519 2 201Non-classified transactions2 21 25 36 82 164 152Other assets 9 321 -1 389 -4 865 -2 583 485 10 125
Net errors and omissions -2 647 1 673 -2 040 1 004 -2 010 3 428Change in reserve assets ('+' - increase, '-' - decrease) 18 582 16 585 15 930 15 385 66 481 38 2021 In order to harmonize the presentation of the Balance of Payments (BOP) and the International Investment Position (IIP) the data on foreign currency in the BOP does not include transactions between residents recorded under Other changes in the IIP.2 Includes fictitious transactions related to foreign trade in goods and services, securities trading, lending to nonresidents and fictitious transactions with money transfers to residents' accounts abroad, which purpose is cross-border money transfer.
25

Tab
le 1
.4
Fin
anci
al T
ran
sact
ion
s o
f P
riva
te S
ecto
r in
201
3-20
19
(Bas
ed o
n t
he
Bal
ance
of
Pay
men
ts, F
low
s D
ata)
billi
ons
of U
S d
olla
rs
Fin
anci
al
tran
sact
ions
(n
et le
ndin
g (+
) / n
et
borr
owin
g (-
))
(3-4
)
Net
acq
uisi
tion
of
finan
cial
ass
ets
Net
incu
rren
ce o
f lia
bilit
ies
Fin
anci
al
tran
sact
ions
(n
et le
ndin
g (+
) / n
et
borr
owin
g (-
))
(6-7
-8)
Net
acq
uisi
tion
of
finan
cial
ass
ets1
Net
incu
rren
ce
of li
abili
ties
"Net
err
ors
and
omis
sion
s" o
f ba
lanc
e of
paym
ents
2
12
34
56
78
2013
60,3
17,3
37,7
20,4
43,0
128,
394
,2-8
,9
2014
152,
186
,048
,5-3
7,5
66,1
74,0
-0,1
7,9
2015
57,1
34,2
-25,
8-6
0,0
22,9
19,3
-6,5
2,9
2016
18,5
-1,1
-28,
3-2
7,1
19,6
31,1
16,9
-5,4
2017
24,3
23,3
-4,4
-27,
71,
017
,614
,02,
6
2018
63,6
32,6
7,6
-25,
031
,030
,3-4
,13,
4
2019
21,9
17,8
-2,0
-19,
84,
126
,724
,7-2
,0
Q1
2017
15,3
17,6
13,6
-3,9
-2,3
-5,0
-3,6
0,9
Q2
2017
-2,2
9,2
-2,5
-11,
7-1
1,4
5,7
13,0
4,1
Q3
2017
0,2
-8,5
-16,
3-7
,88,
711
,03,
0-0
,7
Q4
2017
11,0
5,0
0,8
-4,2
6,0
5,9
1,7
-1,7
Q1
2018
16,1
2,8
0,3
-2,5
13,3
16,7
1,0
2,5
Q2
2018
-4,7
3,9
-5,7
-9,6
-8,6
-1,3
4,0
3,3
Q3
2018
19,0
12,3
8,6
-3,8
6,6
0,5
-8,4
2,3
Q4
2018
33,3
13,7
4,5
-9,2
19,6
14,3
-0,7
-4,5
Q1
2019
24,0
12,3
9,2
-3,2
11,7
14,7
5,7
-2,6
Q2
2019
-0,6
13,3
6,6
-6,7
-13,
90,
813
,01,
7
Q3
2019
-1,7
2,0
-5,8
-7,9
-3,8
-0,5
5,3
-2,0
Q4
2019
0,2
-9,8
-11,
9-2
,110
,011
,70,
71,
0
1 T
he in
debt
edne
ss o
n su
pplie
s of
goo
ds a
ccor
ding
to in
terg
over
nmen
tal a
gree
men
ts is
exc
lude
d.2
The
item
"N
et e
rror
s an
d om
issi
ons"
ent
irely
rel
ates
to th
e ot
her
sect
ors.
It c
ould
be
expl
aine
d by
the
fact
tha
t mos
t not
icea
ble
diffi
culti
es a
rise
upon
the
reco
rdin
g of
fina
ncia
l tr
ansa
ctio
ns u
nder
take
n by
thes
e se
ctor
s in
the
bala
nce
of p
aym
ents
.
Fin
anci
al
tran
sact
ions
of
priv
ate
sect
or (
net l
endi
ng (
+)
/ ne
t bor
row
ing
(-))
(2+
5)
Ban
ksO
ther
sec
tors
26
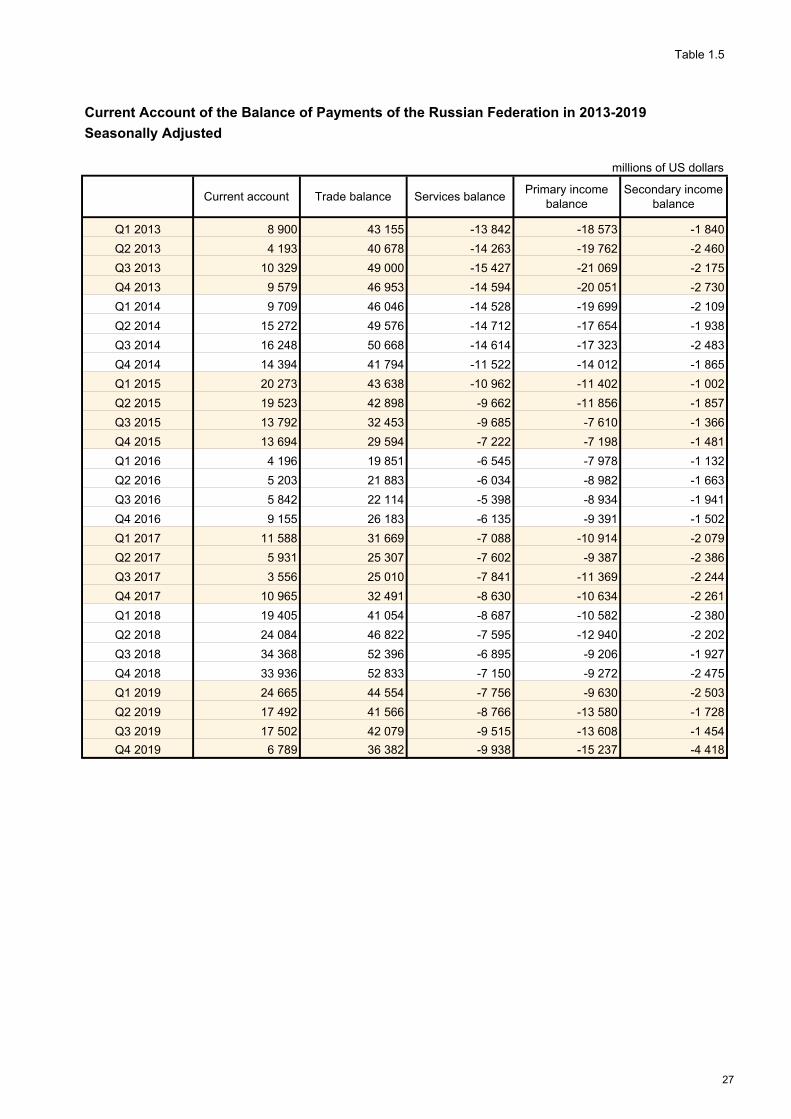
Table 1.5
Current Account of the Balance of Payments of the Russian Federation in 2013-2019
Seasonally Adjusted
millions of US dollars
Current account Trade balance Services balancePrimary income
balanceSecondary income
balance
Q1 2013 8 900 43 155 -13 842 -18 573 -1 840
Q2 2013 4 193 40 678 -14 263 -19 762 -2 460
Q3 2013 10 329 49 000 -15 427 -21 069 -2 175
Q4 2013 9 579 46 953 -14 594 -20 051 -2 730
Q1 2014 9 709 46 046 -14 528 -19 699 -2 109
Q2 2014 15 272 49 576 -14 712 -17 654 -1 938
Q3 2014 16 248 50 668 -14 614 -17 323 -2 483
Q4 2014 14 394 41 794 -11 522 -14 012 -1 865
Q1 2015 20 273 43 638 -10 962 -11 402 -1 002
Q2 2015 19 523 42 898 -9 662 -11 856 -1 857
Q3 2015 13 792 32 453 -9 685 -7 610 -1 366
Q4 2015 13 694 29 594 -7 222 -7 198 -1 481
Q1 2016 4 196 19 851 -6 545 -7 978 -1 132
Q2 2016 5 203 21 883 -6 034 -8 982 -1 663
Q3 2016 5 842 22 114 -5 398 -8 934 -1 941
Q4 2016 9 155 26 183 -6 135 -9 391 -1 502
Q1 2017 11 588 31 669 -7 088 -10 914 -2 079
Q2 2017 5 931 25 307 -7 602 -9 387 -2 386
Q3 2017 3 556 25 010 -7 841 -11 369 -2 244
Q4 2017 10 965 32 491 -8 630 -10 634 -2 261
Q1 2018 19 405 41 054 -8 687 -10 582 -2 380
Q2 2018 24 084 46 822 -7 595 -12 940 -2 202
Q3 2018 34 368 52 396 -6 895 -9 206 -1 927
Q4 2018 33 936 52 833 -7 150 -9 272 -2 475
Q1 2019 24 665 44 554 -7 756 -9 630 -2 503
Q2 2019 17 492 41 566 -8 766 -13 580 -1 728
Q3 2019 17 502 42 079 -9 515 -13 608 -1 454
Q4 2019 6 789 36 382 -9 938 -15 237 -4 418
27
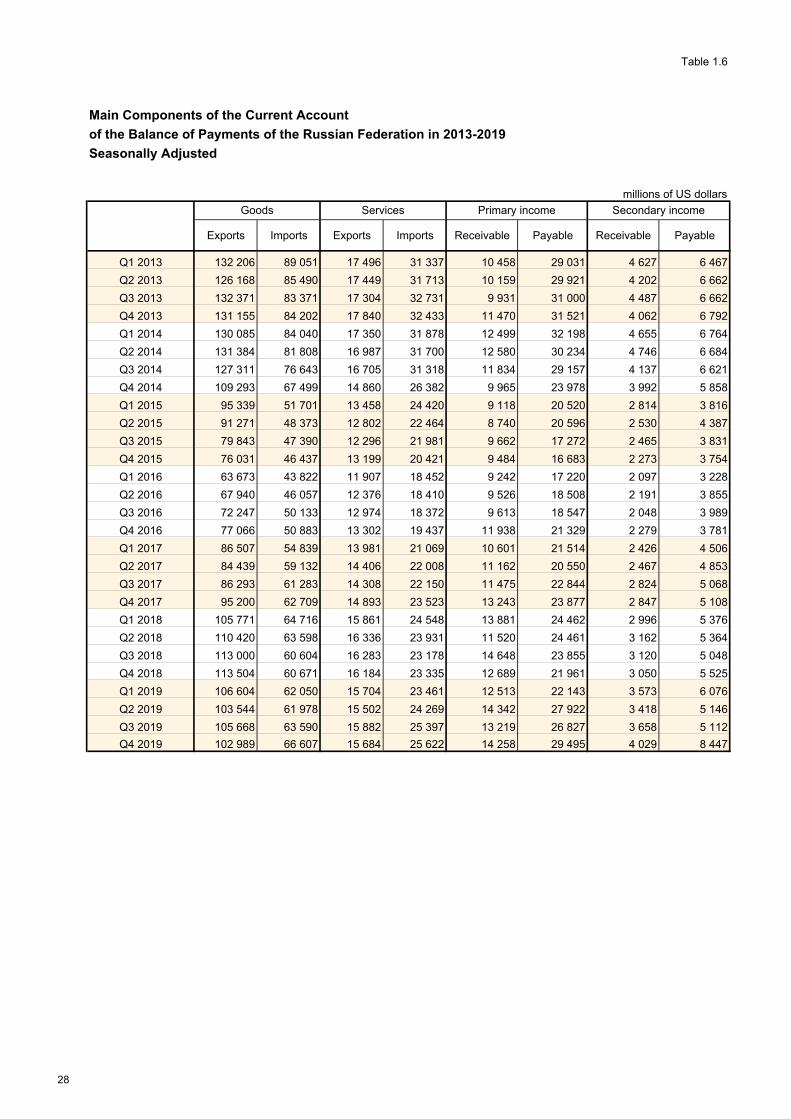
Table 1.6
Main Components of the Current Account
of the Balance of Payments of the Russian Federation in 2013-2019
Seasonally Adjusted
millions of US dollars
Exports Imports Exports Imports Receivable Payable Receivable Payable
Q1 2013 132 206 89 051 17 496 31 337 10 458 29 031 4 627 6 467
Q2 2013 126 168 85 490 17 449 31 713 10 159 29 921 4 202 6 662
Q3 2013 132 371 83 371 17 304 32 731 9 931 31 000 4 487 6 662
Q4 2013 131 155 84 202 17 840 32 433 11 470 31 521 4 062 6 792
Q1 2014 130 085 84 040 17 350 31 878 12 499 32 198 4 655 6 764
Q2 2014 131 384 81 808 16 987 31 700 12 580 30 234 4 746 6 684
Q3 2014 127 311 76 643 16 705 31 318 11 834 29 157 4 137 6 621
Q4 2014 109 293 67 499 14 860 26 382 9 965 23 978 3 992 5 858
Q1 2015 95 339 51 701 13 458 24 420 9 118 20 520 2 814 3 816
Q2 2015 91 271 48 373 12 802 22 464 8 740 20 596 2 530 4 387
Q3 2015 79 843 47 390 12 296 21 981 9 662 17 272 2 465 3 831
Q4 2015 76 031 46 437 13 199 20 421 9 484 16 683 2 273 3 754
Q1 2016 63 673 43 822 11 907 18 452 9 242 17 220 2 097 3 228
Q2 2016 67 940 46 057 12 376 18 410 9 526 18 508 2 191 3 855
Q3 2016 72 247 50 133 12 974 18 372 9 613 18 547 2 048 3 989
Q4 2016 77 066 50 883 13 302 19 437 11 938 21 329 2 279 3 781
Q1 2017 86 507 54 839 13 981 21 069 10 601 21 514 2 426 4 506
Q2 2017 84 439 59 132 14 406 22 008 11 162 20 550 2 467 4 853
Q3 2017 86 293 61 283 14 308 22 150 11 475 22 844 2 824 5 068
Q4 2017 95 200 62 709 14 893 23 523 13 243 23 877 2 847 5 108
Q1 2018 105 771 64 716 15 861 24 548 13 881 24 462 2 996 5 376
Q2 2018 110 420 63 598 16 336 23 931 11 520 24 461 3 162 5 364
Q3 2018 113 000 60 604 16 283 23 178 14 648 23 855 3 120 5 048
Q4 2018 113 504 60 671 16 184 23 335 12 689 21 961 3 050 5 525
Q1 2019 106 604 62 050 15 704 23 461 12 513 22 143 3 573 6 076
Q2 2019 103 544 61 978 15 502 24 269 14 342 27 922 3 418 5 146
Q3 2019 105 668 63 590 15 882 25 397 13 219 26 827 3 658 5 112
Q4 2019 102 989 66 607 15 684 25 622 14 258 29 495 4 029 8 447
Goods Services Primary income Secondary income
28

Tab
le 2
.1
Ext
ern
al M
erch
and
ise
Tra
de
of
the
Ru
ssia
n F
eder
atio
n in
201
8-20
19(u
nd
er B
alan
ce o
f P
aym
ents
Met
ho
do
log
y)
mill
ions
of U
S d
olla
rs
Exp
orts
of g
oods
(F
OB
)Im
port
s of
goo
ds (
FO
B)
Tra
de b
alan
ce
of w
hich
:of
whi
ch:
of w
hich
:
with
non
-CIS
co
untr
ies
% o
f cor
res-
pond
ing
perio
d of
pr
evio
us y
ear
with
CIS
co
untr
ies
% o
f cor
res-
pond
ing
perio
d of
pr
evio
us y
ear
with
non
-CIS
co
untr
ies
% o
f cor
res-
pond
ing
perio
d of
pr
evio
us y
ear
with
CIS
co
untr
ies
% o
f cor
res-
pond
ing
perio
d of
pr
evio
us y
ear
with
non
-CIS
co
untr
ies
with
CIS
co
untr
ies
2018
443
130
125,
538
6 57
012
7,6
56 5
6011
2,8
248
701
104,
322
2 28
010
4,4
26 4
2110
4,1
194
429
164
290
30 1
39
Q1,
201
810
1 52
912
3,0
88 3
5412
2,7
13 1
7512
4,8
57 4
4611
9,4
51 1
7712
0,1
6 26
911
4,3
44 0
8437
177
6 90
7
Q2,
201
810
8 77
512
9,8
94 6
7613
2,5
14 0
9811
4,3
63 4
0810
8,0
56 4
5710
7,9
6 95
110
8,8
45 3
6738
219
7 14
8
Q3,
201
811
0 43
813
0,8
96 4
2613
3,6
14 0
1311
4,4
62 6
8498
,256
325
98,3
6 3
5997
,347
754
40 1
007
654
Q4,
201
812
2 38
811
9,6
107
114
122,
715
273
101,
765
164
96,2
58 3
2196
,06
843
98,2
57 2
2448
793
8 43
1
Janu
ary
33 6
0413
2,2
29 6
7713
3,1
3 92
712
5,7
16 6
7712
2,5
14 7
6712
3,1
1 91
011
7,8
16 9
2714
910
2 01
7
Feb
ruar
y31
298
121,
226
872
119,
94
426
130,
019
119
123,
517
101
124,
82
018
114,
012
179
9 77
12
408
Mar
ch36
627
116,
931
804
116,
54
823
119,
821
650
113,
919
309
114,
22
341
111,
714
977
12 4
952
482
Apr
il35
986
138,
131
228
140,
64
758
124,
120
976
114,
818
711
114,
82
265
115,
215
010
12 5
172
493
May
36 5
0212
9,3
31 8
5313
1,7
4 64
911
4,8
21 3
4710
8,7
18 9
9410
8,9
2 35
31
07,1
15 1
5512
859
2 29
6
June
36 2
8612
2,9
31 5
9412
6,0
4 69
210
5,5
21 0
8510
1,3
18 7
5210
0,9
2 33
310
4,7
15 2
0112
842
2 35
9
July
34 3
4613
9,4
29 7
9014
2,7
4 55
612
1,5
21 2
2610
1,8
19 0
3710
2,0
2 18
910
0,6
13 1
2010
753
2 36
7
Aug
ust
37 4
6312
8,9
32 6
8613
0,9
4 77
711
6,9
21 6
6696
,519
489
96,1
2 17
710
0,4
15 7
9713
197
2 60
0
Sep
tem
ber
38 6
2912
5,6
33 9
4912
8,9
4 68
010
6,1
19 7
9396
,317
800
96,9
1 99
391
,118
836
16 1
492
687
Oct
ober
41 2
9613
0,8
35 8
1713
3,3
5 47
911
6,7
21 4
8899
,819
236
99,8
2 25
299
,619
808
16 5
813
227
Nov
embe
r40
254
120,
335
476
123,
94
778
98,5
21 2
6996
,619
023
96,7
2 24
696
,218
985
16 4
532
532
Dec
embe
r40
838
109,
635
821
112,
75
017
91,7
22 4
0892
,720
062
92,0
2 34
699
,018
430
15 7
592
671
2019
418
687
94,5
362
416
93,8
56 2
7199
,525
4 35
210
2,3
226
621
102,
027
731
105,
016
4 33
513
5 79
528
540
Q1,
201
910
2 62
110
1,1
89 8
0310
1,6
12 8
1997
,355
647
96,9
49 5
1896
,86
129
97,8
46 9
7540
285
6 69
0
Q2,
201
910
1 43
493
,387
523
92,4
13 9
1198
,761
967
97,7
54 8
2297
,17
144
102,
839
467
32 7
016
767
Q3,
201
910
3 36
393
,689
233
92,5
14 1
3010
0,8
65 3
7610
4,3
58 2
7510
3,5
7 1
0111
1,7
37 9
8730
958
7 02
9
Q4,
201
911
1 26
990
,995
858
89,5
15 4
1110
0,9
71 3
6310
9,5
64 0
0610
9,7
7 3
5610
7,5
39 9
0631
851
8 05
5
Janu
ary
30 8
4691
,827
232
91,8
3 61
492
,016
434
98,5
14 5
8898
,81
846
96,6
14 4
1212
644
1 76
8
Feb
ruar
y34
746
111,
030
363
113,
04
383
99,0
18 2
5195
,516
210
94,8
2 04
110
1,1
16 4
9514
153
2 34
2
Mar
ch37
029
101,
132
207
101,
34
822
100,
020
962
96,8
18 7
1996
,92
243
95,
816
067
13 4
882
579
Apr
il36
671
101,
931
522
100,
95
149
108,
222
066
105,
219
606
104,
82
460
108,
614
605
11 9
162
689
May
32 3
8788
,727
987
87,9
4 40
094
,619
889
93,2
17 5
8492
,62
305
98,0
12 4
9810
403
2 09
5
June
32 3
7589
,228
014
88,7
4 36
192
,920
011
94,9
17 6
3294
,02
379
102,
012
364
10 3
821
982
July
33 4
4697
,428
835
96,8
4 61
110
1,2
22 3
7210
5,4
19 9
2910
4,7
2 44
311
1,6
11 0
748
906
2 16
8
Aug
ust
34 3
6991
,729
586
90,5
4 78
310
0,1
21 9
9310
1,5
19 6
3710
0,8
2 35
610
8,2
12 3
769
949
2 42
7
Sep
tem
ber
35 5
4792
,030
812
90,8
4 73
510
1,2
21 0
1110
6,2
18 7
0910
5,1
2 30
211
5,5
14 5
3612
103
2 43
3
Oct
ober
36 7
8089
,131
985
89,3
4 79
587
,523
894
111,
221
482
111,
72
412
107,
112
886
10 5
032
383
Nov
embe
r35
490
88,2
30 3
7785
,65
113
107,
023
237
109,
320
803
109,
42
434
108,
412
253
9 57
42
679
Dec
embe
r38
998
95,5
33 4
9593
,55
503
109,
724
231
108,
121
721
108,
32
510
107,
014
767
11 7
742
993
% o
f cor
res-
pond
ing
perio
d of
pr
evio
us y
ear
% o
f cor
res-
pond
ing
perio
d of
pr
evio
us y
ear
Tot
alT
otal
Tot
al
29
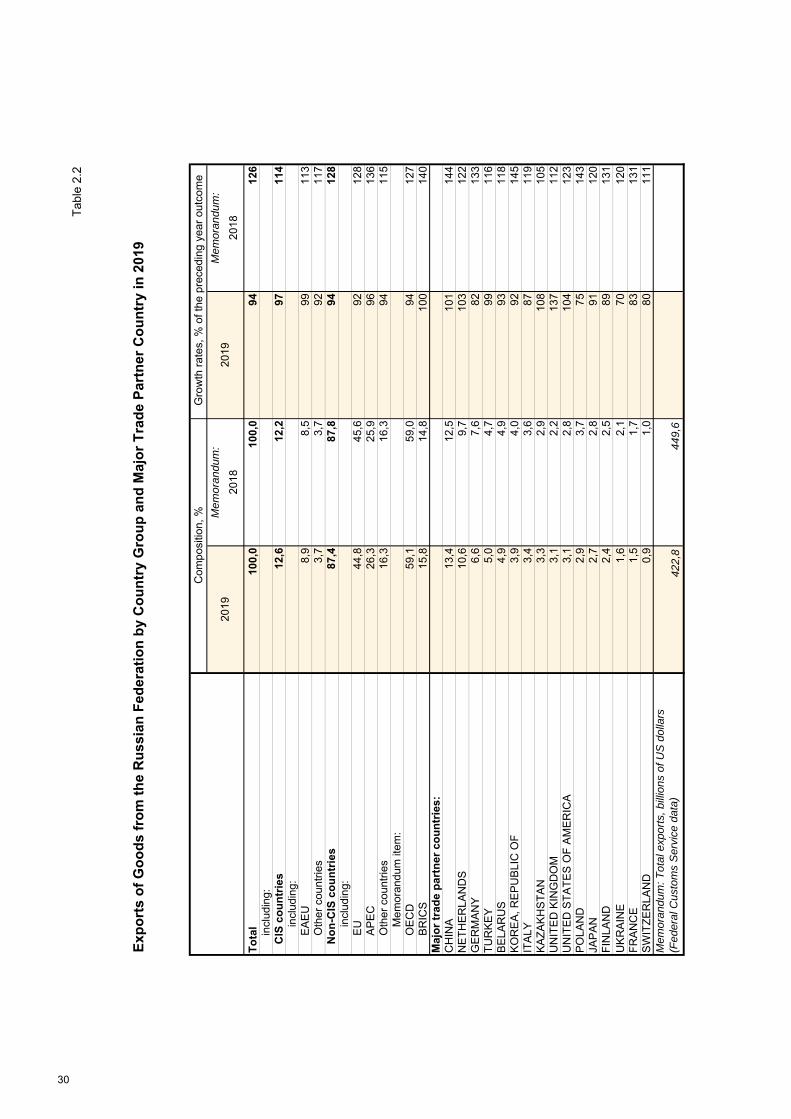
Tab
le 2
.2
Exp
ort
s o
f G
oo
ds
fro
m t
he
Ru
ssia
n F
eder
atio
n b
y C
ou
ntr
y G
rou
p a
nd
Maj
or
Tra
de
Par
tner
Co
un
try
in 2
019
Com
posi
tion,
%G
row
th r
ates
, % o
f the
pre
cedi
ng y
ear
outc
ome
Mem
oran
dum
:M
emor
andu
m:
2018
2018
To
tal
100,
010
0,0
9412
6in
clud
ing:
CIS
co
un
trie
s12
,612
,297
114
incl
udin
g:E
AE
U8,
98,
599
113
Oth
er c
ount
ries
3,7
3,7
9211
7N
on
-CIS
co
un
trie
s87
,487
,894
128
incl
udin
g:E
U
44,8
45,6
9212
8A
PE
C
26,3
25,9
9613
6O
ther
cou
ntrie
s16
,316
,394
115
Mem
oran
dum
item
: O
EC
D59
,159
,094
127
BR
ICS
15
,814
,810
014
0M
ajo
r tr
ade
par
tner
co
un
trie
s:C
HIN
A13
,412
,510
114
4N
ET
HE
RLA
ND
S10
,69,
710
312
2G
ER
MA
NY
6,6
7,6
8213
3T
UR
KE
Y5,
04,
799
116
BE
LAR
US
4,9
4,9
9311
8K
OR
EA
, RE
PU
BLI
C O
F3,
94,
092
145
ITA
L Y3,
43,
687
119
KA
ZA
KH
ST
AN
3,3
2,9
108
105
UN
ITE
D K
ING
DO
M3,
12,
213
711
2U
NIT
ED
ST
AT
ES
OF
AM
ER
ICA
3,1
2,8
104
123
PO
LAN
D2,
93,
775
143
JAP
AN
2,7
2,8
9112
0F
INLA
ND
2,4
2,5
8913
1U
KR
AIN
E1,
62,
170
120
FR
AN
CE
1,5
1,7
8313
1S
WIT
ZE
RLA
ND
0,9
1,0
8011
1M
emor
andu
m: T
otal
exp
orts
, bill
ions
of U
S d
olla
rs
(Fed
eral
Cus
tom
s S
ervi
ce d
ata)
42
2,8
449,
6
2019
2019
30
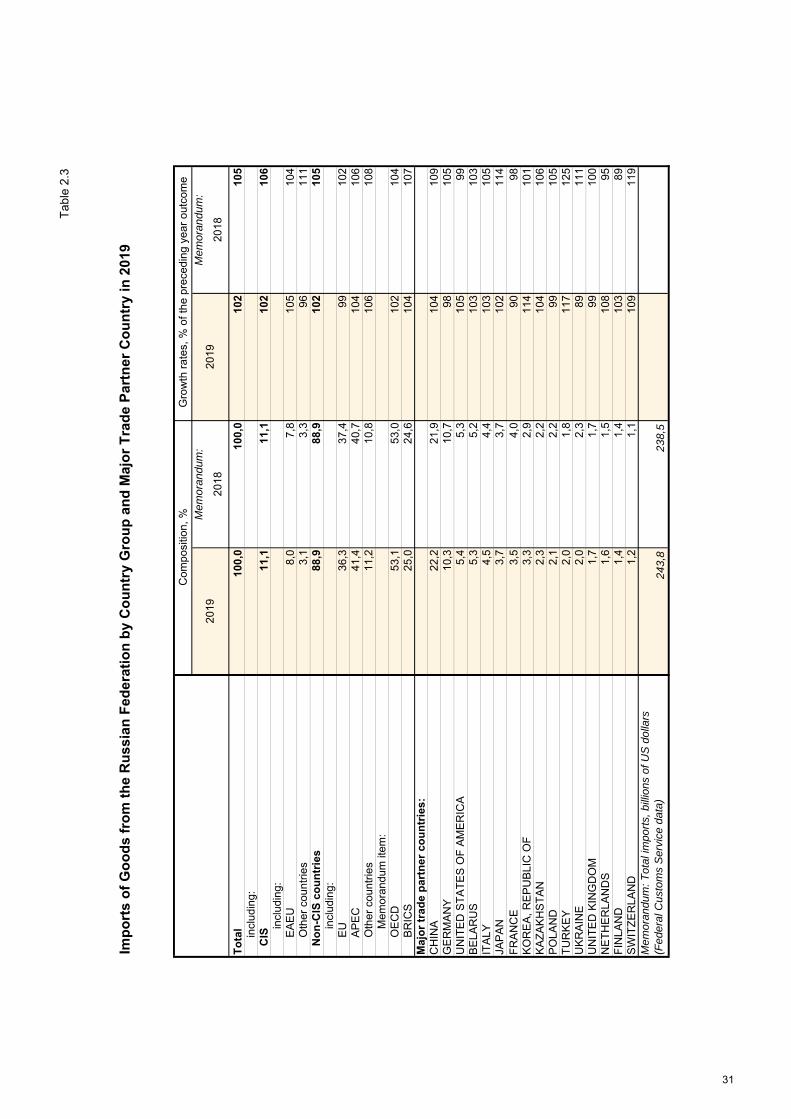
Tab
le 2
.3
Imp
ort
s o
f G
oo
ds
fro
m t
he
Ru
ssia
n F
eder
atio
n b
y C
ou
ntr
y G
rou
p a
nd
Maj
or
Tra
de
Par
tner
Co
un
try
in 2
019
Com
posi
tion,
%G
row
th r
ates
, % o
f the
pre
cedi
ng y
ear
outc
ome
Mem
oran
dum
:M
emor
andu
m:
2018
2018
To
tal
100,
010
0,0
102
105
incl
udin
g:C
IS11
,111
,110
210
6in
clud
ing:
EA
EU
8,0
7,8
105
104
Oth
er c
ount
ries
3,1
3,3
9611
1N
on
-CIS
co
un
trie
s88
,988
,910
210
5in
clud
ing:
EU
36
,337
,499
102
AP
EC
41
,440
,710
410
6O
ther
cou
ntrie
s11
,210
,810
610
8M
emor
andu
m it
em:
OE
CD
53,1
53,0
102
104
BR
ICS
25
,024
,610
410
7M
ajo
r tr
ade
par
tner
co
un
trie
s:C
HIN
A22
,221
,910
410
9G
ER
MA
NY
10,3
10,7
9810
5U
NIT
ED
ST
AT
ES
OF
AM
ER
ICA
5,4
5,3
105
99B
ELA
RU
S5,
35,
210
310
3IT
AL Y
4,5
4,4
103
105
JAP
AN
3,7
3,7
102
114
FR
AN
CE
3,5
4,0
9098
KO
RE
A, R
EP
UB
LIC
OF
3,3
2,9
114
101
KA
ZA
KH
ST
AN
2,3
2,2
104
106
PO
LAN
D2,
12,
299
105
TU
RK
EY
2,0
1,8
117
125
UK
RA
INE
2,0
2,3
8911
1U
NIT
ED
KIN
GD
OM
1,7
1,7
9910
0N
ET
HE
RLA
ND
S1,
61,
510
895
FIN
LAN
D1,
41,
410
389
SW
ITZ
ER
LAN
D1,
21,
110
911
9M
emor
andu
m: T
otal
impo
rts,
bill
ions
of U
S d
olla
rs
(Fed
eral
Cus
tom
s S
ervi
ce d
ata)
24
3,8
238,
5
2019
2019
31
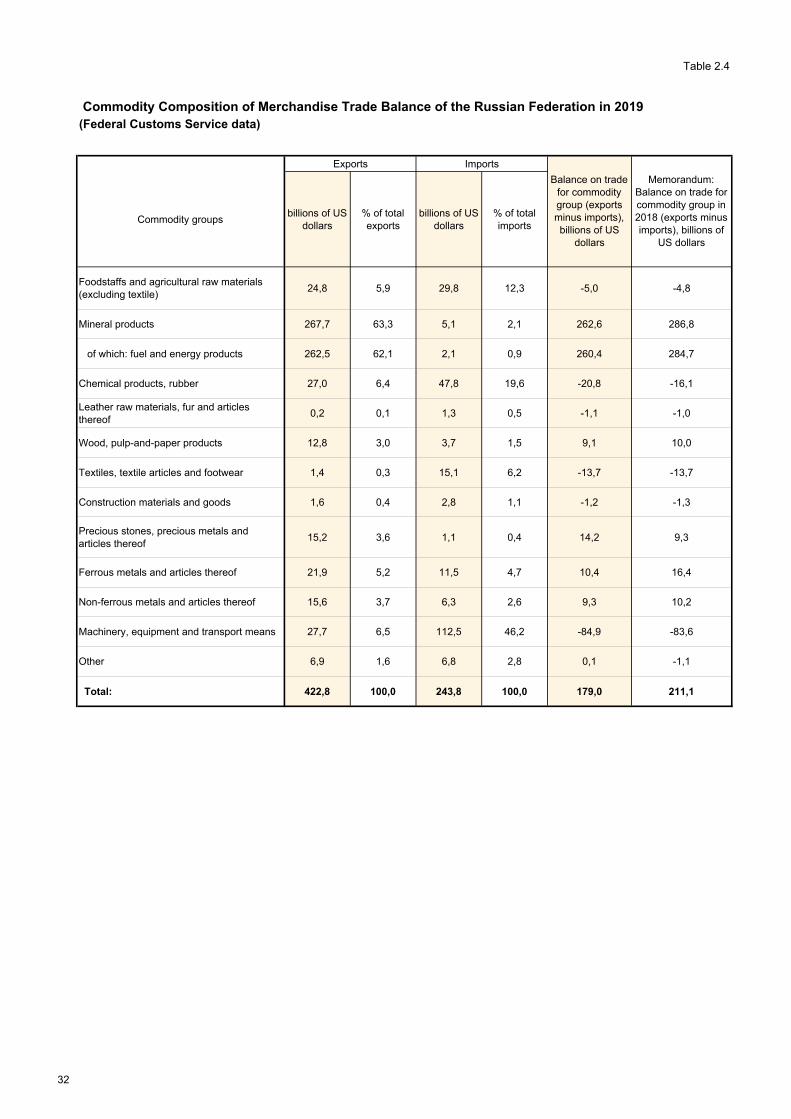
Table 2.4
Commodity Composition of Merchandise Trade Balance of the Russian Federation in 2019(Federal Customs Service data)
Exports Imports
Commodity groupsbillions of US
dollars% of total exports
billions of US dollars
% of total imports
Foodstaffs and agricultural raw materials (excluding textile)
24,8 5,9 29,8 12,3 -5,0 -4,8
Mineral products 267,7 63,3 5,1 2,1 262,6 286,8
of which: fuel and energy products 262,5 62,1 2,1 0,9 260,4 284,7
Chemical products, rubber 27,0 6,4 47,8 19,6 -20,8 -16,1
Leather raw materials, fur and articles thereof
0,2 0,1 1,3 0,5 -1,1 -1,0
Wood, pulp-and-paper products 12,8 3,0 3,7 1,5 9,1 10,0
Textiles, textile articles and footwear 1,4 0,3 15,1 6,2 -13,7 -13,7
Construction materials and goods 1,6 0,4 2,8 1,1 -1,2 -1,3
Precious stones, precious metals and articles thereof
15,2 3,6 1,1 0,4 14,2 9,3
Ferrous metals and articles thereof 21,9 5,2 11,5 4,7 10,4 16,4
Non-ferrous metals and articles thereof 15,6 3,7 6,3 2,6 9,3 10,2
Machinery, equipment and transport means 27,7 6,5 112,5 46,2 -84,9 -83,6
Other 6,9 1,6 6,8 2,8 0,1 -1,1
Total: 422,8 100,0 243,8 100,0 179,0 211,1
Balance on trade for commodity group (exports minus imports), billions of US
dollars
Memorandum: Balance on trade for commodity group in 2018 (exports minus imports), billions of
US dollars
32
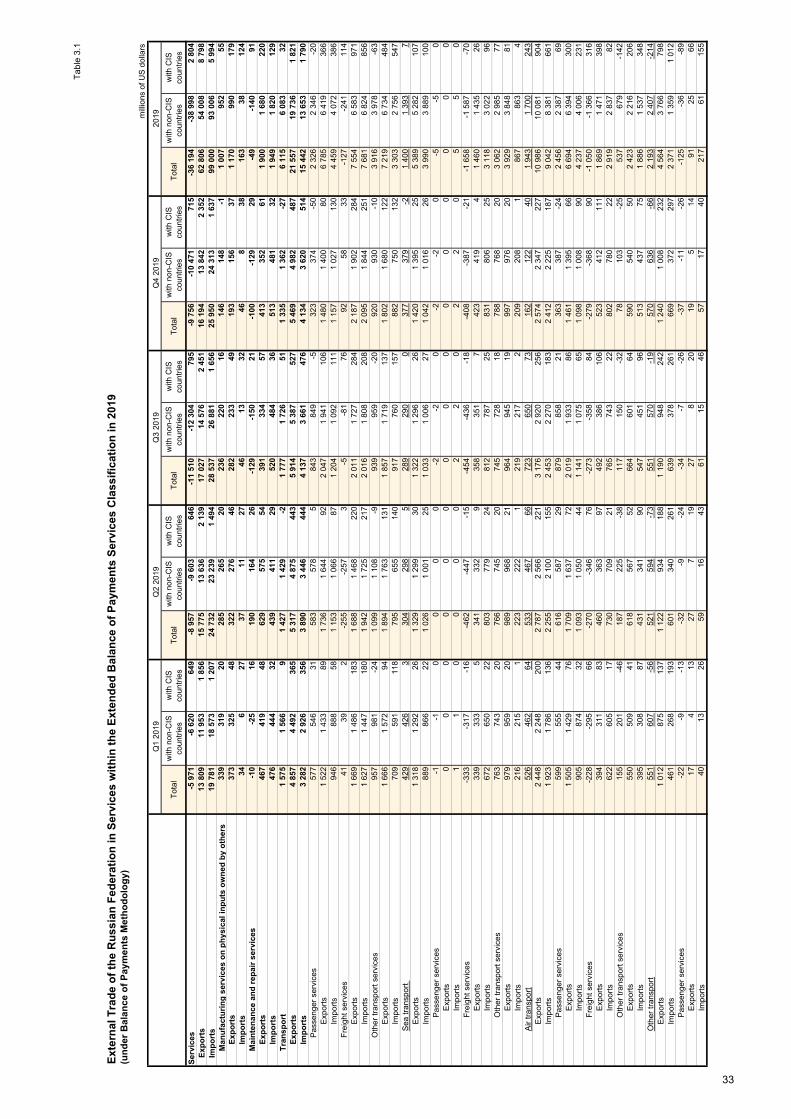
Tab
le 3
.1
Ext
ern
al T
rad
e o
f th
e R
uss
ian
Fed
erat
ion
in S
ervi
ces
wit
hin
th
e E
xten
ded
Bal
ance
of
Pay
men
ts S
ervi
ces
Cla
ssif
icat
ion
in 2
019
(un
der
Bal
ance
of
Pay
men
ts M
eth
od
olo
gy)
mill
ions
of U
S d
olla
rs
Tot
alw
ith n
on-C
IS
coun
trie
sw
ith C
IS
coun
trie
sT
otal
with
non
-CIS
co
untr
ies
with
CIS
co
untr
ies
Tot
alw
ith n
on-C
IS
coun
trie
sw
ith C
IS
coun
trie
sT
otal
with
non
-CIS
co
untr
ies
with
CIS
co
untr
ies
Tot
alw
ith n
on-C
IS
coun
trie
sw
ith C
IS
coun
trie
s
Ser
vice
s -5
971
-6 6
2064
9-8
957
-9 6
0364
6-1
1 51
0-1
2 30
479
5-9
756
-10
471
715
-36
194
-38
998
2 80
4E
xpo
rts
13 8
0911
953
1 85
615
775
13 6
362
139
17 0
2714
576
2 45
116
194
13 8
422
352
62 8
0654
008
8 79
8Im
po
rts
19 7
8118
573
1 20
724
732
23 2
391
494
28 5
3726
881
1 65
625
950
24 3
131
637
99 0
0093
006
5 99
4M
anu
fact
uri
ng
ser
vice
s o
n p
hys
ical
inp
uts
ow
ned
by
oth
ers
339
319
2028
526
520
236
220
1614
614
8-1
1 00
795
255
Exp
ort
s37
332
548
322
276
4628
223
349
193
156
371
170
990
179
Imp
ort
s 34
627
3711
2746
1332
468
3816
338
124
Mai
nte
nan
ce a
nd
rep
air
serv
ices
-10
-25
1619
016
426
-129
-150
21-1
00-1
2929
-49
-140
91E
xpo
rts
467
419
4862
957
554
391
334
5741
335
261
1 90
01
680
220
Imp
ort
s 47
644
432
439
411
2952
048
436
513
481
321
949
1 82
012
9T
ran
spo
rt
1 57
51
566
91
427
1 42
9-2
1 77
71
726
511
335
1 36
2-2
76
115
6 08
332
Exp
ort
s4
857
4 49
236
55
317
4 87
544
35
914
5 38
752
75
469
4 98
248
721
557
19 7
36
1 82
1Im
po
rts
3 28
22
926
356
3 89
03
446
444
4 13
73
661
476
4 13
43
620
514
15 4
4213
65
31
790
Pas
seng
er s
ervi
ces
577
546
3158
357
85
843
849
-532
337
4-5
02
326
2 34
6-2
0E
xpor
ts1
522
1 43
389
1 73
61
644
922
047
1 94
110
61
480
1 40
080
6 78
56
419
366
Impo
rts
946
888
581
153
1 06
687
1 20
41
092
111
1 15
71
027
130
4 45
94
072
386
Fre
ight
ser
vice
s41
392
-255
-257
3-5
-81
7692
5833
-127
-241
114
Exp
orts
1 66
91
486
183
1 68
81
468
220
2 01
11
727
284
2 18
71
902
284
7 55
46
583
971
Impo
rts
1 62
71
447
180
1 94
21
725
217
2 01
61
808
208
2 09
51
844
251
7 68
16
824
856
Oth
er tr
ansp
ort s
ervi
ces
957
981
-24
1 09
91
108
-993
995
9-2
092
093
0-1
03
916
3 97
8-6
3E
xpor
ts1
666
1 57
294
1 89
41
763
131
1 85
71
719
137
1 80
21
680
122
7 21
96
734
484
Impo
rts
709
591
118
795
655
140
917
760
157
882
750
132
3 30
32
756
547
Sea
tran
spor
t 42
942
63
304
298
528
929
00
377
379
-21
400
1 39
37
Exp
orts
1 31
81
292
261
329
1 29
930
1 32
21
296
261
420
1 39
525
5 38
95
282
107
Impo
rts
889
866
221
026
1 00
125
1 03
31
006
271
042
1 01
626
3 99
03
889
100
Pas
seng
er s
ervi
ces
-1-1
00
00
-2-2
0-2
-20
-5-5
0E
xpor
ts0
00
00
00
00
00
00
00
Impo
rts
11
00
00
22
02
20
55
0F
reig
ht s
ervi
ces
-333
-317
-16
-462
-447
-15
-454
-436
-18
-408
-387
-21
-1 6
58-1
587
-70
Exp
orts
339
333
534
133
29
358
351
742
341
94
1 46
01
435
26Im
port
s67
265
022
803
779
2481
278
725
831
806
253
118
3 02
296
Oth
er tr
ansp
ort s
ervi
ces
763
743
2076
674
520
745
728
1878
876
820
3 06
22
985
77E
xpor
ts97
995
920
989
968
2196
494
519
997
976
203
929
3 84
881
Impo
rts
216
215
122
322
21
219
217
220
920
81
867
863
4A
ir tr
ansp
ort
526
462
6453
346
766
723
650
7316
212
240
1 94
31
700
243
Exp
orts
2 44
82
248
200
2 78
72
566
221
3 17
62
920
256
2 57
42
347
227
10 9
8610
08
190
4Im
port
s1
923
1 78
613
62
255
2 10
015
52
453
2 27
018
32
412
2 22
518
79
042
8 38
16
61P
asse
nger
ser
vice
s59
955
544
616
587
2987
985
821
363
387
-24
2 45
62
387
69E
xpor
ts1
505
1 42
976
1 70
91
637
722
019
1 93
386
1 46
11
395
666
694
6 39
430
0Im
port
s90
587
432
1 09
31
050
441
141
1 07
565
1 09
81
008
904
237
4 00
623
1F
reig
ht s
ervi
ces
-228
-295
66-2
70-3
4676
-273
-358
84-2
79-3
6890
-1 0
50-1
366
316
Exp
orts
394
311
8346
036
397
492
386
106
523
412
111
1 86
91
471
398
Impo
rts
622
605
1773
070
921
765
743
2280
278
022
2 91
92
837
82O
ther
tran
spor
t ser
vice
s15
520
1-4
618
722
5-3
811
715
0-3
278
103
-25
537
679
-142
Exp
orts
550
509
4161
856
752
664
601
6459
054
050
2 42
32
216
206
Impo
rts
395
308
8743
134
190
547
451
9651
343
775
1 88
61
537
348
Oth
er tr
ansp
ort
551
607
-56
521
594
-73
551
570
-19
570
636
-66
2 19
32
407
-214
Exp
orts
1 01
287
513
71
122
934
188
1 19
094
824
21
240
1 00
823
24
564
3 76
679
8Im
port
s46
126
819
360
134
026
163
937
826
166
937
229
72
371
1 35
91
012
Pas
seng
er s
ervi
ces
-22
-9-1
3-3
2-9
-24
-34
-7-2
6-3
7-1
1-2
6-1
25-3
6-8
9E
xpor
ts17
413
277
1927
820
195
1491
2566
Impo
rts
4013
2659
1643
6115
4657
1740
217
6115
5
Q1
2019
Q2
2019
Q3
2019
Q4
2019
2019
33

Tab
le 3
.1
mill
ions
of U
S d
olla
rs
Tot
alw
ith n
on-C
IS
coun
trie
sw
ith C
IS
coun
trie
sT
otal
with
non
-CIS
co
untr
ies
with
CIS
co
untr
ies
Tot
alw
ith n
on-C
IS
coun
trie
sw
ith C
IS
coun
trie
sT
otal
with
non
-CIS
co
untr
ies
with
CIS
co
untr
ies
Tot
alw
ith n
on-C
IS
coun
trie
sw
ith C
IS
coun
trie
s
Fre
ight
ser
vice
s53
457
9-4
540
746
6-5
950
849
612
553
588
-35
2 00
22
129
-127
Exp
orts
857
766
9280
969
811
193
476
716
81
005
839
166
3 60
53
070
535
Impo
rts
323
187
137
402
233
169
427
271
156
452
251
201
1 60
494
166
3O
ther
tran
spor
t ser
vice
s39
373
146
137
977
82-5
5559
-431
731
42
Exp
orts
137
105
3228
622
858
228
174
5421
616
452
867
671
197
Impo
rts
9868
3014
091
4915
192
5916
110
456
551
356
195
Spa
ce tr
ansp
ort
7575
061
610
4646
013
130
194
194
0E
xpor
ts75
750
6161
046
460
1313
019
519
50
Impo
rts
00
00
00
00
00
00
00
0R
ail t
rans
port
141
-40
108
172
-64
9815
0-5
282
166
-84
289
530
-241
Exp
orts
231
166
6540
030
010
038
628
110
441
931
010
81
435
1 05
837
7Im
port
s23
012
510
529
212
816
528
713
115
633
614
419
21
146
527
618
Pas
seng
er s
ervi
ces
-13
-4-1
0-2
3-4
-19
-21
-3-1
9-2
5-5
-21
-82
-14
-68
Exp
orts
174
1327
719
278
2019
514
9125
66Im
port
s31
823
4911
3849
1038
4510
3517
439
134
Fre
ight
ser
vice
s-3
19
-40
-29
29-5
932
65-3
436
101
-64
820
4-1
96E
xpor
ts11
689
2714
110
833
188
148
4123
518
253
680
527
153
Impo
rts
147
8066
170
7991
157
8374
199
8111
767
232
334
9O
ther
tran
spor
t ser
vice
s45
369
159
146
1388
880
7170
136
434
123
Exp
orts
9873
2523
218
448
170
126
4416
412
341
664
506
158
Impo
rts
5336
1673
3835
8238
4493
5340
300
165
135
Roa
d tr
ansp
ort
-11
1-1
2-1
06-6
7-3
9-1
19-1
03-1
5-5
5-4
2-1
3-2
91-2
12-7
9E
xpor
ts15
511
441
138
100
3717
210
171
206
141
6667
145
621
5Im
port
s16
611
353
244
167
7629
020
486
262
183
7996
166
829
4P
asse
nger
ser
vice
s-9
-5-4
-10
-5-5
-12
-5-7
-12
-7-5
-43
-22
-21
Exp
ort s
00
00
00
00
00
00
00
0Im
port
s9
54
105
512
57
127
543
2221
Fre
ight
ser
vice
s-2
4-6
-101
-69
-33
-111
-104
-7-4
6-3
9-7
-260
-207
-53
Exp
orts
140
106
3410
880
2814
281
6118
012
456
570
392
179
Impo
rts
141
101
4021
014
961
253
185
6822
616
363
831
599
232
Oth
er tr
ansp
ort s
ervi
ces
02
-25
7-1
45
-13
40
1217
-5E
xpor
ts15
87
2920
929
2010
2717
1010
064
36Im
port
s16
69
2413
1125
1411
2313
1088
4741
Pip
elin
e tr
ansp
ort
491
491
047
744
433
541
488
5255
151
436
2 06
01
937
122
Exp
orts
527
496
3149
944
950
557
491
6657
752
157
2 16
01
957
204
Impo
rts
355
3022
517
173
1327
621
101
1982
Oth
er s
uppo
rtin
g an
d au
xilia
ry tr
ansp
ort s
ervi
ces
-5-1
-4-1
9-1
6-3
-16
-12
-4-2
0-1
5-5
-60
-43
-16
Exp
orts
2524
025
240
2928
125
241
103
101
2Im
port
s30
254
4340
345
405
4539
616
314
419
Pos
tal a
nd c
ourie
r se
rvic
es
6972
-270
700
214
217
-222
622
50
579
583
-4E
xpor
ts79
762
7875
322
722
33
236
232
361
960
712
Impo
rts
95
58
53
127
510
73
4024
16T
rave
l -4
611
-5 2
5764
6-6
584
-7 2
1462
9-8
553
-9 3
2877
4-5
442
-6 1
6272
0-2
5 1
91-2
7 96
12
770
Exp
ort
s1
896
1 01
488
22
879
1 87
11
009
3 83
52
606
1 22
92
351
1 32
51
026
10 9
61
6 81
54
146
Imp
ort
s6
507
6 27
123
69
464
9 08
438
012
388
11 9
3345
57
793
7 48
730
736
152
34 7
751
376
Bus
ines
s tr
avel
758
142
616
743
155
587
886
231
655
815
134
681
3 20
366
22
540
Exp
orts
1 12
246
965
31
130
491
639
1 28
657
271
41
207
482
725
4 74
52
014
2 73
1Im
port
s36
432
736
387
335
5240
034
159
392
348
441
543
1 35
219
1P
erso
nal t
rave
l-5
370
-5 3
9930
-7 3
27-7
369
42-9
440
-9 5
5911
9-6
257
-6 2
9638
-28
394
-28
623
229
Exp
orts
773
544
229
1 74
91
380
370
2 54
82
033
515
1 14
484
330
26
216
4 80
11
415
Impo
rts
6 14
35
944
199
9 07
78
749
328
11 9
8811
592
396
7 40
27
139
263
34 6
0933
423
1 18
6C
on
stru
ctio
n
-60
-89
2917
-43
59-5
45-5
42-4
-150
-199
48-7
38-8
7113
3E
xpo
rts
1 04
187
416
81
145
949
196
1 05
789
016
71
542
1 30
723
54
786
4 02
076
6Im
po
rts
1 10
296
213
91
128
992
137
1 60
21
432
171
1 69
21
506
186
5 52
44
891
633
Q1
2019
Q2
2019
Q3
2019
Q4
2019
2019
34
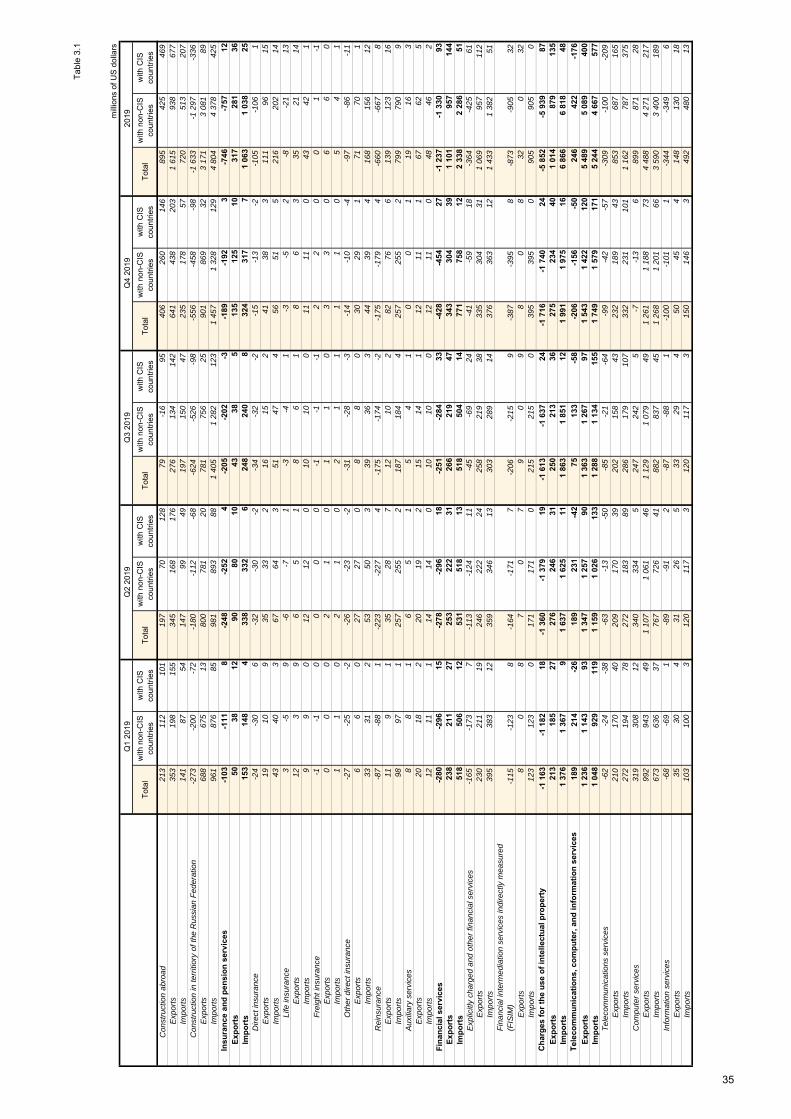
Tab
le 3
.1
mill
ions
of U
S d
olla
rs
Tot
alw
ith n
on-C
IS
coun
trie
sw
ith C
IS
coun
trie
sT
otal
with
non
-CIS
co
untr
ies
with
CIS
co
untr
ies
Tot
alw
ith n
on-C
IS
coun
trie
sw
ith C
IS
coun
trie
sT
otal
with
non
-CIS
co
untr
ies
with
CIS
co
untr
ies
Tot
alw
ith n
on-C
IS
coun
trie
sw
ith C
IS
coun
trie
s
Con
stru
ctio
n ab
road
213
112
101
197
7012
879
-16
9540
626
014
689
542
546
9E
xpor
ts35
319
815
534
516
817
627
613
414
264
143
820
31
615
938
677
Impo
rts
141
8754
147
9949
197
150
4723
517
857
720
513
207
Con
stru
ctio
n in
terr
itior
y of
the
Rus
sian
Fed
erat
ion
-273
-200
-72
-180
-112
-68
-624
-526
-98
-556
-458
-98
-1 6
33-1
297
-336
Exp
orts
688
675
1380
078
120
781
756
2590
186
932
3 17
13
081
89Im
port
s96
187
685
981
893
881
405
1 28
212
31
457
1 32
812
94
804
4 37
842
5In
sura
nce
an
d p
ensi
on
ser
vice
s-1
03-1
118
-248
-252
4-2
05-2
02-3
-189
-192
3-7
46-7
5712
Exp
ort
s50
3812
9080
1043
385
135
125
1031
728
136
Imp
ort
s15
314
84
338
332
624
824
08
324
317
71
063
1 03
825
Dire
ct in
sura
nce
-24
-30
6-3
2-3
0-2
-34
-32
-2-1
5-1
3-2
-105
-106
1E
xpor
ts19
109
3533
216
152
4138
311
196
15Im
port
s43
403
6764
351
474
5651
521
620
214
Life
insu
ranc
e3
-59
-6-7
1-3
-41
-3-5
2-8
-21
13E
xpor
ts12
39
65
18
61
86
335
2114
Impo
rts
99
012
120
1010
011
110
4342
1F
reig
ht in
sura
nce
-1-1
00
00
-1-1
-12
20
01
-1E
xpor
ts0
00
21
01
10
33
06
60
Impo
rts
11
02
10
21
11
10
54
1O
ther
dire
ct in
sura
nce
-27
-25
-2-2
6-2
3-2
-31
-28
-3-1
4-1
0-4
-97
-86
-11
Exp
orts
66
027
270
88
030
291
7170
1Im
port
s33
312
5350
339
363
4439
416
815
612
Rei
nsur
ance
-87
-88
1-2
23-2
274
-175
-174
-2-1
75-1
794
-660
-667
8E
xpor
ts11
91
3528
712
102
8276
613
912
316
Impo
rts
9897
125
725
52
187
184
425
725
52
799
790
9A
uxili
ary
serv
ices
88
16
51
54
10
01
1916
3E
xpor
ts20
182
2019
215
141
1211
167
625
Impo
rts
1211
114
140
1010
012
110
4846
2F
inan
cial
ser
vice
s-2
80-2
9615
-278
-296
18-2
51-2
8433
-428
-454
27-1
237
-1 3
3093
Exp
ort
s23
821
127
253
222
3126
621
947
343
304
391
101
957
144
Imp
ort
s51
850
612
531
518
1351
850
414
771
758
122
338
2 28
651
Exp
licitl
y ch
arge
d an
d ot
her
finan
cial
ser
vice
s-1
65-1
737
-113
-124
11-4
5-6
924
-41
-59
18
-364
-425
61E
xpor
ts23
021
119
246
222
2425
821
938
335
304
311
069
957
112
Impo
rts
395
383
1235
934
613
303
289
1437
636
312
1 43
31
382
51F
inan
cial
inte
rmed
iatio
n se
rvic
es in
dire
ctly
mea
sure
d (F
ISIM
)-1
15-1
238
-164
-171
7-2
06-2
159
-387
-395
8-8
73-9
0532
Exp
orts
80
87
07
90
98
08
320
32Im
port
s12
312
30
171
171
021
521
50
395
395
090
590
50
Ch
arg
es f
or
the
use
of
inte
llect
ual
pro
per
ty-1
163
-1 1
8218
-1 3
60-1
379
19-1
613
-1 6
3724
-1 7
16-1
740
24-5
852
-5 9
3987
Exp
ort
s21
318
527
276
246
3125
021
336
275
234
401
014
879
135
Imp
ort
s1
376
1 36
79
1 63
71
625
111
863
1 85
112
1 99
11
975
166
866
6 81
848
Tel
eco
mm
un
icat
ion
s, c
om
pu
ter,
an
d in
form
atio
n s
ervi
ces
189
214
-26
189
231
-42
7513
3-5
8-2
06-1
56-5
024
642
2-1
76E
xpo
rts
1 23
61
143
931
347
1 25
790
1 36
31
267
971
543
1 42
212
05
489
5 08
940
0Im
po
rts
1 04
892
911
91
159
1 02
613
31
288
1 13
415
51
749
1 57
917
15
244
4 66
757
7T
elec
omm
unic
atio
ns s
ervi
ces
-62
-24
-38
-63
-13
-50
-85
-21
-64
-99
-42
-57
-309
-100
-209
Exp
orts
210
170
4020
917
039
202
158
4323
218
943
853
687
165
Impo
rts
272
194
7827
218
389
286
179
107
332
231
101
1 16
278
737
5C
ompu
ter
serv
ices
319
308
1234
033
45
247
242
5-7
-13
689
987
128
Exp
orts
992
943
491
107
1 06
146
1 12
91
079
491
261
1 18
873
4 48
84
271
217
Impo
rts
673
636
3776
772
641
882
837
451
268
1 20
166
3 59
03
400
189
Info
rmat
ion
serv
ices
-68
-69
1-8
9-9
12
-87
-88
1-1
00-1
011
-344
-349
6E
xpor
ts35
304
3126
533
294
5045
414
813
018
Impo
rts
103
100
312
011
73
120
117
315
014
63
492
480
13
Q1
2019
Q2
2019
Q3
2019
Q4
2019
2019
35
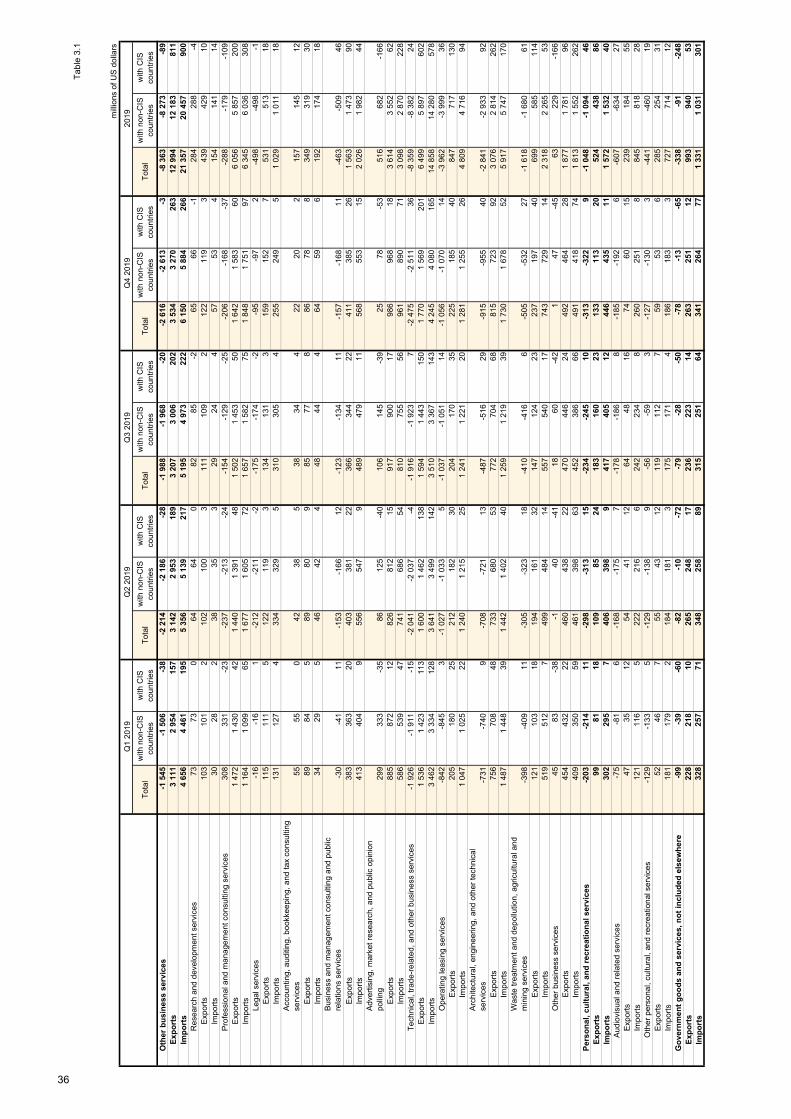
Tab
le 3
.1
mill
ions
of U
S d
olla
rs
Tot
alw
ith n
on-C
IS
coun
trie
sw
ith C
IS
coun
trie
sT
otal
with
non
-CIS
co
untr
ies
with
CIS
co
untr
ies
Tot
alw
ith n
on-C
IS
coun
trie
sw
ith C
IS
coun
trie
sT
otal
with
non
-CIS
co
untr
ies
with
CIS
co
untr
ies
Tot
alw
ith n
on-C
IS
coun
trie
sw
ith C
IS
coun
trie
s
Oth
er b
usi
nes
s se
rvic
es-1
545
-1 5
06-3
8-2
214
-2 1
86-2
8-1
988
-1 9
68-2
0-2
616
-2 6
13-3
-8 3
63-8
273
-89
Exp
ort
s3
111
2 95
415
73
142
2 95
318
93
207
3 00
620
23
534
3 27
026
312
994
12 1
83
811
Imp
ort
s4
656
4 46
119
55
356
5 13
921
75
195
4 97
322
26
150
5 88
426
621
357
20 4
57
900
Res
earc
h an
d de
velo
pmen
t ser
vice
s73
730
6464
082
85-2
6566
-128
428
8-4
Exp
orts
103
101
210
210
03
111
109
212
211
93
439
429
10Im
port
s30
282
3835
329
244
5753
415
414
114
Pro
fess
iona
l and
man
agem
ent c
onsu
lting
ser
vice
s30
833
1-2
3-2
37-2
13-2
4-1
54-1
29-2
5-2
06-1
68-3
7-2
88-1
79-1
09E
xpor
ts1
472
1 43
042
1 44
01
391
481
502
1 45
350
1 64
21
583
606
056
5 85
720
0Im
port
s1
164
1 09
965
1 67
71
605
721
657
1 58
275
1 84
81
751
976
345
6 03
630
8Le
gal s
ervi
ces
-16
-16
1-2
12-2
11-2
-175
-174
-2-9
5-9
72
-498
-498
-1E
xpor
ts11
511
15
122
119
313
413
13
159
152
753
151
318
Impo
rts
131
127
433
432
95
310
305
425
524
95
1 02
91
011
18A
ccou
ntin
g, a
uditi
ng, b
ookk
eepi
ng, a
nd ta
x co
nsul
ting
serv
ices
5555
042
385
3834
422
202
157
145
12E
xpor
ts89
845
8980
985
778
8678
834
931
930
Impo
rts
3429
546
424
4844
464
596
192
174
18B
usin
ess
and
man
agem
ent c
onsu
lting
and
pub
lic
rela
tions
ser
vice
s-3
0-4
111
-153
-166
12-1
23-1
3411
-157
-168
11-4
63-5
0946
Exp
orts
383
363
2040
338
122
366
344
2241
138
526
1 56
31
473
90Im
port
s41
340
49
556
547
948
947
911
568
553
152
026
1 98
244
Adv
ertis
ing,
mar
ket r
esea
rch,
and
pub
lic o
pini
on
polli
ng29
933
3-3
586
125
-40
106
145
-39
2578
-53
516
682
-166
Exp
orts
885
872
1282
681
215
917
900
1798
696
818
3 61
43
552
62Im
port
s58
653
947
741
686
5481
075
556
961
890
713
098
2 87
022
8T
echn
ical
, tra
de-r
elat
ed, a
nd o
ther
bus
ines
s se
rvic
es-1
926
-1 9
11-1
5-2
041
-2 0
37-4
-1 9
16-1
923
7-2
475
-2 5
1136
-8 3
59-8
382
24E
xpor
ts1
536
1 42
311
31
600
1 46
213
81
594
1 44
315
01
770
1 56
920
16
499
5 89
76
02Im
port
s3
462
3 33
412
83
641
3 49
914
23
510
3 36
714
34
245
4 08
016
514
858
14 2
80
578
Ope
ratin
g le
asin
g se
rvic
es-8
42-8
453
-1 0
27-1
033
5-1
037
-1 0
5114
-1 0
56-1
070
14-3
962
-3 9
993
6E
xpor
ts20
518
025
212
182
3020
417
035
225
185
4084
771
713
0Im
port
s1
047
1 02
522
1 24
01
215
251
241
1 22
120
1 28
11
255
264
809
4 71
694
Arc
hite
ctur
al, e
ngin
eerin
g, a
nd o
ther
tech
nica
l se
rvic
es-7
31-7
409
-708
-721
13-4
87-5
1629
-915
-955
40-2
841
-2 9
3392
Exp
orts
756
708
4873
368
053
772
704
6881
572
392
3 07
62
814
262
Impo
rts
1 48
71
448
391
442
1 40
240
1 25
91
219
391
730
1 67
852
5 91
75
747
170
Was
te tr
eatm
ent a
nd d
epol
lutio
n, a
gric
ultu
ral a
nd
min
ing
serv
ices
-398
-409
11-3
05-3
2318
-410
-416
6-5
05-5
3227
-1 6
18-1
680
61E
xpor
ts12
110
318
194
161
3214
712
423
237
197
4069
958
511
4Im
port
s51
951
27
499
484
1455
754
017
743
729
142
318
2 26
553
Oth
er b
usin
ess
serv
ices
4583
-38
-140
-41
1860
-42
147
-45
6322
9-1
66E
xpor
ts45
443
222
460
438
2247
044
624
492
464
281
877
1 78
196
Impo
rts
409
350
5946
139
863
452
386
6649
141
874
1 81
31
552
262
Per
son
al, c
ult
ura
l, an
d r
ecre
atio
nal
ser
vice
s-2
03-2
1411
-298
-313
15-2
34-2
4510
-313
-322
9-1
048
-1 0
9446
Exp
ort
s99
8118
109
8524
183
160
2313
311
320
524
438
86Im
po
rts
302
295
740
639
89
417
405
1244
643
511
1 57
21
532
40A
udio
visu
al a
nd r
elat
ed s
ervi
ces
-75
-81
6-1
68-1
757
-178
-186
8-1
85-1
926
-607
-634
27E
xpor
ts47
3512
5441
1264
4816
7460
1523
918
455
Impo
rts
121
116
522
221
66
242
234
826
025
18
845
818
28O
ther
per
sona
l, cu
ltura
l, an
d re
crea
tiona
l ser
vice
s-1
29-1
335
-129
-138
9-5
6-5
93
-127
-130
3-4
41-4
6019
Exp
orts
5246
755
4312
119
112
759
536
285
254
31Im
port
s18
117
92
184
181
317
517
14
186
183
372
771
412
Go
vern
men
t g
oo
ds
and
ser
vice
s, n
ot
incl
ud
ed e
lsew
her
e-9
9-3
9-6
0-8
2-1
0-7
2-7
9-2
8-5
0-7
8-1
3-6
5-3
38-9
1-2
48E
xpo
rts
228
218
1026
524
817
236
223
1426
325
112
993
940
53Im
po
rts
328
257
7134
825
889
315
251
6434
126
477
1 33
11
031
301
Q1
2019
Q2
2019
Q3
2019
Q4
2019
2019
36
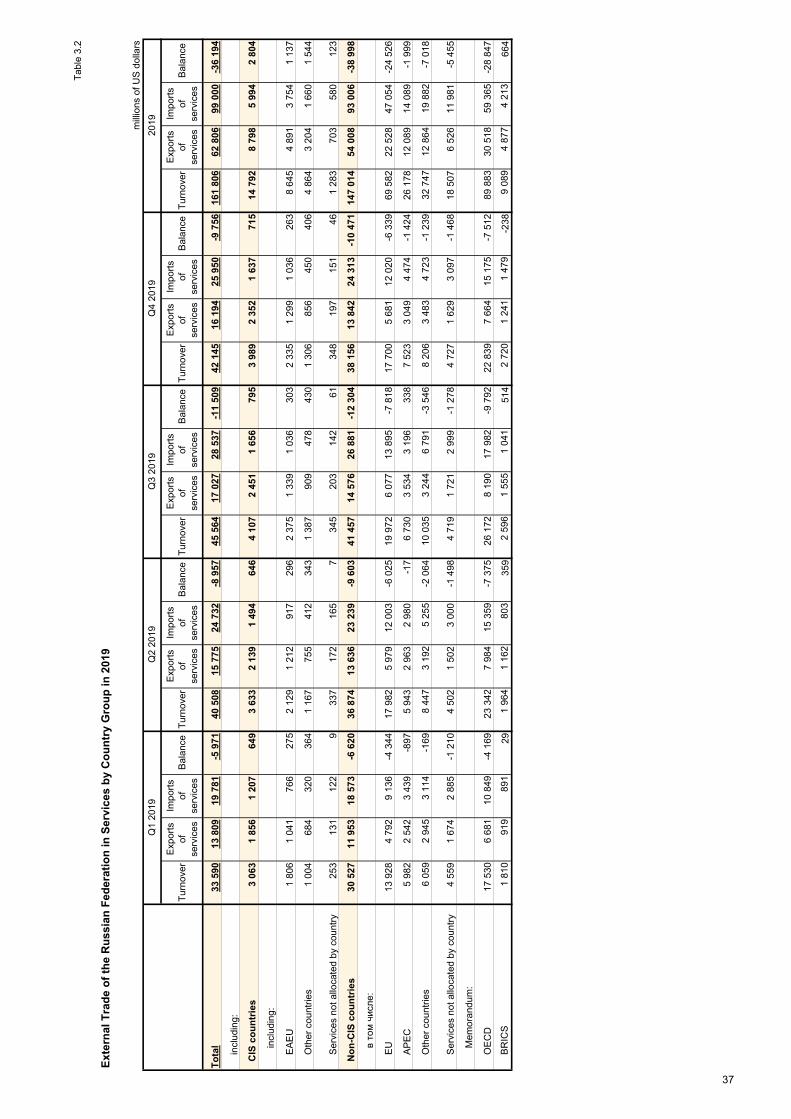
Tab
le 3
.2
Ext
ern
al T
rad
e o
f th
e R
uss
ian
Fed
erat
ion
in S
ervi
ces
by
Co
un
try
Gro
up
in 2
019
mill
ions
of U
S d
olla
rs
Tur
nove
r E
xpor
ts
of
serv
ices
Impo
rts
of
serv
ices
Bal
ance
Tur
nove
r E
xpor
ts
of
serv
ices
Impo
rts
of
serv
ices
Bal
ance
Tur
nove
r E
xpor
ts
of
serv
ices
Impo
rts
of
serv
ices
Bal
ance
Tur
nove
r E
xpor
ts
of
serv
ices
Impo
rts
of
serv
ices
Bal
ance
Tur
nove
r E
xpor
ts
of
serv
ices
Impo
rts
of
serv
ices
Bal
ance
To
tal
33 5
9013
809
19 7
81-5
971
40 5
0815
775
24 7
32-8
957
45 5
6417
027
28 5
37-1
1 50
942
145
16 1
9425
950
-9 7
5616
1 80
662
806
99 0
00-3
6 19
4
incl
udin
g:
CIS
co
un
trie
s3
063
1 85
61
207
649
3 63
32
139
1 49
464
64
107
2 45
11
656
795
3 98
92
352
1 63
771
514
792
8 79
85
994
2 80
4
incl
udin
g:
EA
EU
1 80
61
041
766
275
2 12
91
212
917
296
2 37
51
339
1 03
630
32
335
1 29
91
036
263
8 64
54
891
3 75
41
137
Oth
er c
ount
ries
1 00
468
432
036
41
167
755
412
343
1 38
790
947
843
01
306
856
450
406
4 86
43
204
1 66
01
544
Ser
vice
s no
t allo
cate
d by
cou
ntry
253
131
122
933
717
216
57
345
203
142
61
348
197
151
461
283
703
580
123
No
n-C
IS c
ou
ntr
ies
30 5
2711
953
18 5
73-6
620
36 8
7413
636
23 2
39-9
603
41 4
5714
576
26 8
81-1
2 30
438
156
13 8
4224
313
-10
471
147
014
54 0
0893
006
-38
998
в то
м ч
исл
е:
EU
13 9
284
792
9 13
6-4
344
17 9
825
979
12 0
03-6
025
19 9
726
077
13 8
95
-7 8
1817
700
5 68
112
020
-6 3
3969
582
22 5
2847
054
-24
526
AP
EC
5 98
22
542
3 43
9-8
975
943
2 96
32
980
-17
6 73
03
534
3 19
633
87
523
3 04
94
474
-1 4
2426
178
12 0
8914
089
-1 9
99
Oth
er c
ount
ries
6 05
92
945
3 11
4-1
698
447
3 19
25
255
-2 0
6410
035
3 24
46
791
-3 5
468
206
3 48
34
723
-1 2
3932
747
12 8
6419
882
-7 0
18
Ser
vice
s no
t allo
cate
d by
cou
ntry
4 55
91
674
2 88
5-1
210
4 50
21
502
3 00
0-1
498
4 71
91
721
2 99
9-1
278
4 72
71
629
3 09
7-1
468
18 5
076
526
11 9
81-5
455
Mem
oran
dum
:
OE
CD
17 5
306
681
10 8
49-4
169
23 3
427
984
15 3
59-7
375
26 1
728
190
17 9
82-9
792
22 8
397
664
15 1
75-7
512
89 8
8330
518
59 3
65-2
8 84
7
BR
ICS
1 81
091
989
129
1 96
41
162
803
359
2 59
61
555
1 04
151
42
720
1 24
11
479
-238
9 08
94
877
4 21
366
4
2019
Q1
2019
Q2
2019
Q3
2019
Q4
2019
37
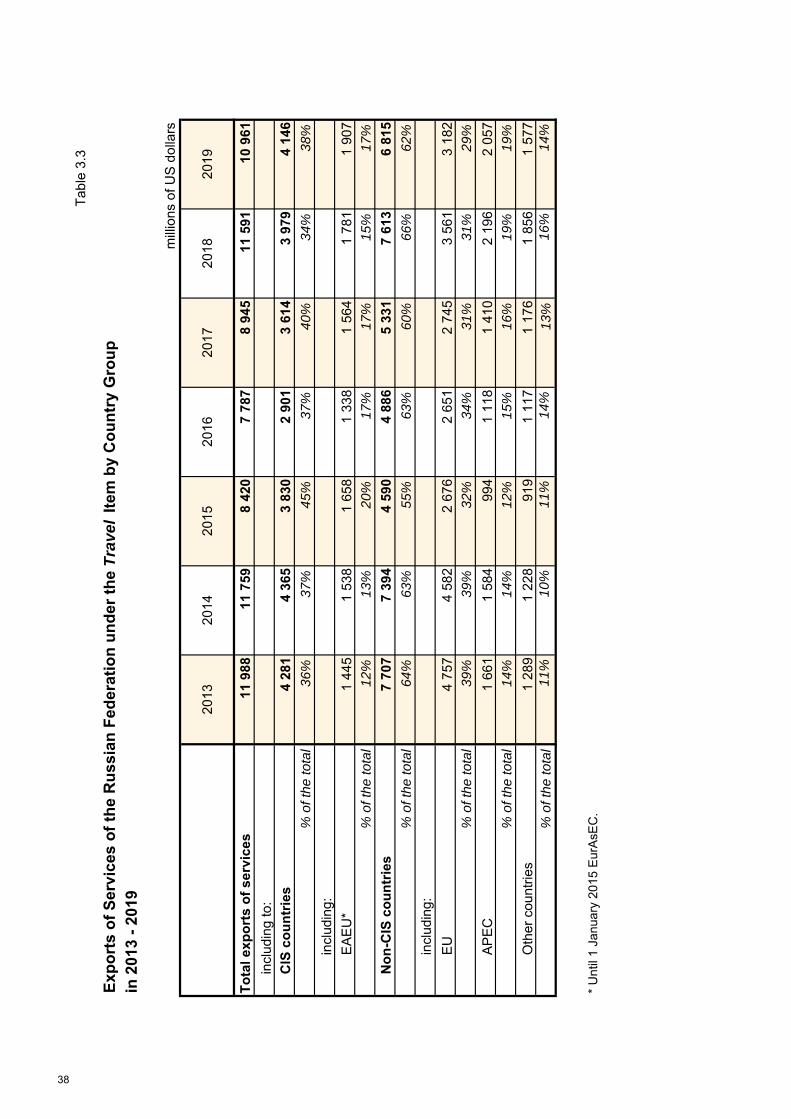
Tab
le 3
.3
Exp
ort
s o
f S
ervi
ces
of
the
Ru
ssia
n F
eder
atio
n u
nd
er t
he
Trav
el It
em b
y C
ou
ntr
y G
rou
pin
201
3 -
2019
mill
ions
of U
S d
olla
rs
2013
2014
2015
2016
2017
2018
2019
To
tal e
xpo
rts
of
serv
ices
11 9
8811
759
8 42
07
787
8 94
511
591
10 9
61
incl
udin
g to
:
CIS
co
un
trie
s4
281
4 36
53
830
2 90
13
614
3 97
94
146
% o
f the
tota
l36
%37
%45
%37
%40
%34
%38
%
incl
udin
g:
EA
EU
*1
445
1 53
81
658
1 33
81
564
1 78
11
907
% o
f the
tota
l12
%13
%20
%17
%17
%15
%17
%
No
n-C
IS c
ou
ntr
ies
7 70
77
394
4 59
04
886
5 33
17
613
6 81
5
% o
f the
tota
l64
%63
%55
%63
%60
%66
%62
%
incl
udin
g:
EU
4 75
74
582
2 67
62
651
2 74
53
561
3 18
2
% o
f the
tota
l39
%39
%32
%34
%31
%31
%29
%
AP
EC
1 66
11
584
994
1 11
81
410
2 19
62
057
% o
f the
tota
l14
%14
%12
%15
%16
%19
%19
%
Oth
er c
ount
ries
1 28
91
228
919
1 11
71
176
1 85
61
577
% o
f the
tota
l11
%10
%11
%14
%13
%16
%14
%
* U
ntil
1 Ja
nuar
y 20
15 E
urA
sEC
.
38
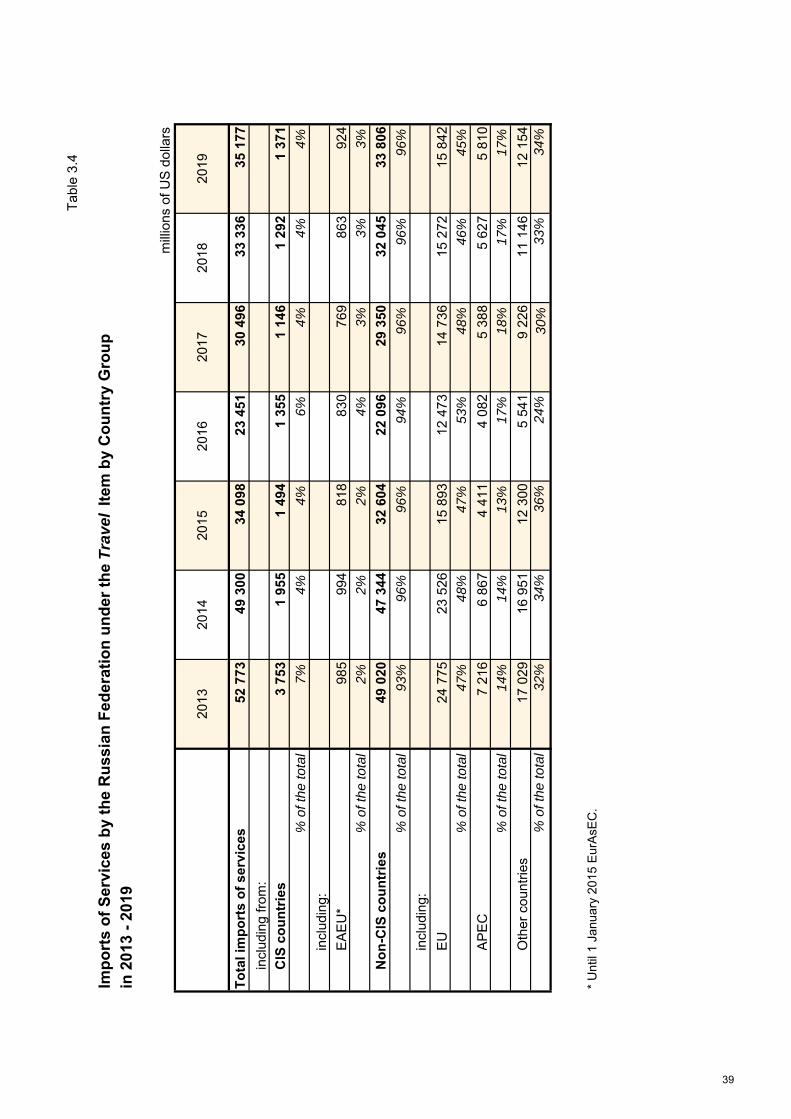
Tab
le 3
.4
Imp
ort
s o
f S
ervi
ces
by
the
Ru
ssia
n F
eder
atio
n u
nd
er t
he
Trav
el It
em b
y C
ou
ntr
y G
rou
pin
201
3 -
2019
mill
ions
of U
S d
olla
rs
2013
2014
2015
2016
2017
2018
2019
To
tal i
mp
ort
s o
f se
rvic
es52
773
49 3
0034
098
23 4
5130
496
33 3
3635
177
incl
udin
g fr
om:
CIS
co
un
trie
s3
753
1 95
51
494
1 35
51
146
1 29
21
371
% o
f the
tota
l7%
4%4%
6%4%
4%4%
incl
udin
g:
EA
EU
*98
599
481
883
076
986
392
4
% o
f the
tota
l2%
2%2%
4%3%
3%3%
No
n-C
IS c
ou
ntr
ies
49 0
2047
344
32 6
0422
096
29 3
5032
045
33 8
06
% o
f the
tota
l93
%96
%96
%94
%96
%96
%96
%
incl
udin
g:
EU
24 7
7523
526
15 8
9312
473
14 7
3615
272
15 8
42
% o
f the
tota
l47
%48
%47
%53
%48
%46
%45
%
AP
EC
7 21
66
867
4 41
14
082
5 38
85
627
5 81
0
% o
f the
tota
l14
%14
%13
%17
%18
%17
%17
%
Oth
er c
ount
ries
17 0
2916
951
12 3
005
541
9 22
611
146
12 1
54%
of t
he to
tal
32%
34%
36%
24%
30%
33%
34%
* U
ntil
1 Ja
nuar
y 20
15 E
urA
sEC
.
39
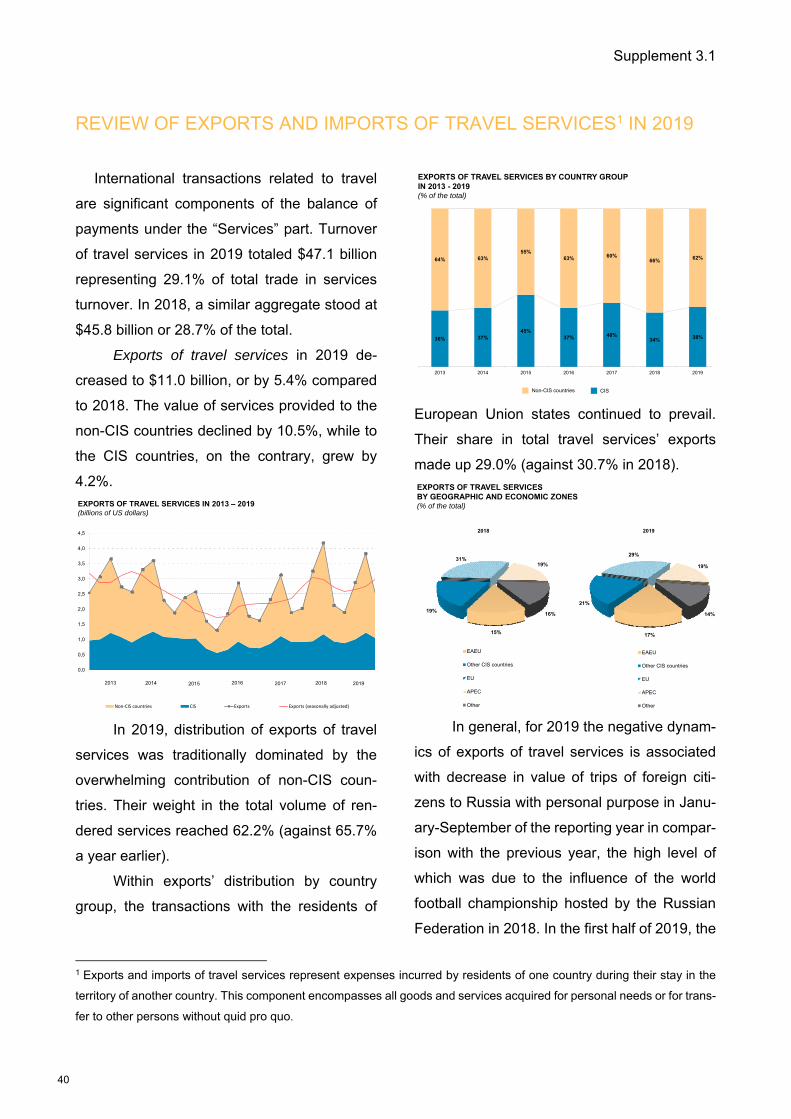
Supplement 3.1
REVIEW OF EXPORTS AND IMPORTS OF TRAVEL SERVICES1 IN 2019
International transactions related to travel
are significant components of the balance of
payments under the “Services” part. Turnover
of travel services in 2019 totaled $47.1 billion
representing 29.1% of total trade in services
turnover. In 2018, a similar aggregate stood at
$45.8 billion or 28.7% of the total.
Exports of travel services in 2019 de-
creased to $11.0 billion, or by 5.4% compared
to 2018. The value of services provided to the
non-CIS countries declined by 10.5%, while to
the CIS countries, on the contrary, grew by
4.2%.
0,0
0,5
1,0
1,5
2,0
2,5
3,0
3,5
4,0
4,5
Non‐CIS countries CIS Exports Exports (seasonally adjusted)
2013 2014 2015 2016 2017 2018 2019
EXPORTS OF TRAVEL SERVICES IN 2013 – 2019(billions of US dollars)
In 2019, distribution of exports of travel
services was traditionally dominated by the
overwhelming contribution of non-CIS coun-
tries. Their weight in the total volume of ren-
dered services reached 62.2% (against 65.7%
a year earlier).
Within exports’ distribution by country
group, the transactions with the residents of
1 Exports and imports of travel services represent expenses incurred by residents of one country during their stay in the
territory of another country. This component encompasses all goods and services acquired for personal needs or for trans-
fer to other persons without quid pro quo.
EXPORTS OF TRAVEL SERVICES BY COUNTRY GROUP IN 2013 - 2019(% of the total)
36% 37%45%
37% 40%34% 38%
64% 63%55%
63% 60%66% 62%
2013 2014 2015 2016 2017 2018 2019
Non-CIS countries CIS
European Union states continued to prevail.
Their share in total travel services’ exports
made up 29.0% (against 30.7% in 2018).
EXPORTS OF TRAVEL SERVICES BY GEOGRAPHIC AND ECONOMIC ZONES(% of the total)
17%
21%
29%
19%
14%
EAEU
Other CIS countries
EU
APEC
Other
2019
15%
19%
31%19%
16%
EAEU
Other CIS countries
EU
APEC
Other
2018
In general, for 2019 the negative dynam-
ics of exports of travel services is associated
with decrease in value of trips of foreign citi-
zens to Russia with personal purpose in Janu-
ary-September of the reporting year in compar-
ison with the previous year, the high level of
which was due to the influence of the world
football championship hosted by the Russian
Federation in 2018. In the first half of 2019, the
40
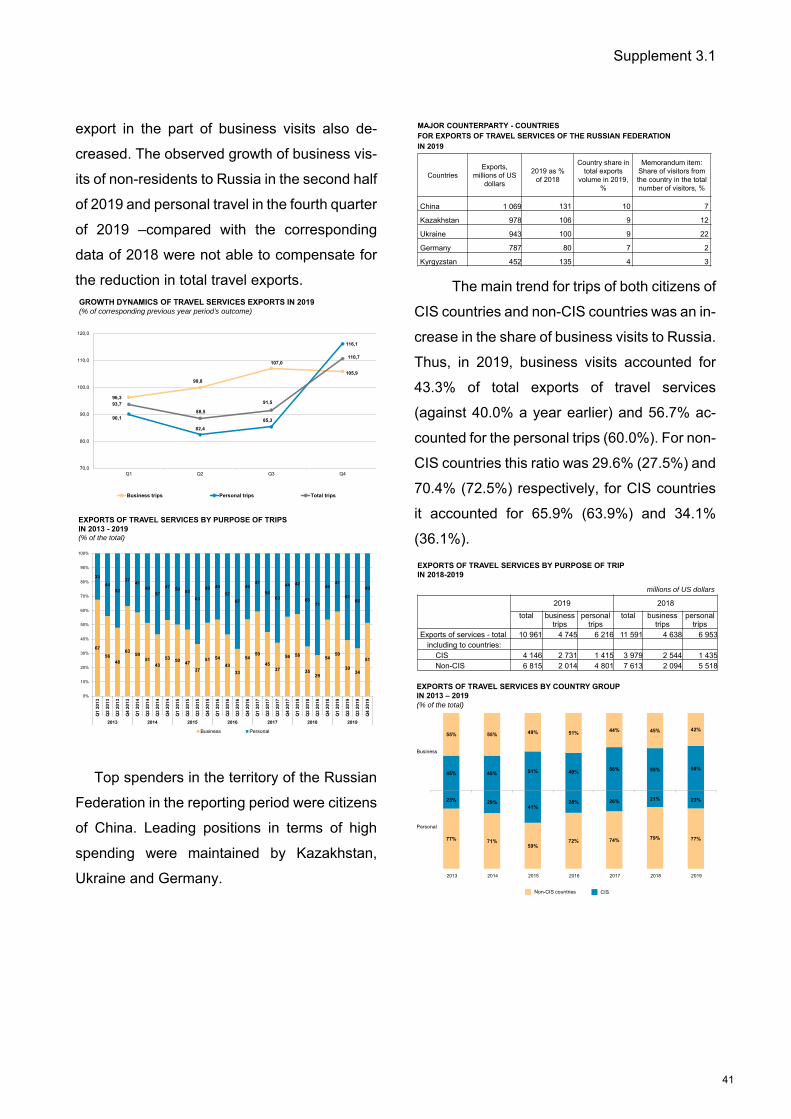
Supplement 3.1
export in the part of business visits also de-
creased. The observed growth of business vis-
its of non-residents to Russia in the second half
of 2019 and personal travel in the fourth quarter
of 2019 –compared with the corresponding
data of 2018 were not able to compensate for
the reduction in total travel exports.
96,3
99,8
107,0
105,9
90,1
82,4
85,3
116,1
93,7
88,5
91,5
110,7
70,0
80,0
90,0
100,0
110,0
120,0
Q1 Q2 Q3 Q4
Business trips Personal trips Total trips
GROWTH DYNAMICS OF TRAVEL SERVICES EXPORTS IN 2019(% of corresponding previous year period’s outcome)
67
5648
6359
5143
53 50 47
37
51 54
43
33
5459
4537
56 58
3529
5459
3934
51
33
4452
3741
4957
47 5053
63
49 46
57
67
4641
5563
44 42
6571
4641
6166
49
0%
10%
20%
30%
40%
50%
60%
70%
80%
90%
100%
Q1
201
3
Q2
201
3
Q3
201
3
Q4
201
3
Q1
201
4
Q2
201
4
Q3
201
4
Q4
201
4
Q1
201
5
Q2
201
5
Q3
201
5
Q4
201
5
Q1
201
6
Q2
201
6
Q3
201
6
Q4
201
6
Q1
201
7
Q2
201
7
Q3
201
7
Q4
201
7
Q1
201
8
Q2
201
8
Q3
201
8
Q4
201
8
Q1
201
9
Q2
201
9
Q3
201
9
Q4
201
9
2013 2014 2015 2016 2017 2018 2019
Business Personal
EXPORTS OF TRAVEL SERVICES BY PURPOSE OF TRIPS IN 2013 - 2019(% of the total)
Top spenders in the territory of the Russian
Federation in the reporting period were citizens
of China. Leading positions in terms of high
spending were maintained by Kazakhstan,
Ukraine and Germany.
CountriesExports,
millions of US dollars
2019 as %of 2018
Country share in total exports
volume in 2019, %
Memorandum item:Share of visitors from the country in the total number of visitors, %
China 1 069 131 10 7
Kazakhstan 978 106 9 12
Ukraine 943 100 9 22
Germany 787 80 7 2
Kyrgyzstan 452 135 4 3
MAJOR COUNTERPARTY - COUNTRIES FOR EXPORTS OF TRAVEL SERVICES OF THE RUSSIAN FEDERATION IN 2019
The main trend for trips of both citizens of
CIS countries and non-CIS countries was an in-
crease in the share of business visits to Russia.
Thus, in 2019, business visits accounted for
43.3% of total exports of travel services
(against 40.0% a year earlier) and 56.7% ac-
counted for the personal trips (60.0%). For non-
CIS countries this ratio was 29.6% (27.5%) and
70.4% (72.5%) respectively, for CIS countries
it accounted for 65.9% (63.9%) and 34.1%
(36.1%).
2019 2018
total business trips
personal trips
total business trips
personal trips
Exports of services - total 10 961 4 745 6 216 11 591 4 638 6 953including to countries:
CIS 4 146 2 731 1 415 3 979 2 544 1 435Non-CIS 6 815 2 014 4 801 7 613 2 094 5 518
EXPORTS OF TRAVEL SERVICES BY PURPOSE OF TRIP IN 2018-2019
millions of US dollars
45% 45% 51% 49% 56% 55% 58%
55% 55% 49% 51% 44% 45% 42%
23% 29%41%
28% 26% 21% 23%
77% 71%59%
72% 74% 79% 77%
2013 2014 2015 2016 2017 2018 2019
EXPORTS OF TRAVEL SERVICES BY COUNTRY GROUPIN 2013 – 2019(% of the total)
Business
Personal
Non-CIS countries CIS
41

Supplement 3.1
In 2019, imports of travel services totaled
$36.2 billion; or $35.2 billion excluding the
value of durable goods acquired for personal
needs in the host country by households own-
ing foreign real estate without importing them
in the territory of the Russian Federation2 (an
increase of 5.5% on the 2018 outcome).
0,0
2,0
4,0
6,0
8,0
10,0
12,0
14,0
16,0
18,0
20,0
Non‐CIS countries CIS Imports Imports (seasonally adjusted)
2013 2014 2015 2016 2017 2018
IMPORTS OF TRAVEL SERVICES BY REGION IN 2013 – 2019(billions of US dollars)
2019
The total volume of imported travel services
has been constantly dominated by services
provided by non-CIS countries. Their weight re-
mained in 2019 at the previous year’s level of
96.1%. IMPORTS OF TRAVEL SERVICES BY COUNTRY GROUPIN 2013 - 2019(% of the total)
7% 4% 4% 6% 4% 4% 4%
93% 96% 96% 94% 96% 96% 96%
2013 2014 2015 2016 2017 2018 2019
Non-CIS countries CIS
In imports’ distribution by country, the bulk
of transactions continued to belong to the
states of the European Union (45.0% of total
2 In accordance with the methodology set out in the sixth edition of the IMF’s “Balance of Payments and Interna-tional Investment Position Manual” (BPM6), travel ser-vices include durable goods acquired abroad by house-holds owning foreign real estate for their own needs in
imports against 45.8% in 2018).
IMPORTS OF TRAVEL SERVICESBY GEOGRAPHIC AND ECONOMIC ZONES(% of the total)
3%1%
45%
17%
34%
EAEU
Other CIS countries
EU
APEC
Other
2019
3%1%
46%
17%
33%
EAEU
Other CIS countries
EU
APEC
Other
2018
In 2019 the determining factor of growth of
travel services’ imports was increase in the
value of trips made by Russian citizens abroad
with personal purpose during II-IV quarters
compared to the corresponding periods of the
previous year. At the same time, the dynamics
of business visits made by Russia’s citizens to
the territory of foreign countries did not have a
significant impact on the change in the total vol-
ume of imports of travel services, since it was
characterized by an alternation of an increase
(in the I and III quarters) and a decrease (in the
II and IV quarters) in the value of travel
100,2
97,5
101,9
96,1
93,4
100,1
109,4
120,9
93,7
100,0
109,2
119,3
90,0
100,0
110,0
120,0
Q1 Q2 Q3 Q4
Business trips Personal trips Total trips
GROWTH DYNAMICS OF TRAVEL SERVICES IMPORTS IN 2019(% of corresponding previous year period’s outcome)
the host country without importing them in the territory of the Russian Federation. Further analysis of travel ser-vices’ imports excludes the value of the foregoing goods.
42

Supplement 3.1
services’ imports compared to 2018 aggre-
gates.
5 4 3 4 4 3 2 4 4 4 3 6 7 6 4 6 6 5 4 6 6 4 4 6 6 4 3 5
95 96 97 96 96 97 98 96 96 96 97 94 93 94 96 94 94 95 96 94 94 96 96 94 94 96 97 95
0%
10%
20%
30%
40%
50%
60%
70%
80%
90%
100%
Q1
201
3
Q2
201
3
Q3
201
3
Q4
201
3
Q1
201
4
Q2
201
4
Q3
201
4
Q4
201
4
Q1
201
5
Q2
201
5
Q3
201
5
Q4
201
5
Q1
201
6
Q2
201
6
Q3
201
6
Q4
201
6
Q1
201
7
Q2
201
7
Q3
201
7
Q4
201
7
Q1
201
8
Q2
201
8
Q3
201
8
Q4
201
8
Q1
201
9
Q2
201
9
Q3
201
9
Q4
201
9
2013 2014 2015 2016 2017 2018 2019
Business Personal
IMPORTS OF TRAVEL SERVICES BY PURPOSE OF TRIPS IN 2013-2019(% of the total)
Maximum total expenditures in the re-
porting period were made by citizens of the
Russian Federation on the territory of the same
countries as a year earlier. Turkey took the
leading position in terms of import, as in 2018.
MAJOR PARTNER COUNTRIES FOR RUSSIA’S IMPORTS OF TRAVEL SERVICES IN 2019
CountryImports,
millions of US dollars
2019 outcome as % of 2018
outcome
Share of the country in total imports volume
in 2019, %
Memorandum item:share of the country in the total number of trips abroad, %
Turkey 5 707 117 16 16
Germany 2 133 97 6 3
Spain 2 023 97 6 2
Thailand 2 014 98 6 3
Italy 1 954 120 6 3
In 2019, traditionally prevailed the share
of trips abroad by Russia’s citizens with per-
sonal purposes. The share of expenses for
such trips was 95.6% of all imports of travel ser-
vices (against 93.5% in 2018). At the same
time, the share of personal trips in imports from
non-CIS countries remained at the level of the
previous year - 96.0% (95.7%), while in imports
from CIS countries it increased to 86.1%
2019 2018total business
tripspersonal
tripstotal business
tripspersonal
tripsImports of services - total 35 177 1 543 33 634 33 336 1 561 31 776
including to countries:CIS 1 371 191 1 180 1 292 189 1 103Non-CIS 33 806 1 352 32 454 32 045 1 372 30 673
IMPORTS OF TRAVEL SERVICES BY PURPOSE OF TRIP IN 2018-2019
millions of US dollars
(85.4%).
17% 13% 10% 10% 9% 12% 12%
83% 87% 90% 90% 91% 88% 88%
7% 4% 4% 6% 3% 3% 4%
93% 96% 96% 94% 97% 97% 96%
2013 2014 2015 2016 2017 2018 2019
IMPORTS OF TRAVEL SERVICES BY PURPOSE OF TRIPS IN 2013-2019(% of the total)
Business
Personal
Non-CIS countries CIS
2018 2019Changes in
absolute terms
including changes resulting from:changes in the number
of trips
changes in average
expenses per trip
structural shifts
Exports 11 591 10 961 -630 75 -281 -424Imports 33 336 35 177 1 841 2 675 -836 2Turnover 44 928 46 138 1 210 2 750 -1 118 -423Balance -21 745 -24 216 -2 471 -2 600 555 -426
EFFECTS OF INDIVIDUAL FACTORS ON CHANGES IN EXPORTS AND IMPORTS OF TRAVEL SERVICES IN 2019 AS COMPARED WITH 2018
millions of US dollars
The number of trips of foreigners that vis-
ited the Russian Federation in 2018 (excluding
those that arrived seeking long-term employ-
ment) totaled 35.4 million (0.6% more than in
2018), including 15.6 million visits from non-
CIS countries (an increase of 4.2%), and 19.8
million visits from the CIS countries (a reduc-
tion of 2.0%).
The fastest growing numbers of visits were
registered with respect to incoming citizens of
Republic of Korea – by 17.3%, Israel – by
13.9%, Spain – by 13.3%, India – by 12.4%, It-
aly – by 11.3%, China – by 10.4%, Japan – by
6.7%, Germany – 6.0%, France – by 5.1%. At
the same time, the number of visits from the
United States of America fell by 11.0%, the
United Kingdom – by 10.0%, Poland - by 6.7%,
Finland – 5.6%. Despite a decrease of the total
number of visits of the CIS countries’ citizens,
the growing number of arrivals was registered
from Kyrgyz Republic and Tajikistan (by 31.2%
43
Supplement 3.1
and 6.7% respectively). In 2019, the leading
destinations for entry from non-CIS countries,
as well as a year earlier, were China (2.3 mil-
lion trips), and from the CIS countries – Ukraine
(7.8 million trips) and Kazakhstan (4.3 million
trips).
The number of trips of Russia’s residents
abroad rose by 8.0% to 44.6 million, including
trips to non-CIS countries increasing by 8.5%
(to 34.8 million), and to the CIS countries gain-
ing 6.5% (totaling 9.8 million).
During the past period the most dynamic
growth was noted in the number of trips of the
Russian citizens to Japan (by 28.2%), Monte-
negro (by 24.2%), Belgium (by 20.4%), Turkey
(by 18.5%), Italy (by 16.7%), China (by 13.5%)
and France (by 12.4%). In 2019, like in the pre-
ceding year, among the leading destinations of
travel abroad to non-CIS countries were Turkey
(with 7.0 million trips), Finland (with 4.0 million
trips) and China (with 2.6 million trips); to CIS
countries – Kazakhstan (with 3.4 million trips)
and Ukraine (with 2.6 million trips).
Average expenses per one nonresident
visitor in the territory of the Russian Federation
decreased from $329 to $309 (by 6.0%), taking
into account changes in travel prices and com-
position. Average per capita expenses of citi-
zens of non-CIS countries on trips to Russia
decreased from $508 to $436 (by 14%), those
of CIS residents, on the contrary, rose from
$197 to $209 (by 6.3%).
While staying abroad in 2019 году, a
Russia’s resident spent $788 against $807 a
year earlier (2.3% less). At the same time, in
non-CIS countries expenses amounted to $971
against $999 (2.7% less), whereas in the CIS
countries they remained at the same level of
$140.
Structural changes among trips by pur-
pose of travel, length of stay and geographic
distribution during the period under review had
a negative effect on the dynamics of exports
and imports of services.
In the inbound flow, the share of CIS res-
idents visiting Russia with working purpose in-
creased by 2.7%; the share of visits of citizens
of foreign countries with business purposes de-
creased by 1.5%
44

Tab
le 4
.1
Cro
ss-B
ord
er T
ran
sfer
s o
f In
div
idu
als
(Res
iden
ts a
nd
No
nre
sid
ents
)1in
201
8 -
2019
Mon
ey tr
ansf
ers
from
indi
vidu
als
in th
e R
ussi
an F
eder
atio
n10
17
012
109
12 2
8913
270
47 8
389
418
10 5
9210
796
11 1
1941
926
to n
on-C
IS c
ount
ries
7 63
98
571
8 53
09
821
34 5
606
937
7 35
37
000
7 74
829
037
to C
IS c
ount
ries
2 53
13
538
3 75
93
450
13 2
772
481
3 23
93
797
3 37
21
2 88
9
Mon
ey tr
ansf
ers
in fa
vor
of in
divi
dual
s to
the
Rus
sian
Fed
erat
ion
5 30
15
761
4 95
66
433
22 4
515
688
6 05
36
592
6 67
825
012
from
non
-CIS
cou
ntrie
s4
492
4 88
34
073
5 40
218
850
4 85
75
247
5 77
45
730
21 6
08
from
CIS
cou
ntrie
s80
987
888
31
031
3 60
183
280
781
894
83
404
Bal
ance
2-4
869
-6 3
48-7
333
-6 8
37-2
5 38
7-3
730
-4 5
39-4
204
-4 4
41-1
6 91
4
with
non
-CIS
cou
ntrie
s-3
147
-3 6
88-4
457
-4 4
18-1
5 71
1-2
081
-2 1
06-1
226
-2 0
17-7
430
with
CIS
cou
ntrie
s-1
722
-2 6
60-2
876
-2 4
19-9
677
-1 6
50-2
433
-2 9
79-2
424
-9 4
85
Mon
ey tr
ansf
ers
from
indi
vidu
als
in th
e R
ussi
an F
eder
atio
n17
620
919
718
219
113
115
015
214
714
5
to n
on-C
IS c
ount
ries
172
199
176
164
177
114
130
126
125
124
to C
IS c
ount
ries
192
240
267
262
241
216
231
251
251
237
Mon
ey tr
ansf
ers
in fa
vor
of in
divi
dual
s to
the
Rus
sian
Fed
erat
ion
414
436
374
410
408
317
353
367
322
340
from
non
-CIS
cou
ntrie
s49
150
941
546
146
834
538
840
734
337
1
from
CIS
cou
ntrie
s22
124
325
626
124
521
622
321
723
522
3
2 N
egat
ive
bala
nce
refle
cts
the
exce
ss o
f the
am
ount
of r
emitt
ance
s fr
om th
e R
ussi
an F
eder
atio
n ov
er th
e am
ount
of r
emitt
ance
s to
the
Rus
sian
Fed
erat
ion.
Q3
2018
Q1
2018
1 C
ross
-bor
der
tran
sfer
s of
indi
vidu
als
(res
iden
ts a
nd n
onre
side
nts)
- m
oney
tran
sfer
s to
Rus
sia
in fa
vor
of r
esid
ent a
nd n
onre
side
nt in
divi
dual
s an
d m
oney
tran
sfer
s fr
om R
ussi
a of
res
iden
t an
d no
nres
iden
t ind
ivid
uals
m
ade
via
cred
it in
stitu
tions
(w
ith/w
ithou
t ope
ning
an
acco
unt)
incl
udin
g re
mitt
ance
s vi
a m
oney
tran
sfer
ope
rato
rs. D
ata
on p
ost o
ffice
rem
ittan
ces
prov
ided
by
FG
UP
"P
ocht
a R
ossi
i".
Q3
2019
Q2
2019
Q4
2019
Q2
2018
2019
Ave
rag
e tr
ansf
er, U
S d
olla
rs
To
tal,
mill
ion
s o
f U
S d
olla
rs
Q1
2019
2018
Q4
2018
45

Tab
le 4
.2
Cro
ss-B
ord
er R
emit
tan
ces
via
Pay
men
t S
yste
ms
in 2
018
- 20
19
Mon
ey tr
ansf
ers
from
indi
vidu
als
in th
e R
ussi
an F
eder
atio
n1
816
2 62
32
679
2 36
69
484
1 60
21
890
2 08
91
956
7 53
7to
non
-CIS
cou
ntrie
s46
254
248
453
32
021
407
376
331
328
1 44
1to
CIS
cou
ntrie
s1
354
2 08
12
195
1 83
37
463
1 19
51
515
1 75
81
628
6 09
6
Mon
ey tr
ansf
ers
in fa
vor
of in
divi
dual
s to
the
Rus
sian
Fed
erat
ion
613
692
667
681
2 65
380
583
381
987
23
329
from
non
-CIS
cou
ntrie
s22
825
924
425
298
345
146
044
947
21
832
from
CIS
cou
ntrie
s38
543
342
342
91
670
354
373
370
401
1 49
7B
alan
ce1
-1 2
03-1
931
-2 0
12-1
684
-6 8
30-7
98-1
057
-1 2
70-1
083
-4 2
08w
ith n
on-C
IS c
ount
ries
-234
-283
-240
-280
-1 0
3744
8411
814
439
1w
ith C
IS c
ount
ries
-969
-1 6
48-1
772
-1 4
04-5
793
-842
-1 1
42-1
388
-1 2
27-4
599
Mon
ey tr
ansf
ers
from
indi
vidu
als
in th
e R
ussi
an F
eder
atio
n43
741
944
544
943
743
441
341
937
340
7to
non
-CIS
cou
ntrie
s1
014
979
945
950
970
906
707
712
677
747
to C
IS c
ount
ries
366
364
398
390
380
368
374
389
342
368
Mon
ey tr
ansf
ers
in fa
vor
of in
divi
dual
s to
the
Rus
sian
Fed
erat
ion
515
536
578
519
536
228
266
230
231
238
from
non
-CIS
cou
ntrie
s48
249
651
247
349
016
621
016
816
717
6fr
om C
IS c
ount
ries
537
563
624
550
568
433
394
419
418
416
Not
es.
P
aym
ent s
yste
ms:
BLI
ZK
O, C
onta
ct, U
NIS
trea
m, W
este
rn U
nion
, Zol
otay
a K
oron
a. D
ata
on p
ost o
f rem
ittan
ces
prov
ided
by
FG
UP
"P
ocht
a R
ossi
i".
S
ourc
es: R
epor
ts o
f the
cre
dit i
nstit
utio
ns "
Dat
a on
Cro
ss-b
orde
r T
rans
fers
of I
ndiv
idua
ls",
FG
UP
"P
ocht
a R
ossi
i".
1 N
egat
ive
bala
nce
refle
cts
the
exce
ss o
f the
am
ount
of r
emitt
ance
s fr
om th
e R
ussi
an F
eder
atio
n ov
er th
e am
ount
of r
emitt
ance
s to
the
Rus
sian
Fed
erat
ion.
Q1
2018
Q1
2019
Q4
2018
2018
Q2
2018
Q3
2018
2019
Ave
rag
e tr
ansf
er, U
S d
olla
rs
To
tal,
mill
ion
s o
f U
S d
olla
rs
Q3
2019
Q2
2019
Q4
2019
46
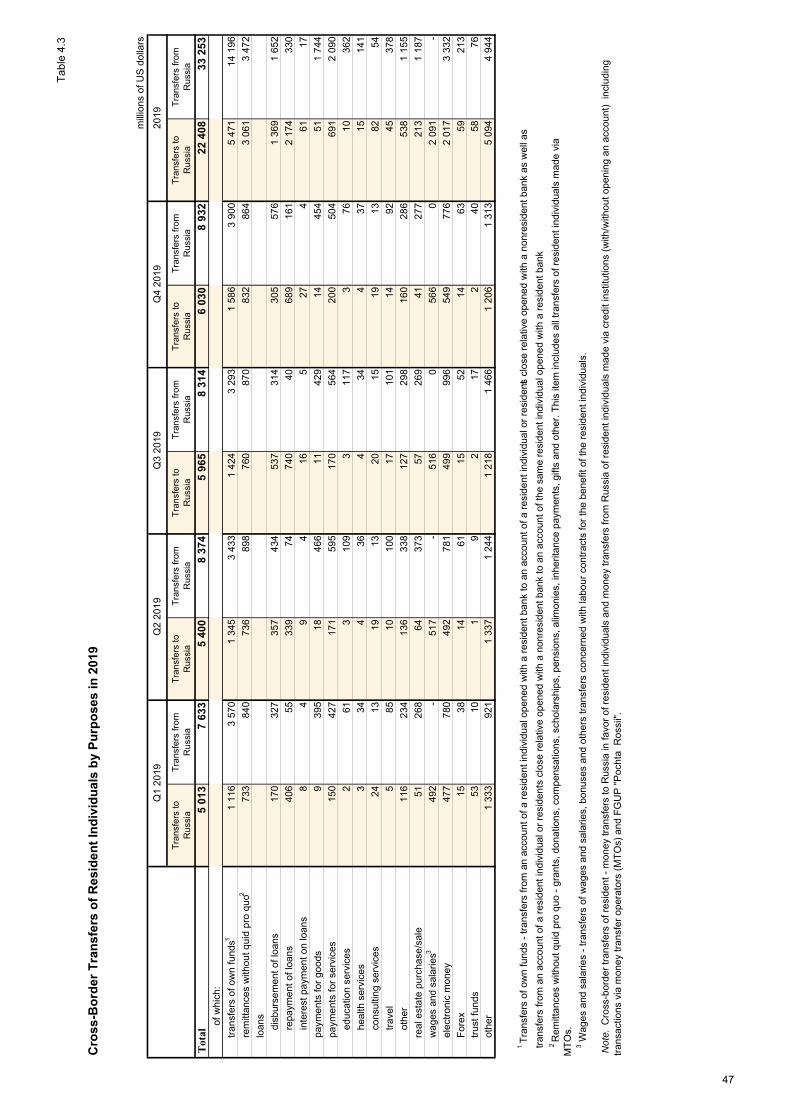
Tab
le 4
.3
Cro
ss-B
ord
er T
ran
sfer
s o
f R
esid
ent
Ind
ivid
ual
s b
y P
urp
ose
s in
201
9
Tra
nsfe
rs to
R
ussi
aT
rans
fers
from
R
ussi
aT
rans
fers
to
Rus
sia
Tra
nsfe
rs fr
om
Rus
sia
Tra
nsfe
rs to
R
ussi
aT
rans
fers
from
R
ussi
aT
rans
fers
to
Rus
sia
Tra
nsfe
rs fr
om
Rus
sia
Tra
nsfe
rs to
R
ussi
aT
rans
fers
from
R
ussi
a
Tot
al5
013
7 63
35
400
8 37
45
965
8 31
46
030
8 93
222
408
33 2
53
of w
hich
:
tran
sfer
s of
ow
n fu
nds1
1 11
63
570
1 34
53
433
1 42
43
293
1 58
63
900
5 47
114
196
rem
ittan
ces
with
out q
uid
pro
quo2
733
840
736
898
760
870
832
864
3 06
13
472
loan
s
dis
burs
emen
t of l
oans
170
327
357
434
537
314
305
576
1 36
91
652
rep
aym
ent o
f loa
ns40
655
339
7474
040
689
161
2 17
433
0
inte
rest
pay
men
t on
loan
s8
49
416
527
461
17
pay
men
ts fo
r go
ods
939
518
466
1142
914
454
511
744
pay
men
ts fo
r se
rvic
es15
042
717
159
517
056
420
050
469
12
090
edu
catio
n se
rvic
es2
613
109
311
73
7610
362
hea
lth s
ervi
ces
334
436
434
437
1514
1
con
sulti
ng s
ervi
ces
2413
1913
2015
1913
8254
trav
el5
8510
100
1710
114
9245
378
oth
er11
623
413
633
812
729
816
028
653
81
155
rea
l est
ate
purc
hase
/sal
e51
268
6437
357
269
4127
721
31
187
wag
es a
nd s
alar
ies3
492
-51
7-
516
056
60
2 09
1-
ele
ctro
nic
mon
ey47
778
049
278
149
999
654
977
62
017
3 33
2
For
ex15
3814
6115
5214
6359
213
trus
t fun
ds53
101
92
172
4058
76 o
ther
1 33
392
11
337
1 24
41
218
1 46
61
206
1 31
35
094
4 94
4
1 T
rans
fers
of o
wn
fund
s -
tran
sfer
s fr
om a
n ac
coun
t of a
res
iden
t ind
ivid
ual o
pene
d w
ith a
res
iden
t ban
k to
an
acco
unt o
f a r
esid
ent i
ndiv
idua
l or
resi
dent, s
clos
e re
lativ
e op
ened
with
a n
onre
side
nt b
ank
as w
ell a
s
tran
sfer
s fr
om a
n ac
coun
t of a
res
iden
t ind
ivid
ual o
r re
side
nt, s
clos
e re
lativ
e op
ened
with
a n
onre
side
nt b
ank
to a
n ac
coun
t of t
he s
ame
resi
dent
indi
vidu
al o
pene
d w
ith a
res
iden
t ban
k
3 W
ages
and
sal
arie
s -
tran
sfer
s of
wag
es a
nd s
alar
ies,
bon
uses
and
oth
ers
tran
sfer
s co
ncer
ned
with
labo
ur c
ontr
acts
for
the
bene
fit o
f the
res
iden
t ind
ivid
uals
.
2
Rem
ittan
ces
with
out q
uid
pro
quo
- gr
ants
, don
atio
ns, c
ompe
nsat
ions
, sch
olar
ship
s, p
ensi
ons,
alim
onie
s, in
herit
ance
pay
men
ts,
gifts
and
oth
er. T
his
item
incl
udes
all
tran
sfer
s of
res
iden
t ind
ivid
uals
mad
e vi
a M
TO
s.
Not
e. C
ross
-bor
der
tran
sfer
s of
res
iden
t - m
oney
tran
sfer
s to
Rus
sia
in fa
vor
of r
esid
ent i
ndiv
idua
ls a
nd m
oney
tran
sfer
s fr
om R
ussi
a of
res
iden
t ind
ivid
uals
mad
e vi
a cr
edit
inst
itutio
ns (
with
/with
out o
peni
ng a
n ac
coun
t) i
nclu
ding
tr
ansa
ctio
ns v
ia m
oney
tran
sfer
ope
rato
rs (
MT
Os)
and
FG
UP
"P
ocht
a R
ossi
i".
Q3
2019
mill
ions
of U
S d
olla
rs
Q2
2019
Q4
2019
Q1
2019
2019
47
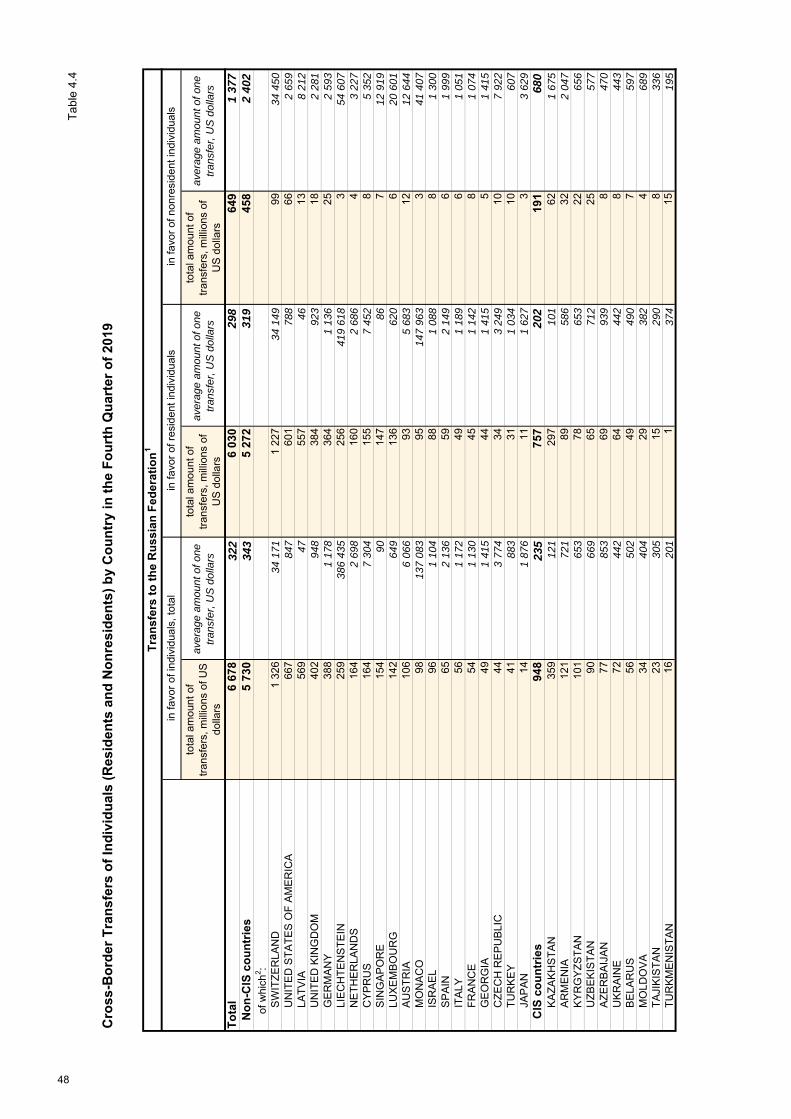
Tab
le 4
.4
Cro
ss-B
ord
er T
ran
sfer
s o
f In
div
idu
als
(Res
iden
ts a
nd
No
nre
sid
ents
) b
y C
ou
ntr
y in
th
e F
ou
rth
Qu
arte
r o
f 20
19
Tra
nsf
ers
to t
he
Ru
ssia
n F
eder
atio
n1
tota
l am
ount
of
tran
sfer
s, m
illio
ns o
f US
do
llars
aver
age
amou
nt o
f one
tr
ansf
er, U
S d
olla
rs
tota
l am
ount
of
tran
sfer
s, m
illio
ns o
f U
S d
olla
rs
aver
age
amou
nt o
f one
tr
ansf
er, U
S d
olla
rs
tota
l am
ount
of
tran
sfer
s, m
illio
ns o
f U
S d
olla
rs
aver
age
amou
nt o
f one
tr
ansf
er, U
S d
olla
rs
To
tal
6 67
832
26
030
298
649
1 37
7N
on
-CIS
co
un
trie
s5
730
343
5 27
231
945
82
402
o
f whi
ch2 :
SW
ITZ
ER
LAN
D1
326
34 1
711
227
34 1
4999
34 4
50U
NIT
ED
ST
AT
ES
OF
AM
ER
ICA
667
847
601
788
662
659
LAT
VIA
569
4755
746
138
212
UN
ITE
D K
ING
DO
M40
294
838
492
318
2 28
1G
ER
MA
NY
388
1 17
836
41
136
252
593
LIE
CH
TE
NS
TE
IN25
938
6 43
525
641
9 61
83
54 6
07N
ET
HE
RLA
ND
S16
42
698
160
2 68
64
3 22
7C
YP
RU
S16
47
304
155
7 45
28
5 35
2S
ING
AP
OR
E15
490
147
867
12 9
19LU
XE
MB
OU
RG
142
649
136
620
620
601
AU
ST
RIA
106
6 06
693
5 68
312
12 6
44M
ON
AC
O98
137
083
9514
7 96
33
41 4
07IS
RA
EL
961
104
881
088
81
300
SP
AIN
652
136
592
149
61
999
ITA
LY56
1 17
249
1 18
96
1 05
1F
RA
NC
E54
1 13
045
1 14
28
1 07
4G
EO
RG
IA49
1 41
544
1 41
55
1 41
5C
ZE
CH
RE
PU
BLI
C44
3 77
434
3 24
910
7 92
2T
UR
KE
Y41
883
311
034
1060
7JA
PA
N14
1 87
611
1 62
73
3 62
9
CIS
co
un
trie
s94
823
575
720
219
168
0K
AZ
AK
HS
TA
N35
912
129
710
162
1 67
5A
RM
EN
IA12
172
189
586
322
047
KY
RG
YZ
ST
AN
101
653
7865
322
656
UZ
BE
KIS
TA
N90
669
6571
225
577
AZ
ER
BA
IJA
N77
853
6993
98
470
UK
RA
INE
7244
264
442
844
3B
ELA
RU
S56
502
4949
07
597
MO
LDO
VA
3440
429
382
468
9T
AJI
KIS
TA
N23
305
1529
08
336
TU
RK
ME
NIS
TA
N16
201
137
415
195
in fa
vor
of in
divi
dual
s, to
tal
in fa
vor
of r
esid
ent i
ndiv
idua
lsin
favo
r of
non
resi
dent
indi
vidu
als
48
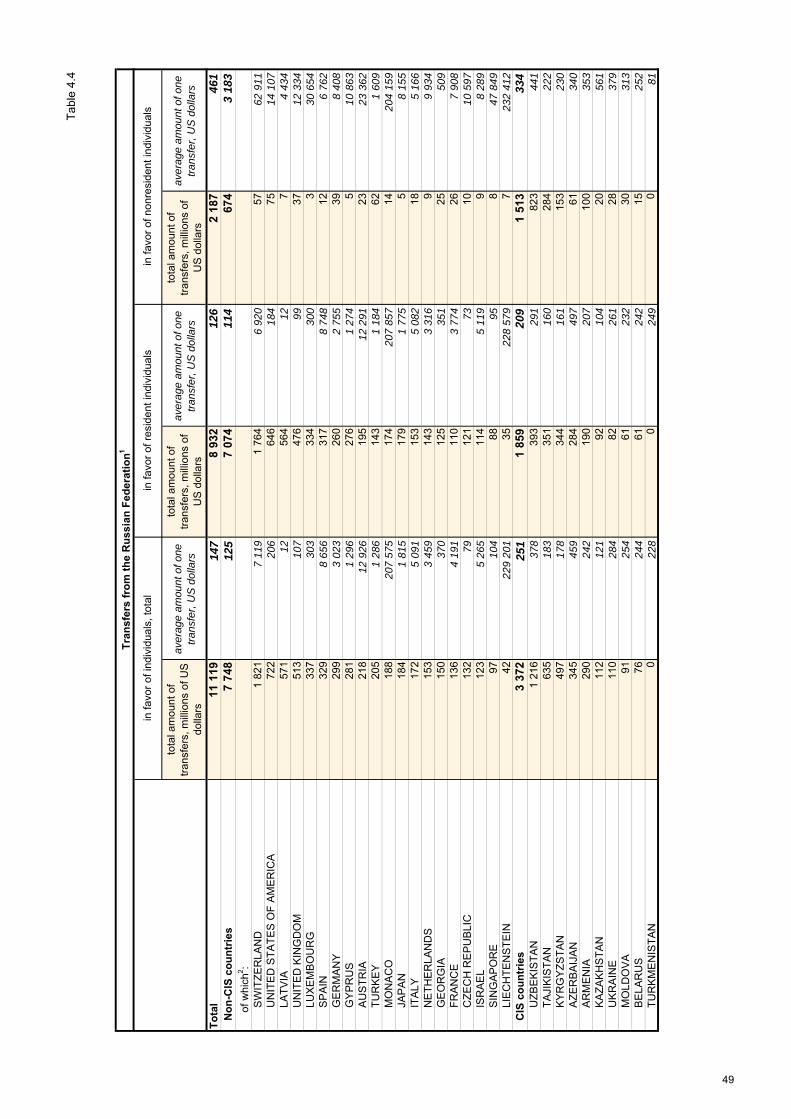
Tab
le 4
.4
tota
l am
ount
of
tran
sfer
s, m
illio
ns o
f US
do
llars
aver
age
amou
nt o
f one
tr
ansf
er, U
S d
olla
rs
tota
l am
ount
of
tran
sfer
s, m
illio
ns o
f U
S d
olla
rs
aver
age
amou
nt o
f one
tr
ansf
er, U
S d
olla
rs
tota
l am
ount
of
tran
sfer
s, m
illio
ns o
f U
S d
olla
rs
aver
age
amou
nt o
f one
tr
ansf
er, U
S d
olla
rs
To
tal
11 1
1914
78
932
126
2 18
746
1N
on
-CIS
co
un
trie
s7
748
125
7 07
411
467
43
183
of w
hich
2 :S
WIT
ZE
RLA
ND
1 82
17
119
1 76
46
920
5762
911
UN
ITE
D S
TA
TE
S O
F A
ME
RIC
A72
220
664
618
475
14 1
07LA
TV
IA57
112
564
127
4 43
4U
NIT
ED
KIN
GD
OM
513
107
476
9937
12 3
34LU
XE
MB
OU
RG
337
303
334
300
330
654
SP
AIN
329
8 65
631
78
748
126
762
GE
RM
AN
Y29
93
023
260
2 75
539
8 40
8G
YP
RU
S28
11
296
276
1 27
45
10 8
63A
US
TR
IA21
812
926
195
12 2
9123
23 3
62T
UR
KE
Y20
51
286
143
1 18
462
1 60
9M
ON
AC
O18
820
7 57
517
420
7 85
714
204
159
JAP
AN
184
1 81
517
91
775
58
155
ITA
LY17
25
091
153
5 08
218
5 16
6N
ET
HE
RLA
ND
S15
33
459
143
3 31
69
9 93
4G
EO
RG
IA15
037
012
535
125
509
FR
AN
CE
136
4 19
111
03
774
267
908
CZ
EC
H R
EP
UB
LIC
132
7912
173
1010
597
ISR
AE
L12
35
265
114
5 11
99
8 28
9S
ING
AP
OR
E97
104
8895
847
849
LIE
CH
TE
NS
TE
IN42
229
201
3522
8 57
97
232
412
CIS
co
un
trie
s3
372
251
1 85
920
91
513
334
UZ
BE
KIS
TA
N1
216
378
393
291
823
441
TA
JIK
IST
AN
635
183
351
160
284
222
KY
RG
YZ
ST
AN
497
178
344
161
153
230
AZ
ER
BA
IJA
N34
545
928
449
761
340
AR
ME
NIA
290
242
190
207
100
353
KA
ZA
KH
ST
AN
112
121
9210
420
561
UK
RA
INE
110
284
8226
128
379
MO
LDO
VA
9125
461
232
3031
3B
ELA
RU
S76
244
6124
215
252
TU
RK
ME
NIS
TA
N0
228
024
90
81
Tra
nsf
ers
fro
m t
he
Ru
ssia
n F
eder
atio
n1
in fa
vor
of r
esid
ent i
ndiv
idua
lsin
favo
r of
non
resi
dent
indi
vid
uals
in fa
vor
of in
divi
dual
s, to
tal
49

Tab
le 4
.4
Bal
ance
3
tota
lre
side
nt in
divi
dual
sno
nres
iden
t ind
ivid
uals
tota
l am
ount
of t
rans
fers
, mill
ions
of
US
dol
lars
tota
l am
ount
of t
rans
fers
, mill
ions
of
US
dol
lars
tota
l am
ount
of t
rans
fers
, mill
ions
of
US
dol
lars
To
tal
-4 4
41-2
903
-1 5
38N
on
-CIS
co
un
trie
s-2
017
-1 8
01-2
16fr
om w
hich
2 :
SW
ITZ
ER
LAN
D-4
95-5
3642
SP
AIN
-264
-258
-6
LUX
EM
BO
UR
G-1
94-1
984
JAP
AN
-170
-168
-2
TU
RK
EY
-164
-112
-52
GY
PR
US
-118
-121
3
ITA
LY-1
16-1
04-1
2
AU
ST
RIA
-112
-102
-11
UN
ITE
D K
ING
DO
M-1
11-9
2-1
9
GE
OR
GIA
-101
-81
-20
MO
NA
CO
-90
-79
-11
CZ
EC
H R
EP
UB
LIC
-88
-88
0
FR
AN
CE
-82
-65
-17
UN
ITE
D S
TA
TE
S O
F A
ME
RIC
A-5
5-4
5-9
ISR
AE
L-2
7-2
70
LAT
VIA
-1-8
6
NE
TH
ER
LAN
DS
1217
-5
SIN
GA
PO
RE
5859
-2
GE
RM
AN
Y89
104
-15
LIE
CH
TE
NS
TE
IN21
722
1-4
CIS
co
un
trie
s-2
424
-1 1
01-1
323
UZ
BE
KIS
TA
N-1
127
-328
-799
TA
JIK
IST
AN
-612
-336
-276
KY
RG
YZ
ST
AN
-396
-266
-130
AZ
ER
BA
IJA
N-2
68-2
15-5
3
AR
ME
NIA
-169
-100
-69
MO
LDO
VA
-58
-32
-26
UK
RA
INE
-37
-18
-20
BE
LAR
US
-20
-12
-7
TU
RK
ME
NIS
TA
N16
115
KA
ZA
KH
ST
AN
248
205
43
2 Dat
a on
top
20 c
ount
ries
by tu
rnov
er.
3 Neg
ativ
e ba
lanc
e re
flect
s th
e ex
cess
of t
he a
mou
nt o
f rem
ittan
ces
from
the
Rus
sian
Fed
erat
ion
over
the
amou
nt o
f rem
ittan
ces
to th
e R
ussi
an F
eder
atio
n.
1 M
oney
tran
sfer
s to
Rus
sia
in fa
vor
of r
esid
ent a
nd n
onre
side
nt in
divi
dual
s an
d m
oney
tran
sfer
s fr
om R
ussi
a of
res
iden
t and
non
resi
dent
indi
vidu
als
mad
e vi
a cr
edit
inst
itutio
ns (
with
/with
out o
peni
ng a
n ac
coun
t) in
clud
ing
rem
ittan
ces
via
paym
ent s
yste
ms
and
FG
UP
"P
ocht
a R
ossi
i".
50
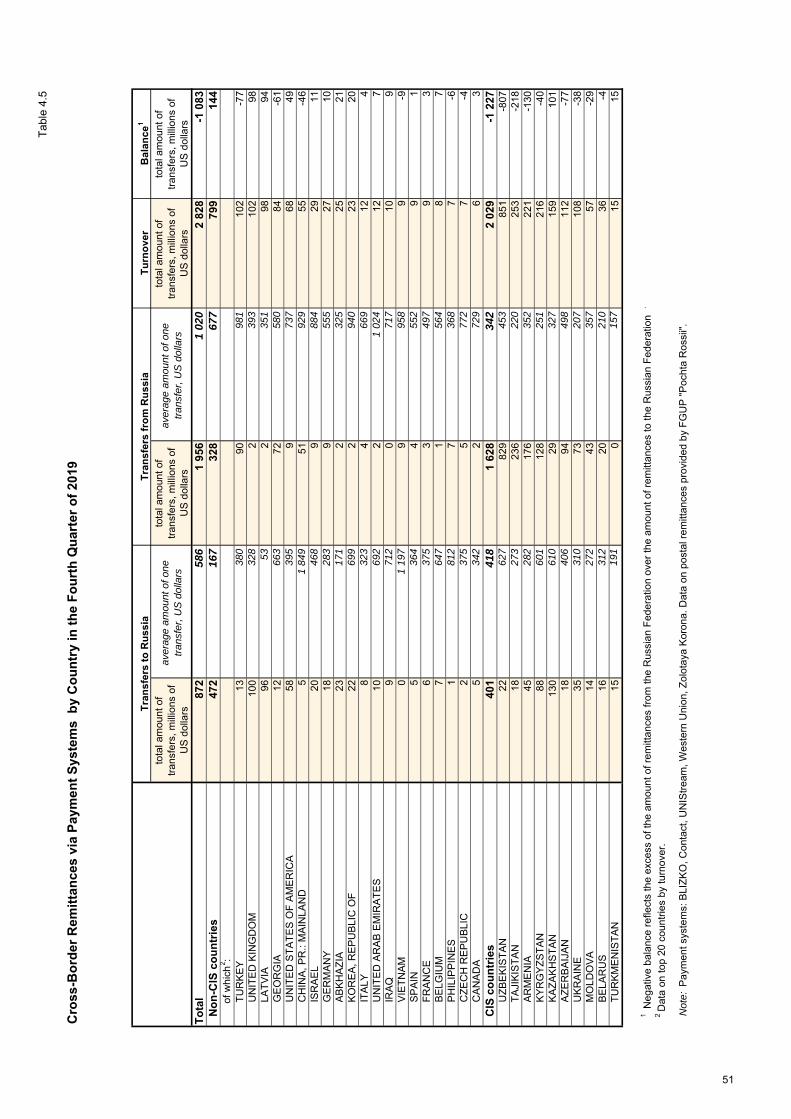
Tab
le 4
.5
Cro
ss-B
ord
er R
emit
tan
ces
via
Pay
men
t S
yste
ms
by
Co
un
try
in t
he
Fo
urt
h Q
uar
ter
of
2019
Tra
nsf
ers
to R
uss
iaT
ran
sfer
s fr
om
Ru
ssia
Tu
rno
ver
Bal
ance
1
tota
l am
ount
of
tran
sfer
s, m
illio
ns o
f U
S d
olla
rs
aver
age
amou
nt o
f one
tr
ansf
er, U
S d
olla
rs
tota
l am
ount
of
tran
sfer
s, m
illio
ns o
f U
S d
olla
rs
aver
age
amou
nt o
f one
tr
ansf
er, U
S d
olla
rs
tota
l am
ount
of
tran
sfer
s, m
illio
ns o
f U
S d
olla
rs
tota
l am
ount
of
tran
sfer
s, m
illio
ns o
f U
S d
olla
rs
872
586
1 95
61
020
2 82
8-1
083
472
167
328
677
799
144
of w
hich
2:
TU
RK
EY
1338
090
981
102
-77
UN
ITE
D K
ING
DO
M10
032
82
393
102
98LA
TV
IA96
532
351
9894
GE
OR
GIA
1266
372
580
84-6
1U
NIT
ED
ST
AT
ES
OF
AM
ER
ICA
5839
59
737
6849
CH
INA
, PR
.: M
AIN
LAN
D5
1 84
951
929
55-4
6IS
RA
EL
2046
89
884
2911
GE
RM
AN
Y18
283
955
527
10A
BK
HA
ZIA
2317
12
325
2521
KO
RE
A, R
EP
UB
LIC
OF
2269
92
940
2320
ITA
LY8
323
466
912
4U
NIT
ED
AR
AB
EM
IRA
TE
S10
692
21
024
127
IRA
Q9
712
071
710
9V
IET
NA
M0
1 19
79
958
9-9
SP
AIN
536
44
552
91
FR
AN
CE
637
53
497
93
BE
LGIU
M7
647
156
48
7P
HIL
IPP
INE
S1
812
736
87
-6C
ZE
CH
RE
PU
BLI
C2
375
577
27
-4C
AN
AD
A5
342
272
96
340
141
81
628
342
2 02
9-1
227
UZ
BE
KIS
TA
N22
627
829
453
851
-807
TA
JIK
IST
AN
1827
323
622
025
3-2
18A
RM
EN
IA45
282
176
352
221
-130
KY
RG
YZ
ST
AN
8860
112
825
121
6-4
0K
AZ
AK
HS
TA
N13
061
029
327
159
101
AZ
ER
BA
IJA
N18
406
9449
811
2-7
7U
KR
AIN
E35
310
7320
710
8-3
8M
OLD
OV
A14
272
4335
757
-29
BE
LAR
US
1631
220
210
36-4
TU
RK
ME
NIS
TA
N15
191
015
715
15
2 D
ata
on to
p 20
cou
ntrie
s by
turn
over
.
N
ote:
Pay
men
t sys
tem
s: B
LIZ
KO
, Con
tact
, UN
IStr
eam
, Wes
tern
Uni
on, Z
olot
aya
Kor
ona.
Dat
a on
pos
tal r
emitt
ance
s pr
ovid
ed b
y F
GU
P "
Poc
hta
Ros
sii"
.
1 N
egat
ive
bala
nce
refle
cts
the
exce
ss o
f the
am
ount
of r
emitt
ance
s fr
om th
e R
ussi
an F
eder
atio
n ov
er th
e am
ount
of r
emitt
ance
s to
the
Rus
sian
Fed
erat
ion
.
To
tal
No
n-C
IS c
ou
ntr
ies
CIS
co
un
trie
s
51
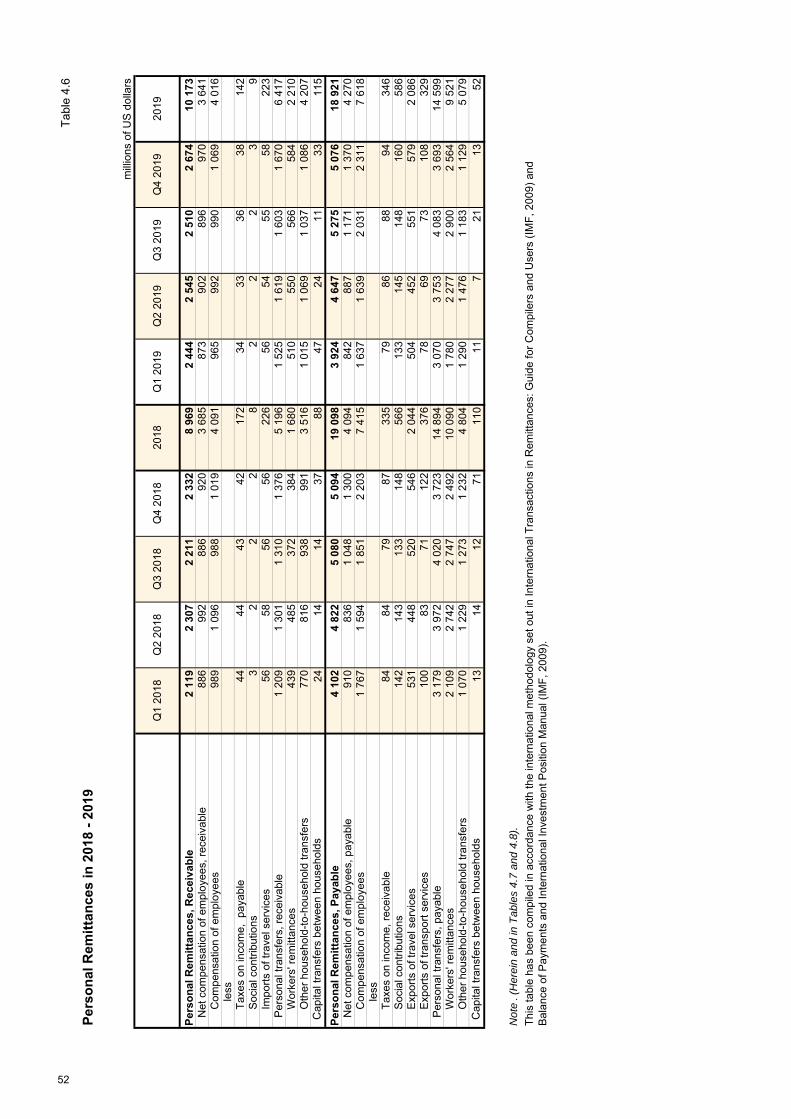
Tab
le 4
.6
Per
son
al R
emit
tan
ces
in 2
018
- 20
19
Q1
2018
Q2
2018
Q3
2018
Q4
2018
2018
Q1
2019
Q2
2019
Q3
2019
Q4
2019
201
9
Per
son
al R
emit
tan
ces,
Rec
eiva
ble
2 11
92
307
2 21
12
332
8 96
92
444
2 5
452
510
2 67
410
173
Net
com
pens
atio
n of
em
ploy
ees,
rec
eiva
ble
886
992
886
920
3 68
587
390
289
697
03
641
Com
pens
atio
n of
em
ploy
ees
989
1 09
698
81
019
4 09
196
599
299
01
069
4 0
16le
ssT
axes
on
inco
me,
pay
able
4444
4342
172
3433
3638
142
Soc
ial c
ontr
ibut
ions
32
22
82
22
39
Impo
rts
of tr
avel
ser
vice
s56
5856
5622
656
5455
5822
3P
erso
nal t
rans
fers
, rec
eiva
ble
1 20
91
301
1 31
01
376
5 19
61
525
1 6
191
603
1 67
06
417
Wor
kers
' rem
ittan
ces
439
485
372
384
1 68
051
055
056
658
42
210
Oth
er h
ouse
hold
-to-
hous
ehol
d tr
ansf
ers
770
816
938
991
3 51
61
015
1 0
691
037
1 08
64
207
Cap
ital t
rans
fers
bet
wee
n ho
useh
olds
2414
1437
8847
2411
3311
5
Per
son
al R
emit
tan
ces,
Pay
able
4 10
24
822
5 08
05
094
19 0
983
924
4 6
475
275
5 07
618
921
Net
com
pens
atio
n of
em
ploy
ees,
pay
able
910
836
1 04
81
300
4 09
484
28
871
171
1 37
04
270
Com
pens
atio
n of
em
ploy
ees
1 76
71
594
1 85
12
203
7 41
51
637
1 63
92
031
2 31
17
618
less
Tax
es o
n in
com
e, r
ecei
vabl
e84
8479
8733
579
8688
9434
6S
ocia
l con
trib
utio
ns14
214
313
314
856
613
314
514
816
058
6E
xpor
ts o
f tra
vel s
ervi
ces
531
448
520
546
2 04
450
445
255
157
92
086
Exp
orts
of t
rans
port
ser
vice
s10
083
7112
237
678
6973
108
329
Per
sona
l tra
nsfe
rs, p
ayab
le3
179
3 97
24
020
3 72
314
894
3 07
03
753
4 08
33
693
14 5
99W
orke
rs' r
emitt
ance
s2
109
2 74
22
747
2 49
210
090
1 78
02
277
2 90
02
564
9 52
1O
ther
hou
seho
ld-t
o-ho
useh
old
tran
sfer
s1
070
1 22
91
273
1 23
24
804
1 29
01
476
1 18
31
129
5 07
9 C
apita
l tra
nsfe
rs b
etw
een
hous
ehol
ds13
1412
7111
011
721
1352
Not
e. (
Her
ein
and
in T
able
s 4.
7 an
d 4.
8).
mill
ions
of U
S d
olla
rs
Thi
s ta
ble
has
been
com
pile
d in
acc
orda
nce
with
the
inte
rnat
ion
al m
etho
dolo
gy s
et o
ut in
Inte
rnat
iona
l Tra
nsac
tions
in R
emitt
anc
es: G
uide
for
Com
pile
rs a
nd U
sers
(IM
F, 2
009)
and
B
alan
ce o
f Pay
men
ts a
nd In
tern
atio
nal I
nves
tmen
t Pos
ition
Man
ual (
IMF
, 200
9).
52

Personal Remittances from the Russian Federation to CIS countries in 2018 - 2019
Q1 2018 Q2 2018 Q3 2018 Q4 2018 2018 Q1 2019 Q2 2019 Q3 2019 Q4 2019 2019
CIS countries 2 955 3 642 3 957 3 895 14 449 2 919 3 607 4 274 4 041 14 841
AZERBAIJAN 242 305 286 309 1 142 233 270 321 351 1 175
ARMENIA 234 293 302 292 1 121 216 264 300 279 1 059
BELARUS 163 161 161 182 667 129 138 157 183 607
KAZAKHSTAN 104 150 152 183 589 104 103 90 82 379
KYRGYZSTAN 434 603 616 636 2 288 544 616 653 650 2 462MOLDOVA, REPUBLIC OF 181 202 195 193 772 129 146 163 161 600
TAJIKISTAN 547 690 780 701 2 718 562 731 912 755 2 960
TURKMENISTAN 1 0 0 0 2 0 0 1 1 2
UZBEKISTAN 696 882 1 115 1 002 3 695 753 1 074 1 315 1 186 4 327
UKRAINE 354 357 348 397 1 456 251 265 362 393 1 271
Table 4.8
Personal Remittances to the Russian Federation from CIS countries in 2018 - 2019
Q1 2018 Q2 2018 Q3 2018 Q4 2018 2018 Q1 2019 Q2 2019 Q3 2019 Q4 2019 2019
CIS countries 503 551 495 522 2 071 475 526 542 590 2 133
AZERBAIJAN 18 20 20 24 82 24 26 23 26 99
ARMENIA 38 37 39 42 156 38 41 39 59 177
BELARUS 24 22 20 20 85 26 24 27 28 106
KAZAKHSTAN 217 254 219 226 916 185 221 233 241 880
KYRGYZSTAN 65 75 66 68 275 65 61 65 73 264MOLDOVA, REPUBLIC OF 13 15 16 19 63 20 20 22 25 88
TAJIKISTAN 25 23 18 21 87 24 20 19 15 79
TURKMENISTAN 3 4 3 4 14 6 10 8 10 35
UZBEKISTAN 73 74 66 69 282 62 65 70 69 267
UKRAINE 26 27 28 29 110 26 37 35 42 140
Table 4.7
millions of US dollars
millions of US dollars
53

Tab
le 5
.1
Inte
rnat
ion
al In
vest
men
t P
osi
tio
n o
f th
e R
uss
ian
Fed
erat
ion
in 2
013
- 20
19
Mai
n C
om
po
nen
ts
mill
ions
of U
S d
olla
rs
Pos
ition
as
ofP
ositi
on a
s of
Pos
ition
as
ofP
ositi
on a
s of
Pos
ition
as
ofP
ositi
on a
s of
Pos
ition
as
ofP
ositi
on a
s of
Pos
ition
as
ofP
ositi
on a
s of
Pos
ition
as
ofP
ositi
on a
s of
Pos
ition
as
ofP
ositi
on a
s of
31.1
2.20
1231
.12.
2013
31.1
2.20
1431
.12.
2015
31.1
2.20
1631
.12.
2017
31.0
3.20
1830
.06.
2018
30.0
9.20
1831
.12.
2018
31.0
3.20
1930
.06.
2019
30.0
9.20
1931
.12.
2019
Net
Inte
rnat
ion
al In
vest
men
t P
osi
tio
n14
2 33
213
1 73
631
3 24
833
9 16
921
9 66
628
0 52
929
3 98
231
5 65
831
9 43
537
4 01
337
3 82
437
8 32
038
2 7
9235
6 50
4A
sset
s1
380
699
1 47
4 59
81
278
199
1 17
7 93
81
241
073
1 34
6 74
71
399
040
1 35
2 39
91
342
820
1 34
3 14
81
405
758
1 46
1 26
61
460
224
1 51
0 56
7D
irec
t in
vest
men
t 40
9 56
747
9 50
141
4 41
337
5 03
442
6 60
847
7 21
349
3 59
046
9 83
645
1 94
743
5 86
245
8 78
947
7 31
347
6 50
750
0 58
3E
quity
and
inve
stm
ent f
und
shar
es
327
504
400
397
326
591
286
411
329
447
372
627
380
933
362
109
348
283
330
123
348
085
367
269
369
634
390
663
Deb
t ins
trum
ents
82 0
6479
104
87 8
2288
623
97 1
6110
4 58
711
2 65
710
7 72
710
3 66
410
5 7
3911
0 70
411
0 04
410
6 87
210
9 92
0P
ort
folio
inve
stm
ent
48 3
0053
743
56 6
3068
119
72 0
6073
946
74 0
7869
685
68 9
8868
551
72 7
2973
944
76 3
2680
294
Equ
ity a
nd in
vest
men
t fun
d sh
ares
5
271
3 23
24
433
2 81
53
172
4 64
54
678
5 28
75
588
5 77
56
593
7 71
87
529
8 45
7D
ebt s
ecur
ities
43
028
50 5
1152
197
65 3
0468
888
69 3
0169
400
64 3
9963
400
62 7
7666
136
66 2
2768
797
71 8
37F
inan
cial
der
ivat
ives
(o
ther
th
an r
eser
ves)
an
d e
mp
loye
e st
ock
op
tio
ns
5 55
35
932
17 5
6511
146
6 85
74
853
4 90
45
211
5 55
16
407
5 50
15
727
5 9
435
362
Oth
er in
vest
men
t 37
9 66
142
5 82
740
4 13
235
5 24
135
7 80
735
7 99
336
8 47
235
0 91
835
7 17
136
3 83
338
0 93
638
5 91
937
0 52
536
9 96
8O
ther
equ
ity
3 42
54
201
4 37
15
319
6 24
96
976
6 99
36
971
7 18
87
450
7 45
37
458
7 4
467
759
Cur
renc
y an
d de
posi
ts
159
411
173
378
181
346
148
089
136
218
149
513
160
252
150
970
155
172
164
183
181
973
187
293
177
864
168
770
Loan
s 17
9 67
919
7 81
016
6 75
016
1 58
617
8 06
117
0 26
216
9 38
416
1 23
016
4 49
416
2 11
616
4 97
516
3 37
715
6 37
415
7 54
3In
sura
nce,
pen
sion
, and
sta
ndar
dize
d gu
aran
tee
sche
mes
1
796
2 25
12
274
1 49
82
127
2 01
12
167
1 94
11
663
1 34
81
525
1 48
11
534
1 37
3T
rade
cre
dit a
nd a
dvan
ces
21 4
7028
163
31 3
2727
884
24 4
3217
140
18 5
6314
986
13 5
4515
185
12 5
2012
579
14 3
9022
031
Oth
er a
ccou
nts
rece
ivab
le13
879
20 0
2318
064
10 8
6310
720
12 0
9111
112
14 8
2015
110
13 5
5112
490
13 7
3012
917
12 4
91R
eser
ve a
sset
s 53
7 61
850
9 59
538
5 46
036
8 39
937
7 74
143
2 74
245
7 99
545
6 74
945
9 16
346
8 49
548
7 80
351
8 36
353
0 92
355
4 35
9L
iab
iliti
es1
238
368
1 34
2 86
296
4 95
183
8 76
91
021
407
1 06
6 21
81
105
057
1 03
6 74
21
023
385
969
135
1 03
1 93
41
082
946
1 07
7 43
21
154
063
Dir
ect
inve
stm
ent
514
926
565
654
371
491
347
690
477
670
529
644
551
835
525
632
518
230
497
366
529
283
544
556
554
035
585
814
Equ
ity a
nd in
vest
men
t fun
d sh
ares
39
4 70
040
9 85
623
6 14
420
7 83
033
6 05
538
0 70
340
2 68
237
9 00
237
6 11
735
6 68
838
2 47
239
5 91
640
4 52
243
6 46
7D
ebt i
nstr
umen
ts12
0 22
615
5 79
813
5 34
713
9 85
914
1 61
514
8 94
114
9 15
214
6 63
014
2 11
314
0 67
814
6 81
114
8 64
014
9 51
314
9 34
7P
ort
folio
inve
stm
ent
270
725
273
737
156
424
141
647
215
960
230
155
249
527
223
830
228
668
206
909
239
608
273
956
268
333
302
674
Equ
ity a
nd in
vest
men
t fun
d sh
ares
19
4 46
119
5 09
411
1 19
910
3 01
516
5 79
615
9 53
917
3 91
016
1 69
917
1 53
715
2 73
217
4 51
319
4 24
118
6 71
221
1 91
9D
ebt s
ecur
ities
76
263
78 6
4245
225
38 6
3250
164
70 6
1675
618
62 1
3257
131
54 1
7765
095
79 7
1581
622
90 7
55F
inan
cial
der
ivat
ives
(o
ther
th
an r
eser
ves)
an
d e
mp
loye
e st
ock
op
tio
ns
4 28
54
355
21 5
309
245
6 45
54
505
4 34
13
957
5 07
34
933
4 72
95
317
5 30
05
733
Oth
er in
vest
men
t 44
8 43
349
9 11
741
5 50
634
0 18
732
1 32
230
1 91
529
9 35
428
3 32
327
1 41
425
9 92
725
8 31
425
9 11
824
9 76
325
9 84
2O
ther
equ
ity
01
222
225
211
183
168
150
119
122
9588
105
Cur
renc
y an
d de
posi
ts
189
372
201
947
162
496
119
332
107
259
92 7
3193
982
83 6
5082
599
75 4
5773
995
69 0
2166
202
66 5
18Lo
ans
241
631
278
410
234
179
205
440
197
344
191
508
188
602
176
781
170
449
166
459
166
406
163
028
162
042
166
512
Insu
ranc
e, p
ensi
on, a
nd s
tand
ardi
zed
guar
ante
e sc
hem
es
398
531
846
616
594
596
701
678
677
576
662
713
829
793
Tra
de c
redi
t and
adv
ance
s 2
932
3 11
53
469
2 87
02
981
3 07
33
162
3 33
13
353
3 06
33
041
5 89
86
403
9 30
0O
ther
acc
ount
s pa
yabl
e5
382
6 37
66
295
4 04
75
292
5 70
94
467
10 7
246
260
6 35
06
201
12 4
636
455
8 76
1S
peci
al d
raw
ing
right
s (N
et in
curr
ence
of
liabi
litie
s)8
718
8 73
68
218
7 86
07
628
8 08
78
257
7 99
07
926
7 90
27
888
7 90
07
744
7 85
3
54
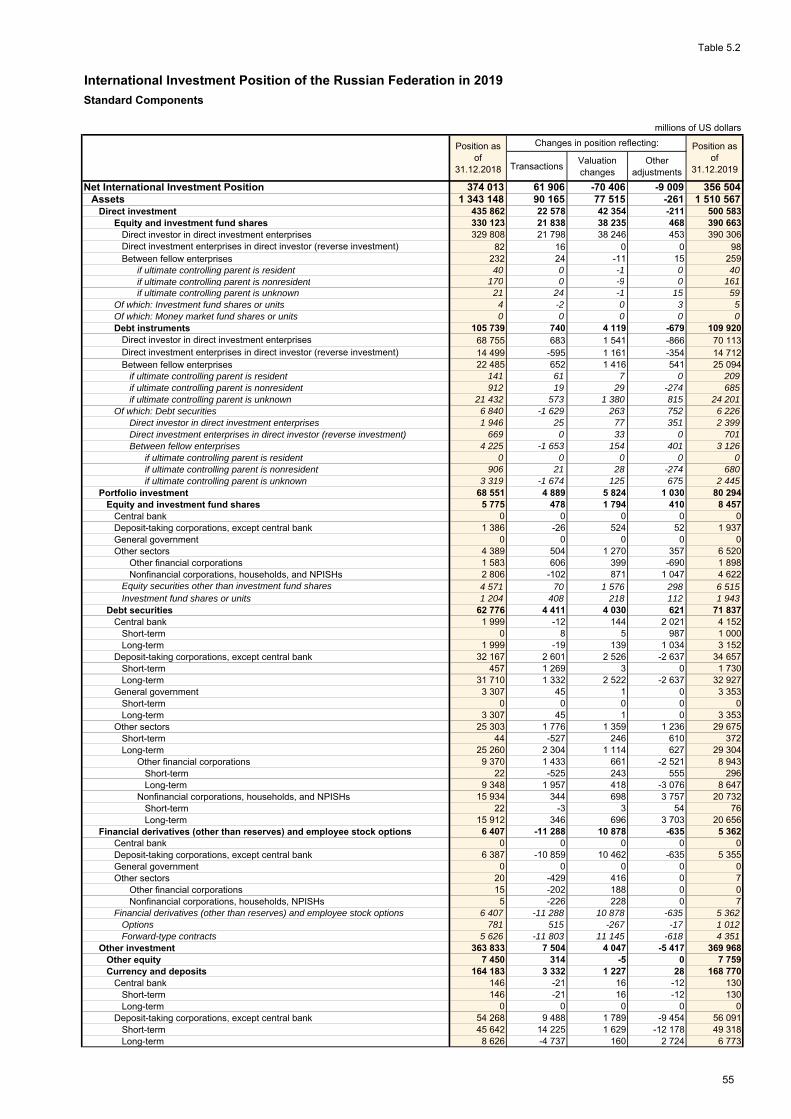
Table 5.2
International Investment Position of the Russian Federation in 2019
Standard Components
millions of US dollars
TransactionsValuation changes
Other adjustments
Net International Investment Position 374 013 61 906 -70 406 -9 009 356 504Assets 1 343 148 90 165 77 515 -261 1 510 567
Direct investment 435 862 22 578 42 354 -211 500 583Equity and investment fund shares 330 123 21 838 38 235 468 390 663
Direct investor in direct investment enterprises 329 808 21 798 38 246 453 390 306Direct investment enterprises in direct investor (reverse investment) 82 16 0 0 98Between fellow enterprises 232 24 -11 15 259
if ultimate controlling parent is resident 40 0 -1 0 40if ultimate controlling parent is nonresident 170 0 -9 0 161if ultimate controlling parent is unknown 21 24 -1 15 59
Of which: Investment fund shares or units 4 -2 0 3 5Of which: Money market fund shares or units 0 0 0 0 0Debt instruments 105 739 740 4 119 -679 109 920
Direct investor in direct investment enterprises 68 755 683 1 541 -866 70 113Direct investment enterprises in direct investor (reverse investment) 14 499 -595 1 161 -354 14 712Between fellow enterprises 22 485 652 1 416 541 25 094
if ultimate controlling parent is resident 141 61 7 0 209if ultimate controlling parent is nonresident 912 19 29 -274 685if ultimate controlling parent is unknown 21 432 573 1 380 815 24 201
Of which: Debt securities 6 840 -1 629 263 752 6 226Direct investor in direct investment enterprises 1 946 25 77 351 2 399Direct investment enterprises in direct investor (reverse investment) 669 0 33 0 701Between fellow enterprises 4 225 -1 653 154 401 3 126
if ultimate controlling parent is resident 0 0 0 0 0if ultimate controlling parent is nonresident 906 21 28 -274 680if ultimate controlling parent is unknown 3 319 -1 674 125 675 2 445
Portfolio investment 68 551 4 889 5 824 1 030 80 294Equity and investment fund shares 5 775 478 1 794 410 8 457
Central bank 0 0 0 0 0Deposit-taking corporations, except central bank 1 386 -26 524 52 1 937General government 0 0 0 0 0Other sectors 4 389 504 1 270 357 6 520
Other financial corporations 1 583 606 399 -690 1 898Nonfinancial corporations, households, and NPISHs 2 806 -102 871 1 047 4 622
Equity securities other than investment fund shares 4 571 70 1 576 298 6 515Investment fund shares or units 1 204 408 218 112 1 943
Debt securities 62 776 4 411 4 030 621 71 837Central bank 1 999 -12 144 2 021 4 152
Short-term 0 8 5 987 1 000Long-term 1 999 -19 139 1 034 3 152
Deposit-taking corporations, except central bank 32 167 2 601 2 526 -2 637 34 657Short-term 457 1 269 3 0 1 730Long-term 31 710 1 332 2 522 -2 637 32 927
General government 3 307 45 1 0 3 353Short-term 0 0 0 0 0Long-term 3 307 45 1 0 3 353
Other sectors 25 303 1 776 1 359 1 236 29 675Short-term 44 -527 246 610 372Long-term 25 260 2 304 1 114 627 29 304
Other financial corporations 9 370 1 433 661 -2 521 8 943Short-term 22 -525 243 555 296Long-term 9 348 1 957 418 -3 076 8 647
Nonfinancial corporations, households, and NPISHs 15 934 344 698 3 757 20 732Short-term 22 -3 3 54 76Long-term 15 912 346 696 3 703 20 656
Financial derivatives (other than reserves) and employee stock options 6 407 -11 288 10 878 -635 5 362Central bank 0 0 0 0 0Deposit-taking corporations, except central bank 6 387 -10 859 10 462 -635 5 355General government 0 0 0 0 0Other sectors 20 -429 416 0 7
Other financial corporations 15 -202 188 0 0Nonfinancial corporations, households, NPISHs 5 -226 228 0 7
Financial derivatives (other than reserves) and employee stock options 6 407 -11 288 10 878 -635 5 362Options 781 515 -267 -17 1 012Forward-type contracts 5 626 -11 803 11 145 -618 4 351
Other investment 363 833 7 504 4 047 -5 417 369 968Other equity 7 450 314 -5 0 7 759Currency and deposits 164 183 3 332 1 227 28 168 770
Central bank 146 -21 16 -12 130Short-term 146 -21 16 -12 130Long-term 0 0 0 0 0
Deposit-taking corporations, except central bank 54 268 9 488 1 789 -9 454 56 091Short-term 45 642 14 225 1 629 -12 178 49 318Long-term 8 626 -4 737 160 2 724 6 773
Position as of
31.12.2018
Changes in position reflecting: Position as of
31.12.2019
55

Table 5.2
millions of US dollars
TransactionsValuation changes
Other adjustments
Of which: Interbank positions 41 074 3 465 1 483 -175 45 848General government 0 0 0 0 0Other sectors 109 769 -6 135 -579 9 494 112 549
Short-term 109 769 -6 135 -579 9 494 112 549Long-term 0 0 0 0 0
Other financial corporations 5 046 1 882 -133 27 6 821Short-term 5 046 1 882 -133 27 6 821Long-term 0 0 0 0 0
Nonfinancial corporations, households, NPISHs 104 724 -8 017 -446 9 467 105 728Short-term 104 724 -8 017 -446 9 467 105 728Long-term 0 0 0 0 0
Loans 162 116 -2 999 2 041 -3 614 157 543Central bank 37 0 5 0 42
Credit and loans with the IMF (other than reserves) 0 0 0 0 0Other short-term 0 0 0 0 0Other long-term 37 0 5 0 42
Deposit-taking corporations, except central bank 75 013 -2 252 434 1 003 74 199Short-term 4 798 2 617 142 -942 6 615Long-term 70 215 -4 869 293 1 946 67 584
General government 39 795 -38 -1 203 39 960Credit and loans with the IMF (other than reserves) 0 0 0 0 0Other short-term 0 0 0 0 0Other long-term 39 795 -38 -1 203 39 960
Other sectors 47 270 -710 1 603 -4 821 43 343Short-term 10 071 -105 436 -5 213 5 190Long-term 37 199 -605 1 167 392 38 153
Other financial corporations 14 311 263 868 -3 502 11 940Short-term 4 035 -326 158 -2 268 1 598Long-term 10 276 590 710 -1 234 10 342
Nonfinancial corporations, households, and NPISHs 32 960 -973 735 -1 319 31 403Short-term 6 036 221 279 -2 945 3 591Long-term 26 923 -1 194 456 1 626 27 811
Insurance, pension, and standardized guarantee schemes 1 348 -120 146 0 1 373Central bank 0 0 0 0 0Deposit-taking corporations, except central bank 0 0 0 0 0General government 0 0 0 0 0Other sectors 1 348 -120 146 0 1 373
Other financial corporations 1 348 -120 146 0 1 373Nonfinancial corporations, households, NPISHs 0 0 0 0 0
Nonlife insurance technical reserves 1 229 -160 144 0 1 213Life insurance and annuity entitlements 118 40 2 0 160
Trade credit and advances 15 185 6 735 110 0 22 031Central bank 0 0 0 0 0Deposit-taking corporations, except central bank 0 0 0 0 0General government 221 0 -4 0 217
Short-term 0 0 0 0 0Long-term 221 0 -4 0 217
Other sectors 14 964 6 735 114 0 21 814Short-term 14 964 6 735 114 0 21 814Long-term 0 0 0 0 0
Nonfinancial corporations, households, and NPISHs 14 964 6 735 114 0 21 814Short-term 14 964 6 735 114 0 21 814Long-term 0 0 0 0 0
Other accounts receivable 13 551 242 528 -1 831 12 491Central bank 1 0 0 0 1
Short-term 1 0 0 0 1Long-term 0 0 0 0 0
Deposit-taking corporations, except central bank 11 793 -267 404 -1 666 10 264Short-term 5 083 9 237 192 -9 549 4 963Long-term 6 711 -9 505 213 7 883 5 301
General government 781 197 40 0 1 018Short-term 440 197 41 0 678Long-term 340 0 0 0 340
Other sectors 976 313 84 -164 1 208Short-term 976 313 83 -164 1 208Long-term 0 0 0 0 0
Other financial corporations 422 48 49 -53 465Short-term 422 48 49 -53 465Long-term 0 0 0 0 0
Nonfinancial corporations, households, NPISHs 554 265 34 -111 743Short-term 554 265 34 -111 743Long-term 0 0 0 0 0
Reserve assets 468 495 66 481 14 412 4 972 554 359Monetary gold 86 903 0 16 455 7 019 110 376
Gold bullion 86 903 0 16 455 7 019 110 376Unallocated gold accounts 0 0 0 0 0
Of which: Monetary gold under swap for cash collateral 0 0 0 0 0Special drawing rights 6 737 18 -38 0 6 717
Position as of
31.12.2018
Changes in position reflecting: Position as of
31.12.2019
56

Table 5.2
millions of US dollars
TransactionsValuation changes
Other adjustments
Reserve position in the IMF 3 122 869 -21 0 3 970Other reserve assets 371 733 65 594 -1 983 -2 047 433 297
Currency and deposits 148 025 27 002 -146 0 174 881Claims on monetary authorities 82 590 22 908 448 0 105 946Claims on other entities 65 435 4 094 -594 0 68 935
Securities 222 938 34 989 -1 970 -2 047 253 911Debt securities 222 938 34 989 -1 970 -2 047 253 911
Short-term 45 093 7 398 -331 -987 51 174Long-term 177 845 27 591 -1 639 -1 060 202 737
Other claims 769 3 603 132 0 4 505Liabilities 969 135 28 259 147 920 8 748 1 154 063
Direct investment 497 366 31 783 48 844 7 821 585 814Equity and investment fund shares 356 688 28 845 45 464 5 470 436 467
Direct investor in direct investment enterprises 356 049 30 451 44 525 2 334 433 359Direct investment enterprises in direct investor (reverse investment) 461 -1 308 692 3 080 2 926Between fellow enterprises 178 -298 247 56 183
if ultimate controlling parent is resident 111 -298 249 57 119if ultimate controlling parent is nonresident 55 0 -16 0 39if ultimate controlling parent is unknown 12 0 14 0 26
Of which: Investment fund shares or units 5 383 -19 793 26 6 183Debt instruments 140 678 2 939 3 380 2 351 149 347
Direct investor in direct investment enterprises 39 068 -663 2 015 2 004 42 425Direct investment enterprises in direct investor (reverse investment) 72 694 2 372 286 -462 74 889Between fellow enterprises 28 916 1 230 1 078 809 32 033
if ultimate controlling parent is resident 338 -156 11 -25 168if ultimate controlling parent is nonresident 3 999 275 48 0 4 323if ultimate controlling parent is unknown 24 578 1 111 1 018 835 27 542
Of which: Debt securities 588 33 38 -4 656Direct investor in direct investment enterprises 568 33 36 -4 633Direct investment enterprises in direct investor (reverse investment) 0 0 0 0 0Between fellow enterprises 20 0 2 0 22
if ultimate controlling parent is resident 0 0 0 0 0if ultimate controlling parent is nonresident 20 0 2 0 22if ultimate controlling parent is unknown 0 0 0 0 0
Portfolio investment 206 909 17 450 80 045 -1 730 302 674Equity and investment fund shares 152 732 -4 325 65 949 -2 438 211 919
Central bank 0 0 0 0 0Deposit-taking corporations, except central bank 18 663 -257 9 578 27 28 011General government 0 0 0 0 0Other sectors 134 069 -4 068 56 372 -2 466 183 908
Other financial corporations 2 878 53 852 1 121 4 904Nonfinancial corporations, households, and NPISHs 131 191 -4 121 55 520 -3 587 179 003
Equity securities other than investment fund shares 152 464 -4 333 65 872 -2 421 211 583Investment fund shares or units 268 8 77 -17 336
Debt securities 54 177 21 774 14 096 708 90 755Central bank 0 0 0 0 0Deposit-taking corporations, except central bank 4 478 -222 290 -114 4 431
Short-term 971 -57 -31 -11 872Long-term 3 507 -165 321 -103 3 560
General government 42 478 22 253 13 207 297 78 235Short-term 0 0 0 0 0Long-term 42 478 22 253 13 207 297 78 235
Other sectors 7 222 -257 599 526 8 090Short-term 0 0 0 0 0Long-term 7 222 -257 599 526 8 090
Other financial corporations 1 998 -267 96 301 2 127Short-term 0 0 0 0 0Long-term 1 998 -267 96 301 2 127
Nonfinancial corporations, households, and NPISHs 5 224 10 503 225 5 962Short-term 0 0 0 0 0Long-term 5 224 10 503 225 5 962
Financial derivatives (other than reserves) and employee stock options 4 933 -13 908 14 996 -289 5 733Central bank 0 0 0 0 0Deposit-taking corporations, except central bank 4 931 -13 359 14 448 -289 5 731General government 0 0 0 0 0Other sectors 2 -548 548 0 2
Other financial corporations 0 -208 208 0 0Nonfinancial corporations, households, NPISHs 2 -340 340 0 2
Financial derivatives (other than reserves) and employee stock options 4 933 -13 908 14 996 -289 5 733Options 361 -83 294 0 571Forward-type contracts 4 572 -13 825 14 702 -289 5 161
Other investment 259 927 -7 066 4 036 2 946 259 842Other equity 119 0 18 -32 105Currency and deposits 75 457 -10 040 1 080 21 66 518
Central bank 2 251 -630 254 33 1 908Short-term 2 251 -630 254 33 1 908Long-term 0 0 0 0 0
Deposit-taking corporations, except central bank 73 130 -9 537 822 -12 64 402Short-term 26 421 -1 338 677 -5 25 755
Position as of
31.12.2018
Changes in position reflecting: Position as of
31.12.2019
57
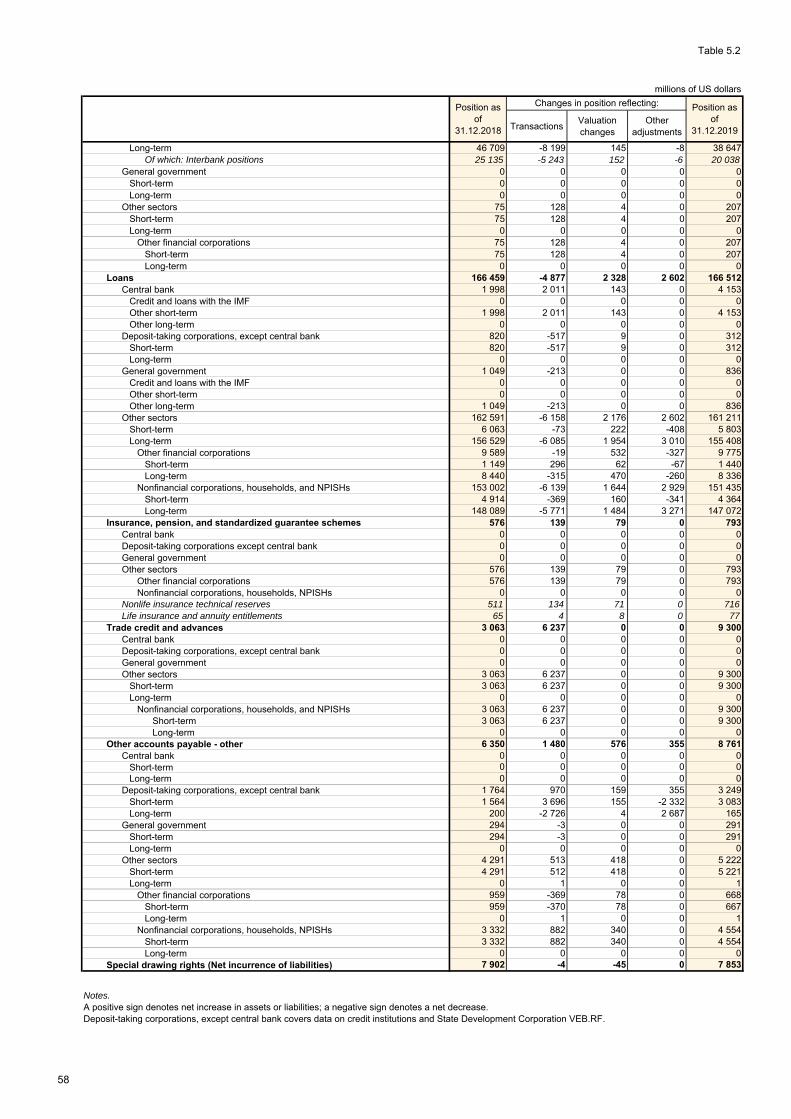
Table 5.2
millions of US dollars
TransactionsValuation changes
Other adjustments
Long-term 46 709 -8 199 145 -8 38 647Of which: Interbank positions 25 135 -5 243 152 -6 20 038
General government 0 0 0 0 0Short-term 0 0 0 0 0Long-term 0 0 0 0 0
Other sectors 75 128 4 0 207Short-term 75 128 4 0 207Long-term 0 0 0 0 0
Other financial corporations 75 128 4 0 207Short-term 75 128 4 0 207Long-term 0 0 0 0 0
Loans 166 459 -4 877 2 328 2 602 166 512Central bank 1 998 2 011 143 0 4 153
Credit and loans with the IMF 0 0 0 0 0Other short-term 1 998 2 011 143 0 4 153Other long-term 0 0 0 0 0
Deposit-taking corporations, except central bank 820 -517 9 0 312Short-term 820 -517 9 0 312Long-term 0 0 0 0 0
General government 1 049 -213 0 0 836Credit and loans with the IMF 0 0 0 0 0Other short-term 0 0 0 0 0Other long-term 1 049 -213 0 0 836
Other sectors 162 591 -6 158 2 176 2 602 161 211Short-term 6 063 -73 222 -408 5 803Long-term 156 529 -6 085 1 954 3 010 155 408
Other financial corporations 9 589 -19 532 -327 9 775Short-term 1 149 296 62 -67 1 440Long-term 8 440 -315 470 -260 8 336
Nonfinancial corporations, households, and NPISHs 153 002 -6 139 1 644 2 929 151 435Short-term 4 914 -369 160 -341 4 364Long-term 148 089 -5 771 1 484 3 271 147 072
Insurance, pension, and standardized guarantee schemes 576 139 79 0 793Central bank 0 0 0 0 0Deposit-taking corporations except central bank 0 0 0 0 0General government 0 0 0 0 0Other sectors 576 139 79 0 793
Other financial corporations 576 139 79 0 793Nonfinancial corporations, households, NPISHs 0 0 0 0 0
Nonlife insurance technical reserves 511 134 71 0 716Life insurance and annuity entitlements 65 4 8 0 77
Trade credit and advances 3 063 6 237 0 0 9 300Central bank 0 0 0 0 0Deposit-taking corporations, except central bank 0 0 0 0 0General government 0 0 0 0 0Other sectors 3 063 6 237 0 0 9 300
Short-term 3 063 6 237 0 0 9 300Long-term 0 0 0 0 0
Nonfinancial corporations, households, and NPISHs 3 063 6 237 0 0 9 300Short-term 3 063 6 237 0 0 9 300Long-term 0 0 0 0 0
Other accounts payable - other 6 350 1 480 576 355 8 761Central bank 0 0 0 0 0
Short-term 0 0 0 0 0Long-term 0 0 0 0 0
Deposit-taking corporations, except central bank 1 764 970 159 355 3 249Short-term 1 564 3 696 155 -2 332 3 083Long-term 200 -2 726 4 2 687 165
General government 294 -3 0 0 291Short-term 294 -3 0 0 291Long-term 0 0 0 0 0
Other sectors 4 291 513 418 0 5 222Short-term 4 291 512 418 0 5 221Long-term 0 1 0 0 1
Other financial corporations 959 -369 78 0 668Short-term 959 -370 78 0 667Long-term 0 1 0 0 1
Nonfinancial corporations, households, NPISHs 3 332 882 340 0 4 554Short-term 3 332 882 340 0 4 554Long-term 0 0 0 0 0
Special drawing rights (Net incurrence of liabilities) 7 902 -4 -45 0 7 853
Notes.A positive sign denotes net increase in assets or liabilities; a negative sign denotes a net decrease. Deposit-taking corporations, except central bank covers data on credit institutions and State Development Corporation VEB.RF.
Position as of
31.12.2018
Changes in position reflecting: Position as of
31.12.2019
58
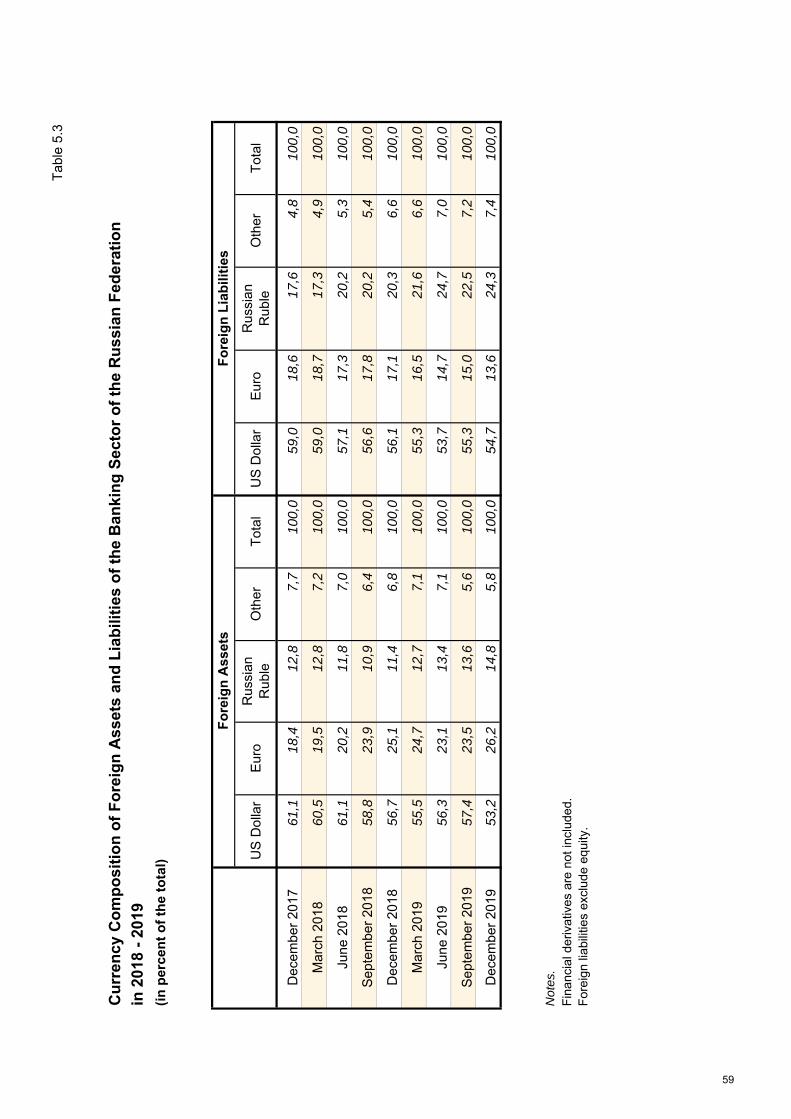
Tab
le 5
.3
Cu
rren
cy C
om
po
siti
on
of
Fo
reig
n A
sset
s an
d L
iab
iliti
es o
f th
e B
anki
ng
Sec
tor
of
the
Ru
ssia
n F
eder
atio
n
in 2
018
- 20
19
(in
per
cen
t o
f th
e to
tal) U
S D
olla
rE
uro
Rus
sian
R
uble
Oth
erT
otal
US
Dol
lar
Eur
oR
ussi
an
Rub
leO
ther
Tot
al
Dec
embe
r 20
1761
,118
,412
,87,
710
0,0
59,0
18,6
17,6
4,8
100,
0
Mar
ch 2
018
60,5
19,5
12,8
7,2
100,
059
,018
,717
,34,
910
0,0
June
201
861
,120
,211
,87,
010
0,0
57,1
17,3
20,2
5,3
100,
0
Sep
tem
ber
2018
58,8
23,9
10,9
6,4
100,
056
,617
,820
,25,
410
0,0
Dec
embe
r 20
1856
,725
,111
,46,
810
0,0
56,1
17,1
20,3
6,6
100,
0
Mar
ch 2
019
55,5
24,7
12,7
7,1
100,
055
,316
,521
,66,
610
0,0
June
201
956
,323
,113
,47,
110
0,0
53,7
14,7
24,7
7,0
100,
0
Sep
tem
ber
2019
57,4
23,5
13,6
5,6
100,
055
,315
,022
,57,
210
0,0
Dec
embe
r 20
1953
,226
,214
,85,
810
0,0
54,7
13,6
24,3
7,4
100,
0
Fin
anci
al d
eriv
ativ
es a
re n
ot in
clud
ed.
For
eign
liab
ilitie
s ex
clud
e eq
uity
.
Not
es.
Fo
reig
n A
sset
sF
ore
ign
Lia
bili
ties
59

Table 5.4
millions of US dollars
Exchange rate changes
Market price changes
International Reserves 468 495 18 582 177 -272 821 19 308 487 803 Monetary gold 86 903 0 2 325 0 783 3 108 90 011 Special drawing rights 6 737 5 0 -12 0 -7 6 730 Reserve position in the IMF 3 122 293 0 -7 0 287 3 409 Other reserve assets 371 733 18 284 -2 148 -253 38 15 920 387 653
millions of US dollars
Exchange rate changes
Market price changes
International Reserves 487 803 16 585 4 313 914 8 748 30 561 518 363 Monetary gold 90 011 0 1 644 0 8 622 10 267 100 278 Special drawing rights 6 730 5 0 10 0 15 6 745 Reserve position in the IMF 3 409 309 0 5 0 314 3 723 Other reserve assets 387 653 16 270 2 669 900 126 19 965 407 618
millions of US dollars
Exchange rate changes
Market price changes
International Reserves 518 363 15 930 1 031 -10 457 6 056 12 560 530 923 Monetary gold 100 278 0 1 652 0 5 917 7 569 107 846 Special drawing rights 6 745 4 0 -131 0 -126 6 618 Reserve position in the IMF 3 723 304 0 -76 0 229 3 952 Other reserve assets 407 618 15 621 -621 -10 251 139 4 889 412 507
millions of US dollars
Exchange rate changes
Market price changes
International Reserves 530 923 15 385 -550 7 763 839 23 437 554 359 Monetary gold 107 846 0 1 397 0 1 133 2 530 110 376 Special drawing rights 6 618 4 0 95 0 99 6 717 Reserve position in the IMF 3 952 -38 0 56 0 18 3 970 Other reserve assets 412 507 15 419 -1 947 7 612 -294 20 790 433 297
millions of US dollars
Exchange rate changes
Market price changes
International Reserves 468 495 66 481 4 972 -2 052 16 464 85 864 554 359 Monetary gold 86 903 0 7 019 0 16 455 23 473 110 376 Special drawing rights 6 737 18 0 -38 0 -20 6 717 Reserve position in the IMF 3 122 869 0 -21 0 847 3 970 Other reserve assets 371 733 65 594 -2 047 -1 992 9 61 564 433 297
Commentary.
Position as of 30.03.2019
Position as of 30.06.2019
Revaluation
Changes in position
reflecting transactions
Other changes
Total changes
Position as of 30.06.2019
Revaluation Total changes
Revaluation
Position as of 31.12.2019
Position as of 30.09.2019
Changes in position
reflecting transactions
Other changes
Other changes
International Investment Position on International Reserves of the Russian Federation in 2019
Total changes
Position as of 31.12.2019
Total changes
Position as of 31.12.2018
Changes in position
reflecting transactions
Other changes
Revaluation
RevaluationPosition as of 30.09.2019
Changes in position
reflecting transactions
Position as of 31.12.2018
Changes in position
reflecting transactions
Other changes
Position as of 30.03.2019
Total changes
International reserves (reserve assets) of the Russian Federation are highly liquid external assets that are readily available to the Bank of Russia and the Government of the Russian Federation.International reserves consist of monetary gold, special drawing rights (SDR) holdings, reserve position in the International Monetary Fund (IMF, Fund), and other reserve assets.Monetary gold is defined as standard gold bars and coins with a purity of at least 995/1,000 held by the Bank of Russia and the Government of the Russian Federation. It comprises gold in vault, en route and in allocated accounts, including those that are held abroad.Special drawing rights are international reserve assets created by the IMF and allocated to members; included are balances of SDR holdings on the account of the Russian Federation in the Fund's SDR Department.Reserve position in the IMF is the sum of the reserve tranche position (representing foreign exchange component of the quota of the Russian Federation in the Fund) and the country's claims on the IMF arising from lending under the New Arrangements to Borrow.Other reserve assets include foreign currency; balances on nostro corresponding accounts including unallocated gold accounts; deposits with the initial maturity of up to 1 year including gold deposits with foreign central banks, the Bank for International Settlements (BIS) and nonresident deposit-taking corporations; debt securities issued by nonresidents; loans extended under reverse repo agreements, and other financial claims on nonresidents with the initial maturity of up to 1 year.Funds received under repos with nonresidents are shown as an increase in Other reserve assets .Securities received as collateral under reverse repos or under securiries' lending agreements (received in exchange for other securities) are not included in international reserves. Securities provided to counterparties under securities' lending transactions are recorded in international reserves, whereas securities that serve as collateral under repurchase agreements are excluded therefrom.Part of resources on accounts of the Reserve Fund and of the National Wealth Fund of the Russian Federation which is denominated in foreign currency, deposited with the Bank of Russia and further invested by the Bank of Russia in foreign financial assets is included in the international reserves of the Russian Federation.Foreign exchange-denominated claims of the Bank of Russia and of the Government of the Russian Federation on residents are not included in the international reserves of the Russian Federation.
60
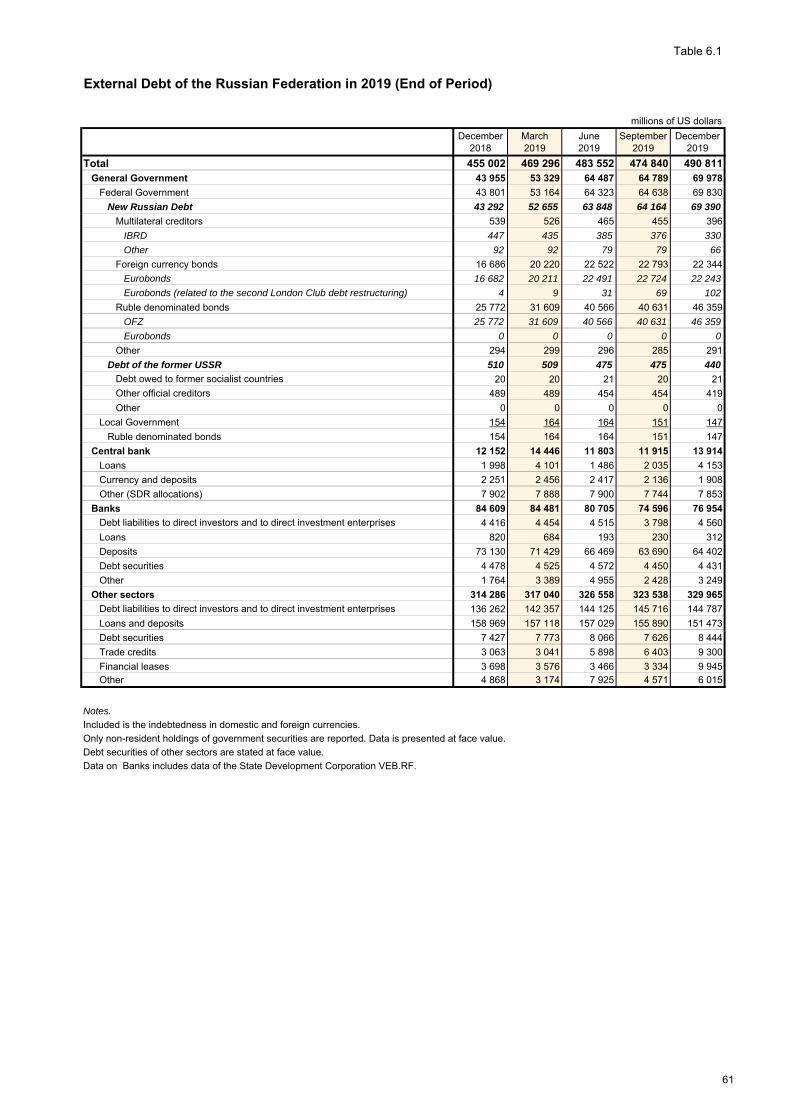
Table 6.1
External Debt of the Russian Federation in 2019 (End of Period)
millions of US dollars
December 2018
March 2019
June 2019
September 2019
December 2019
Total 455 002 469 296 483 552 474 840 490 811General Government 43 955 53 329 64 487 64 789 69 978
Federal Government 43 801 53 164 64 323 64 638 69 830
New Russian Debt 43 292 52 655 63 848 64 164 69 390Multilateral creditors 539 526 465 455 396
IBRD 447 435 385 376 330
Other 92 92 79 79 66
Foreign currency bonds 16 686 20 220 22 522 22 793 22 344
Eurobonds 16 682 20 211 22 491 22 724 22 243
Eurobonds (related to the second London Club debt restructuring) 4 9 31 69 102
Ruble denominated bonds 25 772 31 609 40 566 40 631 46 359
OFZ 25 772 31 609 40 566 40 631 46 359
Eurobonds 0 0 0 0 0
Other 294 299 296 285 291
Debt of the former USSR 510 509 475 475 440Debt owed to former socialist countries 20 20 21 20 21
Other official creditors 489 489 454 454 419
Other 0 0 0 0 0
Local Government 154 164 164 151 147
Ruble denominated bonds 154 164 164 151 147
Central bank 12 152 14 446 11 803 11 915 13 914
Loans 1 998 4 101 1 486 2 035 4 153
Currency and deposits 2 251 2 456 2 417 2 136 1 908
Other (SDR allocations) 7 902 7 888 7 900 7 744 7 853
Banks 84 609 84 481 80 705 74 596 76 954
Debt liabilities to direct investors and to direct investment enterprises 4 416 4 454 4 515 3 798 4 560
Loans 820 684 193 230 312
Deposits 73 130 71 429 66 469 63 690 64 402
Debt securities 4 478 4 525 4 572 4 450 4 431
Other 1 764 3 389 4 955 2 428 3 249
Other sectors 314 286 317 040 326 558 323 538 329 965
Debt liabilities to direct investors and to direct investment enterprises 136 262 142 357 144 125 145 716 144 787
Loans and deposits 158 969 157 118 157 029 155 890 151 473
Debt securities 7 427 7 773 8 066 7 626 8 444
Trade credits 3 063 3 041 5 898 6 403 9 300
Financial leases 3 698 3 576 3 466 3 334 9 945Other 4 868 3 174 7 925 4 571 6 015
Notes.
Included is the indebtedness in domestic and foreign currencies.
Only non-resident holdings of government securities are reported. Data is presented at face value.
Debt securities of other sectors are stated at face value.
Data on Banks includes data of the State Development Corporation VEB.RF.
61

Table 6.2
External Debt of the Russian Federation in 2019
(By Maturity and Financial Instrument, End of Period)
millions of US dollars
December 2018
March 2019
June 2019
September 2019
December 2019
Total Liabilities 455 002 469 296 483 552 474 840 490 811
Short-term 54 130 54 069 64 274 57 936 68 011
Long-term 400 872 415 227 419 278 416 903 422 800General Government 43 955 53 329 64 487 64 789 69 978
Short-term 294 299 296 285 291Other liabilities 294 299 296 285 291
Long-term 43 661 53 030 64 191 64 505 69 687Debt securities 42 611 51 994 63 251 63 575 68 850Loans 1 049 1 036 940 929 836Other liabilities 0 0 0 0 0
Central bank 12 152 14 446 11 803 11 915 13 914Short-term 4 249 6 558 3 903 4 171 6 061
Loans 1 998 4 101 1 486 2 035 4 153Currency and deposits 2 251 2 456 2 417 2 136 1 908
Long-term 7 902 7 888 7 900 7 744 7 853Other liabilities (SDR allocation) 7 902 7 888 7 900 7 744 7 853
Banks (excluding debt liabilities to direct investors and to direct investment enterprises) 80 193 80 028 76 190 70 798 72 394
Short-term 29 776 30 547 30 830 27 210 30 022Debt securities 971 964 938 880 872Loans 820 684 193 230 312Current accounts and deposits 26 421 25 740 24 928 23 846 25 755Other liabilities 1 564 3 159 4 770 2 254 3 083
Long-term 50 416 49 480 45 360 43 588 42 372Debt securities 3 507 3 561 3 634 3 571 3 560Deposits 46 709 45 689 41 541 39 843 38 647Other liabilities 200 230 185 174 165
Other sectors (excluding debt liabilities to direct investors and to direct investment enterprises) 178 024 174 683 182 434 177 823 185 178Other financial corporations 13 345 13 484 13 668 13 887 13 884
Short-term 2 759 2 648 2 677 3 128 3 107Loans and deposits 1 224 1 182 1 182 1 543 1 647Other liabilities 1 535 1 466 1 495 1 585 1 460
Long-term 10 585 10 836 10 991 10 759 10 777Debt securities 2 145 2 169 2 208 2 303 2 441Loans and deposits 8 440 8 667 8 783 8 456 8 336Other liabilities - - - - 1
Nonfinancial corporations, households, and NPISHs 164 680 161 198 168 765 163 936 171 293Short-term 11 309 9 472 17 173 14 042 18 218
Debt securities 0 0 0 0 0Loans 4 914 4 723 4 845 4 654 4 364Trade credits 3 063 3 041 5 898 6 403 9 300Other liabilities 3 332 1 708 6 430 2 986 4 554
Long-term 153 370 151 727 151 592 149 893 153 075Debt securities 5 282 5 604 5 858 5 323 6 004Loans 148 089 146 123 145 734 144 571 147 072
Direct investment 140 678 146 811 148 640 149 513 149 347Banks 4 416 4 454 4 515 3 798 4 560
Direct investor in direct investment enterprises 65 85 99 50 80Direct investment enterprises in direct investor (reverse investment) 33 25 17 8 11Between fellow enterprises 4 318 4 345 4 398 3 739 4 469
Other sectors 136 262 142 357 144 125 145 716 144 787Direct investor in direct investment enterprises 39 003 40 337 42 773 42 244 42 344Direct investment enterprises in direct investor (reverse investment) 72 660 73 435 74 086 75 943 74 878Between fellow enterprises 24 598 28 586 27 265 27 528 27 564
Notes.Included is the indebtedness in domestic and foreign currencies.Only non-resident holdings of government securities are reported. Data is presented at face value.Debt securities of other sectors are stated at face value.Data on Banks includes data of State Development Corporation VEB.RF.
62
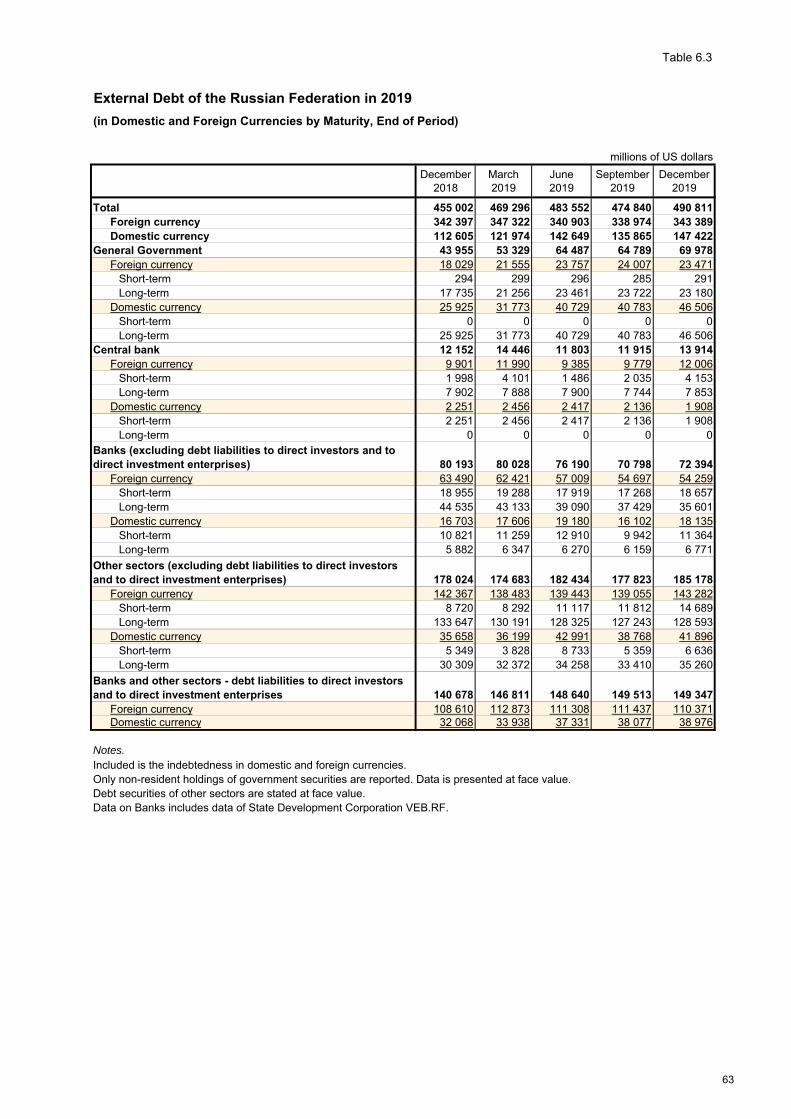
Table 6.3
External Debt of the Russian Federation in 2019
(in Domestic and Foreign Currencies by Maturity, End of Period)
millions of US dollars
December 2018
March 2019
June 2019
September 2019
December 2019
Total 455 002 469 296 483 552 474 840 490 811Foreign currency 342 397 347 322 340 903 338 974 343 389Domestic currency 112 605 121 974 142 649 135 865 147 422
General Government 43 955 53 329 64 487 64 789 69 978Foreign currency 18 029 21 555 23 757 24 007 23 471
Short-term 294 299 296 285 291Long-term 17 735 21 256 23 461 23 722 23 180
Domestic currency 25 925 31 773 40 729 40 783 46 506Short-term 0 0 0 0 0Long-term 25 925 31 773 40 729 40 783 46 506
Central bank 12 152 14 446 11 803 11 915 13 914Foreign currency 9 901 11 990 9 385 9 779 12 006
Short-term 1 998 4 101 1 486 2 035 4 153Long-term 7 902 7 888 7 900 7 744 7 853
Domestic currency 2 251 2 456 2 417 2 136 1 908Short-term 2 251 2 456 2 417 2 136 1 908Long-term 0 0 0 0 0
Banks (excluding debt liabilities to direct investors and to direct investment enterprises) 80 193 80 028 76 190 70 798 72 394
Foreign currency 63 490 62 421 57 009 54 697 54 259Short-term 18 955 19 288 17 919 17 268 18 657Long-term 44 535 43 133 39 090 37 429 35 601
Domestic currency 16 703 17 606 19 180 16 102 18 135Short-term 10 821 11 259 12 910 9 942 11 364Long-term 5 882 6 347 6 270 6 159 6 771
Other sectors (excluding debt liabilities to direct investors and to direct investment enterprises) 178 024 174 683 182 434 177 823 185 178
Foreign currency 142 367 138 483 139 443 139 055 143 282Short-term 8 720 8 292 11 117 11 812 14 689Long-term 133 647 130 191 128 325 127 243 128 593
Domestic currency 35 658 36 199 42 991 38 768 41 896Short-term 5 349 3 828 8 733 5 359 6 636Long-term 30 309 32 372 34 258 33 410 35 260
Banks and other sectors - debt liabilities to direct investors and to direct investment enterprises 140 678 146 811 148 640 149 513 149 347
Foreign currency 108 610 112 873 111 308 111 437 110 371Domestic currency 32 068 33 938 37 331 38 077 38 976
Notes.Included is the indebtedness in domestic and foreign currencies.Only non-resident holdings of government securities are reported. Data is presented at face value.Debt securities of other sectors are stated at face value.Data on Banks includes data of State Development Corporation VEB.RF.
63

Tab
le 6
.4
Pay
men
t S
ched
ule
of
Ext
ern
al D
ebt
of
the
Ru
ssia
n F
eder
atio
n(A
s o
f D
ecem
ber
31,
201
9)m
illio
ns o
f US
dol
lars
Jan
uary
20
20 F
ebru
ary
202
0 M
arch
202
0 A
pril
2020
May
202
0 J
une
202
0 J
uly
2020
Aug
ust
202
0 S
epte
mbe
r 2
020
Oct
ober
202
0 N
ovem
ber
202
0 D
ecem
ber
202
0O
ne y
ear
or le
ssQ
1 20
21Q
2 20
21Q
3 20
21Q
4 20
21O
ver
one
year
to
two
year
s
Ove
r tw
o ye
ars
To
tal
490
811
22 3
9915
879
7 95
88
397
4 86
83
381
4 54
53
572
2 06
36
126
5 52
04
628
13 0
8780
022
12 0
0311
794
10 2
0421
709
55 7
1026
0 93
619
330
52 4
14G
ener
al G
ove
rnm
ent
69 9
780
673
1251
853
121
05
104
3147
561
395
1161
71
324
630
2 58
265
690
672
44F
eder
al G
over
nmen
t69
830
067
312
518
528
210
289
1645
551
357
1161
71
318
621
2 56
865
594
6724
4N
ew R
ussi
an D
ebt
69 3
900
673
1251
849
321
02
8916
4521
1 28
711
582
1 31
858
62
498
65 3
1567
224
Loan
s39
60
43
018
1921
02
016
1321
118
241
237
8219
60
0D
ebt s
ecur
ities
68 7
030
630
1250
047
40
00
890
310
1 16
99
541
1 31
654
92
416
65 1
180
0O
ther
291
00
00
00
00
00
00
00
00
00
00
6722
4D
ebt o
f the
form
er U
SSR
440
00
00
035
00
00
00
3570
035
035
7028
00
21Lo
ans
440
00
00
035
00
00
00
3570
035
035
7028
00
21O
ther
00
00
00
00
00
00
00
00
00
00
00
0Lo
cal G
over
nmen
t14
70
00
00
20
03
1515
20
380
05
814
960
0Lo
ans
00
00
00
00
00
00
00
00
00
00
00
0B
onds
147
00
00
02
00
315
152
038
00
58
1496
00
Cen
tral
ban
k13
914
1 90
84
153
00
00
00
00
00
04
153
00
00
00
07
853
Loan
s 4
153
04
153
00
00
00
00
00
04
153
00
00
00
00
Cur
renc
y an
d de
posi
ts1
908
1 90
80
00
00
00
00
00
00
00
00
00
00
Oth
er (
SD
R a
lloca
tion)
7 85
30
00
00
00
00
00
00
00
00
00
00
7 85
3B
anks
2,3
76 9
5417
378
4 62
01
927
1 78
255
647
765
71
643
222
468
1 94
789
788
916
087
809
2 82
42
562
2 33
08
525
26 3
567
868
740
Loan
s an
d de
posi
ts (
exce
pt fo
r de
man
d de
posi
ts)
51 8
900
4 62
01
927
1 78
255
647
765
71
643
222
468
1 94
789
788
916
087
809
2 8
242
562
2 33
08
525
26 3
5692
20
Cur
rent
acc
ount
s an
d de
man
d de
posi
ts17
378
17 3
780
00
00
00
00
00
00
00
00
00
00
Deb
t sec
uriti
es4
431
00
00
00
00
00
00
00
00
00
00
3 69
174
0O
ther
3 25
51
00
00
00
00
00
00
00
00
00
03
255
0O
ther
sec
tors
329
965
3 11
37
038
6 02
86
602
3 79
42
373
3 86
71
929
1 83
55
554
3 54
23
685
12 1
4258
388
11 1
838
353
6 31
718
749
44 6
0316
8 89
111
394
43 5
76D
ebt l
iabi
litie
s to
dire
ct in
vest
ors
and
to d
irect
inve
stm
ent e
nter
pris
es3
144
787
2 27
12
913
2 71
92
717
2 30
050
51
549
448
442
3 45
71
681
1 85
15
457
26 0
395
963
1 96
11
539
6 08
115
544
82 0
649
092
9 77
6Lo
ans
and
depo
sits
151
473
842
2 08
02
051
3 00
11
430
1 64
52
252
1 41
31
328
2 03
21
587
1 7
686
617
27 2
034
997
6 14
84
460
12 3
5127
956
76 1
270
19 3
44D
ebt s
ecur
ities
8 44
40
37
301
159
24
11
211
24
424
3153
128
126
339
2 28
12
057
3 34
4T
rade
cre
dits
9 30
00
00
00
00
00
00
00
00
00
00
00
9 30
0F
inan
cial
leas
es9
945
064
6464
6464
6464
6464
6464
6476
319
119
119
119
176
38
418
00
Oth
er
6 01
50
1 97
91
187
792
00
00
00
00
03
958
00
00
00
245
1 81
2
1 In
clud
ed a
re a
rrea
rs, p
refe
rred
sha
res
owne
d by
non
resi
dent
s an
d ot
her
inde
bted
ness
with
out s
ched
ule.
2 D
ata
incl
ude
liabi
litie
s of
cre
dit i
nstit
utio
ns a
nd S
tate
Dev
elo
pmen
t Cor
pora
tion
VE
B.R
F.
3 P
aym
ent s
ched
ule
of d
ebt l
iabi
litie
s to
dire
ct in
vest
ors
and
to d
irect
inve
stm
ent e
nter
pris
es is
com
pile
d ac
cord
ing
to in
itia
l bor
row
ing
cond
ition
s an
d do
es n
ot c
onsi
der
poss
ible
res
truc
turin
g fo
r de
bt r
elie
f pur
pose
s.
Not
es.
Incl
uded
is th
e in
debt
edne
ss in
dom
estic
and
fore
ign
curr
enci
es.
The
diff
eren
ce b
etw
een
the
tota
l out
stan
ding
am
ount
of d
ebt a
nd th
e pa
ymen
t sch
edul
e ar
ises
from
diff
eren
ce b
etw
een
mar
ket a
nd n
omin
al v
alue
for
the
inst
rum
ents
val
ued
at m
arke
t pric
e.S
ourc
es u
sed
for
exte
rnal
deb
t com
pila
tion
are
data
pre
sent
ed b
y th
e C
entr
al B
ank
of th
e R
ussi
an F
eder
atio
n (B
ank
of R
ussi
a), M
inis
try
of F
inan
ce o
f the
Rus
sian
Fed
erat
ion
(Min
fin o
f Rus
sia
), in
tern
atio
nal f
inan
cial
org
anis
atio
ns, l
ocal
gov
ernm
ent,
cre
dit o
rgan
izat
ions
, Sta
te
Dev
elop
men
t Cor
pora
tion
VE
B.R
F, d
epos
itary
-cle
arin
g sy
stem
s, a
nd
inst
itutio
nal u
nits
incl
uded
into
Oth
er s
ecto
rs.
Imm
edia
te
Th
e sc
hed
ule
is
no
t av
aila
ble
Deb
t w
ith
ou
t
sch
edu
le1
Ter
ms
of
Pay
men
tsE
xter
nal
deb
t as
of
Dec
emb
er
31, 2
019
64

Tab
le 6
.5
Inte
rest
Pay
men
t S
ched
ule
on
Ext
ern
al D
ebt
of
the
Ru
ssia
n F
eder
atio
n
(As
of
Dec
emb
er 3
1, 2
019)
mill
ions
of U
S d
olla
rs
Ter
ms
of
Pay
men
t
Jan
uary
20
20 F
ebru
ary
202
0 M
arch
202
0 A
pril
2020
May
202
0 J
une
202
0 J
uly
2020
Aug
ust
202
0 S
epte
mbe
r 2
020
Oct
ober
202
0 N
ovem
ber
202
0 D
ecem
ber
202
0O
ne y
ear
or le
ssQ
1 20
21Q
2 20
21Q
3 20
21Q
4 20
21O
ver
one
year
to
two
year
s
Ove
r tw
o ye
ars
To
tal
1 32
31
435
1 62
41
873
1 24
71
811
1 21
71
243
1 53
31
667
1 17
21
981
18 1
263
764
3 96
73
356
4 31
615
403
79 9
2911
3 45
8
Gen
eral
Gov
ernm
ent
342
302
356
676
193
441
339
302
472
548
177
463
4 61
21
109
1 16
31
106
1 16
84
546
37 1
3746
294
Fed
eral
Gov
ernm
ent
341
302
355
675
190
440
338
302
472
547
174
463
4 59
81
108
1 15
91
105
1 16
44
536
37 1
3046
264
New
Rus
sian
Deb
t34
130
235
567
519
043
533
830
247
254
717
445
84
589
1 10
81
155
1 10
51
160
4 52
837
115
46 2
31
Deb
t of t
he fo
rmer
US
SR
00
00
05
00
00
05
100
40
48
1533
Loca
l Gov
ernm
ent
10
11
31
10
11
30
141
41
410
730
Cen
tral
ban
k0
150
015
00
150
015
060
1515
1515
600
120
Ban
ks
255
251
219
216
213
211
203
198
197
189
183
178
2 51
351
949
145
141
41
875
5 25
89
645
Oth
er s
ecto
rs72
686
71
049
981
826
1 16
067
572
786
492
979
71
340
10 9
412
121
2 29
81
784
2 71
98
922
37 5
3557
398
Not
e:In
clud
ed a
re in
tere
st p
aym
ents
for
cate
gorie
s of
deb
t tha
t hav
e in
tere
st p
aym
ent s
ched
ule.
Exc
lude
d ar
e fu
ture
pay
men
ts o
f int
eres
t on
arre
ars
and
divi
dend
s on
pre
ferr
ed s
hare
s ow
ned
by n
onre
side
nts.
To
tal
inte
rest
p
aym
ents
65

Table 6.6
International Investment Position on External Debt of the Russian Federation in 2019
External debt as of December
31, 2018
Changes due to
transactions
Valuation changes
Other changes
Total changes
External debt as of December
31, 2019
Total 455 002 17 688 12 085 6 035 35 809 490 811General Government 43 955 22 018 3 730 275 26 023 69 978
Federal Government 43 801 22 042 3 712 274 26 029 69 830New Russian Debt 43 292 22 112 3 712 274 26 099 69 390
Multilateral creditors 539 -143 0 0 -143 396IBRD 447 -118 0 0 -118 330Other 92 -25 0 0 -26 66
Foreign currency bonds 16686 5826 -184 16 5658 22344Eurobonds 16 682 5 732 -171 0 5 561 22 243Eurobonds (related to the second London Club debt restructuring) 4 94 -13 16 97 102
Ruble denominated bonds 25 772 16 432 3 897 258 20 587 46 359OFZ 25 772 16 432 3 897 258 20 587 46 359Eurobonds 0 0 0 0 0 0
Other 294 -3 -1 0 -3 291Debt of the former USSR 510 -70 0 0 -70 440
Local Government 154 -24 18 0 -6 147Ruble denominated bonds 154 -24 18 0 -6 147
Central bank 12 152 1 377 352 33 1 762 13 914Loans 1 998 2 011 143 0 2 155 4 153Currency and deposits 2 251 -630 254 33 -343 1 908Other (SDR allocations) 7 902 -4 -45 0 -49 7 853
Banks 84 609 -9 188 1 342 192 -7 655 76 954Debt liabilities to direct investors and to direct investment enterprises 4 416 118 62 -36 144 4 560Loans 820 -517 9 0 -509 312Deposits 73 130 -9 537 822 -12 -8 728 64 402Debt securities 4 478 -222 290 -114 -47 4 431Other 1 764 970 159 355 1 484 3 249
Other sectors 314 286 3 481 6 661 5 536 15 678 329 965Debt liabilities to direct investors and to direct investment enterprises 136 262 2 821 3 318 2 386 8 525 144 787Loans and deposits 158 969 -5 267 2 040 -4 269 -7 496 151 473Debt securities 7 427 -197 667 547 1 017 8 444Trade credits 3 063 6 237 0 0 6 237 9 300Financial leases 3 698 -763 140 6 871 6 248 9 945Other 4 868 651 496 0 1 148 6 015
Notes.
Data on Banks includes State Development Corporation VEB.RF.
millions of US dollars
The difference between External Debt data, International Investment Position and Balance of Payments data is due to the fact that External Debt statistics for General government and Other sectors record financial instruments at face value, while transactions’ data do not include accrued interest and coupon values.
66
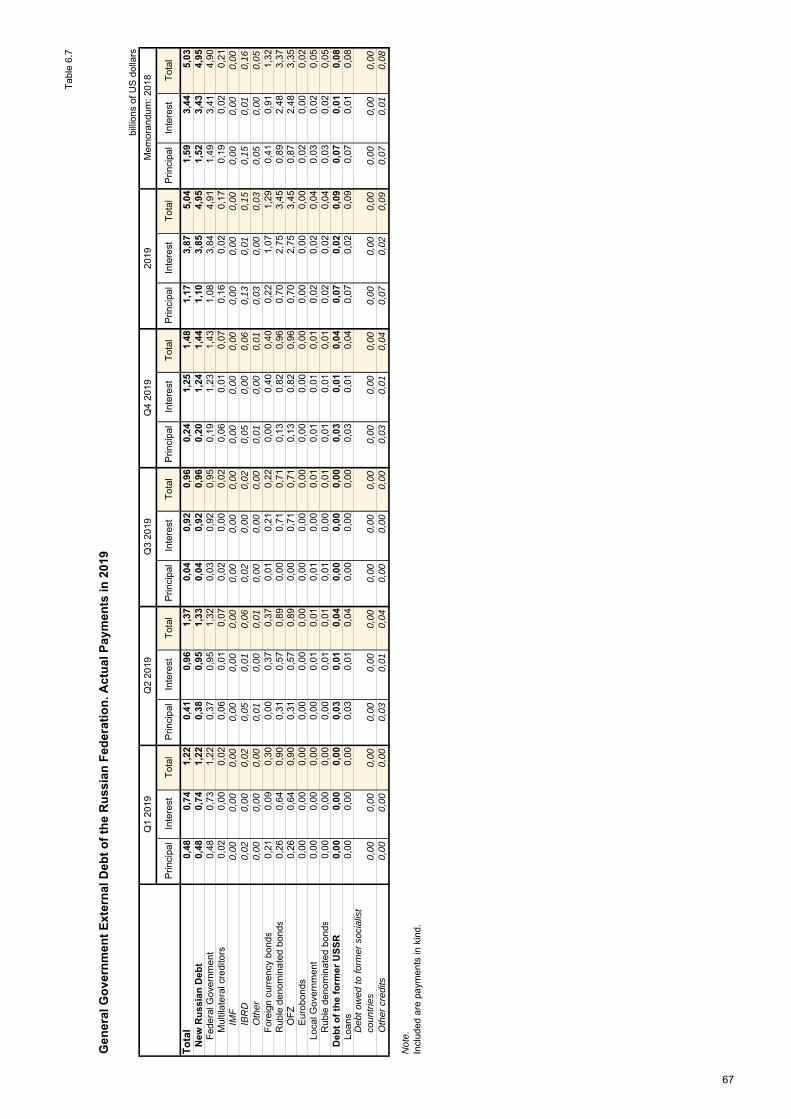
Tab
le 6
.7
Gen
eral
Go
vern
men
t E
xter
nal
Deb
t o
f th
e R
uss
ian
Fed
erat
ion
. Act
ual
Pay
men
ts in
201
9
billi
ons
of U
S d
olla
rs
Prin
cipa
lIn
tere
stT
otal
Prin
cipa
lIn
tere
stT
otal
Prin
cipa
lIn
tere
stT
ota
lP
rinci
pal
Inte
rest
Tot
alP
rinci
pal
Inte
rest
Tot
alP
rinci
pal
Inte
rest
Tot
al
To
tal
0,48
0,74
1,22
0,41
0,96
1,37
0,04
0,92
0,96
0,24
1,25
1,48
1,17
3,87
5,04
1,5
93,
445,
03N
ew R
uss
ian
Deb
t0,
480,
741,
220,
380,
951,
330,
040,
920,
960,
201,
241,
44
1,10
3,85
4,95
1,52
3,43
4,95
Fed
eral
Gov
ernm
ent
0,48
0,73
1,22
0,37
0,95
1,32
0,03
0,92
0,95
0,19
1,23
1,43
1,08
3,84
4,91
1,4
93,
414,
90M
ultil
ater
al c
redi
tor s
0,02
0,00
0,02
0,06
0,01
0,07
0,02
0,00
0,02
0,06
0,01
0,07
0,16
0,02
0,17
0,1
90,
020,
21IM
F0,
000,
000,
000,
000,
000,
000,
000,
000,
000,
000,
000,
000,
000,
000,
000,
000,
000,
00IB
RD
0,02
0,00
0,02
0,05
0,01
0,06
0,02
0,00
0,02
0,05
0,00
0,06
0,13
0,01
0,15
0,15
0,01
0,16
Oth
er0,
000,
000,
000,
010,
000,
010,
000,
000,
000,
010,
000,
010,
030,
000,
030,
050,
000,
05F
orei
gn c
urre
ncy
bond
s0,
210,
090,
300,
000,
370,
370,
010,
210,
220,
000,
400,
400,
221,
071,
290,
41
0,91
1,32
Rub
le d
enom
inat
ed b
ond
s0,
260,
640,
900,
310,
570,
890,
000,
710,
710,
130,
820,
960,
702,
753,
450,
89
2,48
3,37
OF
Z0,
260,
640,
900,
310,
570,
890,
000,
710,
710,
130,
820,
960,
702,
753,
450,
872,
483,
35E
urob
onds
0,
000,
000,
000,
000,
000,
000,
000,
000,
000,
000,
000,
000,
000
,00
0,00
0,02
0,00
0,02
Loca
l Gov
ernm
ent
0,00
0,00
0,00
0,00
0,01
0,01
0,01
0,00
0,01
0,01
0,01
0,01
0,02
0,02
0,04
0,0
30,
020,
05R
uble
den
omin
ated
bon
ds
0,00
0,00
0,00
0,00
0,01
0,01
0,01
0,00
0,01
0,01
0,01
0,01
0,02
0,02
0,04
0,0
30,
020,
05D
ebt
of
the
form
er U
SS
R0,
000,
000,
000,
030,
010,
040,
000,
000,
000,
030,
010,
040,
070,
020,
090,
07
0,01
0,08
Loan
s0,
000,
000,
000,
030,
010,
040,
000,
000,
000,
030,
010,
040,
070,
020,
090,
070,
010,
08D
ebt o
wed
to fo
rmer
soc
ialis
t co
untr
ies
0,00
0,00
0,00
0,00
0,00
0,00
0,00
0,00
0,00
0,00
0,00
0,00
0,00
0,00
0,00
0,00
0,00
0,00
Oth
er c
redi
ts0,
000,
000,
000,
030,
010,
040,
000,
000,
000,
030,
010,
040,
070,
020,
090,
070,
010,
08
Not
e.In
clud
ed a
re p
aym
ents
in k
ind .
Mem
oran
dum
: 201
8Q
2 20
19Q
1 20
1920
19Q
3 20
19Q
4 20
19
67

Table 6.8
External Debt Sustainability Ratios of the Russian Federation
(End of Period)
External Debt to
GDP Ratio, % 1/
External Debt to
Exports Ratio, % 2/
External Debt Service
to GDP Ratio, % 3/, 6/
External Debt Service to Exports
Ratio, % 4/ , 6/
International Reserves to External Debt
Service Ratio, % 5/, 6/
Per Capita External Debt ,
USD
March 2013 31 118 10 38 235 4 825June 2013 31 121 10 38 232 4 935
September 2013 31 121 10 38 236 4 988December 2013 32 123 10 40 217 5 072
March 2014 32 121 10 39 214 4 981June 2014 33 123 10 39 207 5 016
September 2014 30 116 9 35 221 4 653December 2014 29 107 9 32 219 4 100
March 2015 30 106 7 26 258 3 810June 2015 32 116 9 31 240 3 802
September 2015 36 125 9 31 277 3 665December 2015 38 132 9 32 288 3 539
March 2016 39 144 10 36 301 3 548June 2016 41 155 11 41 285 3 565
September 2016 41 157 11 40 300 3 531December 2016 40 154 10 40 282 3 486
March 2017 37 146 11 42 263 3 554June 2017 36 141 11 41 268 3 590
September 2017 35 136 10 40 273 3 605December 2017 33 126 9 33 317 3 528
March 2018 32 121 8 32 333 3 544June 2018 30 107 8 29 340 3 344
September 2018 28 97 7 25 376 3 206December 2018 27 90 7 22 428 3 100
March 2019 29 92 7 22 431 3 197June 2019 29 97 7 23 447 3 296
September 2019 28 96 7 22 484 3 236December 2019 29 102 7 25 460 3 345
Memorandum:
Indicative thresholds* 30 - 40 - 50 100 - 150 - 200 - 15 - 20 - 25 - -
Indicative thresholds ** 50 130 - 220 - 25 should exceed 100 -
1/ Total outstanding external debt as of the end of period to GDP for the period.2/ Total outstanding external debt as of the end of period to exports of goods and services for the period.
6/ Payment schedule of external debt of the Russian Federation includes amortization in kind and payments made in Russian rubles.
* Indicative thresholds recommended by the International Monetary Fund. Degree of risk: "low - medium - high." ** Indicative thresholds recommended by the Accounting Chamber of the Russian Federation. Bulletin of the Accounting Chamber of the Russian Federation №9 (81), 2004.
Notes.The estimations are based on the data of the Bank of Russia and Federal State Statistics Service.
3/ Annual external debt service payments (principal, icluding principal immediately available on demand or immediately due, and interest) scheduled for the outstanding external debt as of the end of period to GDP for the period.4/ Annual external debt service payments (principal, icluding principal immediately available on demand or immediately due, and interest) scheduled for the outstanding external debt as of the end of period to exports of goods and services for the period.5/ International reserves as of the end of period over annual external debt service payments (principal, icluding principal immediately available on demand or immediately due, and interest) scheduled for the outstanding external debt as of the end of the period.
Total outstanding external debt includes gross outstanding external debt of general government, central bank, banks and other sectors as of the end of reporting period (reporting date).
A wide range of debt ratios should be used for external debt sustainability comprehensive analysis, taking into account specific features of an economy.
68

Supplement 7.1
List of Principal Changes Introduced in the Balance of Payments Data of the Russian Federation for Preceding Periods
The Table below contains the list of updates introduced in the previously released balance of
payments data of the Russian Federation for Q3 2019, detailing the reasons for each of them with the
use of the following codes: changes in reported data underlying the balance of payments compilation –
О; improvement of balance of payments methodology and/or that of the calculation and estimation
methods of certain balance of payments items – М; use of new information sources about previously
unaccounted transactions with nonresidents (or accounted for on the basis of other information) – НИИ;
adjustments related to changes of double-entries in the balance of payments – КПП; replacement of
data estimates with actual data when the period of data compilation goes beyond the data release
schedule established for the balance of payments – ЗОП; changes in data related to reclassification of
instruments (aggregates) – ИКП; other changes – П.
Standard component items Period Code for change reason
General merchandise per balance of payments methodology (exports, imports)
Q1–Q3 2019
О
Goods acquired abroad under merchanting Q2 2019 О, ИКП
Goods sold abroad under merchanting Q1–Q3 2019 О, ИКП
Manufacturing services on physical inputs owned by others
Q3 2019 О
Transport, sea transport (exports, imports): – freight; – supporting and auxiliary services
Q1–Q3 2019 Q1–Q3 2019
О О
Transport, air transport (exports, imports): – passenger transportation; – freight; – supporting and auxiliary services
Q1–Q3 2019 Q1–Q3 2019 Q1–Q3 2019
О О О
Transport, other modes of transport (exports, imports): – passenger transportation; – freight; – supporting and auxiliary services
Q1–Q3 2019 Q1–Q3 2019 Q1–Q3 2019
О О О
Postal and courier services (exports, imports)
Q3 2019
О
Travel – business, personal (exports, imports)
Q1–Q3 2019 Q1–Q4 2018
О О
Construction abroad (exports, imports)
Q1–Q3 2019
О
Construction in the reporting economy (imports)
Q1–Q3 2019 Q1–Q4 2018
О О
Telecommunications services (exports)
Q1–Q3 2019 Q1–Q3 2018
О О
69

Supplement 7.1
Standard component items Period Code for change reason
Computer services (imports) Q2–Q3 2019 О Other business services: – legal and management consulting services (imports); – technical, trade-related, and other business services (exports, imports)
Q3 2019 Q1–Q3 2019
O O
Personal, cultural, and recreational services – audiovisual and related services (imports)
Q1–Q3 2019 О
Personal, cultural, and recreational services – other services (exports)
Q1–Q3 2019 О
Personal, cultural, and recreational services – other services (imports)
Q1–Q3 2019 О, М
Government goods and services n.i.e. (exports) Q1–Q3 2019 О
Compensation of employees (receivable, payable)
Q1–Q3 2019 Q1–Q4 2018
О О, М
Direct investment income (receivable) – reinvested earnings
Q3 2019 ЗОП
Direct investment income (payable): – reinvested earnings; – interest
Q3 2019 Q3 2019
ЗОП О
Portfolio investment income – interest on long-term debt instrument (receivable)
Q2 2019 О
Other investment income – interest (payable) Q1–Q3 2019 О, ИКП Other primary income – rent (receivable) Q2–Q3 2019 О Secondary income of General government (receivable): – current taxes on income, wealth, etc.; – social contributions
Q1–Q3 2019 Q1–Q4 2018 Q1–Q3 2019 Q1–Q4 2018
О М О М
Secondary income of General government (payable) – сurrent international cooperation
Q1–Q3 2019 О
Secondary income of financial corporations, nonfinancial corporations, households and NPISHs: – personal transfers (receivable, payable); – workers' remittances (receivable, payable); – current taxes on income, wealth, etc. (payable); – social benefits (payable); – miscellaneous current transfers (receivable, payable)
Q1–Q3 2019 Q1–Q4 2018
О О, П
Capital transfers of General government, other capital transfers (payable)
Q1–Q2 2019 О
Capital transfers of financial corporations, nonfinancial corporations, households, and NPISHs, other capital transfers (receivable, payable)
Q1–Q3 2019 Q1–Q4 2018
О О
Direct investment, net acquisition of financial assets/ net incurrence of liabilities: – reinvestment of earnings; – debt instruments
Q3 2019 Q3 2019
КПП О, ИКП
Portfolio investment of deposit-taking corporations, equity and investment fund shares, net acquisition of financial assets/ net incurrence of liabilities
Q3 2019 О
70

Supplement 7.1
Standard component items Period Code for change reason
Portfolio investment of deposit-taking corporations, long-term debt securities, net incurrence of liabilities
Q3 2019
О
Cash foreign currency and deposits of nonfinancial corporations, households, and NPISHs, net acquisition of short-term financial assets
Q1–Q3 2019 Q1–Q4 2018
О О
Cash foreign currency and deposits of central bank, net incurrence of short-term liabilities
Q1–Q3 2019 Q1–Q4 2018
О, М О, М
Loans of other financial corporations, net acquisition of financial assets/ net incurrence of liabilities (long-term)
Q3 2019 О, ИКП
Loans of other financial corporations, net incurrence of liabilities (short-term)
Q4 2018 О
Loans of nonfinancial corporations, households, and NPISHs, net acquisition of financial assets/ net incurrence of liabilities (short-term, long-term)
Q3 2019 О, ИКП
Trade credit and advances of nonfinancial corporations, households, and NPISHs, net acquisition of short-term financial assets
Q1–Q3 2019 Q1–Q4 2018
О О
Trade credit and advances of nonfinancial corporations, households, and NPISHs, net incurrence of short-term liabilities
Q2–Q3 2019
О
71
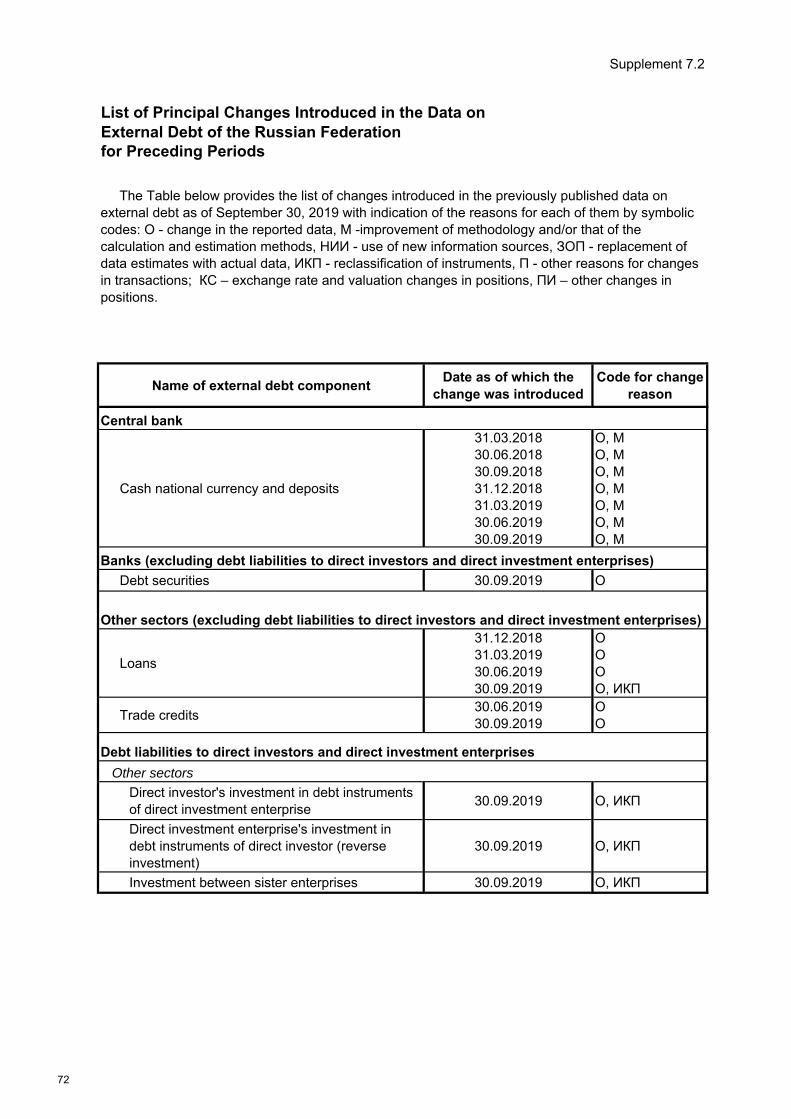
for Preceding Periods
Name of external debt componentDate as of which the
change was introducedCode for change
reason
Central bank
Cash national currency and deposits
31.03.201830.06.2018 30.09.2018 31.12.2018 31.03.2019 30.06.2019 30.09.2019
О, МО, МО, МО, МО, МО, МО, М
Debt securities 30.09.2019 О
Loans
31.12.201831.03.201930.06.201930.09.2019
ОООО, ИКП
Trade credits30.06.201930.09.2019
ОО
Debt liabilities to direct investors and direct investment enterprises
Direct investor's investment in debt instruments of direct investment enterprise
30.09.2019 О, ИКП
Direct investment enterprise's investment in debt instruments of direct investor (reverse investment)
30.09.2019 О, ИКП
Investment between sister enterprises 30.09.2019 О, ИКП
Other sectors (excluding debt liabilities to direct investors and direct investment enterprises)
Other sectors
Supplement 7.2
List of Principal Changes Introduced in the Data onExternal Debt of the Russian Federation
The Table below provides the list of changes introduced in the previously published data on external debt as of September 30, 2019 with indication of the reasons for each of them by symbolic codes: О - change in the reported data, М -improvement of methodology and/or that of the calculation and estimation methods, НИИ - use of new information sources, ЗОП - replacement of data estimates with actual data, ИКП - reclassification of instruments, П - other reasons for changes in transactions; КС – exchange rate and valuation changes in positions, ПИ – other changes in positions.
Banks (excluding debt liabilities to direct investors and direct investment enterprises)
72
