bajaj auto (baauto) - icici...
TRANSCRIPT
May 27, 2015
ICICI Securities Ltd | Retail Equity Research
Result Update
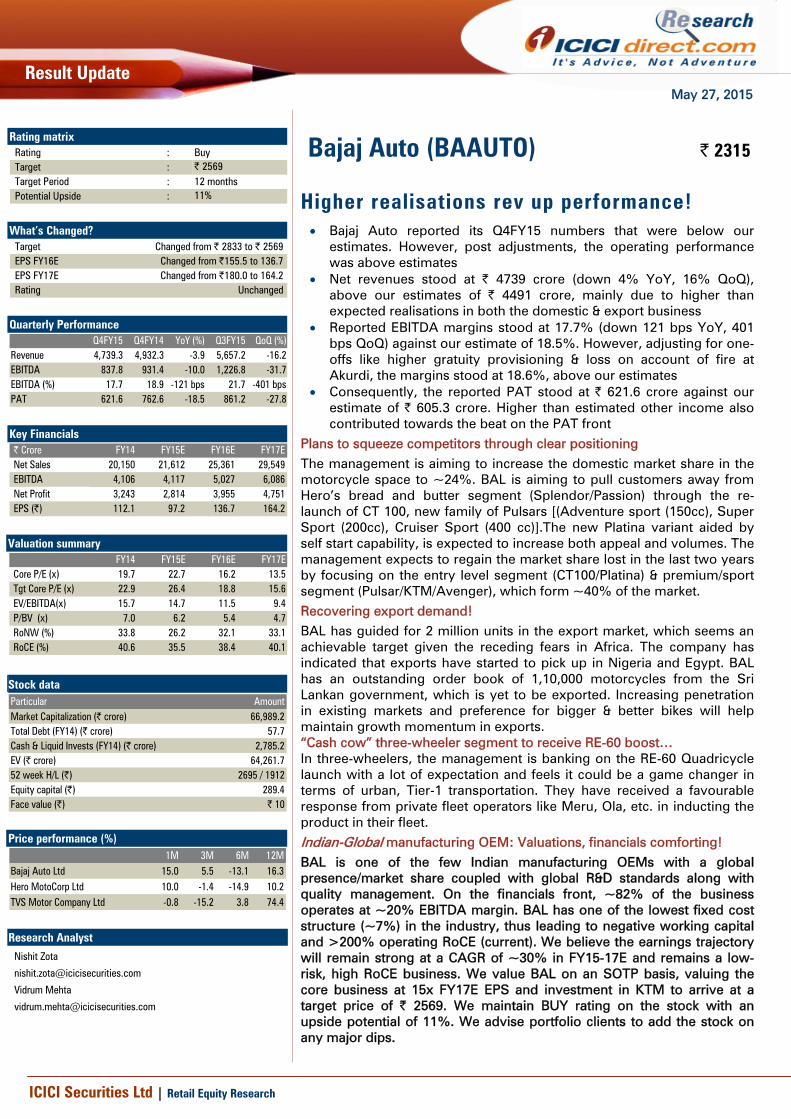
Higher realisations rev up performance! • Bajaj Auto reported its Q4FY15 numbers that were below our
estimates. However, post adjustments, the operating performance was above estimates
• Net revenues stood at | 4739 crore (down 4% YoY, 16% QoQ), above our estimates of | 4491 crore, mainly due to higher than expected realisations in both the domestic & export business
• Reported EBITDA margins stood at 17.7% (down 121 bps YoY, 401 bps QoQ) against our estimate of 18.5%. However, adjusting for one-offs like higher gratuity provisioning & loss on account of fire at Akurdi, the margins stood at 18.6%, above our estimates
• Consequently, the reported PAT stood at | 621.6 crore against our estimate of | 605.3 crore. Higher than estimated other income also contributed towards the beat on the PAT front
Plans to squeeze competitors through clear positioning The management is aiming to increase the domestic market share in the motorcycle space to ~24%. BAL is aiming to pull customers away from Hero’s bread and butter segment (Splendor/Passion) through the re-launch of CT 100, new family of Pulsars [(Adventure sport (150cc), Super Sport (200cc), Cruiser Sport (400 cc)].The new Platina variant aided by self start capability, is expected to increase both appeal and volumes. The management expects to regain the market share lost in the last two years by focusing on the entry level segment (CT100/Platina) & premium/sport segment (Pulsar/KTM/Avenger), which form ~40% of the market. Recovering export demand! BAL has guided for 2 million units in the export market, which seems an achievable target given the receding fears in Africa. The company has indicated that exports have started to pick up in Nigeria and Egypt. BAL has an outstanding order book of 1,10,000 motorcycles from the Sri Lankan government, which is yet to be exported. Increasing penetration in existing markets and preference for bigger & better bikes will help maintain growth momentum in exports. “Cash cow” three-wheeler segment to receive RE-60 boost… In three-wheelers, the management is banking on the RE-60 Quadricycle launch with a lot of expectation and feels it could be a game changer in terms of urban, Tier-1 transportation. They have received a favourable response from private fleet operators like Meru, Ola, etc. in inducting the product in their fleet. Indian-Global manufacturing OEM: Valuations, financials comforting! BAL is one of the few Indian manufacturing OEMs with a global presence/market share coupled with global R&D standards along with quality management. On the financials front, ~82% of the business operates at ~20% EBITDA margin. BAL has one of the lowest fixed cost structure (~7%) in the industry, thus leading to negative working capital and >200% operating RoCE (current). We believe the earnings trajectory will remain strong at a CAGR of ~30% in FY15-17E and remains a low-risk, high RoCE business. We value BAL on an SOTP basis, valuing the core business at 15x FY17E EPS and investment in KTM to arrive at a target price of | 2569. We maintain BUY rating on the stock with an upside potential of 11%. We advise portfolio clients to add the stock on any major dips.
Rating matrix Rating : BuyTarget : | 2569Target Period : 12 monthsPotential Upside : 11%
What’s Changed?
Target Changed from | 2833 to | 2569EPS FY16E Changed from |155.5 to 136.7EPS FY17E Changed from |180.0 to 164.2Rating Unchanged
Quarterly Performance
Q4FY15 Q4FY14 YoY (%) Q3FY15 QoQ (%)Revenue 4,739.3 4,932.3 -3.9 5,657.2 -16.2EBITDA 837.8 931.4 -10.0 1,226.8 -31.7EBITDA (%) 17.7 18.9 -121 bps 21.7 -401 bpsPAT 621.6 762.6 -18.5 861.2 -27.8
Key Financials | Crore FY14 FY15E FY16E FY17ENet Sales 20,150 21,612 25,361 29,549 EBITDA 4,106 4,117 5,027 6,086 Net Profit 3,243 2,814 3,955 4,751 EPS (|) 112.1 97.2 136.7 164.2
Valuation summary
FY14 FY15E FY16E FY17ECore P/E (x) 19.7 22.7 16.2 13.5 Tgt Core P/E (x) 22.9 26.4 18.8 15.6 EV/EBITDA(x) 15.7 14.7 11.5 9.4 P/BV (x) 7.0 6.2 5.4 4.7 RoNW (%) 33.8 26.2 32.1 33.1 RoCE (%) 40.6 35.5 38.4 40.1
Stock data Particular AmountMarket Capitalization (| crore) 66,989.2Total Debt (FY14) (| crore) 57.7Cash & Liquid Invests (FY14) (| crore) 2,785.2EV (| crore) 64,261.752 week H/L (|) 2695 / 1912Equity capital (|) 289.4Face value (|) | 10
Price performance (%)
1M 3M 6M 12MBajaj Auto Ltd 15.0 5.5 -13.1 16.3Hero MotoCorp Ltd 10.0 -1.4 -14.9 10.2TVS Motor Company Ltd -0.8 -15.2 3.8 74.4
Bajaj Auto (BAAUTO) | 2315
Research Analyst
Nishit Zota
Vidrum Mehta

ICICI Securities Ltd | Retail Equity Research Page 2
Variance analysis- Standalone Q4FY15 Q4FY15E Q4FY14 YoY (%) Q3FY15 QoQ (%) Comments
Total Operating Income 4,739 4,491 4,932 -3.9 5,657 -16.2 Higher than estimates due to higher-than-expected realisations in both domestic & export business
Raw Material Expenses 3,198 3,101 3,435 -6.9 3,862 -17.2Employee Expenses 259 184 175 48.0 214 20.9 Higher employee cost due to change in actuarial valuation for gratuity on account of
RBI rate cutsOther Expenses 463 391 404 14.7 368 26.0 Higher-than-expected due to impact of forex loss & provision for loss on account of
fire
EBITDA 837.8 829.6 931.4 -10.0 1,227 -31.7EBITDA Margin (%) 17.7 18.5 18.9 -121 bps 21.7 -401 bpsOther Income 154.3 112.4 184.8 -16.5 95.3 61.9 Higher-than-expected other income Depreciation 63.8 64.7 44.5 43.5 65.8 -3.0Interest 6 0 0 3,582.4 0 8,842.9Total Tax 300 272 309 -2.8 395 -24.0Reported PAT 621.6 605.3 762.6 -18.5 861.2 -27.8EPS (|) 21.5 20.9 26.4 -18.5 29.8 -27.8Key MetricsRevneue (| crore)Domestic 2,800 2,698 2,964 -5.5 3,054 -8.3 Higher than estimates on account of higher ASPsExports 2,091 1,889 2,076 0.7 2,680 -22.0 Higher than estimates on account of higher ASPsBlended ASP (|/ unit)Domestic 65,402 63,036 55,100 18.7 61,800 5.8 ASPs higher due to better-than-expected product mixExports 58,967 53,280 52,182 13.0 54,648 7.9 ASPs higher due to better-than-expected product mixSource: Company, ICICIdirect.com Research Change in estimates
(| Crore) Old New % Change Old New % Change CommentsRevenue 26,656 25,361 -4.9 30,893 29,549 -4.4EBITDA 5,561 5,027 -9.6 6,335 6,086 -3.9EBITDA Margin (%) 20.9 19.8 -104 bps 20.5 20.6 9 bpsPAT 4,486 3,955 -11.8 5,209 4,751 -8.8EPS (|) 155.0 136.7 -11.8 180 164.2 -8.8 Cut EPS estimates on a slower than expected motorcycle growth
FY16E FY17E
Source: Company, ICICIdirect.com Research Assumptions
Current Earlier CommentsUnits (mn) FY14 FY15E FY16E FY17E FY16E FY17EMotorcycle volumes 3.4 3.3 3.6 4.1 3.9 4.5 We have slightly adjusted our estimates considering management commentary on
demand in exports and domestic markets Three-Wheeler volumes 0.4 0.5 0.6 0.7 0.6 0.7Quadricycle volumes 0.01 0.03 0.07 0.06 0.07 Reduced FY16 estimates as commercial dispatches still await judicial approvalExport volumes 1.6 1.8 2.0 2.3 2.1 2.5Domestic revenues (| crore) 12,527 12,255 14,801 17,382 15,357 17,893Export revenues ($ mn) 1,380 1,582 1,798 2,089 1,872 2,209US$INR Realisation rate 59 62 63 63 63 62Export ASP ($/unit) 872 876 900 893 871 878Blended ASP (|/unit) 53,557 57,759 62,605 63,258 59,835 60,214RM/Vehicle (|/unit) 35,465 36,928 37,113 38,919 37,113 38,919EBIDTA/Vehicle (|/unit) 10,609 10,824 12,089 12,784 12,367 12,242
Source: Company, ICICIdirect.com Research
ICICI Securities Ltd | Retail Equity Research Page 3
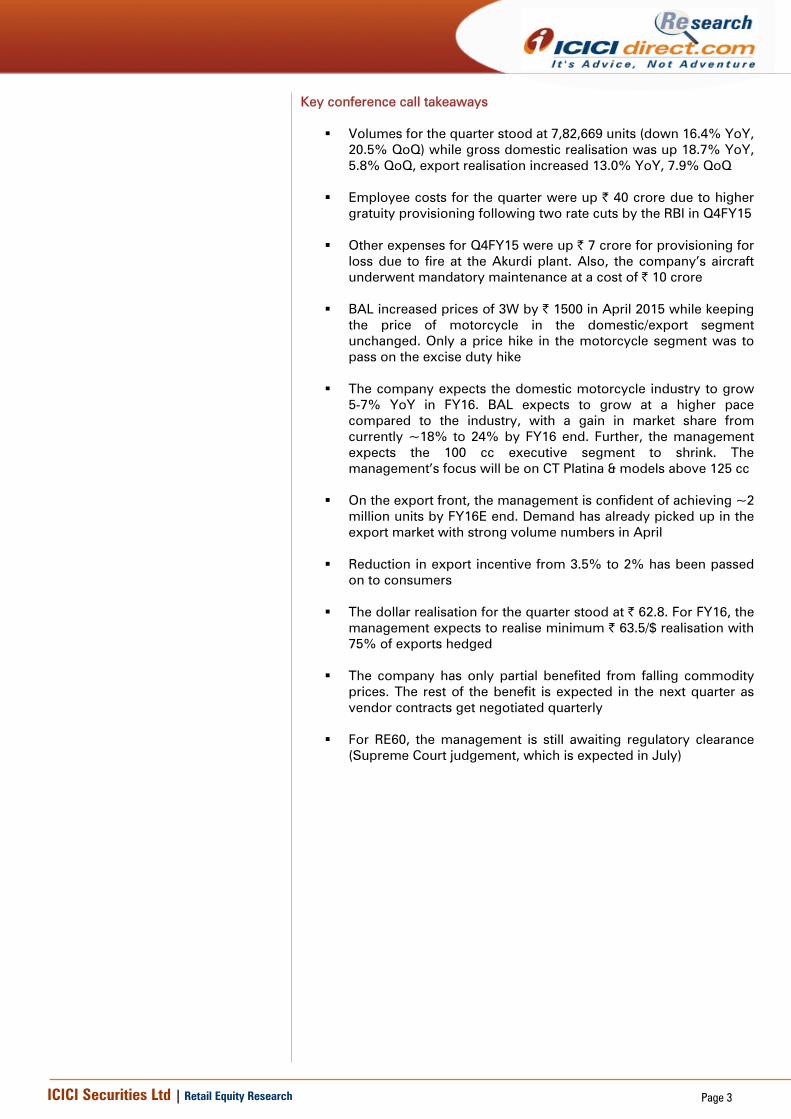
Key conference call takeaways
Volumes for the quarter stood at 7,82,669 units (down 16.4% YoY, 20.5% QoQ) while gross domestic realisation was up 18.7% YoY, 5.8% QoQ, export realisation increased 13.0% YoY, 7.9% QoQ
Employee costs for the quarter were up | 40 crore due to higher
gratuity provisioning following two rate cuts by the RBI in Q4FY15
Other expenses for Q4FY15 were up | 7 crore for provisioning for loss due to fire at the Akurdi plant. Also, the company’s aircraft underwent mandatory maintenance at a cost of | 10 crore
BAL increased prices of 3W by | 1500 in April 2015 while keeping
the price of motorcycle in the domestic/export segment unchanged. Only a price hike in the motorcycle segment was to pass on the excise duty hike
The company expects the domestic motorcycle industry to grow
5-7% YoY in FY16. BAL expects to grow at a higher pace compared to the industry, with a gain in market share from currently ~18% to 24% by FY16 end. Further, the management expects the 100 cc executive segment to shrink. The management’s focus will be on CT Platina & models above 125 cc
On the export front, the management is confident of achieving ~2
million units by FY16E end. Demand has already picked up in the export market with strong volume numbers in April
Reduction in export incentive from 3.5% to 2% has been passed
on to consumers
The dollar realisation for the quarter stood at | 62.8. For FY16, the management expects to realise minimum | 63.5/$ realisation with 75% of exports hedged
The company has only partial benefited from falling commodity
prices. The rest of the benefit is expected in the next quarter as vendor contracts get negotiated quarterly
For RE60, the management is still awaiting regulatory clearance
(Supreme Court judgement, which is expected in July)

ICICI Securities Ltd | Retail Equity Research Page 4
Company Analysis Revenue growth to pick up as uptrading to begin in motorcycle space! The revenue growth of BAL in the coming years is expected to be driven by volume growth across two-wheelers (2-W), three-wheelers (3-W), product mix improvements and less by pricing. However, we have factored in moderate revenue growth at ~17% CAGR (FY15-17E) with the domestic segment expected to be up ~19% to | 17,400 crore and exports up ~16% to | 13,200 crore. We expect the domestic motorcycle market share to increase to ~22-23% in coming years from the current low of ~18-19%. The 3-W (including RE-60) business is also expected to grow at ~20% CAGR in FY15-17E with the RE-60 launch, expected from CY15E. Exhibit 1: Build modest revenue growth at 17% CAGR in FY15P-17E
19,5
29
21,6
12
25,3
61
29,5
49
16,3
98
19,9
97
20,1
50
39
19
21
7
17 17
-
5,000
10,000
15,000
20,000
25,000
30,000
35,000
FY11 FY12 FY13 FY14 FY15E FY16E FY17E
(| c
rore
)
-
5
10
15
20
25
30
35
40
45
(%)
Revenue % increase
Source: Company, ICICIdirect.com Research
Share of exports has increased from ~33% in FY12, FY13 to ~44% in FY15 due to weakness in the domestic business and rapid growth in the global business. Exhibit 2: Revenue mix trend
13,2
23
13,9
05
12,5
27
12,2
55
14,8
01
17,3
82
6,60
4
6,71
3
8,20
0
9,75
8
11,4
15
13,1
63
33.3 32.6
39.6
44.3 43.5 43.1
-
2,000
4,000
6,000
8,000
10,000
12,000
14,000
16,000
18,000
20,000
FY12 FY13 FY14 FY15E FY16E FY17E
20
25
30
35
40
45
50
Domestic Exports % share of exports
Source: Company, ICICIdirect.com Research

ICICI Securities Ltd | Retail Equity Research Page 5
EBITDA margin to remain high as product mix offsets currency! Looking at BAL’s financial performance, we can clearly see that strong consistency is almost synonymous with the company. Currently, BAL faces a margin challenge on the Discover family, which we believe would improve by H1 in terms of market share. However, there may be an enrichment of product mix towards Pulsar as the 150 cc space returns to ~20% of motorcycle sales by FY16E. We believe hedging would remain prudent and possibly expect BAL to realise ~| 63.5 in FY16E, thereby causing a profitability impact in export markets.
Exhibit 4: Per vehicle metrics and estimates
36,709 37,233
37,113
38,919
53,860 53,97262,605
63,258
22,00027,00032,00037,00042,00047,00052,00057,00062,00067,000
Q3FY
12
Q4FY
12
Q1FY
13
Q2FY
13
Q3FY
13
Q4FY
13
Q1FY
14
Q2FY
14
Q3FY
14
Q4FY
14
Q1FY
15E
Q2FY
15E
FY15
E
FY16
E
FY17
E
(|)
Avg RM Cost Avg realisation
Source: Company press release, ICICIdirect.com Research
Return ratios to remain strong as company continues its profit growth! BAL remains a cash generating franchise, which has an annual CFO of ~| 5000 crore and CFO/EBITDA ratios of ~95% (five year average). The company has extremely tight control on working capital and has already worked towards reducing the system inventory in FY14. We believe the cash accumulated in BAL’s balance sheet could be better utilised via higher dividend payout as capex requirements are just ~10% of CFO generated annually.
Exhibit 3: EBITDA margins to remain steady!
3,72
0
4,11
7
5,02
7
6,08
6
3,17
1
3,63
5
4,10
6
19.319.0
18.2
20.4
19.0 19.8
20.6
-
1,000
2,000
3,000
4,000
5,000
6,000
7,000
FY11 FY12 FY13 FY14 FY15E FY16E FY17E
(| c
rore
)
16
17
18
19
20
21
(%)
EBITDA EBITDA margin
Source: Company, ICICIdirect.com Research

ICICI Securities Ltd | Retail Equity Research Page 6
Exhibit 5: CFO continues to remain strong
3,56
7
4,11
5
2,52
1
5,40
4
4,27
8
2,96
5 3,87
6
2,20
7
119.5112.5
70.3
104.2
60.7
100.2
61.2
107.5
-
1,000
2,000
3,000
4,000
5,000
6,000
FY10 FY11 FY12 FY13 FY14P FY15E FY16E FY17E(|
cro
re)
-
20
40
60
80
100
120
140
(%)
CFO CFO/EBITDA
Source: Company, ICICIdirect.com Research
BAL is expected to continue to witness strong profit growth in the coming years with FY16 expected to see PAT margins of ~16% on the back of an improving EBITDA performance. We expect profits to gallop to ~| 4751 crore in FY17E at a CAGR of ~30% in FY15-17E.
Exhibit 6: Profit to start getting pumped up as operational improvement kicks in!
3,00
4
2,81
4 3,95
5 4,75
1
3,34
0
3,04
4
3,24
3
20.4
15.4 15.216.1
13.0
15.6 16.1
-
500
1,000
1,500
2,000
2,500
3,000
3,500
4,000
4,500
5,000
FY11 FY12 FY13 FY14 FY15E FY16E FY17E
(| c
rore
)
-
5
10
15
20
25
(%)
PAT PAT margin
Source: Company press release, ICICIdirect.com Research

ICICI Securities Ltd | Retail Equity Research Page 7
Outlook and valuation With a strong global outlook, BAL’s profile strongly resembles an MNC player, with low dependence on a single market. As the rupee continues to remain under pressure, BAL’s competitiveness has improved in export markets, along with an improvement in realisations and margins. With an increasing portion of Pulsars in export markets, the margin profile is likely to improve, going ahead, and is likely to remain at ~20% as cost structures remain favourable. With an upside potential in the form of improvement in the domestic demand scenario coupled with the launch of the RE60 in CY15E, we believe a lot of negatives are already priced in BAL’s stock price. Despite its absence in the fast growing scooter segment, we believe BAL’s focus remains on the global motorcycle space, which differentiates it from others. The company is not just one of the few manufacturing companies that exports with a quality management in the automotive space but also across other sectors. We feel it has some aces up its sleeve in the 150 cc+ category in the form of new Pulsar/Avenger launches (in competition to Royal Enfield). Both of these could, in any case, provide volume surprises in FY16E and FY17E. Though the market constantly looks at revenue growth possibilities for BAL and cringes today, we feel strategies to chase revenues (e.g. possible scooter entry) while sacrificing profits are not beneficial to shareholders. On the financials front, BAL highlighted the fact that ~82% of business operates at >20% EBITDA margin while for the remaining Platina (7%) and Discover (11%), BAL expects the latter to improve in line with industry averages. The company has one of the lowest fixed cost structure (~7%) in the industry, thus leading to negative working capital and >200% operating RoCE (current). BAL is one of the few Indian manufacturing OEMs with a global presence/market share coupled with global R&D standards along with quality management. We believe BAL’s earnings trajectory will remain strong at a CAGR of ~30% in FY15-17E and remains a low-risk, high RoCE business. We feel the stock is available at 14x FY17E earnings, lower than historical valuations. We value BAL on an SOTP basis, valuing the core business at 15x FY17E EPS and investment in KTM to arrive at a target price of | 2569. We maintain BUY recommendation on the stock with an upside potential of 11%.

ICICI Securities Ltd | Retail Equity Research Page 8
Exhibit 7: SOTP valuation
SOTP Valuation Estimated value Per share (|) Remark
Core Business
FY17E EPS (|) 164.2
Multiple (x) 15.0 Long-term average valuation multiple
Value per share (|) 2,462
Stake in KTM (48%)
Total valuation (| crore) 9104Market Cap of KTM, listed on Vienna Stock Exchange
Value towards BAL 437047.99% stake via Bajaj Auto International Holdings
Value per share post 30% holdco disc 106 30% holding company discount
Total Value per Share (|) 2,569Source: Company, ICICIdirect.com Research
Exhibit 8: Valuation Revenues Growth EPS Growth PE EV/EBITDA RoNW RoCE
(| cr) (%) (|) (%) (x) (x) (%) (%)FY14 20,149.5 3.2 112.1 8.0 20.7 15.7 33.8 40.6 FY15E 21,612.0 7.3 97.2 (13.2) 23.8 14.7 26.2 35.5 FY16E 25,361.0 17.3 136.7 40.6 16.9 11.5 32.1 38.4 FY17E 29,549.0 16.5 164.2 20.1 14.1 9.4 33.1 40.1
Source: Company, ICICIdirect.com Research

ICICI Securities Ltd | Retail Equity Research Page 9
Company snapshot
Target Price: |2569
0
500
1,000
1,500
2,000
2,500
3,000
Dec-
10
Mar
-11
Jun-
11
Sep-
11
Dec-
11
Mar
-12
Jun-
12
Sep-
12
Dec-
12
Mar
-13
Jun-
13
Sep-
13
Dec-
13
Mar
-14
Jun-
14
Sep-
14
Dec-
14
Mar
-15
Jun-
15
Sep-
15
Dec-
15
Source: Bloomberg, Company, ICICIdirect.com Research Key events
Date EventApr-09 Bajaj Auto unveils going global strategy aided by KTM (stake raised to 30% from 14.5% initially in 2007)
May-09 Bajaj unveils all new 150/180 cc Pulsar DTS-I to enhance market leadership position in premium segmentNov-09 Bajaj Auto's export strategy bears strong fruit as volumes rise 46% YoY to ~98,000 odd units (35% of overall share)Jan-10 Bajaj Auto takes historic decision to exit scooter business completely and become a pure play motorcycle manufacturerJul-10 Bajaj shuns JV with Nissan for small car venture to continue alone with RE-60 Dec-10 Auto stocks slide as oil firms hike petrol prices steeply by ~| 3/ litreFeb-11 Bajaj Auto crosses 1 million units in the exports marketsMay-11 Rising input cost pressures cause automakers to raise prices; Bajaj hikes prices further as DEPB tax benefits reduced by governmentOct-11 US$INR skids touching 50 causing market preference towards exporters; Bajaj stands out in the sameMar-12 Bajaj Auto raises stake in KTM to ~48%, first product launch KTM Duke 200 cc receives strong responseMar-13 Bajaj Auto reports lowest March volumes since FY10 on account of weak domestic motorcycle sales as scooter sales shares riseOct-13 Exceptionally strong Q2FY14 margin performance makes it stand head and shoulders above any domestic & global OEMMay-14 Bajaj Auto reports lowest overall market share drop in the 2-W space to below 15%Mar-15 Bajaj Auto reports a market share of 18% in Q4FY15
Source: Company, ICICIdirect.com Research Top 10 Shareholders Shareholding Pattern Rank Name Latest Filing Date % O/S Position (m) Change (m)1 Bajaj Group of Industries 31-Mar-15 46.84 135.5 0.002 Life Insurance Corporation of India 31-Mar-15 5.86 17.0 3.033 Firodia Group of Industries 31-Mar-15 3.54 10.2 0.004 Capital International, Inc. 31-Dec-14 2.3 6.7 0.005 Norges Bank Investment Management (NBIM) 31-Mar-15 1.38 4.0 0.506 Lazard Asset Management, L.L.C. 30-Apr-15 1.31 3.8 -0.027 Sikkim Janseva Pratisthan Pvt. Ltd. 31-Mar-15 1.26 3.7 0.008 First State Investments (HK) Ltd. 31-Dec-14 1.18 3.4 0.119 Bajaj (Rahulkumar) 31-Mar-15 1.03 3.0 0.0010 BlackRock Institutional Trust Company, N.A. 30-Apr-15 0.81 2.4 0.18
(in %) Mar-14 Jun-14 Sep-14 Dec-14 Mar-15Promoter 50.0 50.0 50.0 50.0 49.2FII 18.7 18.7 18.6 18.8 17.0DII 6.9 7.0 7.1 7.0 8.7Others 24.4 24.3 24.3 24.2 25.1
Source: Reuters, ICICIdirect.com Research Recent Activity
Investor name Value Shares Investor name Value SharesLife Insurance Corporation of India 98.22m 3.03m Vontobel Asset Management, Inc. -74.53m -2.41m Bajaj (Madhur) 46.35m 1.43m William Blair & Company, L.L.C. -43.20m -1.36m Bajaj (Niraj) 33.32m 0.96m JPMorgan Asset Management U.K. Limited -30.66m -0.79m Norges Bank Investment Management (NBIM) 16.25m 0.50m RBC Global Asset Management (UK) Limited -23.14m -0.60m Franklin Templeton Asset Management (India) Pvt. Ltd. 13.38m 0.41m British Columbia Investment Management Corp. -18.27m -0.53m
Buys Sells
Source: Reuters, ICICIdirect.com Research
ICICI Securities Ltd | Retail Equity Research Page 10
.
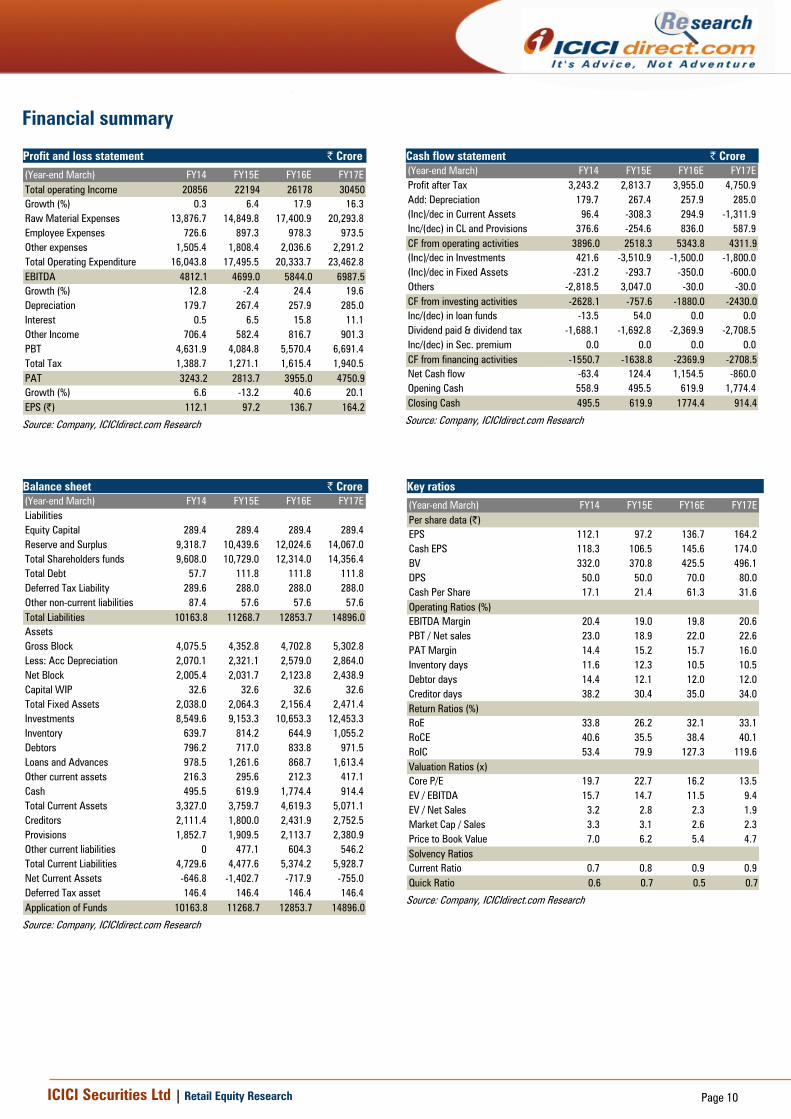
Financial summary Profit and loss statement | Crore
(Year-end March) FY14 FY15E FY16E FY17ETotal operating Income 20856 22194 26178 30450Growth (%) 0.3 6.4 17.9 16.3Raw Material Expenses 13,876.7 14,849.8 17,400.9 20,293.8Employee Expenses 726.6 897.3 978.3 973.5Other expenses 1,505.4 1,808.4 2,036.6 2,291.2Total Operating Expenditure 16,043.8 17,495.5 20,333.7 23,462.8EBITDA 4812.1 4699.0 5844.0 6987.5Growth (%) 12.8 -2.4 24.4 19.6Depreciation 179.7 267.4 257.9 285.0Interest 0.5 6.5 15.8 11.1Other Income 706.4 582.4 816.7 901.3PBT 4,631.9 4,084.8 5,570.4 6,691.4Total Tax 1,388.7 1,271.1 1,615.4 1,940.5PAT 3243.2 2813.7 3955.0 4750.9Growth (%) 6.6 -13.2 40.6 20.1EPS (|) 112.1 97.2 136.7 164.2
Source: Company, ICICIdirect.com Research
Cash flow statement | Crore (Year-end March) FY14 FY15E FY16E FY17EProfit after Tax 3,243.2 2,813.7 3,955.0 4,750.9Add: Depreciation 179.7 267.4 257.9 285.0(Inc)/dec in Current Assets 96.4 -308.3 294.9 -1,311.9Inc/(dec) in CL and Provisions 376.6 -254.6 836.0 587.9CF from operating activities 3896.0 2518.3 5343.8 4311.9(Inc)/dec in Investments 421.6 -3,510.9 -1,500.0 -1,800.0(Inc)/dec in Fixed Assets -231.2 -293.7 -350.0 -600.0Others -2,818.5 3,047.0 -30.0 -30.0CF from investing activities -2628.1 -757.6 -1880.0 -2430.0Inc/(dec) in loan funds -13.5 54.0 0.0 0.0Dividend paid & dividend tax -1,688.1 -1,692.8 -2,369.9 -2,708.5Inc/(dec) in Sec. premium 0.0 0.0 0.0 0.0CF from financing activities -1550.7 -1638.8 -2369.9 -2708.5Net Cash flow -63.4 124.4 1,154.5 -860.0Opening Cash 558.9 495.5 619.9 1,774.4Closing Cash 495.5 619.9 1774.4 914.4
Source: Company, ICICIdirect.com Research
Balance sheet | Crore(Year-end March) FY14 FY15E FY16E FY17ELiabilitiesEquity Capital 289.4 289.4 289.4 289.4Reserve and Surplus 9,318.7 10,439.6 12,024.6 14,067.0Total Shareholders funds 9,608.0 10,729.0 12,314.0 14,356.4Total Debt 57.7 111.8 111.8 111.8Deferred Tax Liability 289.6 288.0 288.0 288.0Other non-current liabilities 87.4 57.6 57.6 57.6Total Liabilities 10163.8 11268.7 12853.7 14896.0AssetsGross Block 4,075.5 4,352.8 4,702.8 5,302.8Less: Acc Depreciation 2,070.1 2,321.1 2,579.0 2,864.0Net Block 2,005.4 2,031.7 2,123.8 2,438.9Capital WIP 32.6 32.6 32.6 32.6Total Fixed Assets 2,038.0 2,064.3 2,156.4 2,471.4Investments 8,549.6 9,153.3 10,653.3 12,453.3Inventory 639.7 814.2 644.9 1,055.2Debtors 796.2 717.0 833.8 971.5Loans and Advances 978.5 1,261.6 868.7 1,613.4Other current assets 216.3 295.6 212.3 417.1Cash 495.5 619.9 1,774.4 914.4Total Current Assets 3,327.0 3,759.7 4,619.3 5,071.1Creditors 2,111.4 1,800.0 2,431.9 2,752.5Provisions 1,852.7 1,909.5 2,113.7 2,380.9Other current liabilities 0 477.1 604.3 546.2Total Current Liabilities 4,729.6 4,477.6 5,374.2 5,928.7Net Current Assets -646.8 -1,402.7 -717.9 -755.0Deferred Tax asset 146.4 146.4 146.4 146.4Application of Funds 10163.8 11268.7 12853.7 14896.0
Source: Company, ICICIdirect.com Research
Key ratios
(Year-end March) FY14 FY15E FY16E FY17EPer share data (|)EPS 112.1 97.2 136.7 164.2Cash EPS 118.3 106.5 145.6 174.0BV 332.0 370.8 425.5 496.1DPS 50.0 50.0 70.0 80.0Cash Per Share 17.1 21.4 61.3 31.6Operating Ratios (%)EBITDA Margin 20.4 19.0 19.8 20.6PBT / Net sales 23.0 18.9 22.0 22.6PAT Margin 14.4 15.2 15.7 16.0Inventory days 11.6 12.3 10.5 10.5Debtor days 14.4 12.1 12.0 12.0Creditor days 38.2 30.4 35.0 34.0Return Ratios (%)RoE 33.8 26.2 32.1 33.1RoCE 40.6 35.5 38.4 40.1RoIC 53.4 79.9 127.3 119.6Valuation Ratios (x)Core P/E 19.7 22.7 16.2 13.5EV / EBITDA 15.7 14.7 11.5 9.4EV / Net Sales 3.2 2.8 2.3 1.9Market Cap / Sales 3.3 3.1 2.6 2.3Price to Book Value 7.0 6.2 5.4 4.7Solvency RatiosCurrent Ratio 0.7 0.8 0.9 0.9Quick Ratio 0.6 0.7 0.5 0.7
Source: Company, ICICIdirect.com Research
ICICI Securities Ltd | Retail Equity Research Page 11
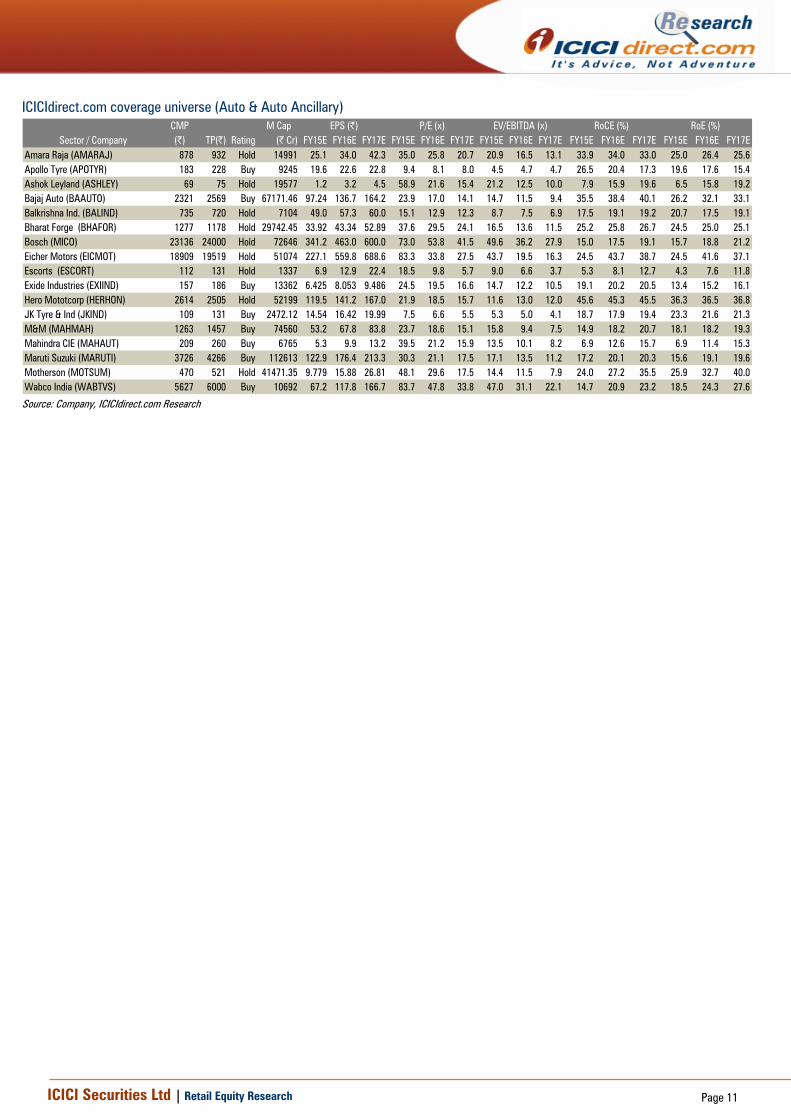
ICICIdirect.com coverage universe (Auto & Auto Ancillary) CMP M Cap(|) TP(|) Rating (| Cr) FY15E FY16E FY17E FY15E FY16E FY17E FY15E FY16E FY17E FY15E FY16E FY17E FY15E FY16E FY17E
Amara Raja (AMARAJ) 878 932 Hold 14991 25.1 34.0 42.3 35.0 25.8 20.7 20.9 16.5 13.1 33.9 34.0 33.0 25.0 26.4 25.6Apollo Tyre (APOTYR) 183 228 Buy 9245 19.6 22.6 22.8 9.4 8.1 8.0 4.5 4.7 4.7 26.5 20.4 17.3 19.6 17.6 15.4Ashok Leyland (ASHLEY) 69 75 Hold 19577 1.2 3.2 4.5 58.9 21.6 15.4 21.2 12.5 10.0 7.9 15.9 19.6 6.5 15.8 19.2Bajaj Auto (BAAUTO) 2321 2569 Buy 67171.46 97.24 136.7 164.2 23.9 17.0 14.1 14.7 11.5 9.4 35.5 38.4 40.1 26.2 32.1 33.1Balkrishna Ind. (BALIND) 735 720 Hold 7104 49.0 57.3 60.0 15.1 12.9 12.3 8.7 7.5 6.9 17.5 19.1 19.2 20.7 17.5 19.1Bharat Forge (BHAFOR) 1277 1178 Hold 29742.45 33.92 43.34 52.89 37.6 29.5 24.1 16.5 13.6 11.5 25.2 25.8 26.7 24.5 25.0 25.1Bosch (MICO) 23136 24000 Hold 72646 341.2 463.0 600.0 73.0 53.8 41.5 49.6 36.2 27.9 15.0 17.5 19.1 15.7 18.8 21.2Eicher Motors (EICMOT) 18909 19519 Hold 51074 227.1 559.8 688.6 83.3 33.8 27.5 43.7 19.5 16.3 24.5 43.7 38.7 24.5 41.6 37.1Escorts (ESCORT) 112 131 Hold 1337 6.9 12.9 22.4 18.5 9.8 5.7 9.0 6.6 3.7 5.3 8.1 12.7 4.3 7.6 11.8Exide Industries (EXIIND) 157 186 Buy 13362 6.425 8.053 9.486 24.5 19.5 16.6 14.7 12.2 10.5 19.1 20.2 20.5 13.4 15.2 16.1Hero Mototcorp (HERHON) 2614 2505 Hold 52199 119.5 141.2 167.0 21.9 18.5 15.7 11.6 13.0 12.0 45.6 45.3 45.5 36.3 36.5 36.8JK Tyre & Ind (JKIND) 109 131 Buy 2472.12 14.54 16.42 19.99 7.5 6.6 5.5 5.3 5.0 4.1 18.7 17.9 19.4 23.3 21.6 21.3M&M (MAHMAH) 1263 1457 Buy 74560 53.2 67.8 83.8 23.7 18.6 15.1 15.8 9.4 7.5 14.9 18.2 20.7 18.1 18.2 19.3Mahindra CIE (MAHAUT) 209 260 Buy 6765 5.3 9.9 13.2 39.5 21.2 15.9 13.5 10.1 8.2 6.9 12.6 15.7 6.9 11.4 15.3Maruti Suzuki (MARUTI) 3726 4266 Buy 112613 122.9 176.4 213.3 30.3 21.1 17.5 17.1 13.5 11.2 17.2 20.1 20.3 15.6 19.1 19.6Motherson (MOTSUM) 470 521 Hold 41471.35 9.779 15.88 26.81 48.1 29.6 17.5 14.4 11.5 7.9 24.0 27.2 35.5 25.9 32.7 40.0Wabco India (WABTVS) 5627 6000 Buy 10692 67.2 117.8 166.7 83.7 47.8 33.8 47.0 31.1 22.1 14.7 20.9 23.2 18.5 24.3 27.6
Sector / CompanyRoE (%)EPS (|) P/E (x) EV/EBITDA (x) RoCE (%)
Source: Company, ICICIdirect.com Research

ICICI Securities Ltd | Retail Equity Research Page 12
RATING RATIONALE ICICIdirect.com endeavours to provide objective opinions and recommendations. ICICIdirect.com assigns ratings to its stocks according to their notional target price vs. current market price and then categorises them as Strong Buy, Buy, Hold and Sell. The performance horizon is two years unless specified and the notional target price is defined as the analysts' valuation for a stock. Strong Buy: >15%/20% for large caps/midcaps, respectively, with high conviction; Buy: >10%/15% for large caps/midcaps, respectively; Hold: Up to +/-10%; Sell: -10% or more;
Pankaj Pandey Head – Research [email protected]
ICICIdirect.com Research Desk, ICICI Securities Limited, 1st Floor, Akruti Trade Centre, Road No. 7, MIDC, Andheri (East) Mumbai – 400 093

ICICI Securities Ltd | Retail Equity Research Page 13
ANALYST CERTIFICATION We /I, Nishit Zota, MBA & Vidrum Mehta, MBA Research Analyst, authors and the names subscribed to this report, hereby certify that all of the views expressed in this research report accurately reflect our views about the subject issuer(s) or securities. We also certify that no part of our compensation was, is, or will be directly or indirectly related to the specific recommendation(s) or view(s) in this report.
Terms & conditions and other disclosures: ICICI Securities Limited (ICICI Securities) is a full-service, integrated investment banking and is, inter alia, engaged in the business of stock brokering and distribution of financial products. ICICI Securities is a wholly-owned subsidiary of ICICI Bank which is India’s largest private sector bank and has its various subsidiaries engaged in businesses of housing finance, asset management, life insurance, general insurance, venture capital fund management, etc. (“associates”), the details in respect of which are available on www.icicibank.com. ICICI Securities is one of the leading merchant bankers/ underwriters of securities and participate in virtually all securities trading markets in India. We and our associates might have investment banking and other business relationship with a significant percentage of companies covered by our Investment Research Department. ICICI Securities generally prohibits its analysts, persons reporting to analysts and their relatives from maintaining a financial interest in the securities or derivatives of any companies that the analysts cover. The information and opinions in this report have been prepared by ICICI Securities and are subject to change without any notice. The report and information contained herein is strictly confidential and meant solely for the selected recipient and may not be altered in any way, transmitted to, copied or distributed, in part or in whole, to any other person or to the media or reproduced in any form, without prior written consent of ICICI Securities. While we would endeavour to update the information herein on a reasonable basis, ICICI Securitiesis is under no obligation to update or keep the information current. Also, there may be regulatory, compliance or other reasons that may prevent ICICI Securities from doing so. Non-rated securities indicate that rating on a particular security has been suspended temporarily and such suspension is in compliance with applicable regulations and/or ICICI Securities policies, in circumstances where ICICI Securities might be acting in an advisory capacity to this company, or in certain other circumstances. This report is based on information obtained from public sources and sources believed to be reliable, but no independent verification has been made nor is its accuracy or completeness guaranteed. This report and information herein is solely for informational purpose and shall not be used or considered as an offer document or solicitation of offer to buy or sell or subscribe for securities or other financial instruments. Though disseminated to all the customers simultaneously, not all customers may receive this report at the same time. ICICI Securities will not treat recipients as customers by virtue of their receiving this report. Nothing in this report constitutes investment, legal, accounting and tax advice or a representation that any investment or strategy is suitable or appropriate to your specific circumstances. The securities discussed and opinions expressed in this report may not be suitable for all investors, who must make their own investment decisions, based on their own investment objectives, financial positions and needs of specific recipient. This may not be taken in substitution for the exercise of independent judgment by any recipient. The recipient should independently evaluate the investment risks. The value and return on investment may vary because of changes in interest rates, foreign exchange rates or any other reason. ICICI Securities accepts no liabilities whatsoever for any loss or damage of any kind arising out of the use of this report. Past performance is not necessarily a guide to future performance. Investors are advised to see Risk Disclosure Document to understand the risks associated before investing in the securities markets. Actual results may differ materially from those set forth in projections. Forward-looking statements are not predictions and may be subject to change without notice. ICICI Securities or its associates might have managed or co-managed public offering of securities for the subject company or might have been mandated by the subject company for any other assignment in the past twelve months. ICICI Securities or its associates might have received any compensation from the companies mentioned in the report during the period preceding twelve months from the date of this report for services in respect of managing or co-managing public offerings, corporate finance, investment banking or merchant banking, brokerage services or other advisory service in a merger or specific transaction. ICICI Securities or its associates might have received any compensation for products or services other than investment banking or merchant banking or brokerage services from the companies mentioned in the report in the past twelve months. ICICI Securities encourages independence in research report preparation and strives to minimize conflict in preparation of research report. ICICI Securities or its analysts did not receive any compensation or other benefits from the companies mentioned in the report or third party in connection with preparation of the research report. Accordingly, neither ICICI Securities nor Research Analysts have any material conflict of interest at the time of publication of this report. It is confirmed that Nishit Zota, MBA & Vidrum Mehta, MBA Research Analyst of this report have not received any compensation from the companies mentioned in the report in the preceding twelve months. Compensation of our Research Analyst is not based on any specific merchant banking, investment banking or brokerage service transactions. ICICI Securities or its subsidiaries collectively or Research Analysts do not own 1% or more of the equity securities of the Company mentioned in the report as of the last day of the month preceding the publication of the research report. Since associates of ICICI Securities are engaged in various financial service businesses, they might have financial interests or beneficial ownership in various companies including the subject company/companies mentioned in this report. It is confirmed that Nishit Zota, MBA & Vidrum Mehta, MBA, Research Analyst do not serve as an officer, director or employee of the companies mentioned in the report. ICICI Securities may have issued other reports that are inconsistent with and reach different conclusion from the information presented in this report. Neither the Research Analyst nor ICICI Securities have been engaged in market making activity for the companies mentioned in the report. We submit that no material disciplinary action has been taken on ICICI Securities by any Regulatory Authority impacting Equity Research Analysis activities. This report is not directed or intended for distribution to, or use by, any person or entity who is a citizen or resident of or located in any locality, state, country or other jurisdiction, where such distribution, publication, availability or use would be contrary to law, regulation or which would subject ICICI Securities and affiliates to any registration or licensing requirement within such jurisdiction. The securities described herein may or may not be eligible for sale in all jurisdictions or to certain category of investors. Persons in whose possession this document may come are required to inform themselves of and to observe such restriction.