bajaj auto accumulate - business...
TRANSCRIPT

Please refer to important disclosures at the end of this report 1
Y/E March (` cr) 1QFY13 1QFY12 % chg (yoy) 4QFY12 % chg (qoq)
Net Sales 4,866 4,706 3.4 4,651 4.6
EBITDA 872 840 3.8 921 (5.3)
EBITDA Margin (%) 17.9 17.8 7bp 19.8 (188)bp
Adj. PAT 718 711 1.0 752 (4.4)
Source: Company, Angel Research
Bajaj Auto’s (BJAUT) 1QFY2013 operating performance was marginally lower-than-expected on account of adverse product-mix led by decline in three-wheeler exports and lower share of premium motorcycles. Looking ahead, the company expects the export volumes to recover; also it expects domestic volumes to improve led by new launches (Pulsar 200NS and Discover 125 ST). While the management has guided for ~15% volume growth in FY2013E, we believe that it would be challenging for the company to meet its guidance. Thus, we have built in a volume growth of ~8% for FY2013E and have marginally lowered our earnings estimates for FY2013 and FY2014. Nonetheless, due to attractive valuations we maintain our Accumulate rating on the stock.
Higher other income offsets weak operating performance: BJAUT’s top-line grew by 3.4% yoy (4.6% qoq) to `4,866cr driven by 5.3% yoy growth in net average realization. However, on a sequential basis, net average realization declined 1.6% as the company witnessed adverse product-mix leading to 1.2% and 1.5% decline in domestic and exports realization, respectively. Volume performance was sluggish and declined 1.3% yoy (although up 6.1% qoq) as export volumes declined 2.7% yoy led by political unrest in Egypt and import duty hike in Sri Lanka. EBITDA margin contracted 188bp sequentially to 17.9% led by 90bp increase in raw-material expenses (mainly related to aluminum) and 70bp increase in employee costs (12% wage hike for employees). Other expenditure increased as the company took a hit of `36cr on unrealized forex hedges. Net profit was up 1.0% yoy (although down 6.9% qoq) to `718cr benefiting from 26.5% yoy (30.5% qoq) jump in other income led by `33cr gains related to reversal of time value of forex hedges. Tax rate came in at 29.5% due to reduction in income tax benefits from the Pantnagar plant.
Outlook and valuation: At `1,549, BJAUT is trading at 12.8x FY2014E earnings. We maintain our Accumulate rating on the stock with a target price of `1,698.
Key financials (Standalone) Y/E March (` cr) FY2011 FY2012 FY2013E FY2014E
Net Sales 16,398 19,529 21,285 23,927
% chg 37.6 19.1 9.0 12.4
Net Profit 2,750 3,082 3,140 3,510
% chg 54.1 12.1 1.9 11.8
EBITDA (%) 18.7 18.4 18.2 18.3
EPS (`) 95.0 106.5 108.5 121.3
P/E (x) 16.3 14.5 14.3 12.8
P/BV (x) 9.1 7.4 5.9 4.8
RoE (%) 70.2 56.3 46.1 41.3
RoCE (%) 60.0 57.3 51.6 47.5
EV/Sales (x) 2.4 1.9 1.7 1.4
EV/EBITDA (x) 13.1 10.7 9.5 7.9 Source: Company, Angel Research
ACCUMULATE CMP `1,549 Target Price `1,698
Investment Period 12 Months
Stock Info
Sector
Bloomberg Code BJAUT@IN
Shareholding Pattern (%)
Promoters 50.0
MF / Banks / Indian Fls 18.4
FII / NRIs / OCBs 15.3
Indian Public / Others 16.3
Abs. (%) 3m 1yr 3yr
Sensex (1.3) (7.4) 17.2
Bajaj Auto (10.6) 8.1 167.8
Face Value (`)
BSE Sensex
Nifty
Reuters Code
10
17,279
5,243
BAJA.BO
Automobile
Avg. Daily Volume
Market Cap (` cr)
Beta
52 Week High / Low
44,829
0.7
1,839/1,351
46,678
Net Debt (` cr) (6,439)
Yaresh Kothari 022-3935 7800 Ext: 6844
Bajaj Auto Performance Highlights
1QFY2013 Result Update | Automobile
July 19, 2012

Bajaj Auto | 1QFY2013 Result Update
July 19, 2012
2
Exhibit 1: Quarterly financial performance (Standalone)
Y/E March (` cr) 1QFY13 1QFY12 % chg (yoy) 4QFY12 % chg (qoq) FY2012 FY2011 % chg (yoy)
Net Sales 4,866 4,706 3.4 4,651 4.6 19,529 16,398 19.1
Consumption of RM 3,316 3,290 0.8 3,141 5.6 13,351 11,229 18.9
(% of Sales) 68.2 69.9 67.5 68.4 68.5 Staff Costs 160 143 12.1 120 34.2 540 494 9.4
(% of Sales) 3.3 3.0 2.6 2.8 3.0 Purchases of TG 192 176 8.8 171 11.8 751 568 32.1
(% of Sales) 3.9 3.7 3.7 3.8 3.5 Other Expenses 326 257 26.4 299 9.0 1,166 936 24.6
(% of Sales) 6.7 5.5 6.4 6.0 5.7 Total Expenditure 3,994 3,866 3.3 3,731 7.1 15,809 13,227 19.5
Operating Profit 872 840 3.8 921 (5.3) 3,720 3,171 17.3
OPM (%) 17.9 17.8 19.8 19.0 19.3 Interest 0 0 (83) 2 (97.7) 22 2 1,216
Depreciation 35 31 15.0 43 (18.8) 146 123 18.5
Other Income 182 144 26.3 139 30.5 608 577 5.5
PBT (excl. Extr. Items) 1,018 953 6.9 1,015 0.3 4,160 3,623 14.8
Extr. Income/(Expense) - - - (20) - 134 (725) -
PBT (incl. Extr. Items) 1,018 953 6.9 1,035 (1.6) 4,026 4,348 (7.4)
(% of Sales) 20.9 20.3 22.3 20.6 26.5 Provision for Taxation 300 242 24.0 263 14.0 1,022 1,008 1.4
(% of PBT) 29.5 25.4 25.4 25.4 23.2 Reported PAT 718 711 1.0 772 (6.9) 3,004 3,340 (10.1)
Adj PAT 718 711 1.0 752 (4.4) 3,138 2,615 20.0
Adj. PATM 14.8 15.1 16.6 15.4 20.4 Equity capital (cr) 289.4 289.4 289.4 289.4 289.4 Reported EPS (`) 24.8 24.6 1.0 26.7 (6.9) 103.8 115.4 (10.1)
Source: Company, Angel Research
Exhibit 2: 1QFY2013 – Actual vs. Angel estimates Y/E March (` cr) Actual Estimates Variation (%)
Net Sales 4,866 4,930 (1.3)
EBITDA 872 954 (8.7)
EBITDA margin (%) 17.9 19.4 (144)bp
Adj. PAT 718 760 (5.5)
Source: Company, Angel Research
Bajaj Auto | 1QFY2013 Result Update
July 19, 2012
3
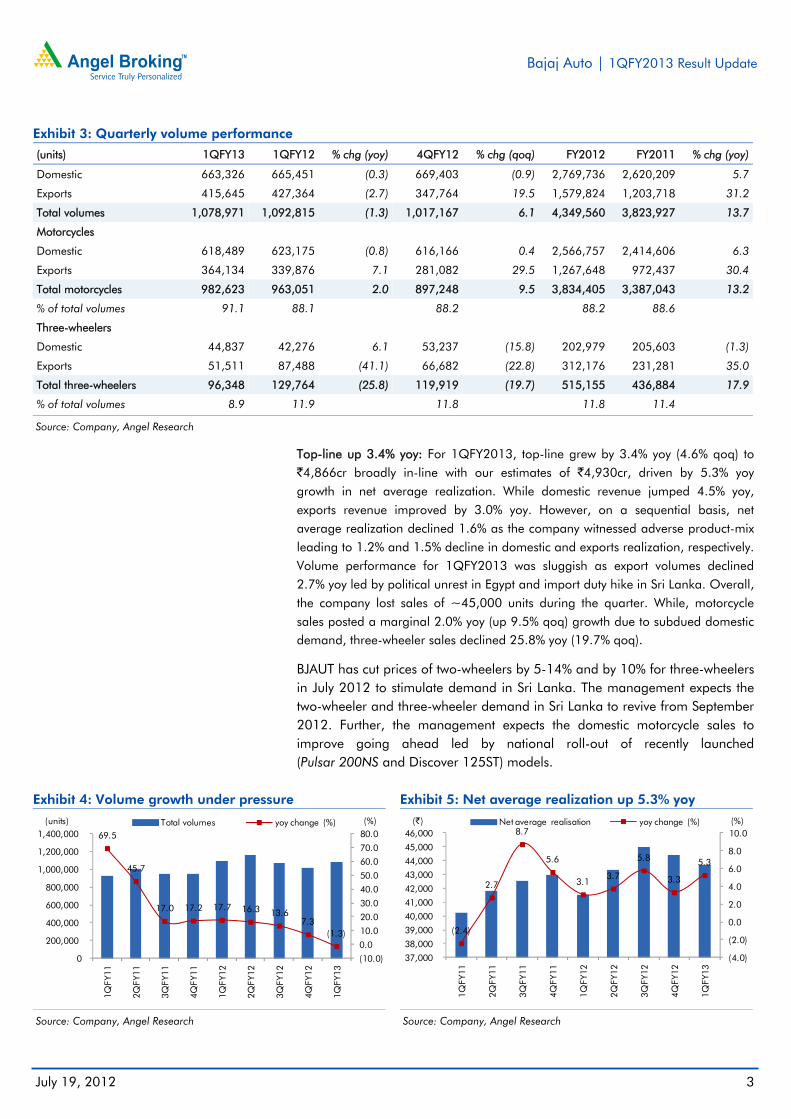
Exhibit 3: Quarterly volume performance
(units) 1QFY13 1QFY12 % chg (yoy) 4QFY12 % chg (qoq) FY2012 FY2011 % chg (yoy)
Domestic 663,326 665,451 (0.3) 669,403 (0.9) 2,769,736 2,620,209 5.7
Exports 415,645 427,364 (2.7) 347,764 19.5 1,579,824 1,203,718 31.2
Total volumes 1,078,971 1,092,815 (1.3) 1,017,167 6.1 4,349,560 3,823,927 13.7
Motorcycles Domestic 618,489 623,175 (0.8) 616,166 0.4 2,566,757 2,414,606 6.3
Exports 364,134 339,876 7.1 281,082 29.5 1,267,648 972,437 30.4
Total motorcycles 982,623 963,051 2.0 897,248 9.5 3,834,405 3,387,043 13.2
% of total volumes 91.1 88.1 88.2 88.2 88.6 Three-wheelers Domestic 44,837 42,276 6.1 53,237 (15.8) 202,979 205,603 (1.3)
Exports 51,511 87,488 (41.1) 66,682 (22.8) 312,176 231,281 35.0
Total three-wheelers 96,348 129,764 (25.8) 119,919 (19.7) 515,155 436,884 17.9
% of total volumes 8.9 11.9 11.8 11.8 11.4
Source: Company, Angel Research
Top-line up 3.4% yoy: For 1QFY2013, top-line grew by 3.4% yoy (4.6% qoq) to `4,866cr broadly in-line with our estimates of `4,930cr, driven by 5.3% yoy growth in net average realization. While domestic revenue jumped 4.5% yoy, exports revenue improved by 3.0% yoy. However, on a sequential basis, net average realization declined 1.6% as the company witnessed adverse product-mix leading to 1.2% and 1.5% decline in domestic and exports realization, respectively. Volume performance for 1QFY2013 was sluggish as export volumes declined 2.7% yoy led by political unrest in Egypt and import duty hike in Sri Lanka. Overall, the company lost sales of ~45,000 units during the quarter. While, motorcycle sales posted a marginal 2.0% yoy (up 9.5% qoq) growth due to subdued domestic demand, three-wheeler sales declined 25.8% yoy (19.7% qoq).
BJAUT has cut prices of two-wheelers by 5-14% and by 10% for three-wheelers in July 2012 to stimulate demand in Sri Lanka. The management expects the two-wheeler and three-wheeler demand in Sri Lanka to revive from September 2012. Further, the management expects the domestic motorcycle sales to improve going ahead led by national roll-out of recently launched (Pulsar 200NS and Discover 125ST) models.
Exhibit 4: Volume growth under pressure
Source: Company, Angel Research
Exhibit 5: Net average realization up 5.3% yoy
Source: Company, Angel Research
69.5
45.7
17.0 17.2 17.7 16.3 13.6 7.3
(1.3)
(10.0)
0.0
10.0
20.0
30.0
40.0
50.0
60.0
70.0
80.0
0
200,000
400,000
600,000
800,000
1,000,000
1,200,000
1,400,000
1QFY
11
2QFY
11
3QFY
11
4QFY
11
1QFY
12
2QFY
12
3QFY
12
4QFY
12
1QFY
13
(%)(units) Total volumes yoy change (%)
(2.4)
2.7
8.7
5.6
3.1 3.7
5.8
3.3
5.3
(4.0)
(2.0)
0.0
2.0
4.0
6.0
8.0
10.0
37,000
38,000
39,000
40,000
41,000
42,000
43,000
44,000
45,000
46,000
1QFY
11
2QFY
11
3QFY
11
4QFY
11
1QFY
12
2QFY
12
3QFY
12
4QFY
12
1QFY
13
(%)(`) Net average realisation yoy change (%)

Bajaj Auto | 1QFY2013 Result Update
July 19, 2012
4
Exhibit 6: Revenue mix
Source: Company, Angel Research
Exhibit 7: Domestic market share trend
Source: Company, SIAM, Angel Research
EBITDA margin declines sequentially, at 17.9%: During 1QFY2013, BJAUT’s EBITDA margin contracted 188bp sequentially to 17.9% led by 90bp increase in raw-material expenses (mainly related to aluminum) and 70bp increase in employee costs (12% wage hike for employees). On a yoy basis, the margins remained flat as the positive impact of decline in raw-material expenses was negated by 120bp increase in other expenditure. Other expenditure increased as the company took a hit of `36cr on unrealized forex hedges. Adjusted for the same, EBITDA margin declined 110bp to 18.7%. Operating profit grew by 3.8% yoy (down 5.3% qoq) to `872cr.
Exhibit 8: EBITDA margins under pressure
Source: Company, Angel Research
Exhibit 9: High other income benefits bottom-line
Source: Company, Angel Research
Higher other income benefits bottom-line: BJAUT reported bottom-line growth of 1.0% yoy (down 4.4% qoq primarily on account of margin contraction) to `718cr which was 5.5% below our estimates. Bottom-line performance benefited from 26.5% yoy (30.5% qoq) jump in other income led by `33cr gains related to reversal of time value of forex hedges. Tax rate during the quarter increased to 29.5% from 25.4% in both, 1QFY2012 and 4QFY2012 due to reduction in tax benefits from the Pantnagar plant.
67.6 72.4 71.9 73.8 62.8 65.7 64.7 67.3 63.1
32.4 27.6 28.1 26.2 37.2 34.3 35.3 32.7 36.9
0.0 10.0 20.0 30.0 40.0 50.0 60.0 70.0 80.0 90.0
100.0
1QFY
11
2QFY
11
3QFY
11
4QFY
11
1QFY
12
2QFY
12
3QFY
12
4QFY
12
1QFY
13
(%) Domestic Export
36.4
42.1 38.5 38.6 38.3 39.9 38.9
40.9 40.3
27.0 28.6 25.6 26.1 25.3 26.7 25.1 24.5 23.5
20.8 21.9 19.6 19.9 19.6 20.1 18.9 17.9 17.6
0.0
5.0
10.0
15.0
20.0
25.0
30.0
35.0
40.0
45.0
1QFY
11
2QFY
11
3QFY
11
4QFY
11
1QFY
12
2QFY
12
3QFY
12
4QFY
12
1QFY
13
(%) Three-wheelers Motorcycles Total Two-wheelers
20.0 20.7 20.3 19.4 17.8 20.1 19.7 19.8 17.9
74.1 73.5 74.0 73.9 76.4 74.5 73.6 73.4 74.4
0.0
10.0
20.0
30.0
40.0
50.0
60.0
70.0
80.0
90.0
1QFY
11
2QFY
11
3QFY
11
4QFY
11
1QFY
12
2QFY
12
3QFY
12
4QFY
12
1QFY
13
(%) EBITDA margin Raw material cost/sales
590 682 667 676 711 726 795 772 718
15.2 15.7 16.0 16.3 15.1
13.8
15.9 16.6 14.8
0.0
2.0
4.0
6.0
8.0
10.0
12.0
14.0
16.0
18.0
0
100
200
300
400
500
600
700
800
900
1QFY
11
2QFY
11
3QFY
11
4QFY
11
1QFY
12
2QFY
12
3QFY
12
4QFY
12
1QFY
13
(%)(` cr) Net profit (LHS) Net profit margin (RHS)

Bajaj Auto | 1QFY2013 Result Update
July 19, 2012
5
Conference call – Key highlights
Management has guided for an industry volume growth of 7-8% for FY2013 and expects volume pick up in 2HFY2013. On account of volume decline in 1QFY2013, BJAUT may fall short of its guidance of 5mn units of total volumes for FY2013.
Average USD/INR rate at which exports revenue was realized stood at `49.8 in 1QFY2013 as against `48.7 in 4QFY2012.
BJAUT has hedged 90-95% of its estimated exports for FY2013 at a rate of `48-51/USD. Management has started taking hedges for FY2014 exports and is getting favorable rates in excess of `55/USD.
Management expects material cost to inch higher in 2QFY2013 led mainly due to increase in cost of aluminum alloy.
The company expects sales volume in Sri Lanka to revive post August and expects three-wheeler retails volumes of close to 8,000 units from the current levels of around 3,500 units. The inventory level at dealers end in Sri Lanka is around four-six weeks.
The company has increased product price by `500-`1,000 across two-wheeler models in July 2012.
The recently launched Pulsar 200NS and Discover 125ST are expected to be rolled out nationally around the festival season.
Management has guided for a challenging environment in Indonesia and does not expect to break even at the PAT level in FY2013 as well.
BJAUT plans to spend `350cr in capex for FY2013 including `265cr towards purchase of new aircraft.

Bajaj Auto | 1QFY2013 Result Update
July 19, 2012
6
Investment arguments
Strong focus on Discover and Pulsar to improve market share: BJAUT has witnessed slight moderation in demand in the domestic market recently due to increased competitive activity and slowdown in the industry. However, BJAUT continues to focus on its core brands, Discover and Pulsar. The successful launches of Discover 100cc and 125cc bikes have helped BJAUT to maintain its market share at 25-27% in the domestic motorcycle market. Further, launch of the Discover 125ST and Pulsar 200NS is expected to help BJAUT in retaining its strong volume momentum. The company is positioning itself in-line with its strategy of value and price products, wherein it proposes to tap the higher-value bike segments, which have a high-growth potential and fetch better realizations.
Three-wheelers registering healthy growth: BJAUT has a strong presence in the three-wheeler market, with an overall market share (including exports) of ~60%. The company tops the passenger auto-rickshaw segment (~66% market share), which accounts for ~85% of the three-wheeler market. The three-wheeler segment fetches higher margins than the company’s two-wheeler business. Although competition in the domestic three-wheeler space is intense, strong export volume growth has helped BJAUT to post higher volumes. As a result, we expect the company’s three-wheeler volumes to grow by 7-8% over FY2012-14E.
Growth potential in export markets: BJAUT registered a strong exports CAGR of ~29% during FY2007-12, aided by a ~33% CAGR in two-wheeler exports and a ~17% CAGR in three-wheeler exports. Going ahead, we estimate BJAUT to register 14-15% exports revenue CAGR over FY2012-14E, driven by a strong demand from the exports market. BJAUT has hedged 90-95% of its FY2013 exports at a USD-INR rate of `48-51. The recent sharp depreciation of the INR against the USD is expected to further aid exports profitability.
Outlook and valuation
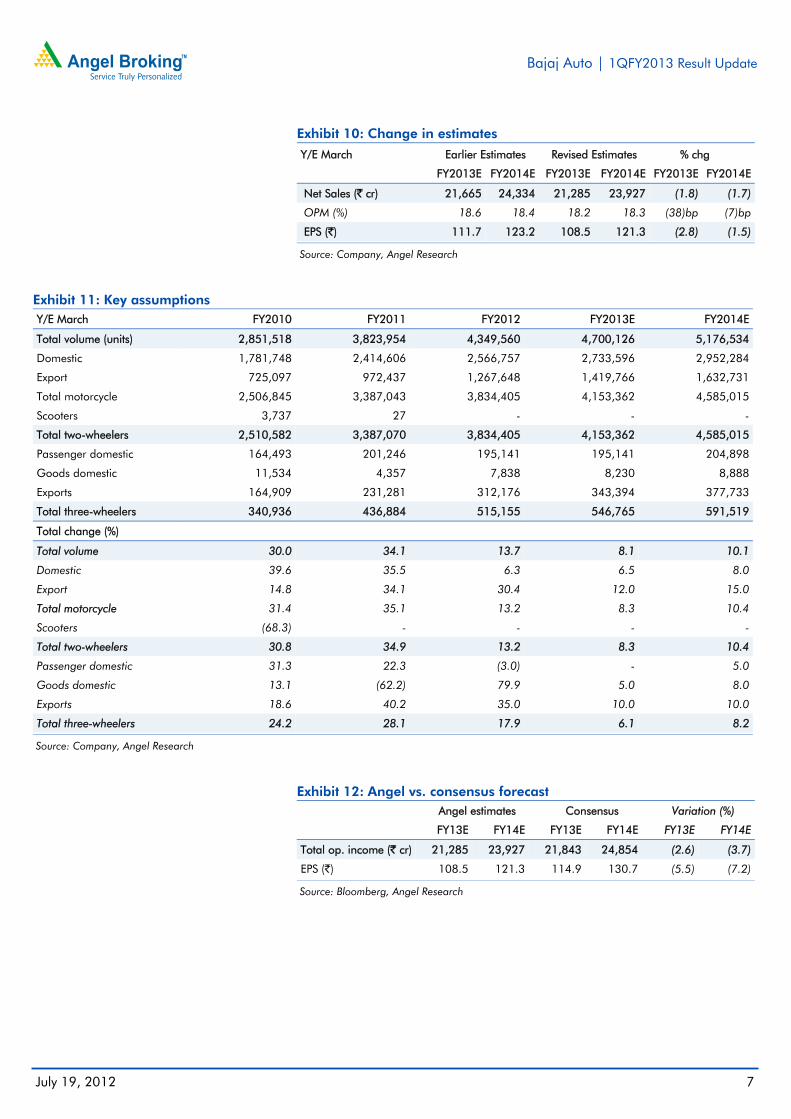
The company expects the export volumes to recover going ahead and also expects the domestic volumes to improve led by new launches (Pulsar 200NS and Discover 125 ST). While the management has guided for ~15% volume growth in FY2013E, we believe that it would be challenging for the company to meet its guidance. We have built in a volume growth of ~8% for FY2013E and have marginally lowered our earnings estimates for FY2013 and FY2014.
At `1,549, BJAUT is trading at 12.8x FY2014E earnings. Due to attractive valuations, we maintain our Accumulate rating on the stock with a target price of `1,698 valuing the stock at 14x FY2014E earnings.
Bajaj Auto | 1QFY2013 Result Update
July 19, 2012
7
Exhibit 10: Change in estimates
Y/E March Earlier Estimates Revised Estimates % chg
FY2013E FY2014E FY2013E FY2014E FY2013E FY2014E
Net Sales (` cr) 21,665 24,334 21,285 23,927 (1.8) (1.7)
OPM (%) 18.6 18.4 18.2 18.3 (38)bp (7)bp
EPS (`) 111.7 123.2 108.5 121.3 (2.8) (1.5)
Source: Company, Angel Research
Exhibit 11: Key assumptions Y/E March FY2010 FY2011 FY2012 FY2013E FY2014E
Total volume (units) 2,851,518 3,823,954 4,349,560 4,700,126 5,176,534
Domestic 1,781,748 2,414,606 2,566,757 2,733,596 2,952,284
Export 725,097 972,437 1,267,648 1,419,766 1,632,731
Total motorcycle 2,506,845 3,387,043 3,834,405 4,153,362 4,585,015
Scooters 3,737 27 - - -
Total two-wheelers 2,510,582 3,387,070 3,834,405 4,153,362 4,585,015
Passenger domestic 164,493 201,246 195,141 195,141 204,898
Goods domestic 11,534 4,357 7,838 8,230 8,888
Exports 164,909 231,281 312,176 343,394 377,733
Total three-wheelers 340,936 436,884 515,155 546,765 591,519
Total change (%) Total volume 30.0 34.1 13.7 8.1 10.1
Domestic 39.6 35.5 6.3 6.5 8.0
Export 14.8 34.1 30.4 12.0 15.0
Total motorcycle 31.4 35.1 13.2 8.3 10.4
Scooters (68.3) - - - -
Total two-wheelers 30.8 34.9 13.2 8.3 10.4
Passenger domestic 31.3 22.3 (3.0) - 5.0
Goods domestic 13.1 (62.2) 79.9 5.0 8.0
Exports 18.6 40.2 35.0 10.0 10.0
Total three-wheelers 24.2 28.1 17.9 6.1 8.2
Source: Company, Angel Research
Exhibit 12: Angel vs. consensus forecast
Angel estimates Consensus Variation (%)
FY13E FY14E FY13E FY14E FY13E FY14E
Total op. income (` cr) 21,285 23,927 21,843 24,854 (2.6) (3.7)
EPS (`) 108.5 121.3 114.9 130.7 (5.5) (7.2)
Source: Bloomberg, Angel Research

Bajaj Auto | 1QFY2013 Result Update
July 19, 2012
8
Exhibit 13: One-year forward P/E band
Source: Company, Angel Research
Exhibit 14: One-year forward P/E chart
Source: Company, Angel Research
Exhibit 15: BJAUT – Premium/Discount to Sensex P/E
Source: Company, Angel Research
Exhibit 16: Two-wheeler stock performance v/s Sensex
Source: Company, Angel Research
Exhibit 17: Automobile - Recommendation summary
Company Reco. CMP (`)
Tgt. price (`)
Upside (%)
P/E (x) EV/EBITDA (x) RoE (%) FY12-14E EPS
FY13E FY14E FY13E FY14E FY13E FY14E CAGR (%)
Ashok Leyland Buy 25 33 33.5 10.1 8.2 5.4 4.5 14.7 16.5 18.4
Bajaj Auto Accumulate 1,549 1,698 9.6 14.3 12.8 9.5 7.9 46.1 41.3 6.7
Hero MotoCorp Buy 2,088 2,428 16.3 14.9 13.8 8.4 6.5 54.7 44.2 12.9
Maruti Suzuki Buy 1,117 1,364 22.1 15.7 12.3 10.0 7.3 12.8 14.4 26.8 Mahindra & Mahindra Buy 710 824 16.0 14.9 13.4 9.0 7.6 21.3 20.5 6.3
Tata Motors Buy 224 305 35.8 5.5 5.1 3.5 3.2 36.0 33.1 9.1
TVS Motor Accumulate 40 42 5.8 8.3 7.6 3.5 3.0 18.2 17.9 0.0
Source: Company, Angel Research
0
500
1,000
1,500
2,000
2,500
Oct
-03
Sep-
04
Jul-0
5
May
-06
Apr
-07
Feb-
08
Dec
-08
Nov
-09
Sep-
10
Jul-1
1
Jun-
12
(`) Share Price (`) 6x 10x 14x 18x
BJAUT de-merged
0.0
10.0
20.0
30.0
40.0
50.0
60.0
Apr
-04
Jan-
05
Nov
-05
Sep-
06
Jul-0
7
May
-08
Mar
-09
Dec
-09
Oct
-10
Aug
-11
Jun-
12
(x) Absolute P/E Five-yr average P/E
(100)
(50)
0
50
100
150
200
250
Apr
-04
Jan-
05
Nov
-05
Sep-
06
Jul-0
7
May
-08
Mar
-09
Dec
-09
Oct
-10
Aug
-11
Jun-
12
(%) Absolute premium Five-yr average premium
0 50
100 150 200 250 300 350 400 450 500
Mar
-08
Sep-
08
Feb-
09
Aug
-09
Feb-
10
Aug
-10
Jan-
11
Jul-1
1
Jan-
12
Jun-
12
TVSL HMCL BJAUT Sensex

Bajaj Auto | 1QFY2013 Result Update
July 19, 2012
9
Company background
Bajaj Auto (BJAUT) is the second largest 2W manufacturer in the country (~26% market share) and a market leader in the 3W segment (~55% market share). BJAUT has three manufacturing facilities in India, located at Waluj, Chakan and Pantnagar, with a total installed capacity (2W - 4.5mn and 3W - 0.6mn) of 5.1mn units. BJAUT also happens to be one of India's largest auto exporters, with exports forming ~33% of revenue (~36% of total volumes) in FY2011. Led by two dominant brands, Discover and Pulsar (~65% of motorcycle volumes), BJAUT reported a strong 25.6% volume CAGR over FY2009-12.
Bajaj Auto | 1QFY2013 Result Update
July 19, 2012
10
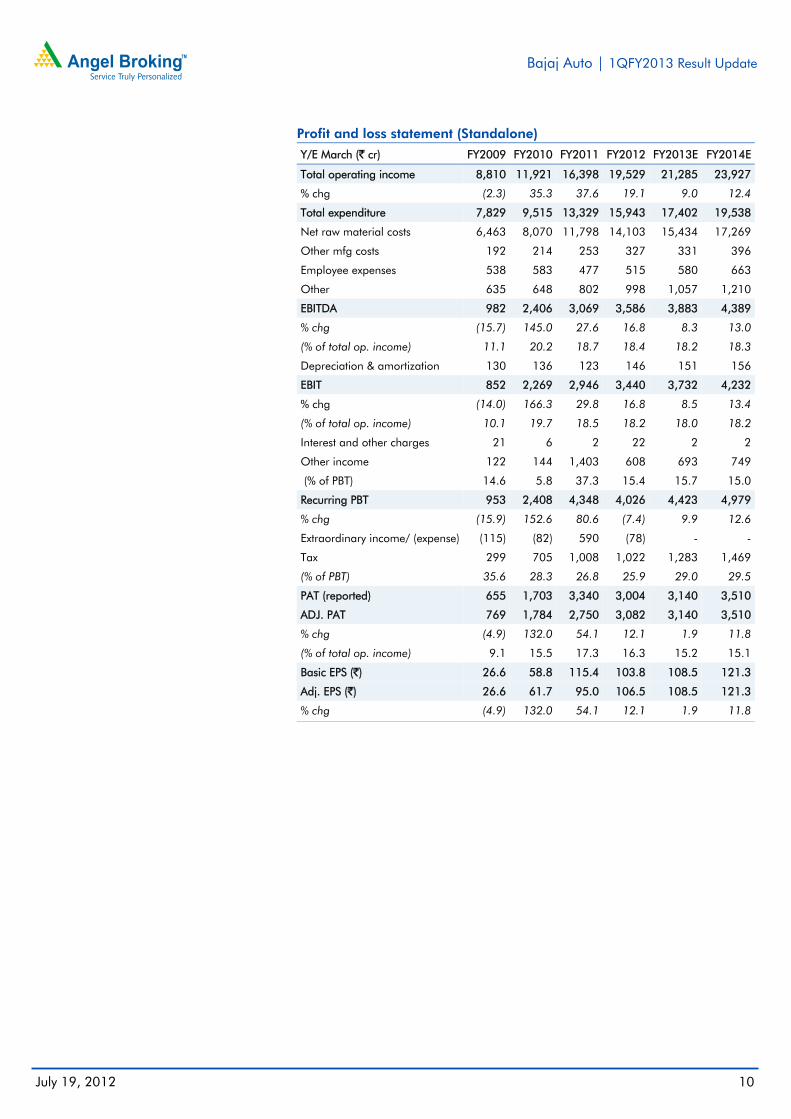
Profit and loss statement (Standalone)
Y/E March (` cr) FY2009 FY2010 FY2011 FY2012 FY2013E FY2014E
Total operating income 8,810 11,921 16,398 19,529 21,285 23,927
% chg (2.3) 35.3 37.6 19.1 9.0 12.4
Total expenditure 7,829 9,515 13,329 15,943 17,402 19,538
Net raw material costs 6,463 8,070 11,798 14,103 15,434 17,269
Other mfg costs 192 214 253 327 331 396
Employee expenses 538 583 477 515 580 663
Other 635 648 802 998 1,057 1,210
EBITDA 982 2,406 3,069 3,586 3,883 4,389
% chg (15.7) 145.0 27.6 16.8 8.3 13.0
(% of total op. income) 11.1 20.2 18.7 18.4 18.2 18.3
Depreciation & amortization 130 136 123 146 151 156
EBIT 852 2,269 2,946 3,440 3,732 4,232
% chg (14.0) 166.3 29.8 16.8 8.5 13.4
(% of total op. income) 10.1 19.7 18.5 18.2 18.0 18.2
Interest and other charges 21 6 2 22 2 2
Other income 122 144 1,403 608 693 749
(% of PBT) 14.6 5.8 37.3 15.4 15.7 15.0
Recurring PBT 953 2,408 4,348 4,026 4,423 4,979
% chg (15.9) 152.6 80.6 (7.4) 9.9 12.6
Extraordinary income/ (expense) (115) (82) 590 (78) - -
Tax 299 705 1,008 1,022 1,283 1,469
(% of PBT) 35.6 28.3 26.8 25.9 29.0 29.5
PAT (reported) 655 1,703 3,340 3,004 3,140 3,510
ADJ. PAT 769 1,784 2,750 3,082 3,140 3,510
% chg (4.9) 132.0 54.1 12.1 1.9 11.8
(% of total op. income) 9.1 15.5 17.3 16.3 15.2 15.1
Basic EPS (`) 26.6 58.8 115.4 103.8 108.5 121.3
Adj. EPS (`) 26.6 61.7 95.0 106.5 108.5 121.3
% chg (4.9) 132.0 54.1 12.1 1.9 11.8

Bajaj Auto | 1QFY2013 Result Update
July 19, 2012
11
Balance sheet statement (Standalone)
Y/E March (` cr) FY2009 FY2010 FY2011 FY2012 FY2013E FY2014E
SOURCES OF FUNDS
Equity share capital 145 145 289 289 289 289
Reserves & surplus 1,725 2,784 4,621 5,752 7,295 9,124
Shareholders’ Funds 1,870 2,928 4,910 6,041 7,584 9,413
Total loans 1,570 1,339 292 97 97 97
Deferred tax liability 4 2 30 48 48 48
Other long term liabilities - - 194 157 157 157
Long term provisions - - 125 112 112 112
Total Liabilities 3,444 4,269 5,550 6,456 7,999 9,828
APPLICATION OF FUNDS Gross block 3,350 3,379 3,395 3,396 3,502 3,636
Less: Acc. depreciation 1,808 1,900 1,912 1,914 2,065 2,221
Net Block 1,542 1,480 1,483 1,482 1,438 1,415
Capital work-in-progress 22 42 70 42 35 36
Investments 1,809 4,022 4,722 4,883 4,883 4,883
Long term loans and advances - - 227 580 580 580
Other noncurrent assets - - 402 1 1 1
Current assets 2,325 1,584 2,344 4,094 6,066 8,326
Cash 137 101 229 1,654 3,256 5,207
Loans & advances 1,491 797 992 1,043 1,243 1,396
Other 697 686 1,123 1,397 1,567 1,722
Current liabilities 2,438 2,858 3,698 4,625 5,003 5,413
Net current assets (112) (1,274) (1,353) (532) 1,062 2,913
Misc. exp. not written off 183 - - - - -
Total Assets 3,444 4,269 5,550 6,456 7,999 9,828
Source: Company, Angel Research

Bajaj Auto | 1QFY2013 Result Update
July 19, 2012
12
Cash flow statement (Standalone)
Y/E March (` cr) FY2009 FY2010 FY2011 FY2012 FY2013E FY2014E
Profit before tax 838 2,489 3,758 3,948 4,423 4,979
Depreciation 130 136 123 146 151 156
Change in working capital 3 790 974 683 8 101
Others (138) 171 (830) (186) - -
Other income (122) (144) (1,403) (608) (693) (749)
Direct taxes paid (299) (705) (1,008) (1,022) (1,283) (1,469)
Cash Flow from Operations 413 2,737 1,614 2,960 2,606 3,019
(Inc.)/Dec. in fixed assets (353) (49) (44) 27 (100) (135)
(Inc.)/Dec. in investments 49 (2,213) (700) (161) - -
Other income 122 144 1,403 608 693 749
Cash Flow from Investing (183) (2,117) 659 474 593 613
Issue of equity - - 145 - - -
Inc./(Dec.) in loans 236 (231) (1,047) (194) - -
Dividend paid (Incl. Tax) 339 372 1,345 1,513 1,597 1,681
Others (723) (796) (2,588) (3,803) - -
Cash Flow from Financing (149) (655) (2,145) (2,484) (1,597) (1,681)
Inc./(Dec.) in cash 81 (35) 127 950 1,602 1,951
Opening Cash balances 56 137 101 229 1,654 3,256
Closing Cash balances 137 101 229 1,179 3,256 5,207

Bajaj Auto | 1QFY2013 Result Update
July 19, 2012
13
Key ratios
Y/E March FY2009 FY2010 FY2011 FY2012 FY2013E FY2014E
Valuation Ratio (x) P/E (on FDEPS) 58.3 26.3 16.3 14.5 14.3 12.8
P/CEPS 57.1 24.4 12.9 14.2 13.6 12.2
P/BV 24.0 15.3 9.1 7.4 5.9 4.8
Dividend yield (%) 0.7 1.3 2.6 2.9 3.1 3.2
EV/Sales 4.9 3.5 2.4 1.9 1.7 1.4
EV/EBITDA 45.3 17.5 13.1 10.7 9.5 7.9
EV / Total Assets 12.9 9.8 7.2 5.9 4.6 3.5
Per Share Data (`) EPS (Basic) 26.6 58.8 115.4 103.8 108.5 121.3
EPS (fully diluted) 26.6 61.7 95.0 106.5 108.5 121.3
Cash EPS 27.1 63.6 119.7 108.8 113.7 126.7
DPS 11.0 20.0 40.0 45.0 47.5 50.0
Book Value 64.6 101.2 169.7 208.8 262.1 325.3
Dupont Analysis EBIT margin 10.1 19.7 18.5 18.2 18.0 18.2
Tax retention ratio 0.6 0.7 0.7 0.7 0.7 0.7
Asset turnover (x) 2.8 3.2 3.5 3.9 4.5 5.1
ROIC (Post-tax) 18.5 45.1 46.9 52.1 57.0 65.5
Cost of Debt (Post Tax) - - - - - -
Leverage (x) - - - - - -
Operating ROE 18.5 45.1 46.9 52.1 57.0 65.5
Returns (%) ROCE (Pre-tax) 26.7 58.8 60.0 57.3 51.6 47.5
Angel ROIC (Pre-tax) 25.8 54.5 55.4 71.6 78.7 91.6
ROE 44.5 74.4 70.2 56.3 46.1 41.3
Turnover ratios (x) Asset Turnover (Gross Block) 2.8 3.5 4.8 5.8 6.2 6.7
Inventory / Sales (days) 15 12 11 12 13 13
Receivables (days) 14 9 7 8 9 9
Payables (days) 49 51 49 47 48 47
WC cycle (ex-cash) (days) (11) (25) (33) (35) (38) (34)
Solvency ratios (x) Net debt to equity (0.2) (1.0) (0.9) (1.1) (1.1) (1.1)
Net debt to EBITDA (0.4) (1.2) (1.5) (1.8) (2.1) (2.3)
Interest Coverage (EBIT / Int.) 41 379 1,743 155 1,914 2,171

Bajaj Auto | 1QFY2013 Result Update
July 19, 2012
14
Research Team Tel: 022 - 39357800 E-mail: [email protected] Website: www.angelbroking.com DISCLAIMER This document is solely for the personal information of the recipient, and must not be singularly used as the basis of any investment decision. Nothing in this document should be construed as investment or financial advice. Each recipient of this document should make such investigations as they deem necessary to arrive at an independent evaluation of an investment in the securities of the companies referred to in this document (including the merits and risks involved), and should consult their own advisors to determine the merits and risks of such an investment.
Angel Broking Limited, its affiliates, directors, its proprietary trading and investment businesses may, from time to time, make investment decisions that are inconsistent with or contradictory to the recommendations expressed herein. The views contained in this document are those of the analyst, and the company may or may not subscribe to all the views expressed within.
Reports based on technical and derivative analysis center on studying charts of a stock's price movement, outstanding positions and trading volume, as opposed to focusing on a company's fundamentals and, as such, may not match with a report on a company's fundamentals.
The information in this document has been printed on the basis of publicly available information, internal data and other reliable sources believed to be true, but we do not represent that it is accurate or complete and it should not be relied on as such, as this document is for general guidance only. Angel Broking Limited or any of its affiliates/ group companies shall not be in any way responsible for any loss or damage that may arise to any person from any inadvertent error in the information contained in this report. Angel Broking Limited has not independently verified all the information contained within this document. Accordingly, we cannot testify, nor make any representation or warranty, express or implied, to the accuracy, contents or data contained within this document. While Angel Broking Limited endeavours to update on a reasonable basis the information discussed in this material, there may be regulatory, compliance, or other reasons that prevent us from doing so. This document is being supplied to you solely for your information, and its contents, information or data may not be reproduced, redistributed or passed on, directly or indirectly.
Angel Broking Limited and its affiliates may seek to provide or have engaged in providing corporate finance, investment banking or other advisory services in a merger or specific transaction to the companies referred to in this report, as on the date of this report or in the past.
Neither Angel Broking Limited, nor its directors, employees or affiliates shall be liable for any loss or damage that may arise from or in connection with the use of this information.
Note: Please refer to the important `Stock Holding Disclosure' report on the Angel website (Research Section). Also, please refer to the latest update on respective stocks for the disclosure status in respect of those stocks. Angel Broking Limited and its affiliates may have investment positions in the stocks recommended in this report.
Disclosure of Interest Statement Bajaj Auto
1. Analyst ownership of the stock No
2. Angel and its Group companies ownership of the stock No
3. Angel and its Group companies' Directors ownership of the stock No
4. Broking relationship with company covered No
Ratings (Returns): Buy (> 15%) Accumulate (5% to 15%) Neutral (-5 to 5%) Reduce (-5% to 15%) Sell (< -15%)
Note: We have not considered any Exposure below ` 1 lakh for Angel, its Group companies and Directors