bahrain economic quarterly - invest in bahrain · seeing the fastest increase in global oil demand...
TRANSCRIPT

BAHRAIN ECONOMIC QUARTERLY| SEPTEMBER 2017
Please refer to the disclaimer at the end of the document. Page 1 of 39
Bahrain Economic Quarterly
September 2017

BAHRAIN ECONOMIC QUARTERLY| SEPTEMBER 2017
Please refer to the disclaimer at the end of the document. Page 2 of 39
S U M M A R Y
ROBUST GROWTH MOMENTUM CONTINUES
The Bahraini economy has continued to post strong non-oil growth against the
backdrop of a more benign international economic environment. At the same time,
confidence across the GCC region is benefiting from stronger oil prices.
Headline real growth in Bahrain attained 3.3% YoY in Q2. This was in line with the
(revised) 3.5% pace posted in Q1. The annual rate of growth during the first half of
the year reached 3.4%, which marked a slight improvement over the 3.2% rate seen
during 2016 as a whole
Non-oil growth momentum has further accelerated in recent quarters. The overall
non-oil growth rate in Q2 was 4.3%. While slightly short of the 5.2% annual pace
seen in Q1, this remained firmly ahead of the 3.7% rate recorded during 2006 as a
whole. The non-oil economy expanded by an annual 4.7% during the first half of
the year in a clear acceleration over 4.0% during 2016 as a whole
Oil output cuts have depressed GCC growth but momentum in the non-oil sector
is accelerating. Compliance with the OPEC-led productions cuts has led to a YoY
contraction in the regional oil sector. By contrast, the non-oil economy is continuing
to adapt to the new economic realities and posting stronger growth than in 2016
The global economy seems to be embarking on its first synchronized recovery
since the onset of the financial crisis. Growth is looking generally stronger in the
advanced economies and is no longer primarily reliant on stimulus measures. Also
emerging market growth is accelerating, partly thanks to stronger performance by
China
Bahrain economic outlook
2016 2017f 2018f 2019f
Real GDP growth, % 3.2% 3.1% 2.7% 2.2% Non-hydrocarbons sector 4.0% 3.9% 3.3% 2.7% Hydrocarbons sector -0.1% 0.0% 0.0% 0.0%
Nominal GDP growth, % 3.4% 7.4% 6.4% 5.6% Inflation (CPI %) 2.8% 1.8% 3.0% 3.5% Current account (% of GDP) -4.6% -3.8% -3.5% -3.2% Fiscal balance (% of GDP) -13.6% -11.0% -9.8% -6.4% Crude Oil Arabian Medium (USD) 43 52 55 55
Source: Bahrain Economic Development Board
SUMMARY 2
GLOBAL ECONOMY 3
THE GCC REGION 8
BAHRAIN 18
KEY SECTORS 35

BAHRAIN ECONOMIC QUARTERLY| SEPTEMBER 2017
Page 3 of 39 Please refer to the disclaimer at the end of the document.
G L O B A L E C O N O M Y
ALL TOGETHER NOW
Even as the global economy remains subject to exceptional risks, the near-term outlooks is
increasingly turning into one of a synchronized recovery. This is the first time since the onset of
the global economic crisis when the growth momentum of most major economies appears to be
no longer primarily driven by stimulus measures.
The recovery is particularly evident in the US but also the Euro-zone has seen a steady
improvement in its performance. Growth in Asian has proven somewhat slower, albeit possibly
due to temporary factors such as the introduction of a national sales tax in India. Indian growth in
Q2 slowed to 5.7%. Similarly, there is continued concern about the build-up in leverage in China,
although for now, growth numebrs have tended to surprise on the upside.
The International Monetary Fund now expects the global economy to expand by 3.6% this year in
a clear acceleration from 3.2% in 2016. A slight further improvement to 3.7% is projected for 2018.
Growth will continue to be solidly led by the emerging economies which are expected to post 4.6%
expansion this year, followed by 4.9% next year. The advanced economies are on track for 2.2%
growth this year and a broadly comparable 2.0% in 2018.
The stronger global growth has also translated into renewed growth in global trade flows. A
downtrend in global trade was reversed last year when 1.4% expansion was achieved. This
accelerated to an annual pace of 4.1% in the first half of 2017, suggesting that one of the main
negative effects of the global crisis maybe passing even as worries persist about growing
protectionism. Apart from greater economic dynamism, the expansion of trade has benefited from
generally stronger commodity prices.
Global growth prospects (real growth in major economies, %)
Source: International Monetary Fund, World Economic Outlook, October 2017
0
1
2
3
4
5
6
7
8
9
2015 2016 2017 2018
World Advanced economies
US Euro-zone
Emerging markets China
India
The global economy
appears to have entered
its first synchronized
recovery since the onset
of the global economic
crisis
BAHRAIN ECONOMIC QUARTERLY| SEPTEMBER 2017
Page 4 of 39 Please refer to the disclaimer at the end of the document.
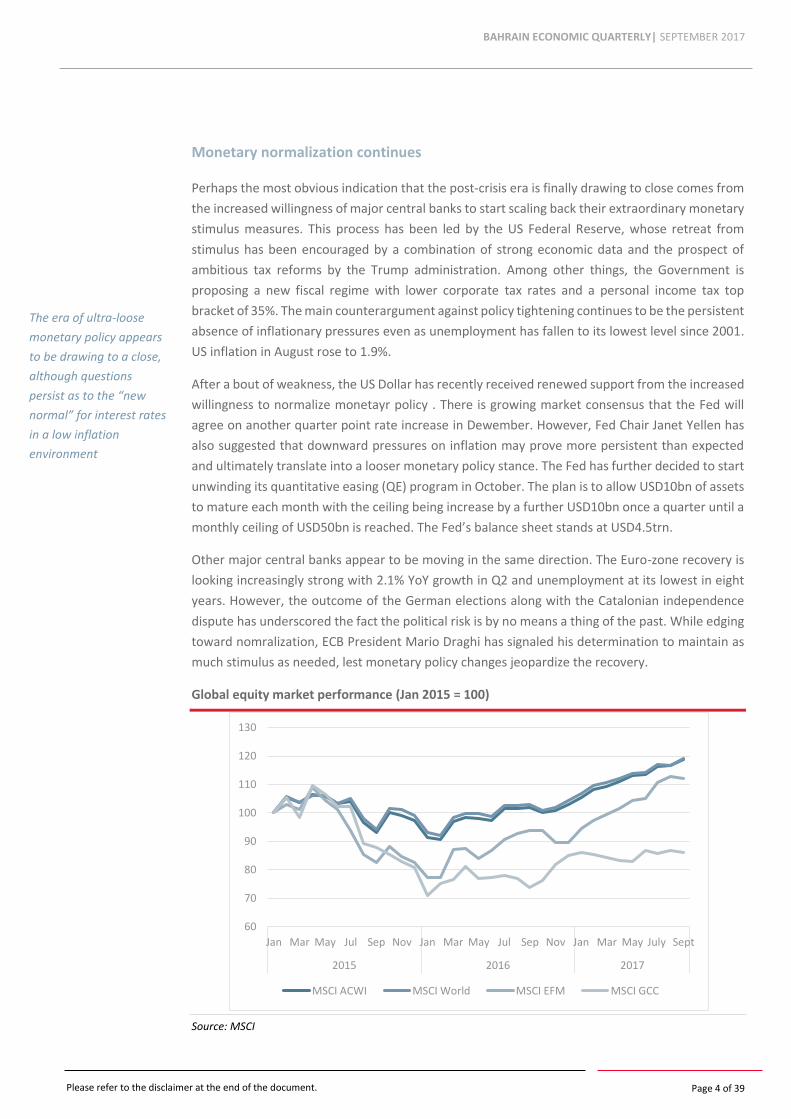
Monetary normalization continues
Perhaps the most obvious indication that the post-crisis era is finally drawing to close comes from
the increased willingness of major central banks to start scaling back their extraordinary monetary
stimulus measures. This process has been led by the US Federal Reserve, whose retreat from
stimulus has been encouraged by a combination of strong economic data and the prospect of
ambitious tax reforms by the Trump administration. Among other things, the Government is
proposing a new fiscal regime with lower corporate tax rates and a personal income tax top
bracket of 35%. The main counterargument against policy tightening continues to be the persistent
absence of inflationary pressures even as unemployment has fallen to its lowest level since 2001.
US inflation in August rose to 1.9%.
After a bout of weakness, the US Dollar has recently received renewed support from the increased
willingness to normalize monetayr policy . There is growing market consensus that the Fed will
agree on another quarter point rate increase in Dewember. However, Fed Chair Janet Yellen has
also suggested that downward pressures on inflation may prove more persistent than expected
and ultimately translate into a looser monetary policy stance. The Fed has further decided to start
unwinding its quantitative easing (QE) program in October. The plan is to allow USD10bn of assets
to mature each month with the ceiling being increase by a further USD10bn once a quarter until a
monthly ceiling of USD50bn is reached. The Fed’s balance sheet stands at USD4.5trn.
Other major central banks appear to be moving in the same direction. The Euro-zone recovery is
looking increasingly strong with 2.1% YoY growth in Q2 and unemployment at its lowest in eight
years. However, the outcome of the German elections along with the Catalonian independence
dispute has underscored the fact the political risk is by no means a thing of the past. While edging
toward nomralization, ECB President Mario Draghi has signaled his determination to maintain as
much stimulus as needed, lest monetary policy changes jeopardize the recovery.
Global equity market performance (Jan 2015 = 100)
Source: MSCI
60
70
80
90
100
110
120
130
Jan Mar May Jul Sep Nov Jan Mar May Jul Sep Nov Jan Mar May July Sept
2015 2016 2017
MSCI ACWI MSCI World MSCI EFM MSCI GCC
The era of ultra-loose
monetary policy appears
to be drawing to a close,
although questions
persist as to the “new
normal” for interest rates
in a low inflation
environment

BAHRAIN ECONOMIC QUARTERLY| SEPTEMBER 2017
Page 5 of 39 Please refer to the disclaimer at the end of the document.
Renewed oil optimism
After a lacklustre and largely flat late spring and summer, the oil market regained some of its
positive momentum in Q3. The monthly average of the Brent benchmark, having troughed at
USD46.4 per barrel in June, rebounded to USD56.2 in September. Several factors account for this
turnaround:
A combination of stronger global growth and a period of lower prices has pushed up the
demand for oil. A bout of relative US Dollar weakness further contributed to this. 2017 is
seeing the fastest increase in global oil demand since 2015, according to the International
Energy Agency (IEA), which now puts its projected demand growth this year at 1.6 mbd, the
equivalent of 1.7%. This is clearly ahead of the 10-year average of some 1.2 mbd
Even though the process of market rebalancing has persistently defied past expectations,
there are growing signs of the supply overhang beginning to diminish. Advanced economy
inventories have declined by some 28% since the beginning of the year. Global oil supply in
August fell by 720,000 b/d while concern is mounting about the ability of several OPEC
members to increase output soon. The situation is particularly acute in Venezuela where
underinvestment is depressing output. But also, countries such as Nigeria, Libya, Iran, and Iraq
are likely to be affected by reduced investment in exploration and field development. The
rebound in US rig numbers has stalled and the shale sector is amidst a major shake-up due to
high leverage levels as the cost of debt has increased
A tighter market is in turn making oil prices more sensitive to unexpected disruptions. Recent
events in Iraqi Kurdistan, which held an independence vote in September, are a case in point
when it prompted Turkey to threaten to halt all oil shipments through its territory. The
Kurdistan Regional Government has relied heavily on the south-eastern Turkish port of Ceyhan
for its crude exports. Meanwhile, the Iraqi parliament voted to place the Kurdish fields under
federal control. KRG output in 2016 was 544,600 b/d with 602,000 b/d projected for this year.
The region is responsible for 12% of Iraq’s output. Kurdish exports last year were estimated at
515,000 b/d. Renewed tensions around the Iranian sanctions deal is another source of market
concern
OPEC and its partners seem firm in their commitment to control their supply until the market
has returned to a balance. OPEC output in August was 32.76 mbd, reflective of 98%
compliance with cuts. There have been reports of discussions to extend the output cuts past
March, potentially for most of 2018. Some are even suggesting a further 1% cut in production.
Saudi Arabia has reiterated its determination to cut unilaterally as needed to support prices
Even as the oil market is showing signs of tightening, there are important questions as to the speed
and continuity of this apparent trend:
OPEC expects demand for its oil to increase next year and recently revised the projected
demand by 400,000 b/d to 32.8 mbd. This is roughly in line with current production levels.
However, OPEC expects demand for its oil to fall short of this in the first half of 2018.
Oil prices regained their
upward momentum in Q3
against the backdrop of
stronger global demand
growth and OPEC
determination to control
output

BAHRAIN ECONOMIC QUARTERLY| SEPTEMBER 2017
Page 6 of 39 Please refer to the disclaimer at the end of the document.
Some industry estimates suggest that US output could grow by as much as 400,000 b/d over
a matter of months should prices rebound to the 60s. Similarly, compliance with the OPEC-led
cuts is likely to prove more difficult to ensure in a more favourable pricing environment. US
exports have risen close to 2 mbd
A stronger Dollar, if sustained, may curb the upward momentum
Monthly average crude oil prices (USD/barrel)
Source: US Energy Information Administration
Global oil demand and supply dynamics (mbd)
IEA OPEC EIA*
2016 Global oil demand (mbd) 96.6 95.1 96.92
Advanced economies 46.8 46.9 46.85
Developing economies 49.7 31.4 50.07
China 11.9 11.5 12.44
2017 Global oil demand (mbd) 97.8 96.4 98.46
Advanced economies 46.9 47.1 47.14
Developing economies 50.9 32 51.32
China 12.3 11.8 12.78
2016 Global oil supply (mbd) 96.9 95.8 97.17
OPEC 39.3 32 39
Non-OPEC 57.6 57.3 58.17
2017 Global oil supply (mbd) - - 98.3
OPEC - - 39.22
Non-OPEC 58.3 58.1 59.08
*Petroleum and other liquids data
Source: International Energy Agency, Organization of the Petroleum Exporting Countries, US Energy Information Administration
0
10
20
30
40
50
60
70
Jan Mar May Jul Sep Nov Jan Mar May Jul Sep Nov Jan Mar May Jul Sep
2015 2016 2017
WTI spot Europe Brent spot

BAHRAIN ECONOMIC QUARTERLY| SEPTEMBER 2017
Page 7 of 39 Please refer to the disclaimer at the end of the document.
Implications for Bahrain
The global backdrop for Bahrain is generally benign with the main risks likely pertaining to a
tighter monetary stance:
The global economic recovery appears to be gathering steam which should support trade
and investment flows
There are renewed signs of oil market rebalancing, which should help improve the fiscal
position in combination with ongoing consolidation efforts
With monetary tightening in the US set to continue, the monetary policy environment is set
to become less permissive. However, there are growing doubts about how far rates can rise
in the current low inflation environment

BAHRAIN ECONOMIC QUARTERLY| SEPTEMBER 2017
Page 8 of 39 Please refer to the disclaimer at the end of the document.
T H E G C C R E G I O N
OIL-FUELLED OPTIMISM
The GCC economy is steadily continuing to adjust to the new oil market and fiscal realities. In this
environment, the drivers of oil sector and non-oil growth are increasingly decoupling, a trend that
various government policies across the region are seeking to encourage further.
Growth in the oil sector is set to fall to a multi-year low this year as a result of the OPEC-led output
cuts. This in turn is likely to reduce headline growth to its cyclical trough – at most 1.5% for the
GCC region as a whole. In fact, some estimates suggest growth of less than 1%.
By contrast, the growth momentum in the non-oil economy appears to be strengthening as
companies adjust to the new economic realities. Further steps toward fiscal consolidation – such
as the introduction of the region-wide value added tax next year – will temper this growth
momentum but are unlikely to reverse it.
GCC real GDP growth, %
N.B. The non-oil growth projections are by the IMF.
Source: International Monetary Fund, World Bank
Gradual strengthening in the non-oil sector
Economic activity in the non-oil sector has generally continued to strengthen across the region.
Nonetheless, the first half of the year saw very subdued growth in much of the region with the
more diversified economies generally performing somewhat better. GCC-wide corporate earnings
disappointed as they came below expectations, reflecting tougher operating conditions. Overall,
net profits were up 3% y/y in the first nine months of 2017, but the pick-up stemmed from cost
cutting rather than higher revenue. Indeed, total revenue growth across Kuwait, Saudi, and the
UAE was flat and up 1% as a whole for the GCC. Also, project awards have remained under
0
1
2
3
4
5
6
2014 2015 2016 2017f 2018f 2019f
World Bank IMF Non-oil
While oil production cuts
will bring down regional
headline growth this year,
non-oil economic activity
is showing signs to
accelerating from last
year’s lows

BAHRAIN ECONOMIC QUARTERLY| SEPTEMBER 2017
Page 9 of 39 Please refer to the disclaimer at the end of the document.
downward pressure with MEED Projects tallying regional awards of USD56.1bn during the first half
of the year, down on USD69.3bn a year earlier.
Economic growth in the region’s largest economy, Saudi Arabia, has remained subdued with a 1%
YoY headline contraction in Q2. This was led by a 1.8% YoY drop in the oil sector as a direct result
of the OPEC cuts. The non-oil sector, by contrast, expanded by an annual 0.6% with the
Government sector increasing by 1% and the non-oil private sector by 0.4%. Recent data point to
gradual strengthening of activity. Point of sale transactions in the summer months achieved
double-digit annual growth rates while ATM withdrawals rose by 4% YoY in August. Trade data,
similarly, has turned more positive with a 19% YoY increase in imports and a 25% rise in non-oil
exports in July. The IMF now projects Saudi headline growth this year of just 0.1% followed by 1.1%
in 2018.
The Non-Oil Economic Composite Indicator of the UAE Central Bank suggested a non-oil growth
rate of 3.1% during the first half of 2017. Nonetheless, the OPEC-led cuts have brought headline
growth down from 3.3% in Q1 to 2.4% in Q2. YoY growth in the Dubai economy decelerated from
3.9% in 4Q16 to 3.2% in 1Q17. While the economy is thus continuing to expand, new job creation
has been minimal. The IMF now expects UAE growth to be 1.3% this year, led by 3.3% expansion
in the non-oil sector. Growth is projected to rebound to 3.4% in 2018.
In Kuwait growth in total consumer spending has also been steadily improving and reached an
annual pace of just under 5% in 2Q17. Also, consumer confidence has continued its gradual
rebound. In spite of the stronger performance of the economy, employment growth has been
historically subdued. In particularly, the public sector added 17% fewer jobs in FY2016/17 than the
year before. Non-Kuwaiti job growth fell below 4% YoY in 1H17. The IMF projects a 2.1% oil-led
contraction in the Kuwaiti economy this year followed by a sharp 4.1% rebound in 2018. Also, the
Oman forecast sees flat GDP this year followed by 3.7% expansion in 2018.
Qatar has seen a sharp slowdown in its growth, partly as a result of a diplomatic dispute with its
neighbours. Headline growth in Q2 stalled to an annual 0.6%, down from 2.4% in Q1. While the
hydrocarbons sector shrank by 2.7% YoY, in line with regional trends, also non-oil growth
decelerated from 5.2% in Q1 to 3.9% in Q2. Going forward, growth is likely to benefit from
increased activity in the hydrocarbons sector with the launch of the Barzan gas project.
Forward-looking indicators of economic activity in the GCC suggest that the positive trend in non-
oil growth is likely to continue. The Emirates NBD Purchasing Managers’ index for the region’s two
largest economies has, in spite of some volatility, seen consistently higher readings that in 2016.
The YTD average during the first three quarters of 2017 was 55.9 in Saudi Arabia, up from 54.9 a
year earlier. The UAE monthly average improved from 53.8 to 55.8 over the same period. The
Emirates NBD Dubai Economy Tracker saw a slight drop from 56.3 in August to 55.2 in September.
Although the overall
growth dynamics are
historically subdued, most
indicators of non-oil
activity point to gradual
normalization

BAHRAIN ECONOMIC QUARTERLY| SEPTEMBER 2017
Page 10 of 39 Please refer to the disclaimer at the end of the document.
Emirates NBD Purchasing Managers’ Index
Source: Emirates NBD, Markit
Going forward, growth in the will likely benefit from potent structural drivers. The Saudi
authorities have announced plans to release a revised version of the National Transformation
Program (NTP) 2020 later this year. The original NTP released last year set 543 initiatives with a
total cost of SAR268bn (USD71bn). Its key overreaching goals were linked to employment, private
sector participation, local content maximization, and digital transformation.
In another important step, the Saudi government has agreed to allow women to drive starting in
June 2018. This will be instrumental for achieving the objectives of greater female labour market
participation and will also reduce reliance on low-cost foreign labour. Other economies activities
benefiting from the move are likely to include car sales, insurance, and consumer goods.
Kuwait is, similarly, implementing its ‘New Kuwait’ strategy which was launched earlier this year.
The plan is aimed at diversifying the economy with key policy initiatives are clustered around seven
key pillars: global standing, human capital, healthcare, living environment, infrastructure, the
economy and public administration.
In an important development for a region going through a major infrastructure build-up, the real
estate sector is showing signs of stabilizing. The property market has been challenged by weaker
demand growth and increasing supply. For instance, the Government estimates that real estate
prices in Saudi Arabia declined by 8.7% last year. The Dubai real estate sector has recorded
stronger growth and especially apartment prices are showing sign stabilizing. Overall transaction
volumes during the first eight months of the year were up by 9.8%, as compared to a 24.6% drop
a year earlier. In Kuwait, residential real estate sales rose by 23% during the first eight months of
the year. Prices are stabilizing, albeit down 5%-10% YoY.
Tourism flows have also remained generally strong. The Dubai International Airport witnessed its
busiest month on record in August with 8.2mn passengers. The YTD average of 7.4mn compared
to a 2016 average of 6.9mn. Hotel occupancy has remained high (83% in 1H17) in spite of new
construction ahead of Expo 2020. Saudi Arabia had a successful Hajj season with a record share of
48
50
52
54
56
58
60
62
Jan Mar May Jul Sep Nov Jan Mar May Jul Sep Nov Jan Mar May Jul Sep
2015 2016 2017
Saudi Arabia United Arab Emirates
The real estate sector is
showing signs of
stabilizing across the
region

BAHRAIN ECONOMIC QUARTERLY| SEPTEMBER 2017
Page 11 of 39 Please refer to the disclaimer at the end of the document.
foreign pilgrims at 74%. The total number of pilgrims rebounded sharply from less than 1.9mn in
2016 to some 2.4mn this year.
Fiscal consolidaiton progresses
The fiscal reforms across the GCC region are beginning to bear fruit while the stronger oil prices
are further accelerating the gradual process of fiscal rebalancing. For instance, Saudi Arabia’s
budget deficit during the first half of 2017 was half the level recovered a year earlier. Saudi
revenues during Q2 rose by an annual 6% to SAR163.9bn, led by a 28% gain in oil revenues.
Spending declined by 1.3% to SAR210.4bn. The resulting deficit of SAR46.5bn compared to a
shortfall of SAR58.4bn as year earlier. Recurrent spending was 2.4% lower in 1H17. Oil made up
62% of Saudi Government income in Q2.
Oman’s budget deficit in the first five months of the year was OMR2bn, as compared to just over
OMR5bn in 2016. Similarly in Qatar, the fiscal shortfall contracted to 5.1% of GDP in Q1, as
compared to 17.9% in 4Q16. Government revenues rose by an annual 31.0%, more than twice as
fast as the 15.8% increase in expenditure.
Brent oil price dynamics, 2016-2017 (USD/barrel)
Source: US Energy Information Administration
Several further steps are being taken to push fiscal consolidation forward:
The costly regime of universal subsidies is continuing to be scaled back. Kuwait has
implemented petrol subsidy cuts while Saudi Arabia is reportedly planning to raise gasoline
and jet fuel prices in November
Revenue diversification is making gradual headway. Saudi Arabia became the first regional
economy to introduce excise duties in June. The UAE introduced an excise duty in October
with a 100% increase on tobacco and energy drinks and 50% on fizzy drinks. The duty is
expected to raise around USD2bn (some 0.5% of GDP) of revenue annually. The UAE has
further reiterated its intention to implement the region-wide VAT from January. It will be
20
25
30
35
40
45
50
55
60
2017 2016
Fiscal consolidation has
benefited from higher oil
prices but also revenue
diversification is
beginning to pay off. The
introduction of excise and
value added taxes is likely
to mark a significant
improvement

BAHRAIN ECONOMIC QUARTERLY| SEPTEMBER 2017
Page 12 of 39 Please refer to the disclaimer at the end of the document.
levied on companies with annual revenues greater than USD1mn. The 5% levy is projected to
generate tax revenues of some USD5bn a year – or 1% of GDP. The Government expects VAT
to generate AED12bn in the first year and AED20bn in the second year
The administration of the fiscal system is strengthening, an example being the creation of the
Federal Tax Authority in the UAE
Government infrastructure spending is continuing to be reviewed in some countries and there
is a growing interest in new funding models involving private capital
Lower oil production underpins slower growth
Having been a key source of GDP growth in recent years, the oil sector across the region is pulling
down headline growth because of the OPEC-led production cuts. Saudi Arabia has been leading
the way and recently signalled that it would be ready to cut a further 300,000 b/d starting in
November to drive the global rebalancing. Similarly, the UAE’s Abu Dhabi National Oil Company
(Adnoc) recently announced that it will cut crude shipments by 10% starting in October.
Overall, regional output has remained well below last year’s levels. Saudi output is estimated to
have averaged just over 9.95 mbd during the first eight months of the year. This is some 4.2% down
on the 10.38 mbd monthly averaged recorded during the corresponding period of 2016. In Kuwait,
the monthly average has declined an estimated 6.2% from a monthly average of just under 2.9
mbd during the first eight months of 2016 to just over 2.7 mbd a year later. In the UAE, the decline
was just over 11.1% from some 3.27 mbd to 2.9 mbd.
Even as crude extraction is under downward pressure in the near term, the regional oil companies
are developing other activities. Saudi Aramco recently announced plans to expand its trading
business to buying and selling non-Saudi crude. Kuwait is pursuing ambitious plans in the
downstream area. The authorities are aiming to modernize and expand the two largest refineries
in the country. An entirely new refinery will be built to replace a decommissioned facility. These
investments should increase the country’s overall refining capacity from 0.9 to 1.4 mbd by 2020.
Key producers across the
GCC have cut their oil
output in response to
OPEC’s current quota
regime

BAHRAIN ECONOMIC QUARTERLY| SEPTEMBER 2017
Page 13 of 39 Please refer to the disclaimer at the end of the document.
Monthly oil production by Saudi Arabia (‘000 b/d)
Source: Joint Organisations Data Initiative, OPEC
Crude oil production in other GCC countries, ‘000 b/d
Source: Joint Organisations Data Initiative, OPEC, Bloomberg
Inflationary convergence at low levels
Consumer price pressures have generally remained on a firm downtrend across the region. While
some regional economies saw YoY inflation in excess of 3% as recently as the beginning of the year,
the regional inflation rates had converged to a fairly narrow range of -0.4% to 1.2% by August.
Both Saudi Arabia and Qatar recorded YoY declines in consumer prices. Indeed, Saudi inflation has
remained consistently negative since the beginning of the year, although the August reading was
barely negative at -0.1%.
9,000
9,200
9,400
9,600
9,800
10,000
10,200
10,400
10,600
10,800
11,000
Jan Mar May Jul Sep Nov Jan Mar May Jul Sep Nov Jan Mar May July
2015 2016 2017
0
500
1,000
1,500
2,000
2,500
3,000
3,500
4,000
Jan Mar May Jul Sep Nov Jan Mar May Jul Sep Nov Jan Mar May July
2015 2016 2017
Kuwait Oman Qatar UAE
Consumer price pressures
have remained minimal
across the region with
Saudi Arabia seeing
deflation since the turn of
the year

BAHRAIN ECONOMIC QUARTERLY| SEPTEMBER 2017
Page 14 of 39 Please refer to the disclaimer at the end of the document.
The highest inflation has been recorded in Kuwait, Oman, and the UAE. However, all three
countries have seen a fairly consistent deceleration this year from the neighbourhood of 3% to
around 1% in August.
The slower inflation has been due to reduced import price inflation thanks to bouts of US Dollar
strength as well as the inflationary impact of earlier subsidy price cuts wearing off. There have
been minimal disruptions in the food market, while the ample new supply in the real estate market
has curbed housing cost inflation at a time of measured demand growth.
Going forward, the introduction of the regional excise duty and VAT is likely to stoke up renewed
inflationary pressure. UAE government officials have estimated the short-term inflationary impact
of VAT and the excise duty at 1.4%.
Consumer price inflation, %
Source: National statistical agencies
Fixed income markets drive financial sector activity
Activity in the financial sector has been heavily dominated by continued sovereign issuance, while
also corporate names, especially in banking and utilities remain active. In particular, the sukuk
market has become more active in spite of some concerns over the impact of the Dana Gas dispute.
GCC sukuk issuance in the first half was USD17bn, up on USD13.7bn a year earlier. Total GCC bond
and sukuk issuance in 1H17 reached a record USD43, as compared to USD36bn a year earlier.
Most GCC governments have tapped the bond and sukuk markets at a time of low rates and strong
international demand:
Saudi Arabia in July launched a new domestic sukuk program following regular domestic bond
issuance between 2015 and September 2016. 13 Saudi banks were qualified as participants by
the Ministry of Finance. Three rounds of sales with an aggregate value of SAR37bn were
conducted by the end of Q3: SAR17bn in July, SAR13bn in August, and SAR7bn in September.
-1
0
1
2
3
4
5
6
Jan
uar
y
Mar
ch
May
July
Sep
tem
ber
No
vem
ber
Jan
uar
y
Mar
ch
May
July
Sep
tem
ber
No
vem
ber
Jan
uar
y
Mar
ch
May
July
2015 2016 2017
Kuwait Oman Qatar Saudi Arabia UAE
Inflationary pressures
remain subdued across
the region with a clear
downtrend in evidence
since the summer

BAHRAIN ECONOMIC QUARTERLY| SEPTEMBER 2017
Page 15 of 39 Please refer to the disclaimer at the end of the document.
The placements were approximately three times oversubscribed with the latest round in
September attracting SAR24bn of subscriptions. Each round was composed of three tranches
with tenors of five, seven, and ten years, respectively
Saudi Arabia in late September issued its second international bond, a USD12.5bn offering,
which was the largest emerging market bond in 2017. A USD3bn five-year tranche was priced
at 110 basis points over US Treasuries. A USD5bn 10-year bond was placed at 145 bps over
Treasuries, while a USD4.5bn 30-year offering had a 185 bps margin. More than three times
oversubscribed, the placement attracted bids in excess of USD40bn. Saudi Arabia has raised
nearly USD40bn in international markets since 2016
The Kuwaiti Cabinet in August approved a bill that allows the Government to take loans of up
to KWD25bn for a period up to 30 years. Recent issuance by the Central Bank of Kuwait took
the total outstanding domestic debt to KWD4.9bn
Oman in August announced a USD3.55bn five-year loan agreement with a number of Chinese
financial institutions. The initial target for the deal had been USD2bn
At the very beginning of October, Abu Dhabi issued a USD10bn international bond which
attracted some USD30bn of subscriptions. The offering was composed of three tranches with
maturities of five, 10, and 30 years, respectively. The spreads varied between 65 bps and 130
bps above Treasuries
GCC equity market indices (January 2016=100)
Source: Regional stock exchanges
The regional equity markets have generally lagged their international peers, reflecting the volatility
of oil prices as well as the historically weaker drivers of non-oil growth at a time of tighter liquidity
and reduced government spending. Most regional markets have fluctuated around a relatively flat
trend this year. During Q3, Dubai and Oman were the only two regional markets to post positive
growth, by 5.1% and 0.4% respectively. Apart from an 8% drop at Qatar Exchange, the other
regional exchanges posted modest declines of 0.6-1.8%. During the first three quarters of the year,
80
90
100
110
120
130
140
Jan
-16
Feb
-16
Mar
-16
Ap
r-1
6
May
-16
Jun
-16
Jul-
16
Au
g-1
6
Sep
-16
Oct
-16
No
v-1
6
Dec
-16
Jan
-17
Feb
-17
Mar
-17
Ap
r-1
7
May
-17
Jun
-17
Jul-
17
Au
g-1
7
Sep
-17
Kuwait Oman Qatar Saudi Arabia Abu Dhabi Dubai

BAHRAIN ECONOMIC QUARTERLY| SEPTEMBER 2017
Page 16 of 39 Please refer to the disclaimer at the end of the document.
Boursa Kuwait was the strongest performer with a 16.2% gain. Saudi Arabia’s TASI gained 1% and
the Dubai Financial Market 0.9%. The other regional markets declined in YTD terms with Abu Dhabi
shedding 3.3%, Oman 11.2%, and Qatar 20.4%.
In an important development in the ongoing internationalization of the regional equity markets,
FTSE Russell included Kuwait as a “secondary emerging market” as of September 2018. The
decision is likely to result in passive inflows of USD600-800mn as more international investors
choose to track the Kuwaiti index. FTSE Russell did not yet include Saudi Arabia in its Emerging
Markets index but is expected to consider the issue again in March.
Primary equity market activity has remained fairly subdued by historical standards. A total of 14
GCC companies listed during the first three quarters of the year. However, the amount raised –
USD632mn – fell short of the corresponding figure in 2016, namely USD745mn. Outside of the
GCC, Dubai-based oil and gas production services firm ADES International Holding raised
USD243.5mn in a London IPO in May. Q3 saw only one IPO when Saudi Arabia’s Zahrat al Waha
Trading Co. sold a 30% stake in September.
GCC quarterly IPO activity
Source: PricewaterhouseCoopers, Tadawul
Reflecting the lower oil price environment, bank lending has generally continued to edge down
across the region. At same time, new liquidity requirements under Basel III appear to be curbing
loan growth. With the exception of Qatar and Kuwait, the YoY pace of lending growth is now below
5%. In the case of Saudi Arabia, credit growth has remained negatively, albeit on the latest data
only barely so.
In the case of Qatar, renewed lending growth has been made possible by a sharp increase in public
sector deposits, which were up 70% YoY as of July. A QAR95bn injection since the onset of the
crisis has pushed up the share of government deposits from 26% to 37%. While primarily a
response to heavy non-resident deposit outflows, the policy has also increase the annual pace of
deposit growth to 20% in August.
0
2
4
6
8
10
12
0
200
400
600
800
1000
1200
1400
Q1 Q2 Q3 Q4 Q1 Q2 Q3 Q4 Q1 Q2 Q3
2015 2016 2017
Value (USD mn) Number (RHS)
Bank lending has
generally tended to drift
down in a tighter liquidity
environment

BAHRAIN ECONOMIC QUARTERLY| SEPTEMBER 2017
Page 17 of 39 Please refer to the disclaimer at the end of the document.
Bank credit growth, %
Source: Regional central banks
-5
0
5
10
15
20
25
Jan
uar
y
Mar
ch
May
July
Sep
tem
ber
No
vem
ber
Jan
uar
y
Mar
ch
May
July
Sep
tem
ber
No
vem
ber
Jan
uar
y
Mar
ch
May
July
2015 2016 2017
Kuwait Oman Qatar Saudi Arabia UAE
Implications for Bahrain
The regional environment of historically subdued growth and ongoing fiscal consolidation
entails mixed implications for Bahrain:
The improved near-term prospects for the non-oil economy should support regional trade
and investment. However, the ongoing steps toward government revenue diversification
are likely to test to positive momentum somewhat
More subdued disposable income growth should increase Bahrain’s appeal as a regional,
cost effective holiday and weekend destination, thereby supporting tourism

BAHRAIN ECONOMIC QUARTERLY| SEPTEMBER 2017
Page 18 of 39 Please refer to the disclaimer at the end of the document.
B A H R A I N
ROBUST GROWTH MOMENTUM CONTINUES
Recent revisions to the 2016 National Accounts as well as more complete data for 1Q17 indicate
that the Bahraini economy is on a somewhat faster growth trajectory than previously estimated.
The revised overall growth figure for 2016 was 3.2% and growth in Q1 further accelerated to 3.5%.
The Bahraini economy posted another quarter of strong performance during the April-June period.
Headline real growth in the Kingdom attained 3.3% YoY in Q2. The annual rate of growth during
the first half of the year reached 3.4%, which marked a further improvement over the rate seen
during 2016 as a whole.
Non-oil growth decelerated from an annual 5.2% in Q1 to 4.3% in Q2. The non-oil economy
expanded by an annual 4.7% during the first half of the year. This nonetheless remained ahead of
the 4.0% pace recorded during 2006 as a whole. The continued strong growth momentum is
reflective of unusually strong countercyclical drivers, most notably unprecedented infrastructure
investments.
By contrast, the oil sector has remained under some continued downward pressure. It contracted
by just over 0.5% YoY in Q2. The annual pace of decline during 1H17 was 1.9%. The declines are
partly reflective of a base effect as especially offshore output was above historic capacity levels
last year. Onshore production, similarly, remained under some downward pressure during 1H17.
Real GDP growth
Source: Information & e-Government Authority
-3
-2
-1
0
1
2
3
4
5
Q1 Q2 Q3 Q4 Q1 Q2 Q3 Q4 Q1 Q2
2015 2016 2017
QoQ YoY
The Bahraini economy is
growing slightly faster the
previously projects with
the YoY growth rate 3.4%
during 1H17

BAHRAIN ECONOMIC QUARTERLY| SEPTEMBER 2017
Page 19 of 39 Please refer to the disclaimer at the end of the document.
Projected real GDP growth contribution
Recent data revisions put the trend growth rate in Bahrain at a higher level than previously estimated.
In addition, the ongoing rapid build-up in infrastructure spending along with the fiscal direction
provided by the 2017-2018 suggest that growth is likely to remain around 3% in 2017 and 2018 alike.
Beyond that, further steps toward fiscal consolidations (notably the full impact of VAT) along with the
base effect on the infrastructure side, are likely lead to more moderate growth with a gradual
deceleration toward 2-2.5% now likely by 2019.
Near-term inflationary presureres are likely to remain fairly measured with the introduciton of VAT
eventurally rtesully in one-off increases. However, inflationary expectations remain well anchored.
The fiscal and external imbalances are likely to correct gradually, with the introduction of VAT
eventually accelerating the fiscal consolidation more significantly.
-0.5
0
0.5
1
1.5
2
2.5
3
3.5
4
2015 2016 2017f 2018f 2019f
Hydrocarbons Non-oil GDP GDP
Forecasts: Growth continuity in the face of conflicting pressures
2016 2017f 2018f 2019f
Real GDP growth, % 3.2% 3.1% 2.7% 2.2% Non-hydrocarbons sector 4.0% 3.9% 3.3% 2.7% Hydrocarbons sector -0.1% 0.0% 0.0% 0.0%
Nominal GDP growth, % 3.4% 7.4% 6.4% 5.6% Inflation (CPI %) 2.8% 1.8% 3.0% 3.5% Current account (% of GDP) -4.6% -3.8% -3.5% -3.2% Fiscal balance (% of GDP) -13.6% -11.0% -9.8% -6.4% Crude Oil Arabian Medium (USD) 43 52 55 55
Source: Central Bank of Bahrain, Ministry of Finance, Information & e-Government Authority, Economic Development Board forecasts

BAHRAIN ECONOMIC QUARTERLY| SEPTEMBER 2017
Page 20 of 39 Please refer to the disclaimer at the end of the document.
Non-oil activity shows continued resilience
The revised national accounts data showed 5.2% YoY growth in the non-oil sector during Q1. With
Government Services posting only modest growth, the non-oil private sector expanded by a
remarkable 5.7%. This growth momentum moderated somewhat in Q2 and its composition
changed. Nonetheless, growth remained strong by recent historical standards.
The YoY non-oil growth rate in Q2 was 4.3%. While markedly lower than the Q1 reading, this still
pointed to non-oil sector momentum ahead of that seen in 2016. The non-oil private sector
expanded by an annual 4.4% while Government services expended by 3.6%.
The overall rate of non-oil growth during the first half of 2017 reached 4.7% as compared to the
first half of 2016. This was clearly ahead of the 4.0% non-oil growth recorded during 2016 as a
whole. The non-oil private sector expanded by just over 5% in annual terms. This compared to
3.1% YoY expansion in the Government Services sector.
Real GDP growth composition
Source: Information & eGovernment Authority
The sectoral composition of growth in Q2 was broadly in line with the trends seen during the
beginning of the year. The fastest growing sector was Hotels & Restaurants, which posted a 13.4%
YoY rate of expansion in a slight acceleration from the 12.3% pace seen in Q1. Social & Personal
Services adhered to its established track record as one of the most dynamic sectors of the economy
– a reflection of the continued popularity of private education and health care in the Kingdom. The
YoY rate of growth in Q2 was 9.8%, almost exactly in line with the 10.1% pace seen in Q1. Financial
Services have continued to post robust growth, expanding by an annual 7.6% in Q2, down slightly
from 8.3% in Q1. The Trade sector saw a clear pick-up in activity from 3.6% in Q1 to 5.6% in Q2.
During the first half of the year as whole, Hotels & Restaurants posted 12.9% YoY growth. Social &
Personal Services expanded by 9.9%. Financial Services posted 7.9% YoY growth. Transportation &
Communications grew by 7%, Real Estate & Business Activities by 4.9%, and Trade by 4.6%.
-3
-2
-1
0
1
2
3
4
5
Q1 Q2 Q3 Q4 Q1 Q2 Q3 Q4 Q1 Q2
2015 2016 2017
Oil Government Other GDP
Non-oil growth in 1H17
attained an annual pace
of 4.7%. The momentum
was led by the private
sector which expanded by
5.0% YoY

BAHRAIN ECONOMIC QUARTERLY| SEPTEMBER 2017
Page 21 of 39 Please refer to the disclaimer at the end of the document.
Source: Information & e-Government Authority
In something of a departure from recent historical trends, the Manufacturing sector posted a 0.8%
YoY decline during 1H17. This was in part due to production disruptions at the Alba aluminium
smelter which have seen been rectified. Similarly, the Construction sector, which has been one of
the most dynamic areas in recent year, expanded by just 2.2% in 1H17. In fact, the second quarter
saw a slight 0.1% YoY contraction. While the slower momentum is partly due to a base effect after
a couple of years of robust growth, some of slowdown is likely to prove temporary given the
ongoing build-up of infrastructure project activity.
The outlook for the economy looks generally encouraging in view of the Quarterly Business
Perceptions Survey (QBPS) undertaken by the Information & eGovernment Authority (iGA). The
most recent data suggest that businesses in the Kingdom had a clearly more favourable view of
2015 2016 2017
YoY growth, % Annual Annual Q1 Q2 H1
Crude Pet. & Nat.
Gas -0.1 -0.1 -3.3 -0.5 -1.9
Manufacturing 3.2 1.3 0.4 -1.9 -0.8
Construction 5.9 5.7 4.6 -0.1 2.2
Trade 2.1 3.0 3.6 5.6 4.6
Hotels &
Restaurants 3.0 2.0 12.3 13.4 23.9
Transp. & Comm’s 6.8 3.2 8.2 5.9 7.0
Social & Pers. Serv. 3.5 9.1 10.1 9.8 9.9
Real Est. & Bus. Act. 1.7 2.8 4.5 5.3 4.9
Finance 4.5 5.2 8.3 7.6 7.9
Government 2.2 2.5 2.6 3.6 3.1
Other 7.9 3.6 6.6 5.6 6.1
GDP 2.9 3.2 3.5 3.3 3.4
The service sector drove
growth in the Bahraini
economy during 1H17

BAHRAIN ECONOMIC QUARTERLY| SEPTEMBER 2017
Page 22 of 39 Please refer to the disclaimer at the end of the document.
the business environment in Q2 than during the opening three months of the year. The percentage
of respondents with a favourable assessment of the current situation rose from 24.8% in Q1 to
35.9% in Q2. The share of pessimistic assessments declined from 17% to 12.6% over the same
period. The favourable assessments were consistently more prevalent for the larger the
companies in question.
Bahrain QBPS opinions regarding current business performance, 1-2Q17
Source: Information & eGovernment Authority
Forward-looking indicators of business confidence in Bahrain attest to continued dynamism in the
economy. According to the QBPD, the proportion of optimists among respondents has risen from
41.8% in Q2 to 52.6% in Q3. At the same time, the proportion of those subscribing to an
unfavourable outlook has declined from 9.2% to 6%.
Bahrain Business Confidence Index, 2-3Q17
Source: Information & eGovernment Authority
Favourable Neutral Unfavourable
Q1
Q2
Optimistic Neutral Pessimistic
Q2
Q3
Business confidence has
remained resilient and
companies appear
increasingly optimistic
about the future

BAHRAIN ECONOMIC QUARTERLY| SEPTEMBER 2017
Page 23 of 39 Please refer to the disclaimer at the end of the document.
Oil production edges up in Q3
The oil sector in Bahrain had relatively weak first half of the year, posting YoY declines in Q1 and
Q2 alike. This was partly due to the base effect of historically high production in 1H16 but also
reflected a gradual decline in onshore production.
Encouragingly, these trends were reversed in Q3. Off-shore output from the Abu Sa’afah field
rebounded to 161,494 b/d. This marked a 0.5% increase on the previous quarter. However, it was
0.9% down in YoY terms, in reflection of the historically and seasonally high production in 3Q16.
Production from the on-shore Bahrain field reached 44,400 b/d in Q3. This represented a 1.1%
QoQ increase but a 12.9% YoY drop.
During the first three quarters of the year, Bahrain’s total oil production averaged 204,332 b/d.
This was broadly comparable to the 2016 all-year average of 202,063 b/d. Abu Sa’afah production
was some 4% higher in 1-3Q17 than during 2016. Bahrain Field production, by contrast, was 8.1%
lower.
Crude oil production, b/d
Source: National Oil and Gas Authority
Counter-cyclical project drivers remain strong
Bahrain continues to benefit from exceptionally strong growth drivers in the infrastructure
projects area. According to MEED Projects, the active pipeline of projects in Bahrain stood at
USD83.6bn in October, up some 21.4% in YoY terms. According to the Ministry of Works, Municipal
Affairs, and Urban Planning, 627 investment projects with a footprint of 4.9mn sq m were
authorized in Bahrain in 1-3Q17. This was up from 560 projects and 2.1mn sq m a year earlier. The
aggregate value of the projects increased from BHD526mn to BHD1.3bn/
A number of projects are making progress:
0
50,000
100,000
150,000
200,000
250,000
Q1 Q2 Q3 Q4 Q1 Q2 Q3 Q4 Q1 Q2 Q3
2015 2016 2017
Bahrain Field Abu Sa'afah
Oil production has
remained broadly in line
with 2016 levels

BAHRAIN ECONOMIC QUARTERLY| SEPTEMBER 2017
Page 24 of 39 Please refer to the disclaimer at the end of the document.
The new 350,000 b/d oil pipeline between Saudi Arabia and Bahrain is due to be completed
next year. The expanded capacity will in turn support the modernization of the Bapco refinery
which is seeking to boost its capacity from 267,000 to 360,000 b/d. The estimated USD5bn
project is expected to be awarded by the end of the year. Plans are reportedly under
consideration also for a gas pipeline to connect the two countries
The Bahrain LNG terminal is expected to be commissioned in 2019. The pioneering PPP project
has a total estimated value of USD1bn
The Electricity and Water Authority (EWA) has received proposals for a planned 100 MW
photovoltaic solar power plant. The facility is due to be tendered in February and
commissioned in 2019. The Government’s National Renewable Energy Action Plan seeks to
produce 5% of Bahrain’s energy needs from renewables by 2025, a proportion that is due to
increase further to 10% in 2035
EWA has received prequalification bids for the planned Al Dur 2 independent water and power
project. The new facility is expected to have a power generation capacity of 1,200-1,500 MW
and a desalination capacity of 50mn imperial gallons a day. EWA is expected to sign a 20-year
power purchase agreement as the plant becomes operational in 2020. Power demand in
Bahrain grew by 3.5% and is expected to increase by an annual average of 6.4% in the medium
term
The Ministry of Works, Municipal Affairs, and Urban Planning has received bids for the
expansion of the Tubli wastewater plant. The project is designed to double the capacity of the
plant from 200,000 cu m a day to 400,000 cu m/d. The value of the project is expected to be
close to USD400mn
Tender documents are due to be released for a feasibility study of the King Hamad Causeway
in April 2018. The project which will establish a 25km road and rail causeway between Bahrain
and Saudi Arabia to parallel the current King Fahad Causeway. The rail segment is 70 km and
may be structured separately
Bids have been submitted for the North Manama Causeway and Busaiteen link road project
which will create a fourth bridge between Manama and the island of Muharraq
Eagle Hills has appointed the main contractor for a USD270mn Marassi Shores Residences
project providing 287 units. Another scheme, Marassi Boulevard, will provide 240 residential
units and a retail area. The Marassi al Bahrain master development is expected to house
22,000 people and provide 1,200 jobs
In connection with ongoing efforts to revive projects that stalled during the global financial
crisis, the Judicial Committee for the Settlement of Stalled Real Estate Projects is due to
publicly auction the Amway Gateway mixed-used project at the end of October. The project
covers an area of 33,391 sq m
The GCC Development Program is seeing a major scaling up of activity as the pipeline of tendered
projects becomes active. As of Q3, the total value of awarded projects was just below USD3.5bn
2017 is likely to see the
fastest scaling up of
GCC Development
Programme projects
since its inception

BAHRAIN ECONOMIC QUARTERLY| SEPTEMBER 2017
Page 25 of 39 Please refer to the disclaimer at the end of the document.
while the aggregate value of projects that have commenced stood at USD3.3bn. The cumulative
fund disbursement to date stand at less than USD1.3bn.
GCC Development Program project pipeline, USD mn (cumulative totals)
Source: Government sources
In general, activity in the real estate sector has been characterized by continuity. According to data
collected by the Survey and Land Registration Bureau, the total value of property transactions in
Q2 stood at BHD238.1mn, as compared to BHD290mn in Q1.
The aggregate value of real estate trading during the first seven months was BHD613.6mn. The
monthly average of BHD87.8mn. This compared to a 20216 monthly average of BHD86.6mn. Local
buyers have decisively dominated the market in 2017.
Aggregate value of real estate transactions, BHD
Source: Survey and Land Registration Bureau
0
500
1000
1500
2000
2500
3000
3500
4000
4500
Q1 Q2 Q3 Q4 Q1 Q2 Q3 Q4 Q1 Q2 Q3 Q4 Q1 Q2 Q3 Q4 Q1 Q2 Q3
2013 2014 2015 2016 2017
Tendered Awarded Commenced Disbursed
0
50,000,000
100,000,000
150,000,000
200,000,000
250,000,000
300,000,000
350,000,000
400,000,000
Q1 Q2 Q3 Q4 Q1 Q2 Q3 Q4 Q1 Q2
2015 2016 2017
Locals GCC citizens Other foreigners
The value of real estate
transactions rose by an
annual 8.1% in 1Q17

BAHRAIN ECONOMIC QUARTERLY| SEPTEMBER 2017
Page 26 of 39 Please refer to the disclaimer at the end of the document.
Visitor numbers in Bahrain have continued to grow steadily. The YTD total of inbound visitors
during the first eight months of the year was 10.28mn, up just over 3.7% from the I-VIII 2016 total
of 9.91mn. Growth was particularly pronounced on the King Fahad Causeway where the
cumulative number of inbound arrivals rose to nearly 8.6mn, up 5% on just over 8.1mn a year
earlier. Airport arrivals were more or less flat and totalled just over 1.7mn during the first eight
months of the year.
Visitor arrivals by port of entry
Source: Ministry of the Interior – Nationality, Passports & Residence Affairs
Trade volumes stable
Trade volumes have generally remained broadly in line with last year’s readings. The total value of
non-exports during the first eight months of the year rose to USD4.72bn. This was comparable to
USD4.82bn during the corresponding period of 2016. The value of exports of Bahraini origin
increased quite sharply from USD3.26bn in I-VIII 2016 to USD3.81bn a year later – a 16.9% YoY
increase. This was above all indicative of strong prices of metals and metal products which
dominate among Bahrain’s export bundle.
According to Civil Aviation Affairs of the Ministry of Transportation and Telecommunications, the
cumulative volume of airborne cargo traffic rose by an annual 10% during the first three quarters
of the year to reach 174,856 tonnes.
0
200,000
400,000
600,000
800,000
1,000,000
1,200,000
1,400,000
Jan
Mar
May Ju
l
Sep
No
v
Jan
Mar
May Ju
l
Sep
No
v
Jan
Mar
May Ju
l
2015 2016 2017
Causeway Airport
Bahrain’s non-oil export
volumes have
rebounded sharply
since 2H16

BAHRAIN ECONOMIC QUARTERLY| SEPTEMBER 2017
Page 27 of 39 Please refer to the disclaimer at the end of the document.
Non-oil trade, USD mn
Source: Information & eGovernment Authority, preliminary data from Customs Affairs
Continued low inflation
Headline inflation is Bahrain has accelerated somewhat recently after several months of minimal
price pressures. The YoY rate of consumer price increases in September rose to 2%, which was
slightly down on 2% in August. This had been the highest reading so far during 2017. In spite of
this, the average monthly rate of YoY inflation during the first nine months of 2017 was
substantially lower than a year earlier: 1.1%, as compared to 3.1% during January-September
2016. The year-to-date rate of inflation was 1.1% and the Q3 reading 1.7%, up on 0.9% in Q2.
The slowdown in inflation is mainly due to the impact of the 2015 subsidy cuts wearing off,
although utilities tariffs, for instance, remain subject to annual increments. At the same time, food
inflation has been relatively subdued while a steady influx of new supply has checked the rise of
housing costs. Price pressures in September were led by clothing and footwear (5.5% YoY
inflation), housing costs (5%), recreation and culture (2.2%), and food (2%). YoY price decreases
were observed in transportation (-2%), furnishings, household equipment, and maintenance (-
1.2%), as well as communication (-0.2%).
-1500
-1000
-500
0
500
1000
Jan
Feb
Mar
Ap
r
May Jun
Jul
Au
g
Sep
Oct
No
v
Dec Jan
Feb
Mar
Ap
r
May Jun
Jul
Au
g
2016 2017
Re-exports Exports Imports
Consumer price
inflation slowed down
sharply in 2H16 with
food price inflation in
fact turning negative

BAHRAIN ECONOMIC QUARTERLY| SEPTEMBER 2017
Page 28 of 39 Please refer to the disclaimer at the end of the document.
Consumer price inflation, % YoY
Source: Information & e-Government Authority
Increased bank lending
Following a gradual deceleration in the annual pace of bank lending since the beginning of 2016,
recent months have seen renewed growth. The overall YoY rate of credit growth peaked at 3.9%
in July before decelerating slightly to 3.4% in August. As recently as May, the rate had been just
narrowly above 2%. Encouragingly, the lending growth has been entirely thanks to increased credit
to the private sector. Throughout the year, the YoY change in credit to the Government has been
negative.
As of August, business loans made up 53.3% of the total BHD8.4bn retail bank portfolio. Loans to
the personal sector accounted for 44% while the share of the government sector was 2.7%.
-10
-5
0
5
10
15
20
Jan Mar May Jul Sep Nov Jan Mar May Jul Sep Nov Jan Mar May Jul Sep
2015 2016 2017
CPI
Food and non-alcoholic beverages
Housing, water, electricity, gas, and other fuels
Transportation
Credit growth by retail
banks has been
relatively subdued in
recent months

BAHRAIN ECONOMIC QUARTERLY| SEPTEMBER 2017
Page 29 of 39 Please refer to the disclaimer at the end of the document.
YoY growth in credit issued by retail banks, BHD mn
Source: Central Bank of Bahrain
In spite of a generally tighter liquidity situation across the region, the deposit base of Bahraini
retail banks has continued to grow. The total value of deposits in August stood at BHS16.9bn. This
was up just 3% in YoY terms.
Deposit liabilities to non-banks, BHD mn
Source: Central Bank of Bahrain
In spite of gradual policy tightening led by the US Federal Reserve, the cost of capital in Bahrain
has remained more or less flat. The average interest rate charged by conventional retail banks for
-2.00%
0.00%
2.00%
4.00%
6.00%
8.00%
10.00%
12.00%
-300
-200
-100
0
100
200
300
400
500
600
700
Jan Mar May Jul Sep Nov Jan Mar May Jul Sep Nov Jan Mar May Jul
2015 2016 2017
Private sector Government Total credit growth, RHS
0
2000
4000
6000
8000
10000
12000
14000
16000
18000
Jan Mar May Jul Sep Nov Jan Mar May Jul Sep Nov Jan Mar May Jul
2015 2016 2017
Government Private sector Foreign

BAHRAIN ECONOMIC QUARTERLY| SEPTEMBER 2017
Page 30 of 39 Please refer to the disclaimer at the end of the document.
business loans was just under 6% in August. It averaged 5.3% during the first eight months of the
year. Whereas business loans have manifested a degree on month-to-month volatility, the cost of
personal loans has been virtually flat. It reached 4.9% in August, which in fact also equalled the
average during the year to date.
Average rate of interest on credit facilities (conventional retail banks)
Source: Central Bank of Bahrain
Medical policies drive insurance sector growth
Growth in medical policies drove the expansion of the Bahraini insurance sector in 2016. The value
of contributions jumped from BHD52.2mn to BHD62.1mn, a figure that now accounts for just
under 23% of the premiums written in the Kingdom.
Motor insurance remains the largest category, however, and posted 4% growth in 2016. With total
written premiums of BHD78.9mn, it accounted for 29% of the entire market.
Long-term life and savings-type insurance products generated premiums of BHD51.6mn in 2016.
Their share of the total market was 19%.
Overall gross premiums in 2016 were in line with the 2015 total and reached BHD272.81mn.
Bahrain currently has 25 locally incorporated insurance companies and 11 branches of foreign
companies. 14 of the local companies are conventional insurers and six are takaful firms. In
addition, there are two conventional reinsurers, two retakaful companies, and one captive insurer.
The overseas branches are composed of eight conventional insurers and three reinsurance
companies. The gross premiums of Bahrain-based reinsurance and retakaful firms reached
BHD378.97mn in 2016.
2.50%
3.00%
3.50%
4.00%
4.50%
5.00%
5.50%
6.00%
6.50%
Jan Mar May Jul Sep Nov Jan Mar May Jul Sep Nov Jan Mar May Jul
2015 2016 2017
Business Loans (Excluding overdraft approvals) Personal Loans
The cost of credit has
remained largely flat
in spite of the US rate
increases

BAHRAIN ECONOMIC QUARTERLY| SEPTEMBER 2017
Page 31 of 39 Please refer to the disclaimer at the end of the document.
Capital markets stall
Echoing regional trends, Bahraini Bourse was virtually flat during Q3. In spite of a 2% drop during
Q3, the Bahrain All Share Index remained up 5.6% YTD and 11.6% YoY.
The Bahrain Islamic Index declined by nearly 4.4% during Q3 but was up 24.3% in YTD terms and a
remarkable 34.2% YoY.
The capitalization of the Bourse reached BHD20.8bn at the end of Q3. This was marginally up on
BHD20.63bn at the end of Q2. It marked a 14.7% YoY increase. The total value of shares traded in
Q3 was BHD49.17mn, down on BHD77.89mn in Q2.
Bahrain All Share Index and Bahrain Islamic Index
Source: Bahrain Bourse
The performance of individual sectors was highly variable. The sharpest improvement continued
to be seen in the industrial sector, which was up a remarkable 53.3% in YoY terms. This marked an
impressive turnaround from a 19.7% correction during 2016 as a whole. Commercial banks were
the second the strongest sector with a 10% YoY advance. The insurance sub-sector posted a 4.9%
gain. The other three indices were negative: investment -5.2%, hotels & tourism -9.8%, and
services -11.2%.
600
700
800
900
1000
1100
1200
1300
1400
1500
1600
Jan Mar May Jul Sep Nov Jan Mar May Jul Sep Nov Jan Mar May Jul Sep
2015 2016 2017
Bahrain Bourse closed
the first half of 2017
with a 7.3% net gain

BAHRAIN ECONOMIC QUARTERLY| SEPTEMBER 2017
Page 32 of 39 Please refer to the disclaimer at the end of the document.
Sectoral stock market indices, 2016-3Q2017
Source: Bahrain Bourse
In the fixed income space, the CBB in mid-July placed a BHD200mn five-year Government
Development Bond with a coupon of 5.35%. Subscriptions totalled BHD224mn. This was followed
by a BHD125mn ijarah sukuk with a tenor of three years and a rate 4.2%. The offering was 152%
oversubscribed.
In September, Bahrain tapped the international markets with a three-tranche USD3bn placement.
This was composed of a USD850mn, 7.5-year sukuk tranche and two tranches of conventional
bonds: USD1.25bn with a 12-year tenor and USD900mn with a 30 tenor. In something of a recent
regional record, the combined offering was five times oversubscribed with offers of more than
USD15bn. The three tranches were prices at 5.25%, 6.75%, and 7.5%, respectively, tighter than
initially expected. The issue was arranged by BNP Paribas, Citigroup, Gulf International Bank, JP
Morgan, and National Bank of Bahrain.
Interest rates for short-term Treasury Bills have edged up slightly during the quarter. The total
value of outstanding bills in early October stood at BHD1.985bn.
Nogaholding has reportedly hired banks to prepare for the issuance of a 10-year bond.
-30% -20% -10% 0% 10% 20% 30% 40% 50% 60%
Commercial Banks
Investment
Insurance
Services
Industrial
Hotels & Tourism
1-3Q2017 2016
Al Baraka Banking
Group placed a
successful USD400mn
perpetual sukuk in May

BAHRAIN ECONOMIC QUARTERLY| SEPTEMBER 2017
Page 33 of 39 Please refer to the disclaimer at the end of the document.
Issue date Issue Value,
BHD mn
Maturity,
days
Average
interest/
profit rate, %
Average
price, %
Over-
subscript
ion, %
2 Jul 2017 Treasury bill No. 1658 35 182 2.45 98.776 128
5 Jul 2017 Treasury bill No. 1659 70 91 2.33 99.414 100
12 Jul 2017 Treasury bill No. 1660 70 91 2.30 99.421 100
13 Jul 2017 Sukuk al ijarah No. 143 26 182 2.45 100
26 Jul 2017 Treasury bill No. 1661 70 91 2.30 99.422 160
27 Jul 2017 12-month Treasury bill
No. 35 100 365 3.13 96.931 124
2 Aug 2017 Treasury bill No. 1662 70 91 2.31 99.419 122
6 Aug 2017 Treasury bill No. 1663 35 182 2.52 98.740 120
9 Aug 2017 Treasury bill No. 1664 70 91 2.36 99.408 105
10 Aug 2017 Sukuk al ijarah No. 144 26 182 2.52 100
16 Aug 2017 Treasury bill No. 1665 70 91 2.54 99.363 128
23 Aug 2017 Sukuk al salam No. 196 43 91 2.36 100
30 Aug 2017 Treasury bill No. 1666 70 91 2.45 99.385 120
31 Aug 2017 12-month Treasury bill
No. 36 100 365 3.22 96.844 128
3 Sep 2017 Treasury bill No. 1667 35 182 2.75 98.630 111
6 Sep 2017 Treasury bill No. 1668 70 91 2.46 99.383 109
13 Sep 2017 Treasury bill No. 1669 70 91 2.49 99.375 100
14 Sep 2017 Sukuk al ijarah No. 145 26 182 2.75 100
20 Sep 2017 Sukuk al salam No. 197 43 91 2.45 100
27 Sep 2017 Treasury bill No. 1670 70 91 2.57 99.355 143
28 Sep 2017 12-month Treasury bill
No. 37 100 365 3.29 96.781 100
1 Oct 2017 Treasury bill No. 1671 35 182 3.01 98.502 120
4 Oct 2017 Treasury bill No. 1672 70 91 2.61 99.344 111
Source: Central Bank of Bahrain
Continued labour market growth
The aggregate number of people employed in Bahrain attained 763,618 by the end of June,
according to a report by the Ministry of Labour and Social Development. This marked a 1.2%
increase over a year earlier.
The number of Bahraini nationals working in the private and public sectors taken together reached
157,261 in a 0.3% YoY increase. By contrast, the number of expatriates employed in the Kingdom
increased by 4.7%.
Private sector job
creation has remained
robust with a 8.6% YoY
increase in the number
of new jobs in Q4

BAHRAIN ECONOMIC QUARTERLY| SEPTEMBER 2017
Page 34 of 39 Please refer to the disclaimer at the end of the document.
External assessments
Index/report Description Global
rank
MENA
rank
Key strengths
highlighted
Expat Insider
Survey by
InterNations
Compiled by a 2.8mn-strong
global expatriate network
present is 390 cities, the index
ranks locations based on
quality of life indicators, the
ease of settling in, as well as
metrics of working abroad,
family life, and personal
finance.
1 1
Bahrain leapt from 19th
to 1st place in recognition
of:
The ease of settling in
(76% feel welcome)
Career satisfaction
(73% satisfied with
their jobs)
Global Human
Capital Index by
World Economic
Forum
Measures four key areas of
human capital development:
Capacity (existing
stock of education)
Development
(current education and
upskilling efforts)
Deployment
(application and skills
acquisition through work)
Know-how (breadth
and depth of specialized skills
at work)
47 (out of
130) 2
Bahrain has regionally
high education levels but
lower investment in
further development
than the rest of the
region. Employment
levels are higher than in
neighbouring countries
but weaker in lower
skilled positions.
Global
Competitiveness
Index by World
Economic Forum
Measures national
competitiveness based on
three sub-indices:
Basic requirements
(institutions, infrastructure,
macroeconomics, health and
primary education)
Efficiency enhancers
(higher education and training,
goods and labour market
efficiency, financial market
development, technological
readiness, market size)
Innovation and
sophistication (business
sophistication, innovation)
44 (out of
137) 3
Recognizes Bahrain as an
“innovation-driven
economy.” Key positives
include:
Strong institutions
Sound infrastructure
Higher education and
training
Efficient labour
market regulations
Technological
readiness

BAHRAIN ECONOMIC QUARTERLY| SEPTEMBER 2017
Page 35 of 39 Please refer to the disclaimer at the end of the document.
K E Y S E C T O R S
TAPPING INTO CROWDS
Introducing crowdfunding
The Central Bank of Bahrain in August unveiled pioneering crowdfunding regulations for
conventional and Shariah-compliant financial institutions. This build on an earlier initiative to
create a regulatory sandbox for Fintech firms which attracted its first two entrants in August. These
were a London-based provider of foreign exchange cash management solutions for business and
a Dubai-based account and remittance service for GCC-based low income workers.
Following the latest innovation, it will be possible for local small and medium-sized businesses to
raise funding outside of the established channels. The maximum paid up capital for such
companies is BHD250,000. The regulations provide exclusively for person to business lending.
Financing can be provided to companies outside of Bahrain provided the platforms highlight the
relevant risks. Lenders are responsible for evaluating the credit worthiness of their borrowers.
Platforms have to be fully transparent about their fees, charges, and commissions.
The CBB will license crowdfunding companies under its Rulebook Vol. 5: Financing Based
Crowdfunding Platform Operation. The regulations are identical except in terms of mandating
Shariah approval for relevant entities. This can be done by engaging an advisor or outsourcing the
function. The minimum capital requirement for platforms is BHD50,000. Only accredited expert
investors are allowed to provide funding through the platforms. They can only lend up to 10% of
their net assets to a single recipient.
A borrower can raise a maximum of BHD100,000 in crowdfunding in a given calendar year. The
tenor of such financing should not exceed five years. If an attempt to raise funding through a
platform fails to meet at least 80% of the offer, the deal is cancelled, and all monies received have
to be refunded within seven calendar days. Crowdfunding platforms are required to comply with
the CBB’s anti-money laundering and combating financing of terrorism regulations.
In a further major step to supporting the growth of Islamic finance, the CBB in September released
a new Shariah Governance module. Following consultations with the industry as well as the CBB’s
centralized Shariah Supervisory Board, the module is likely to set a new benchmark for Shariah
governance. The new regulations will apply as of 30 June 2018. Among other things, the CBB has
now made an independent external Shariah compliance audit mandatory. Regular annual
reporting of the audit results will commence in 2020 in a major step toward higher transparency
standards. The module further delineates the authority of the Shariah Supervisory Board and
enhances its independence. It defines eligibility criteria, roles, and responsibility for the members.
It requires board rulings, along with their justifications, to be made public. Shariah
coordination/implementation and internal Shariah audit are required to report independent to
the board.
The introduction of
crowdfunding regulations
marks another important
milestone in Bahrain’s
journey to becoming a
Fintech hub

BAHRAIN ECONOMIC QUARTERLY| SEPTEMBER 2017
Page 36 of 39 Please refer to the disclaimer at the end of the document.
Driving the ICT agenda
In September, Bahrain held its first Technology Week. Sponsored by the Economic Development
Board, the event was designed to showcase ways in which disruptive technological change is
reshaping the global and regional economy. Focus areas included Fintech, artificial intelligence,
cybersecurity, and cloud computing. The Technology Week coincided with the Amazon Web
Services (AWS) summit on cloud computing and the first region Innovation Forum of MIT
Enterprise Pan-Arab hosted by the EDB and Investcorp. The forum was designed to foster
innovation, entrepreneurship, and technology adoption. It covered a wide range of emerging
technology trends, such as cloud computing, autonomous driving, cybersecurity, artificial
intelligence, and blockchain. In connection with the Technology Week, Tamkeen hosted the
StartUp Bahrain competition with USD75,000 of prices.
During the AWS Summit, the company announced that it intends to open a new infrastructure
region in the Middle East, headquartered in Bahrain, in early 2019. The company currently
provides 44 such zones across 16 infrastructure regions. A further five AWS Regions and 44
Availability Zones are expected to become operational by the end of 2018. Globally, AWS provides
cloud storage services to more than a million customers in 190 countries. Cloud services hold
particular appeal because of the low initial costs, which makes them attractive to SMEs. They are
also flexible and scalable as end-users buy a service rather than expensive infrastructure.
The presence of a dedicated AWS Region in the Middle East will give business faster access to data
though lower latency as well as lower costs. Cloud services hold particular appeal because of the
low initial costs, which makes them attractive to SMEs. They are also flexible and scalable as end-
users buy a service rather than expensive infrastructure.
Cloud services hold particular appeal because of the low initial costs, which makes them attractive
to SMEs. They are also flexible and scalable as end-users buy a service rather than expensive
infrastructure. The Government of Bahrain has pioneered in the adoption of cloud with, for
instance, the Information & eGovernment Authority observing a ‘cloud first’ policy.
Bahrain is seeking to further partner with the AWS Educate program to develop local cloud
computing skills. Courses will be offered at the University of Bahrain as well as Bahrain Polytechnic.
Local incubators and accelerators are working with the AWS Activate program to help with their
own globalization.
Introducing Industry 4.0
Bahrain has in recent months taken pioneering steps toward the adoption of Industry 4.0 as an
important engine of productivity and innovation. Industry 4.0 refers to the use of automation and
digitized data exchange in manufacturing. It relies on cyber-physical systems, the Internet of
Things, cloud computing, and cognitive computing to create a ‘smart factory’ where cyber-based
systems monitor physical processes and create a digital replica of them. This allows for
decentralized decisions but also for full integration and optimization as different process can
communicate with each other in real time. This approach permits the optimization of production
processes but also the efficient integration of broader value chains. The increased visibility across
Q3 saw the first-ever
Bahrain Technology Week
and the announcement by
Amazon Web Services of
its new Middle East
Region

BAHRAIN ECONOMIC QUARTERLY| SEPTEMBER 2017
Page 37 of 39 Please refer to the disclaimer at the end of the document.
processes and supply chains can boost awareness and lead to more efficient decision. Machine-
generated data can also enhance the analytical capabilities of an organization and drive better
decisions.
As the Gulf economies transition to a more productivity-driven model of development, Industry
4.0 holds considerable promise as a way to create more efficient companies and processes. In
recognition of this, Bahrain has launched a number of interconnected initiatives to drive the
adoption of Industry 4.0 in the country.
BFG International, a Bahrain-based producer of composites technologies has partnered with the
EDB and Tamkeen to launch a first-in-kind Industry 4.0 project at its Mina Salman facility and
eventually across the group. BFG International’s factories will be automated and all its business
areas integrated through a software solution supplied by QiO Technologies. This will establish full
transparency across the entire value chain and allow for the production process to be optimized.
The four-year project will by supported by Tamkeen. As part of the project, BFG will train local to
acquire relevant skills and become capable of producing new solutions for the local market.
Bahrain attracted more than USD200mn of investment into its manufacturing and logistics sector
in the first half of the year. The investments are expected to engender a total of 1,000 jobs over
the coming three-year period. The new investments include a major expansion by Mondelez
International which is building a biscuit factory in the Kingdom with an initial employment impact
of 200 jobs. This builds on Mondelez’ existing presence in the country which has produced its brand
products for 47 markets since 2008.
Strong momentum in tourism investment
Bahrain is currently at various stages of implementing tourism projects worth approximately
USD10bn. Major developments include the following:
The Avenues shopping mall with a value of USD145mn, due to launch in October
A number of new hotel projects including:
o The One & Only Resort in Seef
o The Wyndham Grand in Bahrain Bay
o The dusitD2 boutique hotel of Dusit International
o The Wyndham Garden in Juffair which, with 450 keys, will be the largest hotel in
the Kingdom. It is being developed by Mannai Holding
The Marassi Galleria mall, which offers 180,000 sq m of retail space. The facility is part of
a largest Marassi al Bahrain development managed by Abu Dhabi-based Eagle Hills
The Mall of Dilmunia will have a build-up area of 125,000 sq m and a gross leasable area
of 47,300 sq m. The total investment is estimated at USD137mn
Industry 4.0 is emerging
as an important new
driver of efficiency and
innovation with the first
pioneering initiatives
underway in Bahrain

BAHRAIN ECONOMIC QUARTERLY| SEPTEMBER 2017
Page 38 of 39 Please refer to the disclaimer at the end of the document.
Important additions to leisure facilities around the island include a new adventure park at Bahrain
International Circuit and a range of water-based activities in Bahrain Bay provided by the Bahrain
Rowing Club and Beach Culture. The companies involved are Bahrain-based start-ups hoping to
deliver new tourism experiences.
Improved accessibility is an important aspect of ongoing tourism sector developments. The
Bahrain Airport Company is overseeing the investment of approximately USD1.1bn in the
modernization of the Bahrain International Airport, including a new terminal. The construction is
now 40% complete with the launch scheduled for 3Q19. The new facility will be four times the size
of the existing airport and opportunities in retail and restaurants, along with other facilities, will
be offered to investors soon. The national carrier Gulf Air is purchasing a total of five Boeing 787-
9 Dreamliners which are expected to be delivered in 2018.
Bahrain has recently seen the launch of two inbound tour operators that are offering packages
targeting travellers from key source markets outside the GCC. Visit Bahrain and @Bahrain offer
scheduled tours, well-trained staff, and innovative service solutions.
The Bahrain Tourism and Exhibition Authority plays a key role in driving the further development
of the sector by standardizing classifications, developing regulations, opening new markets
through their seven international marketing offices, and creating a diverse calendar of events. The
Bahrain Authority for Culture and Antiquities has established Bahrain as a centre for culture, art,
and history. They are instrumental in providing an array of activities and events that highlight
global, regional, and national art and culture.
The tourism sector infrastructure development is taking place against the backdrop of a continued
strong increase in tourist numbers. According to the Bahrain Tourism & Exhibitions Authority, the
aggregate total number of tourists visiting Bahrain during the first three quarters of 2017 was
8.7mn – up 12.8% on 1-3Q16. The total number of tourist visitors across the King Fahad Causeway
rose by 13% YoY during the first half of 2017 to a reach a total of 4.9mn. The annual rate of increase
in tourists arriving through the airport was 23% to 616,230. Cruise ship arrivals numbers 43,191, a
44% YoY increase. The average stay of these tourists during 1H17 was 2.3 days, although 63% of
them were day visitors. The average expenditure per day reached BHD77 with the total tourist
expenditure estimated at BHD631.4mn. 87% of all tourists in January-September came from Saudi
Arabia and 9.8% from the rest of the Gulf region.
An unprecedented
investment pipeline is
reshaping the tourism
sector in Bahrain

BAHRAIN ECONOMIC QUARTERLY| SEPTEMBER 2017
Page 39 of 39 Please refer to the disclaimer at the end of the document.
DISCLAIMER
Copyright © 2017 by the Bahrain Economic Development Board.
All rights reserved. No part of this publication may be reproduced, stored in a retrieval system, or
transmitted, in any form or by any means, electronic, mechanical, photocopying, or otherwise
without the prior permission of the Bahrain Economic Development Board.
CONTACT
Bahrain Economic Development Board
3rd floor
ARCAPITA Building
Bahrain Bay
P.O. Box 11299
Manama
Bahrain
T: +973 17589962
Email: [email protected]