bacteria (escherichia coli) dna fingerprinting in the ... · dna fingerprinting of escherichia coli...
TRANSCRIPT

Clean Water Services DNA Fingerprinting of Bacteria Sources in the
Tualatin Sub-basin SUMMARY This study was divided into two parts. The first part had two goals. One goal was to determine the sources of bacteria in the stormwater and receiving streams to help focus Clean Water Services management efforts to reduce the bacteria levels. This will allow the Best Management Practices (BMPs) to be targeted at the primary sources of bacteria and will lead to the most cost-effective implementation plan. The other goal was to provide information that would encourage the public to change behaviors that were resulting in high levels of bacteria. Many of the BMPs to reduce bacteria in receiving streams rely on changing the public’s perception of the source of the problem and engaging them to solve the problem. Effectively communicating this information to the public will make it more likely that they will change their behaviors to reduce bacteria loads on Tualatin River Basin streams. The second part of this study was to determine if bacteria from human sources were present at a stormwater outfall at one of the Clean Water Services wastewater treatment plants. Both parts were done at the same time. Clean Water Services received a 319h grant for $41,723 from DEQ during the 2002 granting cycle. The grant money, plus $40,000 from Clean Water Services, paid for the DNA fingerprinting of Escherichia coli (E. coli) bacteria isolates. In addition Clean Water Services covered the sampling and laboratory cost of collecting the E. coli bacteria samples that were sent to the DNA laboratory. The DNA fingerprinting was done by Dr. Mansour Samadpour at the Institute for Environmental Health (IEH) in Seattle, Washington using the ribosomal RNA typing method. This is one of several methods currently being used for microbial source tracking (MST). The theory behind this test is that DNA patterns can be used to match E. coli bacteria found in the environment with the sources of the bacteria. The Tualatin River and its tributaries have bacteria levels that are periodically above the numeric criteria established to support the water contact recreation beneficial use. The tributaries in the Tualatin Basin have higher bacteria levels than the main stem of the Tualatin River. The criteria are based on non-pathogenic E. coli bacteria, which serve as an indicator of the possible presence of pathogens. In 2001 the Oregon Department of Environmental Quality (DEQ) developed a Total Maximum Daily Load (TMDL) for bacteria in the Tualatin Basin. Clean Water Services (formerly Unified Sewerage Agency) received a Wasteload Allocation (WLA) for discharges from municipal separate storm sewer systems (MS4) for E. coli bacteria. The TMDLs establish different summer and winter stormwater WLAs for each subbasin. To meet the WLAs, Clean Water Services must develop Best Management Practices (BMPs) to control bacteria in stormwater. While the TMDL document lists likely sources of bacteria, it is not clear whether the identified sources are relevant to the Tualatin River Basin; furthermore, Bacteria DNA Fingerprinting - Final Page 1 of 33 2005

information regarding the relative contributions of the individual sources, which would enable Clean Water Services to focus its management activities, was not available. The first part of the study focused on sites that had characteristics that existed throughout the basin. Sites were selected to represent these characteristics. These were called general sites. There were both stream sites and stormwater sites in this part. General sites were selected based on a history of high bacteria levels and a probable source of bacteria. It is important that BMPs be applied to all areas that share characteristics of the sites in the study and not just the areas upstream of the sites in the study. Samples were collected from the following general sites:
• Stream site in an area with a high percentage of septic systems • Stream site in an area that has dog waste next to the stream • Stream site in an older urban area with a mix of septic and sewered systems • Stream site downstream of a lake where the public often feeds the ducks and
geese • Stream site in an area that has both older homes on septic and very new homes on
the sewer system. • Stormwater site that served a commercial site • Stormwater site that served a new residential site • Water quality facility effluent.
The second part of the study consisted of one site that represented a specific problem. This was called the specific site. It was a stormwater outfall at the Durham Wastewater Treatment Plant with periodically high bacteria counts and no obvious source of bacteria other than the geese that frequent the site. Samples were collected from April 2004 to April 2005 during dry weather and during wet weather in both the summer and winter. Sites were visited between 6 and 7 times. There was an average of 116 isolates of E. coli bacteria evaluated for each site. The results from part 1, the general sites, and part 2, the specific site, were evaluated separately. A summary of the results from part 1 is shown in the following pie chart that shows the relative contribution of each source of bacteria when the results from the 924 isolates from the general sites were aggregated:
Bacteria DNA Fingerprinting - Final Page 2 of 33 2005

All General Site Results CombinedPercentage of E. coli Bacteria Sources
Avian51%
Rodent16%
Canine13%
Human4%
Wildlife6%
Feline1%
Unknown9%
This pie chart shows that 51% of the 924 E. coli bacteria isolates came from avian sources. Rodents, canines, humans, wildlife and felines made up 40% of the isolates. Isolates of unknown origin made up 9% of the isolates. This pattern of sources (avian highest, followed by rodents and canines, and then humans) was consistent across the general sites whether aggregated together, aggregated by stream or stormwater, or aggregated by weather condition. The following table shows the results from two other studies conducted in this geographic area that had similar aggregated results: Clean Water Services
Lower Boise River
Idaho City of Puyallup
Washington Avian 51 % 24 % 40 % Rodent 16 % 4 % 28 % Canine 13 % 14 % 11 % Human 4 % 12 % 5 % Wildlife 6 % 3 % 5 % Agricultural 8 % 1 % Feline 1 % 4 % 1 % Unknown 9 % 31 % 9 % Count of isolates 924 1565 687 The City of Puyallup and Clean Water Services had very similar results. The Boise River study was slightly different, which may be due to the fact that it had such a high percentage of unknown isolates. Bacteria DNA Fingerprinting - Final Page 3 of 33 2005

This information can be used to focus the development of BMPs to reduce bacteria contributions from human activities that are detrimental to the receiving streams. It can also be used to show that anthropogenic activities have a negative impact on the bacteria levels of the receiving streams. Effectively communicating this information to the public is the best way to encourage behavioral changes that will reduce bacteria loading to streams in the Tualatin River basin. The following pie chart shows the results for the second part of the project. It is the stormwater outfall from the Durham wastewater treatment plant.
Wastewater Treatment Plant Stormwater
Rodent7%
Human37%
Unknown4%Wildlife
2%
Avian50%
The results from this site are very different from the general sites. There is a much higher percentage of bacteria from human sources (37%) and fewer types of isolates. There were only about half as many rodents and no canine isolates at this site. Now that isolates from human sources have been found at this site, options for reducing or eliminating this source are being evaluated by the treatment plant staff. WATERSHED SETTING The Tualatin River drains an area of 712 square miles and is situated in the northwest corner of Oregon. It corresponds to the fourth field hydrologic unit code (HUC) 17090010 and is a sub-basin of the Willamette River Basin. The headwaters are in the Coast Range and the River flows in a generally easterly direction to its confluence with the Willamette River, upstream of the Willamette Falls. The sub-basin lies almost entirely within Washington County, although there are also small portions in Multnomah, Clackamas, Columbia, Tillamook, and Yamhill counties. The Tualatin River is
Bacteria DNA Fingerprinting - Final Page 4 of 33 2005

approximately 83 miles long. Major tributaries include: Scoggins, Gales, Dairy (including East Fork, West Fork, and McKay), Rock (including Beaverton), and Fanno creeks. The subbasin supports a wide range of forest, agriculture and urban-related activities. The rapidly growing urban portion covers an area of 122 square miles and currently has a population of 480,000. It includes the cities of Banks, Beaverton, Cornelius, Durham, Forest Grove, Gaston, Hillsboro, King City, North Plains, Sherwood, Tigard, Tualatin, a relatively large unincorporated area, and small portions of Portland and West Linn. The Tualatin River is receiving increasing use for water contact recreation (e.g. canoeing, fishing, and swimming) as the population increases. Access to the river through parks and boat ramps has also increased. WATER QUALITY STANDARD The bacteria standard is designed to protect water contact recreation as a beneficial use in the Tualatin Basin. The bacteria criterion for water contact recreation is as follows:
A 30-day log mean of 126 E. coli bacteria per 100 mL, based on a minimum of five (5) samples No single sample shall exceed 406 E. coli bacteria per 100 mL
Water Quality Limited Determination:
More than 10% of the samples (with a minimum of 2 exceedences) exceed 406 E. coli bacteria per 100 mL
Bacteria DNA Fingerprinting - Final Page 5 of 33 2005

The following table shows the streams listed on the DEQ 1998 303(d) list, which is the basis for the 2001 TMDL.
Tualatin River Subbasin Bacteria Impaired Stream SegmentsSegment1 Tributary To: Listing Criterion2 Season of Violation Ash Ck. Fanno Ck. Fecal Coliform All Year Beaverton Ck. Rock Ck. E. coli All Year Bronson Ck. Beaverton/Rock E. coli All Year Burris Ck. Tualatin R. Fecal Coliform All Year Butternut Ck. Tualatin R. Fecal Coliform All Year Carpenter Ck. Tualatin R. E. coli Summer Cedar Ck. Chicken Ck. Fecal Coliform All Year Cedar Mill Ck. Beaverton/Rock Fecal Coliform All Year Chicken Ck. Tualatin R. E. coli All Year Christenson Ck. Tualatin R. Fecal Coliform All Year Dairy Ck. (Mouth to E/W Forks) McKay Ck. E. coli All Year Dairy Ck., West Fork M/S Dairy Ck. E. coli Summer Fanno Ck. Tualatin R. E. coli All Year Gales Ck. (Mouth to Clear Ck.) Tualatin R. E. coli Summer Hall Ck. Beaverton Ck. Fecal Coliform All Year Heaton Ck. McFee Ck. Fecal Coliform All Year Hedges Ck. Tualatin R. E. coli All Year Johnson Ck.-North Cedar Mill Ck. Fecal Coliform All Year Johnson Ck.-South Beaverton Ck. E. coli All Year McFee Ck. Tualatin R. Fecal Coliform All Year McKay Ck. (Mouth to E. Fork) Tualatin R. E. coli All Year Nyberg Ck. Tualatin R. Enterococci All Year Rock Ck. Tualatin R. E. coli All Year Summer Ck. Fanno Ck. Fecal Coliform All Year Tualatin R. (Mouth to Dairy Ck.) Willamette E. coli All Year Willow Ck. Beaverton Ck. Fecal Coliform All Year
DEQ Tualatin Subbasin TMDL, August 2001, Section 4.2.3, Table 15
1 Mouth to headwaters (unless otherwise noted) 2 The “listing criterion” is the bacteria criterion from Table 13 (above) for which the water body had exceedances. (E.g., since “Fecal Coliform” is listed as the “listing criterion” for Summer Creek, exceedances of the fecal coliform criterion are what warranted the creek’s placement on the 303(d) list.) Bacteria DNA Fingerprinting - Final Page 6 of 33 2005

The following table shows the DEQ Tualatin Sub-basin TMDL, August 2001 wasteload allocations (Section 4.2.10.3, Table 17 and 18).
Summer (May 1 – October 31) Wasteload Allocations For Discharges from Municipal Separate Storm Sewer Systems and CAFO Sources (Concentrations)
Designated Management Agency 5th-Field Subbasin
Wasteload Allocation – E. coli counts/100 mL
All Land Uses3/Sources
Covered By MS4 Permits Except as Otherwise
Noted
During Runoff Events4
(Measured as an event mean
concentration)
All other times (Measured as a grab sample)
Gales 9500 406 Rock 3000 406 Dairy 7000 406
Scoggins/Upper Tualatin 9500 406
Middle Tualatin 12000 406
City of Lake Oswego, City of Portland, City of West Linn, Clackamas Co., Oregon Dept. of Transportation, Multnomah Co., Unified
Sewerage Agency, and Washington Co.
Lower Tualatin 12000 406
Oregon Dept. of Agriculture All CAFO Direct Discharges 0 0
Winter (Nov. 1 – April 31) Wasteload Allocations For Discharges from Municipal Separate
Storm Sewer Systems and CAFO Sources (Concentrations)
Designated Management Agency 5th-Field Subbasin
Wasteload Allocation – E. coli counts/100 mL
All Land Uses/Sources
Covered By MS4 Permits Except as Otherwise
Noted
During Runoff Events5
(Measured as an event mean
concentration)
All other times (Measured as a grab sample)
Gales 3500 406 Rock 700 406 Dairy 3500 406
Scoggins/Upper Tualatin 1500 406
Middle Tualatin 11000 406 Lower Tualatin 5000 406
City of Lake Oswego, City of Portland, City of West Linn, Clackamas Co., Oregon Dept. of Transportation, Multnomah Co., Unified
Sewerage Agency, and Washington Co.
All Septic Systems 0 0
Oregon Dept. of Agriculture All CAFO Direct Discharges 0 0
3 The land uses utilized in the DEQ bacteria model included forestry, meadow, open space, commercial, agricultural, industrial, residential and transportation. 16, 17 Runoff Event is defined as the period when precipitation causes overland runoff to occur from the area of concern.
Bacteria DNA Fingerprinting - Final Page 7 of 33 2005

REGULATORY FRAMEWORK Clean Water Services holds a Watershed-Based NPDES permit that covers the treated effluent produced by its four wastewater treatment plants (Rock Creek & Durham year-round and Forest Grove & Hillsboro winter-only), stormwater discharges from the Rock Creek and Durham wastewater treatment plants, and stormwater from the urban portion of Washington County (MS4 stormwater). It was originally issued on February 26, 2004 and reissued on July 27, 2005 after being reconsidered by DEQ. The wastewater treatment plant effluents have numeric limits for E. coli bacteria that are consistent with the bacteria criterion. The treatment plant stormwater has a benchmark of 406 E. coli bacteria per 100 mL. For the MS4 stormwater, Clean Water Services must evaluate bacteria levels relative to the WLA and set benchmarks in its Stormwater Management Plan (SWMP). A revised SWMP must be submitted to the DEQ on May 1, 2006. GOALS OF THE DNA TESTING STUDY The 2001 Tualatin Subbasin TMDL lists the tributaries and main stem of the Tualatin River as water quality limited for bacteria in both the summer (low flow period) and winter (high flow period). The tributaries are more severely impacted by bacteria than is the main stem. The summer period is more significantly impacted than the winter period. The following tables show a history of the summer and winter levels for the routinely monitored sites using the 90th percentile as the statistic. This is the statistic that is used to designate water quality listed streams on the DEQ’s 303(d) list. It starts in 1995 which was the last year used to develop the 2001 Tualatin TMDL. The bold sites are part of this DNA study.
Bacteria DNA Fingerprinting - Final Page 8 of 33 2005

Summer E. coli Bacteria Levels (in E. coli per 100 mL)
90th Percentile
Location River Mile LOCCOD 1995 2000 2001 2002 2003 2004
ASH @ HEMLOCK 1.4 3845014 2840 4580 1450 BANSTR @ 124TH 1.0 3859010 367 8 143 536 300
BRNSN @ 143RD 5.0 3824050 2460 836 320 556 547 464
BRNSN @ 185TH 1.8 3824018 290 760 32 1030 368 1000
BRNSN @ 205TH 0.1 3824001 148 4580 980 1030 897 560
BRNSN @ BRNSN PK 2.0 3824020 304 974 130 704 784 500
BRNSN @ SALTZMAN 7.2 3824072 838 1400 68 3790 1429 1300
BRNSN @ WALKER 1.5 3824015 180 248 120 3240 248 300
BRNSN @ WU 3.2 3824032 1072 816 36 4240 515 1000
BVTN @ 170TH 5.0 3821050 834 280 1840 770 300
BVTN @ BEAMAN 0.8 3821008 2620 964 730
BVTN @ CNLUS PASS 1.2 3821012 1016 480 980 976
CHICKEN @ SCH-SHER 2.0 3835020 732 1028 550 381 986 576
DAIRY @ HWY 8 2.1 3815021 312 860 848 978 879 476
DWSN @ AIRPORT 1.7 3850017 1950 1300 960 960
DWSN @ BROOKWOOD 0.6 3850006 1280 120 2080 3870 1400 Un-named Tributary to FANNO @ WALNUT 0.1 3500035 2160 FANNO @ DURHAM 1.2 3840012 1460 1180 2960 821 1001 848
FANNO @ TCKRWD 7.4 3840074 1760 1160 3740 2140 2030 1900
FANNO NR ALN 9.5 3840095 3080 1080 2420 3300 5590 2000 GALES @ NEW HWY 47 1.5 3810015 254 188 526 326 300 476
JHNSN S @ DAVIS 1.4 3827014 990 1510 260 1620 2040 720
JHNSN S @ GLENBRK 1.1 3827011 4060 1200 380 1490 620
MCKAY @ HORN 2.0 3816020 860 282 472 580 1100 336
RC@BROOK 2.2 3820022 688 1220
ROCK @ HWY 8 1.2 3820012 364 316 1610 1000
ROCK @ QUATAMA 4.7 3820047 904 656 2360 1000 1030 740
SCOGGINS @ 47 1.7 3805017 93 52 421 25 155 72
SCOGGINS @ STIM 4.8 3805048 11 4 1 1 3 4
SUMMER @ 121ST 0.9 3844009 5860 13500 1500 Tualatin River @ BOONES FERRY 8.7 3701087 984 172 607 176 92 136
Tualatin River @ CHER GR 71.5 3701715 72 56 100 33 57 57
Tualatin River @ ELSNER 16.5 3701165 156 49 37 33 56 55
Tualatin River @ FARMNGTN 33.3 3701333 182 264 80 164 368 230
Tualatin River @ GOLF CRS 52.8 3701528 300 156 709 238 260 272
Tualatin River @ HWY 219 45 3701450 748 250 553 343 254 292
Tualatin River @ ROOD 39.1 3701391 1304 156 214 229 51 276
Tualatin River @ SCHOLLS 27.1 3701271 725 120 102 109 95 150
Tualatin River @ SPRINGHILL 61.2 3701612 304 212 790 100 123 164
Tualatin River @ STAFFORD 5.4 3701054 257 212 655 97 158 150
Tualatin River @ WEISS BR 0.2 3701002 214 120 100 116 101 78 The highlighted cells have values over 406 E. coli bacteria per 100 mL
Bold locations are in this DNA study
Bacteria DNA Fingerprinting - Final Page 9 of 33 2005

Winter E. coli Bacteria Levels (in E. coli per 100 mL)
90th Percentile
Location River Mile LOCCOD 1995 2000 2001 2002 2003 2004
ASH @ HEMLOCK 1.4 3845014 576 964 600 BANSTR @ 124TH 1.0 3859010 260 23 80 68 43
BRNSN @ 143RD 5.0 3824050 2187 180 279 1870 281 110
BRNSN @ 185TH 1.8 3824018 716 280 116 555 157 658
BRNSN @ 205TH 0.1 3824001 776 200 88 1240 138 208
BRNSN @ BRNSN PK 2.0 3824020 388 280 125 756 151 101
BRNSN @ SALTZMAN 7.2 3824072 868 420 1640 221 228 502
BRNSN @ WALKER 1.5 3824015 732 400 188 832 224 302
BRNSN @ WU 3.2 3824032 1142 270 159 1036 507 212
BVTN @ 170TH 5.0 3821050 620 237 1231 426 524
BVTN @ BEAMAN 0.8 3821008 228 520 298
BVTN @ CNLUS PASS 1.2 3821012 521 557 148
CHICKEN @ SCH-SHER 2.0 3835020 240 140 142 170 195 246
DAIRY @ HWY 8 2.1 3815021 272 118 328 249 207 142
DWSN @ AIRPORT 1.7 3850017 220 660 513 228
DWSN @ BROOKWOOD 0.6 3850006 270 512 995 202 319 Un-named Tributary to FANNO @ WALNUT 0.1 3500035 464 FANNO @ DURHAM 1.2 3840012 540 590 154 340 850 383
FANNO @ TCKRWD 7.4 3840074 1482 1082 177 468 832 545
FANNO NR ALN 9.5 3840095 1016 800 404 986 1140 504 GALES @ NEW HWY 47 1.5 3810015 213 127 84 107 136 244
JHNSN S @ DAVIS 1.4 3827014 600 310 388 1834 298 312
JHNSN S @ GLENBRK 1.1 3827011 820 420 554 1765 482
MCKAY @ HORN 2.0 3816020 134 421
RC@BROOK 2.2 3820022 117 504
ROCK @ HWY 8 1.2 3820012 2250 180 100 430 344
ROCK @ QUATAMA 4.7 3820047 484 210 105 234 474 858
SCOGGINS @ 47 1.7 3805017 170 53 55 58 50 68
SCOGGINS @ STIM 4.8 3805048 5 2 9 4 2
SUMMER @ 121ST 0.9 3844009 390 1080 845 Tualatin River @ BOONES FERRY 8.7 3701087 280 205 82 271 362 124
Tualatin River @ CHER GR 71.5 3701715 21 15 17 24 20 17
Tualatin River @ ELSNER 16.5 3701165 160 168 87 258 314 124
Tualatin River @ FARMNGTN 33.3 3701333 170 201 61 37 198 68
Tualatin River @ GOLF CRS 52.8 3701528 300 185 216 161 118 124
Tualatin River @ HWY 219 45 3701450 240 100 278 299 173 120
Tualatin River @ ROOD 39.1 3701391 150 88 220 259 275 80
Tualatin River @ SCHOLLS 27.1 3701271 160 134 122 488 222 126
Tualatin River @ SPRINGHILL 61.2 3701612 180 468 268 264 146 155
Tualatin River @ STAFFORD 5.4 3701054 230 61 99 152 392 143
Tualatin River @ WEISS BR 0.2 3701002 260 103 66 314 328 88 The highlighted cells have values over 406 E. coli bacteria per 100 mL
Bold locations are in this DNA study
Bacteria DNA Fingerprinting - Final Page 10 of 33 2005

Clean Water Services has been assigned WLAs for stormwater for both the summer and winter time periods. Clean Water Services is required to develop a stormwater management plan, which includes BMPs to meet the WLAs. To better focus the bacteria reduction efforts, the sources of bacteria need to be identified. This will allow the BMPs to be targeted at the primary sources of bacteria and will lead to the most cost-effective implementation plan. The August 2001 TMDL document lists several potential sources of bacteria.
• Non-runoff sources (maximum impact during summer flow conditions) o Sanitary sewer cross connections and overflows to stormwater sewers o Confined animal feeding operations (CAFOs) o Direct deposition by farm animals o Illegal dumping of waste water o Failing Septic Systems
• Runoff sources (maximum impact during the winter flow conditions)
o All of the above, although they will be diluted with rain water o Pet, farm animals, and wildlife waste o Illegal dumpsites that attract vermin
Many of the BMPs will rely on changing the public’s perception of the source of the problem. By educating the public about the sources of bacteria with understandable scientific data, they will be more likely to adopt and champion the actions necessary to reduce bacteria levels in the Tualatin Sub-basin. Potential BMPs that could be used are as follows:
Connect urban areas with septic systems to the sanitary system (Currently underway in Clean Water Services area of responsibility)
Active pet waste management Signage in all parks that allow pets Facilities for pet waste in parks Require riparian areas between trails and surface water in parks Mailings to pet owners describing problem and how they can help SOLV cleanups to include pet waste collection in parks
Hobby Farms Require barriers between livestock and surface waters Establish minimum land requirements Educate the land owners
Duck and Goose waste Limit ducks and geese depending on water surface area Require riparian areas that do not encourage feeding of ducks and geese Educate the pubic
Illegal Dump Sites Determine responsibility; develop a procedure to discourage illegal dumping; clean up the sites that are found
Bacteria DNA Fingerprinting - Final Page 11 of 33 2005

Clean Water Services will use the information to develop BMPs that target human activities that result in elevated bacteria levels in the receiving streams in its Stormwater Management Plan.
The sites from this study will be monitored for E. coli bacteria levels over the next three (3) to five (5) years to quantify the reduction of bacteria levels that are the result of the BMPs that are implemented. After three (3) to five (5) years Clean Water Services may apply for a second 319h grant to do a follow up study to determine the effectiveness of the BMPs relative to the sources of E. coli bacteria. The adaptive management process will also use this information to make modifications to the BMPs. This will maximize the resources Clean Water Services uses to meet the bacteria TMDL. SAMPLE SITE CHARACTERISTICS Part 1 - General Sites Stream – High Septic System Area
This is on an un-named tributary to Fanno Creek (CWS location ID 3500035) in the Tigard area. It has many septic systems and is slated for a sewer system in the next few years. It was identified as an area with high bacteria in a synoptic survey that was done in 1996. It has recently been added to the monitoring plan and continues to have high bacteria levels.
Stream – High Dog Population This area is along Fanno Creek (CWS location ID 3840095) where there is strong evidence that people walk their dogs without picking up after them.
Stream – Older Urban This is a neighborhood on Ash Creek (CWS location ID 3845014) that has had chronic high bacteria levels and is mostly older residential land use.
Stream – Duck Feeding Area This is a site on Summer Creek (CWS location ID 3844009) that is downstream of Summer Lake where people feed ducks and geese. There are landscaped lawns down to the edge of the lake. This site was also the duplicate site for the stream sites.
Stream – Mixed Urban This is a site on Dawson Creek (CWS location ID 3850006) that is a mix of older residential area and a very new residential area.
Stormwater – Commercial This stormwater comes from a large shopping mall parking lot (CWS location ID 7301021) in the lower Tualatin Subbasin.
Bacteria DNA Fingerprinting - Final Page 12 of 33 2005

Stormwater – New Residential This stormwater comes from a new residential area (CWS location ID 7106001) in the Rock Creek Subbasin. It is the influent to the water quality facility that is in this study. This is the duplicate site for the stormwater sites.
Stormwater – Water Quality Facility Effluent This is the effluent from an extended dry detention basin (CWS location ID 7106002) that has permanent wetland vegetation due to a spring that continually supplies it with water.
The following box plot shows the bacteria levels from the routine monitoring program for the selected stream sites between 2000 and 2005 for both winter and summer. The bacteria criterion is 406 E. coli bacteria per 100 mL.
10
100
1000
10000
100000
Septic Area(w inter)
Septic Area(summer)
High Dog(w inter)
High Dog(summer)
Duck Feeding(w inter)
Duck Feeding(summer)
Older Urban(w inter)
Older Urban(summer)
Mixed Urban(w inter)
Mixed Urban(summer)
Bacteria Criterion
Note: Units are E. coli per 100 mL The following box plot shows the stormwater data from 1995 to 2005. The WLAs are set in the 2001 TMDL and vary between summer and winter and between sub-basins. The WLAs were set on stormwater to attain the geomean of 126 E. coli bacteria at the mouth of the 5th field watersheds that are designated in the Tualatin Basin TMDL.
Bacteria DNA Fingerprinting - Final Page 13 of 33 2005

1
10
100
1000
10000
100000
1000000
New Residential(w inter)
New Residential(summer)
WQ Facility Eff luent(w inter)
WQ Facility Effluent(summer)
Commercial (w inter) Commercial(summer)
Wasteload Allocations
Note: Units are E. coli per 100 mL Part 2 - Specific Site Stormwater – Manhole at the Durham Wastewater Treatment Facility
The Watershed-Based NPDES permit contains benchmarks of 406 E. coli per 100 mL for stormwater from its Wastewater Treatment Facilities. One of the outfalls at the Durham facility (Clean Water Services location ID 7311044) has periodic elevated bacteria levels. The only obvious source of bacteria is the geese that frequent the area. When bacteria levels exceed the benchmark, the permit requires Clean Water Services to identify the cause of the high bacteria and take necessary actions to reduce the bacteria level below the benchmark.
1
10
100
1000
10000
100000
1000000
Durham Stormw ater
Benchmark
Note: Units are E. coli per 100 mL
Bacteria DNA Fingerprinting - Final Page 14 of 33 2005

MAP OF SITES
Bacteria DNA Fingerprinting - Final Page 15 of 33 2005

STUDY METHODOLOGY Clean Water Services sampled the following weather events:
Weather Condition Stream Samples Stormwater Samples Summer Dry 2 Summer Storm 2 3 Winter Dry 1 Winter Storm 2 3 Total Events Sampled 7 6
Each time a site was visited five, (5) samples were taken at two (2) minute intervals. During storms samples were taken on the rising hydrograph. The Clean Water Services Water Quality Laboratory used the membrane filter method to determine the number of E. coli bacteria in the sample. A plate from each sample with at least three (3) well separated colonies was sent to the IEH for DNA analysis. At IEH, at least three (3) isolated colonies were independently picked for DNA fingerprinting. This resulted in approximately 105 isolates per stream site (7 x 5 x 3 = 105) and 90 isolates per stormwater site (6 x 5 x 3 = 90). This met the goal of approximately 100 isolates per site for statistical validity. Two (2) sites were tested in duplicate, one stream site (Duck Feeding) and one stormwater site (New Residential), for quality control purposes. The samples that were sent to IEH were labeled site #1 to site #11. Therefore IEH did not know the source of the samples or that two of the samples were duplicates. A total of 1203 isolates were tested. There were 924 from general sites, 222 from duplicate sites, and 57 from the specific site. The DNA fingerprinting was done by Dr. Mansour Samadpour at the IEH using the ribosomal RNA typing method. This is one of several methods currently being used for microbial source tracking (MST)6. The theory behind this test is that DNA patterns can be used to match E. coli bacteria found in the environment with the sources of the bacteria. The IEH has a library of DNA patterns from E. coli bacteria that are produced by known sources, such as specific wildlife species, pets, humans, and farm animals. The IEH matched the DNA patterns found in the isolates from the Clean Water Services study to their library of E. coli bacteria DNA patterns to determine the source of the bacteria in the samples. RESULTS The two parts of the study were evaluated separately. The duplicates were not included in the aggregates. For part 1 the general sites were evaluated in the following ways:
6 Donald M. Stoecklt et al., Comparison of Seven Protocols To Identify Fecal Contamination Sources Using Escherichia coli, Environmental Science & Technology, Vol. 38, No. 22, 2004, pages 6109-6117 Bacteria DNA Fingerprinting - Final Page 16 of 33 2005

• Each site was evaluated separately • All sites were aggregated • All stream sites were aggregated • All stream sites were aggregated and then split between weather events • All storm sites were aggregated • All storm sites were aggregated and then split between weather events • Each duplicate was compared to its original
Part 2 only had one site. It was evaluated separately and then compared to all the general sites in part 1. The study identified 19 different sources of bacteria. These were grouped in seven (7) major categories before the results were evaluated. The following shows the distribution of E. coli bacteria sources by major category for the 924 isolates from the part 1 sites.
Avian Canine Feline Rodent Human Wildlife Unknown
Source Count Source Count Source Count Source Count Source Count Source Count Source Count avian 252 canine 22 feline 13 rodent 143 human 12 deer 12 Unknown 85
waterfowl 157 coyote 12 squirrel 5 septage 1 opossum 5 crow 49 dog 84 sewage 26 raccoon 38 geese 3 skunk 1 gull 4
465 118 13 148 39 56 85
In some of the major categories there is a generic source designation. For instance the canine category has the generic source of canine and the more specific sources of coyote and dog. This means the canine DNA type is shared between dogs, coyotes, wolves, foxes, etc. The same is also true of the other major categories. Part 1 - General Sites Each of the general sites was evaluated using a pie chart. The following pie charts show the percentage of each E. coli bacteria source and the total isolates that were evaluated for that sample site. The first five (5) general sites were stream samples.
Bacteria DNA Fingerprinting - Final Page 17 of 33 2005

Stream
Septic Tank Area
134 Isolates
Avian40%
Rodent15%
Canine20%
Human8%
Wildlife10%
Feline1%
Unknown6%
Of the general steam sites, this sample had the highest percentage of human source isolates (8% vs. 7% to 4% for stream samples). Because the site was selected based on a significant number of septic systems in the area, it was actually expected to have a higher percentage of human isolates. This site also had the highest percentage of canine source isolates (20% vs. 7% to 17%).
Stream
High Dog Population
125 Isolates
Avian46%
Rodent13%
Canine12%
Human6%
Wildlife7%
Feline2%
Unknown14%
This site as expected to have the highest percentage of canine source isolates but it did not. It was in the middle of the range of isolates (12% vs. 7% to 20%).
Bacteria DNA Fingerprinting - Final Page 18 of 33 2005
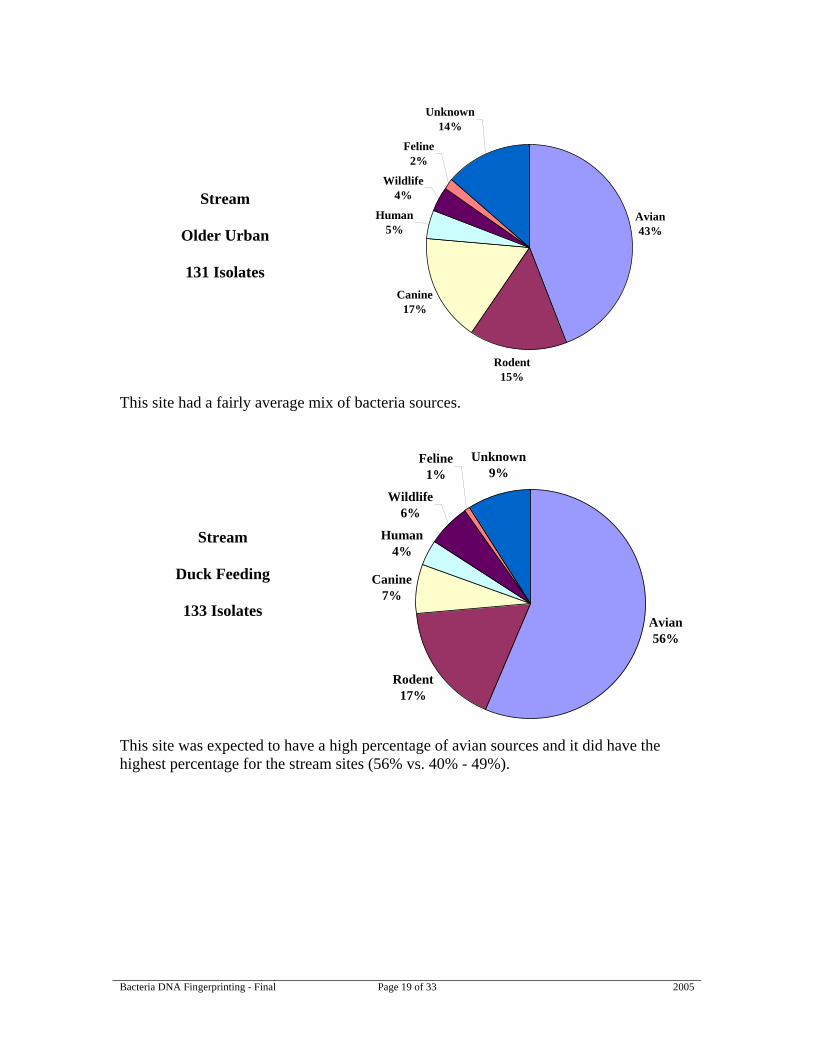
Stream
Older Urban
131 Isolates
Avian43%
Rodent15%
Canine17%
Human5%
Wildlife4%
Feline2%
Unknown14%
This site had a fairly average mix of bacteria sources.
Stream
Duck Feeding
133 Isolates Avian
56%
Rodent17%
Canine7%
Human4%
Wildlife6%
Feline1%
Unknown9%
This site was expected to have a high percentage of avian sources and it did have the highest percentage for the stream sites (56% vs. 40% - 49%).
Bacteria DNA Fingerprinting - Final Page 19 of 33 2005

Stream
Mixed Urban
130 Isolates
Avian48%
Rodent18%
Canine15%
Human7%
Feline2%Wildlife
7%
Unknown3%
This site had a fairly average mix of bacteria sources. Duplicate Duck Feeding Area Samples
Avian56%
Rodent17%
Canine7%
Human4%
Wildlife6%
Feline1%
Unknown9%
Avian63%
Rodent11%
Canine11%
Feline3%
Unknown8%
Wildlife4%
Sample Duplicate
There was reasonable agreement between the sample and duplicate. However because the general sites were so similar the duplicate could have matched several other sites.
Bacteria DNA Fingerprinting - Final Page 20 of 33 2005

The next three (3) general sites are stormwater sites.
Stormwater
Commercial Parking Lot
79 Isolates
Avian51%
Rodent20%
Canine10%
Unknown15%
Feline4%
As with all the stormwater sites, this site has relatively high avian and rodent percentages and no E.coli bacteria from human sources.
Stormwater
New Residential
96 Isolates Avian
57%
Rodent15%
Canine10%
Wildlife9%
Feline2%
Unknown7%
This site was similar to the commercial parking lot site.
Bacteria DNA Fingerprinting - Final Page 21 of 33 2005

Stormwater
Water Quality Facility Effluent
96 Isolates
Avian67%
Rodent17%
Canine8%
Wildlife2%
Unknown6%
This site had the highest avian of all the sites. It is a water quality facility that is full of wetland plants. Duplicate Stormwater – New Residential Area
Avian57%
Rodent15%
Canine10%
Wildlife9%
Feline2%
Unknown7%
Avian54%
Rodent25%
Canine9%
Unknown10%
Wildlife2%
Sample Duplicate
There was reasonable agreement between the sample and duplicate. However because the general sites were so similar the duplicate could have matched several other sites.
Bacteria DNA Fingerprinting - Final Page 22 of 33 2005

Reviewing the individual sites showed a very similar pattern. Most of the isolates were avian, followed by rodent and canine in that order. The following chart aggregates all the general sites.
All General Sites
924 Isolates
Avian51%
Rodent16%
Canine13%
Human4%
Wildlife6%
Feline1%
Unknown9%
The next series of graphs show how the various sites compare for key sources. It also shows how the duplicate matches its sample and the other samples. A statistic that is used to determine if one sample of a set of samples is an outlier was used to determine if any site was statistically different from the other sites. This was done by sources. The statistic7 is designed to be used on small data sets such as this. The data is sorted from lowest to highest percentage and then the difference between the data point in question (either the highest one in the set or the lowest one in the set) and the nearest value as a fraction of the range from the smallest to the largest value in the data set is compared to the statistic in the table. There is a 5% risk of an incorrect conclusion.
7 W. J. Youden and E.H. Steiner, Statistical Manual of the Association of Official Analytical Chemists, Published by the Association of Official Analytical Chemists, 1975, pages 30 & 86 Bacteria DNA Fingerprinting - Final Page 23 of 33 2005

Avian
0
10
20
30
40
50
60
70
Septic
Area
High D
og
Older U
rban
Duck F
eedin
g
Dup D
uck
Mixed U
rban
COMMERCIAL
NEW U
RBAN
DUP N U
RBANWQF
Mixed Upper and Lower Case for Stream Samples, All Upper Case for Stormwater Samples
Perc
ent i
n Sa
mpl
e
There was no statistical difference between the septic area that had the lowest percentage with the data set or the Water Quality Facility that had the highest percentage with the data set.
Rodent
0
5
10
15
20
25
30
Septic
Area
High D
og
Older U
rban
Duck F
eedin
g
Dup D
uck
Mixed U
rban
COMMERCIAL
NEW U
RBAN
DUP N U
RBANWQF
Mixed Upper and Lower Case for Stream Samples, All Upper Case for Storm Water Samples
Perc
ent i
n Sa
mpl
e
There were no statistically different samples in this set.
Bacteria DNA Fingerprinting - Final Page 24 of 33 2005

Canine
0
5
10
15
20
25
Septic
Area
High D
og
Older U
rban
Duck F
eedin
g
Dup D
uck
Mixed U
rban
COMMERCIAL
NEW U
RBAN
DUP N U
RBANWQF
Mixed Upper and Lower Case for Stream Samples, All Upper Case for Storm Water Samples
Perc
ent i
n Sa
mpl
e
There were no statistically different sites in this data set.
Human
0
1
2
3
4
5
6
7
8
9
Septic
Area
High D
og
Older U
rban
Duck F
eedin
g
Dup D
uck
Mixed U
rban
COMMERCIAL
NEW U
RBAN
DUP N U
RBANWQF
Mixed Upper and Lower Case for Stream Samples, All Upper Case for Storm Water Samples
Perc
ent i
n Sa
mpl
es
There were no statistically different sites in this data set.
Bacteria DNA Fingerprinting - Final Page 25 of 33 2005

From these graphs it is apparent that there is not much variation between sites. Sites that were expected to have high concentrations from a particular source did not necessarily have the highest percentage. General Stream Sites The next method used to evaluate the samples was to aggregate all the stream samples together. The following graph shows the bacteria levels in the samples collected for this study.
Stream Bacteria Levels during DNA Study
0
1000
2000
3000
4000
5000
6000
7000
8000
9000
10000
Septic Tank High Dog Older Urban Duck Feeding Duck Feeding (dup) Mixed Urban
Bacteria Criterion
Note: Units are E. coli per 100 mL
Site Types n Mean Median Septic Tank 35 2426 1100
High Dog 35 2034 1000 Older Urban 35 2290 800
Duck Feeding 35 1063 920 Duck Feeding (dup) 35 999 880
Mixed Urban 35 800 560 These sites were selected due to consistently high bacteria levels which were maintained during the study.
Bacteria DNA Fingerprinting - Final Page 26 of 33 2005

The following pie chart shows the aggregate of all the stream sites for the study.
Stream Bacteria Sources
All Sites
653 Isolates
Avian47%
Rodent16%
Canine14%
Human6%
Wildlife7%
Feline1%
Unknown9%
Samples were collected during various weather conditions. The individual stream sites did not have sufficient isolates to evaluate relative to weather; however, if the sites are aggregated there are enough isolates. The following table shows the results.
Aggregate
Summer Dry
Summer Storm
Winter Dry
Winter Storm
Avian 47 % 53 % 46 % 45 % 40 %
Rodent 16 % 13 % 17 % 15 % 18 %
Canine 14 % 14 % 13 % 16 % 13 %
Human 6 % 4 % 9 % 7 % 6 %
Count of Isolates 653 208 157 130 158 The same pattern emerges when the stream samples are aggregated and evaluated relative to weather conditions. Avian is the most common followed by rodent and canine and then by human.
Bacteria DNA Fingerprinting - Final Page 27 of 33 2005

General Stormwater Samples Next the stormwater samples were aggregated. The following graph shows the levels of bacteria in the samples collected for the study.
Stormwater Runoff Bacteria Levels During the Study
0
5000
10000
15000
20000
25000
30000
Commercial New Residential New Residential (dup) WQ Facility Eff luent
Note: Units are E. coli per 100 mL
Site Types n Mean Median
Commercial 33 2647 580 New Residential 33 7535 4600
New Residential (dup) 33 6957 3800 WQ Facility Effluent 33 4120 1800
The following pie chart shows the aggregated stormwater samples.
Stormwater Bacteria Sources
All Sites
271 Isolates
Avian58%
Rodent17%
Canine10%
Wildlife4%
Feline2%
Unknown9%
Bacteria DNA Fingerprinting - Final Page 28 of 33 2005

Samples were collected during various weather conditions. The individual stormwater sites did not have sufficient isolates to evaluate relative to weather; however, if the sites are aggregated there are enough isolates. The following table shows the results.
Aggregate Summer Storm Winter Storm
Avian 58 % 64 % 53 %
Rodent 17 % 11 % 22 %
Canine 10 % 10 % 9 %
Human 0 % 0 % 0 %
Count of Isolates 271 128 143 Each time the data is aggregated the same pattern is present. The highest concentration is avian, followed by rodent, canine, and human. The results of this study were also compared to two other studies. One was done for the Lower Boise River Water Quality Plan8. The watershed studies covered 1,300 square miles and had a population of approximately 260,000. River and stormwater sites were collected in the urban and rural areas. This study was conducted between April and September 2000. The second study was done on Clarks and Meeker Creeks near the City of Puyallup, Washington. Ten (10) sites were sampled a total of 12 times during 2002 and 2003.
Clean Water Services Lower Boise River
Idaho City of Puyallup
Washington
Avian 51 % 24 % 40 %
Rodent 16 % 4 % 28 %
Canine 13 % 14 % 11 %
Human 4 % 12 % 5 %
Other 7 % 15 % 7 %
Unknown 9 % 31 % 9 %
Count of Isolates 924 1565 687
8 Lower Boise River Coliform Bacteria DNA Testing, Prepared for the Lower Boise River Water Quality Plan, CH2MHILL, October 2003 Bacteria DNA Fingerprinting - Final Page 29 of 33 2005

The Lower Boise results are different but that may be due to the high percentage of unknowns and higher percentage of human sources. The higher percentage of unknowns may be due to the fact it was the first study done in this set. The higher percentage of human sources could be due to the fact that one third of the area studied was unsewered. Part 2 - Specific Site One of the stormwater outfalls from the Durham Wastewater Treatment Plant had sporadic high bacteria levels. The only likely source was the geese that frequent the wastewater treatment plant. The site was visited five (5) times during the study. The mean E. coli per 100 mL of each of the five samples taken during each visit were as follows: 98,000, 1, 360, < 1, 62. One of the visits had so few isolates that representative plates were not sent to IEH for analysis. The following pie chart shows the percentage of each of the sources at this site.
Stormwater
Wastewater Treatment Plant
57 Isolates
Rodent7%
Human37%
Unknown4%Wildlife
2%
Avian50%
This answered the original question of whether there were bacteria from human sources at this site. The human isolates represented 37% of the sources for this site. To determine if this site was statistically different from the general sites, the data from this site was added to the data from the part 1 sites. When all sites, including the duplicates, are evaluated, there is a statistical difference between the human isolates for this site and the general sites. If the duplicates are removed from the statistical evaluation, there was a statistical difference between this site and the general sites relative to the human and rodent sources. Bacteria DNA Fingerprinting - Final Page 30 of 33 2005

These differences can be seen in the following stacked bar chart.
Bacteria Sources
0%
20%
40%
60%
80%
100%
120%
Septic
Area
High D
og
Older Urb
an
Duck Feed
ing
Mixe
d Urb
an
COMM
ERCIAL
NEW U
RBANW
QF
WW
TP STORMW
ATER
Avian Rodent Canine Human Feline Wildlife Unknown
USE OF THE DATA This information will allow Clean Water Services to better focus its efforts to reduce the bacteria levels in stormwater and the receiving streams. The information from the first part of the study will be used in public education efforts. Clean Water Services already has a program in place to convert areas with high concentrations of septic system to sanitary sewer systems. The information from the second part will be used to reduce the bacteria in the stormwater from the wastewater treatment plant. Public Education Efforts The two areas that the public education efforts will focus on will be waterfowl feeding and dog waste management. It will be important to effectively communicate this information to the public so they understand that their actions can cause high bacteria levels in the receiving streams. To address high avian bacteria levels, signs will be used that ask the public not to feed the waterfowl. The anticipated result is that fewer waterfowl will congregate in or near water bodies. This would not preclude waterfowl in more naturally sustained numbers being
Bacteria DNA Fingerprinting - Final Page 31 of 33 2005

present. In addition, riparian restoration projects will be landscaped in ways that don’t encourage ducks and geese to take up residence. Another public education campaign will focus on dog waste. The City of Tigard has already prepared a news article for this purpose. In Holy Dog Poop Batman!!!, they compare the number of wolves that an area the size of the Tualatin Sub-basin can support with the number of dogs in the Tualatin Sub-basin. With a naturally sustainable population of 70 wolves and a dog population of 80,000 there are 79,930 dogs that need waste management! Signage with both messages is being developed. The following is a prototype of the sign. The bottom half is still in production.
These signs along with dog-waste bags will be provided to parks in the basin. There will also be press releases that encourage the public to notice the signs and use the bags! These concepts are also incorporated into our River Ranger program that is used in the elementary schools in this area. There are also plans to do a fun and informative postcard to licensed dog owners in the basin.
Bacteria DNA Fingerprinting - Final Page 32 of 33 2005

Wastewater Treatment Plant The results of this test show a significant human contribution in the stormwater. The likely activity that is the source of this contamination has now been identified. The earlier efforts at tracking down the source focused on drainage from treatment plant processes. These were not the issue. The problem has been identified as drainage from a road that the sludge trucks drive on as they exit the treatment plant site. The best way to manage this source is currently being evaluated by Clean Water Services. CONCLUSIONS After evaluating a diverse set of sites, different weather events and different studies, a pattern of sources emerges: most of the bacteria identified are from avian sources, with rodents and canines being the second and third largest sources. In the Boise study human contaminants represented a higher percentage than the rodent percentage. In the other studies, humans were the fourth largest groups of isolates. As the plans are developed to address the WLAs in the TMDLs, it is important to note that human sources are not a dominant source of bacteria. Although it is important to reduce the bacteria from human sources, this will not result in streams meeting their bacteria criterion. It is also important to note that activities that humans participate in do have an impact on the bacteria levels in both stormwater and the receiving streams. Public education will be the best way to deal with these sources. This DNA study will help convince the public that their activities have a direct and significant impact on receiving streams. Providing them with the tools necessary to do their part will be important. Unfortunately, there is too much variability in the bacteria values and the percentages of sources to accurately predict what combination of actions will achieve the WLAs. This information should be taken into consideration as new TMDLs are developed and existing TMDLs are revised. The routine monitoring program will continue to measure E. coli bacteria concentrations. This information from the study sites and the other routine sites will be used to inform the adaptive management process. It will also measure progress towards meeting the bacteria benchmarks in the SWMP.
Bacteria DNA Fingerprinting - Final Page 33 of 33 2005