background elevated perc above dry cleaners –new york city 1990-1997 –median levels 441-530 ug/m...
TRANSCRIPT


Background
• Elevated perc above dry cleaners– New York City 1990-1997– median levels 441-530 ug/m3
– range 7-25,086 ug/m3
• Perc associated with altered vision– color vision (50,000 ug/m3)– visual contrast sensitivity (2,250 ug/m3)
• Other solvents alter vision– styrene, toluene, mixed solvents

Questions• Is living in a building with an onsite dry
cleaner associated with altered vision? • What level of residential perc is harmful?
– relationship between perc exposure and vision – relationship between environmental and
biological measures of perc exposure
• Are children more vulnerable than adults?– child and adult exposures – child and adult effect

Data Collected
• Environmental -- Indoor Air Perc Level
- households with parent/child pairs
- buildings with and without dry cleaners
• Biological -- Breath, blood perc level
- parent and child
- home and clinic
• Health Outcome -- Visual Function
- parent and child

Study Area


Total Telephone Numbers or Households
3177Non-working or non-
residential number or vacant household
397
Total Sampling Frame 2780 Not contacted and/or refused screening
1519
Households Contacted 1261 Not eligible – no children present 1129
Potentially Eligible 132
Not eligible – medical condition, residence duration, current or
previous VOC exposures
43
Eligible 89 Did not participate 24
Participated 65

Perchloroethylene (ug/m3)
StudySampling
PeriodDry Cleaner
TypeBuildingsSampled
ApartmentsSampled
GeometricMeanb Median Range
SamplingTime (hr)
Onsite 24 65 34 28 3-5000 24
Drop Off 5 9 6 3 3-29 24 NYC Perc Project 2001-2003
None 36 61 3 3 3-92 24
May 1997-Effective Date 6NYCRR Part 232-NYS Dry Cleaner Regulation
NYSDOH (Unpublished) 1996-1997 Onsite 8 18 336 530 19-5467 4-24
Onsite 12 29 361 441 7-25086 24Wallace et al. 1995 1994-1995
None 8 10 3 6 1-19 24
Onsite-AM 16 20 1326 2091 6-24667 12NYS DOH (Unpublished) 1991-1993
Onsite-PM 1 5 4629 5900 400-48000 12

Elevated Perc is Present in 54% of Residential Dry Cleaner Buildings Sampled
BuildingHighest Perc Level Detected
(ug/m3)
e368 5
e702 10
e56 12
e103 13
e369 27
e107 39
e41 42
e432 49
e53 62
e63 81
e252 84
e64 101
e47 194
e703 216
e404 322
e249 375
e431 378
e404 402
e152 408
e18a 700
e4 770
e6 2100
e22 4800
e5 5200
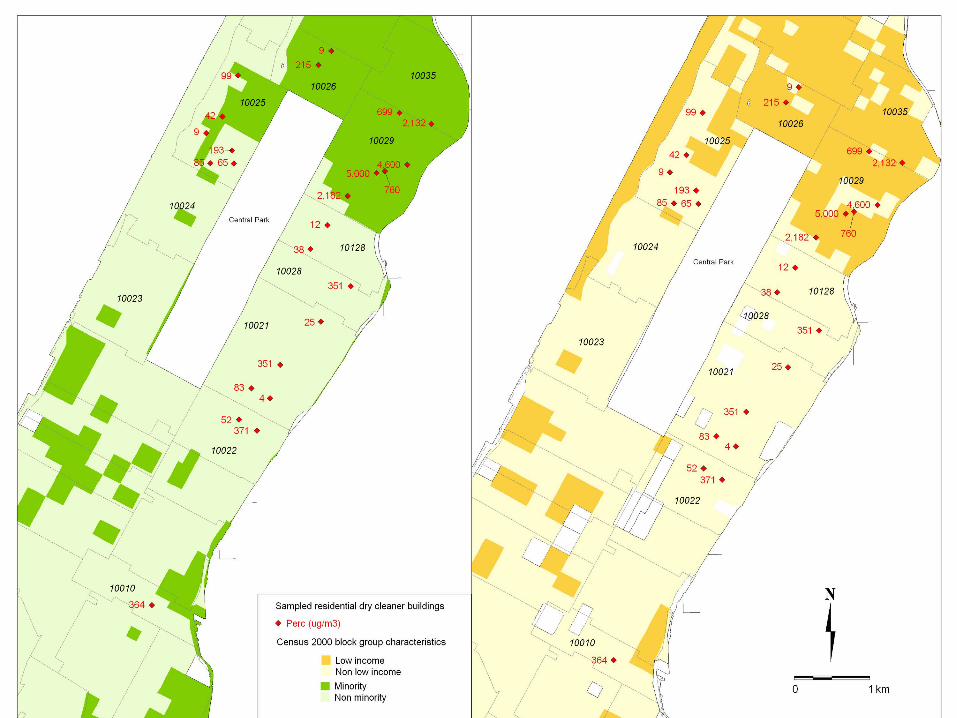

Indoor air perc (ug/m3) by census block group characteristics

Household LevelNumber of Households 65Race/ethnicity Number (% of total)
African American 8 12%Hispanic 13 20%African American OR Hispanic 5 8%White 31 48%Other a 8 12%
Reported income<$15,000 12 18%$15,000 to $30,000 5 8%$30,000 to $45,000 4 6%$45,000 to $60,000 6 9%>$60,000 30 46%No response 8 12%
Individual Level
Number of Adults 67Age std.dev. (years) 41.7 0.9Gender (% female) 74.6%
Numer of Children 68Age std.dev. (years) 9.5 0.3Gender (% female) 55.8%
Self-reported race/ethnicity, annual income ranges
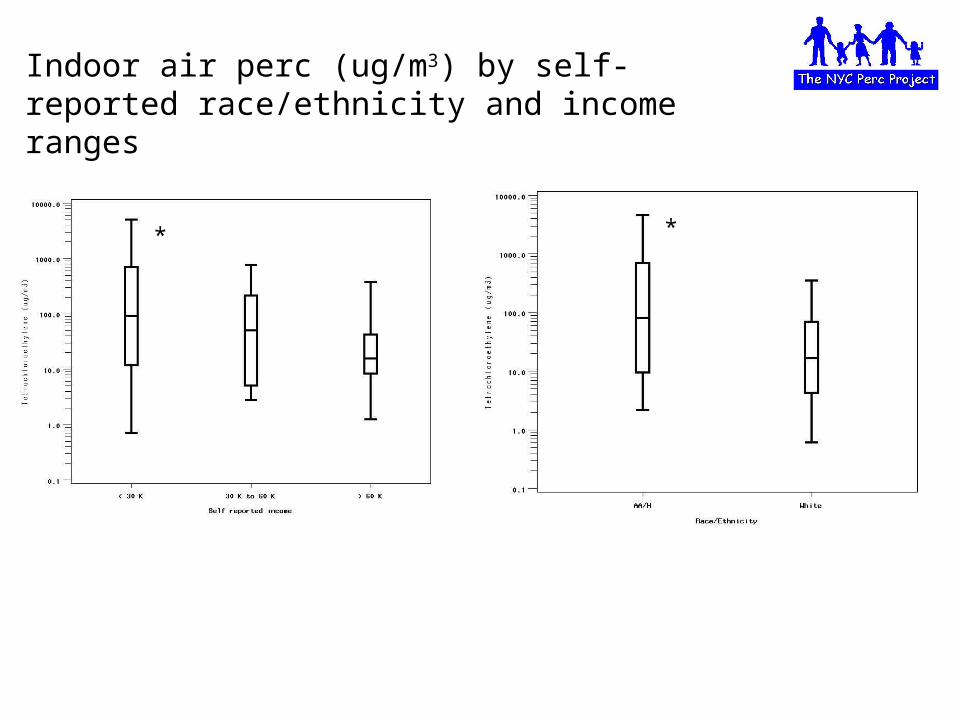
* *
Indoor air perc (ug/m3) by self-reported race/ethnicity and income ranges

1 10 100 1,000 10,000
1
10
100
1,000
Indoor Air Perc (ug/m3)
Bre
ath
Pe
rc -
ho
me
(u
g/m
3)
1 10 100 1,000 10,000
1
10
100
1,000
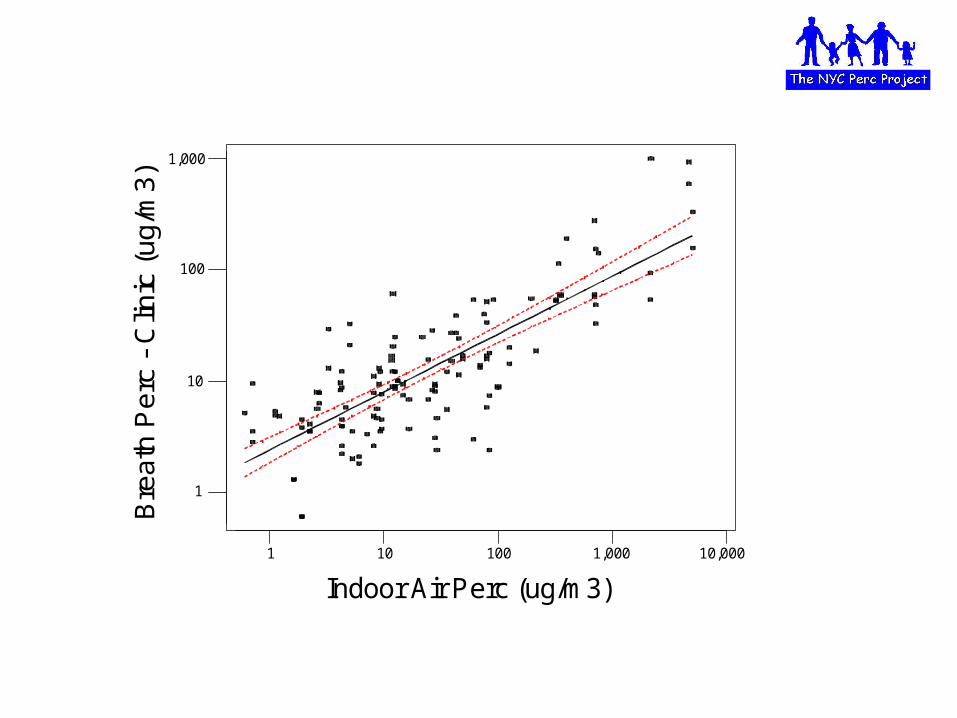
Indoor Air Perc (ug/m3)
Bre
ath
Pe
rc -
Clin
ic (
ug
/m3
)
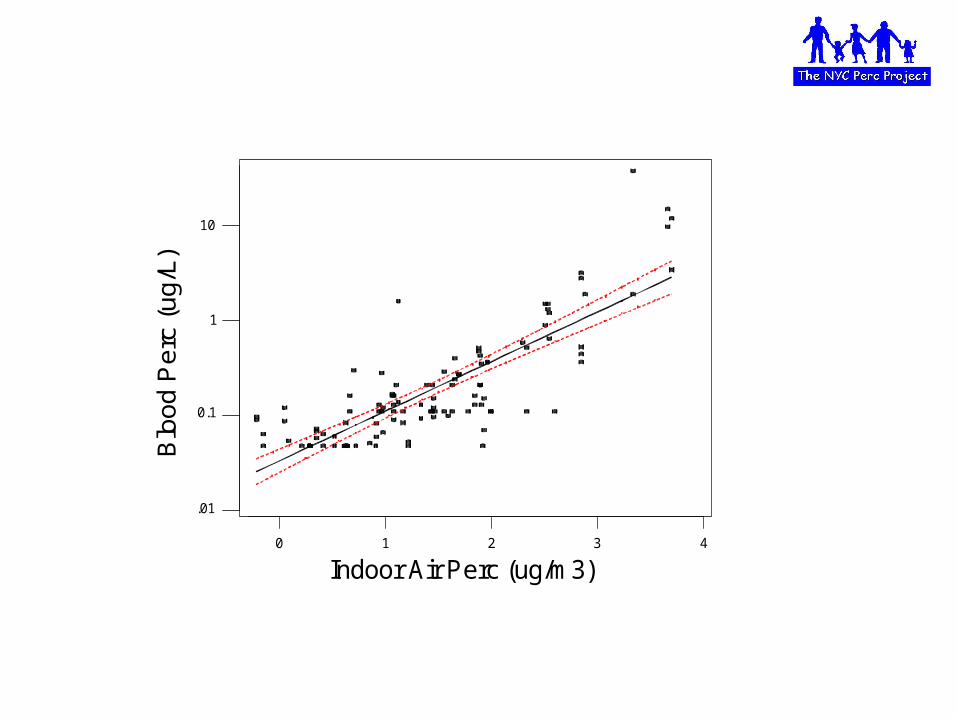
0 1 2 3 4
.01
0.1
1
10
Indoor Air Perc (ug/m3)
Blo
od
Pe
rc (
ug
/L)

Perc in home breath samples by income
Adults Children

Perc in clinic breath samples by income
Adults Children*

Perc in home breath samples by race/ethnicity
Adults Children

Perc in clinic breath samples by race/ethnicity
*Adults Children
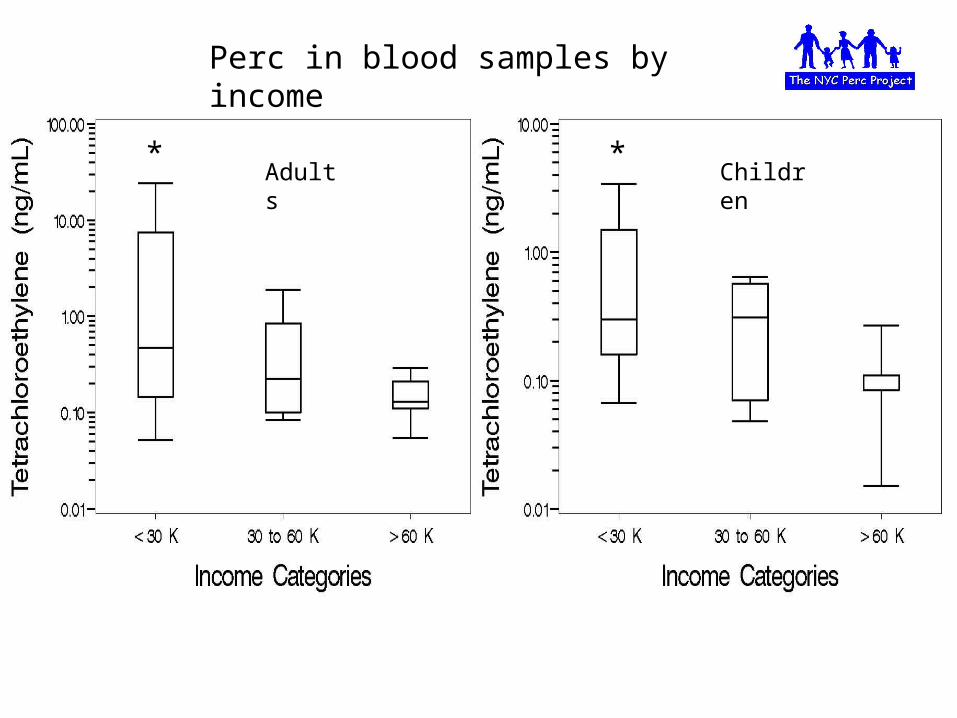
Perc in blood samples by income
Adults Children* *

Perc in blood samples by race/ethnicity
Adults Children*
*