background check: achievability of new ozone standards - gpo · julia brownley, california mark...
TRANSCRIPT

U.S. GOVERNMENT PRINTING OFFICE
WASHINGTON :
For sale by the Superintendent of Documents, U.S. Government Printing OfficeInternet: bookstore.gpo.gov Phone: toll free (866) 512–1800; DC area (202) 512–1800
Fax: (202) 512–2104 Mail: Stop IDCC, Washington, DC 20402–0001
81–724PDF 2013
BACKGROUND CHECK: ACHIEVABILITY OF NEW OZONE STANDARDS
HEARING BEFORE THE
SUBCOMMITTEE ON ENVIRONMENT
COMMITTEE ON SCIENCE, SPACE, AND
TECHNOLOGY
HOUSE OF REPRESENTATIVES
ONE HUNDRED THIRTEENTH CONGRESS
FIRST SESSION
JUNE 12, 2013
Serial No. 113–35
Printed for the use of the Committee on Science, Space, and Technology
(
Available via the World Wide Web: http://science.house.gov

(II)
COMMITTEE ON SCIENCE, SPACE, AND TECHNOLOGY
HON. LAMAR S. SMITH, Texas, Chair DANA ROHRABACHER, California RALPH M. HALL, Texas F. JAMES SENSENBRENNER, JR.,
Wisconsin FRANK D. LUCAS, Oklahoma RANDY NEUGEBAUER, Texas MICHAEL T. MCCAUL, Texas PAUL C. BROUN, Georgia STEVEN M. PALAZZO, Mississippi MO BROOKS, Alabama RANDY HULTGREN, Illinois LARRY BUCSHON, Indiana STEVE STOCKMAN, Texas BILL POSEY, Florida CYNTHIA LUMMIS, Wyoming DAVID SCHWEIKERT, Arizona THOMAS MASSIE, Kentucky KEVIN CRAMER, North Dakota JIM BRIDENSTINE, Oklahoma RANDY WEBER, Texas CHRIS STEWART, Utah VACANCY
EDDIE BERNICE JOHNSON, Texas ZOE LOFGREN, California DANIEL LIPINSKI, Illinois DONNA F. EDWARDS, Maryland FREDERICA S. WILSON, Florida SUZANNE BONAMICI, Oregon ERIC SWALWELL, California DAN MAFFEI, New York ALAN GRAYSON, Florida JOSEPH KENNEDY III, Massachusetts SCOTT PETERS, California DEREK KILMER, Washington AMI BERA, California ELIZABETH ESTY, Connecticut MARC VEASEY, Texas JULIA BROWNLEY, California MARK TAKANO, California ROBIN KELLY, Illinois
SUBCOMMITTEE ON ENVIRONMENT
HON. CHRIS STEWART, Utah, Chair JIM BRIDENSTINE, Oklahoma F. JAMES SENSENBRENNER, JR.,
Wisconsin DANA ROHRABACHER, California RANDY NEUGEBAUER, Texas PAUL C. BROUN, Georgia RANDY WEBER, Texas LAMAR S. SMITH, Texas
SUZANNE BONAMICI, Oregon JULIA BROWNLEY, California DONNA F. EDWARDS, Maryland MARK TAKANO, California ALAN GRAYSON, Florida EDDIE BERNICE JOHNSON, Texas

(III)
C O N T E N T S Wednesday, June 12, 2013
Page Witness List ............................................................................................................. 2 Hearing Charter ...................................................................................................... 3
Opening Statements
Statement by Representative Chris Stewart, Chairman, Subcommittee on Environment, Committee on Science, Space, and Technology, U.S. House of Representatives ................................................................................................ 10
Written Statement ............................................................................................ 11 Statement by Representative Suzanne Bonamici, Ranking Minority Member,
Subcommittee on Environment, Committee on Science, Space, and Tech-nology, U.S. House of Representatives ............................................................... 12
Written Statement ............................................................................................ 14 Statement by Representative Lamar S. Smith, Chairman, Committee on
Science, Space, and Technology, U.S. House of Representatives ..................... 15 Written Statement ............................................................................................ 16
Statement by Representative Eddie Bernice Johnson, Ranking Member, Com-mittee on Science, Space, and Technology, U.S. House of Representatives .... 17
Written Statement ............................................................................................ 17
Witnesses:
Ms. Amanda Smith, Executive Director, Utah Department of Environmental Quality
Oral Statement ................................................................................................. 18 Written Statement ............................................................................................ 21
Mr. Samuel Oltmans, Senior Research Associate, Cooperative Institute for Research in the Environmental Sciences, University of Colorado, and Earth System Research Laboratory Global Monitoring Division
Oral Statement ................................................................................................. 34 Written Statement ............................................................................................ 36
Dr. Russell Dickerson, Professor, Department of Atmospheric and Oceanic Science, University of Maryland
Oral Statement ................................................................................................. 51 Written Statement ............................................................................................ 53
Mr. Jeffrey Holmstead, Partner, Bracewell & Giuliani LLP Oral Statement ................................................................................................. 63 Written Statement ............................................................................................ 65
Dr. John Vandenberg, Director, Research Triangle Park, North Carolina Divi-sion, National Center for Environmental Assessment, U.S. Environmental Protection Agency
Oral Statement ................................................................................................. 75 Written Statement ............................................................................................ 77
Discussion ................................................................................................................. 73
Appendix I: Answers to Post-Hearing Questions
Ms. Amanda Smith, Executive Director, Utah Department of Environmental Quality .................................................................................................................. 96

PageIV
Mr. Samuel Oltmans, Senior Research Associate, Cooperative Institute for Research in the Environmental Sciences, University of Colorado, and Earth System Research Laboratory Global Monitoring Division ................................ 102
Dr. Russell Dickerson, Professor, Department of Atmospheric and Oceanic Science, University of Maryland ......................................................................... 106
Mr. Jeffrey Holmstead, Partner, Bracewell & Giuliani LLP ............................... 108 Dr. John Vandenberg, Director, Research Triangle Park, North Carolina Divi-
sion, National Center for Environmental Assessment, U.S. Environmental Protection Agency ................................................................................................. 114
Appendix II: Aditional Material for the Record
Charts submitted by Representative Chris Stewart, Chairman, Subcommittee on Environment, Committee on Science, Space, and Technology, U.S. House of Representatives ................................................................................................ 134
(1)
BACKGROUND CHECK: ACHIEVABILITY OF NEW OZONE STANDARDS
Wednesday, June 12, 2013
HOUSE OF REPRESENTATIVES, SUBCOMMITTEE ON ENVIRONMENT
COMMITTEE ON SCIENCE, SPACE, AND TECHNOLOGY, Washington, D.C.
The Subcommittee met, pursuant to call, at 10:05 a.m., in Room 2318 of the Rayburn House Office Building, Hon. Chris Stewart [Chairman of the Subcommittee] presiding.

2
LAMAR S. SMITH, Texas CHAIRMAN
trongress of the tinitcd ~tates 1I\oUSl' of 1R.cprmcntatiDl'S
COMMITTEE ON SCIENCE, SPACE, AND TECHNOLOGY
2321 RAYBURN HOUSE OFFICE BUILDING
WASHINGTON, DC 20515-6301
(202) 225-6371 www.S1:lience.house.gov
Subcommittee on Environment
EDDIE BERNICE JOHNSON. Texas RANKING MEMBER
Background Check: Achievahility of New Ozone Standards
Wednesday, June 12,2013 10:00 a.m. -12:00 p.m.
2318 Rayburn House Office Building
Ms. Amanda Smith, Executive Director, Utah Department ofEuvironmental Quality
Mr. Samuel Oltmans, Senior Research Associate, Cooperative Institute for Research in the Environmental Sciences, University of Colorado, and Earth System Research Laboratory Global Monitoring Division
Dr. Russell Dickerson, Professor, Department of Atmospheric and Oceanic Science, University of Maryland
Mr. Jeffrey Holmstead, Partuer, Bracewell & Giuliani LLP
Dr. John Vandenberg, Director, Research Triangle Park, NOlth Carolina Division, National Centcr for Environmental Assessment, U.S. Environmental Protection Agency

3
U.S. HOUSE OF REPRESENTATIVES COMMITTEE ON SCIENCE, SPACE, AND TECHNOLOGY
SUBCOMMITTEE ON ENVIRONMENT
HEARING CHARTER
Background Clleck: Acllievability of New Ozone Standards
PURPOSE
Wednesday, June 12,2013 10;00 a.m. - 12;00 p.m.
2318 Rayburn House Office Building
The Subcommittee on Environment will hold a hearing entitled Background Check: Achievability a/New Ozone Standards on Wednesday, June 12,2013, at 10;00 a.m. in Room 2318 of the Rayburn House Office Building. The purpose of the hearing is to highlight the science behind Environmental Protection Agency's (EPA) forthcoming National Ambient Air Quality Standards (NAAQS) for ground level ozone ("ozone NAAQS") including EPA's estimation of background (naturally occurring/uncontrollable) ozone and its implications on, the achievability of, and compliance with, the NAAQS.
WITNESS LIST
Ms. Amanda Smith, Executive Director, Utah Department of Environmental Quality • Mr. Samuel Oltmans, Senior Research Associate, Cooperative Institute for Research in the
Environmental Sciences, University of Colorado, and Earth System Research Laboratory Global Monitoring Division Dr. Russell Dickerson, Professor, Department of Atmospheric and Oceanic Science, University of Maryland Mr. Jeffrey Holmstead, Partner, Bracewell & Giuliani LLP Dr. Kenneth Olden, Director, National Center for Environmental Assessment, U.S. Environmental Protection Agency
BACKGROUND
Ozone (03) is a gas that occurs both in the Earth's upper atmosphere, as well as at ground level (troposphere). Ozone in the upper atmosphere helps protect the earth from the sun's harmful rays such as ultraviolet radiation. Ozone at ground level is not directly emitted into the air, but instead is created by chemical reactions between "precursor emissions," specifically nitrogen oxide (NOx) and volatile organic compounds (YOC).l Ground level ozone is often referred to as "smog."
1 http://www.epa.gov/air/ozonepollutionlbasic.html
1
4
The Clean Air Act directed EPA to set National Ambient Air Quality Standards (NAAQS) for pollutants considered hannful to public health and the environment.2 EPA has set standards for six criteria pollutants including: carbon monoxide, lead, nitrogen dioxide, ozone, particle pollution (particulate matter), and sulfur dioxide. The Clean Air Act specifies two categories of standards: primary standards for public health protection and secondary standards for public welfare protection.
The Clean Air Act requires EPA to review the NAAQS every five years to ensure adequate health and environmental protection is being provided. In 1997, the EPA replaced the existing ozone NAAQS with an 8-hour standard of 84 parts per billion (using standard rounding conventions). In 2008, EPA issued a final rule revising the ozone standard, which set the level at 75 parts per billion.3
In July 2011, outside of the normal five year review process, EPA submitted a draft final rule for reconsideration of the 2008 ozone NAAQS that was subsequently withdrawn in September 2011 by President Obama.4
EPA is now in the process ofrcviewing the NAAQS. In February 2013, the agency released its final Integrated Science Assessment (ISA), a document guided by advice from the Clean Air Scientific Advisory Committee (CASAC). EPA is now developing and receiving CASAC feedback on the Risk and Exposure Assessment (REA) and Policy Assessment (PA). These documents build on the (SA and discuss options for either retaining or revising existing standards. Based upon advice provided by CASAC, EPA will propose and finalize an updated ozone NAAQS (See Appendix B).
OZONE CONTRIBUTIONS:
EPA's final ISA for Ozone and Related Photochemical Oxidants makes a distinction between ozone concentrations that result from precursor emissions that cannot be controlled from those that are controllable through U.S. policies:
"For this document, EPA has considered background 03 concentrations more broadly by considering three different definitions of background. The first is natural background which includes contributions resulting from emissions from natural sources (e.g., stratospheric intrusion, wildfires, biogenic methane, and more shortlived VOC emissions) througbout tbe globe simulated in tbe absence of all anthropogenic emissions. The second is North American background (NA background) which includes contributions from natural background throughout the globe and emissions of anthropogenic pollutants contributing to global concentrations of 03 (e.g., anthropogenic methane) from countries outside North America. The third is United States background (U.S. background) which includes contributions from natural background throughout the globe and emissions from anthropogenic pollutants contributing to global concentrations of 03 from countries outside the United. States. U.S. background differs from NA background in that it
2 http://www.epa.gov/air/criteria.html 3 bttp://www.gpo.gov/fdsys/pkglFR-2008-03-27/html/ES-564 5 .btm 4 http://www.whitehouse.gov/the-press-office/ZO\\/09/02/statement-president-ozone-national-ambient-air-gualitystandards
2

5
includes anthropogenic emissions from neighboring Canada and Mexico. These three definitions have been explored in recent literature and are discussed further below."s
Contributions from the stratosphere account for variations in background ozone levels. Ozone is produced in the stratosphere naturally, through photochemical reactions. This ozone is often transported downward into the troposphere (ground level) through a process known as tropopause folding.6 This phenomenon often occurs in conjunction with varying weather patterns, where tropospheric and stratospheric air mixes, contributing to increased background ozone levels at ground level. Additionally other occurrences can lead to increases in ozone; deep convection is capable of penetrating the troposphere during summer months. Biomass burning, such as wildfires, can also be a source of ozone precursors. Not only can wildfires in the US affect background ozone levels, but the ozone from wildfires in other countries can be transported to the US.
COMPLIANCE WITH THE NAAQS
As the EPA revises the NAAQS for ozone, it must designate areas in the US which meet attainment or nonattainment of the standard. Attainment simply refers to a state or region complying with federal regulations, while nonattainment means that an area is exceeding the regulated limit. States must individually develop a plan to comply with the NAAQS, while also planning to attain the standards for each area designated nonattainment. State environmental agencies must then develop State Implementation Plans (SIPs).7 After each revised NAAQS is promulgated, both the EPA and states must undertake specific actions:
"Within two years after NAAQS promulgation: With input from the states and tribes, EPA must identify or "designate" areas as meeting (attainment areas) or not meeting (nonattainment areas), the standards. Designations are based on the most recent set of air monitoring data. Within three years after NAAQS promulgation: All states must submit plans, known as state implementation plans (SIPs), to show they have the basic air quality management program components in place to implement a new or revised NAAQS, as specified in Clean Air Act section 110. Within 18-36 months after designations: Due dates for nonattainment area SIPs are based on the area designation date and vary by pollutant and area classification. SIPs for Ozone, PM25, and CO nonattainment areas are generally due within 36 months from the date of designation. Each nonattainment area SIP must outline the strategies and emissions control measures that show how the area will improve air quality and meet the NAAQS. In addition, the CAA mandates that areas adopt certain specified control requirements."g
5 U.S. Environmental Protection Agency, Integrated Science Assessment for Ozone and Related Photochemical Oxidants. 2013. Page 3-31. Available at: http://www.epa.gov/ncealisal. 6 Ibid, pg. 3-32. 7 http://www.epa.gov/airqualitv/urbanair/sipstatus/overview.html 'http://www.epa.gov/airqualitv/urbanair/sipstatus/process.html
3

6
After a state submits its SIP, the EPA then reviews and either approves it in full, in part, or disapproves. The public does have an opportunity to submit comments on the EPA's proposed
actions. If a state fails to submit a plan, or if the EPA disapproves of the plan, the EPA is
required to develop a federal implementation plan.9
ADDITIONAL READING
• U.S. Environmental Protection Agency, Integrated Science Assessment for Ozone and Related Photochemical Oxidants. 2013. Available at: http://www.epa.gov/nceaJisa/
• Emery, C., Jung, J., Downey, N., Johnson, J., Jimenez, M., Yarwood, G., Morris, R., 2012. Regional and Global Modeling Estimates of Policy Relevant Background Ozone over the United States. Atmos. Environ. 47, 206-217.
• Lin, M., Fiore, A.M., Cooper, O.R., Horowitz, L.W., Langford, A.O., Levy II, H., Johnson, BJ., Vaishali, N., Oltmans, SJ., Senff, C.J., 2012. Springtime High Surface Ozone Events over the Western United States: Quantifying the Role of Stratospheric Intrusions. J. Geophys. Res. 117, DOOV22, doi:lO. 10291201210018151.
• McDonald-Buller, E.C., Allen, D.T., Brown, N., Jacob, OJ., Jaffe, D., Kolb, C.E., Lefohn, A.S., Oltmans, S., Parrish, D.O., Yarwood, G., Zhang, L., 2011. Establishing Policy Relevant Background (PRB) Ozone Concentrations in the United States. Environ. Sci. & Tech. 45, doi: 10.1021!es2022918, 9484-9497.
9 Ibid
4

7
Appendix A:
1979
44 FR 8202
Feb 8,1979
1993
58 FR 13008
Mar9,1993
1997
62 FR38856
Ju118,1997
2008
73 FR 16483
Mar 27,2008
Table of Historical Ozone NAAQSIO
Total
photochemical I-hour
oxidants
0 3 1-hour
EPA decided that revisions to the standards were not warranted at the time
Secondary 0 3
0.08 fourth-l1igl1est daily maximum
8-hour concentration, averaged over 3 ppm
Primary and
Secondary 0 3
fourth-highest daily maximum
8-hour concentration, averaged over 3 ppm
10 http://www.epa.gov/ttnJnaaqs/standards/ozone/s 03 history.html
5

8
New NAAQS review process April 2009
II hUJ):llwww.epa.govittnnaagslmU.sINAAQSReviewProccssl.vfQ!.l1052102,pilf

9
AppendixC:
Percent Change in Air Qualityl2
1980vs 2010 1990vs 2010 2000vs 2010
Carbon Monoxide (CO) -82 -73 -54
Ozone (0;) (8-hr) -28 -17 -11
lead (Pb) -90 -83 -62
Nitrogen Dioxide (N02) (annual) -52 -45 -38
PM'0 (24-hr) -- -38 -29
PM2.5 (annual) --- --- -27
PM2.5 (24-hr) --- --- -29
Sulfur Dioxide (502) (24-hr) -76 -68 -48
Notes: 1. --- Trend data not available 2. Negative numbers indicate improvements in air quality
National and local air quality trends graphs showing the nation's progress towards clean air are available for: carbon monoxide (CO)' ozone (011, lead (Pb), nitrogen dioxide (NO?), particulate matter (PM), and sulfur dioxide (S02).
12 http://www.epa.gov/airtrends/agtrends.html

10
Chairman STEWART. The Subcommittee on Environment will come to order.
Good morning, everyone. Thank you for your time today. Wel-come to today’s hearing entitled ‘‘Background Check: Achievability of New Ozone Standards.’’ In front of you are packets containing the written testimony, biographies, and Truth in Testimony disclo-sures for today’s witness panels, whom I will be introducing in just a moment. The chair now recognizes myself for five minutes for an opening statement.
Again, I would like to thank our excellent witnesses for being here today. We have what is really a superb panel, including the head of my state’s world-class Department of Environmental Qual-ity. Welcome. And each of you, I know, intend to tell us about re-cent science related to the background ozone levels and how these developments should inform EPA’s upcoming revisions in the Na-tional Ambient Air Quality Standards, or NAAQS, for ozone.
Recent studies suggest that EPA may be underestimating mul-tiple sources of background ozone, especially in the western United States. Failure to acknowledge these uncontrollable concentrations could lead to EPA setting a new ozone standard next year that is at or near background levels, with catastrophic economic impacts for large swaths of the country. As this slide shows—and this slide was created from EPA data—most of the Nation would be non-compliant with the new EPA standard. More discouraging, many of these locations would find it impossible to get in compliance be-cause of naturally occurring ozone, or from emissions that are im-ported from other locations around the Nation or, in some cases, from around the globe. In fact, EPA data suggests that areas in vir-tually every state would violate these standards if the Agency went lower than the current limit of 75 parts per billion. The result leaves little room for states like Utah to demonstrate compliance with the Clean Air Act, and the consequences include draconian re-duction requirements, severe economic sanctions, threats to high-way funding, and construction bans.
It is important to recognize that an unachievable standard would result in little actual environmental improvement. Over the past 30 years, the emissions of all precursors to ground-level ozone have dropped more than 50 percent, and states have not even begun to implement the tighter 2008 ozone standards.
The lower ozone standard of 60 parts per billion, which is cur-rently being discussed by EPA, would be incredibly expensive. In fact, even the EPA’s conservative cost estimate of $90 billion a year would make this proposed rule the most expensive regulation ever considered. But is this a record to be proud of? And it is potentially much worse, for outside analyses suggested the real cost of this proposed regulation is closer to $1 trillion in annual attainment costs and reduced gross domestic product. Recognizing the signifi-cant negative economic consequences of this proposed action, in 2011 the President showed restraint by withdrawing the proposal, citing the importance of reducing regulatory burdens.
It is early in this standard-setting process, but once again there are troubling signs. The Agency’s Clean Air Scientific Advisory Committee, which advises the Administrator on NAAQS, has al-ready flagged that the EPA fails to provide a definition of ozone

11
background or to discuss the role of background in developing op-tions for the standards in its initial scientific documents.
EPA also has signaled an unprecedented break with past practice in the Clean Air Act process by attempting to disregard back-ground levels in evaluating health risks, essentially trying to load the dice to generate large regulatory benefits by claiming that a new standard would address ozone that cannot be controlled. One of the Agency’s own science advisors has called this shift a mis-interpretation that invites litigation against the Administrator and the Agency. It is critical that these advisors carry out their obliga-tion under the Clean Air Act to advise EPA on the relative con-tribution of concentrations of natural as well as human activity and to inform the Administrator about any adverse public health, wel-fare, social, economic and energy effects from the new ozone stand-ards.
It is very important that these scientists focus on their role as independent peer reviewers. But the reality that I see is con-cerning. For example, among the 28 panelists reviewing EPA’s sci-entific documents on ozone, 22 of them are cited by the EPA in the Agency’s Integrated Science Assessment and they are referenced more than a thousand times in a document they are being asked to critically examine.
Our witnesses will testify today about new modeling and moni-toring results that show that atmospheric events like stratospheric intrusions, transported emissions from Asia, and other sources could make new ozone standards unachievable. As we will hear, these results are confirmed by EPA’s monitors in rural areas and isolated National Parks.
Let me be clear: if EPA lowers its standard to 60 parts per bil-lion, there are places in this country that could not meet it even if they eliminated all human emissions. An air quality standard that cannot be met in Yellowstone or Canyonlands or Zion or the Grand Canyon is simply divorced from reality. EPA claims that there are flexibilities within the Clean Air Act implementation that could resolve these concerns about compliance due to exceptional events or international emissions. However, the Agency’s track record on approving state applications under these provisions leaves little room for comfort.
I look forward to discussing these absolutely critical issues with our witnesses today, and I now recognize the Ranking Member, Ms. Bonamici, for her opening statement.
[The prepared statement of Mr. Stewart follows:]
PREPARED STATEMENT OF SUBCOMMITTEE CHAIRMAN CHRIS STEWART
Good morning and welcome to the Environment Subcommittee’s hearing entitled ‘‘Background Check: Achievability of New Ozone Standards.’’
I’d like to thank our excellent witnesses for being here today. We have a superb panel of experts, including the head of my state’s world-class Department of Envi-ronmental Quality, to tell us about recent science related to background ozone levels and how these developments should inform EPA’s upcoming revisions to its National Ambient Air Quality Standards, or NAAQS, for ozone.
Recent studies suggest that EPA may be underestimating multiple sources of background ozone, especially in the Western United States. Failure to acknowledge these uncontrollable concentrations could lead to EPA setting a new ozone standard next year that is at or near background levels, with catastrophic economic impacts for large swaths of the country.

12
As this slide shows, and this slide was created from EPA data, most of the nation would be non-compliant with the new EPA standard. More discouraging, many of these locations would find it impossible to get in compliance because of naturally occurring ozone, or emissions that are imported from other locations around the na-tion or around the globe. In fact, EPA data suggests that areas in virtually every state would violate these standards if the Agency went lower than the current limit of 75 parts per billion. The result leaves little room for states like Utah to dem-onstrate compliance with the Clean Air Act, and the consequences include draconian reduction requirements, severe economic sanctions, threats to highway funding, and construction bans.
It’s also important to recognize that an unachievable standard would result in lit-tle actual environmental improvement. Over the last 30 years, the emissions of all precursors to ground-level ozone have dropped more than 50 percent, and States have not even begun to implement the tighter 2008 ozone standards.
The lower ozone standard of 60 parts per billion, which is currently being dis-cussed by EPA, would be incredibly expensive. In fact, even the EPA’s conservative cost estimate of $90 billion a year would make this proposed rule the most expen-sive regulation ever considered. But is this a record to be proud of? And it’s poten-tially much worse, for outside analyses suggested the real cost of this proposed regu-lation is closer to one trillion dollars in annual attainment costs and reduced gross domestic product. Recognizing the significant negative economic consequences of this proposed action, in 2011, the President showed restraint by withdrawing the proposal, citing ‘‘the importance of reducing regulatory burdens.’’
It is early in this standard-setting process, but once again there are troubling signs. The Agency’s Clean Air Scientific Advisory Committee, which advises the Ad-ministrator on NAAQS, has already flagged that the EPA ‘‘fails to provide a. defini-tion of ozone background’’ or to ‘‘discuss the role of background in developing op-tions’’ for the standards in its initial scientific documents.
EPA has also signaled an unprecedented break with past practice in the Clean Air Act process by attempting to disregard background levels in evaluating health risks—essentially trying to load the dice to generate large regulatory benefits by claiming that a new standard would address ozone that cannot be controlled. One of the Agency’s own science advisors has called this shift a misinterpretation that ‘‘invites litigation against the Administrator and the Agency.’’
It is critical that these advisors carry out their obligation under the Clean Air Act to advise EPA on the ‘‘relative contribution to [ozone] concentrations of natural as well as’’ human activity and to inform the Administrator about ‘‘any adverse public health, welfare, social, economic, or energy effects’’ from these new ozone standards.
It is very important for these scientists to focus on their role as independent peer reviewers. But the reality that I see is concerning: For example, among the 28 pan-elists reviewing EPA’s scientific documents on ozone, 22 of them are cited by EPA in the Agency’s Integrated Science Assessment and they are referenced more than a thousand times in a document they are being asked to critically examine.
Our witnesses will testify today about new modeling and monitoring results that show that atmospheric events like stratospheric intrusions, transported emissions from Asia, and other sources could make new ozone standards unachievable. As we will hear, these results are confirmed by EPA’s monitors in rural areas and isolated National Parks.
Let me be clear: if EPA lowers its standard to 60 parts per billion, there are places in this country that could not meet it even if they eliminated all human emis-sions. An air quality standard that cannot be met in Yellowstone, Canyonlands, Zion, or the Grand Canyon is divorced from reality.
EPA claims that there are flexibilities within Clean Air Act implementation that could resolve these concerns about compliance due to exceptional events or inter-national emissions. However, the Agency’s track record on approving state applica-tions under these provisions leaves little room for comfort.
I look forward to discussing these absolutely critical issues with our witnesses today. I now recognize the Ranking Member Ms. Bonamici, for her opening state-ment.
Ms. BONAMICI. Thank you very much, Chairman Stewart. I want to thank all the witnesses for being here today. I hope that this dis-cussion about the latest science regarding the health standard for ozone in the air we breathe, how ozone affects health and our qual-ity of life, will set the stage for a positive outcome.
As we will hear this morning, the EPA is considering new sci-entific information that will inform their work on setting an ozone

13
health standard later this year. The last time the EPA reconsid-ered the ozone health standard in 2008, the scientific recommenda-tions of the Clean Air Science Advisory Committee called for a more protective standard than we currently have in place. Now, five years later, we know more about how ozone impacts our health than ever before.
According to the American Lung Association, numerous health studies show evidence of a causal link between inhaling ozone lev-els well below the standard, and measurable respiratory harm in children, the elderly, and people who exercise and work outdoors. Inflammation of the lungs and increased asthma attacks are just the start of the serious health problems associated with breathing ozone.
Having a clean and healthy environment can build a stronger economy in many ways. Sick workers are not productive workers. Sick children are not learning and maximizing their potential. Time spent with doctors and in hospitals is time lost from more productive pursuits. And additionally, we cannot overlook the im-pact that pollution has on a thriving agricultural community. A vi-brant economy can be the result of good environmental practices, not a victim of those practices.
Over the years scientific and technological advancements have dramatically improved our knowledge about how ozone is formed and where sources of ozone precursors originate. The majority of ozone in most parts of the country originates in local human activi-ties. Emissions from power plants and tailpipes are often the lead-ing culprit, but ozone can also form from precursor emissions that may have originated thousands of miles away or from biogenic sources such as forest fires. Causes of ozone, especially at higher elevations and in the Intermountain West, seem to differ from those found on the East or West coasts and are often beyond the reach of our regulators. We still do not fully understand all of these complex processes, and strong investments in scientific research would make it possible for us to better identify sources, especially policy-relevant background conditions, with more precision. Sci-entific research would provide regulators with the information they would need to develop approaches to managing ozone more appro-priate to local conditions. However, that kind of precision requires funding and, as Ms. Smith notes in her testimony, research fund-ing at EPA is under pressure, and neither states nor universities are in a good position fiscally to fill the gap.
The EPA has the responsibility to insure that its decision to set a new ozone standard is guided by the best available science. I am cognizant of the argument that local conditions in the Inter-mountain West may require some new forms of flexibility by the EPA in enforcing ozone standards, and I encourage EPA to work with the states to develop such flexibility. Despite that call for flexibility, the science on ozone and health is sound. The need for more science on policy-relevant background levels of ozone must not deter or prevent the EPA from setting an ozone standard that is fully protective of human health.
This country has proven time and time again that a cleaner envi-ronment improves worker productivity, increases agricultural yield, reduces mortality and illness, and achieves other economic and

14
public health benefits that outweigh the costs of compliance. As we look ahead to the EPA’s proposal to set a new ozone standard, the EPA must examine the latest scientific findings along with the cost of implementation and the protection of human health.
I look forward to hearing from all the witnesses, and with that, Mr. Chairman, I yield back.
[The prepared statement of Ms. Bonamici follows:]
PREPARED STATEMENT OF SUBCOMMITTEE RANKING MEMBER SUZANNE BONAMICI
Thank you, Chairman Stewart. I want to thank all of the witnesses for being here today. I hope this discussion about the latest science regarding the health standard for ozone in the air we breathe—how ozone affects health and our quality of life— will set the stage for a positive outcome.
As we will hear this morning, the EPA is considering new scientific information that will inform their work on setting an ozone health standard later this year. The last time the EPA revised the ozone health standard in 2008, the advisory com-mittee recommended a more protective standard than we currently have in place.
Now, five years later, we know more about how ozone impacts our health than ever before. According to the American Lung Association, numerous health studies show evidence of a causal link between inhaling ozone levels well below the stand-ard, and measurable respiratory harm in children, the elderly, and people who exer-cise and work outdoors. Inflammation of the lungs and increased asthma attacks are just the start of the serious health problems associated with breathing ozone.
Having a clean and healthy environment can build a stronger economy in many ways. Sick workers are not productive workers. Sick children are not learning and maximizing their potential. Time spent with doctors and in hospitals is time lost from more productive pursuits. Additionally, we cannot overlook the impact that pollution can have on a thriving agriculture community. A vibrant economy can be the result of good environmental practices, not the victim of those practices.
Over the years scientific and technological advancements have dramatically im-proved our knowledge about how ozone is formed and where sources of ozone pre-cursors originate. The majority of ozone in most parts of the country originates in local human activities. Emissions from power plants and from tail pipes are often the leading culprit. But ozone can also form from precursor emissions that may have originated thousands of miles away or from biogenic sources such as forest fires. Causes of ozone, especially at higher elevations and in the Intermountain West, seem to differ from those found on the East or West coasts and are often beyond the reach of our regulators.
We still do not fully understand all of these complex processes, and strong invest-ments in scientific research would make it possible for us to identify sources, espe-cially background conditions, with more precision. Scientific research would provide regulators with the information they would need to develop approaches to managing ozone more appropriate to local conditions. However, that kind of precision requires funding and, as Ms. Smith notes in her testimony, research funding at EPA is under pressure and neither states nor universities are in a good position fiscally to fill the gap.
EPA has the responsibility to insure that its decision to set a new ozone standard is guided by the best available science. I am cognizant of the argument that local conditions in the Intermountain West may require some new forms of flexibility by EPA in enforcing ozone standards, and I encourage EPA to work with the states to develop such flexibility. Despite that call for flexibility, the science on ozone and health is sound. The need for more science on background levels of ozone must not deter or prevent the EPA from setting an ozone standard that is fully protective of human health.
This country has proven time and time again that a cleaner environment im-proves worker productivity, increases agricultural yield, reduces mortality and ill-ness, and achieves other economic and public health benefits that outweigh the costs of compliance.
As we look ahead to the EPA’s proposal to set a new ozone standard, the EPA must consider the latest scientific findings and the protection of human health. I look forward to hearing from the witnesses.
15
Chairman STEWART. Thank you very much, Ms. Bonamici. We now recognize the Chairman of the full Committee, the gentleman from Texas, Mr. Smith, for an opening statement.
Chairman SMITH. Thank you, Mr. Chairman. Mr. Chairman, today’s hearing comes at a critical time. The En-
vironmental Protection Agency is now reviewing the science that it will use to determine whether to revise or retain the National Am-bient Air Quality Standards for ozone, called NAAQS. This decision has significant implications that will drive regulatory requirements across the country and will have a significant impact on the econ-omy. In 2010, the EPA itself estimated that revised ozone stand-ards could impose compliance costs of $90 billion.
As we will hear from today’s witnesses, the Agency is now con-sidering setting the NAAQS either at or below naturally occurring background levels in many parts of the country. This means two things. First, these areas will be out of compliance with the Clean Air Act through no fault of their own. And second, with no way to comply, these areas will face significant regulatory hurdles, with little to no environmental benefit.
A nonattainment designation under the Clean Air Act has seri-ous consequences. Additional permitting and compliance obliga-tions could halt any business expansion or new economic develop-ment. And with limits on Federal highway funding, nonattainment areas would also suffer direct Federal sanctions that will harm their ability to make critical infrastructure investments.
The effects could be devastating. Looking at EPA’s monitoring data, we see that if EPA lowers the ozone standards to 60 parts per billion, over 90 percent of the U.S. population could live or work in a nonattainment area. Many communities still struggle to meet the standards that were set in 2008. In these tough economic times, tighter regulations would put an additional burden on the backs of hardworking American families. Businesses and commu-nities across the country protested EPA’s efforts to tighten these standards in 2010, and such concerns eventually forced President Obama to withdraw the proposal, a decision that is best remem-bered by former White House Chief of Staff Bill Dailey’s asking, ‘‘What are the health effects of unemployment?’’
I am once again concerned that without transparency, the EPA has incentive to further inflate the health benefit claims associated with tighter ozone standards, and alarmingly, the Agency may ex-aggerate benefits using undisclosed data with highly questionable results. For two years this Committee has asked the EPA for ac-cess to the data that supports two federally funded studies: the Cancer Prevention Study and the Harvard Six Cities Study. This data’s significance goes well beyond the ozone standards we now consider. It forms the basis for nearly all benefit claims from Clean Air Act rulemaking in this Administration and a disproportionate share of overall Federal regulatory benefit claims. In other words, the EPA has refused to provide the data that supports a majority of regulatory benefit claims, and the EPA has repeatedly failed to respond to Congressional requests to make the underlying data publicly available. To the extent that any information has been pro-vided, it contains significant gaps that make full replication and validation of the studies’ original results impossible. Further, these

16
studies are decades old and have not been comprehensively up-dated. Even the National Research Council in 2004 cautioned that these studies, ‘‘have little use for decision making.’’ That the agen-cy now attempts to use this data set to justify new onerous regula-tions is unjustified.
Today I will send a letter to the Acting EPA Administrator cau-tioning the Agency not to rely on studies based on these data in the ozone rulemaking. I am also once again asking the Agency to release the underlying data in a manner that is sufficient for inde-pendent analysis. If the Agency continues to ignore this request, the Committee will be forced to resort to formal action to obtain its release.
Thank you, Mr. Chairman. I yield back. [The prepared statement of Mr. Smith follows:]
PREPARED STATEMENT OF CHAIRMAN LAMAR S. SMITH
Today’s hearing comes at a critical time. The Environmental Protection Agency (EPA) is now reviewing the science that it will use to determine whether to revise or retain the National Ambient Air Quality Standards for ozone.
This decision has significant implications that will drive regulatory requirements across the country and will have a significant impact on the economy. In 2010, the EPA itself estimated that revised ozone standards could impose compliance costs of $90 billion.
As we will hear from today’s witnesses, the Agency is now considering setting the NAAQS either at, or below, naturally occurring background levels in many parts of the country. This means two things: First, these areas will be out of compliance with the Clean Air Act through no fault of their own. And second, with no way to comply, these areas will face significant regulatory hurdles—with little to no envi-ronmental benefit.
A nonattainment designation under the Clean Air Act has serious consequences. Additional permitting and compliance obligations could halt any business expansion or new economic development.
And with limits on federal highway funding, nonattainment areas would also suf-fer direct federal sanctions that will harm their ability to make critical infrastruc-ture investments.
The effects could be devastating. Looking at EPA’s monitoring data, we see that if EPA lowers the ozone standards to 60 parts per billion, over 90 percent of the U.S. population could live or work in a nonattainment area. Many communities still struggle to meet the standards that were set in 2008. In these tough economic times, tighter regulations would put an additional burden on the backs of hard- working American families. Businesses and communities across the country pro-tested EPA’s efforts to tighten these standards in 2010. And such concerns eventu-ally forced President Obama to withdraw the proposal—a decision that is best re-membered by former White House Chief of Staff Bill Dailey’s asking, ‘‘What are the health effects of unemployment?’’
I am once again concerned that without transparency, the EPA has incentive to further inflate the health benefit claims associated with tighter ozone standards. And alarmingly, the agency may exaggerate benefits using undisclosed data with highly questionable results.
For two years this Committee has asked EPA for access to the data that supports two federally-funded studies: the ‘‘Cancer Prevention Study’’ and the ‘‘Harvard Six Cities Study.’’ This data’s significance goes well beyond the ozone standards we now consider. It forms the basis for nearly all benefit claims from Clean Air Act rule-making in this Administration and a disproportionate share of overall federal regu-latory benefit claims.
In other words, the EPA has refused to provide the data that supports a majority of regulatory benefit claims. And the EPA has repeatedly failed to respond to Con-gressional requests to make the underlying data publicly available.
To the extent that any information has been provided, it contains significant gaps that make full replication and validation of the studies’ original results impossible. Further, these studies are decades old and have not been comprehensively updated. Even the National Research Council in 2004 cautioned that these studies, ‘‘have lit-

17
tle use for decision making.’’ That the agency now attempts to use this data set to justify new onerous regulations is unjustified.
Today I will send a letter to Acting EPA Administrator Bob Perciasepe cautioning the agency not to rely on studies based on these data in the ozone rulemaking. I am also, once again, asking the agency to release the underlying data in a manner that is sufficient for independent analysis. If the agency continues to ignore this re-quest, the Committee will be forced to resort to formal action to obtain its release.
Chairman STEWART. Thank you, Mr. Chairman. I now recognize the Ranking Member, the gentlelady from Texas,
Ms. Johnson, for an opening statement. Ms. JOHNSON. Thank you very much, Mr. Chairman, and thank
you for holding the hearing on the forthcoming National Ambient Air Quality Standards for ground-level ozone, and I want to thank all the witnesses for being here today.
As someone who has been in the public health field, I am keenly sensitive to the problem poor air quality can have on the health of our citizens, and especially the young and the infirm. As a country, we need to do all that we can to ensure that we have clean air to breathe. The EPA is at the forefront of protecting our citizens’ abil-ity to breathe clean air, whether it is in my home State of Texas or here in Washington, D.C. To do its job correctly, the EPA must invest in research, determining how pollutants occur and how they affect the health of our population. The EPA’s investment in sci-entific research helps achieve regulations which are the fairest and most cost-effective way of protecting our citizens from pollutants.
I am looking forward to the testimony from the EPA’s witness here today to explain the science behind the EPA’s Integrated Science Assessment of Ozone and Related Photochemical Oxidants. This report is another reminder of the importance of investing in research. If we are going to ask the EPA protect the public health and the environment we must give them the funding to carry out the best research, thereby ensuring that the scientific justifications for any regulations from the EPA are backed by the best science.
It has always seemed simple to me that protecting the health of our citizens ensures a stronger and more vibrant economy. I look forward to hearing about these new ozone air quality standards from our witnesses.
I thank you, and yield back. [The prepared statement of Ms. Johnson follows:]
PREPARED STATEMENT OF RANKING MEMBER EDDIE BERNICE JOHNSON
I want to thank Chairman Stewart for holding this hearing on the forthcoming National Ambient Air Quality Standards for ground level ozone and I want to thank the witnesses on the panel.
As someone who has been in the public health field, I am keenly sensitive to the problem poor air quality can have on the health of our citizens, especially the young and the infirm.
As a country, we need to do all that we can to ensure that we have clean air to breathe. The EPA is at the forefront of protecting our citizen’s ability to breathe clean air, whether it is in my home State of Texas or here in Washington, D.C. To do its job correctly, the EPA must invest in research, determining how pollutants occur and how they affect the health of our population. The EPA’s investment in scientific research helps achieve regulations which are the fairest and most cost-ef-fective way of protecting our citizens from pollutants.
I am looking forward to the testimony from the EPA’s witness here today to ex-plain the science behind the EPA’s Integrated Science Assessment of Ozone and Re-lated Photochemical Oxidants. This report is another reminder of the importance of investing in research.

18
If we are going to ask the EPA protect the public health and the environment we must give them the funding to carry out the best research; thereby ensuring that the scientific justifications for any regulations from the EPA are backed by the best science.
It has always seemed simple to me that protecting the health of our citizens en-sures a stronger and more vibrant economy. I look forward to hearing about these new ozone air quality standards from our witnesses today.
Chairman STEWART. Thank you, Ms. Johnson. And if there are Members who wish to submit additional opening
statements, your statements will be added to the record at this point.
At this time I would like to introduce our witnesses. Our first witness today I am proud to introduce here is Ms. Amanda Smith, Executive Director at the Utah Department of Environmental Quality. She is responsible for providing leadership to the depart-ment and to the State of Utah to carry out DEQ’s mission of safe-guarding human health and quality of life by protecting and en-hancing the environment. Prior to this, Amanda was a Legislative Director and Rural Advisor to Governor Huntsman. Amanda Smith received her law degree from Gonzaga University.
And as our witnesses should know, spoken testimony is limited to five minutes each after which Members of the Committee will have five minutes each to ask questions. I will introduce the subse-quent witnesses as they get a chance for their opening statements.
I now recognize Ms. Smith for five minutes to present her testi-mony.
TESTIMONY OF MS. AMANDA SMITH, EXECUTIVE DIRECTOR,
UTAH DEPARTMENT OF ENVIRONMENTAL QUALITY
Ms. SMITH. Mr. Chairman Stewart, Ranking Member Bonamici and Members of the Committee, my name is Amanda Smith. I am the Executive Director of the Utah Department of Environmental Quality.
Utah is fortunate to boast a high quality of life, a strong economy and a safe, clean environment. Governor Herbert has directed the Department to take a proactive approach to solve Utah’s air quality issues. From a strong idle reduction policy for state vehicles, to for-mation of the independent air quality organization, UCAIR, to ad-dress statewide air issues, to a multi-partner state-of-the-science wintertime ozone study, Utah has led.
I am speaking before you today to express Utah’s concerns about how the state will meet the ozone standard if it is lowered from 75 parts per billion. Surprisingly high ozone values have been meas-ured at rural monitors in Utah and even within National Parks. Similar high values have also been seen throughout the Inter-mountain West. In Utah, our work to date has focused on reduc-tions in urban areas, successfully reducing peak ozone levels to meet more stringent standards. However, in rural Utah, where there are few sources, ozone values have not been decreasing, rath-er values have remained fairly constant despite these significant reductions in emissions of ozone precursors in Utah and upwind states. National efforts to reduce ozone since the 1970s have fo-cused on the eastern United States and California, with the accom-

19
panying research, modeling and regulatory strategies designed to solve those problems. The 1990 Clean Air Act Amendments reflect that focus, and included specific strategies and deadlines to solve an urban ozone problem that was primarily caused by mobile sources. Only recently, as ozone standards have become more strin-gent, has attention been given to background ozone in the Inter-mountain West. Recent research shows significantly higher impacts in the West than in the rest of the country, with background ozone increasing every year. Wildfires and stratospheric ozone intrusions also contribute significantly to background ozone levels, and have a disproportionate impact on the Intermountain West. It is critical to recognize that the primary causes of high background ozone are beyond the control of the states.
Before moving forward with a more stringent ozone standard, EPA needs to have in place the necessary tools to allow states to succeed in meeting this standard. These tools could include poten-tial legislation, regulations, technical tools, and additional research on ozone formation and mitigation. Additionally, EPA must define paths forward on how attainment will be addressed through poli-cies such as exceptional events, policy-relevant background and rural transport area designation. Again, these tools were designed for the East Coast and currently are problematic and an ill fit for solving ozone in the rural Intermountain West.
Specifically, the exceptional-events policy has proven to be an im-possibly high hurdle to meet and eats up literally thousands of hours of critical staff time to develop each submission. Since 2008, Utah has submitted 12 exceptional-event demonstrations for partic-ulate matter that have required over 4,000 hours of technical work. None of those have been approved by Region 8. There were many other events, including ozone levels affected by wildfires that we did not even attempt to demonstrate as exceptional events because the technical criteria are too difficult to meet. If the exceptional- event process doesn’t work for particulate matter, it will not work for the complicated science behind rural background ozone. If EPA moves forward with a more stringent standard without workable measures to address background ozone, it will guarantee failure for Utah, leading to severe consequences for the state.
To put this in perspective, the Canyonlands monitor in San Juan County regularly measures ozone above 70 parts per billion, the upper end of EPA’s standard proposal. San Juan County is close to the size of New Jersey and has a population of about 14,000 peo-ple. If designated nonattainment, permitting regulations would re-quire existing sources to reduce emissions before new emission sources could be built, affecting economic development. If the standards are not met after that, more stringent strategies are re-quired with additional reductions in activities such traffic control measures, etc. These requirements would be nearly meaningless in reducing ozone and would have an exceptionally burdensome im-pact on an area of Utah with one of the highest rates of poverty.
The Department of Environmental Quality’s mission is to safe-guard public health and our quality of life by protecting and en-hancing the environment. We take that mission seriously. Trans-portation-focused measures in small rural communities will not be effective, nor will overly stringent controls applied to remote

20
sources. Setting an ozone standard that can’t be met will not im-prove public health.
Thank you, Chairman Stewart, Ranking Member Bonamici and Members of the Committee. I appreciate the time.
[The prepared statement of Ms. Smith follows:]

21
Amanda Smith, Executive Director Utah Department of Environmental Quality
Testimony before the
Sub-Committee on Environment of the
Committee on Science, Space and Technology
"Issues regarding background ozone levels, consequences of a non-attainment designation and the interpretation and background of policy relevant
background for ozone"
June 12, 2013

22
Amanda Smith Executive Director of Utah Department of Environmental Quality
Testimony before the
Sub-Committee on Environment of the Committee on Science, Space and Technology "Issues regarding background ozone levels, consequences of a non-attainment designation
and the interpretation and background of policy relevant backgroundfor ozone"
June 12,2013
Mr. Chairman Stewart, Ranking Member Bonamici and Members of the Committee: My name is Amanda Smith and I am the Executive Director of the Utah Department of Environmental Quality. Utah is fortunate to boast a high quality of life - a strong economy and a safe and clean environment. Governor Gary Herbert has directed the Department of Environmental Quality to take a pro-active approach to solve Utah's air quality issues. From a strong idle reduction policy for state vehicles, to formation of the independent air quality organization, "UCAIR," that addresses state-wide air issues, to a multi-partner state-of-the science wintertime ozone study - Utah has led.
I am speaking before you today to express Utah's concerns about how the state will meet the ozone standard if it is lowered from 75 ppb. Surprisingly high ozone values have been measured at rural monitors in Utah and even within National Parks. Similar high values have been seen throughout the Intermountain West. In Utah our work to date has focused on reductions in urban areas - successfully reducing peak ozone levels to meet more stringent standards. However, in rural Utah ozone values have not been decreasing, rather values have remained fairly constant despite these significant reductions in emissions of ozone precursors in Utah and upwind states.
National efforts to reduce ozone since the 1970s have focused on the eastern US and California, with accompanying research, modeling, and regulatory strategies designed to solve those problems. The 1990 Clean Air Act Amendments reflect that focus, and included specific strategies and deadlines to solve an urban ozone problem that was primarily caused by mobile sources. Only recently, as ozone standards have become more stringent, has attention been given to background ozone in the Intermountain West. Recent research shows significantly higher impacts in the Intermountain West than in the rest of the country, and these impacts are increasing every year. Wildfires and stratospheric ozone intrusions also contribute significantly to background ozone levels, and have a disproportionate impact on the Intermountain West. It is critical to recognize that the primary causes of high background ozone are beyond the control of the states.
Before moving forward with a more stringent ozone standard, EPA needs to have in place the necessary tools to alJow states to succeed in meeting this standard. Those tools would include;
1

23
potential legislation, regulations, technical tools, and additional research on ozone formation and mitigation. Additionally, EPA must have a defined path forward on how attainment will be addressed through policies such as exceptional events, policy relevant background and rural transport area designation. Again these tools were designed for the east coast and currently are problematic and an ill fit for solving ozone in the rural Intermountain West. Specifically, the exceptional events policy has proven to be an impossibly high hurdle to meet and one that eats literally thousands of hours of critical staff time to develop each submission. Since 2008 Utah has submitted 12 exceptional event demonstrations for particulate matter, requiring about 4,000 hours of technical work, that have not been approved by Region 8. There were many other events, including ozone levels affected by western wildfires that we did not even attempt to demonstrate as exceptional events because the technical criteria were too difficult to meet. Ifthe exceptional event process doesn't work for pa11iculate matter - it certainly won't work for the complicated science behind rural background ozone. If EPA moves forward with a more stringent standard without workable measures to address background ozone, it will guarantee failure for Utah, leading to severe consequences for the state.
To put this in perspective, the Canyonlands monitor in San Juan County, Utah regularly measures ozone above 70 ppb, the upper end of EPA's standard proposal. San Juan County is close to the size of the state of New Jersey with a population of 14,413. Ifdesignated nonattainment, permitting regulations would require existing sources to reduce emissions before new emission sources could be built, affecting economic devclopment in the area because there are few existing sources. If the standard is not met, increasingly more stringent strategies are required including a mandatory 15% reduction in VOC, vehicle emission programs, fuel reformulations, reasonably achievable control technology for stationary sources and traffic control measures. These requirements would be nearly meaningless in reducing ozone and would be exceptionally burdensome on an area of Utah with one of the highest rates of poverty.
The Department of Environmental Quality'S mission is to safeguard public health and our quality oflife by protecting and enhancing the environment. We take that mission seriously, and the public health impacts of ozone are important to address. We want to ensure that our efforts arc focused on emission reduction strategies that are effective and appropriate in reducing ozone levels without requiring difficult, expensive measures that make no sense. Transportationfocused measures in small rural communities will not be effective, nor will overly stringent controls applied to remote industrial sources. Setting an ozone standard that can't be met won't improve public health in Utah.
The Subcommittee asked the Utah Department of Environmental Quality to address three specific questions. The remainder of this written testimony provides more detail regarding the specific elements that relate to those three questions.
2

24
1. Describe the Utah Department of Environmental Quality's assessment of background ozone conceutratious and their import relative to the National Ambient Air Quality Staudards (NAAQS), including the consequences of a "nonattainment designation."
IUi9
0.07
IlOJ
!t02
Ozone levels in the intermountain west are not decreasing as much as would be expected based on the significant emission reductions that have occurred over the last twenty years. Figure 1 shows ozone trends at rural western national parks. Many of these parks, such as Canyonlands in Utah, are located far from any significant emission sources. The current ozone standard is shown, as well as the range of potential ozone standards that had been proposed during EPA's 2010 reconsideration of the 2008 ozone standard. As can be seen from this figure, ozone values have remained fairly constant over the last 20 years and are routinely above the proposed range of 60 to 70 ppb (.060 to .070 ppm). It is also apparent from this figure that the problem is widespread throughout the intermountain west and is not limited to parks that are close to urban areas or to energyproducing areas.
4th High, Dally Maximum Ozone Value at Rural Monitors
(Source EPA AirData)
FIGURE 1
The eastern US has seen significant improvements in ozone. One of the major ozone strategies to reduce regional ozone levels in the eastern US has been to reduce nitrogen oxide (NOx) emissions from power plants. Federal motor vehicle standards and non-road engine standards have also reduced NOx emissions substantially throughout the country. As a result ofthese significant emission reductions ozone levels have been improving throughout the eastern US. Equivalent NOx emission reductions have also
3

25
been occurring at western power plants as can be seen in Figure 2, and mobile source emission reductions have also been substantial, but there have not been corresponding decreases in ozone levels in the west.
Western State Power Plant Emissions Trends
III III III III A..
;:00,00II
A-- ~·III~ '~~
" .... III " ..
III ~ .. ~ ..
III lit S01(1p;)
III III
200,00II __ "O:t{IpJ) iii
150,00II
Data from EPA CIl'lIIDAir llarketsDivisioll
FIGURE 2 One explanation of ozone trends in the intermountain west is that US anthropogenic emissions are only part of the problem. Current research suggests that increased international ozone transport is counteracting domestic emissions reductions in the west (Cooper, et. al. Long-term ozone trends at rural ozone monitoring sites across the United States, 1990-2010, J. Geophys. Res., 117).
High background concentrations may have an even greater impact when evaluating seasonal ozone levels. In the 2010 reconsideration of the ozone standard EPA proposed a new metric called the WI26 that is designed to measure ozone over a 3 month period and during daylight hours to protect vegetation during the growing period. Figure 3 shows a map prepared by EPA showing counties with monitors that would have violated the proposed secondary standard. As can be seen from this map, a large portion of the intermountain west would not attain the standard. It is important to realize that the white
4
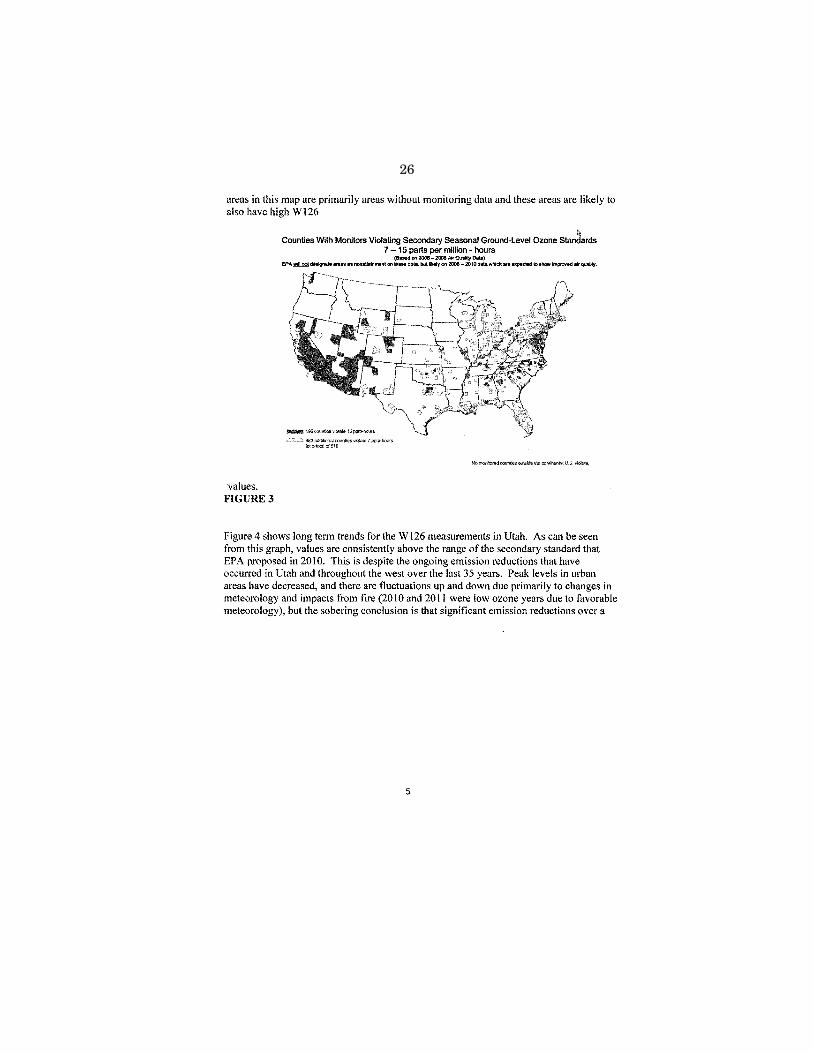
26
areas in this map are primarily areas without monitoring data and these areas are likely to also have high W126
values. FIGURE 3
f< Counties With Monitors Violating Secondary Seasonal Ground-Level Ozone Standards
7 - 15 parts per million - hours (Based on 2006 -2008 AifOu8lity Data)
EPAd...J:K!I: designate areas &$ nonattainlTlltllt on these data, 1M likely on 2008 - 2010 data WfIk:h are expected to show irnpJOYed alrquaJity.
_100oo~violAtef5wm4lourn
\Je3i!dd1tioM!WUflI\e$<A-!law7~rs lora lOtaI o! 5<9
Figure 4 shows long term trends for the W 126 measurements in Utah. As can be seen from this graph, values are consistently above the range of the secondary standard that EPA proposed in 2010. This is despite the ongoing emission reductions that have occurred in Utah and throughout the west over the last 35 years. Peak levels in urban areas have decreased, and there are fluctuations up and down due primarily to changes in meteorology and impacts from fire (2010 and 2011 were low ozone years due to favorable meteorology), but the sobering conclusion is that significant emission reductions over a
5

27
long time period have had little impact on seasonal ozone levels.
Utah W126 Annual Trend
1975 1995 2""
(Source: EPA Air Quality Systems (AQS»
FIGURE 4
Utah has little experience with developing a SIP for a secondary standard and the implications of this standard are therefore unclear. Ultimately, the secondary standard may be more difficult to meet in the intermountain west than the primary standard. The consequences prescribed in the Clean Air Act of a nonattainment designation can be severe for an area.
o Nonattainment area permitting rules require offsetting emission reductions for any new major source in a nonattainment area. The reductions must occur within the nonattainment area. EPA had tried to allow some flexibility to allow reductions from other areas that impact the nonattainment area, but this flexibility was overturned by recent court decisions. These rules would effectively prevent development in rural areas that are designated nonattainment because there are no existing sources that could provide this offset. For example, the Canyonlands monitor in San Juan County Utah has measured ozone levels above 70 ppb, the upper end of EPA's recent ozone standard proposals. San Juan County is 7,933 sq miles, the largest county in the state. This is close to the size of the entire state of New Jersey (8,722 sq miles). The population for the entire county was 14,413 in 2005. The point source inventory for this entire county is less than 400 tons/yr NOx and less than 100 tons/yr VOc. Economic opportunity in this part of Utah, including portions of the Navajo Nation, could be stifled because there would be
6

28
no possibility to construct a new major source even though ozone levels at Canyonlands are not caused by local emissions.
o The Clean Air Act provides some flexibility for Rural Transport Areas. In these areas, the nonattainment permitting requirements must be met, but other mandatory measures that were designed for urban areas do not apply. Unfortunately, because ofthe large county sizes in western states, large areas do not qualify as Rural Transport Areas because the definition in the Clean Air Act excludes any areas that are part of a metropolitan statistical area (MSA) or consolidated statistical area (CSA) or that are adjacent to an MSA or CSA. As can be seen in Figure 5 below, the Salt Lake City CSA excludes most of northern Utah, as well as half of the state of Nevada, even though many of these areas are clearly rural. The scattered MSAs throughout the intermountain west effectively exclude most areas from being considered Rural Transport Areas under the Clean
7

29
Air Act.
FIGURES
Counties in Utah and Surrounding States that would not qualify as Rural Transport Areas
under Section 182(h) ofthe CM
GSA Counties MSACounties Adjacent Counties Rural Transport Areas
o Mandatory measures are established for moderate, serious, severe, and extreme ozone nonattainment areas. If an area starts as a marginal area but is not able to attain the standard it is progressively bumped up to a higher classification over time, requiring progressively more stringent control measures even if those measures do not help the ozone problem in the area. These measures include a 15% mandatory voe reduction for moderate areas followed by a 3% reduction
8

30
per year for serious and above areas, vehicle emission and inspection programs, fuel reformulations, reasonably available control technology requirements for stationary sources, and traffic control measures. These measures make little sense in rural western counties, may be impossible to implement, and may do little to reduce ozone levels even in the urban areas where background levels are high. In rural areas where biogenic (natural source) emissions are the majority of the inventory, the mandatory VOC reductions are especially problematic because reductions in anthropogenic VOC are unlikely to have any effect on ambient ozone concentrations.
a If an area is unable to attain a NAAQS, mandatory sanctions apply to highway funding for the state. These sanctions would have severe consequence on an area that had no ability to solve the underlying ozone problem.
There is a significant correlation between high wildfire years and high ozone years in the western US.
a EPA has indicated that this impact could potentially be addressed through the exceptional event process used to exclude infrequent exceedances of the standard that do not have an anthropogenic origin, but this is problematic for several reasons.
The technical demonstrations that are required to demonstrate that high pollution levels are due to an exceptional event are extensive and it has been very difficult to get EPA concurrence, even for relatively straightforward cases of particulate matter exccedances caused by high wind events. Utah does not have the resources to develop an exceptional event demonstration for every potential event during a high fire year. EPA would need corresponding resources to review the demonstrations and would also need to implement internal policies to ensure that demonstrations could be approved. During a high fire year, it is likely that many days or weeks could be affectcd by fire smoke and it would strain the exceptional event process to address longer-term events. During high fire years, there are likely regional impacts that affect multiple states, and the current exceptional event process is best suited to address local impacts within a single state's jurisdiction. High ozone values may also occur at monitors that are not operated by the State, such as CASTNET monitors run by the National Park Service or tribal monitors. States do not have the ability to flag exceptional events at those monitors and the entities that are responsible for the data may not have the resources or the desire to prepare an exceptional event demonstration.
2. Discuss recent developments in scientific issues regarding background ozone levels in the United States, including summarizing the relevant portions of EPA's Integrated Science Assessment of Ozone and Related Photochemical Oxidants.
9

31
EPA has been studying ozone in the eastcrn US for decades, and the mechanisms of ozone formation and transport pathways are well understood there. This process is just beginning in the western US where mountainous topography, unique meteorology, forest fires, stratospheric intrusion, distinct emissions sources, highly variable emissions density, and international transport play important roles in ozone formation. Unfortunately, just at the time when improved models, emission inventories, and research on western ozone issues are needed, EPA is facing funding constraints that will limit its ability to support new technical work, and will likely decrease their current efforts. Funding is also decreasing for important research activities at the National Oceanic and Atmospheric Administration (NOAA) and for grants to support research at universities. States such as Utah do not have the resources to make up for the decreases in federal funding for these important technical tools. Emissions from Asia are affecting ozone levels in the western US, especially in the spring, and this impact is increasing. Cooper, 2010 estimated an increase of 0.63 ppbv per year, which would be around 6 ppb over ten years, a significant amount when compared to the current ozone standard of75 ppb. This Asian impact is often cited as the reason the west is not seeing the reductions in ozone trends over the last 20 years that have been observed in the eastern states.
o Increasing springtime ozone mbcing ratios in the free troposphere over western North America, O. R. Cooper, et aI., published in Nature (Vol 463, January 21, 20 I 0). This paper examines the influence of Asian transported ozone to the western North America. The rate of increase in ozone concentrations over the last 20 years is greatest when measurements are more heavily influenced by direct transport from Asia with an average increase of 0.63 ppbv/yr. The paper suggests that western North America is particularly sensitive to rising Asian emissions and that the observed increase in springtime background concentrations may hinder compliance with its ozone air quality standard.
o Long-term ozone trendy at rural ozone monitoring sites across the United States, 1990--2010, Cooper, O. R., R.-S. Gao, D. Tarasick, T. Leblanc, and C. Sweeney (2012), J. Geophys. Res. (Vol 117, Issue 022, 27, November 2012). The paper reports on long term ozone trends (1990-2010) aeross the US and finds that while eastern sites arc generally seeing decreases in ozone concentrations as a results national emissions controls, the western sites are not. The paper discusses the concept that increasing background ozone flowing into the western U.S. is counteracting ozone reductions due to domestic emission reductions.
Western wildfires significantly affect ozone levels throughout the intermountain west. This impact is highly variable and can positively or in some cases negatively affect ozone formation as the fire emissions plume ages. Though complex, understanding this impact is increasingly important as the ozone standard is lowered. Ozone production from wildfires: A critical review, Daniel A. Jaffe and Nicole Wigder, Atmospheric Environment, Vol 51 (2012) 1-10. Ozone levels can be signifieantly elevated due to "stratospheric intrusions" under specific meteorological conditions. This phenomenon typically occurs in spring and summer seasons in mountainous terrain where energetic storm systems can fold a pocket of
10

32
stratospheric ozone into the lower troposphere (ozone levels are much higher in the stratospherc). This entrained ozone can radically increase ozone levels locally and significantly increase surface level ozone over multi-state regions downwind of the event. Researchers have found that stratospheric intrusion can playa major role (at times reaching 50 - 60 percent) in elevating springtime high ozone events over high altitude western US, posing a challenge for staying below the ozone standards, particularly if a standard in the range of 60 - 70 ppb were adopted. Springtime high sUlface ozone events over the western United States: QuantifYing the role of stratospheric intrusions, Lin M., A. M. Fiore, O. R. Cooper, L. W. Horowitz, A. O. Langford, Hiram Levy II, B. J. Johnson, V. Naik, S. J. Oltmans, C. Senff, Journal of Geophysical Research, Vol 117, November 2012. Ozone increases with elevation. This effect is due to the fact the ozone increases vertically through the lower atmosphere (troposphere). Near-surface ozone tends to be titrated by oxides of nitrogen released from sources at the surface and subject to other scavenging processes while ozone aloft can be enhanced by stratospheric ozone intrusion and ozone that has been transported long distances without loss. Mountainous terrain pushing into this ozone aloft can experience higher ozone concentrations.
3. Discuss the interpretation of background and "policy relevant background" for ozoue in the NAAQS process.
Background ozone is important to consider in addressing ozone. In general, it refers to the level of ozone that is not controllable by a regulatory agency and would include ozone precursor emissions from biogenic and other non-anthropogenic sources. It could also include precursor emissions from anthropogenic sources that are not domestic to the US. This latter definition is termed policy relevant background (PRB). PRB is determined using a photochemical transport model. PBR from non-anthropogenic sources is not constant. It varies from season to season and from episode to episode. It also varies from place to place. In the Integrated Science Assessment for the current ozone NAAQS review, EPA uses the mean PRB for broad regions and this may not be reflective of the PRB that is occurring during high ozone episodes in the intermountain west. PRB increases with elevation. Higher ozone levels in the upper troposphere are more readily mixed to ground level at higher elevations and this could be an important factor in ozone levels in mountain communities and also higher elevation forests that may be evaluated as part of the secondary standard. While the concept of PRB considers the impact from international sources, there is no mechanism to address impact that is increasing. Asian emissions are increasing background ozone concentrations in the intermountain west in the spring. Cooper (Nature, 2010) estimated an average increase of 0.63 ppbv/yr from 1995-2008. EPA is considering the current impact from Asia through the concept of PRB, but once the NAAQS is finalized next year, the standard will be set even though the PRB continues to increase.
11

33
Modeling to detennine PRB has shown the highest values to occur in the intennountain west where the 4th high values are estimated to be 50 - 60 ppb. "The high PRB values in that region compared to the proposed revisions of the ozone NAAQS (60 - 70 ppbv) suggest that special consideration may be needed in the NAAQS-setting process." Improved estimate of the policy-relevant background ozone in the United States using the GEOS-Chem global model with % x % horizontal resolution over North America, Atmospheric Environment, Vol 45, (2011) 6769-6776.
Recommendation The Utah Department of Environmental Quality does not have a specific recommendation about how EPA should address the issue of background ozone levels in the intennountain west. EPA could address this issue through the standard setting process, as has been done in the past using
the concept of policy relevant background, or EPA could address it by changing how the ozone standard is implemented. The key point is that mechanisms to account for background ozone that can't be controlled must be in place, including technical and regulatory tools, before a more stringent ozone standard is finalized. Funding is also needed to improve the technical tools that are available to western states when developing their SIPS, and funding is also needed to support the important research that is currently underway to better understand the causes of background ozone in the intennountain west. Otherwise, states such as Utah will not be able to develop successful state implementation plans and will be essentially set up for failure.
12
34
Chairman STEWART. Thank you, Ms. Smith. Our second witness today then is Mr. Samuel Oltmans, Research
Associate with the Cooperative Institute for Research in the Envi-ronmental Sciences at the University of Colorado at Boulder. This is a joint institute between the University of Colorado and the Na-tional Oceanic and Atmospheric Administration. Mr. Oltmans con-ducted atmospheric and environmental research for NOAA and its predecessors for nearly 40 years—and sir, you don’t look that old. I find that hard to believe—and was the Chief of the Ozone and Water Vapor Group of NOAA’s Earth Systems Research Lab for 15 years. Mr. Oltmans pursued graduate studies in astrogeophysics at the University of Colorado.
Mr. Oltmans, for your testimony then.
TESTIMONY OF MR. SAMUEL OLTMANS, SENIOR RESEARCH ASSOCIATE,
COOPERATIVE INSTITUTE FOR RESEARCH IN THE ENVIRONMENTAL SCIENCES,
UNIVERSITY OF COLORADO, AND EARTH SYSTEM RESEARCH LABORATORY
GLOBAL MONITORING DIVISION
Mr. OLTMANS. Chairman Stewart, Ranking Member Bonamici, honorable Members. My name is Sam Oltmans, and I am a Re-search Associate at the University of Colorado. Thank you for this opportunity to present recent developments both from an observa-tional and modeling perspective in our understanding of back-ground ozone and its relevance in determining an ozone standard as part of the National Ambient Air Quality Standards process.
In the previous review of the ozone standard culminating in the current form of the standard with a maximum daily eight hour av-erage of 75 parts per billion background ozone, or as it was re-ferred to as policy-relevant background, was based solely on an at-mospheric modeling exercise from a single global model. At that time, empirical observations representing background ozone sug-gested levels higher than those determined by the model, but these were not given significant weight by the EPA and its Clean Air Sci-entific Advisory Committee in determining background ozone lev-els.
As part of the review of the ozone standard currently underway, the Integrated Science Assessment refers to several terms to des-ignate background ozone including North American background and U.S. background. The term ‘‘policy relevant background’’, or PRB, used in early discussions has generally been abandoned. This is a positive step, in my mind, since it at least implies that back-ground ozone can be assessed from relevant observations rather than being simply a model construct.
Consideration of U.S. background reflects the reality that the United States has no regulatory control of pollution sources beyond its borders. Recent studies, including our own, have shown that several key sites at or near the West Coast of the United States regularly provide observational data that represent background ozone levels. Two sites have been extensively studied that include

35
Trinidad Head, a marine boundary layer site in northern Cali-fornia, and Mount Bachelor, a higher altitude location in Oregon. At Trinidad Head, springtime daily eight hour maximum ozone concentrations exceed 45 parts per billion one quarter of the time. At Mt. Bachelor, May ozone levels are higher than 60 ppb 25 per-cent of the time. These observations suggest that background ozone could be substantial—could be a substantial contribution at sites where ozone is measured near the NAAQS standard. Contribu-tion—I will show that recent modeling results also support this conclusion.
In the current Integrated Science Assessment, a comparison of the model-derived ozone values for determining background ozone for the assessment is significantly lower than the observed values, as you can see in the slide. This suggests background ozone is un-derestimated in the model since at Trinidad Head, ozone levels under conditions representative of background are almost always higher than non-background conditions.
Recent work led by Dr. Meiyun Lin at the Geophysical Research Laboratory and Princeton University and collaborators, including myself, is a major advance within the modeling framework in the ability to quantify the contributions to background ozone. This new work by Lin and coauthors published last year dramatically rein-forces the important contribution of North American background ozone, including a significant stratospheric component, on 8-hour average concentrations at or near current air quality standard lev-els. Unlike the modeling work used in EPA assessments, the GFDL model explicitly simulates ozone variability in the lower strato-sphere and its dynamic coupling with the troposphere, as opposed to using a parameterized formulation. Based on this model, esti-mates of stratospheric impacts on surface ozone over the western United States are generally higher, and up to two to three times greater during intrusions than previous model estimates. This find-ing is in notable contrast to prior work concluding that strato-spheric influence on surface ozone concentrations is rare. It should also be pointed out that these findings show that the influence of ozone transported from the stratosphere is not limited to episodes categorized as exceptional events.
In summary, the work of Lin and coauthors shows that back-ground ozone concentration contributes on average about 40 parts per billion to measured ozone in the Mountain West. A significant portion of the time, background ozone exceeds 50 ppb under high measured ozone conditions. Based on these recent results, the EPA and the Ozone Panel of CASAC should take cognizance of the underestimates of background levels described in the Assessment and utilize the more realistic estimates of background ozone avail-able. These more realistic estimates should be used when devel-oping the Human Health Risk and Exposure Assessment, Welfare Risk and Exposure Assessment, and Policy Assessment documents that will play a role in the determination of the recommended ozone health and welfare standards.
[The prepared statement of Mr. Oltmans follows:]

36
(Slide) My name is Sam Oltmans and I am a Research Associate at the Cooperative Institute for Research in the Environmental Sciences at the University
of Colorado in Boulder. I am speaking on my own behalf.
Thank you for this opportunity to present recent developments, both from an observational and modeling perspective, in our understanding of background ozone and its relevance in determining an ozone standard as part of the National Ambient Air Quality Standards process. In the previous review of the ozone standard culminating in the current form of the standard with a maximum daily 8-hour average of75 ppb, background ozone (or as it was referred to as "policy relevant background") was based solely on an atmospheric modeling exercise from a single global model. At that time, empirical observations representing background ozone suggested levels higher than those determined by the model, but these were not given significant weight by the EPA and its Clean Air Scientific Advisory Committee (CASAC) in determining background ozone levels.
As part of the review of the ozone standard currently underway, the Intergrated Science Assessment (or ISA) refers to several terms to designate background ozone including North American Background and U.S. Background. The term "Policy Relevant Background" or PRB used in earlier discussions has generally been abandoned. This is a positive step since it at least implies that background ozone can be assessed from relevant observations rather than being simply a model construct. Consideration of U.S. Background reflects the reality that the U.S. has no regulatory control of pollution sources beyond its borders. Recent studies, including our own, have shown that several key sites at or near the west coast of the U.S. regularly provide observational data that represent background ozone levels. Two sites that have been extensively studied include Trinidad Head, a marine boundary layer site in northern California, and Mount Bachelor, a higher altitude location in Oregon. (Slide) At Trinidad Head, springtime daily 8-hour maximum ozone concentrations exceed 45 ppb one quarter of the time. At Mt. Bachelor, May ozone levels are higher than 60 ppb 25% ofthe time. These
observations suggest that background ozone could be a substantial contribution at
sites where ozone is measured near the current NAAQS standard of 75 ppb or if a lower standard were implemented. I will show that recent modeling results also
support this conclusion.

37
In the current Integrated Science Assessment, a comparison of the model-derived background ozone values at Trinidad Head from the most recent version of the global photochemical model used for determining background ozone for the Assessment is significantly lower than observed values (Slide). This suggests background ozone is underestimated in the model since at Trinidad Head ozone levels under conditions representative of background are almost always higher than non-background conditions.
Recent work led by Dr. Meiyun Lin at the Geophysical Fluid Dynamics Laboratory (GFDL) and Princeton University and collaborators including myself is a major advance within the modeling framework in the ability to quantify the contributions to background ozone. {I have included a copy the publication in my written remarks.}
This new work by Lin and coauthors published last year dramatically reinforces the important contribution of North American background ozone, including a significant stratospheric component, on 8-hour average concentrations at or near current air quality standard levels. (Slide) In particular, during the spring and early summer, background ozone over the western U.S. is routinely elevated by input from the stratosphere and other contributions. These findings emphasize the need to provide a balanced view on the contributions to background ozone and a proper attribution of background ozone in determining human health and welfare risk.
Unlike the modeling work used in EPA assessments, the GFDL AM3 Global Chemical Transport Model explicitly simulates 0 3 variability in the lower stratosphere and its dynamic coupling with the troposphere, as opposed to using a parameterized formulation or a climatological stratosphere. Based on the AM3 model, estimates of stratospheric impacts on springtime surface 0 3 over the western U.S. are generally higher on average, and up to 2-3 times greater during the intrusions, than previous model estimates. This finding is in notable contrast to
prior work concluding that stratospheric influence on surface ozone concentrations is rare. The Lin analysis implies that during springtime background ozone will
influence surface ozone concentrations in the U.S. Mountain West such that the 0 3
National Ambient Air Quality Standard may regularly be violated.

38
It should also be pointed that these findings show that the influence of 0 3
transported from the stratosphere is not limited to episodes categorized as
"exceptional events". Stratospheric 0 3 intrusions that lead to an "exceptional
event", in other words an exceedance of the standard by a naturally occurring
event, are one example of 0 3 transported from the stratosphere to ground level.
However, the contribution from the stratosphere to background 0 3 levels at more
modest levels is very significant and also plays an important role in high ozone
events. This contribution to background levels is important in assessing human
health and welfare risk.
(Slide) In summary, the work of Lin and coauthors shows that background ozone
contributes on average about 40 ppb to measured ozone in the Mountain West
during the spring and early summer when measured levels exceed about 60 ppb. A
significant portion of the time background ozone exceeds 50 ppb under high
measured ozone conditions. With these relatively high contributions from
background ozone, an ozone standard needs to be set at a level that allows
regulatory controls of pres cursor emissions to achieve success in meeting the
standard. At a standard less than 70 ppb, achieving the standard over a broad
portion of the western U.S. with current background ozone levels would be very
difficult. It should be noted that while high background ozone levels are a
particular problem for the western U.S., conditions exist in other parts of the
country during some times of the year when background contributes significantly
to ozone under exceedance or near exceedance conditions. Based on these recent results, the EPA and the Ozone Panel of CASAC should take cognizance of the
underestimates of background levels described in the Integrated Science
Assessment Document and utilize the more realistic estimates of background
ozone available. These more realistic estimates should be used when developing
the Human Health Risk and Exposure Assessment, Welfare Risk and Exposure
Assessment, and Policy Assessment Documents that will playa role in the
determination ofthe recommended ozone health and welfare standards.

39
References:
Lin, M., AM. Fiore, O.R. Cooper, L.W. Horowitz, AO. Langford, H. Levy II, B.J. Johnson, V. Naik, SJ. Oltmans, and CJ. Senff(2012), Springtime high surface ozone events over the western United States: Quantifying the role of stratospheric intrusions, J. Geophys. Res., 117, DOOV22, doi: 10.1 029/20 12JDO 18151.
McDonald-Buller, E.C., D.T. Allen, N. Brown, DJ. Jacob, D. Jaffe, C.E. Kolb, AS. Lefohn, S. Oltmans, D.D. Parish, G. Yarwood, and L. Zhang (2011), Establishing policy relevant background (PRB) ozone concentrations in the United
States, Environ. Sci. Technol., 45, doi:1O.l0211es2022918, 9484-9497.
Oltmans, S.J., AS. Lefohn, J.M. Harris, and D.S. Shadwick (2008), Background ozone levels of air entering the west coast ofthe U.S. and assessment oflonger
term changes, Almos. Environ.,42, doi: 1 0.1016/j.atmosenv.2008.03.034, 6020-6038.

40

41
Trinidad Head, California
~~~~~~$$$~~~ ~1 J 'F i M i A 'M' J 'J i A 's ' 0 I N 'D
MONTH
gi
~ ~ ~ ~ ~ jri'~';'jO; ~1J 'F'M'A'M'J 'J iAisiorr\C'~D
MONTH
1) Background ozone as only from however, there are make observations conditions background. At Trinidad Head boundary layer daytime 8-hr ozone exceeds 45 ppb 250/0 of time.
3) At Mt. Bachelor site) in May ozone levels exceed 60 ppb 250/0 ot

42

43
MDA8 = Maximum Daily 8·hr Average
• The GfDl AM3 model captures high 0 3 events • NA Background 0 3 and its stratospheric component
increases with increasing up to the of • NA Background largest the 50-80 • Stratospheric 0 3 more
Asian anthropogenic

44

45
Informing North American Background Ozone from Observations
and Recent Modeling Results
Sam Oltmans
Cooperative Institute for Researh in the Environmental Sciences (CIRES)
University of Colorado Boulder, Colorado

46
Surface ozone at Trinidad Head and Mt. Bachelor under conditions representative of background ozone
Trinidad Head, California :go
:;;::-g 1f18 ~~ ~~ <.!> !ii! z>O
~~ ~1Q 2g o~
~~~~~$$$~~~~ ~ T-i-----r--.... ----r--i--,,---r---:;c-T-:;.--.;--T---;---T---i----T- ... -----l-- .... ---l----..... ---,-,.-.----r-p,;
MONTH
~ Mt. Bachelor, Oregon
I!~~~~~~~~~~~~ :z .,
~~1 ~~ ~~
MONTH
Diamond ::: Mean Horizontal line Inside Box::: Median
Box ::: Inner 50th Percentile (25th & 75th)
Whiskers::: Inner 90th Percentile (5th & 95th)
are make observations conditions .. "" ........ background. At Head (a
daytime (or 8-hr ozone exceeds 45 time.
3) At Mt. Bachelor (a site) in May ozone
ot

47
Comparison of Observations with Model Results
::c 100 0. Sao o +:: (II 60
0::
g> 40 'x :i 20 '" o
Trinidad Head, CA (41 N, 124W, 107m)
o llq*qlq'iiUQllli"llllI,dq!II,,*!Slq!!llliIIIH'PQ
Mar Apr May Jun Jul Aug
The modeled 0 3 (red) is NS ppb less than observed (black) and background (blue) is Nl0 ppb less than observed in the spring.
Comparison of daily maximum 8-h average 0 3 predicted using GEOS-Chem at 0.50 x 0.6670 with measurements at Trinidad Head, CA from March to August 2006. Source: US EPA (20l2a).
This comparison suggests the model underestimates the background ozone levels since observed ozone at Trinidad Head under conditions representative of background is almost always higher than non-background conditions.
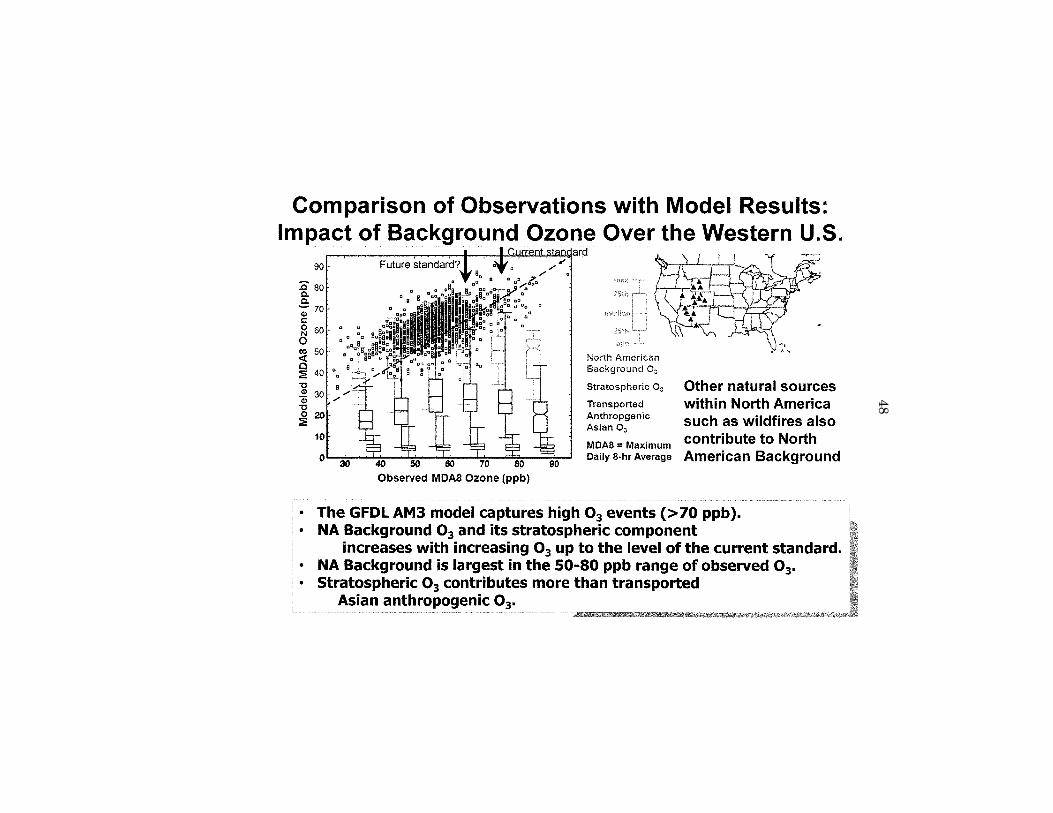
48
Comparison of Observations with Model Results: Impact of Background Ozone Over the Western U.S.
90
:Q 80 c. c. -; 70 c: 2 60 o ~ 50
~ 40~·. "'0 .! 30 Q)
"'0 o :a:
, I , I ClJf~nt ~\anQard ~ I
Observed MOA8 Ozone (ppb)
North American Background 0 3
Stratospheric 0 3
Transported Anthropgenic Asian 0 3
MDA8 = Maximum Daily 8·hr Average
Other natural sources within North America such as wildfires also contribute to North American Background
• The GFDL AM3 model captures high 0 3 events (>70 ppb). • NA Background 0 3 and its stratospheric component
increases with increasing 0 3 up to the level of the current standard. • NA Background is largest in the 50-80 ppb range of observed 0 3•
• Stratospheric 0 3 contributes more than transported Asian anthropogenic 0 3•

49
Final Points
• Observations at sites monitoring air entering the west coast of the U.S. regularly measure air under conditions representative of North American background - these measurements provide useful contraints on modeled background ozone.
• Current model estimates used by the EPA for estimating background ozone likely underestimate background over the western U.S.
• Unlike earlier work, recent model results suggest that background ozone has a greater contribution from stratospheric sources and that background can contribute substantially to measured ozone during high ozone events.
• Background ozone levels in the western U.S. leave limited opportunity for regulatory compliance for an ozone standard much below the current standard.
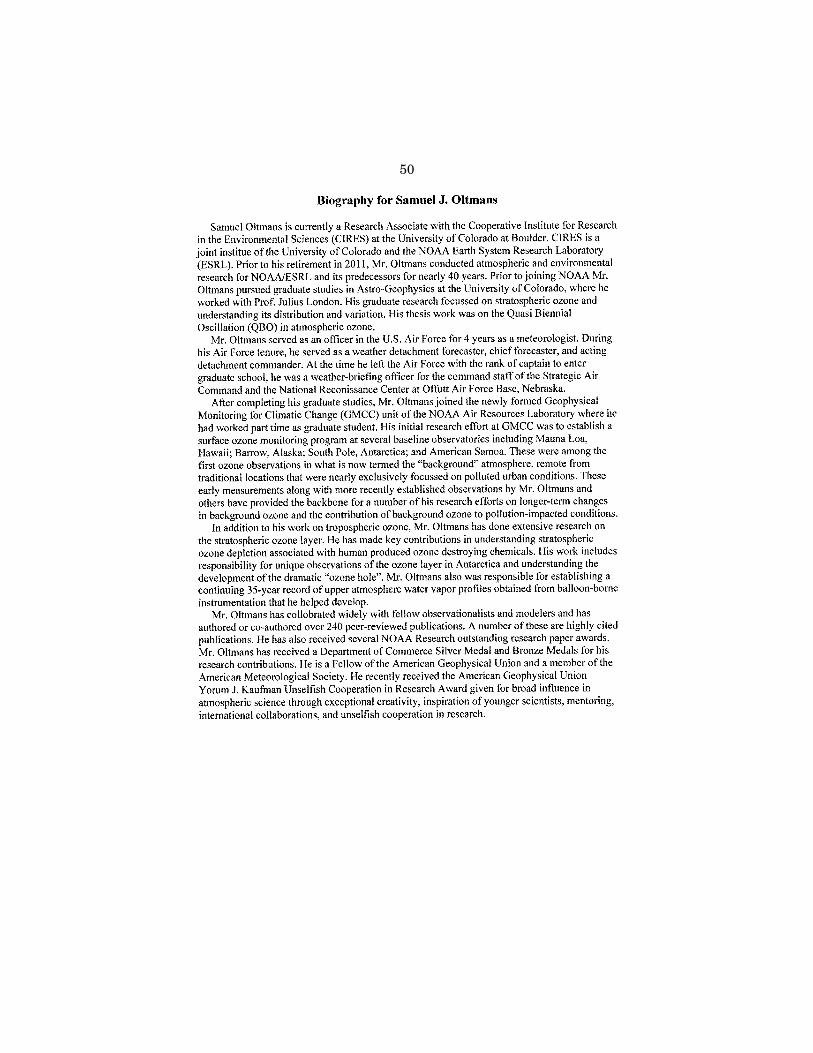
50
Biography for Samuel J. Oltmans
Samuel Oltmans is currently a Research Associate with the Cooperative Institute for Research in the Environmental Sciences (CIRES) at the University of Colorado at Boulder. CIRES is a joint institue of the University of Colorado and the NOAA Earth System Research Laboratory (ESRL). Prior to his retirement in 2011, Mr. Oltmans conducted atmospheric and environmental research for NOAAJESRL and its predecessors for nearly 40 years. Prior to joining NOAA Mr. Oltmans pursued graduate studies in Astro-Geophysics at the University of Colorado, where he worked with Prof. Julius London. His graduate research focussed on stratospheric ozone and understanding its distribution and variation. His thesis work was on the Quasi Biennial Oscillation (QBO) in atmospheric ozone.
Mr. Oltmans served as an officer in the U.S. Air Force for 4 years as a meteorologist. During his Air Force tenure, he served as a weather detachment forecaster, chief forecaster, and acting detachment commander. At the time he left the Air Force with the rank of captain to enter graduate school, he was a weather-briefing officer for the command staff of the Strategic Air Command and the National Reconissance Center at Offutt Air Force Base, Nebraska.
After completing his graduate studies, Mr. Oltmans joined the newly formed Geophysical Monitoring for Climatic Change (GMCC) unit of the NOAA Air Resources Laboratory where he had worked part time as graduate student. His initial research effort at GMCC was to establish a surface ozone monitoring program at several baseline observatories including Mauna Loa, Hawaii; Barrow, Alaska; South Pole, Antarctica; and American Samoa. These were among the first ozone observations in what is now termed the "background" atmosphere, remote from traditional locations that were nearly exclusively focussed on polluted urban conditions. These early measurements along with more recently established observations by Mr. Oltmans and others have provided the backbone for a number of his research efforts on longer-term changes in background ozone and the contribution of background ozone to pollution-impacted conditions.
In addition to his work on tropospheric ozone, Mr. Oltmans has done extensive research on the stratospheric ozone layer. He has made key contributions in understanding stratospheric ozone depletion associated with human produced ozone destroying chemicals. His work includes responsibility for unique observations of the ozone layer in Antarctica and understanding the development of the dramatic "ozone hole". Mr. Oltmans also was responsible for establishing a continuing 35-year record of upper atmosphere water vapor profiles obtained from balloon-borne instrumentation that he helped develop.
Mr. Oltmans has collobrated widely with fellow observationalists and modelers and has authored or co-authored over 240 peer-reviewed publications. A number of these are highly cited publications. He has also received several NOAA Research outstanding research paper awards. Mr. Oltmans has received a Department of Commerce Silver Medal and Bronze Medals for his research contributions. He is a Fellow of the American Geophysical Union and a member of the American Meteorological Society. He recently received the American Geophysical Union Yorum 1. Kaufman Unselfish Cooperation in Research Award given for broad influence in atmospheric science through exceptional creativity, inspiration of younger scientists, mentoring, international collaborations, and unselfish cooperation in research.

51
Chairman STEWART. Thank you, Mr. Oltmans. Our third witness today is Dr. Russell Dickerson, Professor at
the University of Maryland’s Department of Atmospheric and Oce-anic Studies—I am sorry—Oceanic Science. Dr. Dickerson has served on EPA air quality panels and was a member of the Na-tional Academy of Sciences and National Research Council Com-mittee on Animal Feeding Operations. Dr. Dickerson received his Ph.D. from the University of Michigan studying radiation and trace gases in the atmosphere, and Dr. Dickerson, your five minutes, please.
TESTIMONY OF DR. RUSSELL DICKERSON, PROFESSOR, DEPARTMENT OF ATMOSPHERIC
AND OCEANIC SCIENCE, UNIVERSITY OF MARYLAND
Dr. DICKERSON. Thank you. Good morning. My name is Russ Dickerson. I am with the University of Maryland, but I am speak-ing on my own behalf.
[Slide.] I like this picture because it is the NASA P3 research aircraft
during DISCOVER-AQ campaign conducted over the Mid-Atlantic states in the summer of 2011, and that picture was shot from the University of Maryland research aircraft. We have a Cessna. Our pockets aren’t quite as deep as NASA’s. But both of these aircraft were chockfull of research instruments and they are flying in for-mation at this point to make sure we are on the same page with respect to calibrations. In the middle of that picture, you will see a little power plant on the Eastern Shore.
So what has been the result of all of this what we hope is policy- relevant science? Next slide, please. Oh, I can do it.
[Slide.] These are the exceedance days over the past few decades for a
combination of Baltimore and Washington, and you can see that we are making excellent progress. Why have we made this progress? I like to think that it is because the science has helped guide pol-icy, and there should be some of these little lenticulars that look like postcards that have been passed around. They are NASA ob-servations of NO2, the thing that produces ozone, and you can see from this lenticular that we made good progress. The concentra-tions in 2005 were quite a bit higher than they were in 2010. So we are making good progress but we are not there yet. You will no-tice that in the last couple of years there are still a substantial number of exceedances in the Baltimore-Washington area.
So my main point would be that ozone at concentrations of 60 to 70 parts per billion is harmful, causing morbidity and mortality. This is what the standard should be. It is the best science avail-able, and that is my recommendation.
It is absolutely true that natural processes, as my colleague, Mr. Oltmans, has indicated, are important, and as a research scientist I have flown through these events and seen them. They happen. But I have never seen one in the eastern United States in my 20 years of flying through ozone events that has come down below about 10,000 feet altitude. So for the vast majority of nonattain-

52
ment sites, these are not important. They are, however, important for the Intermountain West.
What is background ozone? This is an image—I am an experi-mentalist so I am always skeptical of models, but some models are useful, and this is one that is useful, and it shows what the back-ground concentrations of ozone are, how much ozone would we have if there were no emissions in America, and the hotter the color, the higher the concentration of ozone here. So this model makes sense with respect to observations. You can see that in springtime, there is a substantial amount of ozone, especially at high altitudes. In the summer, it is less. And if you look at the United States east of the Rocky Mountains, those concentrations are really pretty modest. So I think we can achieve higher stand-ards.
There is a mechanism in existence called exceptional events. I sympathize with the difficulty of getting those. The State of Mary-land was successful in getting one. It was not easy. EPA has begun streamlining that process. Oh, and the NASA team of which I am a member that generated these lenticulars is called the Air Quality Applied Science Team, AQAST. The Air Quality Applied Sciences Team is prepared to provide support at no expense to the States to help explain natural events, forest fires and so on using in situ and remotely sensed data. So that mechanism is in place, and that is appropriate for dealing with exceptional events.
Now, for the eastern United States, certainly where I have most of my experience, there are certainly pollution sources that can be controlled. There are some power plants still using the technology of the 1960s, ICI industrial, commercial institutional boilers that are uncontrolled, even agricultural processes that with judicious application of good agricultural practices could help reduce nitric oxide, ‘‘ozone precursor’’ emissions, to the atmosphere.
However, in order for these to be effective, we will have to realize that air pollution episodes are much larger in scope than a single small eastern state. We need to consider the entire eastern United States as one large air shed.
So in conclusion, I will say that I agree with tightening the standards. I don’t think it is appropriate to punish the people of urban areas in the eastern United States by maintaining looser standards, and we have made a lot of progress, but as Robert Frost said, ‘‘we have promises to keep and miles to go before we sleep.’’
Thank you. [The prepared statement of Dr. Dickerson follows:]

53
Testimony Background Check: Achievability o/new Ozone Standard~
Russell R. Dickerson, Ph.D. Professor
The Department of Atmospheric and Oceanic Science Affiliate Professor of Chemistry and Chemical Physics
The University of Maryland College Park, MD 20742
201.405.5364
June 12,2013

54
As an atmospheric scientist with 30 years experience in air quality research, I am happy to provide testimony on background ozone. My scientific judgment can be summarized as follows:
Ozone at concentrations between 60 and 70 ppb is harmful to the environment and to human health, causing sickness and death.
• Natural processes such as forest fires and downward transport of ozone from the upper atmosphere are sources of ozone in remote regions and even high altitude sites such as the intermountain west.
• These natural or uncontrollable processes arc rarely important for the vast majority of areas in the U.S. designated nonattainment or where air pollution is known to be a problcm.
• When high concentrations of ozone from natural processes, or causes beyond the control of States are detected, they have been identified and designated Exceptional Events by the EPA; these do not count against attainmcnt status.
• High ozone from natural causcs in the intermountain west can be identified from unique chemical signatures; these episodes can and should be designated "Exceptional Events."
The NAAQS for ozone should bc set to no more than 60-70 ppb as recommended by the USEPA in 2006 based on compelling scientific evidence; this standard is achicvable with existing technology and necessary to protect welfare and human health.
Laboratory and field studies show clear, consistent evidence of a causal relationship between short-term ozone exposure and harmful respiratory health effccts such as cough, wheeze, and shortness of breath. The USEPA assembles experts from around the country to review and summarize the scientific data on Critcria Pollutants - the reports were called Critcria Documents (CD's) and are now referred to as Integrated Science Asscssments (ISA's). Evidence developed since thc 2006 Criteria Document on which I was a coauthor now indicate that ozone can also contributc to death from rcspiratory causes. The very young, old, and asthmatics are especially sensitive. Children who spcnd more time outside and have breathing rates higher than most adults are at increased risk. Adversc effects have been measured at conccntrations as low as 40 ppb, but evidence is compelling that ozone in concentrations above 60-70 ppb causes substantial morbidity and mortality - that is sickness and death. The best estimates of mortality from air pollution in America are about 30,000 people per ycar - about the same as from traffic
2

55
accidents. The evidence is strong that ozone also produces adverse cardiovascular, reproductive, and central nervous system effects. The 2006 Criteria Document [EPA, 2006b] includes summaries of hundreds of studies of the impact of ozone on human health compiled and vetted by outstanding, highly qualified health scientists. Their conclusion that the NAAQS should be set to between 60-70 ppb is founded on compelling evidence and years of careful study. I supported this recommendation and confirm that support today.
In addition, ozone is a phytotoxin, harmful to plants, both wild and agricultural. Valuable crops and produce are damaged by even modest conccntrations of ozone, and the economic losses from this damage are substantial. Reducing ozone protects America's farms and forests.
Reductions in emissions of ozone precursors (the pollutants that combine with UV radiation to make ozone in the atmosphere) have bccn highly succcssful- even more effective than had been predicted by models [Bloomer, 2008; Bloomer et al., 2010; Bloomer et al., 2009; EPA, 2006a; b; 2013; Gilliland et aI., 2008; Marufu et aI., 2004; Oltmans et aI., 2013; Rieder et aI., 2013]. Past efforts have focused mainly on reducing emissions from power plants and automobiles. Many major sources such as other internal combustion engines, industrial boilers and small power plants, and off-road sources remain uncontrolled or under-controlled. There is a clear path for further reductions in surfacc ozone.
Natural ozone from high altitudes (the stratosphere') does indeed enter the troposphere (the lowest ~1O miles of the atmosphere), and can be definitively identified from the composition of these air parcels; I have personally flown on research aircraft penetrating these high altitude events, called tropopause folds, [Cooper et aI., 1999]. They are well characterized by low humidity and low concentrations of CO, S02, hydrocarbons, and other manmade pollutants along with high concentrations of ozone. All these events were seen at high elevation. Natural ozone is an important source for the remote atmosphere, but the bulk of the ozone in the part of the atmosphere where Americans live is manmade - in urban areas the origin of ozone is overwhelmingly anthropogenic (manmade) [Lamarque et al., 2013; Stevenson et 01.,2013]. Likewise air pollution from Asia can reach the western United States, and I havc becn involved in direct measurements ofthe chemistry and transport of pollution from China [Dickerson et al., 2007; He et aI., 2012; C Li et aI., 2010; Z Q Li et al., 2007]. Long-range transport of dust and pollutants from China and India has major impacts on global atmospheric composition and probably climate, but they rarely if ever contribute substantially to pollution events for non-attainment areas. State of the art computer simulations indicate that anthropogenic sources from outside North America account for 5-7 ppb background increase in the West in spring (this includes methane's effects), but less in other seasons [Zhang et aI., 2011]. Other models seem to agree on that amount, for example a the maximum surface ozone attributable to Asian pollution in the western U.S. 00.4 ppb in
, Note ozone at high altitudes in the stratosphere, the good ozonc, protects us from dangerous UV radiation; ozone in the troposphere, the bad ozone, is toxic.
3

56
the spring and 1.4 ppb in the summer [Brown-Steiner and Hess, 2011]. See also [Huang et al., 2013; Lei et at., 2013]. Less Asian ozone makes it to the eastern U.S.
Having measured the chemistry and meteorology of pollution events in the eastern U.S. for more than 20 years, I can testifY that we have never seen a surface ozone episode with a major impact from high altitude, natural ozone. Ifwe were to discover one, my group would find it an exciting, surprising event and write a scientific paper on it immediately.
Occurrences of high concentrations of ozone at high altitude background sites in the western U.S. are worthy of further research and cause for concern. The people of Colorado, Utah, Wyoming and other intermountain states are just as deserving of clean air as the rest of America. The high concentrations of ozone are hazardous to human health there may be occasions where there is simply nothing the local authorities can do about it.
Computer simulations (numerical models) are valuable in determining the impact of natural ozone and pollution from outside the U.S. These simulations indicate that emissions from vehicles and industry dominate the production of ozone in metropolitan areas. Early models had difficulty simulating these events, but more recent work handles natural ozone better [Lin et al., 2012; Zhang et aI., 201l]. A different model, CAMx, produced background ozone 10 ppb higher in the west and 5 ppb higher in the East [Emery et at., 2012]. These and other numerical simulations however continue to indicate a minor a role for natural ozone on polluted days in heavily populated areas. Numerical models consistently indicate less than 35 ppb for most of the eastern U.S. [A Fiore et al., 2003; Fiore et al., 2002; Wang et al., 2009; Wu et al., 2008]. More recently developed models such as AM3 are not 'more advanced' than the model used previously (GEOS-Chem) in all important respects. AM3 better represents certain meteorological interactions (and chemistry-climate interactions), but in many aspects involving tropospheric chemistry and other processes influencing ozone, GEOS-Chem is clearly pioneering. Finding high levels of ozone at high altitude does not in any way indicate a high background for the eastern U.S. and California during smog events. The amounts arc too small, in the wrong place and at the wrong time. The same is true for ozone from lightning. The amounts are small compared to anthropogenic (manmade) emissions, the emissions are at high altitudes, and occur during thunderstorms when ozone levels at the surface plummet. In other words natural ozone is too little, and at the wrong place and wrong time to have a significant impact on smog events in the eastern U.S.
Concern has been expressed that remote, high altitude sites could be declared in nonattainment based on high concentrations of ozone that are beyond the control of the State. The appropriate response to ozone episodes that can be proven to be natural, such as from ozone from high altitudes or forest fires, or from distant source such as Asia, is to declare them "Exceptional Events". As defined by the EPA, "Exceptional Events are unusual or naturally occurring events that can affect air quality but are not reasonably controllable using techniques that tribal, state or local air agencies may implement in order to attain and maintain the National Ambient Air Quality Standards." http://www.epa.gov/ttn/analysis/exevents.htm This system works. Massive forest fires
4

57
in Quebec gencrated a smoke pall (containing PM and ozone) that covered much of thc eastern U.S. in July 2002, but scientific evidence that this was a natural phenomenon made it possible for Maryland to have this episodc designated an Exceptional Event and it did not count against the State in terms of attainment of the NAAQS. We wrote several scientific papers on this episode [Calarco et a!., 2004; Taubman et al., 2004; Vant-Hull et al.,2005]. My colleagues, graduate students, and I used both aircraft mcasurements and satellite observations (freely available from NASA and NOAA) in these studies. A recent publication on high surface ozone events prcsented data (Tablc 1) for this specific purpose [Lin et aI., 2012]. California and Kansas have successfully petitioned to have ozone exceedances declarcd "Exceptional Events".
Measuring ozone and weather variables alone may be insufficient or even misleading about the origin of unhealthy air. High concentrations of ozone (>70 ppb) were consistently obscrved at Bermuda, and attributed on the basis of meteorological analyses to natural causes, a surprising rcsult given that Bermuda lies just ~600 miles off the East Coast [Oltmans and Levy II, 1992]. A more thorough examination of these ozone episodes, howcver, revealed high concentrations of carbon monoxide (CO), hydrocarbons, oxides, of nitrogen (NOx), and othcr indicators of industrial pollution and car exhaust ffJickerson et al., 1995; Milne et al., 2000; Prados et al., 1999] proving that these episodes were indeed manmade. Computer simulations (models) reached similar conclusions [A M Fiore et aI., 2003; Q B Li et ai., 2002].
Forest fires do not generally produce high concentrations of ozone unless mixed with urban emissions [Singh et ai., 2012; Singh et at., 2010]. Further research is required to determinc thc relative contributions of natural and man made cmissions to ozone related to forest fires.
Proving that high ozone concentrations observed at high altitude sites in the western U.S. is the result of clean, upper atmospheric ( stratospheric) air is straightforward and practical. Reliable carbon monoxide and sulfur dioxide (S02) monitors are commercially available, and have an excellent track record in compliance monitoring. Pollution ozone is essentially always associated with vehiele exhaust containing CO or with coal combustion plumes containing S02. If the ozone increases and neither CO nor S02 increase with it then thc ozone is from a natural source. These episodes can and should be declared Exceptional Events.
Obtaining the scientific evidence to have an ozone cpisode designated "Exceptional Events" requires technical effort. NASA has assembled and supports the Air Quality Applied Science Team (AQAST) to serve the needs of U.S. air quality management through the use of Earth Science satellite data, observations from the surface and aircraft as well as models. http://acmg.seas.harvard.edulaqastiindex.htmIOne of the AQAST tasks is to provide data on stratospheric intrusions (natural ozone) and forest fires. The NASA AQAST is already working with western States on identifYing exccptional ozone events and would be happy to expand those efforts.
5

58
The state of the science is sufficient to take action. All scientific findings have associated uncertainty. Scientists revel in finding and measuring this uncertainty; it leads to ever increasing understanding and accuracy. The level of confidence related to the NAAQS for ozone, however, is high. The evidence is compelling. A multitude of measurements confirm the fundamental theory of ozone production from pollution. Stratospheric intrusions and long-range transport are scientifically fascinating and worthy of further research, but the background ozone from such processes is small compared to manmade ozone during smog events in heavily populated areas. To protect the natural environment, farms and forests, but most of all human health, an ozone standard of no more than 60-70 ppb is urgently needed.
6

59
References
Bloomer, B. J. (2008), Air Pollution Response to Changing Weather and Power Plant Emissions in the Eastern United States, 174 pp, The University of Maryland, College Park.
Bloomer, B. 1., R. R Dickerson, and K. Vinnikov (2010), A Chemical Climatology and Trend Analysis of Ozone and Temperature over the Eastern U.S., Atmospheric Environment, 44«21-22», 2543-2551.
Bloomer, B. J., J. W. Stehr, C. A. Piety, R. J. Salawitch, and R R. Dickerson (2009), Observed relationships of ozone air pollution with tempcrature and emissions, Geophysical Research Letters, 36.
Brown-Steiner, B., and P. Hess (2011), Asian influence on surface ozone in the United States: A comparison of chemistry, seasonality, and transport mechanisms, Journal of Geophysical Research-Atmospheres, 116.
Colarco, P. R, M. R. Schoeberl, B. G. Doddridge, L. T. Marufu, O. Torres, and E. J. Welton (2004), Transport of smoke from Canadian forest fires to the surface near Washington, D. C.: Injection height, entrainment, and optical properties, Journal of Geophysical Research-Atmospheres, 109(D6).
Cooper, 0., et al. (1999), Temporal and spatial evolution ofa tropopause fold and associated trace gas signatures ovcr the eastern United States and western North Atlantic Ocean, paper presented at 79th AMS Annual Meeting, Dallas, Texas, 1999.
Dickerson, R. R., B. G. Doddridge, P. K. Kelley, and K. P. Rhoads (1995), Large-scale pollution of the atmosphere over the North Atlantic Ocean: Evidence from Berrnuda,J. Geophys. Res., 100(5), 8945-8952.
Dickerson, R R., et al. (2007), Aircraft observations of dust and pollutants over northeast China: Insight into the meteorological mechanisms of transport, Journal of Geophysical Research-Atmospheres, 112(D24).
Emery, C., ct al. (2012), Regional and global modeling estimates of policy relevant background ozone over the United States, Atmospheric Environment, 47, 206-217.
EPA (2006a), Air Quality Criteria for Ozone, edited. EPA (2006b), Air Quality Criteria for Ozone and Related Photochemical Oxidants Rep.
El'A/600/R-05/0004aA. EPA (2013), Integrated Science Assessment for Ozone adn Related Photochemical
OxidantsRep. El'A 600/R-1O/076F. Fiore, A., D. J. Jacob, H. Liu, R. M. Yantosca, T. D. Fairlie, and Q. Li (2003), Variability
in surface ozone background over the United States: Implications for air quality policy, Journal of Geophysical Research-Atmospheres, 108(D24).
Fiore, A. M., D. J. Jacob, R Mathur, and R. V. Martin (2003), Application of empirical orthogonal functions to evaluate ozone simulations with regional and global models, Journal of Geophysical Research-Atmospheres, 108(DI9).
Fiore, A. M., et al. (2002), Background ozone over the Unitcd States in summer: Origin, trend, and contribution to pollution episodes, Journal of Geophysical ResearchAimospheres,107(DI5).
Gilliland, A. B., C. Hogrefe, R. W. Pinder, J. M. Godowitch, K. L. Foley, and S. T. Rao (2008), Dynamic evaluation of regional air quality models: Assessing changes in
7
60
0 3 stemming from changes in emissions and meteorology, Atmospheric Environment, 42(20), 5110-5123.
He, H., et al. (2012), S02 over central China: Measurements, numerical simulations and the tropospheric sulfur budget, Journal of Geophysical Research-Atmospheres, 117.
Huang, M., et al. (2013), Impacts of transported background pollutants on summertime western U.S. air quality: model evaluation, sensitivity analysis and data assimilation, Atmospheric Chemistry and Physics, 13(1), 359-391.
Lamarque, J. F., et al. (2013), The Atmospheric Chemistry and Climate Model Intercomparison Project (ACCMIP): overview and description of models, simulations and climate diagnostics, Geoscientific Model Development, 6(1), 179-206.
Lei, H., D. J. Wuebbles, X. Z. Liang, and S. Olsen (2013), Domestic versus international contributions on 2050 ozone air quality: How much is convertible by regional control?, Atmospheric Environment, 68, 315-325.
Li, C., N. A. Krotkov, R. R. Dickerson, Z. Q. Li, K. Yang, and M. Chin (2010), Transport and evolution of a pollution plume from northern China: A satellite-based case study, Journal of Geophysical Research-Atmospheres, J J 5.
Li, Q. B., D. J. Jacob, T. D. Fairlie, H. Y. Liu, R. V. Martin, and R. M. Yantosca (2002), Stratospheric versus pollution influences on ozone at Bermuda: Reconciling past analyses, Journal of Geophysical Research-Atmospheres, 107(D22).
Li, Z. Q., ct al. (2007), Preface to special section on east Asian studies of tropospheric aerosols: An international regional experiment (EAST -AIRE), Journal of Geophysical Research-Atmospheres, 112(D22).
Lin, M. Y., et al. (2012), Springtime high surface ozone events over the western United States: Quantifying the role of stratospheric intrusions, Journal of Geophysical Research-Atmospheres, 117.
Marufu, L. T., et al. (2004), The 2003 North American electrical blackout: An accidental experiment in atmospheric chemistry, Geophysical Research Letters, 31(13).
Milne, P. J., et al. (2000), Nonmethane hydrocarbon mixing ratios in continental outflow air from eastern North America: Export of ozone precursors to Bermuda, Journal of Geophysical Research-Atmospheres, J 05(D8), 9981-9990.
Oltmans, S. J., and H. Levy II (1992), Seasonal cycles of ozone over the western North Atlantic, Nature, 358, 3920394.
Oltmans, S. J., et al. (2013), Recent tropospheric ozone changes - A pattern dominated by slow or no growth, Atmospheric Environment, 67, 331-351.
Prados, A. I., R. R. Dickerson, B. G. Doddridge, P. A. Milne, J. L. Moody, and 1. T. Merrill (1999), Transport of ozone and pollutants from North America to the North Atlantic Ocean during the 1996 Atmosphere!Ocean Chemistry Experiment (AEROCE) intensive, Journal of Geophysical Research-Atmospheres, 104(D21), 26219-26233.
Rieder, H. E., A. M. Fiore, L. M. Polvani, 1. F. Lamarque, and Y. Fang (2013), Changes in the frequency and return level of high ozone pollution events over the eastern United States following emission controls, Environmental Research Letters, 8(1).
8
61
Singh, H. B., C. Cai, A. Kaduwela, A. Weinheimer, and A. Wisthaler (2012), Interactions of fire emissions and urban pollution over California: Ozone formation and air quality simulations, Atmospheric Environment, 56, 45-51.
Singh, H. B., et al. (2010), Pollution influences on atmospheric composition and chemistry at high northern latitudes: Borcal and California forest fire emissions, Atmospheric Environment, 44(36), 4553-4564.
Stevenson, D. S., et al. (20l3), Tropospheric ozone changes, radiative forcing and attribution to emissions in the Atmospheric Chemistry and Climate Model Intercomparison Project (ACCMIP), Atmospheric Chemistry and Physics, 13(6), 3063-3085.
Taubman, B. F., et al. (2004), Smoke over haze: Aircraft observations of chemical and optical properties and the effects on heating rates and stability, Journal of Geophysical Research-Atmospheres, 109(D2).
Vant-Hull, B., et al. (2005), Smokc over haze: Comparative analysis of satellite, surface radiometer, and airborne in situ measurements of aerosol optical properties and radiative forcing over the eastern United States, Journal of Geophysical Research-Atmospheres, 11 OeD 1 0).
Wang, H. Q., et al. (2009), Surface ozone background in the United States: Canadian and Mexican pollution influenccs, Atmospheric Environment, 43(6), 131O-l319.
Wu, S. L., L. J. Mickley, E. M. Leibensperger, D. J. Jacob, D. Rind, and D. G. Streets (2008), Effects of 2000-2050 global change on ozone air quality in the United States, Journal of Geophysical Research-Atmospheres, 113(D6).
Zhang, L., et al. (2011), Improved estimate of the policy-relevant background ozone in the United States using the GEOS-Chem global model with 112 degrees x 2/3 degrees horizontal resolution over North America, Atmospheric Environment, 45(37),6769-6776.
9
62
BIOSKETCH Russell R. Dickerson
Professor and past Chair Department of Atmospheric and Oceanic Science (AOSC)
The University of Maryland
Russell R. Dickerson received his Ph.D. in 1980 from The University of Michigan, where he studied the interaction of radiation and trace gases in the atmosphere. After graduation, he worked in the Air Chemistry Division at NCAR and in the Abteilung Luftchemie at the Max Planck Institute in Mainz, Germany. Professor Dickerson began working in the Department of Meteorology (now AOSC) as an Assistant Professor in 1983 as the sole atmospheric chemist. He built the program in atmospheric chemistry and air pollution to include six faculty, several post docs and more than a dozen graduate students. His research has expanded to include the interactions of various weather phenomena such as thunderstorms and atmospheric chemistry, oceanatmosphere interactions, air pollution, the links between particulate and gaseous chemistry and global biogeochemical cycles.
His research group, composed of meteorologists, engineers, and chemists, develops analytical instruments (for species such as NOx, CO, NH3, aerosols, and for photolysis rate measurements) employs these instruments in the laboratory, field, and on ships and aircraft, and interprets the results in terms of photochemistry, heterogeneous processes, and atmospheric physics with the aid of numerical chemical transport and cloud models. Remote sensing from satellites has been added to better extrapolate from in situ observations to large-scale processes and climate impacts. The research group enjoys fruitful collaboration with colleagues in UMD Departments of Aerospace Engineering, Chemistry, Chemical Engineering, Physics, Chemical Physics, ESSIC, and MEES, and with outside colleagues from NASAlGSFC, MPI, several universities, and NOAA's ARL, PMEL, and AOML Labs. Among the more exciting recent discoveries are smoke pall from South Asia, rapid ozone destruction in the marine boundary layer, and the impact of aerosol radiative forcing on air quality.
He has helped define, plan, and execute the Atmosphere Ocean Chemistry Experiment (AEROCE), and the Indian Ocean Experiment (lNDOEX). He served on numerous EPA air quality panels, the steering committees of Center for Clouds Chemistry and Climate (C4), INDO EX, NARSTO, and SOLAS. Professor Dickerson was a member of the National Academy of Sciences National Research Council Committee on Animal Feeding Operations and has helped write a NRC Report on the impact of agriculture on air pollution in the US. He heads the heads the Regional Atmospheric Measurement, Modeling and Prediction Program (RAMMPP) which acts as the scientific arm of the Maryland Department of the Environment and Department of Natural Resources concerning air quality issues in the Mid-Atlantic region. RAMMPP leads policy relevant research and helps develop plans for compliance with the Clean Air Act.
In teaching, Professor Dickerson developed courses in Air Pollution (METO 434), Atmospheric Chemistry (METO/CHEM 637) and Laboratory Techniques (METO/CHPH 634). Most recently he has helped revise the core courses to include the fundamentals of the chemistry and physics of the atmosphere (METO 620 and METO 621). He has directed research for 12 B.S., 15 M.S. and 26 Ph.D. degrees in AOSC, CHEM, CHPH, and METO.
Professor Dickerson was elected a Fellow ofthe AGU and AAAS, and has received numerous awards and honors, including recognition as one of the top 100 researchers at UMD every year since 1999, as well as various fellowships such as a Max Planck Visitors Program. At the end of his 7-year tenure as Chair, the National Academies ranked VMD's Atmospheric and Oceanic Sciences Department in the top five in America.

63
Chairman STEWART. Thank you, Dr. Dickerson. Our fourth witness is Mr. Jeffrey Holmstead, Partner of
Bracewell & Giuliani. Mr. Holmstead is one of the Nation’s leading air quality lawyers and heads the Environmental Strategies Group at Bracewell & Giuliani. He previously served as the Assistant Ad-ministrator at the EPA for the Office of Air and Radiation. He also served on the White House staff as Associate Counsel to former President George H.W. Bush. Mr. Holmstead received his law de-gree from Yale Law School. Mr. Holmstead.
TESTIMONY OF MR. JEFFREY HOLMSTEAD,
PARTNER, BRACEWELL & GIULIANI LLP
Mr. HOLMSTEAD. Thank you. I am delighted to be here this morning. As you mentioned, I am a Partner in the law firm of Bracewell and Giuliani, but I am not appearing on behalf of my law firm or any clients this morning. I am here to share my views as a former EPA official and as a private attorney who spent more than 25 years dealing with Clean Air Act issues.
One of the things that I think has become apparent is, ozone is not a new issue. There are some issues that arise under the Clean Air Act that really are kind of new. The focus on fine particles, which I know many of you are aware of, is something that really has only been a regulatory and science issue over the last decade or so. But ozone has been an issue now for more than 40 years, and I do think there is a couple of things—and I have been sitting here trying to think what I can add to this panel, and the first thing I want to say, which I think we would all agree with, is, we really have made remarkable progress over 40 years. By any measure, ozone levels throughout almost certainly all urban areas have im-proved pretty dramatically. You talk to people who lived in Los An-geles or Houston back in the early 1970s, and it is really pretty re-markable.
The issue, though—well, there is really a confluence of two or three things that are going on now. As researchers have become more sophisticated at looking at more subtle signals in the data, we are seeing that at lower and lower levels, there appear to be health effects. There is still debate over how serious those are and how widespread they are, but certainly EPA over the years has changed its view on what the safe level is, so going back to when I first started thinking about these issues, the standard people were thinking about was 120 parts per billion, and that was meas-ured in a slightly different way so you can’t exactly compare it with today’s levels, but think of this: the standard has gone from 120, and then in 1997 it went down to 84, and then in 2008 it has gone down to 75, and now EPA is talking about lowering it—a standard that was 120 and then 84 and 75, we are now talking, as Dr. Dickerson said, somewhere between 60 and 70.
The other issue is—so we have made enormous progress but EPA says we need to do more, and clearly there is more that we need to do. The issue, though, is, notwithstanding this considerable proc-ess, the history has shown us that just changing the standard doesn’t clean up the air. You need technology, you need things that you can actually do, and the way that the Clean Air Act works

64
really hasn’t changed since 1970 in terms of this particular pro-gram. Back in the 1970s, the general view was, if you had a pollu-tion problem, it was largely a local problem, and so EPA would set the standard and then states would be given the responsibility to go out and control local sources to make sure that they met the standard, and that is what people assumed was the way to clean up our air. Well, we have discovered it is actually much more com-plicated than that, as various people have talked about this morn-ing. There certainly are localized sources of pollution, and I agree with Dr. Dickerson that there is more than we can do in some cases, but the problem is, there are many parts of the country where there is not much more we can do, especially when it comes to these events that occur from time to time but don’t quality for EPA’s exceptional-events policy.
And so my basic message this morning is, I think that the Clean Air Act that has served us pretty well for the last 40 years on ozone is going to have to be reexamined, and I think this Com-mittee, even though you don’t have regulatory jurisdiction, can play a very important part in making sure that the public and policy-makers understand the issues that we are facing today.
I would also like to suggest that we can rely more on EPA’s Clean Air Science Advisory Committee, the CASAC, which was spe-cifically set up by Congress to deal with some of these issues, and for many years, CASAC has largely simply responded to questions it has received from EPA staff. But Congress clearly envisioned a more—a broader role for CASAC, and I think it is important now that we have very fine scientists who look at these issues about what is background, what more can we do in the United States, and then how do we deal with the fact that there are many states certainly in the Intermountain West but in other parts of the coun-try that now have a legal obligation to do something that is impos-sible for them to do. I hope that isn’t related to my testimony. Is that——
Chairman STEWART. I think you are okay. Please continue. Mr. HOLMSTEAD. So I think the fundamental question for Con-
gress is what does it mean to have a statute that imposes a legal obligation that requires states to do something that is impossible for them to do. I don’t think that makes any sense. I think it is contrary to our basic notions about what the rule of law should mean, and so I think it is time for Congress to start thinking about how we can be realistic about what we can do, how we can con-tinue to improve air quality throughout the United States without imposing the burdens on states like Utah and others that have really done largely what they can do and are being affected by events and by actions that are outside of their control.
[The prepared statement of Mr. Holmstead follows:]

65
Testimony of Jeffrey R. Holmstead Bracewell & Giuliani, LLP
Background Check: Achievability of New Ozone Standards
U.S. House Committee on Science, Space, and Technology Subcommittee on Environment U.S. House of Representatives
June 12, 2013
My name is JeffHolmstead. I am a partner in the law firm of Bracewell & Giuliani and the head of the firm's Environmental Strategies Group. However, I am not submitting this testimony on behalf of my law firm or any of my clients or the firm's clients. Rather, I am sharing my views as a former government official and an attorney in private practice who has spent almost 25 years working on issues arising under the Clean Air Act.
I have worked on Clean Air Act issues since 1989, when I joined the White House Staff of President George H.W. Bush. In that capacity, I worked closely with the Environmental Protection Agency (EPA) and a number of other stakeholders on the implementation of the 1990 Amendments to the Clean Air Act. I served at the White House until 1993 and then, from 1993 until 2001, I worked as attorney in private practice, where I represented companies and trade associations in a number of different industries on Clean Air Act issues. Beginning in 2001, I had the opportunity to serve for more than four years as the head of the EPA Air Office - the office in charge of implementing the Clean Air Act. My official title was Assistant Administrator of EPA for Air and Radiation. Since 2006, I have been a partner at the law firm of Bracewell & Giuliani, where I work with many different industry groups and companies on a variety of issues related to the Clean Air Act.
From these various vantage points in both the government and the private sector, I have closely followed EPA's efforts to set national ambient air quality standards (NAAQS) for ozone and then to develop and implement a variety of regulatory and permitting programs designed to reduce ozone concentrations throughout the country. I have also been involved with a number of state and local governments, industry groups, and private

66
companies as they have tried to deal with the challenges created by the ozone standards and the various rules and regulations related to those standards.
I am especially interested in the ozone standards because of the long history of EPA and state efforts to deal with ozone under the Clean Air Act. Ozone is not a new challenge. EPA and state environmental agencies have been focused on reducing concentrations of ozone for more than 40 years (although the term ozone was not used in the early years).
In light of this 40-year history, I would like to highlight two key facts related to ozone:
• Ozone levels have been reduced substantially since the 1970s in most parts of the U.S. and especially in urban areas that had previously suffered from the highest levels of ozone.
• Notwithstanding the considerable progress that has been made in reducing ozone concentrations, there are many areas of the country that have not attained the current ozone NAAQS of75 parts per billion (Ppb). In fact, there are a number of major urban areas that, although they have made substantial improvements in air quality, are still a long way from meeting this standard. Based on the most recent EPA data, there are 9 areas with "design values" of90 ppb or above - meaning that they are still 20 percent or more above the current standard and well above the 84 ppb standard that was established back in 1997.
These areas have not been negligent in their efforts to regulate sources of air pollution. In fact, many of them - in California, Texas, and the mid-Atlantic region in particular - have been extremely aggressive (and creative) in regulating virtually every imaginable source of ozone precursors. In fact, as a country, we have spent more money to address ozone than to address any other air pollutant (even though EPA and most air quality researchers believe that other pollutants pose a much greater health risk). In my discussions with regulatory officials in these areas, they say that there is little more that they can do to achieve further reductions.
To be sure, ozone concentrations in these areas will continue to decrease gradually as new, lower-emitting cars, trucks, and non-road engines replace older vehicles and engines. But these decreases will fall far short of what is needed to attain the ozone standard in many areas of the country.
2

67
Under the Clean Air Act, states have a legal obligation to meet the ozone standard, but the standard itself is not fixed in law. Rather, EPA is supposed to review the standard every five years based on the most current research about the health effects of ozone. If EPA believes, based on the current scientific evidence, that the standard should be adjusted, then EPA is required to set the standard at a level that is "requisite to protect the public health" with an "adequate margin of safety." Based on a decision by the Supreme Court, EPA believes that it must set the standard based purely on the health effects of ozone and without considering the cost of meeting the standard or even whether the standard can be met.
EPA is now reviewing the ozone standard and has suggested that it should be lowered from 75 ppb (its current level) to somewhere in the range of 60 to 70 ppb. Thus, many parts of the country that have not been able to meet the 1997 standard of 84 ppb or the 2008 standard of 75 ppb may soon have a new legal obligation to meet an even lower standard.
Why "Background" Ozone Matters
The basic structure of the Clean Air Act program for dealing with ozone was established back in the 1970s and has remained relatively unchanged since that time. Ozone (then in the form of "total photochemical oxidants") was thought to be primarily a local issue. If a city had high ozone levels, policymakers believed that it was caused by local sources of emissions. It was understood, of course, that vehicle emissions were the single largest part of the problem in many areas, and EPA was given primary responsibility for regulating those emissions. Otherwise, it was thought that states could meet the ozone standard (which was 120 ppb from 1979 - 1997) simply by adopting more stringent regulations to reduce emissions from industries within their borders.
By the mid-1990s, EPA came to understand that ozone was also a regional issue - not just a local one - and began to develop programs to control emissions from power plants in the eastern U.S. as a way to reduce ozone levels throughout the region.
More recently, government and academic researchers have noted that ozone is truly a global issue. Even without any human activity, there would be natural levels of ozone (not necessarily a constant background level but a level that
3

68
would vary from time to time and place to place over the year). In addition, it is now clear that a range of industrial and other human activities (like biomass burning) throughout the world contribute to ozone concentrations in the U.S. In a 2011 report, EPA scientists noted that:
A growing body of observational and modeling studies suggests that the international anthropogenic [man-made] contribution to U.S. background ozone levels is substantial and is expected to rise in the future as rapid economic development continues around the world. Of particular concern is rising Asian emissions of nitrogen oxides (NOx), which can influence U.S. ozone concentrations in the near-term, and methane, which affects background ozone concentrations globally over decadal time scales.
* * * * * In particular, [a 2010 Report by the Task Force on Hemispheric Transport of Air Pollution] estimated that the contribution of NOx, non- methane VOC, and CO emissions in Europe, South Asia, and East Asia to North American ozone concentrations at relatively unpolluted sites is 32% of the contribution of emissions from all four regions (including North America) combined. That contribution is projected to rise to 49% in a conservative emissions growth scenario and to 52% in a scenario of aggressive global economic development. I
The U.S. can certainly work with other countries to encourage them to reduce emissions that contribute to air quality problems in the U.S. However, for U.S. policymakers, it is important to understand how much we can actually do, within our own borders, to reduce ozone concentrations in the U.S. This would require an understanding of the ozone levels that would exist in the U.S. even if all man-made emissions from sources within the U.S. were to be eliminated entirely.
Since "true" background ozone levels are unknown, EPA and others have developed models to estimate what EPA has called "Policy-Relevant Background" (PRB) ozone. Unfortunately, the concept of "Policy-Relevant
I EPA, Ozone National Ambient Air Quality Standards; Scope and Methods Plan for Health Risk and Exposure Assessment (2011).
4

69
Background" is not entirely helpful because it assumes that emissions in Canada and Mexico can somehow be regulated by the U.S. and should not be viewed as background ozone. Thus, EPA has defined PRB ozone as the surface ozone concentration that would be present over the U.S. in the absence of North American (and not just U.S.) emissions from human activities. Mexican and Canadian emissions already have a large and growing impact on bordering states' ozone levels. The authors of a recent report found that, by 2020, "Canadian pollution influence in the Northeast will become comparable in magnitude to that from domestic power plants.,,2
Even though the concept ofPRB ozone is flawed, it is still useful in providing a sense about how much we can actually accomplish by further regulating U.S. sources of emissions. A 2011 Harvard study was designed to improve current modeling ofPRB to assist EPA in its current revision of the ozone NAAQS. While "previous studies found no occurrences ofPRB exceeding 60 ppbv," the authors found PRB exceeds that amount in the intermountain West (extending between the Sierra Nevada/Cascades Mountains to the west and the Rocky Mountains to the east) on a regular basis. 'The annual 4th-highest PRB value in the model (representing the minimum standard achievable through suppression of North American anthropogenic emissions) is ... 50-60 ppbv" in the region. As EPA has considered decreasing the current NAAQS from 75 ppbv to 60-70, "such high PRB values in the intermountain West suggest that special consideration of this region may be needed if the ozone NAAQS is decreased to a value in the 60-70 ppbv range." The report also noted that as the standard becomes more stringent and approaches the PRB, accurate specification of the PRB becomes increasingly important. 3
The recent Chair of EPA's Clean Air Science Advisory Committee, Dr. Jonathan Samet, has also noted the significance of EPA standards converging with background radiation:
2 Wang, Huiqun, et aI., "Surface Ozone Background in the United States: Canadian and Mexican Pollution Influences," Atmospheric Environment, Vol. 43, February 2009, p. 1310.
3 Zhanga, Lin, et aI., "Improved estimate of the policy-relevant background ozone in the United States using the GEOS-Chem global model with Yz x 2/3 horizontal resolution over North America," Atmospheric Environment, Vol. 45, June 14,2011. http://acmg.seas.harvard.edu/publicationslzhang2011.pdf
5

70
Although health and welfare effects of ozone will occur regardless of the origin of the ozone (Le., natural, U.S. anthropogenic emissions or internationally transported emissions), we note that as levels for ozone standards move closer to "background" levels, new issues may arise with implementation. As the Agency moves forward with the next ozone review cycle, it would be well advised to carefully consider any new monitoring and implementation issues that may arise, particularly as background levels vary throughout the country. 4
The Role of CASAC
As part of the Clean Air Act, Congress created an outside group of science advisors known as the Clean Air Science Advisory Committee (CASAC). Congress created CASAC back in 1977, when it enacted what has now been codified as section 109 of the Clean Air Act.
For many years, CASAC has largely just responded to questions posed by EPA staff. Congress, however, envisioned a broader role for CASAC and also gave CASAC a specific list of responsibilities. Unfortunately, CASAC has largely overlooked two things on this list.
Section 1 09( d)(2)(C) specifically states that CASAC "shall" (1) "advise the Administrator on the relative contribution to air pollution concentrations of natural as well as anthropogenic activity" and (2) "advise the Administrator of any adverse public health, welfare, social, economic, or energy effects which may result from various strategies for attainment and maintenance of such national ambient air quality standards."
Some CASAC observers have downplayed the importance of these responsibilities, arguing that they are not relevant to the question of where the NAAQS should be set. But Congress clearly wanted CASAC to playa broader role than simply advising EPA on the level of the NAAQS.
4 Dr. Jonathan M. Samet, Chair, Clean Air Scientific Advisory Committee. Letter to Lisa Jackson. February 19,2010. http://yosemite.epa.gov/sab/sabproduct.nsf/61 OBB57CF AC8A41 C852576CF007076BD/$ File/EPA-CASAC-I0-007-unsigned.pdf
6
71
Virtually everyone agrees that, in the effort to regulate ozone precursors, regulators have already picked most of the low-hanging fruit. And in many areas, regulators believe that they have picked essentially all the fruit that can be reached. Under these circumstances, it is important for CASAC to advise the Administrator and through her, other policymakers - about "the relative contribution to [ozone] concentrations of natural as well as anthropogenic activity." In considering the contribution from anthropogenic sources, CASAC should distinguish between (i) anthropogenic sources that are within the U.S. and therefore subject to control under the Clean Air Act and (ii) anthropogenic sources from outside the U.S., which are not. As a practical matter, the contribution from non-U.S. anthropogenic sources is essentially part of the uncontrollable background. Policymakers and regulators around the country need a valid source of information about background concentrations (attributable to both natural and non-U.S. anthropogenic sources) and the degree to which they effect the ability of certain areas to achieve the ozone NAAQS.
It is perhaps even more important for CASAC to advise the Administrator and other policymakers about the "adverse public health, welfare, social, economic, or energy effects which may result from" further efforts to reduce ozone formation. If, as most experts believe, the low hanging fruit has been picked, additional actions will be ever more costly in terms of the cost-perunit of ozone reduced. CASAC clearly has a role in advising policymakers about the tradeoffs that we all face as our society spends more resources to achieve a goal that may not even be achievable in certain parts of the country.
Need for an Honest Evalnation of PM2.5 and Ozone
Although EPA does not consider costs and benefits when setting the NAAQS (for ozone or any other pollutant), it does perform cost-benefit analyses of the NAAQS in order to provide such information to policymakers and the public. In recent years, however, these efforts have done little to provide meaningful information about the true costs and benefits of efforts to reduce public exposure to ozone. At the very least, it is puzzling to see that the benefits of lowering the ozone standard, according to EPA, come almost entirely from reducing concentrations of another pollutant known as PM2.5 (which stands for particulate matter less than 2.5 microns in diameter).
As others have noted, EPA's statements on the health benefits oflowering the ozone NAAQS are misleading. The claimed health benefits have very little to
7

72
do with benefits of reducing exposure to ozone. In fact, all the analysis done by EPA and others shows that the cost to society of lowering the ozone standard will be higher than the health benefits of reducing public exposure to ozone. But EPA asserts that a lower ozone standard is justified on costbenefit grounds because actions taken to meet a lower ozone standard will also have a side-benefit of reducing concentrations ofPM2.5. And this sidebenefit, according to EPA, is substantially greater than the benefit of reducing public exposure to ozone.
Perhaps even more troubling, EPA claims, in the context of ozone, that there are tremendous health benefits in reducing concentrations ofPM2.5 below the level of the NAAQS for PM2.5. Thus, EPA goes through a public and scientific review process to set a PM2.5 standard at a level that is requisite to protect public health (including sensitive subpopulations) with an adequate margin of safety. Then, in the context of reviewing the ozone standard, EPA asserts that lowering the ozone standard will save thousands of lives by reducing PM2.5 concentrations in areas that are already below the PM2.5 NAAQS.
As others have pointed out, EPA has used the purported benefits of reducing PM2.5 to justify virtually all its regulatory actions over the last few years.5
This approach makes a mockery of the standard-setting process and misleads the public and policymakers about the true costs and benefits of various Clean Air Act programs. Congress and CASAC should encourage EPA to conduct a more transparent and honest evaluation of the costs and benefits of reducing public exposure to ozone.
Background Ozone and the Rule of Law
As noted above, EPA believes that the issue of background ozone is not relevant to the question of where the NAAQS should be set. This position is based on the Supreme Court's decision in Whitman v. American Trucking, 531 U.S. 457 (2001), which said (among other things) that EPA must set the NAAQS based purely on an assessment of health effects and without considering the cost of meeting any particular standard. Most surprising, the Court also suggested that EPA must set air quality standards without even
5 See Anne E. Smith, NERA Economic Consulting, Summary and Critique of the Benefits Estimates in the RIA for the Ozone NAAQS Reconsideration. July 22, 2011.
8

73
considering whether they are achievable. As a result, the Clean Air Act appears to give rather remarkable authority to EPA - the authority to impose legal obligations that are impossible to meet. To me, at least, this seems contrary to our long-standing notions about the rule oflaw.
To be fair, this issue has only arisen as background levels of ozone have continued to increase while EPA has simultaneously regulated ozone to lower and lower levels. Certainly, when the Clean Air Act was enacted back in 1970, and even when it was last amended in 1990, Congress did not appear to contemplate this issue - that background emissions would make it impossible for states to meet national ambient air quality standards. Perhaps it is time for Congress to consider this problem, but I recognize that it is perhaps beyond the purview of this Subcommittee.
I do believe, however, that this Subcommittee - and EPA's Clean Air Science Advisory Committee should take steps to ensure that this issue is fairly presented to policymakers and the public.
9

74
Jeffrey R. Holmstead
JeffHolmstead, fonner Assistant Administrator of the United States Environmental Protection Agency (EPA) for Air and Radiation, is one of the nation's leading air-quality lawyers and heads the Environmental Strategies Group (ESG) at Bracewell & Giuliani. The ESG is a multidisciplinary group that includes environmental and energy attorneys, public policy advocates, and strategic communications experts - most of whom have had high-level government experience. Under Mr. Holmstead's leadership, they work together on daily basis to advise and defend companies and business groups confronting major environmental and energydevelopment challenges, both domestically and globally.
From his time in both the government and the private sector, Mr. Holmstead is very familiar with the environmental and energy challenges facing the business community. He advises clients dealing with an increasingly complex regulatory, legal and public relations landscape, drawing on his experience in policy development, administrative and legislative advocacy, litigation and strategic communications. He has worked with clients in a number of industries on issues related to climate change, Clean Air Act policy and enforcement, and energy policy - including the development of new coal-fired power plants, refineries, renewable energy sources, and electric transmission infrastructure.
Mr. Holmstead headed the EPA's Office of Air and Radiation from 2001 - 2005, longer than anyone in EPA history. During his tenure, he was the architect of several of the agency's most important initiatives, including the Clean Air Interstate Rule, the Clean Air Diesel Rule, the Mercury Rule for power plants and the refonn of the New Source Review program. He also oversaw the development of the Bush Administration's Clear Skies Legislation and key parts of its Global Climate Change Initiative. Prior to his appointment at EPA, Mr. Holmstead was a partner in the Environmental Group of Latham & Watkins, which he joined in 1993. Between 1989 and 1993, Mr. Holmstead served on the White House Staff as Associate Counsel to fonner President George H.W. Bush. In that capacity, he was involved in the passage of the Clean Air Act Amendments of 1990 and the key steps taken to implement those amendments. From 1987 to 1988, he served as a law clerk to Judge Douglas H. Ginsburg on the U.S. Court of Appeals for the District of Columbia.
Education J.D., Yale Law School, 1987 B.A., summa cum laude, Brigham Young University, 1984
Bar Admissions District of Columbia
Noteworthy Chambers USA: America's Leading Lawyers/or Business, Climate Change, 2010-2013; Environment, 2008-2013 US Legal 500, Environment: Litigation, 2012 Best Lawyers in America, Environmental Law, 2008-2010 and 2013

75
Chairman STEWART. Thank you, sir. By the way, none of us have any idea what any of those bells mean, so—our final witness today is Dr. John Vandenberg, Director of Research Triangle Park, North Carolina Division, at the National Center for Environmental As-sessment, U.S. Environmental Protection Agency. Dr. Vandenberg began working in EPA in 1984 and was responsible for performing national scale exposure and health risk assessments for hazardous air pollutants. He received his Ph.D. from Duke University in bio-physical ecology. Dr. Vandenberg.
TESTIMONY OF DR. JOHN VANDENBERG, DIRECTOR, RESEARCH TRIANGLE PARK,
NORTH CAROLINA DIVISION, NATIONAL CENTER FOR ENVIRONMENTAL ASSESSMENT,
U.S. ENVIRONMENTAL PROTECTION AGENCY
Dr. VANDENBERG. Chairman Stewart and Members of the Com-mittee, thank you for the opportunity to testify today. My name is John Vandenberg, and I am a Division Director in EPA’s National Center for Environmental Assessment in the Office of Research and Development. My division is responsible for identifying and evaluating the world’s scientific literature to create the Integrated Science Assessment, which I will refer to as the ISA, for ozone. The ISA serves as the scientific foundation for decisions by the Admin-istrator on retaining or revising the National Ambient Air Quality Standards, which I will refer to as the NAAQS, for ozone. My testi-mony today will include a brief overview of the process for review-ing the NAAQS including how the ISA fits into this process, the scientific information related to background ozone levels in the United States.
The process for reviewing the NAAQS contains four major com-ponents: science assessment, risk and exposure assessment, and policy assessment and rulemaking. The ISAs are developed by the Office of Research and Development to evaluate the atmospheric chemistry involved in pollutant formation and presence as well as the human health and environmental consequences of exposure. The risk and exposure assessment as well as the policy assessment are developed by the Office of Air and Radiation, and they draw from the ISA but they do not revisit the conclusions of the ISA. Each of these assessments undergoes independent peer review by the Clean Air Scientific Advisory Committee, or CASAC, and public review. The final stage of the NAAQS review process is rule-making, which involves developing a proposed decision, considering public comments, and completing the review with a final decision by the Administrator.
Ozone is one of six pollutants for which a NAAQS has been es-tablished under the Clean Air Act. Ozone in the atmosphere is not directly emitted from sources but rather ozone is formed in the at-mosphere by photochemical reactions involving sunlight and cer-tain air pollutants or precursors. Based on a strong body of evi-dence, in 2008 EPA lowered the NAAQS for ozone from the 1997 level of 0.08 parts per million to 0.075 parts per million.
The current review of the air quality criteria for ozone was initi-ated in October of 2008. The final ISA for ozone includes the eval-

76
uation of over 2,200 scientific studies, and those were released in February of 2013 after three reviews by CASAC. The final ISA in-corporated revisions based on CASAC and public comments. I have a copy here of half of the ISAs, twice as much as that.
In the February 2013 ozone ISA, EPA concluded there is clear, consistent evidence of a causal relationship between short-term ozone exposure and respiratory health effects. EPA also concluded that the current body of research provides consistent evidence for causal relationship between exposure to ozone and ecosystem ef-fects.
In the context of review of the ozone NAAQS, EPA generally de-fines background ozone in ways that distinguish between con-centrations that result from emissions of precursor pollutants that are relatively less controllable from those that are relatively more controllable through U.S. policies or through international agree-ments. In the current review of the ISA, defines background in three different ways. The most narrow definition is referred to as natural background, which includes those resulting from precursor emissions of only natural origin from all over the world such as from wildfires and stratospheric ozone intrusion. A second defini-tion is referred to as North American background, which is ozone concentration that would occur in the United States in the absence of manmade precursor emissions in continental North America in-cluding the United States, Canada and Mexico. The third definition is referred to as U.S. background, which includes natural back-ground plus manmade precursor emissions from all countries out-side of the United States including outside of Canada and Mexico.
Estimates of background concentrations in the United States, re-gardless of which definition is used, cannot be obtained directly from measurements of ozone. Instead, air quality models are used to estimate background concentrations, and this approach has been supported by CASAC. The ISA included several recent modeling studies which showed that background concentrations vary by re-gion of the country and by season. These modeling efforts result in estimates of seasonal average North American background ozone levels of 29 plus or minus 8 parts per billion at low elevations. Modeling results also suggests that at high elevations, background concentrations can make up a greater proportion of measured ozone on some high-ozone days. In low elevations, background con-centrations make up a relatively small proportion of measured ozone on those high-ozone days. These results indicate that in low- elevation areas on high-ozone days, the ozone is mainly formed in the United States from U.S. manmade emissions.
In closing, EPA’s Integrated Science Assessment for ozone evalu-ates the scientific information on atmospheric monitoring and chemistry and on the health and welfare effects of ozone. This in-formation will be considered by the Administrator in the decision- making process for ozone.
Thank you for the opportunity to testify today. I am happy to an-swer any questions you may have.
[The prepared statement of Dr. Vandenberg follows:]
77
TESTIMONY OF
JOHN J.VANDENBERG, PhD
DIRECTOR, RESEARCH TRIANGLE PARK DIVISION
NATIONAL CENTER FOR ENVIRONMENTAL ASSESSMENT
OFFICE OF RESEARCH AND DEVELOPMENT
U.S. ENVIRONMENTAL PROTECTION AGENCY
BEFORE THE
SUBCOMMITTEE ON ENVIRONMENT
COMMITTEE ON SCIENCE, SPACE AND TECHNOLOGY
UNITED STATES HOUSE OF REPRESENTATIVES
JUNE 12, 2013

78
Chairman Stewart and Members of the Committee, thank you for the opportunity to testify
to this Subcommittee.
My name is John Vandenberg, and I am a Division Director in EPA's National Center for
Environmental Assessment in the Office of Research and Development. My division is
responsible for identifying and evaluating the world's scientific literature to create the
Integrated Science Assessment (which I will refer to as the "ISA") for ozone. The ISA serves
as the scientific foundation for decisions by the Administrator on retaining or revising the
National Ambient Air Quality Standards (which I will refer to as "NAAQS") for Ozone. The
Clean Air Act requires a review of the NAAQS for ozone every 5 years. My testimony today
will include a brief overview of the process for reviewing the NAAQS, including how the ISA
fits into this process, and scientific information related to background ozone levels in the
United States.
The process for reviewing the NAAQS contains four major components: planning, science
assessment, risk/exposure assessment, and policy assessment/rulemaking. The ISAs are the
second component and are developed by the EPA Office of Research and Development to
evaluate the atmospheric chemistry involved in pollutant formation and presence as well the
human health and environmental consequences of exposure. The third component, the Risk
and Exposure Assessment (REA) as well as the Policy Assessment are developed by the
Office of Air and Radiation and draw from the ISA, but do not revisit the conclusions of the
ISA. The REA presents quantitative analyses characterizing exposures and risks, including
uncertainties and relative confidence in results. The Policy Assessment integrates and
interprets the information from the ISA and the Risk and Exposure Assessment. It frames
the range of policy options that are supported by the scientific evidence and assessments
for consideration by the Administrator. Each of these assessments undergoes independent
peer review by the Clean Air Scientific Advisory Committee (or CASAC) and public review.
The final stage of the NAAQS review process is rulemaking, which involves developing a
2

79
proposed decision, considering public comments, and completing the review with a final
decision by the Administrator.
Ozone is one of six pollutants for which a NAAQS has been established under the Clean Air
Act. Ozone in the atmosphere is not directly emitted from sources, but rather ozone is
formed in the atmosphere by photochemical reactions involving sunlight and certain air
pollutants, or "precursors", contributing to what we typically experience as "smog" or haze.
Based largely on a strong body of evidence showing ozone-induced respiratory health
effects, in 2008, EPA lowered the NAAQs for ozone from the 1997 level of 0.08 parts per
million (ppm) to 0.075 ppm
The current review of the air quality criteria for ozone, as required every 5 years by the Clean
Air Act, was initiated in October of 2008 with a call for information and subsequent
development of a draft ISA. The finallsA for ozone and related photochemical oxidants
includes the evaluation of over 2200 scientific studies and it was released in February 2013
after three reviews by CASA(. The finallsA incorporated revisions based on CAsAC and
public comments on the drafts of the IsA.
In the February 2013 ozone ISA, EPA concluded there is clear, consistent evidence of a causal
relationship between short-term exposure to ozone and respiratory health effects, which is
consistent with the previous scientific assessment, completed in 2006. EPA also concluded
that the current body of research provides consistent evidence for a causal relationship
between exposure to ozone and ecosystem effects, including visible foliar injury, decreased
photosynthesis, and decreased growth rates.
In the context of a review of the ozone NAAQS, EPA generally defines "background" ozone
concentrations in ways that distinguish between concentrations that result from emissions
of precursor pollutants that are relatively less controllable from those that are relatively
more controllable through U.S. policies or through international agreements with other
3

80
countries. In previous NAAQS reviews, EPA used a specific definition of background
concentrations referred to as "policy-relevant" background (PRB). In this review, the ISA
characterizes background defined in three different ways. The most narrow definition is
referred to as "natural" background (NB), which includes ozone resulting from precursor
emissions of only natural origin from all over the world, such as from wildfires and intrusions
of stratospheric ozone. A second definition is referred to as "North American" background
(NAB, which is the same as the previously used PRB), which is ozone concentrations that
would occur in the U.S. in the absence of man-made "precursor" emissions in continental
North America, defined as the U.S., Canada, and Mexico. Thus, NAB includes "natural"
background plus man-made precursor emissions from other continents. The third
definition in the ISA is referred to as U.S. background (USB), which includes "natural"
background plus man-made precursor emissions from all countries outside the United
States, including Canada and Mexico.
Estimates of background concentrations in the U.S., regardless of which definition is used,
cannot be obtained directly from measurements of ambient ozone because of long·range
transport from man-made pollution in North America. Instead, air quality models are used to
estimate background concentrations and the approach to estimate background using
models has been supported by CASAC. The ISA included several recent modeling studies
which showed that background concentrations vary by region of the country and by season.
These modeling efforts result in estimates of seasonal average North American background
ozone concentrations of 29±8 ppb at low elevations. Modeling results also suggest that at
high elevations background concentrations can make up a greater proportion of measured
ozone on some high ozone days. In low elevations background concentrations make up a
relatively small proportion of measured ozone on high ozone days. These results indicate
that at low elevation areas on high ozone days that ozone is mainly formed from U.S. man
made emissions. lower background ozone is estimated in the summer (than in the spring)
when measured ozone concentrations are usually the highest.
4

81
In closing, EPA's Integrated Science Assessment for ozone evaluates the scientific
information on atmospheric monitoring and chemistry and on the health and welfare effects
of ozone. This information will be taken into account in the development of second drafts
of the Risk and Exposure Assessment and Policy Assessment for consideration by the
Administrator in the decision-making process on the National Ambient Air Quality Standards
for ozone.
Thank you for the opportunity to testify today. I am happy to answer any questions you may
have at this time.
5

82
Biography of Dr. John Vandenberg
Dr. Vandenberg is Director of the Research Triangle Park Division of the National Center for Environmental Assessment at the US Environmental Protection Agency. He is responsible for leadership, planning and oversight of EPA's Integrated Science Assessments for the major (criteria) air pollutants and Integrated Risk Information System (IRIS) assessments for high priority hazardous air pollutants.
He began working at EPA in 1984, and was responsible for performing national-scale exposure and health risk assessments for numerous hazardous air pollutants. Following a year on assignment from EPA to the State of California to help develop risk assessment guidelines, he joined EPA's Office of Research and Development as Director of EPA's Research to Improve Health Risk Assessments program. In recent years he served as EPA's first National Program Director for particulate matter research and as acting director of EPA's Human Studies Division, and Experimental Toxicology Division. In recent years Dr. Vandenberg was Associate Director for Health at NCEA, where he had oversight responsibilities for much of EPA's health risk assessment activities.
Dr. Vandenberg has been a consultant to the World Health Organization and has represented EPA in scientific meetings in Europe, South America, Africa and Asia, and he serves on numerous scientific advisory committees. In 2006, he was elected a Fellow of the Society for Risk Analysis. He is an adjunct professor at the Nicholas School of the Environment at Duke University and since 1991 he has taught a graduate-level course in air quality management.
He received his MS and PhD from Duke University in biophysical ecology and his B.A from the College of Wooster, Ohio.
83
Chairman STEWART. Thank you, Dr. Vandenberg. I thank, again, all of the witnesses for your testimony. I would like to remind Members that the Committee rules limit questioning to five min-utes, and the chair will at this point open the round of questions, and the chair recognizes himself for five minutes.
Once again, I think that your expertise and the experience that all of you bring to this panel, we greatly appreciate that. Some of you know that I represent the State of Utah. Salt Lake City is a big part of my district. It is one of the most beautiful cities in the country, I believe, right at the foothills of the Wasatch Range, but because of geography primarily, we from time to time have inver-sions come in in the winter and ozone becomes a real problem for us. I have children. Some of them have respiratory illnesses, which was aggravated by these conditions. Ms. Bonamici mentioned in her opening statement children’s health, and I appreciate that she did that. This is something that all of us would like to address. Something that all of us would like to make better if we can.
Dr. Dickerson, you talked about some of the progress we have made, and as well as some of the other witnesses, and we celebrate that and we should be proud of that, and I think most of us would agree that we want to help, we want to make this better if we can. Dr. Dickerson, you said something I would like to come back to in a moment for a question, but you said—paraphrasing, I think—you said it is not fair to penalize eastern communities or some eastern states with a standard that if we were to lower that standard would help those communities, and I would suggest that at the same time, it wouldn’t be fair to penalize western communities or western states with a regulation that is unachievable for them.
If I could bring up the slide that I used in my opening statement, and I know this is familiar to all of you, at least I am guessing that it would, you can see that vast swaths of this Nation that would be either not in compliance with the new standard if the EPA sets the standard at 60 – 70 parts per billion, as they have been dis-cussing. Would any of you—I will ask this individually very quick-ly—would any of you disagree with the statement that there will be parts of the country that cannot meet the new standard due to background concentrations of ozone? Ms. Smith, I will start with you. Would you disagree with that?
Ms. SMITH. Thank you, Chairman Stewart. No, I would not dis-agree with that. I think Utah is a case in point. We would have counties that would be unable to achieve the standard.
Chairman STEWART. Okay. And if I could emphasize that for just a minute while I am talking to you, Ms. Smith. I mean, if you look at a map of Utah—and Utah isn’t New York City, this is a very rural part of the country—and you can see some of the eastern and southern parts of my state where there are a few thousand people living, and the ozone that is created there is very small—very, very small parts of that are created by manmade activity.
Ms. SMITH. That is correct. If you look at the State of Utah, the lower southeastern county is San Juan County. That county has one major source.
Chairman STEWART. Yeah, one. Ms. SMITH. One.

84
Chairman STEWART. Other Members of the panel, would any of you disagree with that statement that there will be large parts of the country that would be in noncompliance because of naturally occurring ozone? Okay. So none of you disagree with that. Well, then I would ask very quickly, and maybe I will start with you, Mr. Vandenberg, and I would like to save a little time to come back to Dr. Dickerson, but I mean, what would those counties do? What do you suggest that they do then?
Dr. VANDENBERG. Thank you for your question. To go back to the question before you were asking whether background itself would lead to nonattainment in some counties, is that—did I understand what you were implying?
Chairman STEWART. Yes. Dr. VANDENBERG. I have to say, I am not sure if it would be the
case or not. The way the monitors are evaluated is to look at the fourth highest level in each of three years and average across those years, so I don’t—I am not aware of the data that would lead me to the conclusion to say yes. I apologize for——
Chairman STEWART. Okay. Other Members of the panel, would you think—Mr. Holmstead, would that be true, that there would be some parts of the Nation that would be in nonattainment because of background ozone?
Mr. HOLMSTEAD. I think that is almost certain to be the case, given the way that the standard is currently done.
Chairman STEWART. Okay. So let us assume that that is true be-cause that is the testimony of some, and our information indicates that is absolutely the case, then again, Dr. Vandenberg, what would you suggest those parts of the country do?
Dr. VANDENBERG. I believe that the key thing is to bring to bear the science information that is available. As I mentioned in my tes-timony, ozone is formed from precursor emissions from volatile or-ganic compounds and nitrogen oxides, and to look at the models to help evaluate what are the major contributors to the ozone levels and recognize that there are stratospheric intrusions as well as wildfires that contribute. And, as has been mentioned, there is the exceptional-events policy that may contribute to the evaluation of that.
Chairman STEWART. Okay, and I appreciate your answer, and my time is up, and I wish it wasn’t because I would really like to come back to Dr. Dickerson but maybe we will have a second round. I mean, for all of us, there is this, and it is worth repeating: If you are in a part of this country that cannot achieve compliance and there is nothing you can do about that because of naturally occur-ring ozone and yet the economic consequence of having to comply with an unachievable standard and the frustration that that would create on the parts of many people is certainly something that I think all of us would appreciate and be sympathetic to.
My time has expired. Again, I hope we come back for a second round. We will see how it goes. I now yield my time to the Ranking Member, Ms. Bonamici.
Ms. BONAMICI. Thank you very much Mr. Chairman, and thank you to all the witnesses again for your testimony.
Dr. Vandenberg, it is my understanding that the ISA review for ozone is one of the most extensive studies to date conducted by the

85
EPA. You said you have half of it with you; it is voluminous. Could you briefly discuss some of the recent evidence that demonstrates the harmful effect of ozone on human health?
Dr. VANDENBERG. Thank you very much for that question. There is a significant amount of new studies that build on prior studies regarding the health effects of ozone. These include hundreds of ep-idemiological studies of populations throughout the United States and the world. It includes controlled human exposure studies. It in-cludes toxicological studies, atmospheric sciences study, human ex-posure studies. There is a tremendous body of evidence. As I men-tioned in my testimony, there are over 2,200 studies that have been conducted that are included in this ISA, this is only half of them, and over a thousand of those studies are on health effects, so we have the great benefit here of tremendous scientific weight that un-derscores the nature of that evidence, and what is very clear about it is, it is very clear and coherent. A lot of the data fits together very nicely. We have got consistency in the results in terms of res-piratory effects caused by exposure to ozone, and it is clear to me that with our Clean Air Scientific Advisory Committee, that there is strong endorsement for the strength of that science and how it can help inform ultimately the decision making that will be down the road.
Ms. BONAMICI. Thank you. And you mentioned in your testimony about the three definitions for defining background ozone. Could you talk a little bit more about that, expand on that, and how did this approach aid in analyzing the scientific literature for the re-view?
Dr. VANDENBERG. Again, thank you very much. I think as the science has evolved, and as the other witnesses noted, in the last 40 years we have had tremendous advances in terms of both air quality management programs but the science that underlies that, and in this document, the Integrated Science Assessment, what we have done is, we have recognized that a broader set of definitions may be informative as we move forward. So we have brought to bear this sort of idea that you look at the world’s background influ-encing the United States, you look at the North American back-ground, which includes Canada and Mexico, and you include just North America—or just the United States—excuse me. So what that does is, it gives us more information, and I think a key feature here is, we want to be as inclusive as we can in terms of informa-tion to bring to bear as we move that into the decision-making process.
Ms. BONAMICI. Thank you. And Dr. Dickerson, thank you for your testimony. You had talked
about how you have worked on the exceptional-event process and the issues with the State of Maryland, and you also mentioned in your testimony, you offered some assistance to states in this excep-tional-event process. I wonder if you could discuss a little bit about what you are offering and what assistance might be available to States as they go through this process, which Ms. Smith noted in her testimony was onerous.
Dr. DICKERSON. Thank you. I am sympathetic. It took quite a bit of work for the State of Maryland to get its exceptional event ap-proved. The NASA AQAST, Air Quality Applied Sciences Team,

86
has a number of scientists around the country who are very clever at using satellite information and other NASA information to help identify natural events or forest fires from both space and in situ measurements. For example, in answer to Mr. Stewart’s question, what would you do if there were a tremendous amount of ozone above 60 ppb at some beautiful—and I agree completely that Utah is a spectacularly beautiful state. I love going hiking there. And if you are on top of a mountain and the ozone is above 60 ppb, the answer to that question is, you can monitor with commercially available instruments that have a proven track record, other pol-lutants, other trace gases like carbon monoxide comes out of tail-pipes or oxides of nitrogen, and if the ozone is high and those other pollutants are not high, this is not a controllable event; it is prob-ably a natural event. We know how to identify them, and that is pretty conclusive scientific proof that this is not a controllable ozone occurrence. So that is what I would recommend.
Ms. BONAMICI. Thank you. And I want to go back to Dr. Vanden-berg because there are concerns raised about the inability of states to comply if the standard is lowered. Do you believe that the new definitions or these three definitions plus the exceptional-event process could result in states being able to comply even if the standards are lowered?
Dr. VANDENBERG. I think one of the recognitions that we have is that the process of standard setting and then implementation are sort of phased. First, we set the standards and then we implement them. A lot of information is brought to bear there. I don’t think you can speak to a particular situation as to what would be the ap-proach that you would use, and I think the strength of our science is that we have a variety of tools that we can apply to help evalu-ate the types of events that are occurring. The key here is to use the science to its best advantage.
Ms. BONAMICI. Thank you, and I see my time is expired. I yield back. Thank you, Mr. Chairman.
Chairman STEWART. Thank you, Ms. Bonamici, and Mr. Dickerson, thanks for answering my question, and if I could just comment quickly regarding that.
You know, you took a very reasonable response to that, and I would hope that would be the case, but my fear is that the regula-tions wouldn’t allow for the latitude of looking at what is naturally versus what was manmade and that the control or some of the mechanisms would kick in that would, you know, again, not allow for the latitude that you described, but we can talk about that after, perhaps.
We now recognize Mr. Weber for five minutes. Mr. WEBER. Thank you, Mr. Chairman. Mr. Dickerson, I want to go back to something you said in your
testimony, and I didn’t catch all of it at the time. You said that some of the ozone occurrences that you saw were above 10,000 feet.
Dr. DICKERSON. Yes. We have flown aircraft over the eastern United States, and you can see what are called stratospheric intru-sions. That is a fancy expression for just natural ozone coming down from the stratosphere, and you can identify it by high ozone but it is very dry and there are no indications of pollution in it. I have never seen one of these reach the Earth’s surface in the east-

87
ern United States, though. I would love to. It would be very excit-ing. I would probably ask my colleague Sam to help me write a paper on it.
Mr. WEBER. Okay. It sounds like you might be a little bored at times, I will tell you. You said that they didn’t occur except—they weren’t substantial except out West. So those don’t occur very often in the East?
Dr. DICKERSON. They are more frequent at high altitude states. Mr. WEBER. Okay. And I will follow up on what you said earlier
about assistance to states. Let us go back to that scenario for a minute, and before we do, if I remember correctly, a lot of the NOX gases, according to the EPA’s own admission or should I say emis-sion, they have come from—70 percent of those come from non-sta-tionary-point sources. Is that correct? Or maybe that is a question for Dr. Vandenberg.
Dr. DICKERSON. No, I can address that. In the United States as a whole, I think about 40 percent from vehicles, and the remainder, there are a lot of power plant and boilers and then a number of small sources including agricultural.
Mr. WEBER. But non-stationary? You are saying it is only 40 per-cent of noxious gases come from non-stationary-point sources?
Dr. DICKERSON. The total—the single largest source of oxides of nitrogen in the United States is now, according to the EPA esti-mates, tailpipe emissions from vehicles.
Mr. WEBER. Okay. And so basically can you explain why it is that in the Northeast where there is a higher concentration of peo-ple and probably more vehicles, why there is less concentration there than over in the West or in the central part of the country?
Dr. DICKERSON. Okay. I think your question is, why is there more NOX in the Northeast than there is——
Mr. WEBER. Why isn’t there? Dr. DICKERSON. Oh, isn’t. There is. There is a picture we will
show you concentrations of NOX are higher certainly in urban areas than in rural areas, and they are generally higher in the eastern United States, excluding California, than in the western United States.
Mr. WEBER. So due in large part to a lot of the vehicles you would say, but you are saying only 40 percent?
Dr. DICKERSON. They are an important source, absolutely. Mr. WEBER. Okay. You said in one of my colleague’s questions,
assistance to the states, that if there was an event that was identi-fiable, you could provide assistance to the states and then you said it not a controllable event, it is a natural occurrence.
Dr. DICKERSON. There are natural occurrences such as strato-spheric intrusions. These are identifiable from the meteorology. Sometimes they can be seen from space. And if a full monitor, a full air-pollution monitor were there, you would——
Mr. WEBER. So are you suggesting that in a real-time basis, the Federal Government would get involved and interact with the states and say we have this event going on and we need to send you some assistance to take care of it?
Dr. DICKERSON. I don’t know about the real-time part but cer-tainly there are ongoing efforts from me and my colleagues at the University of Maryland and another couple dozen universities

88
around the country where we use NASA observations to iden-tify——
Mr. WEBER. Well, it scares me when you get the Federal Govern-ment involved with the states because we are fixing to put more regulations on them. Strings come attached with everything that the feds tell the states to do. How often do those occur? Once a year, twice a year, every month, every day, every week?
Dr. DICKERSON. Forest fires are extremely common and identifi-able.
Mr. WEBER. So you are basically describing what is happening out West, and I am running out of time here, so forgive me.
Let me jump over to Dr. Vandenberg for just a second. You said, Dr. Vandenberg, in your testimony, it scares me a little bit because it doesn’t seem commonsensical. Of course, let me just be sarcastic for a minute. I think when it comes to common sense, the EPA may be in nonattainment, okay? You said first we set the standards and then we implement them. Wouldn’t it be commonsensical to have a stopgap measure that says what effect does this have on indus-try? What are we fixing to mandate—that is a Texas term, ‘‘fixing.’’ What are we fixing to mandate on industry and are we fixing to drive everybody’s cost of fuel, heating oil, electricity, and every-thing sky high because we are going to mandate on the industry? Shouldn’t that be considered, Dr. Vandenberg?
Dr. VANDENBERG. Thank you for your question. The way the Clean Air Act is constructed is I think the science is brought to bear to set the standards and then the states are evaluating their air quality conditions and developing state implementation plans in order to attain those standards or maintain the air quality that is necessary. So I think it is the relationship between the Clean Air Act and the process is, it is develop the standards and then work with the states’ state implementation plans, evaluate the moni-toring data, look at the sources as you were just discussing, and then determine the appropriate approaches that would lead to at-tainment and maintenance of acceptable air quality.
Mr. WEBER. Well, there is a lot more I could say, but Mr. Chair-man, thank you. I am out of time and I yield back.
Chairman STEWART. Yes, you are, sir. Thank you, Mr. Weber. And now Mr. Takano.
Mr. TAKANO. Thank you, Mr. Chairman, and thank you to our witnesses for sharing your expertise today.
Clean air is an issue that is vitally important to my constituents. I am reminded of it every time I enter this committee room and I look over to see the portrait of former Chairman George Brown hanging above me. Congressman Brown represented parts of River-side County in my own district during his 34 years of service in the House, and during that time he was a champion for science and fought to improve air quality for millions across the country. He was an early supporter of the legislation creating EPA and worked to include ozone provisions in the Clean Air Act. It is because of leaders like George Brown that we have seen air quality in south-ern California make great improvements.
Growing up in Riverside, I remember days where we couldn’t go outside for physical education class because the smog was so bad, days where you couldn’t even see the mountains. In the 1970s, the

89
ozone levels in southern California exceeded Federal health stand-ard levels more than 200 times out of the year. And thanks to a lot of hard work and coordination between federal, state and local stakeholders, we have cut that number of days in half. Guidance from EPA has been and will continue to be a critical component of efforts to improve air quality in southern California, and I am glad to learn more about the process of these standards today.
My first question, Ms. Smith, do you—can you tell me about your background, your academic training? Do you have any degrees, un-dergraduate degrees or advanced degrees, that are scientific in na-ture?
Ms. SMITH. I do not. I have a degree in political science and his-tory and law.
Mr. TAKANO. And so your assertion today that there are parts of this country that could not meet these standards, is that an evalua-tion based on science or based on background training that is more political and legal in nature?
Ms. SMITH. That is actually an assessment that is based on the hundreds of air quality scientists and engineers that work for the Department of Environmental Quality.
Mr. TAKANO. But you yourself do not have academic background in science?
Ms. SMITH. That is correct. Mr. TAKANO. But you are here as an expert witness to offer a sci-
entific—or is it a scientific or a political assessment? Ms. SMITH. Actually, I was asked to come and give a state’s per-
spective on the policy implications and the ability for the states to actually implement and create a plan to——
Mr. TAKANO. Thank you very much. Mr. Holmstead, can you tell me whether or not you have any scientific advanced degrees or un-dergraduate training?
Mr. HOLMSTEAD. No, and I don’t purport to do that. My role in this meeting as well as in much of my career is to deal with regu-latory policy and how it works, and so that is my view here this morning is to talk about how the Clean Air Act works from a regu-latory perspective and so I rely on others, and I think all of them have agreed, that there are sources that cannot be controlled in the United States that contribute to a large share of the problems that we have here. So I don’t think there is any scientific dispute about that. I think the question is, well, what do you do once you recog-nize that those are the data.
Mr. TAKANO. All right. Dr. Vandenberg, you believe that the major basis on which we should establish levels of ozone that are acceptable should be based on the science concerning what ozone does to the health of the public. Is that right?
Dr. VANDENBERG. Right. There is a tremendous body of evidence, scientific evidence, on the health and environmental effects that ozone produces with exposure.
Mr. TAKANO. And it points to the level of 60 parts per billion. Is that right?
Dr. VANDENBERG. Again, I am not going to speak to the specifics in terms of a level but the scientific evidence does go from higher levels down to 60 and below. We look at the entirety of the expo-sures that are occurring. Some are relatively low, some are rel-

90
atively high, and we look at the relationships between those expo-sures and effects.
Mr. TAKANO. Do you agree or disagree with the Chairman’s as-sertion that parts of this country could not comply or would not be able to attain these ozone standards as proposed? Or is the sci-entific evidence somewhat inconclusive?
Dr. VANDENBERG. What I would like to say is, as I understood the question, was whether the background levels of ozone would lead to nonattainment areas, if I am correct about that, and that is where I would have to say we would have to look at the mod-eling that has been done as well as consider those exceptional events that occurred to make those judgments. I can’t say that there are any places that would not meet the standard specifically because of background levels. Background contributes to the ozone but on top of that is the human-derived emissions.
Mr. TAKANO. Thank you. Mr. Dickerson, same question. Dr. DICKERSON. Good question. I do not know conclusively if
there are areas that would fail to meet a 60 ppb. There are cer-tainly areas in the western United States where it might be dif-ficult.
Mr. TAKANO. Okay. But Ms. Smith, you categorically believe that there would be?
Ms. SMITH. Based on what we have looked at in terms of the monitoring that we have seen coming from the State of Utah, there are counties that would not meet the 60 ppb from past history.
Mr. TAKANO. Okay. I have heard the scientists be inconclusive but you are absolutely certain?
Ms. SMITH. Yes. Mr. TAKANO. Thank you. Chairman STEWART. Thank you. Before we go on, I would like to
note that I was very clear in my questioning to the panel. I gave you each the opportunity to say do you disagree with that asser-tion, and none of you spoke up at that point. I am hearing some-thing slightly different right now, which again, we may follow up with additional written questions.
The full Chairman, Mr. Smith, we will give you your five min-utes for questions.
Chairman SMITH. Thank you, Mr. Chairman, and let me apolo-gize. I am having to shuttle back and forth between this Committee and another committee I sit on, which is marking up two bills, so I am trying to go to one place and ask questions and then another, and if these questions have been answered, let me know and we can go on.
Mr. Holmstead, let me address the first couple of questions to you. First is this: Of the 28 members of the Clean Air Scientific Ad-visory Committee review panel for ozone, 22 of the 28 are cited by EPA in the Integrated Science Assessment they have been asked to review. Is this consistent with the requirement in EPA’s peer- review handbook that ‘‘an independent peer reviewer is an expert who is not associated with the generation of the specific work prod-uct either directly or indirectly’’?
Mr. HOLMSTEAD. I have to say, I am not entirely clear of how EPA’s regulations work. I think people have raised legitimate issues about the need for people outside of this little community to

91
be involved in the process, but I can’t say whether is it a violation of the peer-review requirements.
Chairman SMITH. Okay. It seems on the face that it probably is if you go by the common definitions involved, so I will just say that that is my opinion and I look forward to hearing more about that from the others.
My next question, though, to you is, the EPA appears poised to rely on a single study to establish a link between ozone and chronic mortality despite the overwhelming weight of evidence from other studies. This study is based on data that has not been made public or verified by independent scientists. Would you agree that that is not the best way to pursue it and that is not the best way to make decisions?
Mr. HOLMSTEAD. I do think that a lot of us are troubled that im-portant decisions are made based on data that is not publicly avail-able, and I am a little surprised that that hasn’t been resolved be-fore now. The government has funded many of these studies. It is surprising that the data are not available to outside researchers. And again, these data sets are so enormous that there is just dif-ferent ways of looking at the data, and maybe Dr. Dickerson has more familiarity with it but I think we would all benefit from hav-ing public availability of data that are used to set regulatory and other requirements.
Chairman SMITH. And Dr. Dickerson, would you agree with that? Dr. DICKERSON. I am not really comfortable discussing EPA’s pol-
icy. I don’t work for the EPA. But I would indicate that if you were going to ask people to evaluate ozone science, that you would ex-pect all of them have written peer-reviewed scientific publications that would be cited in criteria documents or science assessments. How would you—that would forbid me or my colleague Sam from——
Chairman SMITH. You don’t want to exclude anybody who had been an expert on it. On the other hand, you don’t want to have a biased source that might have a vested interest in coming up with a predetermined conclusion either.
But let me ask you and Mr. Holmstead a related question, which is, you have got the EPA’s Inspector General currently reviewing potential conflicts of interest and a lack of impartiality among the Clean Air Scientific Advisory Committee. Don’t you think that we should maybe wait until we see what the Inspector General has to say before we issue too many more regulations that might involve conflicts of interest and a lack of impartiality? Mr. Holmstead?
Mr. HOLMSTEAD. There certainly are legitimate issues that have been raised. I don’t know anything about the IG investigation, but I do think it is good for—you know, I am a little uncomfortable about some of these issues because I am not as familiar with them, but I do think it is good to have all of these things aired publicly so that we really understand more about the data on which these decisions are made and who it is that—and what interests they may have.
Chairman SMITH. Okay. Thank you. Dr. Vandenberg, the person you report to is Dr. Kenneth Olden,
who is Director of the National Center for Environmental Assess-ment at EPA. Dr. Olden has said, ‘‘Studies used in the formation

92
of regulations should be subject to data access requirements re-gardless of who funded the study.’’ He has followed this rec-ommendation as head of the National Center. Do you agree with his statement?
Dr. VANDENBERG. Thank you for that question. This is a complex area because some of the studies that we are referring to here in-clude private individual medical information and so I think what is essential is to assure the protection of an individual’s private——
Chairman SMITH. I am not talking about classified or confiden-tial information but just in general do you agree with Dr. Olden’s standard?
Dr. VANDENBERG. That the data should be available? Chairman SMITH. Yes, correct. Dr. VANDENBERG. Of course, yes. Chairman SMITH. Good. Thank you, Dr. Vandenberg. Thank you,
Mr. Chairman. Yield back. Chairman STEWART. Thank you, Mr. Chairman. The final ques-
tions will come today from Ms. Edwards. Ms. EDWARDS. Mr. Chairman, thank you, and I actually hope we
do go to a second round of questions. Dr. Dickerson, my question is for you. A key to some recent find-
ings is the discovery of a chemical signature that differentiates emissions from oil and gas activity from those given off by auto-mobiles, cow manure, or other sources of volatile organic com-pounds. The finding was fundamental to the conclusion that oil and gas activity contributed about 55 percent of the volatile organic compounds linked to unhealthy ground-level ozone. Can you please tell me whether this chemical signature will help determine how much ozone levels are due to things like gas wells versus the im-pact in a metropolitan region such as ours where we experience high levels of ozone, bad air quality, and we are always at the top of those lists? Can you tell me how you think those—that chemical signature could help in making determinations for EPA and using its flexibility in setting ozone standards?
Dr. DICKERSON. Yes, I would be happy to. I have to say wow, I didn’t expect such technical questions. It is absolutely true that oil and gas operations have a characteristic signature of isomers of pentane and other hydrocarbons that allow you to differentiate those from tailpipe emissions, and these are indeed useful inves-tigations. Ozone can be made in a power-plant plume that has one chemical signature. It can come from tailpipe emissions. That has a different—forest fires are not as efficient as internal combustion engines but they can make ozone as well. They have yet another chemical signature. And all of these are indeed distinguishable by hydrocarbon ratios as well as other trace gases and aerosols.
Ms. EDWARDS. So let me just ask this, and maybe this goes to Mr. Vandenberg. Wouldn’t it be the case that if we are able to make those distinctions in the source by this chemical signature, that that could enable us to make adjustments in a way that would accommodate some of the interests of some states that are claiming or regions that are claiming to produce ozone that they don’t have—where there is ozone present, they don’t have any control of and we might actually use—the EPA could use its regulatory au-

93
thority to make some distinctions in those regions so we really do get at the heart of the problem?
Dr. VANDENBERG. Thank you for the question, and again, to rein-force the comment, I think with the advancements in science in terms of looking at chemical signatures, that is the kind of infor-mation that I think helps inform the decision making downstream in terms of what is a natural event, what is a source of the contrib-utors to the ozone that is in the air, and I think that is a very im-portant type of information that can be brought to bear.
Ms. EDWARDS. And Mr. Oltmans, I probably should direct this really to you because it is the work of the scientists at the Coopera-tive Institute for Research and Environmental Sciences at the Uni-versity of Colorado that you are representing that actually helped to reach this conclusion. How do you think the discovery can clarify some of the questions that we have about background ozone levels and contribute to EPA’s research and review process?
Mr. OLTMANS. Yes, I am familiar with the work that you are dis-cussing. Most of it took place in the front range of Colorado, Utah and in Wyoming. Personally, I am not sure that this is that impor-tant a factor in determining the role of background ozone. One of the things I think that is misinterpreted about background ozone, it isn’t that often that background ozone itself leads to a violation of the standard but it gives very little room for regulatory control to bring ozone levels down to the standard. In other words, it is very unusual for ozone to be 60 parts per billion in what would be considered background conditions. But as you push up close to 60 parts per billion on the background, it is very difficult to find any regulatory scheme that will reduce the result from photochemically produced ozone either over a region or locally to be controlled and meet the standard. I think that is one of the things that needs to be considered, and background ozone itself is not the violation of the standard by the background but how difficult it makes it to control.
Ms. EDWARDS. I think I understand that. I guess my point, and we can get to this at some other point, I suppose, is that knowing, for example, that 40 percent is coming from that background ozone that we don’t have any control of, would that allow then the EPA to exercise somewhat more flexibility in those areas in order to have ozone settings that actually reflected the things that we could have control over? Anyway, I think my time is expired. I hope we get to a second round.
Chairman STEWART. Thank you, Ms. Edwards. Many of us would actually really appreciate the opportunity for a second round. How-ever, the nature of what we do being what it is, a couple of us have to go another committee where they are holding votes for us now, so unfortunately, we won’t be able to take that opportunity at this time. However, I would like to remind Members that we can follow up with written questions, and several of us intend to do that.
I thank the witnesses for your valuable testimony and Members for their questions, and as I said, Members of the Committee may have additional questions, and we will ask you to respond to this in writing. The record will remain open for two weeks for addi-tional comments and written questions from the Members.

94
With that, the witnesses are excused and this hearing is now ad-journed.
[Whereupon, at 11:26 a.m., the Subcommittee was adjourned.]

(95)
Appendix I
ANSWERS TO POST-HEARING QUESTIONS

96
ANSWERS TO POST-HEARING QUESTIONS
Responses by Ms. Amanda Smith
97
Page 2 Hearing Questions for the RecordlResponses AchievabiIity of New Ozone Standards Ms. Amanda Smith
on ozone using statistiad analyses and the scattered monitoring data that are available, but it is extremely difflcult to meet EPA's standard of proof, especially in urban areas where there are multiple confoundingjactors.
b. Question: How confident are you that stratospheric intrusions would be covered under EPA's "exceptional events?"
Response: Researchers have determined that stratospheric intrusWn can be a big contributor to background ozone, especially in the higher elevations of the intermountain west There is a working group guided by technical stIlff at EPA, Region 8 to develop a protocol for characterizing stratospheric ozone intrusWn events. This process is just beginning, however, so it could be a long time before these events are formally recognized by EPA and covered under the Exceptional Event's Policy.
We are most confident that this process will be successfol at rural monitors when there is a sudden spike in ozone that is clearly linked to a specific meteorological event. It will be much more difflcult to quantify the smaller impact that occurs downwind over the period of several days, especially in an urban area where the impact may be enough to cause an exceedonce of the stondard (a few ppb) but is not enough to cause an obvious spike in the monitoring daUz. There are huge areas of the intermountain west with no monitoring data making it more difficult to determine the downwind effects of a stratospheric intrusWn event.
2. EPA has also claimed that the Clean Air Act allows for special treatment for places where air quality would meet ozone standards "but for" emissions from another country.
Question: Ms. Smith, are you confident that EPA would use this authority and not punish Utah or other Western states for ozone concentrations driven by Asia?
Response: The.first hurdle will be the burden of proof. EPA's intentions are good, but it will be difficult to make a' demonstration that requires global modeling in additWn to the modeling of local impacts. Section 179B of the Clean Air Act provides some relief for international barder areas, but many of the mandatory m'-res are stlIl. required in the local area, even if they will have little effect on ozone levels in the area. The Clean Air Act provides EPA with limited flexibility in these circumstonces.
3. When EPA proposed a new ozone standard of between 60 and 70 parts per billion at the beginning of this Administration, they estimated that it could cost up to $90 billion making it the most expensive environmental regulation in history.

98
Page 3 Hearing Questions for the RecordIResponses Acbicvability of New Ozone Standards Ms. Amanda Smith
Question: Ms. Smith, do you have any reason to think a new regulation in that range would cost any less now?
Response: UDEQ has not evaluated the cost estimates in the previous proposal ami is not able to determine what costs may be different today.
4. Question: Ms. Smith, ifEP A lowers the current ozone standard to a level that would be unachievable for parts of Utah due to high and uncontrollable background levels, what would be the economic and regulatory consequences for the state? What happens to an area that does not meet the National Ambient Air Quality Standards?
Response: Depending on the level of the standard, the entire state of Utah could be desigtUlfed nomlttainnumt This would begin tuegula:tory process that would require tremendous resources from the state to develop SIPs for different areas of the state that have elevated ozone levels at different time of year and due to different causes. Every county that is designated nonatltzinment would have economic consequences as described more fully in question 6; leading to significant impacts on the State's overall economy. If an area is not able to attain the standard after implementing the mandatory measures in the Clean Air Act, the area is progressively bumped up to the next higher classijication, requiring increasingly more stringent controls that may do little to reduce ozone in the aref4 Sanctions may also be required, even though the State does not have the ability to control background ozone levels.
5. Question: You testified that.EPA has yet to approve any of the exceptional event demonstrations that Utah has submitted on particulate niatter since 2008. If EPA acts similarly Jor ozone exceptional event demonstrations, could Western states like Utah face perpetual non-attainment under a more stringent ozone NAAQS?
Response: Utah has submitted 12 exceptional demonstrations to EPA for past exceedances of the PM stondartls dating back to 2008. These demonstrations are relatively straight forward, the result of wind -bloWn dust and wild fire smoke impacts. Ozone is a secondary pollutant formed in the atmosphere and a demonstration of exceptional event impacts is much more difflcult, usually requiring a photochemical model. Until there is progress on review of the PM demonstration, Utah sees no point in expending resources to develop any ozone exceptional event demonstrations. This could potentially result in a non-attainment situation that cannot be solved locally.

99
Page 4 Hearing Questions for the RecordlResponses Acbievability of New Ozone Standards Ms. Amanda Smith
6. . According to your written testimony, "[fEP A moves forward with a more stringent standard without workable measures to address background ozone, it will guarantee failure for Utah, leading to severe consequences for the State"
Question: Can you explain in more detail the economic consequences that counties designated as non-attainment could face as a result of this guaranteed failure?
Response: The Clean Air Act imposes consequences in several different ways. The Jirst layer of consequences is the imposition oflimits on growth that will adversely affect economic development. These limits are found in the New Source Review program that requires new major sources to obtain offietting emission reductions from existing sources before they can be constructed - an impossible hurdk in many rural areas. Limits on growth are also found in the conformity provisions that require federal land managers to ensure that there is no emission increase due to new federal actions 01'
federal funding. General conformity will be probkmatic for mining and oil and gas operations that require federal kasing or permits. The second layer 0/ consequences is t/uf imposition o/mandatory control requirements, such as fuel formulations, transportotlon control measures, and inspection and maintenance programs for vehicks. These controirequirements will impose direct costs on businesses and the general pubUc while providing Uttk beneflt in rural areas where local emissions have little effect on ozone kvels. /fthe area does not attuin the stfIndard it is bumped up to a higher classijlcation requiring additional mandatory controls. /fthe mandatory measures do not bring an area into attuinment. all feasibk control measures must be implemented in the area, imposing additional costs. The third layer 0/ consequences is the sanctions that EPA imposes if an area is not abk to develop a successful SIP or is not abk to attuin a stfIntlard. These sanctions include withholding o/highway funding 01' further restrictions on growth.
7. Businesses seeking to construct or expand major projects outside of a non-attainment area must demonstrate that the project's ozone emissions will not result in an exceedance of the ozone NAAQS.
Question: Could lower ozone NAAQS make it difficult for businesses to demonstrate compliance in counties that, while being in attainment, have high background ozone levels? Put simply. does this mean that a lower ozone NAAQS could stop economic development even outside of designated nonattainment areas?
Response: Permittingprograms under Parts C amiD o/the Federal Clean Air Act require new sources or modlftcations to existing sources to demonstrate that they wiU

100
PageS Hearing Questions for the Record/Responses Achievability of New Ozone Standards Ms. Amanda Smith
not cause or contribute to a violation of an air quality standard. In rural parts of the State this technical demonstration largely has been made based on monitoring values that fll'e well below the ozone standfll'd. As the standard is lowered it becomes more difficult to make this demonstratimt. The alternative is to model the source using a photochemical algorithm that can simulate ozone formation, a difficult and expensive proposition. lfthe background levels fll'e close to or exceed the NAAQS then it will be diJJicultfor any source to demonstrate that they will not cause or contribute to a violation of the ozone NAAQS.
Hearing Questions for the Record The Honorable Donna Edwards Bac:kground Check: Achievability of New Ozone Standards Ms. Amanda Smith
1. In your testimony you state, "Unfortuoately, just at the time when improved models, emission-inventories and research on western ozone issues are needed, EPA is facing funding constraints that will limit its ability to support new technical work, and will likely decrease their current efforts. Funding is also decreasing for important research activities' at the National Oceanic and Atmospheric Administration (NOAA) and for grants to support research at universities. States such as Utah do not have the resources to make up for the decreases in federal funding for these important technical tools."
Question: Can you discuss .fUrther the impact of these budget shortfalls at EPA and NOAA on those agencies' ability to rkJ exactly the things thot states like yours need?
Response: Ozone regulation under the 1990 Clean Air Act is based on scientiflc understatulingfrom the 1970s and 1980s. As was presented in the panel's testimony a lot has been iefll'ned in the last decade about the effects of things such as transport (both regional and international),jire,llghtnlng, elevation, and stratospheric intrusion on 1nu:kground ozone. These effects fll'e temporally and spatially varying throughout the US, though resefll'ch has shown that they have an inordinately high impact on the intermountain west. Additional research is neetkd from universities and federal agencies such as NOAA to improve our understanding of what is causing high 1nu:kground ozone values in the west because the issues fll'e still not weD understood.
In IlIldition to the research needs, states and EPA need technical tools to identifY 1nu:kground ozone levels that can't be controlled so that regulatory efforts fll'e focused on ozone that can be controlled. Photochemical modeling ls the tool to quantify the impacts from these "background" effects but the stIlndard models used e.g., CMAQ and C~ fll'e essentially research grade requiring tremendous resources and time to prepare and run. There is no quantitative evaluation tool for source permitting applications. Global models flt'e also required to quantify the effect of international

101
Page 6 Hearing Questions for the RecordIResponses Achievability of New Ozone Standards Ms. Amanda Smith
. tran$J1Orf. AtltIitiolUllmonitoring and meteorological tlIlta may be needed to provide the necessary inputs to the models. There tll'e large tll'eflS of the intermountain west that have lJttle or no monitoring tIaIil, including trllCe pollutants that may be needed to tletennine the source of ozone in the tll'efl.
There is stilI much to be leamed and developed in this. area and EPA should not promulgate II lower standard unless tools are prwided to the state to deal with the stanrlarrl. Small states such flS Utah do not have the resources to develop these tools.
Again, I want to thank you for the opportunity to testify on this issue to the Sub-Committee on Environment. Please do not hesitate to contact us if you have further questions.
Executive Director
Cc: Bryce Bird, Director, Division of Air Quality Brock LeBaron, Deputy Director, Division of Air Quality Taylor Jordan

102
Responses by Mr. Samuel Oltmans Responses of Samuel J. OItmans to questions submitted for the record by Members of the House Committee on Science, Space and Technology
1. EPA has claimcd most of the sources of background ozone can be dealt with through the Clean Air Act implementation process which allows for special treatment of so-called "exceptional events". What atmospheric conditions would fit within the Agency's interpretation of "exceptional events"? The most common high ozone events that may exceed the 8-hour standard are intrusions of stratospheric air that reach the ground, and somewhat less often, forest fire emissions that can photochemically lead to significant ozone enhancements. Considerable effort is required to justifY the declaration of a high ozone event as an "exceptional event", however, it is a proceedure with specific requirements that can be met. In most cases these types of events do not lead directly to exceedances of the 8-hour standard. Recent research (Lin et a!., 2012) has shown ,however, that these events can make a significant contribution to "background" ozone such that there is limited room for regional or local emissions reductions to achieve a standard as low as .060 ppm.
2. EPA has also claimed that the Clean Air Act allows for special treatment for places where air quality would meet ozone standards but for emissions from another country. Would the EPA use this authority for western states that could be impacted by Asian emissions? I am not familiar with cases where this authority has been exercised by the EPA. The primary contributions of emissions from outside of the U.S. is to elevate background ozone levels where emissions from Asia make a substantial contribution. These elevated background levels make emissions reductions that can be controlled through U.S. policies for a standard below .070 ppm very difficult to achieve based on a substantial background that can regularly exceed .050 ppm.
3. According to thc EPA, Yellowstone National Park would exceed ozone standards at the lower limits recommended to EPA by its Clean Air Scientific Advisory Committee. What can a remote area like this do to reduce ozone levels? For a standard below .070 ppm, local control of emissions would not be sufficient to reduce emissions to levels that could achieve the standard. Even a regional approach would likely not be sufficient to adequately reduce emissions. Since measured levels representative of background ozone may exceed .050 ppm, the ability to meet the lowest previously proposed standard is very limited since this background makes a major contribution even when photochemical production from U.S. emissions gives a modest enhancement (Lin et aI., 2012).
4. What are the public policy consequences of EPA using too low of an estimate for background levels over the western U.S.? Human health risk may be overestimated (see answers below related to human health risk). Based on measurements under PRB conditions similar to those experienced at the Trinidad Head, CA site, the amount of emission reductions associated with attaining a standard set at either the 0.060 or 0.065 ppm level may have to be fairly large. Thus the EPA's current assumptions concerning PRB, or any other forms of background ozone, result in
103
underestimations that will result in overly optimistic policy expectations as to the ability to lower ozone concentrations through emissions reduction requirement.
5. How do actual readings at remote monitoring locations compare with EPA's modeling of background ozone? In the cnrrent Integrated Science Assessment, a comparison of the model-derived background ozone values at Trinidad Head from the most recent version of the global photochemical model used for determining background ozone for the Assessment is significantly lower (up to 20 ppb) than observed values. This suggests background ozone is underestimated in the model since at Trinidad Head ozone levels under conditions representative of background are almost always higher than non-background conditions.
6. Could stratospheric intrusions of ozone and other natural events when combined with even modest modest levels of ozone resulting from anthropogenic emissions cause metropolitan areas in the Intermountain West like Denver to face perpetual nonattainment of ozone NAAQS at levels below .070 ppm? During the spring and early summer when background levels of ozone are relatively high, the incidents of ozone exceeding a standard below .070 ppm would increase substantially. Ozone photochemical production can be substantial during this time of year so that the a large contribution of background ozone leaves a much smaller margin to meet the standard through emissions reductions.
7. Do Policy Relevant Background conditions at low-elevation monitoring sites like Trinidad Head, California indicate that some areas may need to make fairly large emissions reductions in order to attain an ozone standard set at .060 ppm or .065 ppm? Monitoring sites such as Trinidad Head, CA that routinely make observations under conditions representative of background ozone as well as recent modeling efforts (Lin et aI., 2012) show that background ozone will make an important contribution to ozone levels at a standard below .070 ppm. With limited room between background ozone and the standard, emissions reductions may have to be unattainably large to meet the standard under cnrrent or near future (next 10 years) background ozone conditions.
8. Could the Environmental Protection Agency's current assumptions concerning ozone Policy Relevant Background lead the Agency to overestimate health benefits associated with reducing ozone?
EPA's PRB estimates, using its model, resulted in a maximum monthly average of diurnal concentrations in the 15 to 25 ppb range used in its risk analyses. These concentrations are far below actual PRB levels as reported by Lefblm (2007) and Oltmans and Lefolm (2005), as well as our most current results published in Lefolm et al. (2011, 2012). The Oltmans and Lefolm (2005) report was later published as a peer-reviewed paper in the peer-reviewed journal Atmospheric Environment (Oltmans et aI., 2008). The uncertainty associated with the Agency's assumptions in regard to Policy-Relevant Background, as well as other estimated forms of background, has an important role in developing confidence in the risk assessment results. Empirical data indicate that ozone concentrations under PRB conditions can be substantially higher than the modeled estimate. Long-range transport outside of North

104
America and natural processes, such as stratospheric intrusion, contribute to PRE ozone concentrations measured at the surface at both high and low-elevation monitoring sites. The modeled estimates made by the EPA for PRE ozone appears to be too low and therefore, the health benefits associated with reducing ozone will be overly optimistic.
9. Could the Environmental Protection Agency's current assumptions concerning ozone Policy Relevant Background lead the agency to have overly optimistic policy expectations as to the ability to lower concentrations through emissions reduction requirements?
Observations indicate that ozone concentrations under PRE conditions can be significantly higher than the EPA's modeled range of concentrations. The frequent number of hourly average ozone concentrations 2: 50 ppb indicates that the human health risk results may have been overestimated. If other ozone monitoring sites exhibit levels under PRE conditions similar to those experienced at the Trinidad Head, CA site, the amount of emission reductions associated with attaining a standard set at either the 0.060 or 0.065 ppm level may have to be fairly large. Thus, the EPA's current assumptions concerning PRE or any other forms of background ozone, result in underestimations that will result in overly optimistic policy expectations as to the ability to lower ozone concentrations through emissions reduction requirements.
10. Conld even slight changes to calculations of Policy Relevant Background have a significant effect on the Environmental Protection Agency's human health risk analysis for ozone? Based on its own analysis in its Ozone Staff Paper (EPA, 2007), the EPA's risk model was very sensitive to the choice of PRE ozone levels. Lefohn (2007) presented data showing that by using EPA's data from its Ozone Staff Paper (US EPA, 2007), changing EPA's estimated ozone baekground levels by 5 ppb for Los Angeles would result in a 62%, 72%, and 86% reduction in the estimates for non-accidental mortality for the Agency's various alternative proposed standards ("84/4", "74/4", and "64/4"). Lefohn (2007) noted that if EPA had used actual ozone data, which shows observed background ozone at levels 15 to 20 ppb higher than modeled background ozone, the amount of overestimate of non-accidental mortality would have been even greater than those described in the EPA StatI Paper (US EPA, 2007). Although the Agency is in the process of developing its risk analyses for the current ozone NAAQS review, indications are that the base estimates of background ozone may be low as they were in 2007 and thus, the health benefits may be overly optimistic.
References
Lefohn, A.S., 2007. Major issues inadequately addressed in the final version of the EPA's Ozone Staff Paper. Comments on the EPA Staff Paper, submitted to EPA.
Lefohn, A.S., Wernli, H., Shadwick, D., Limbach, S., Olttnans, S.J., Shapiro, M., 2011. The importance of stratospheric-tropospheric transport in affecting surface ozone concentrations

105
in the Western and Northern Tier of the United States. Atmospheric Environment 45, 4845-4857.
Lefohn, A.S., Wernli, H., Shadwick, D., Oltmans, S.1., Shapiro, M., 2012. QuantifYing the frequency of stratospheric-tropospheric transport affecting enhanced surface ozone concentrations at high- and low-elevation monitoring sites in the United States. Atmospheric Environment, 62, 646-656.
Lin, M., A.M. Fiore, O.R. Cooper, L.W. Horowitz, A.O. Langford, H. Levy II, BJ. Johnson, V. Naik, S.J. Oltmans, and C.1. Senff (20 12), Springtime high surface ozone events over the western United States: QuantifYing the role of stratospheric intrusions, J Geophys. Res .• 117, DOOV22, doi: 10.1 029/20 12JDO 18151.
Oltmans, S.1., Lefohn, A.S., 2005. Using empirical data to estimate policy relevant background for ozone exposures. Submitted to the U.S. EPA as part of the comments on the second draft of the Ozone Criteria Document.
Oltmans, S.J., Lefohn, A.S., Harris, J.M., Shadwick, D., 2008. Background ozone levels of air entering the west coast of the U.S. and assessment oflonger-term changes. Atmospheric Environment 42, 6020-6038.
US Environmental Protection Agency, US EPA, 2007. Review of the National Ambient Air Quality Standards for Ozone: Policy Assessment of Scientific and Technical Information OAQPS Staff Paper. EPA-452/R-07-007. Research Triangle Park, NC: Office of Air Quality and Planning and Standards. July.

106
Responses by Dr. Russell Dickerson
~. UNIVERSITY OF -~MARYLAND
Department of Atmospheric & Oceanic Science
July 17,2013
RE: Response to questions from The Honorable Donna Edwards
Computer and Space Sciences Building The University of Maryland College Park, Maryland 20742-2425 USA Tel: (301)405-5364 Fax: (301)314-9482 http://atmos.umd.edu
Ql: Should the EPA revise the standard to be 60 ppb, what additional techniques and efforts could be undertaken by states to meet tbat level?
A great deal can be done to improve air quality and achieve a standard even as strict as 60 ppb. The first issue is that individual states have limited options - for a standard that will truly protect human health, the entire US east of the Mississippi must be considered as an interdependent airshed. Actions such as the Cross-Slate Air Pollution Rule (CSAPR) are essential.
Ozone is produced in the atmosphere as a result ofthe sun's action on pollutants. Ozone production starts within hours and continues for several days. The relevant distance depends on meteorology, but the most important impact occurs a few hundred to a thousand miles downwind. For example, Baltimore will benefit from local emissions controls, but New Jersey will see the greatest reductions in ozone from actions taken in Chann City.
Make a level playing field across the US. All major point sources, even in upwind states that do not themselves violate air quality standards, must be required to control NOx emissions with selective catalytic reduction, deNOx, or other means. Major sources should be held to a perfonnance standard such as a maximum allowed NOx emission rate per kilowatt produced.
Target uncontrolled and under-controlled sources such as power plants without NOx controls, as well as institutional, commercial, and industrial (ICI) boilers.
Continued improvements in off-highway vehicles - these emit substantially more NOx per gallon of fuel consumed than do highway vehicles. The same is true for most boats and ships as well as older locomotives.
Strict enforcement of emissions standards for highway vehicles through inspection and maintenance as well as roadside monitoring - a small number of gross-emitters are responsible for a disproportionate amount of pollution.
Coordination with USDA for wise agricultural practices such as the judicious application offertilizer and no-till com.

107
• Continue progress on high efficiency appliances, well-insulated buildings, bike paths, and public transportation. Less energy consumed means fewer emissions.
• Minimize the Urban Heat Island effect. High temperatures exacerbate ozone production, but green roofs and a healthy urban tree canopy can help prevent excess heat.
Q2. Would you agree with some of the witnesses that not much more could be done?
While it is true that much progress has been made, ozone levels in and downwind of many urban areas in the US (including Prince George's County, MD) continue to pose a danger to human health and to the environment. My professional judgment is that much more could be done. Specific recommendations are provided in the answer to Q 1,
Sincerely,
Russell R. Dickerson, Ph.D. Professor
108
Responses by Mr. Jeffrey Holmstead Responses to Questions from the Honorable Chris Stewart
1. There are many activities that contribute to ozone formation but also provide important benefits to public health. You mention just a few of them in your
question agricultural activities, public health infrastructure, and the treatment and delivery of clean water. Thus, it is certainly possible that actions taken to
reduce ozone concentrations could actually harm the public by curtailing activities that are important to public health.
Even more fundamentally, electric power and transportation clearly provide
important benefits to society but also cause emissions that result in ozone formation. Efforts to reduce emissions have increased the cost of electric power and transportation (and many other goods and services), but cost
increases have thus far been relatively low in most areas of the country. In some parts of the country, however, it will be very costly to achieve further reductions in ozone formation beyond the reductions that gradually will be achieved as newer, lower-emitting cars, trucks, and non-road engines replace
older vehicles and engines. Requiring further emission reductions will mean tradeoffs, including public health tradeoffs, and I believe that EPA can and should consider these tradeoffs when it is evaluating the ozone standard and
how it should be set.
2. The "exceptional events" policy is designed to deal with unusual episodes such as forest fires or dust clouds that occur infrequently and are very difficult to predict. I understand that EPA is now revising the policy, but I do not see how it could be used to deal with background ozone effectively or fairly. Unless there are very significant changes in the policy - and the way in which it is implemented - it simply is not an appropriate way to deal with the issue of background ozone.
It may be instructive for the Subcommittee to gather information from states about their experience in dealing with the "exceptional events" policy. I
believe that many of them have found it extremely cumbersome, costly, and
frustrating. Given that the Clean Air Act is based on a model of cooperative
federalism, it seems that the states' views on this issue should be given
considerable weight.

109
3. There are several significant issues with the way that EPA is proposing to calculate the benefits (and costs) of its ozone standards. In my view, EPA should provide an analysis that actually informs the public and policymakers, rather than misleading them.
Although EPA does not take costs into account when setting the NAAQS (for ozone or any other pollutant), it does perform cost-benefit analyses of the NAAQS in order to provide such information to policymakers and the public. In recent years, however, these efforts have done little to provide meaningful
information about the true costs and benefits of efforts to reduce public exposure to ozone.
As a purely academic exercise, it might be interesting to calculate the benefits of reducing ozone from one level (perhaps 75 ppb) to another (perhaps 60 ppb). But it is highly misleading to suggest that these are the benefits that will actually be achieved by reducing the ozone standard from 75 to 60 ppb because it is simply not possible for many areas of the country to achieve the lower level. (Certain areas, in fact, are unlikely even to achieve 75 ppb.)
It is even more troubling to see that the benefits of lowering the ozone standard, according to EPA, come almost entirely from reducing concentrations of another pollutant known as PM2.5 (which stands for particulate matter less than 2.5 microns in diameter). Thus, as others have noted, EPA's statements on the health benefits oflowering the ozone NAAQS are misleading. The claimed health benefits have very little to do with benefits of reducing exposure to ozone. In fact, analysis done by EPA and others shows that the cost to society of lowering the ozone standard will be higher than the health benefits of reducing public exposure to ozone. But EPA asserts that a lower ozone standard is justified on cost-benefit grounds because actions taken to meet a lower ozone standard will also have a side-benefit of reducing concentrations ofPM2.5. And this side-benefit, according to EPA, is
substantially greater than the benefit of reducing public exposure to ozone.
Perhaps even more troubling, EPA claims, in the context of ozone, that there
are tremendous health benefits in reducing concentrations ofPM2.5 below the
level ofthe NAAQS for PM2.5. Thus, EPA goes through a public and
2

110
scientific review process to set a PM2.5 standard at a level that is requisite to protect public health (including sensitive subpopulations) with an adequate margin of safety. Then, in the context of reviewing the ozone standard, EPA asserts that lowering the ozone standard will save thousands of lives by reducing PM2.5 concentrations in areas that are already below the PM2.5
NAAQS.
As others have pointed out, EPA has used the purported benefits of reducing PM2.5 to justifY virtually all its regulatory actions over the last few years. I This approach makes a mockery of the standard-setting process and misleads the public and policymakers about the true costs and benefits of various Clean Air Act programs. Congress and CASAC should encourage EPA to conduct a more transparent and honest evaluation of the costs and benefits of reducing public exposure to ozone.
4. The Clean Air Act specifically requires CASAC to (1) "advise the Administrator on the relative contribution to air pollution concentrations of natural as well as anthropogenic activity" and (2) "advise the Administrator of any adverse public health, welfare, social, economic, or energy effects which may result from various strategies for attainment and maintenance of such national ambient air quality standards." In order to comply with these statutory requirements, CASAC must evaluate background ozone concentrations.
There is nothing in the Clean Air Act that requires EPA to ignore background ozone concentrations when setting the NAAQS. In both the standard-setting process and the implementation process, EPA could deal with this issue in a way that does not require states to meet a standard that is impossible to meet because of background ozone concentrations.
1 See Anne E. Smith, NERA Economic Consulting, Summary and Critique of the Benefits Estimates in the RIA for the Ozone NAAQS Reconsideration. July 22,2011.
3

111
Responses to Questions from the Honorable Randy Neugebauer
In my experience, CASAC normally just responds to questions posed by EPA staff. It appears that, until recently, most CASAC members were not aware that
they have a statutory obligation to advise the head of EPA on certain issues that are specifically mentioned in the Clean Air Act, including the relative importance of natural and anthropogenic emissions on ozone concentrations. CASAC has paid little attention to this issue in the past, but I am hopeful that CASAC will provide the EPA Administrator and other policymakers with useful information about this issue in the near future.
It may be helpful for this Subcommittee to remind CASAC about section 109(d)(2)(C) of the Clean Air Act, which specifically states that CASAC "shall advise the Administrator on the relative contribution to air pollution concentrations
[including ozone concentrations] of natural as well as anthropogenic activity." In considering the contribution from anthropogenic sources, CASAC should distinguish between (i) anthropogenic sources that are within the US. and therefore subject to control under the Clean Air Act and (ii) anthropogenic sources from outside the US., which are not. As a practical matter, the contribution from non-US. anthropogenic sources is essentially part of the uncontrollable background. Policymakers and regulators around the country need a valid source of information about background concentrations (attributable to both natural and non-US. anthropogenic sources) and the degree to which they effect the ability of certain areas to achieve the ozone NAAQS.
As you note, the Clean Air Act also specifically requires CASAC to advise EPA on "any adverse public health, welfare, social, economic, or energy effects which may result from various strategies for attainment and maintenance of [the] national ambient air quality standards," including the ozone standard. As far as I know, CASAC had never fulfilled this requirement as it relates to the ozone standard or any other national ambient air quality standard.
I believe it is important for policymakers in both the Executive and Legislative branches of government to consider the trade-offs between reducing ozone and other important societal objectives. Virtually everyone agrees that, in the effort to
regulate ozone precursors, regulators have already picked most of the low-hanging
4

112
fruit. And in many areas, regulators believe that they have picked essentially all the fruit that can be reached. Even where additional actions may be available, they will be ever more costly in terms of the cost-per-unit of ozone reduced.
CASAC clearly has a role in advising poIicymakers about the tradeoffs that we all face as our society spends more resources to achieve a goal that may not even be achievable in certain parts of the country. Some CASAC observers have downplayed the importance of these responsibilities, arguing that they are not relevant to the question of where the NAAQS should be set. But Congress clearly wanted CASAC to playa broader role than simply advising EPA on the level of theNAAQS.
5

113
Responses to Questions from the Honorable Donna Edwards
As I indicated in my Truth in Testimony form, I am testifYing in my personal capacity and not on behalf of any company or other entity. I have worked on Clean Air Act issues for almost 25 years - first as a White House staffer during the
debate over and the early implementation of the 1990 Amendments to the Clean Air Act, then as an attorney in private practice, then as the head of EPA's Air
Office, and now again as an attorney private practice. Over many years, I have been involved with EPA, public policy "think tanks," a number of state and local governments, industry groups, and private companies as they have tried to deal with the challenges created by ozone. The views I have expressed to the
Subcommittee are my own and are based on my experience in dealing with the ozone NAAQS from a number of different perspectives.
As you point out, I am registered to lobby for certain companies on certain issues,
as shown on publicly available disclosure forms. However, I am not testifYing on
behalf of any of these companies. I did not consult with any of them in preparing my testimony and do not purport to represent their views on the ozone NAAQS.
It is misleading to suggest that my lobbying activities have generated nearly $18 million in lobbying fees for my law firm since 2007. My law firn1 and its
government relations practice are well known for their expertise on a wide variety of energy and environmental issues. I assume that you must be referring to the total amount paid to my law firm from many different energy companies since
2007. Only a small fraction of this amount is for my work, and none of it is for the testimony that I havc provided to the Subcommittee.
6

114
Responses by Dr. John Vandenberg Hearing before the U.S. House Committee on Science, Space and Technology
Subcommittee on Environment Entitled "Background Check: Achievability of New Ozone Standard"
June 12,2013 EPA response to Questions for the Record
Representative Stewart
1. For the first time, EPA has decided to no longer consider the background concentrations of ozone in assessing health risks, a dramatic change in Agency standard-setting practice. Dr. Vandenberg; why did you change this assumption? How can states limit uncontrollable or natural background levels?
In the first drafts of the health REA and the P A, the EPA estimated risk from exposure to total measured
ozone concentrations, which include those concentrations from background sources. This was a change
from the last review where only estimates of risk from exposure to ozone above background ozone
concentrations were provided, and was done in part to address comments received from CASAC during the previous ozone NAAQS review. For example, CASAC stated, "In any case, there is no apparent need to define PRB in the context of establishing a health-based (primary) ozone NAAQS. The effects
of inhaled ozone on decreases in respiratory function have been seen in healthy children exposed to
ozone within ambient air mixtures in summer camps (1-6). Furthermore, the concentration-response
functions above 40 ppb are either linear, or indistinguishable from linear. Thus, PRB is irrelevant to the
discussion of where along the concentration-response function a NAAQS with an 8-hour averaging time that provides enhanced public health protection should be."· The second drafts of the REA and PA will
focus on the changes in risk associated with meeting potential revised ozone standards relative to the
existing ozone standards. When simulating the air quality changes required to meet a revised standard, the EPA assumes that only U.S. man-made emissions would be affected by implementation of the ozone
NAAQS. As a result, risk changes reported do not include any changes in background ozone, such as
ozone precursor emissions associated with natural sources or sources outside the U.S.
The EPA's definition of North American background (formerly referred to as policy relevant background) concentrations includes ozone resulting from precursor emissions of natural origin from all
over the world such as from wildfires. biogenic sources, man-made precursor emissions from other continents. and intrusions of stratospheric ozone. While these sources contribute to background ozone consistently. some with more limited day-to-day variability (e.g. biogenic emissions), other sources can also contribute to background ozone episodically (e.g. stratospheric intrusions. international transport events, wildfires). These episodic events usually occur in relation to a specific event, such as a strong
cold front or a wildfire, and occur more often in specific geographical locations, such as at high elevations and in wildfire prone areas during the local dry season. These episodic sources of background
ozone have been identified as the primary drivers of occasional high background concentrations.
1 EPA-CASAC-07-002

115
The EPA does not expect states to limit uncontrollable or naturally occurring background ozone. The Clean Air Act contains provisions that facilitate excluding high ozone values that meet the definition of exceptional events (section 319), and attainment planning provisions that do not penalize states if attalnment is not possible due to international influences (section 179B).
2. Dr. Vandenberg, EPA produces an Integrated Science Assessment, which is developed by your office, in the process of reviewing ozone standards. That document discusses the difference between "Policy Relevant Background" and "North American Background." Can you explain the difference to us?
In previous NAAQS reviews, a specific definition of background concentrations was used and referred to as policy relevant background (PRB). In those previous reviews, PRB concentrations were defined by EPA as those concentrations that would occur in the U.S. in the absence of anthropogenic emissions in continental North America (CNA), defined here as the U.S., Canada, and Mexico. For the current review, EPA has considered background 03 concentrations more broadly by considering three different definitions of background. The first is natural background which includes contributions resulting from emissions from natural sources (e.g., stratospheric intrusion, wildfires, biogenic methane, and more short lived VOC emissions) throughout the globe simulated in the absence of all anthropogenic emissions. The second is North American background (NA background) which includes contributions from natural background throughout the globe and emissions of anthropogenic pollutants (e.g., anthropogenic methane) from countries outside North America. This second definition of background is the same as that used for PRB in previous reviews. The third is United States background (U.S. background) which includes contributions from natural background throughout the globe and emissions from anthropogenic polJutants from countries outside the United States. The U.S. background differs from NA background in that it also includes anthropogenic emissions from neighboring Canada and Mexico.
3. Your office is in charge of assessing the available science when reviewing air standards
a. Do you think that data and models used as the basis for siguificant rulemakings should be fully transparent and publically available?
b. Are any of the key studies included in your ozone Integrated Science Assessment based on data sets that are not publically available? If so, please identify these studies.
The National Center for Environmental Assessment (NCEA) supports openness and transparency; we have continued to work on ways to enhance the public's access to information and ability to have input into NCEA's assessments. In providing public access to data, it is important to recognize the need to protect privacy. As stated in OMB circular A-II 0:
2

116
"Research data also do not include: (A) Trade secrets, commercial information, materials necessary to be held confidential by a researcher until publication of their results in a peerreviewed journal, or information which may be copyrighted or patented; and (B) personnel and medical files and similar files the disclosure of which would constitute a clearly unwarranted invasion of personal privacy, such as information that could be used to identifY a particular person in a research study."
With those limitations in mind, the EPA has a commitment to work with those upon whose published articles we rely to, consistent with OMB's Government-wide Information Quality Guidelines, ensure
reproducibility, and consistent with OMB Circular A-II 0 work with grantees to request, encourage, and facilitate public access to the underlying data for studies that we have funded in whole or in part. The
EPA has been open and transparent in providing access to data while being cognizant of the need to provide protection for confidential or private data. In response to your second question; the Integrated Science Assessment for Ozone and Photochemical Oxidants evaluated hundreds of human health studies. These studies can include research data "the disclosure of which would constitute a clearly unwarranted invasion of personal privacy."
4. Dr. Kenneth Olden, Director of the National center for Environmental Assessment at EPA, was invited to testify. Do you report to Dr. Olden? Why isn't he presenting testimony?
a. In 2009, Dr. Olden was a panelist on a Bipartisan Policy Center report that recommended that "Studies used in the formulation of regulation should be subject to data access requirements ••• regardless of who funded the study." Has he foUowed this recommendation as the head ofthe National Center? Do you agree with this recommendation?
As the Director for the National Center for Environmental Assessment (NCEA) Research Triangle Park
Division, and Dr. Olden is the Director ofNCEA. He was unable to present testimony on the day of the hearing. As Director of the NCEA division that prepares the Integrated Science Assessments, Dr. John Vandenburg presented the testimony. With regard to access to data, as I stated in Mr. Vandenburg's, the Agency agree's with Dr. Olden's views regarding data access with the appropriate protections in place for confidential or private data andwouId note that the statement made in the Bipartisan Policy Center report is consistent with the requirements ofOMB Circular A-I 10, and NCEA under Dr. Olden's leadership has operated accordingly.
5. Under EPA's interpretation of the Clean Air Act, would the Agency be able to set a standard so low that an area could eliminate all emissions and still not meet it?
The Clean Air Act requires the NAAQS to be set at a level requisite to protect public health and welfare. As such, EPA may only consider health and welfare effects when setting the standard. The CAA does not require the Administrator to establish a primary NAAQS at a zero-risk level or at background
3

117
concentration levels, see Lead Industries Association v. EPA, 647 F.2d at 1156 n. 51, but rather at a level that reduces risk sufficiently so as to protect public health with an adequate margin of safety. In setting primary and secondary standards that are "requisite" to protect public health and welfare, respectively, as provided in section 109(b), the EPA's task is to establish standards that are neither more nor less stringent than necessary for these purposes. In so doing, EPA may not consider the costs of implementing the standards. [Whitman v. America Trucking Associations, 531 U.S. 457, 465-472, 475-76 (2001 )}. Likewise, "[aJttainability and technological feasibility are not relevant considerations in the promulgation of national ambient air quality standards." [American Petroleum Institute v. Costie, 665 F. 2d at 1185.]
However, different considerations apply when implementing a NAAQS. During implementation, the CAA allows consideration of cost, technical feasibility, and time needed to attain the new standard. For example, the Clean Air Act contains provisions that facilitate excluding high ozone values that meet the defmition of exceptional events (section 319), and attainment planning provisions that do not penalize states if attainment is not possible due to international influences (section 179B).
6. Does EPA consider high, uncontrollable levels of background ozone an "exceptional event"?
a. How many "exceptional events" exemptions has EPA approved in tbe last five years?
b. How many Clean Air Act exemptions bas EPA provided to states for emissions transported from Asia?
High, uncontrollable levels of background ozone could be considered to be the result of an exceptional event if the measured concentration meets the statutory definition ofan exceptional event and if the affected air agency fulfills all of the Exceptional Events Rule (EER) criteria. An exceptional event is one that affects air quality, is not reasonably controllable or preventable, is caused by a natural event or by human activity that is unlikely to recur at a particular location, is shown to have a clear causal relationship between the measured exceedance or violation of a National Ambient Air Quality Standard (NAAQS) and the event, is associated with a measured concentration in excess of normal historical fluctuations including background, and would nol have resulted in an exceedance or violation but for the event. Routine natural emissions that occur every day and contribute to background levels, such as biogenic emissions, do not meet the definition of an exceptional event and are thus not eligible for regulatory exclusion. However, if a natural event (e.g., wildfire or stratospheric ozone intrusion) contributes to background ozone that causes an observed concentration that meets the above mentioned criteria, the EPA would consider the event to be an exceptional event.
Affected air agencies prepare and submit exceptional event demonstrations to the appropriate reviewing EPA regional office. The EPA does not maintain a single database to track the status of submitted exceptional event demonstrations. Several examples of submitted exceptional event demonstrations that the EPA has approved are posted on the EPA's exceptional events website at hllP:/il I'WH'. epa. !,ov/lll1/anaiJ 'sis! eX<!l'ellls. him.
4

118
As of July 3, 2013, the EPA has no knowledge of receiving any exceptional event demonstrations related to emissions transported from Asia.
7. In a November 26, 2012 letter to EPA, CASAC emphasized the inadequate discussion of ozone background levels in the draft Policy Assessment, stating that EPA had failed to clearly present "how background ozone may be considered in estimating the risk indicators for ozone (e.g., total risk and scenarios of reduced risk), and to discuss the role of background in developing options for the NAAQS". EPA's failure to adequately present technical and policy considerations with regard to ozone background levels in the PA raises concerns that EPA may be undermining full CASAC review of the technical and policy issues surrounding this complex and important issue.
a. Please explain why EPA failed to include a clear presentation in the draft P A that explains how EPA will be considering background levels in estimating risk and in developing policy options?
b. How did EPA develop the policy options that were included in the P A without having a clear view of the role of ozone background levels?
c. How does EPA expect CASAC to review the policy options without having this vital information?
As part ofthe CASAC review process, EPA submits "charge questions" to request CASAC advice on certain aspects of the draft risk and exposure assessments and policy assessment. EPA then uses CASAC's feedback to refine later drafts of these documents. This is standard practice and does not undennine CASAC's ability to review critical technical and policy issues. For the first drafts ofthe health REA and the PA, EPA requested CASAC advice on the proposed assessment of risk from total ozone concentration and on the characterization of background ozone in the PA. We project that the
second draft of the REAs and P A, which will include revisions to address comments received on background ozone and other topics, will be released for CASAC and public review approximately three months before the CASAC meeting in late March2014.
8. Recent research by scientists from NOAA show that stratospheric intrusions and foreign emissions playa significant role in causing western ozone background levels.
The effects of stratospheric intrusions and foreign emissions on ozone levels have been studied for a number of years by various government agencies and academic institutions as reviewed in the 2008
Ozone AQCD and the 2013 Ozone ISA.
a. Did EPA consider the NOAA results of the GFDL model in the ISA or the P A? If not, why did EPA exclude this important source of information?
5
119
The EPA considered the NOAA GFDL model (AM3) results in the Ozone ISA (Section 3.4) with regard to the effects of Asian pollution on air quality in Southern California in June 2010 (p. 3-39) and for ozone simulations in the intermountain West (p. 3-54) and in more general terms throughout Section 3.4. TheEPA also included a brief summary of the ISA's GFDL AM3 model discussion in the first draft of thePA.
b. Does EPA plan to eonsider this new evidence in developing the policy options in the next draft ofthePA?
As part of the 2nd draft PA, the EPA intends to extend the characterization of background ozone to include analysis of new modeling simulations. In doing so, we intend to utilize a variety of models and ambient data to build a composite characterization, including the results from the NOAA GFDL AM3 model, where appropriate.
c. What are the relative strengths and weaknesses of the NOAA GFDL model compared to the models EPA has consulted?
Each model has its own set of strengths and weaknesses compared to other models (see Section 3-3 of the ISA for more detailed discussion). Although similar in construction to each other in many respects, each model has its own treatment of atmospheric chemical reactions and transport of pollutants by atmospheric motions, which all undergo continual evolution. Note also there are compensating errors in all models; that's why Section 3.9 of the 2008 AQCD stated that an ensemble of models should be considered. See Figure 3-6 of the 2013 Ozone ISA as an example of the range of ozone values that can be calculated by different models over the same region.
d. Which model has been the most accurate in predicting peak ozone concentrations during test runs on the models?
As mentioned above, each model has different strengths and weaknesses and different models tend to better capture different types of conditions. For instance, regional photochemical models often used by EPA for regulatory applications such as CMAQ and CAMx do well at capturing peak ozone typical of urban and regional summertime smog events. These types of national-scale models internally calculate the effects of US emissions, meteorology and chemistry on ozone concentrations but rely on inputs from global models to capture international transport and stratospheric intrusion events. Multiple global air pollution models have been developed by the scientific community and numerous assessments of model performance for these models are described in the ISA and in response 8e. No one model has been demonstrated to be "most accurate". As a result, as noted in response 8b, EPA intends to use a variety of models to inform future assessments of background ozone.
c. Please provide a summary of the relative accuracy of each of the major models EPA plans to consider in estimating ozone background levels. Specifically, what is the range of accuracy in parts per billion for each model in estimating peak concentrations?
6

120
It is difficult to summarize the accuracy of each major modeling system for several reasons. First model performance varies by time and location. In addition, the model performance depends heavily on how the model is run (e.g. choice of different chemistry and physics schemes available within each model) and what emissions and meteorological inputs are used. Below is a brief summary of model performance reported specifically for three modeling applications that were discussed in the ISA. The performance from these specific applications do not necessarily imply that the same model performance would be
achieved in separate studies evaluating different time periods and using independently derived model inputs. Atmospheric chemistry and transport models considered in the ISA included: CMAQ, developed by EPA; CAMx developed by Environ Corp.; GEOS-Chem developed initially at Harvard with funding
from NASA and undergoing further development as a cooperative multi-institutional effort; and NOAA GFDL's AM3 climate-chemistry model.
Lin et aI (2013) reported that the AM3 (GFDL) overpredicted ozone on average by a 2-10 ppb at high
elevation sites, 10-20 ppb in New Mexico and Arizona, and 10-25 ppb at Pacific coastal sites. AM3 was
also reported to overpredict peak ozone concentrations on several days by up to 10 ppb compared to
observations at the air monitoring site in Gothic Colorado. (see also Figure 3-75 in the Ozone [SA).
CAMx and GEOS-Chem produced seasonal mean ozone concentrations within a few ppb of
observations at relatively remote monitoring sites across most regions ofthe United States., including the intermountain West. Exceptions included the southeast U.S. where the CAMx model (Environ Corp) produced seasonal mean ozone concentrations that were about seven ppb too high. A comparison of the ability of both models to simulate 4th highest (99th percentile) ozone for 2006 is given in Table 3-2 of the
Ozone ISA. Either model tends to underpredict measured 4th highest ozone on average by about 5 to 10 ppb across most ofthe US and by about 20 ppb in California. However, the CAMx model (Environ Corp.) tended to overpredict the measured 4th highest ozone in the eastern US by only a few ppb.
9_ Despite repeated questions from Committee members, you could not say whether current ozone background levels alone will cause exceedances. Specifically, in response to a direct question on this point, you stated:
1 have to say, 1 am not sure if it would be the case or not. The way the monitors are evaluated is to look at the fourth highest level in each of 3 years and average across those years, so 1 don 't-I am not aware o/the data that would lead me to the conclusion to say yes. 1 apologizefor-
If the Division Director of EPA's National Center for Environmental Assessment in the Office of Research and Development, responsible for identifying and evaluating the world's scientific literature to create the ISA does not know the answer to this critical question on the current role of ozone background levels, how can EPA have finished the ISA and now be formulating policy options?
Background ozone cannot be directly measured; to estimate background ozone one must analyze the
observed ozone concentrations in conjunction with models and observations of other pollutants that will
7

121
provide insights as to the source of the observed ozone. To determine whether background ozone is the cause of specific exceedances, this type of analysis must be done for each exceedance event. States, with the help of our regional offices, have begun to flag exceedance events that may be due high background contributions for additional analysis. However, it is difficult to generalize. The Ozone ISA evaluated results from various models and found that the models are generally capable of simulating mean background concentrations but that there is greater uncertainty in estimates of high background events. Therefore, as previously noted itcammpt ne determined that ozone background concentrations
alone will cause exceedances. It is possible rare cases of large stratospheric intrusion could directly cause an exceedance (e.g., the high ozone observed at Gothic, CO around April 19-20, 2006 mentioned above, see pp. 3-53 to 3-54 of the ISA), however, these types of events are eligible for exclusion under
the exceptional events rule so they would not affect ozone attainment status.
10. What is the risk that ozone background levels will cause exceedances if the standard is lowered to 70 ppb? 6Sppb? Or 60ppb? Please explain how confident you are of your assessment at each of these levels.
Based on values from published modeling studies in the first draft PA, it is very unlikely that ozone background (NAB) levels alone will cause exceedances of a 70 ppb standard. These studies also show that it is rare for NAB ozone to exceed levels of 65 or 60 ppb. Since the standard is based on a 3-year average of the fourth highest daily maximum 8-hour value, even rare daily exceedances may not result in violations ofthe standards at these levels. The background ozone analyses included in the ISA and P A suggest that background concentrations on the days with the highest total ozone concentrations are not dramatically higher than typical seasonal average background concentrations over most of the U.S. and, therefore, that anthropogenic sources within the U.s. are largely responsible for exceedances. In areas where background ozone is highest, such as the western U.S. and at higher elevation sites, the sources contributing to high background concentrations have been identified as wildfires, stratospheric intrusions, and intercontinental transport. lfhigh ozone days are determined to meet the statutory and regulatory requirements for exclusion as exceptional events, then those days will not be considered exceedances and will not count towards detennining whether an area is in attainment or nonattainment
with the standard.
11. According to testimony by Ms. Amanda Smith, Executive Director of the Utah Department of Environmental Quality, ozone levels in rural areas have remained relatively constant despite significant emission reductions in urban areas and upwind states. How does EPA explain this result? Does this result suggest that further reductions in ozone precursors may not impact ozone levels in rural areas? Care must be taken to distinguish between rural areas in different regions of the United States as underlying causes in ozone trends may be different. As discussed in Sections 3.2 and 3.4 of the ISA,

122
underlying causes of trends in ozone concentrations are complex and differ with the level of ozone, season and location and are still active areas of research. These causes include changes in temperature, wind patterns, land use and land cover in addition to pollutant emissions. In the western United States, in general, there have either been slight increases or no increases across the concentration distribution of ozone, according to an analysis by Cooper et a!. (2012) (with the exception of some sites in California which show significant summertime decreases on high ozone days). On the other hand, they also found large negative trends in higher rural ozone levels in two areas that have experienced dramatic reductions in anthropogenic emissions: the eastern United States and Southern California. This result indicates that pollutant emission reductions can be effective in reducing high ozone levels. If ozone concentrations do not decrease 'with upwind emissions then it is reasonable to conclude that there are either other offsetting sources or that there is a meteorological trend leading to higher ozone. In the intermountain West, these offsetting sources might include increasing Asian emissions and perhaps an increase in emissions from domestic sources not fully captured by the emissions inventories such as oil and gas production.
12. Does EPA agree with Ms. Smith's testimony that in western regions ofthe US, ozone background levels are increasing?
As indicated in the 2013 Ozone ISA, small increases in background concentrations have been estimated for the western U.S., and they have been attributed to increases in Asian emissions of precursors. This is discussed in the ISA, which includes an analysis of ozone data collected above the planetary boundary layer" satellite observations showing an increase in levels ofNOz (an important ozone precursor) in the atmosphere above Asia that is related to Asian emissions, and results from the OEOS-Chem model (Harvard). However, more data are needed to confirm whether or not the increase in background contributions from Asian emissions is real and will continue at the same rate as discussed in the ISA. For example, Cooper et al. (20) 2) noted that rates of increase in background ozone appear to be leveling off.
13. In her testimony. Ms. Smith also refers to rural transport areas. How would rural transport areas affect states that are trying to attain the standard?
Under the Clean Air Act (CAA) designated ozone nonattainment areas are classified according to the severity of their air quality problems. The classification categories are Marginal, Moderate, Serious, Severe, and Extreme. Ozone areas are subject to specific mandatory measures depending on their classification. In certain cases, the CAA allows the EPA under authority of section 182(h)to determine that, regardless of its classification, an ozone nonattainment area can be treated as a "rural transport area.". Section 182(h) recognizes that violations of the ozone standards in some rural areas may be almost entirely attributable to emissions from upwind areas. Such areas may, at the Administrator's discretion, be treated as a "rural transport areas" if they meet the qualification criteria specified in the CAA. Once an area is determined to be a "rural transport area," the state's ozone implementation requirements are met for that area if the area fulfills all the CAA requirements applicable to the
9

123
Marginal classification. Provided that these requirements are met, any consequences of failing to attain any potential new/revised ozone NAAQS by the area's attainment deadline would not apply.
14. According to Ms. Smith's testimony by Ms. Amanda Smith, Utah has submitted 12 petitions for exceptional events since 2008 that were all rejected by Region8 despite significant investment of state resources. Why these petitions were repeatedly rejected?
a. Why were Region 8 officials not able to work with Utah to ensure that its petitions would be more likely to succeed rather than let that state repeatedly waste resources?
Since 2008, the EPA has not rejected any of the submitted demonstrations from Utah. The EPA has concurred with Utah demonstrations for three exceptional events, and in the case of the 12 demonstrations mentioned by Ms. Smith, the EPA review of the demonstrations found that the demonstrations did not include all of the information required by CAA Section 319 and regulations, so decisions on the demonstrations are pending submission of additional information by Utah. TheEPA has communicated to Utah in a series of letters the types of information not included, and Utah has the opportunity to provide the missing information to allow the EPA to complete its assessment of the evidence. During the development of the demonstrations for the exceptional events in question, the EPA did work with Utah. Discussions were held with Utah Department of Environmental Quality staff members during the development of some packages, and EPA Region 8 also provided comments on some packages during public comment periods provided prior to formal submission to the EPA.
In some cases, Utah elected to complete the demonstrations without providing the information the EPA recommended, and that resulted in incomplete submissions. The EPA has subsequently issued the "Interim Guidance to Implement Requirements for the Treatment of Air Quality Monitoring Data Influenced by Exceptional Events" to assist states in understanding the types of information needed in demonstrations to comply with statutory requirements.
15. Ms. Smith also states that Utah did not even try to submit petitions with regard to other "events" because the technical criteria for EPA approval of an exceptional event is too difficult to achieve. Please respond to this criticism.
a. How many exceptional events petitions bas EPA' received from all states since 2008? How many has EPA approved?
b. What are the main reasons for why EPA has disapproved state petitions?
c. When is a forest fire considered an exceptional event? What must a state show to prove that a forest fire is an exceptional event under EPA's policy?
d. Similarly, is a stratospheric intrusion an exceptional event? What must a state show to prove this?
e. How much time and resources will it take a state to make these demonstrations?
10

124
The EPA recognizes the challenges that air agencies face in preparing exceptional event demonstrations. The EPA also recognizes the limited resources of the agencies that prepare and submit exceptional event demonstrations and of the EPA regional offices that review these demonstrations. The EPA does not maintain a single database to track the status of submitted exceptional event demonstrations, so we cannot comment on the number of received exceptional event demonstration submissions, or on reasons why the EPA has not concurred with state petitions.
Both wildfires and stratospheric ozone intrusions can be determined to be exceptional events ifthe resulting measured concentrations meet the statutory definition of an exceptional event and if the affected air agency fulfills all of the Exceptional Events Rule (EER) criteria. (See the response to Question 6 for additional detail.) In order to help establish clearer expectations about the analyses and documentation necessary to establish that these criteria are met, the EPA developed and issued "Interim Guidance to Implement Requirements for the Treatment of Air Quality Monitoring Data Influenced by Exceptional Events" (Interim EE Guidance) on May 10, 2013. The Agency simultaneously announced our intent to pursue revisions to the 2007 EER to provide additional clarifications and streamlining mechanisms not available through guidance. The Interim EE Guidance and the EPA's exceptional events website at hIlP:llwww.epa.govlllnianaivsis/exevents.hll1l present examples of analyses that air agencies might consider when submitting exceptional event demonstrations.
The EPA expects the resources required to prepare (and review) packages to decrease so we continue to identify ways to streamline the process and continue to build our database of example demonstrations and analyses. The same level of analysis and detail are not necessarily needed for all demonstrations. Submitters should prepare and submit the appropriate level of supporting documentation, which will vary on a case-by-case basis using a weight-of-evidence approach. For example, extreme exceptional events may justify a more limited demonstration package.
To promote early communication, the EPA suggests that air agencies who anticipate submitting an exceptional event demonstration provide their reviewing EPA regional office with an optional letter of intent to submit a demonstration package as soon as possible, if possible within 12 months from the event occurrence. This initial notification can assist both the air agency and the EPA in planning and prioritizing work.
16. According to Ms. Smith's testimony, monitors in San Juan County in Utah often show ozone levels above 70 ppb even though the county is large and very sparsely populated. How does EPA explain these high readings? If EPA tightens the existing standard, how will EPA be sure that this county can lower its ozone levels? How would these reductions impact residents in this county, given the already high poverty rate?
Our records show that there is one ozone monitor in San Juan County, UT, which is operated by the National Park Service in Canyonlands National Park. This monitor typically has 2 - 6 days per year where 8-hour average ozone concentrations exceed 70 ppb, with an annual 4th highest 8-hour ozone concentration in the range of 68 72 ppb. Elevated ozone levels in this region are suspected to result
11

125
from a variety of sources, including US manmade emissions in surrounding states, natural sources (wildfire, stratosphere), and possibly international sources. The role of each contributor can varY from event to event.
If EPA were to tighten the existing ozone standard and San Juan County, UT did not attain it, the EPA
would consult with the State of Utah on how to assess the sources contributing to elevated ozone levels and options for ensuring Clean Air Act compliance. This could include developing assessments to support excluding ozone data from regulatorY determinations if impacted by exceptional events, and addressing interstate pollution transport. Any emissions reductions targeted to upwind sources outside
of San Juan County would not be expected to significantly impact the local economy.
17. According to testimony from Mr. Oltmans, a research associate at the University of Colorado at Boulder and a former researcher for40 years at NOAA, recent studies show that several western monitors provide direct observational data on ozone background levels.
a. Has EPA reviewed these studies and met with NOAA researchers to discuss their results? The observational studies conducted by NOAA and discussed by Mr. Oltmans were reviewed in the ISA. To the extent possible, direct conversations were held with NOAA investigators including Mr. Oltmans. NOAA has been very cooperative in providing data and model results.
b. Were these studies discussed and evaluated in the ISA? Section 3.4.2 of the Ozone ISA was devoted to the fmdings by the modeling results from the NOAA
labs in Princeton, NJ and the monitoring studies conducted by the NOAA lab in Boulder, CO. Results from NOAA were also reflected in other sub-sections of Section 3.4 of the Ozone ISA.
c. Does EPA agree with Mr. Oltmans that certain western monitors can provide valuable information on ozone background levels? Please explain. The EPA agrees with Mr. Oltrnans that certain western monitors provide valuable information related to ozone background levels. There are only a few sites that can be shown, based on concurrent
measurements of ozone and other trace species, to be heavily influenced by background sources for limited periods during the year. Because of the expense and effort involved in measuring these trace species, and the limited number of such sites, the data from these sites is best used to evaluate the models. However, in general, as noted in the response to Question 9, EPA does not believe that background ozone is directly measurable as even the most remote sites within the U.S. are affected by domestic anthropogenic emissions.
d. If, as Mr. Oltmans testified, the monitor at Mt Bachelor exceeds 60 ppb about 25 percent of the time, what are the reasons for these high ozone levels? Regarding data from Mt. Bachelor, the ISA states on p. 3-37, "High elevation sites are most susceptible
to the intercontinental transport of pollution especially during spring. For example, a number of occurrences of 03>60 ppb from mid-April to mid-May of2006 were observed at Mt. Bachelor
12

126
Observatory, OR (elevation 2,700 meters) with a maximum 03 concentration of -85 ppb observed on April 22,2006." In general at high elevation sites, approximately 9 to 13 ppb are due to intercontinental pollution and high elevation sites such as Mt. Bachelor are also more susceptible to stratospheric
influence [Note: 2700 m is about 9000 feet above sea level.] 03 concentrations normally increase with altitude and because of dilution and mixing, the high concentrations observed on Mt. Bachelor would be lower at lower elevations.
e. If future readings from this monitor cause a new nonattainment area, what would the area encompass? First we note that the Mt. Bachelor monitor is a mountain-top monitor operated by the University of Washington-Bothell and is not a regulatory monitor that reports data to the EPA's AQS regulatory data
system. Therefore measurements made at this location would not be used to identifY the area as a nonattaimnent area. However, when establishing nonattainment areas the EPA believes that the boundaries for each area should be evaluated and determined on a case-by-case basis considering the specific facts and circumstances unique to the area. Section 1 07( d) of the Clean Air Act explicitly requires that the EPA designate as nonattainment not ouly the area that is violating the standard at issue, but also those nearby areas that contribute to the violation in the violating area. Thus, the first step in defining potential new ozone nonattainment areas is to identify air quality monitoring sites that are violating any potential new/revised ozone NAAQS. The EPA generally evaluates areas using the most recent three consecutive years of quality-assured, certified air quality data in the EPA Air Quality System (AQS). In general, violations are identified using data from Federal Reference Method (FRM) and Federal Equivalent Method (FEM) monitors that are sited and operated in accordance with 40 CFR Part 58. Procedures for using the air quality data to determine whether a violation has occurred are given in 40 CFR Part 50 Appendix P, as revised on March 27,2008 (73 FR 16511). These procedures could change if and when the EPA revises the ozone NAAQS.
As a framework for each area-specific analysis and consistent with past area designation efforts, the EPA would likely evaluate information relevant to five factors: air quality data, emissions and emissions-related data, meteorology, geography/topography, and jurisdictional boundaries. Ground-level ozone and ozone precursor emissions are pervasive and readily transported. Therefore, the EPA believes it is important to examine ozone-contributing emissions across a relatively broad geographic area when establishing nonattainment area boundaries. Accordingly, in the case of urbanized areas with monitored violations, the EPA advises states to examine emissions contributions from the larger of the Core Based Statistical Area (CBSA) or Combined Statistical Area (which includes 2 or more adjacent CBSA's) associated with the violating monitor(s).
18. Based on recent research by NOAA and Princeton University, Mr. Oltmans states that background ozone concentrations contribute on average 40 ppb and often exceed 50 ppb. Mr. Oltmans concludes that that the ozone background data included in the ISA significantly underestimates ozone background concentrations. Does EPA agree? If not, why not?
13

127
a. What are the key reasons that EPA's estimates of ozone background levels are so much lower than estimates generated using NOAA models?
The EPA disagrees with the assertion that the ISA underestimated ozone background conditions over the US. The EPA based its assessment on a suite of modeled and ambient analyses of background ozone and reported the range of results within the peer-reviewed literature for the entire continental United States. The ISA assessment was judged to be an appropriate representation of the state of th.e science by a peer review panel of the Clean Air Scientific Advisory Committee.
We believe Mr. Oltmans might have been referring to observational studies at sites on the Pacific Coast, in particular at Trinidad Head, CA.For example, at times during spring, at Trinidad Head, during conditions conducive for directly observing background concentrations, those concentrations are observed in the range stated by Mr. Oltmans. (The GEOS-Chem model generally predicts MDA8 ozone concentrations to within a few ppb at this site as shown in Figure 3-65 of the ISA). However, Mr. Oltmans' numbers are specific to one particular site and can't be used to generalize about background levels across broad areas of the U.S. (see Section 3.4.2 of the Ozone ISA).
a) At low elevations « 1500 m), the AM3 model referred to by Mr. Oltmans is subject to a high positive bias compared to observations and to the other models which show better and more consistent agreement with observations (see also answer to Q 8d). At high elevations, the AM3 model slightly overestimates observed levels, whereas the other models slightly underestimate observations by about the same amount (a few ppb for a seasonal average). The ISA addresses the reasons for the behavior of the different models in Section 3.4.3.2 of the ISA.
19. According to your testimony, seasonal average ozone background levels for the US average 29 ppb plus or minus 8 ppb at low elevations, but can be greater at higher elevations. How mucb greater does EPA believe ozone background concentrations are at higber elevations on days with high ozone levels?
North American Background (NAB) ozone concentrations at high elevations as simulated by the GEOSChern model (Harvard) are 40 ± 8 ppb. With regard to GEOS-Chem, Zhang et al. (2011) state that "PRB (North American Background) increases with increasing ozone concentration in the intermountain West, whereas for surface sites in the East there is little correlation of PRB (North American Background) with ozone." These results are reproduced in Figure 3-) 1 of the Ozone ISA. Mean NAB ozone concentrations for the same locations calculated by CAMx are a few ppb higher. Comparing CAMx, and GEOS-Chem Emery et al. (2012) state that "Both models predicted similar PRB ranges as a function of observed MDA8 (maximum daily 8-hour average ozone) except in the west where CAMx consistently predicted
14

128
higher PRB than GEOS·Chem, and in the east where CAMx predicted higher PRB for observations above 60 ppb.
a. What do EPA models suggest are the average 98th percentile-readings for ozone background levels at low and high elevations?
North American Background (NAB) estimates predicted by GEOS-Chem (Harvard) are shown in Fig. 3-15 and CAMx (Environ Corp.) are shown in Fig. 3-16. As can be seen from these figures, on those days when the models predicted their annual 4th highest MDA8 03 (for the base case, i.e., including North American anthropogenic emissions), the corresponding NAB concentrations are 36 ± 9 ppb in the eastern United States Base case concentrations are much higher indicating that regional pollution is mainly responsible for the models 4th highest concentrations. In the western United States on the other hand, NA background concentrations are generally higher and make up a larger fraction of the calculated 4th highest MDA8 03 in both models. The Harvard model shows 4'h highest (99'h percentile) NAB between 55 and 60 ppb in the intermountain West. The Environ model shows somewhat higher values in simulating ozone production from wildfires, but typically 55 to 65 ppb in the intermountain West. However, as noted above, the EPA does not expect states to limit uncontrollable or naturally occurring background ozone. The Clean Air Act contains provisions that facilitate excluding high ozone values that meet the definition of exceptional events (section 319), and attainment planning provisions that do not penalize states if attainment is not possible due to international influences (section 179B).
b. How does that differ from the NOAA GFDL model results? The AM3 model (GFDL) was not included in these comparisons because during the preparation and review of the ISA, this model only produced results using a spatial resolution of approximately 200 X 200 krn for the time period simulated by the other two models. This resolution is inadequate to resolve differences in background between major cities in the eastern United States. The AM3 model (GFDL) produced generally higher values than either model at both high and low elevations. At low elevations the AM3 model (GFDL) is subject to a very high positive bias compared to observations and the other models (see also answer to Q 8d).
20. Last month, the US Supreme Court announced that it has decided to hear USEPA's challenge to the invalidation of the Cross State Air Pollution Rule (CSAPR) by the DC Cireuit in EME Homer City Generation L.P., et al. v. EPA. A final decision by the Supreme Court on this complex matter could take well over a year.
a. Many states have relied on the CSAPR (or its predecessor, the Clean Air Interstate Rule) in their regional haze and NAAQS state plan. Will EPA approve these plans or let them remain pending?
As the D.C. Circuit has directed, the EPA is continning to implement the Clean Air Interstate Rule. The EPA is not currently implementing the provisions of the CSAPR while the rule is vacated. The EPA
15

129
intends to carefully evaluate each regional haze and NAAQS state plan and determine the appropriate course of action for moving forward with each plan.
b. Will EPA include the expected CSAPR reductions in the regulatory baseline for the Regulatory Impact Analysis ofthe upcoming proposed ozone rule?
The EPA will develop the Regulatory Impact Analysis for the proposed ozone rule later in the NAAQS review process. At that time, we will review the available data and determine the appropriate regulatory
baseline.
21. Which studies cited in the Ozone Integrated Science Assessment find a statistically significant association between ozone and chronic mortality?
a. Which studies do not show a statistically significant association.
The 2013 03 ISA included twelve studies that examined the relationship between long·term exposure to 03 and mortality (Dockery et al. ) 993; Pope et aJ. 2002; Abbey et al. 1999; Chen et al. 2005; Lipfert et al. 2006a; Lipfert et al. 2003, 2000; Upfert et aJ. 2006b; Wang et al. 2009; Zanobetti and Schwartz 2011; Jerrett et aJ. 2009; Smith et aL 2009i.
The focus of the section was on two (2) studies that examined the association between long-term exposure to 03 and respiratory mortality, as this is the cause of death that is coherent with the strong evidence reported for respiratory morbidity with both short- and long-tenn exposure to 0 3• Both of the respiratory mortality studies found positive associations; one was statistically significant (Jerrett et al. 2009) and one was not (Abbey et al. 1999). In the study by Abbey et al. (1999), the effect estimate for
respiratory mortality was larger than the effect estimates for all-cause and cardiopulmonary mortality for both men and women. Similarly, in the study by Jerrelt et al. (Jerrett et al. 2009) the effect estimate for respiratory mortality was larger than the effect estimates for all-cause, cardiopulmonary, cardiovascular, and ischemic heart disease mortality. This difference became more apparent in co-pollutant models that adjusted for PM2.5 concentrations.
In response to your question, five (5) of the twelve (12) studies reported positive and statistically significant associations between long-tenn exposure to 03 and mortality (Lipfert et al. 2006a; Lipfert et al. 2003, 2000; Zanobetti and Schwartz 2011; Jerrett et al. 2009). Additionally, six (6) of these twelve· (12) studies reported positive, but not statistically significant, associations (Dockery et a1. 1993; Pope et al. 2002; Abbey et al. 1999; (Dockery et al. 1993; Pope et al. 2002; Abbey et a1. 1999; Lipfert et al. 2006a; Lipfert et al. 2003, 2000; Lipfert et al. 2006b; Wang et al. 2009; Zanobetti and Schwartz 2011; Jerrett et al. 2009; Smith et a!. 2009). Thus, overall eleven (11) of the twelve (12) studies reported
positive, though not necessarily statistically significant, results. The only study that did not report a positive association was Chen et a!. (2005). In fact, Chen et aJ. (2005) reported a non-statistically
significant negative association between long-term exposure to 0 3 and death due to coronary heart
2 http://cfpub.epa.gov!ncealisalrecordisplay.cfm?deid=247492#Download. pp. 7-85 to 7-90
16

130
disease among both men and women. This study did not examine the association between long-term exposure to 0) and all-cause mortality or respiratory mortality.
References:
I. Dockery DW, Pope CA, III, Xu X, Spengler JD, Ware JH, Fay ME, et al. 1993. An association between air pollution and mortality in six US cities. N Engl J Med 329(24): 1753-1759.
2. Pope CA, III, Burnett RT, Thun MJ, Calle EE, Krewski D, Ito K, et al. 2002. Lung cancer, cardiopulmonary mortality, and long-term exposure to fine particulate air pollution. JAMA 287(9): 1132-1I41.
3. Abbey DE, Nishino N, Mcdonnell WF, Burchette RI, Knutsen SF, Beeson WL, et al. 1999. Long-term inhalable particles and other air pollutants related to mortality in nonsmokers. Am J Respir Crit Care Med 159(2): 373-382.
4. Chen LH, Knutsen SF, Shavlik D, Beeson WL, Petersen F, Gharnsary M, et aJ. 2005. The association between fatal coronary heart disease and ambient particulate air pollution: Are females at greater risk? Environ Health Perspect 113(12): 1723-1729.
5. Lipfert FW, Baty JD, Miller JP, Wyzga RE. 2006a. PM2.5 constituents and related air quality variables as predictors of survival in a cohort of U.S. military veterans. Inhal ToxicoI18(9): 645-657.
6. Lipfert FW, Perry HM, Jr, Miller JP, Baty JD, Wyzga RE, Carmody SE. 2003. Air pollution, blood pressure, and their long-term associations with mortality. Inhal ToxicoI15(5): 493-512.
7. Lipfert FW, Perry HM, Jr, Miller JP, Baty JD, Wyzga RE, Carmody SE. 2000. The Washington University-EPR! veterans' cohort mortality study: Preliminary results. Inhal Toxicol4: 41-73.
8. Lipfert FW, Wyzga RE, Baty JD. Miller JP. 2006b. Traffic density as a surrogate measure of environmental exposures in studies of air pollution health effects: Long-term mortality in a cohort of US veterans. Atmos Environ 40(1): 154-169.
9. Wang XV, Hu W, Tong S. 2009. LOng-term exposure to gaseous air pollutants and cardiorespiratory mortality in Brisbane, Australia. Geospat Health 3(2): 257-263.
10. Zanobetti A, Schwartz J. 20 II. Ozone and survival in four cohorts with potentially predisposing diseases. Am J Respir Crit Care Med 184(7): 836-841.
II. Jerrett M, Burnett RT. Pope CA, Ill, Ito K. Thurston G, Krewski D, et al. 2009. Long-term ozone exposure and mortality. N Engl J Med 360(11): 1085-1095.
12. Smith KR, Jerrett M, Anderson HR, Burnett RT, Stone V, Derwent R, et al. 2009. Public health benefits of strategies to reduce greenhouse-gas emissions: Health implications of short-lived greenhouse pollutants. Lancet 374(9707): 2091-2103.
22. You referred to the Exceptional Events Rule (EER) in the discussion around background ozone challenges. However, EPA is on record indicating that not all background is considered by
17
131
the Agency as an exceptional event. EPA stated in its Q&A guidance document "Attachment 1: Interim Exceptional Events Rule Frequently Asked Questions"- in the answer to questions 16athat not all background ozone can be excluded as an exceptional event.
a. If background ozone cannot be excluded in the implementation process, how is EPA going to address background in the standard setting process?
The Clean Air Act requires the NAAQS to be set at a level requisite to protect public health and welfare. As such, the EPA may only consider health and welfare effects when setting the standard. The CAA does not require the Administrator to establish a primary NAAQS at a zerorisk level or at background concentration levels, see Lead Industries Association v. EPA, 647 F.2d at 1156 n. 51, but rather at a level that reduces risk sufficiently so as to protect public health with an adequate margin of safety. In setting primary and secondary standards that are "requisite" to protect public health and welfare, respectively, as provided in section 109(b), the EPA's task is to establish standards that are neither more nor less stringent than necessary for these purposes. However, with respect to implementation, the EPA does not expect states to limit uncontrollable or naturally occurring background ozone.
Also, does EPA intend to include background in its upcoming revisions to the EER rule?
When the EPA issued the Interim Exceptional Events Implementation Guidance in May of2013, we simultaneously announced our intent to pursue revisions to the 2007 EER. The EPA is just beginning the rule revision process and has not yet determined specific elements for inclusion or exclusion. As we move forward with a notice and comment rulemaking process, there will be an opportunity for all interested parties, including those that commented during the 2012 public comment period, to raise any issues or concerns, including those concerns associated with background ozone levels.
23. You stated during the hearing that you were not aware that background ozone alone could cause an exceedance of the ozone standard. However, in the Final Integrated Science Assessment that EPA published February 15, 2013 in the Federal Register, Figures 3-15 and 3-16 show US background up to 60 ppb and 95 ppb respectively on 4th highest maximum daily average 8 hour (MDAS) basis. This seems to clearly show that EPA knows that hackground is above the proposed 60-70 ppb and parts of the US simply could not comply due to background ozone levels alone. Does it not? As stated previously, the contribution of background sources to ozone concentrations generally cannot be directly measured, and the available models are less capable of estimating peak background ozone concentrations than average background values3
. Uncertainty in the modeled predictions of higher concentrations, and the fact that monitoring data rather than model predictions are necessary to
, In their conclusions, Zhang et al. (2011) note that, "The (GEOS-Chem) model captures the frequency of high-ozone events up to about 70 ppbv but fails to reproduce events of exceptionally high ozone that may be due to stratospheric or wildfire influences." and, regarding CAMx, Emery et al (2012) states that the 95 ppb background estimate from a fire event was highly uncertain.
18

132
designate an area as in attainment or non-attainment, underlies the testimony that it is not known whether background ozone alone could cause an exceedance of the ozone National Ambient Air Quality Standard (NAAQS).
19

(133)
Appendix II
ADDITIONAL MATERIAL FOR THE RECORD
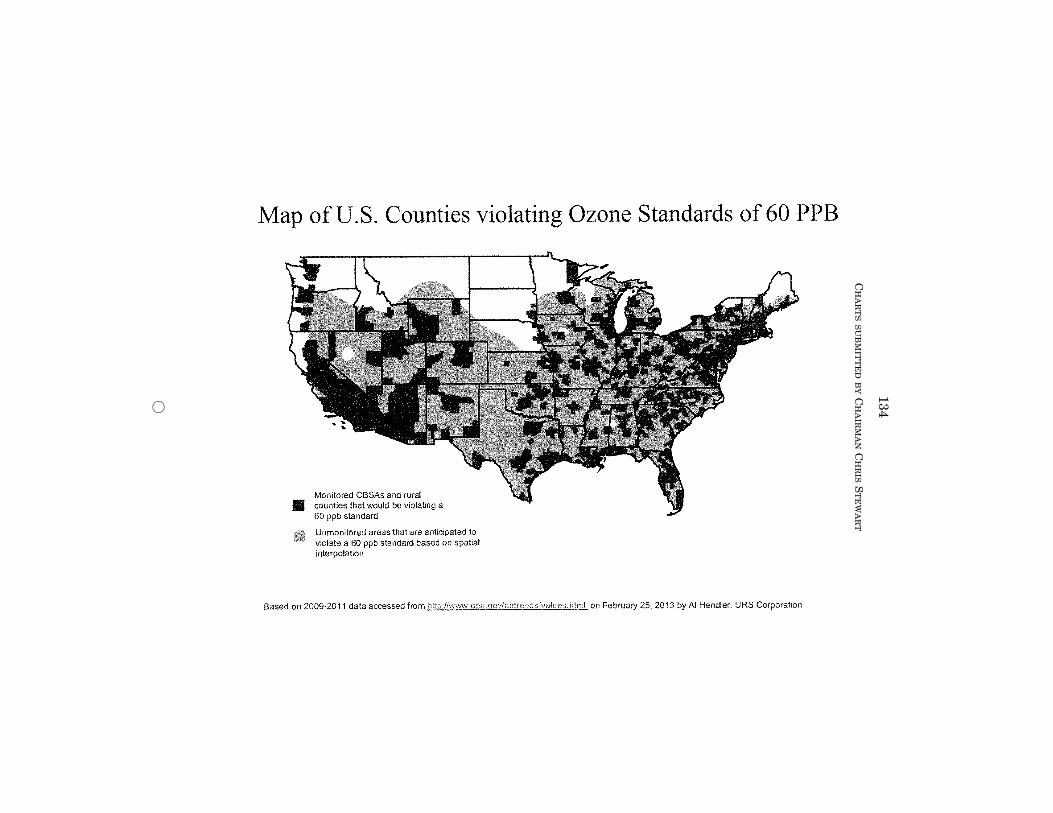
134
CH
AR
TS
SU
BM
ITT
ED
BY
CH
AIR
MA
NC
HR
ISS
TE
WA
RT
Æ
Map of U.S. Counties violating Ozone Standards of 60 PPB
Monitored CBSAs and rural • counties that would be violating a
60 ppb standard
Un monitored areas that are anticipated to violate a 60 ppb standard based on spatial interpolation
Based on 2009-2011 data accessed from htto:'hhwv;e~,ac,oviai:trends!values.htmi on February 25.2013 by AI Hendler, URS Corporation