bac2664 audit planning
TRANSCRIPT
TRIMESTER II, 2015/2016 SESSION
BAC 2664 Auditing
Report:
Audit Planning for PN-17 Company
Study Case: Petrol One Resources Bhd.
Competitor: Carimin Petroleum Bhd.
Prepared by: Ana Ululiyatul Al-bab 1132702479
Lee Sin Yee 1141326955
Leong Jun Rong 1121115871
Submission Date: 1st of February 2016
Lecturer : Mdm. Sunita
Session : B01
ii
Table of Contents 1. Introduction ........................................................................................................................ 1
1.1 Background Information ............................................................................................. 1
1.2 Purpose of Audit Planning .......................................................................................... 1
1.3 Steps of Audit Planning............................................................................................... 2
1.4 Potential Client’s Profile ............................................................................................. 2
1.4.1 Potential Customer Due Diligence Procedure ..................................................... 2
1.4.2 About PN17 ......................................................................................................... 2
1.4.3 About Potential Client’s Company: Petrol One Resources Bhd. ......................... 3
1.5 Potential Client’s Competitor ...................................................................................... 5
1.6 Industry Insight: Trends, Problems and Challenges.................................................... 5
2. Accepting Client ................................................................................................................ 7
3. Understanding Client’s Business Risk ............................................................................. 10
4. Performing Analytical Procedures ................................................................................... 11
4.1 Horizontal Analysis ................................................................................................... 11
4.2 Vertical Analysis ....................................................................................................... 14
4.3 Ratio Analysis of Petrol One Resources Berhad (PORB) and Carimin Petroleum
Berhad (CPB) ....................................................................................................................... 17
4.3.1 Profitability Ratios ............................................................................................. 17
4.3.2 Liquidity Ratio ................................................................................................... 20
4.3.3 Risk Ratio........................................................................................................... 21
4.4 Industry Analysis....................................................................................................... 23
4.5 Credit Analysis .......................................................................................................... 24
5. Setting Materiality and Assess Acceptable Audit Risk and Inherent Risk ...................... 24
5.1 Setting Materiality Level ........................................................................................... 24
5.2 Assessing Acceptable Audit Risk ............................................................................. 25
5.3 Assessing Inherent Risk ............................................................................................ 25
6. Internal Control ................................................................................................................ 26

iii
6.1 Control Environment ................................................................................................. 26
6.2 Information System and Communication ................................................................. 28
6.3 Monitoring ................................................................................................................. 28
6.4 Control Activities ...................................................................................................... 29
6.5 Other Control Activities ............................................................................................ 29
6.6 Corporate’s Structure ................................................................................................ 31
7. Audit Procedure ............................................................................................................... 32
7.1 Management Assertions for Liabilities and Owner’s Equity .................................... 33
7.2 Management Assertions for Sales and Cost of Sales ................................................ 34
7.3 Management Assertions for Account Receivables.................................................... 35
8. Overall Audit Plan ........................................................................................................... 36
9. Conclusion ....................................................................................................................... 38
References ................................................................................................................................ 39

1
1. Introduction
1.1 Background Information
Since its introduction, the need for companies to be audited by an independent
external auditor has been a key element of confidence and trust in corporate world. It
builds the bridges to prevent agency problem, where different interests might arise
between the ones managing the company and those who own the company. It also
provides assurance that management has presented a ‘true and fair’ view of company’s
financial performance and position, hence the users would be able to fully rely on the
information provided to make an economical decision.
In general, an audit consists of evaluation of a subject matter with a view to express
an opinion on whether the subject matter is fairly presented (PwC, 2013). In order to do
so, ISA 300 states that a proper audit plan has to be made beforehand to ensure that the
overall audit process is efficiently conducted in reasonably low level of audit risk (Burke,
2016).
In this report, we will only focus on the planning stage of audit which is the first step
out of three to be conducted once the engagement with the client has been accepted.
1.2 Purpose of Audit Planning
The following are the purpose of creating an audit plan according to ISA 300 Para
A1-A3 (Alvin A. Arens, 2014):
It will enable the auditor to identify, obtain sufficient evidence and pay more
attention to important and risky areas of the audit.
It assists the auditor to identify and resolve potential problems effectively and
efficiently on a timely basis
It is useful in choosing the right engagement team members with appropriate
levels of capabilities and competence to respond to anticipated risks being
assessed and suitable job assignment to them.
It facilitates to direct, coordinate and supervise the engagement team members
and review their work.
It helps to keep audit costs to be paid by the client at a reasonable level, as
well as to avoid misunderstandings with the client.

2
1.3 Steps of Audit Planning
The following are the steps to be taken in planning an audit and designing an audit
approach, which also serves as guide for us to compose our own audit plan for this report.
You may refer to which section is referring to which step of our audit plan progress.
Accept client and perform initial audit planning: (2) and (1.4.1, 1.4.2, 1.4.3)
Understand the client’s business and industry: (1.5, 1.6)
Assess client business risk : (3)
Perform preliminary analytical procedures (4.1, 4.2, 4.3, 4.4, 4.5)
Set materiality level and assess acceptable audit risk and inherent risk (5.1,
5.2, 5.3)
Understand internal control and assess control risk (6.1, 6.2, 6.3, 6.4, 6.5, 6.6)
Gather information to assess fraud risks (5)
Develop overall audit plan and audit program (7 and 8)
(Alvin A. Arens, 2014)
1.4 Potential Client’s Profile
1.4.1 Potential Customer Due Diligence Procedure
As stated in IFAC’s Code of Ethics for Professional Accountants, we have to
investigate our potential client, its owners and business activities they conduct in order
to evaluate whether taking them in as the new client would expose us into integrity
issues which lead into unacceptable risk (ACCA, 2015). Normally known as ‘customer
due diligence’ procedures, we are performing this procedure towards Petrol One
Resources Bhd. as they approach us, so that we have a better understanding of what
they do.
1.4.2 About PN17
After exercising the due diligence procedure, we found out that Petrol One
Resources Bhd. is classified as PN 17 in Bursa Malaysia for the past 4 financial years.
PN 17 stands for Practice Note, and any listed company in the Malaysian Stock
Exchange that fall within PN17 normally face financial difficulties and poor
managements (Bursa Malaysia, 2015). The list itself serves as a warning to the potential
investors and stakeholders that the companies within the list are under scrutiny due to
their poor performance.

3
As of 29 December 2015, there are 17 companies listed in Malaysian Stock
Exchange classified as PN17. To be classified as one of the PN17 companies, the
company needs to meet at least one of these criteria as follow:
Shareholders' equity is 25% or less of the total paid-up capital and such
shareholders' equity is less than RM40 million;
Receivers or managers have been appointed to take control of at least 50% of
the total assets employed;
Winding up of a subsidiary or associate company;
The auditors have expressed adverse or disclaimer opinion to the company;
default in loan interest and principal repayments;
The companies have suspended or ceased their operations;
And companies do not have any significant businesses or operations.
(Bursa Malaysia, 2015)
The main reason why Petrol One Resources Bhd. is classified under PN17 is
because the result of the shareholders’ equity of the Group on a consolidated basis was
less than 25% of its issued and paid-up capital (excluding treasury shares) and it was
less than RM40,000,000 (Petrol One Resources Bhd, 2015). Additionally, it is being
listed as PN17 for the reason that the auditors, KPMG Malaysia, has issued three times
of disclaimer opinions for their financial statements for the year 2012-2014 (Yuan,
2015).
1.4.3 About Potential Client’s Company: Petrol One Resources Bhd.
As the result of our initial investigation about our prospective client, basically
Petrol One Resources Berhad is a Malaysia-based investment holding company.
Incorporated in 1995 and based in Kuala Lumpur, the company is engaged in the oil
and gas refining, and marketing industry. Through its subsidiaries, i.e Arus Dermaga
Sdn. Bhd., Petrol One Storage Sdn. Bhd., Petrol One Offshore Sdn. Bhd. and One
Petroleum Ltd; Petrol One Resources Bhd operates their businesses.
The company mainly operates in three major activities, which are: support
activities for mining, support activities for transportation, and warehousing and storage.
In general, they offer services in shipping and forwarding, floating storage and
offloading, offshore support services, bunker and ship management which are broken
down further in the figure 1 below.

4
In each major activities we have mentioned earlier, the company has different
strong competitors. In terms of doing support activities for mining, Kim Yuan Amang
Factory Sdn. Bhd is the closest competitors for Petrol One Resources. Meanwhile, Nyk
Line (Malaysia) Sdn. Bhd. is a fast growing and potential competitor for activities of
support activities for transportation, and Kic Oil Terminals Sdn. Bhd.is a strong
competitor for activities of warehousing and storage.
Having said that oil and gas is the lifeblood of Malaysia's economy and
accounted for approximately 30 percent of GDP, the company which is doing support
services and providing related equipment related to oil and gas is operating in relatively
competitive and mature market although the number of competitors have been
declining (Manac, 2015).
In terms of business partner, Petrol One Resources Bhd. has constantly done
business together with its two major customers, Coastal Oil Limited Private Limited
and Noble Clean Fuels Limited since they have signed fuel storage contract with Petrol
One eversince 2009.
Figure 1: The Product Line that Petrol One Resources Bhd. Offers (Petrol One Resources Bhd., 2011)

5
1.5 Potential Client’s Competitor
We have mentioned earlier that Kim Yuan Amang Factory Sdn. Bhd, Nyk Line
(Malaysia) Sdn. Bhd., and Kic Oil Terminals Sdn. Carimin Petroleum Berhad are among
the closest and strongest competitors for our potential client, Petrol One Resources Bhd.
However, due to the fact that none of the end-date of the fiscal year is the same with
Petrol One Resources Bhd., we have decided to choose other company as the comparison
for us to proceed with analytical procedures later on. Comparing companies with different
starting and ending date of fiscal year can distort the analysis. The time included may
vary and seasonal factors may become skewed. Additionally, the extra day in leap years
may distort comparisons too.
With that in mind, we choose Carimin Petroleum Berhad instead. Carimin Petroleum
Berhad is an investment holding company that has been established since 1989 and
headquartered in Kuala Lumpur, Malaysia. It principally involves in providing technical
support services in the offshore oil and gas industry in Malaysia. It mainly engages in the
provision oilfield inspections services, manpower, commissioning of onshore or offshore,
and quality assurance services and related contract works for Oil and Gas support
industry.
In terms of long-term business relationship, Carimin has established some good
relationship with top players in oil and gas industry, such as: Petronas, Carigali, Shell,
Murphy Oil, Talisman, Exxon Mobil, Nippon Oil, New Field, Petrofac, and Hess.
Furthermore, marine support services is one of the major activities of Carimin
Petroleum Berhad. This service involves of chartering and maintenance, offshore
transportation and support vessels which are similar to the major activities of offshore
support services offered by Petrol One Resources Berhad. Hence, Carimin Petroleum
Berhad is considered as a strong competitor to Petrol One Resources Berhad in this area.
1.6 Industry Insight: Trends, Problems and Challenges
Over the last few months, we have witnessed the series of economics events has been
hitting energy industry hard. With global economy turmoil i.e slower economic growth in
China and continuing financial distress in Europe resulting in weakening global energy
demand, oil price drops below $28 per barrel reaching its 12-year low (down more than
60% from their high in the Summer 2014) (Viren Doshi, 2016), and Iran recently being
lifted from the sanction enabling them to export more oil to the already oversupplied-
market; oil and gas industry has a wide range of challenges to face across its sectors in the
6
months to come, including in the downstream and oilfield services sectors which our
potential client is currently operating at.
While many analysts have been predicting that it is not going to get better anytime
soon, and the oil price is not expected to rebound until at least the end of 2016 (Ngai,
2016); the challenge for top managers and business leaders has prevailed. How are they
going to navigate their company in the oversupplied-market where the market outlook
hints that 2016 is going to be arduous? Especially in Malaysian market where our
prospective client has its operation, where it is evident that oil companies and
governments that rely on the price of crude oil for their living are in trouble. 30% of lay
off happened in 2015 alone is from oil and gas companies, amounting to nearly 2000
people losing their jobs (Sidhu, 2015).
Furthermore, as our prospective client – Petrol One Resources Bhd. is not only doing
oil refinery1 but also offering support services for other oil and gas companies; another
challenge that they are going to face is that their customers are expected to negotiate for
10 to 30 percent discounts from oil-field services that Petrol One provides in the attempt
to lower their operating cost, leading into potential reduction in revenues (Viren Doshi,
2016).
Additionally, the fact that a major concern about climate change is being raised, and
the effort to reduce CO2 emissions and minimize fossil fuels has been in the top priority
worldwide; being in the industry where it does otherwise sets another challenge for our
prospective client on how to successfully do business in oil and gas industry in an
increasingly carbon-constrained world.
1 Oil refinery refers to an industrial plant that refines crude oil into petroleum products such as diesel, gasoline
and heating oils (Investopedia, 2016)

7
2. Accepting Client
After thoroughly understand the nature of business, the way our prospective client run
their business, and the intended use of the statements as well as who are the likely users; we
have decided to accept Petrol One Resources Bhd. as our client, and sent an engagement
letter to define the professional and engagement relationship between our auditing firm and
our client. Enclosed in the following page is the copy of our audit engagement letter that we
sent to our client, Petrol One Resources Bhd.
We are appointing Ms. Lee Sin Yee as the main auditor for this engagement as to meet
the first general standard of the Generally Accepted Auditing Standards relating to adequate
technical training and proficiency. Considering that she is a Chartered Accountant with
previous experiences and adequate expertise in auditing oil and gas company, we believe that
she will be the best suit for the job.

8
Audit Engagement Letter
ANA, JR AND SY, CAs
CYBERJAYA, MALAYSIA
January 2, 2015
MR. LIM KIAN BOON, Executive Chairman
PETROL ONE RESOURCES BERHAD
Regus, Level 8, Tower 8, Avenue 5
The Horizon Phase 2,
59200 Kuala Lumpur Wilayah Persekutuan,
Malaysia.
DEAR MR. LIM KIAN BOON,
We are pleased to accept the instruction to act as auditor for your company of the
financial statement of PETROL ONE RESOURCES BERHAD for the year ending June 30,
2015. The purpose of this letter, together with the attached terms and conditions, is to clarify
our terms for carrying out the work and make our respective responsibilities clear. We are
bound by the ethical guidelines of accepted accounting standards, and accept instructions to
act for you on the basis that we will act in accordance with those ethical guidelines.
Our audit will be conducted in accordance of Auditing Standards which issued by the
Malaysian Institute of Accountants. Those standards require that we obtain reasonable, rather
than absolute, assurance that the financial statements are free of material misstatement,
whether caused by error or fraud. It will include such tests of transactions and of the
existence, ownership and valuation of assets and liabilities as we consider necessary. We also
shall obtain an understanding of the accounting systems and internal control systems in order
to assess their adequacy as a basis for the preparation of the accounts and to establish whether
proper books of accounts have been maintained. We shall expect to obtain such appropriate
evidence and explanation as we consider sufficient to enable us to draw reasonable
conclusions there from.
In addition, an audit is not designed to detect immaterial misstatements or violations of
laws or governmental regulations that do not have a direct and material effect on the financial
statements or major programs. Therefore, the audit will not necessarily detect misstatements
less than this materiality level that might exist because of error, fraudulent financial
9
reporting, or misappropriation of assets. If, for any reason, we are unable to complete the
audit or are unable to form or have not formed an opinion, we may decline to express an
opinion or decline to issue a report as a result of the engagement. However, if during the
course of our audit we become aware of such errors, fraud, or illegal acts, we will bring them
to your attention.
The financial statements are the responsibility of the company’s management.
Management is also responsibility for:
1. establishing and maintaining effective internal controls over financial report, and also
including monitoring on-going activities
2. responsible for making all financial records and related information available to us
3. responsible for the design and implementation of programs and controls to prevent
and detect fraud, and for informing us about all known or suspected fraud or illegal
acts affecting the government involving
4. Providing the conclusion of the engagement a representation letter that, among other
things, will confirm management’s responsibility for the preparation of the financial
statement in conformity with accounting principles generally accepted in Malaysia.
Our fees for all services are related to our standard hourly rates in effect at the time
services are performed. Our standard hourly rates vary according to the degree of
responsibility involved and the experience level of the personnel assigned to your engagement.
Our fee for this engagement will be RM 9000 from which 50% will be paid upon March 1,
2015 and other 50% upon June 1, 2015.
Once it has been agreed, this letter will remain effective, from one audit appointment to
another, until it is replaced arising from changes in audit scope or other circumstances. We
shall be grateful if you could confirm in writing your agreement to these terms by signing and
returning the enclosed copy of this letter, or let us know if they are not in accordance with
your understanding of our terms of engagement.
Accepted: Yours very truly:
By: Lee Sin Yee
Date : PARTNER

10
3. Understanding Client’s Business Risk
Each company will have to face a certain risk, but different industries will have to face a
different risk that maybe. The following is the biggest risks that oil and gas companies face:
Political risk, risk that an investment's returns could suffer as a result of political
changes or instability in a country. Instability affecting investment returns could stem
from a change in government, legislative bodies, other foreign policy makers, or
military control. For example, political decisions by governmental leaders about taxes,
currency valuation, trade tariffs or barriers, investment, wage levels, labor laws,
environmental regulations and development priorities, can affect the business
conditions and profitability. Similarly, non-economic factors can affect a business.
For example, political disruptions such as terrorism, riots, coups, civil wars,
international wars, and even political elections that may change the ruling government,
can dramatically affect businesses’ ability to operate.
Geological Risk refers to both the difficulty of extraction and the possibility that the
accessible reserves in any deposit will be smaller than estimated. For example,
exploration has moved on to areas that involve drilling in less friendly environments
like on a platform in the middle of an undulating ocean, they normally use the terms
"proven," "probable" and "possible" before reserve estimates, to express their level of
confidence in the findings. Because they have no proper ways and method to estimate
the resource.
Price risk is the primary risk and unavoidable. Basically, the higher the geological
barriers to easy extraction, the more price risk a given project faces. This is because
unconventional extraction usually costs more than a vertical drill down to a deposit.
This doesn't mean that oil and gas companies automatically mothball a project that
becomes unprofitable due to a price dip. Often, these projects can't be quickly shut
down and then restarted.
Supply and Demand Risks, a real risk for oil and gas companies. As mentioned,
operations take a lot of capital and time to get going, and they are not easy to mothball
when prices go south, or ramp up when they go north. The uneven nature of
production is part of what makes the price of oil and gas so volatile. Other economic
factors also play into this, as financial crises and macroeconomic factors can dry up
capital or otherwise affect the industry independently of the usual price risks.

11
Cost risk. Cost focuses on operational factors and an extraction project can
commonly exceed capital invested based on regulations, global production and
drilling in unfamiliar areas. A major risk is not being able to find qualified workers
due to many who are retiring which also add to the increasing operational cost. A risk
for companies is also dealing with stakeholders who feel like they can cut cost and
still have healthy growth while incurring more costs through spending on new
technology for a more efficient extraction.
4. Performing Analytical Procedures
Following ISA 520, we are conducting analytical procedures in our planning stage to
assist us in gaining better understanding of the client’s business and in assessing client’s
business risk. We might not be aware of that risk, but performing analytical procedures will
assist us in finding any unusual or unexpected relationships that may highlight where the
risks exist. In order for us to do so, we will perform 5 sets of analysis: horizontal analysis,
vertical analysis, ratio analysis, and industry analysis, and credit analysis.
4.1 Horizontal Analysis
Horizontal analysis is the comparison of historical financial information within the
company over a series of reporting periods (Accounting Tools, 2016). We are using this
method on their income statement as well as balance sheet for the year 2014 and 2015. By
doing so, we would like to see if any numbers are unusually high or low within the period
of time, which may then can be our base to conduct a further and detailed investigation
pertaining the area with the highlighted risks.
PETROL ONE RESOURCES BERHAD
Comparative Income Statement
For Years Ended 30 June, 2014 and 2015
2015
2014
Increase or Decrease
(RM'000)
(RM'000)
Amount Percent(%)
Net Sales
11811
5404
6407 119%
Other Revenues
165
1027
(862) -84%
Total Revenues
11976
6431
5545 86%
Costs of Goods &
Services / Total
Expenses
(4909)
(522)
(4387) -840%
Operating Income
7067
5909
1158 20%

12
Selling, general &
administrative costs
(3385)
(7125)
3740 52%
Earnings Before Interest,
Tax & Depreciation
3682
(1216)
4898 403%
Total Depreciation, Depletion &
Amortization
(343) (303)
(40) -13%
Earnings Before Interest
& Tax
3339
(1519)
4858 320%
Interest Expense
(2199)
(4226)
2027 48%
Other Financial Income
& Expenses
3333
(236)
3569 1512%
Earnings Before Tax
4473
(5981)
10454 175%
Income Taxes
(19)
4
(23) -575%
Net Profit
4454
(5977)
10431 175% The figures of income statements are extracted from Petrol One Resources Sdn Bhd Annual Report: 2014 and 2015
The overall trend in 2015 has shown a significant increase and improvement from the
previous year, including the rise in the revenue as well as the net profit. However, we have
found out that there are areas with unusually high change which we believe we need to
investigate further as it might contain the risk of misstatement or the existence of fraud.
In cost of sales part, it drops by -840% for the year 2015 while the revenue increased
by 86%. Normally cost of sales has a positive correlation with the increase in the revenue.
The increase in the efficiency might happen which could lead to reduce the cost, but we
find it odd enough that the reduction reach the percentage above 800%.
PETROL ONE RESOURCES BERHAD
Comparative Balance Sheet
30 June, 2014 and 2015
2015
2014
Increase or decrease
(RM'000)
(RM'000)
Amount Percent(%)
Assets
Non-current assets
Plant and equipment
3,169
3,106
63 2%
Current assets
Cash & Bank
80.00
24.00
56 233%
Accounts Receivable
8,371
2,897
5474 189%
Prepayments & Advances
0
340
(340) -100%
Other Current Assets
1,246
1,022
224 22%

13
Total Assets
12,866
7,389
5477 74%
Liabilities
Non-current liabilities
Loans and borrowings
126
136
(10) -7%
Current liabilities
Loans and borrowings
52,215
48,569
3646 8%
Trade and other payables
59,377
48,426
10951 23%
Provision for taxation
40
20
20 100%
Total liabilities
111,758
97,151
14607 15%
Equity
Share capital
50,805
50,805
0 0%
Share premium
12,669
12,669
0 0%
Reserves
(162,366)
(153,236)
(9130) -6%
Total equity
(98,892)
(89,762)
(9130) -10%
Total equity and liabilities
12,866
7,389
5477 74%
The figures of balance sheet are extracted from Petrol One Resources Sdn Bhd Annual Report: 2014 and 2015
The overall trend of the balance sheet comparison for the year 2014 to 2015 shows
some unusual figures and changes which we believe we need to investigate further as it
might contain the risk of misstatement or the existence of fraud.
First of all, despite the issue that the company has issues in settling their debt
obligation for the year 2014 (Lynn, 2014), the company was still taking more short term
loans and borrowings to cover their operations for the year 2015. It poses the risk in the
going concern of the company.
Secondly, a sudden rise of 189% in account receivables put a question into how
effective their credit collection policy is. There is also a risk of misstatements in this area
which we need to investigate further to figure out how it correlates with the sales.
Thirdly, we noticed that there is a negative equity in both reporting years and it
increased too. As a measure, shareholder equity reveals what the owners of a company
(stockholders) would be left with if all assets were sold and all debts were paid, as asset –
liabilities = stockholders equity. In the case it shows a negative answer, theoretically the
stockholders would owe money, although the structure of publicly listed corporations like
Petrol One Resources Bhd. would prevents common stockholders from facing actual
liability. While knowing that it is already negative for the year 2014, we believe that it is
probable that the risk of mismanagement or even fraud exist when the company decided to
14
further leverage its borrowing and causes even higher negative equity, instead of trying to
improve it.
Fourthly, we have came to know that there is a substantial increase in cash and bank
amounting 223% that came into our attention. We need to further investigate to figure out
how this happened and where is the source of the money came from.
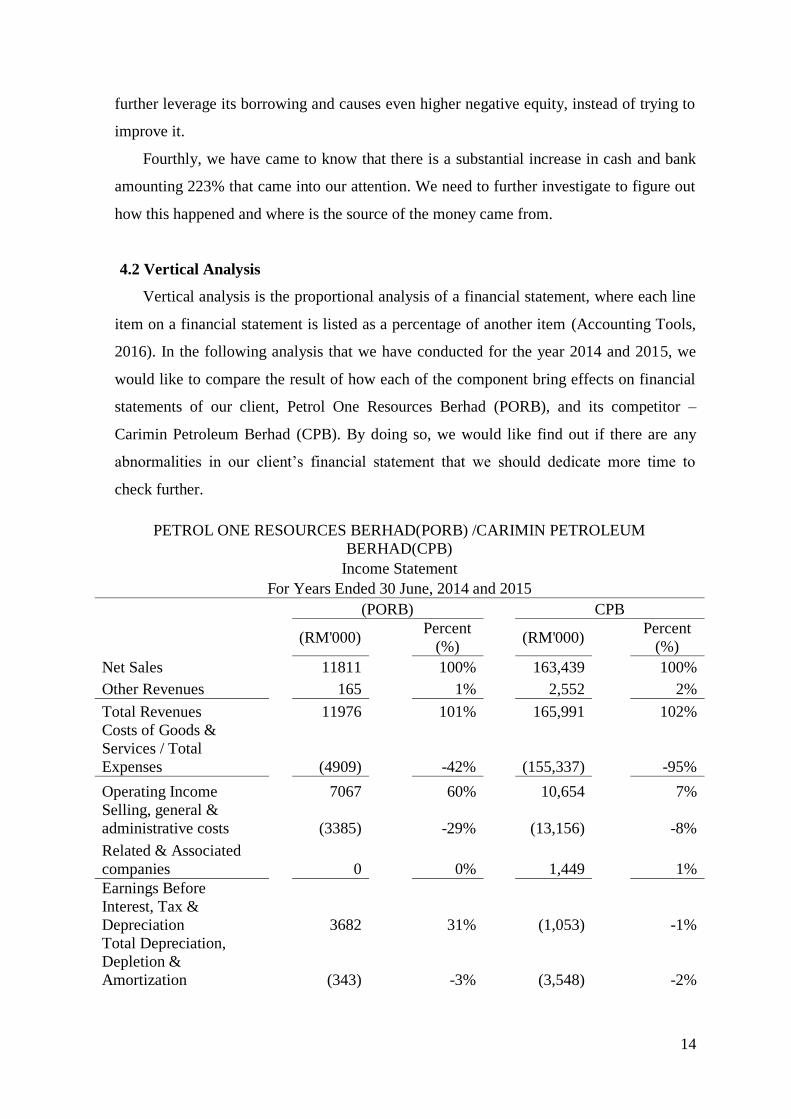
4.2 Vertical Analysis
Vertical analysis is the proportional analysis of a financial statement, where each line
item on a financial statement is listed as a percentage of another item (Accounting Tools,
2016). In the following analysis that we have conducted for the year 2014 and 2015, we
would like to compare the result of how each of the component bring effects on financial
statements of our client, Petrol One Resources Berhad (PORB), and its competitor –
Carimin Petroleum Berhad (CPB). By doing so, we would like find out if there are any
abnormalities in our client’s financial statement that we should dedicate more time to
check further.
PETROL ONE RESOURCES BERHAD(PORB) /CARIMIN PETROLEUM
BERHAD(CPB)
Income Statement
For Years Ended 30 June, 2014 and 2015
(PORB)
CPB
(RM'000)
Percent
(%) (RM'000)
Percent
(%)
Net Sales
11811
100%
163,439
100%
Other Revenues
165
1%
2,552
2%
Total Revenues
11976
101%
165,991
102%
Costs of Goods &
Services / Total
Expenses
(4909)
-42%
(155,337)
-95%
Operating Income
7067
60%
10,654
7%
Selling, general &
administrative costs
(3385)
-29%
(13,156)
-8%
Related & Associated
companies
0
0%
1,449
1%
Earnings Before
Interest, Tax &
Depreciation
3682
31%
(1,053)
-1%
Total Depreciation,
Depletion &
Amortization
(343)
-3%
(3,548)
-2%
15
Unusual/Exceptional
Items
0
0%
(287)
0%
Earnings Before Interest
& Tax
3339
28%
(4,888)
-3%
Interest Expense
(2199)
-19%
(2,150)
-1%
Other Financial Income
& Expenses
3333
28%
1,877
1%
Earnings Before Tax
4473
38%
(5,161)
-3%
Income Taxes
(19)
0%
(3,087)
-2%
Earnings After Tax
4454
38%
(8,248)
-5%
Minority Interest
0
0%
2
0%
Net Profit
4454
38%
-8,246
-5%
PETROL ONE RESOURCES BERHAD(PORB) /CARIMIN PETROLEUM
BERHAD(CPB)
Balance Sheet
As at 2015
PORB
CPB
(RM'000) Percent(%)
(RM'000) Percent(%)
Assets
Non-current assets
Plant and equipment
3,169 25%
131,488 42%
Long Term
Investments
0 0%
5,139 2%
Current assets
Cash & Bank
80 1%
11,272 4%
Short-term
Investments
0 0%
68,705 22%
Accounts Receivable
8,371 65%
67,578 21%
Prepayments &
Advances
0 0%
3,150 1%
Other Current Assets
1,246 10%
27,943 9%
Total Assets
12,866 100%
315,275 100%
Liabilities
Non-current
liabilities
Loans and
borrowings
126 1%
29,686 9%
Lease Obligation
0 0%
697 0%
Deferred Taxes
0 0%
691 0%
16
Current liabilities
Loans and
borrowings
52,215 406%
14,017 4%
Trade and other
payables
59,377 462%
8,716 3%
Provision for taxation
40 0%
0 0%
Other Current
Liabilities
0 0%
101,854 32%
Total liabilities
111,758 869%
155,661 49%
Equity
Share capital
50,805 395%
116,939 37%
Share premium
12,669 98%
0 0%
Additional Paid In
Capital
0 0%
32,429 10%
Retained Earnings
0 0%
91,033 29%
Reserves
(162,366) -1262%
(80,785) -26%
Minority Interest in
Shareholders’ Equity
0 0%
(2) 0%
Total equity
(98,892) -769%
159,614 51%
Total equity and
liabilities
12,866 100%
315,275 100%
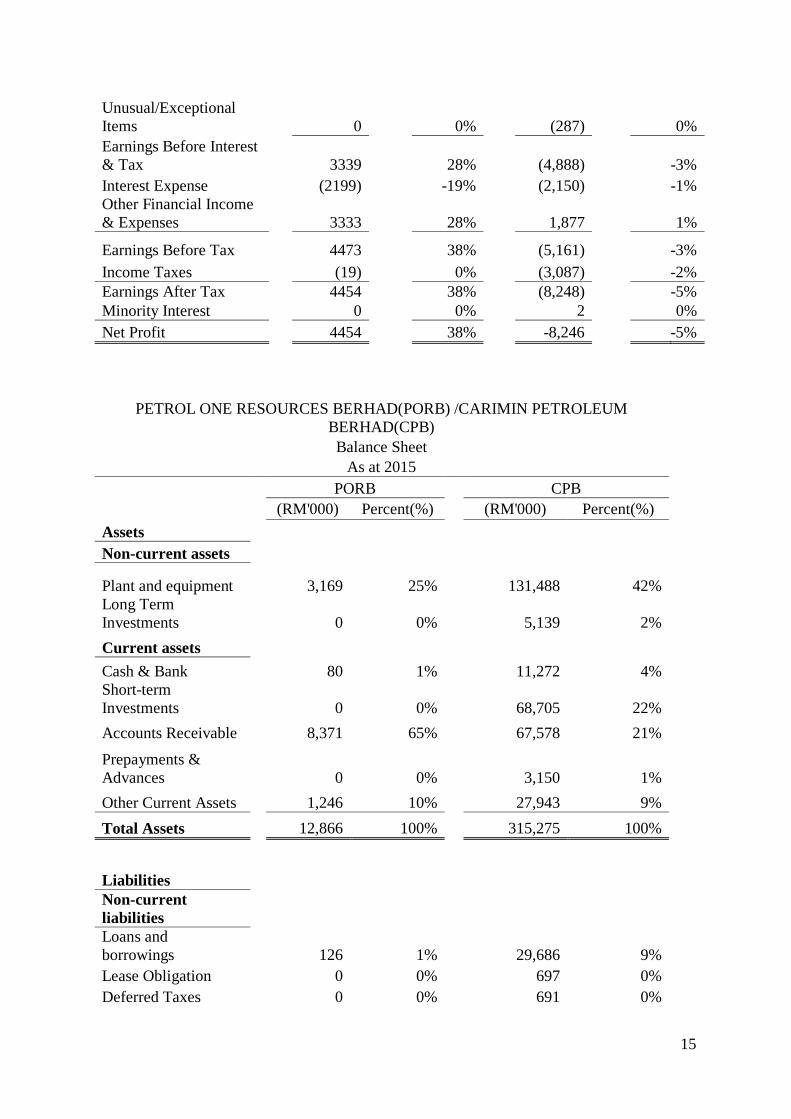
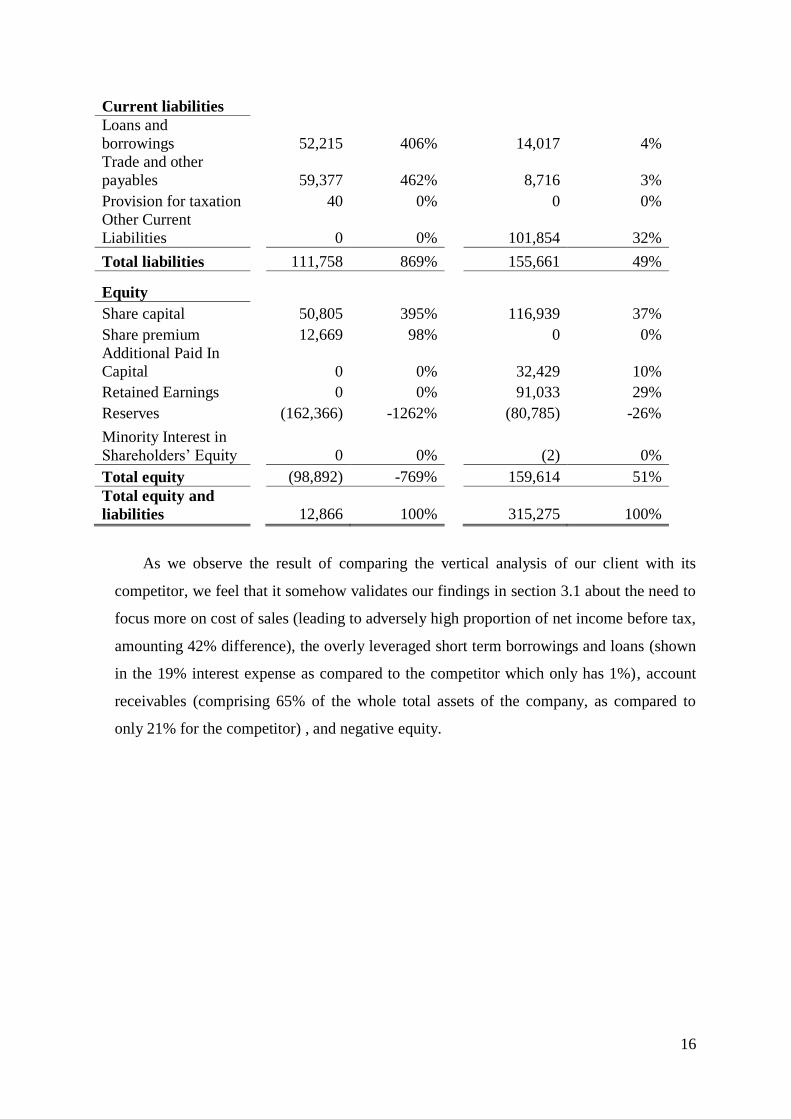
As we observe the result of comparing the vertical analysis of our client with its
competitor, we feel that it somehow validates our findings in section 3.1 about the need to
focus more on cost of sales (leading to adversely high proportion of net income before tax,
amounting 42% difference), the overly leveraged short term borrowings and loans (shown
in the 19% interest expense as compared to the competitor which only has 1%), account
receivables (comprising 65% of the whole total assets of the company, as compared to
only 21% for the competitor) , and negative equity.

17
4.3 Ratio Analysis of Petrol One Resources Berhad (PORB) and Carimin Petroleum Berhad (CPB)
4.3.1 Profitability Ratios
Gross profit percentage = 𝐺𝑅𝑂𝑆𝑆 𝑃𝑅𝑂𝐹𝐼𝑇
𝑆𝐴𝐿𝐸𝑆 𝑅𝐸𝑉𝑈𝑁𝑈𝐸 𝑥 100
Net profit percentage = 𝑂𝑃𝐸𝑅𝐴𝑇𝐼𝑁𝐺 𝑃𝑅𝑂𝐹𝐼𝑇
𝑆𝐴𝐿𝐸𝑆 𝑅𝐸𝑉𝑈𝑁𝑈𝐸 𝑥 100
Year (PORB) (CPB) Comments
2014 4,578,996
5,404,077 x 100 =84.73 %
44,108
245,575 𝑥 100 = 17.96%
A high gross profit margin is an indication that PORB is in good financial health, although there is a substantial reduction
in the ratio for the year 2015 that we need to find the reason
why. It means that it has more than enough money left from
revenues after accounting for the cost of goods sold.
However, as we compared to the competitor, CPB, it has significant difference which makes it probable that the risk of
misstatement, sales errors or fraud within PORB exist.
2015 6,588,554
11,810,645 x 100 = 55.78 %
4,616
163,439 𝑥 100 = 2.82%
Year (PORB) (CPB) Comments
2014 5909
6431 x 100 = 91.88%
47,710
245,575 x 100 = 19.43%
Reasonably good cost control has been maintained by PORB despite the substantial decrease in sales for the year 2015.
On the other hand, it has a substantial difference as we
compared the ratio with the CPB as the competitor. The high
gap between the two makes it probable that there is a risk of
misstatement in cost of sales, sales cost errors, missing
transaction unrecorded, understatement of cost or even fraud
within PORB. To test this, it is worth comparing the
commercial and administrative costs to sales.
2015 7067
11,976 x 100 = 59.01 %
10,654
163,439 𝑥 100 = 6.52 %
18
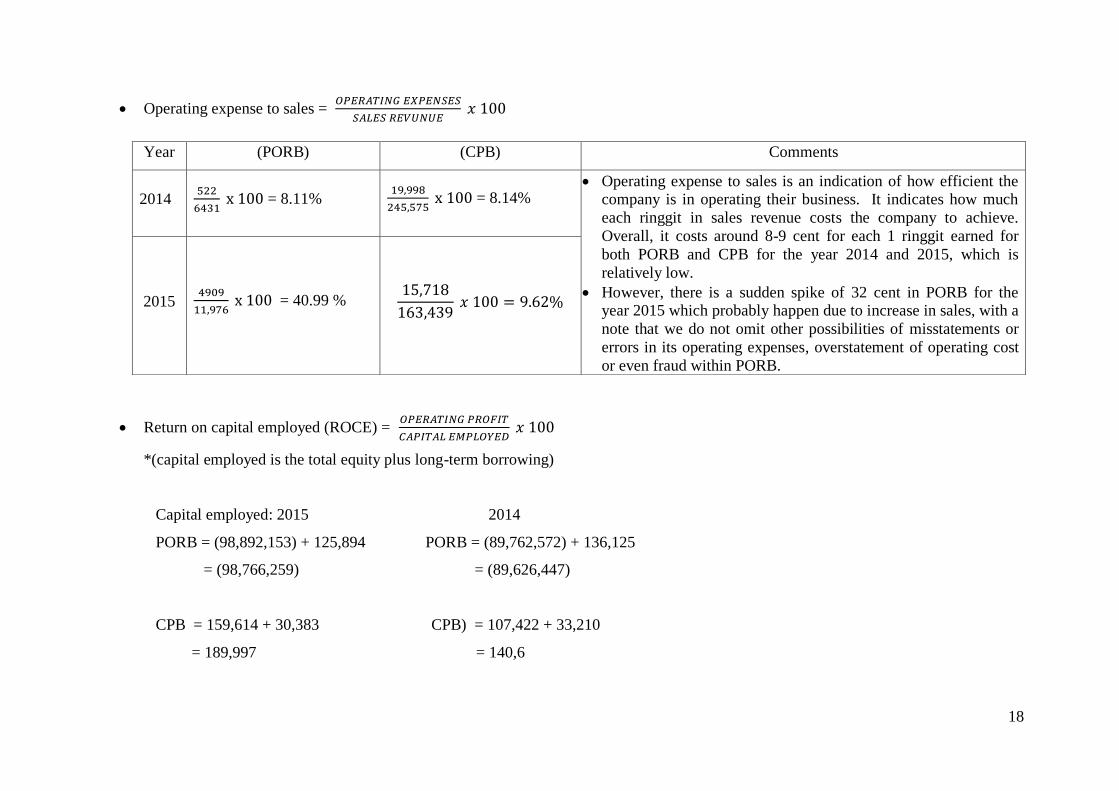
Operating expense to sales = 𝑂𝑃𝐸𝑅𝐴𝑇𝐼𝑁𝐺 𝐸𝑋𝑃𝐸𝑁𝑆𝐸𝑆
𝑆𝐴𝐿𝐸𝑆 𝑅𝐸𝑉𝑈𝑁𝑈𝐸 𝑥 100
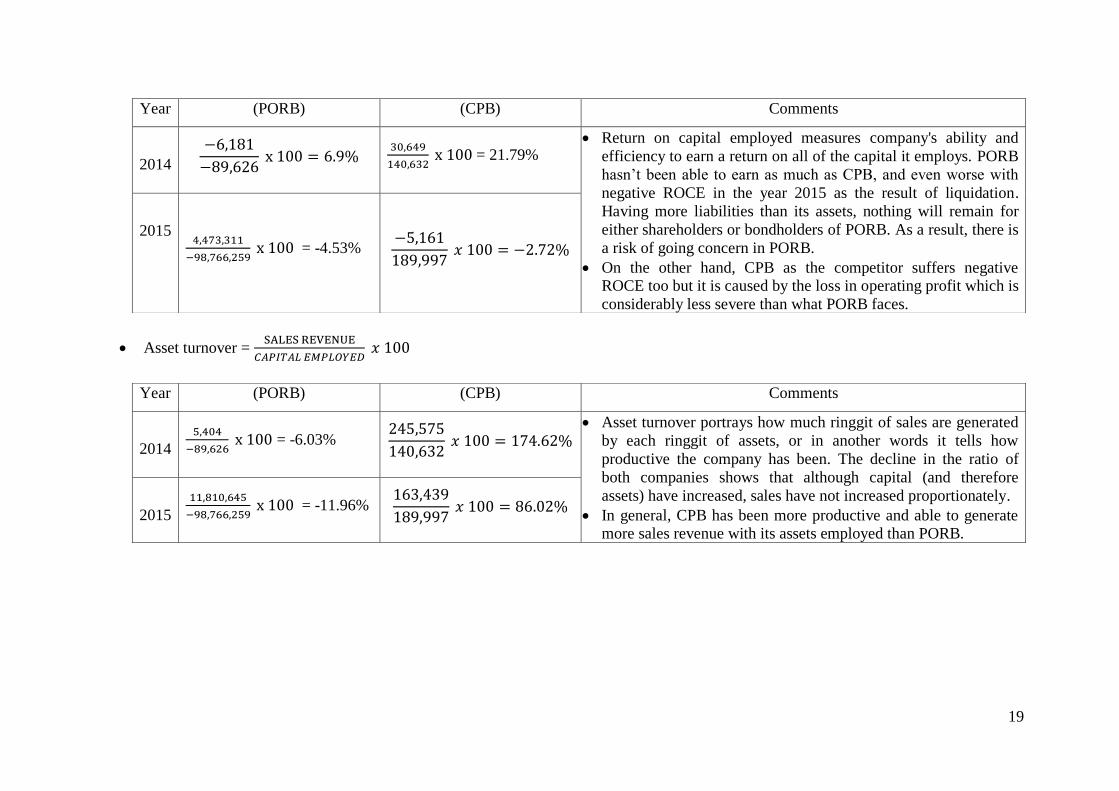
Return on capital employed (ROCE) = 𝑂𝑃𝐸𝑅𝐴𝑇𝐼𝑁𝐺 𝑃𝑅𝑂𝐹𝐼𝑇
𝐶𝐴𝑃𝐼𝑇𝐴𝐿 𝐸𝑀𝑃𝐿𝑂𝑌𝐸𝐷 𝑥 100
*(capital employed is the total equity plus long-term borrowing)
Capital employed: 2015 2014
PORB = (98,892,153) + 125,894 PORB = (89,762,572) + 136,125
= (98,766,259) = (89,626,447)
CPB = 159,614 + 30,383 CPB) = 107,422 + 33,210
= 189,997 = 140,6
Year (PORB) (CPB) Comments
2014 522
6431 x 100 = 8.11%
19,998
245,575 x 100 = 8.14%
Operating expense to sales is an indication of how efficient the company is in operating their business. It indicates how much
each ringgit in sales revenue costs the company to achieve.
Overall, it costs around 8-9 cent for each 1 ringgit earned for
both PORB and CPB for the year 2014 and 2015, which is
relatively low.
However, there is a sudden spike of 32 cent in PORB for the year 2015 which probably happen due to increase in sales, with a
note that we do not omit other possibilities of misstatements or
errors in its operating expenses, overstatement of operating cost
or even fraud within PORB.
2015 4909
11,976 x 100 = 40.99 %
15,718
163,439 𝑥 100 = 9.62%
19
Asset turnover = SALES REVENUE
𝐶𝐴𝑃𝐼𝑇𝐴𝐿 𝐸𝑀𝑃𝐿𝑂𝑌𝐸𝐷 𝑥 100
Year (PORB) (CPB) Comments
2014
−6,181
−89,626 x 100 = 6.9%
30,649
140,632 x 100 = 21.79%
Return on capital employed measures company's ability and
efficiency to earn a return on all of the capital it employs. PORB
hasn’t been able to earn as much as CPB, and even worse with
negative ROCE in the year 2015 as the result of liquidation.
Having more liabilities than its assets, nothing will remain for
either shareholders or bondholders of PORB. As a result, there is
a risk of going concern in PORB.
On the other hand, CPB as the competitor suffers negative ROCE too but it is caused by the loss in operating profit which is
considerably less severe than what PORB faces.
2015 4,473,311
−98,766,259 x 100 = -4.53%
−5,161
189,997 𝑥 100 = −2.72%
Year (PORB) (CPB) Comments
2014
5,404
−89,626 x 100 = -6.03%
245,575
140,632 𝑥 100 = 174.62%
Asset turnover portrays how much ringgit of sales are generated
by each ringgit of assets, or in another words it tells how
productive the company has been. The decline in the ratio of
both companies shows that although capital (and therefore
assets) have increased, sales have not increased proportionately.
In general, CPB has been more productive and able to generate more sales revenue with its assets employed than PORB.
2015
11,810,645
−98,766,259 x 100 = -11.96%
163,439
189,997 𝑥 100 = 86.02%
20
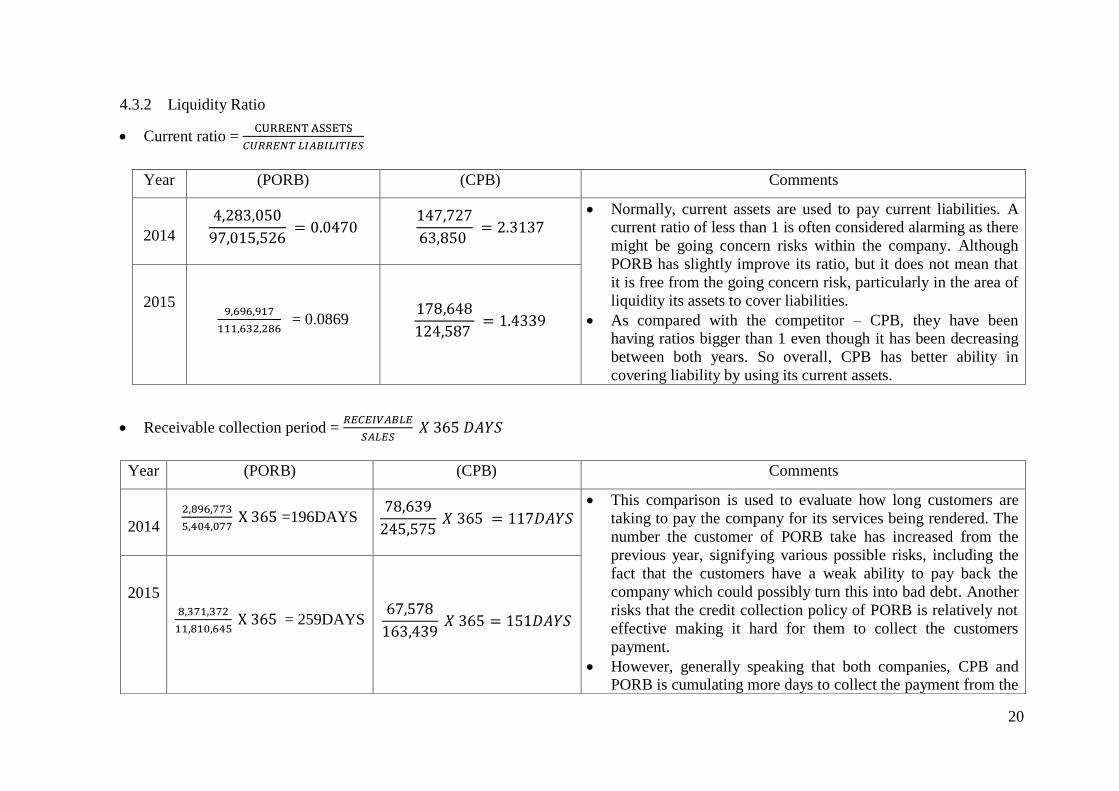
4.3.2 Liquidity Ratio
Current ratio = CURRENT ASSETS
𝐶𝑈𝑅𝑅𝐸𝑁𝑇 𝐿𝐼𝐴𝐵𝐼𝐿𝐼𝑇𝐼𝐸𝑆
Receivable collection period = 𝑅𝐸𝐶𝐸𝐼𝑉𝐴𝐵𝐿𝐸
𝑆𝐴𝐿𝐸𝑆 𝑋 365 𝐷𝐴𝑌𝑆
Year (PORB) (CPB) Comments
2014
4,283,050
97,015,526 = 0.0470
147,727
63,850 = 2.3137
Normally, current assets are used to pay current liabilities. A current ratio of less than 1 is often considered alarming as there
might be going concern risks within the company. Although
PORB has slightly improve its ratio, but it does not mean that
it is free from the going concern risk, particularly in the area of
liquidity its assets to cover liabilities.
As compared with the competitor – CPB, they have been having ratios bigger than 1 even though it has been decreasing
between both years. So overall, CPB has better ability in
covering liability by using its current assets.
2015 9,696,917
111,632,286 = 0.0869
178,648
124,587 = 1.4339
Year (PORB) (CPB) Comments
2014
2,896,773
5,404,077 X 365 =196DAYS
78,639
245,575 𝑋 365 = 117𝐷𝐴𝑌𝑆
This comparison is used to evaluate how long customers are
taking to pay the company for its services being rendered. The
number the customer of PORB take has increased from the
previous year, signifying various possible risks, including the
fact that the customers have a weak ability to pay back the
company which could possibly turn this into bad debt. Another
risks that the credit collection policy of PORB is relatively not
effective making it hard for them to collect the customers
payment.
However, generally speaking that both companies, CPB and PORB is cumulating more days to collect the payment from the
2015 8,371,372
11,810,645 X 365 = 259DAYS
67,578
163,439 𝑋 365 = 151𝐷𝐴𝑌𝑆

21
Payables Payment period = 𝐴𝐶𝐶𝑂𝑈𝑁𝑇 𝑃𝐴𝑌𝐴𝐵𝐿𝐸𝑆
𝐶𝑂𝑆𝑇 𝑂𝐹 𝑆𝐴𝐿𝐸𝑆 𝑋 365𝐷𝐴𝑌𝑆
4.3.3 Risk Ratio
The gearing ratio 𝐿𝑂𝑁𝐺 𝑇𝐸𝑅𝑀 𝐿𝑂𝐴𝑁 𝐹𝐼𝑁𝐴𝑁𝐶𝐸
𝐸𝑄𝑈𝐼𝑇𝑌 𝐹𝐼𝑁𝐴𝑁𝐶𝐸 𝑋 100%
customer, highlighting the fact that it could be collective problem that the whole industry is currently facing though
PORB has it worse than its competitor, CPB.
Year (PORB) (CPB) Comments
2014
9,962,688
825,081 𝑋 365
= 4407𝐷𝐴𝑌𝑆
11,778
201,467 𝑋 365 = 21𝐷𝐴𝑌𝑆
Payables payment period ratio tells how long it takes for company to pay its invoices from trade creditors, such as
suppliers and its business partners. In the previous fiscal years,
Petrol One and its subsidiary were unable to meet their loan
obligations since January 2011 and March 2010, respectively
(Lynn, 2014). So it does make sense that PORB was having a
huge number of days count to pay its payables as the
obligations from the previous fiscal years were carried forward.
However, they have shown a good improvement as PORB has
successfully reduced the days to 16% of previous year’s day
count.
On the other hand, its competitor, CPB has shown a constantly
healthy and reasonable period of payment in meeting its
obligation to pay its payables having it less than 30 days, as
compared with PORB which has a long way to go before it can
be considered healthy.
2015
10,897,955
5,252,091 X 365 =
757DAYS
8,716
158,823 𝑋 365 = 20𝐷𝐴𝑌𝑆

22
Interest cover = 𝑂𝑃𝐸𝑅𝐴𝑇𝐼𝑁𝐺 𝑃𝑅𝑂𝐹𝐼𝑇 𝐵𝐸𝐹𝑂𝑅𝐸 𝐼𝑁𝑇𝐸𝑅𝐸𝑆𝑇
𝐼𝑁𝑇𝐸𝑅𝐸𝑆𝑇
Year (PORB) (CPB) Comments
2014
136,125
(89,762,572) X 100 = −0.16%
33,210
107,422 𝑋 100 = 30.92%
The gearing ratio is defined in a way of comparing long-
term loan finance to total finance. As gearing ratio
decreases, so does the possibility of more interest can not
be paid. However, it is difficult to define a ‘safe’ level of
gearing. Reduction of gearing ratio would mean a greater
financial stability, and hence it is recommended for oil and
gas companies to keep it low as it is operating in volatile
market full of uncertainties. Yet, PORB has still long plan
to settle their equity finance problem.
As compared with CPB, both of the company has shown a slight improvement in its gearing ratio, reducing its
possibility of not being able to pay the interest of its loans.
2015
125,894
(98,892,153) X 100 = -0.13%
31,074
159,614 𝑋 100 = 19.47%
Year (PORB) (CPB) Comments
2014
(1,519)
4,266= −0.36
30,393
246 = 123.55
Interest cover shows how many times interest can be paid out of earnings. Neither
of these ratios would give cause for concern. The interest amounts would have to be
tested to see that they were reasonable, given interest rates and when the additional
borrowings were made. Besides that, because in the 2014, the company was making
loses so PORB was not able to pay its interest and hence it gets the negative figure.
However, as we compared with CPB as the competitor which has sudden drop in its ability to pay interest out of its earnings, it has significant difference which shows
that PORB was operating slightly well as compared to CPB.
2015 3,339
2,199 = 1.52
(4,888)
2,150 = -2.27
23
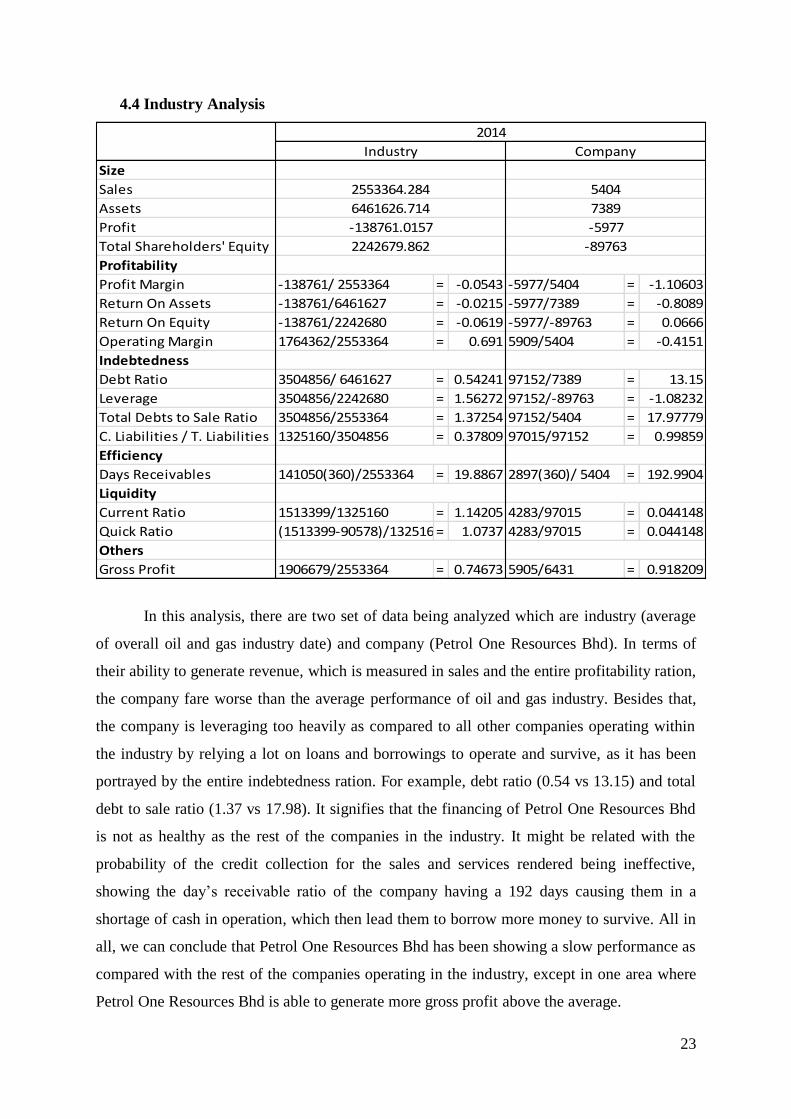
4.4 Industry Analysis
Size
Sales
Assets
Profit
Total Shareholders' Equity
Profitability
Profit Margin -138761/ 2553364 = -0.0543 -5977/5404 = -1.10603
Return On Assets -138761/6461627 = -0.0215 -5977/7389 = -0.8089
Return On Equity -138761/2242680 = -0.0619 -5977/-89763 = 0.0666
Operating Margin 1764362/2553364 = 0.691 5909/5404 = -0.4151
Indebtedness
Debt Ratio 3504856/ 6461627 = 0.54241 97152/7389 = 13.15
Leverage 3504856/2242680 = 1.56272 97152/-89763 = -1.08232
Total Debts to Sale Ratio 3504856/2553364 = 1.37254 97152/5404 = 17.97779
C. Liabilities / T. Liabilities 1325160/3504856 = 0.37809 97015/97152 = 0.99859
Efficiency
Days Receivables 141050(360)/2553364 = 19.8867 2897(360)/ 5404 = 192.9904
Liquidity
Current Ratio 1513399/1325160 = 1.14205 4283/97015 = 0.044148
Quick Ratio (1513399-90578)/1325160= 1.0737 4283/97015 = 0.044148
Others
Gross Profit 1906679/2553364 = 0.74673 5905/6431 = 0.918209
-138761.0157
2242679.862
2014
CompanyIndustry
5404
7389
-5977
-89763
2553364.284
6461626.714
In this analysis, there are two set of data being analyzed which are industry (average
of overall oil and gas industry date) and company (Petrol One Resources Bhd). In terms of
their ability to generate revenue, which is measured in sales and the entire profitability ration,
the company fare worse than the average performance of oil and gas industry. Besides that,
the company is leveraging too heavily as compared to all other companies operating within
the industry by relying a lot on loans and borrowings to operate and survive, as it has been
portrayed by the entire indebtedness ration. For example, debt ratio (0.54 vs 13.15) and total
debt to sale ratio (1.37 vs 17.98). It signifies that the financing of Petrol One Resources Bhd
is not as healthy as the rest of the companies in the industry. It might be related with the
probability of the credit collection for the sales and services rendered being ineffective,
showing the day’s receivable ratio of the company having a 192 days causing them in a
shortage of cash in operation, which then lead them to borrow more money to survive. All in
all, we can conclude that Petrol One Resources Bhd has been showing a slow performance as
compared with the rest of the companies operating in the industry, except in one area where
Petrol One Resources Bhd is able to generate more gross profit above the average.

24
4.5 Credit Analysis
Focusing more of our attention towards the credit of its company due to its high
amount of loans and borrowings to the point it is exceeding its asset, we do think that
presenting the result analysis would be a good complementary towards other analysis we
have performed earlier.
Referring to the credit analysis on Petrol One Resources Berhad on International
Emerging Market, this company is scored higher than only 26.19% of companies in the
industry, which equates to D - High Risk on the Business Scale (EMIS, 2016). The
relative weakness stated is sales, sales growth and net income. EMIS was issuing
disclaimer on this, which we should take into consideration as it has been a primary go-to
source for investors an business leaders in making decisions.
5. Setting Materiality and Assess Acceptable Audit Risk and Inherent Risk
5.1 Setting Materiality Level
In deciding the level of materiality that we are going to use in determining whether
the omission of certain part would significantly alter the economic decision being made
by the users, we will take some matters into our consideration.
First and foremost, we are considering the disclaimer opinion for the year 2012 until
2014 for Petrol One Resources Bhd being expressed by KPMG Malaysia as the
company’s former auditor. The disclaimer opinions serve as precaution for us as the
appointed auditor to do a more thorough checking and review when we are auditing the
company.
Secondly, we have found inconsistencies between the figures posted in the annual
report and the audited figures of financial statements available in EMIS, an institutional
investment website for investors and analysts. This serves as another cautionary for us as
the risk of the misstatement are evident.
Thirdly, as the result of credit analysts put Petrol One Resources Bhd in D list (High
Risk on the Business Scale); we will hence need to take the risks into account too.
Fourthly, considering the company is having liquidity problem with its liabilities
exceeding its assets and the current outlook of the industry is in high volatility and not
very well either; it will not only mean that a lot more stakeholders will rely on our audit
report, but it will also mean that a little mistake might bring a fatal blow to the company
which is relatively unhealthy in terms of its financial condition. Hence, a careful and
25
thorough checking and review would be factored in deciding the level of materiality
which is not only economically and time efficient for auditor and its client, but also it is
highly reliable with its reasonable assurance for the users to rely on.
Fifthly, figuring out the fact that there are 3 major areas in high risk category which
are: account receivables, liabilities and stockholders’ equity, as well as sales and cost of
sales; a thorough audit and review shall be necessary in ensuring that it is reasonably
reliable.
Hence, after taking the aforementioned factors into consideration and the nature of the
company being risk taker; our auditing company has decided to set 5% materiality level –
strict enough to not miss any material misstatements but economically wise enough to not
put our client in deeper financial difficulty.
5.2 Assessing Acceptable Audit Risk
Acceptable audit risk or normally referred as audit assurance is a measure of how
willing are we as an auditor to accept that the financial statements might be materially
misstated after the audit is done and an unqualified opinion has been issued. Considering
our client’s company size with its less than 50 employees, the degree of the external users
might rely on our audit report especially those creditors that our client has been
borrowing the money from, and the likelihood that the financial difficulties that our client
are facing might be getting severe; we have decided to set the acceptable audit risk to 3%
- which is fine to contain material statement but not powerful enough to bring adverse
effects towards our client and the stakeholders in general.
5.3 Assessing Inherent Risk
Inherent risk measure the auditor’s assessment of the tendency that there are material
misstatement due to error or fraud in a segment before considering the effectiveness of
internal control (Alvin A. Arens, 2014). As the auditor, we have conclude that the area of
sales and its cost of sales is assessed as high inherent risk, while receivables, liabilities
and stockholders’ equity are assessed as lower inherent risk based on our findings from
the analytical procedures we conducted in the earlier section. In addition to the increasing
high inherent risk, we would appoint more experienced staff in performing further
investigations and extensive tests to the sales and cost of sales in regards of achieving
reasonable assurance.
26
6. Internal Control
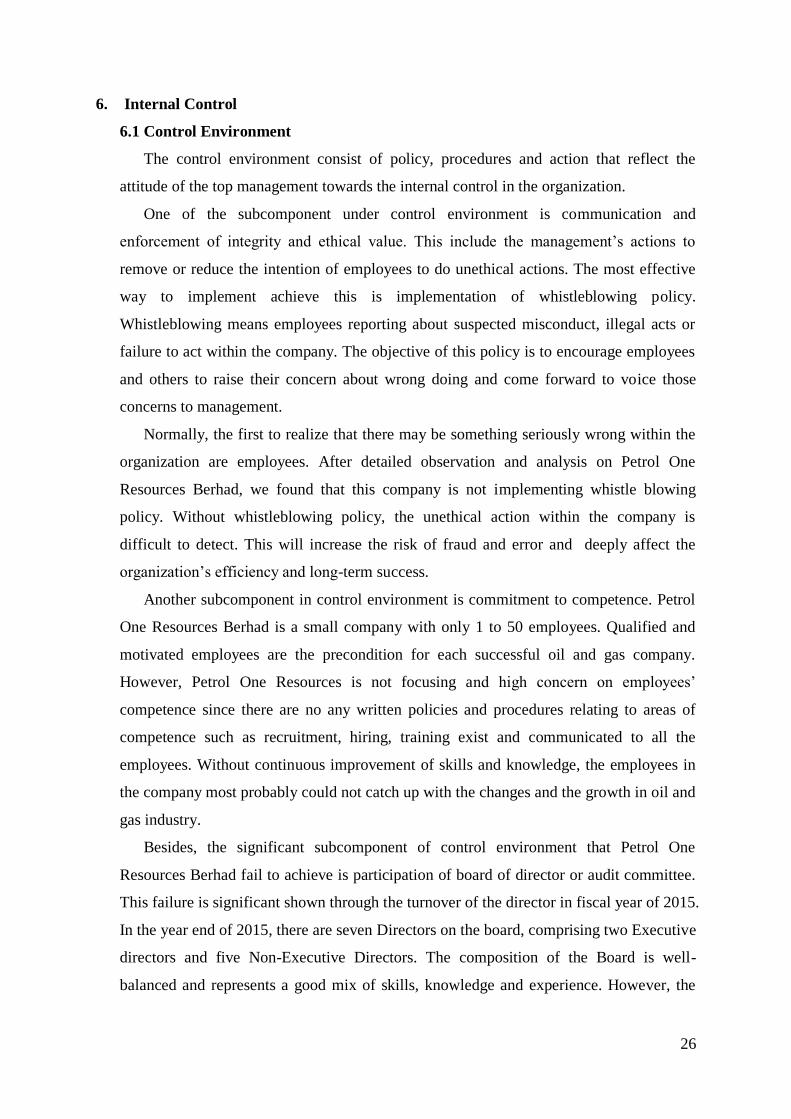
6.1 Control Environment
The control environment consist of policy, procedures and action that reflect the
attitude of the top management towards the internal control in the organization.
One of the subcomponent under control environment is communication and
enforcement of integrity and ethical value. This include the management’s actions to
remove or reduce the intention of employees to do unethical actions. The most effective
way to implement achieve this is implementation of whistleblowing policy.
Whistleblowing means employees reporting about suspected misconduct, illegal acts or
failure to act within the company. The objective of this policy is to encourage employees
and others to raise their concern about wrong doing and come forward to voice those
concerns to management.
Normally, the first to realize that there may be something seriously wrong within the
organization are employees. After detailed observation and analysis on Petrol One
Resources Berhad, we found that this company is not implementing whistle blowing
policy. Without whistleblowing policy, the unethical action within the company is
difficult to detect. This will increase the risk of fraud and error and deeply affect the
organization’s efficiency and long-term success.
Another subcomponent in control environment is commitment to competence. Petrol
One Resources Berhad is a small company with only 1 to 50 employees. Qualified and
motivated employees are the precondition for each successful oil and gas company.
However, Petrol One Resources is not focusing and high concern on employees’
competence since there are no any written policies and procedures relating to areas of
competence such as recruitment, hiring, training exist and communicated to all the
employees. Without continuous improvement of skills and knowledge, the employees in
the company most probably could not catch up with the changes and the growth in oil and
gas industry.
Besides, the significant subcomponent of control environment that Petrol One
Resources Berhad fail to achieve is participation of board of director or audit committee.
This failure is significant shown through the turnover of the director in fiscal year of 2015.
In the year end of 2015, there are seven Directors on the board, comprising two Executive
directors and five Non-Executive Directors. The composition of the Board is well-
balanced and represents a good mix of skills, knowledge and experience. However, the

27
turnover of directors is high within this year. There are 2 directors resigned from the
group and 3 directors were appointed during the financial year.
Name of director Date of resigned and appointed
Azlan Shairi Bin Asidin
Appointed as an Executive Director cum Chief
Executive Officer w.e.f. 11 November 2014
Ahmad Nainy Bin Mokhtar
Appointed as an Independent Non-Executive
Director w.e.f. 6 February 2015
Chris Lim Su Heng
Appointed as an Independent Non-Executive
Director w.e.f. 2 March 2015
Lim Kian Boon
Resigned as the Managing Director w.e.f. 11
November 2014
Wisun Soon
Resigned as an Independent Non-Executive
Director w.e.f.11 November 2014
(Petrol One Resources Bhd, p.19, 2015)
The turnover of director will result in the poor communication among Directors.
There will be a time gap for every new directors appointed to the board to understand the
board responsibilities and management. This may result in the inactiveness of the Board
and reduce their efficiency of action and effectiveness to internal control implementation.
Moreover, we recognize Petrol One Resources Berhad is a risk taker in its
management philosophy and operating style. In 2014, the current ratio of the company has
decrease to 0.04 from 0.32 from 2012. The decrease in current ratio give a very significant
view that the ability of the company to pay their short term debt is decreasing. However,
Petrol One Resources Berhad keeps getting more loan from financial institution without
considering their ability to pay for the short- term and long-term obligation. The risk of
Petrol One Resources Berhad unable to pay for its debt is very high and this has arisen the
substantial doubt about going concern of the company.

28
6.2 Information System and Communication
Information system and communication is one of the components of internal control.
It is establishment of an information system to manage and communicate the
organization’s activities and prepare financial statements. Information system and
communication is enabling to supports understanding and execution of organizational
objectives and individual responsibilities at all levels of the organization. Communication
can flow down, up, and across all levels of an organization to effective. This includes not
only emails, office memorandums, and staff meetings; but also more formal
communications like position descriptions, employee evaluations, and agency and
statewide policy and procedures. It is critical that employees understand organizational
objectives, including internal control objectives, and their specific role in achieving them.
In the group, the Senior Management adopt‘ open-door’ and ‘hands-on’ approach in
the daily operational activities to improve the workflow throughout the Group and to
enhance overall communication effectiveness. (Petrol One Resources Bhd, p.18, 2015)
6.3 Monitoring
Third is monitoring, the Board recognizes and think to increasing of maintaining a
risk management and internal control system and affirms its ultimate responsibility for the
Group’s risk management and internal control that covers the determination of the risk
profiles, appetite and level of tolerance, the implementation of appropriate processes and
control actions to manage the significant risks, and the periodical review and monitoring
of the effectiveness of the system to ensure its adequacy and integrity to enable the Group
to achieve its goals and objectives as well as to safeguard the shareholders’ investments
and the Group’s assets. The Management, which comprises Directors with executive
function, is assigned to implement the Board’s policies and practices on risk and control.
Besides that, the Group’s risk management and system of internal controls are designed to
manage rather than eliminate the risks that may impede the achievement of its corporate
objectives.
Other than that, the Group’s risk management and internal control extends to all
aspects of its activities. The Board is dedicated to ensure that the Group’s corporate
strategies are set in congruence with its risk profile and degree of tolerance. The risk
management structure and control mechanism for financial, operational, environmental
and compliance matters with Board’s participation, is put in place and embedded
throughout the Group during the financial year under review and up to the date of
29
approval of this Statement, so as to manage the significant risks that may affect the
Group’s business objectives on a continuous basis and they also allow any new
significant risk identified being subsequently evaluated and managed.
To strengthen the Group’s risk management processes of identifying, evaluating,
monitoring and managing significant risks faced by the Group, administrative and
operational functions of the Group are centralized to maintain consistency in the setting
and application of policies and procedures relating to these functions. The structure helps
to reduce duplication or overlapping of efforts, close the possible coverage gaps and
create synergies to the Group. The Executive Directors and the Management, who are
accountable for the conduct and performance of the Group, practiced ‘open-door’ and
‘hands-on’ approach in their management of the day-to-day affairs and business activities
of the Group.
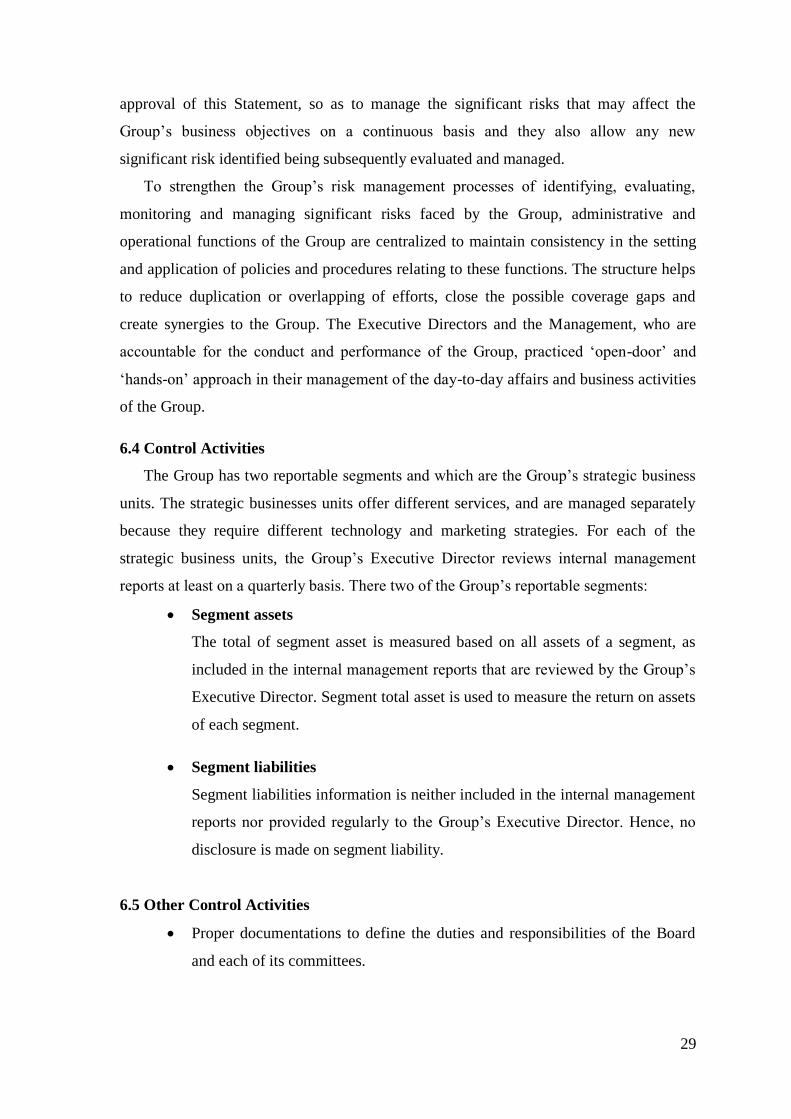
6.4 Control Activities
The Group has two reportable segments and which are the Group’s strategic business
units. The strategic businesses units offer different services, and are managed separately
because they require different technology and marketing strategies. For each of the
strategic business units, the Group’s Executive Director reviews internal management
reports at least on a quarterly basis. There two of the Group’s reportable segments:
Segment assets
The total of segment asset is measured based on all assets of a segment, as
included in the internal management reports that are reviewed by the Group’s
Executive Director. Segment total asset is used to measure the return on assets
of each segment.
Segment liabilities
Segment liabilities information is neither included in the internal management
reports nor provided regularly to the Group’s Executive Director. Hence, no
disclosure is made on segment liability.
6.5 Other Control Activities
Proper documentations to define the duties and responsibilities of the Board
and each of its committees.

30
Key functional units are managed by experienced and dedicated team of
personnel.
Defined levels of authority for day-to-day business aspects of the Group
covering procurement, payments, capital expenditures, investments and
recruitment have been made known to all personnel.
Clear organization structure, comprising Business Operations and Finance, to
facilitate the implementation of risk management and control procedures.
The executive directors participate directly in the daily management of the
Group, and report to the Board on significant changes in business environment
as well as relevant corporate, legal, accounting and market developments
which might affect the business of the Group.

31
6.6 Corporate’s Structure
BOARD OF DIRECTOR AUDIT COMMITEE
PRESIDENT
GENERAL MANAGEMENT
Bunker
Offshore
Support
Services
Floating
Storage and
Offloading
Storage
Shipping and
Forwarding
INTERNAL
AUDIT
Ship
Management
32
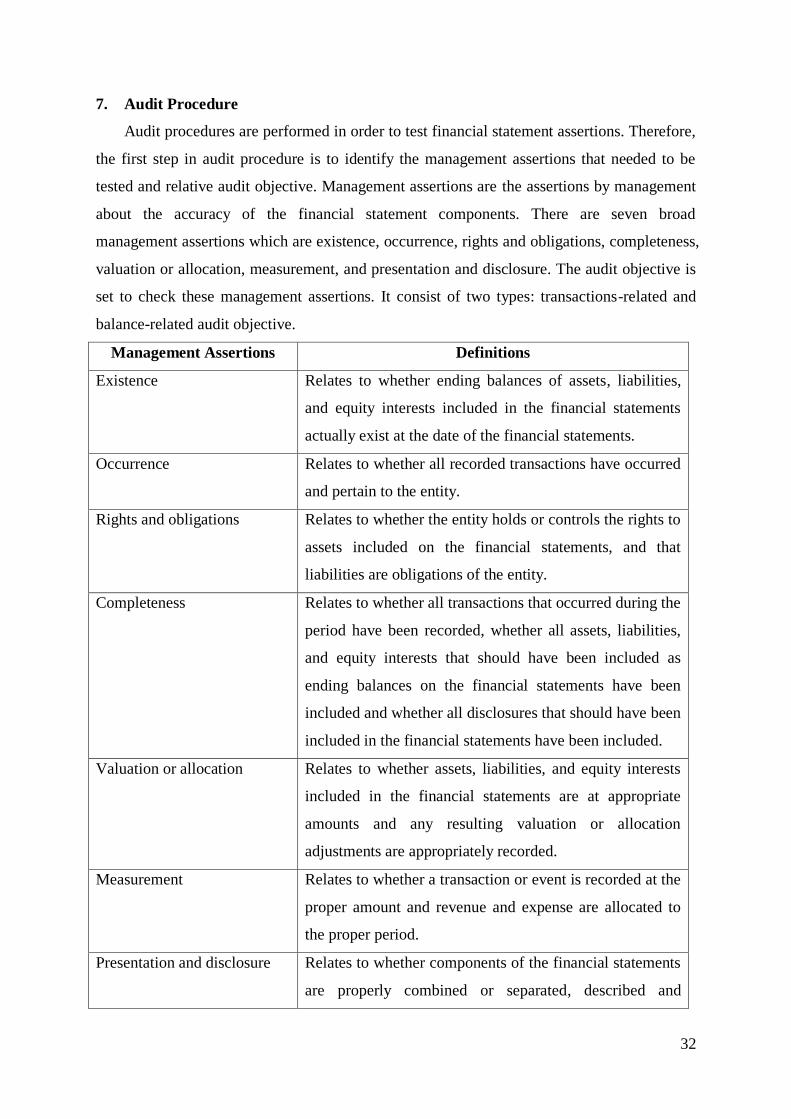
7. Audit Procedure
Audit procedures are performed in order to test financial statement assertions. Therefore,
the first step in audit procedure is to identify the management assertions that needed to be
tested and relative audit objective. Management assertions are the assertions by management
about the accuracy of the financial statement components. There are seven broad
management assertions which are existence, occurrence, rights and obligations, completeness,
valuation or allocation, measurement, and presentation and disclosure. The audit objective is
set to check these management assertions. It consist of two types: transactions-related and
balance-related audit objective.
Management Assertions Definitions
Existence Relates to whether ending balances of assets, liabilities,
and equity interests included in the financial statements
actually exist at the date of the financial statements.
Occurrence Relates to whether all recorded transactions have occurred
and pertain to the entity.
Rights and obligations Relates to whether the entity holds or controls the rights to
assets included on the financial statements, and that
liabilities are obligations of the entity.
Completeness Relates to whether all transactions that occurred during the
period have been recorded, whether all assets, liabilities,
and equity interests that should have been included as
ending balances on the financial statements have been
included and whether all disclosures that should have been
included in the financial statements have been included.
Valuation or allocation Relates to whether assets, liabilities, and equity interests
included in the financial statements are at appropriate
amounts and any resulting valuation or allocation
adjustments are appropriately recorded.
Measurement Relates to whether a transaction or event is recorded at the
proper amount and revenue and expense are allocated to
the proper period.
Presentation and disclosure Relates to whether components of the financial statements
are properly combined or separated, described and

33
disclosed.
After running of risk assessment and the ratio analysis on Petrol One Resources Berhad,
we have decided to test these management assertions together with relative audit objectives
on the dubious, improbable, and high risk areas such as liabilities and owner’s equity, sales
and cost of sales, account receivables. Substantive procedures are performed to detect
whether there are any material misstatements in these areas.
7.1 Management Assertions for Liabilities and Owner’s Equity
Management
Assertions
Balances-Related
Audit Objective Substantive procedure
Existence Existence Trace a sample of trade payables to the
purchase invoices, to confirm the existence
of the transaction of purchasing goods.
Completeness Completeness Examine all loan and borrowings contracts,
cast the amount and agree the amount with
the balances amount on balance sheet to
confirm there all loan and borrowing exist
has been counted and included in the loan
summary.
Valuation or
allocation
Accuracy
Recheck the price of shares and the amount
of outstanding shares to ensure the price
used to value the shares are materially
correct and the extensions of prices times
the number of shares are correct and detail
are correctly added.
Cutoff Examine a sample of shipping documents
and purchase invoices for a few days before
and after year-end to confirm the purchase
cutoff at year-end is proper.
Classification Examine the account on the balance sheet
to confirm the equity items are properly
classified as to common stock(ordinary

34
shares), preference shares and reserves
Rights and obligation Rights and obligation Examine the loan contract to confirm entity
has legal title or obligation to the debts
shows on the balance sheet
7.2 Management Assertions for Sales and Cost of Sales
Management
Assertions
Transaction-
Related Audit
Objectives
Substantive Procedure
Existence or
occurrence
Existence Examine the profile of customer to confirm
the recorded sales are for shipments made
to non-fictitious customers.
Completeness Completeness Examine cost of goods sold in all sales
transaction and agree it with the beginning
inventory and ending inventory to ensure
all existing cost of goods sold is are
recorded and there is no any intentionally
omission of cost.
Valuation or
allocation
Accuracy Recheck the selling price and relative
quantity sold for sale transactions in
samples of sale invoice and general journal
to ensure recorded sales are for the amount
of goods shipped and are correctly billed
and recorded.
Timing Examine the dates of receiving the order,
shipment and payment to ensure the sales
are recorded on the correct dates.
Posting and
Summarization
Review the daily sales records updated on
computer accounting system and monthly
statement to ensure sales transactions are
properly included in the master file and are
correctly summarized.
35
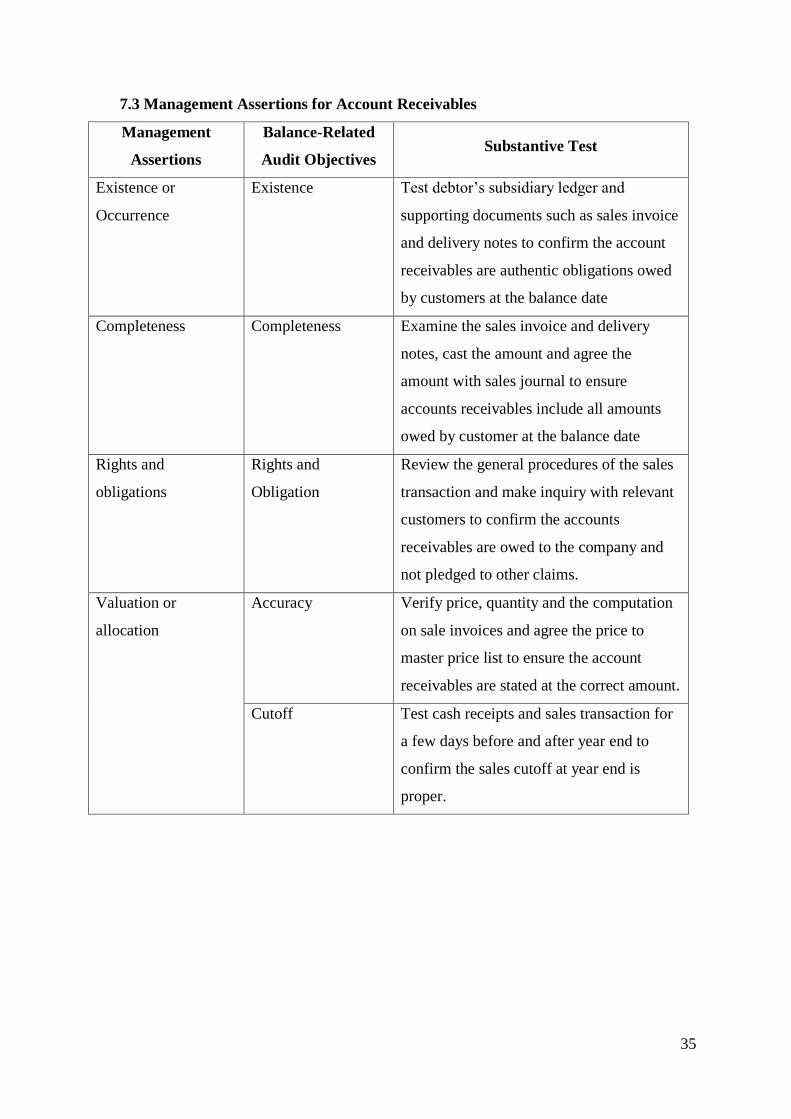
7.3 Management Assertions for Account Receivables
Management
Assertions
Balance-Related
Audit Objectives Substantive Test
Existence or
Occurrence
Existence Test debtor’s subsidiary ledger and
supporting documents such as sales invoice
and delivery notes to confirm the account
receivables are authentic obligations owed
by customers at the balance date
Completeness Completeness Examine the sales invoice and delivery
notes, cast the amount and agree the
amount with sales journal to ensure
accounts receivables include all amounts
owed by customer at the balance date
Rights and
obligations
Rights and
Obligation
Review the general procedures of the sales
transaction and make inquiry with relevant
customers to confirm the accounts
receivables are owed to the company and
not pledged to other claims.
Valuation or
allocation
Accuracy Verify price, quantity and the computation
on sale invoices and agree the price to
master price list to ensure the account
receivables are stated at the correct amount.
Cutoff Test cash receipts and sales transaction for
a few days before and after year end to
confirm the sales cutoff at year end is
proper.

36
8. Overall Audit Plan
Auditor Contact
Details
Name: Ana, JR and SY, CAs
Address: 13, Jalan Multimedia, Persiaran Multimedia, 63000
Cyberjaya, Selangor Darul Ehsan.
Auditee Contact
Details
Address:
Regus, Level 8,
Tower 8, Avenue 5
The Horizon Phase 2,
59200 Kuala Lumpur Wilayah Persekutuan, Malaysia.
Telephone (m):
03-20849000
Audit Objective The objective of this audit was to determine whether Petrol One
Resources Berhad adequately enforced compliance with the
Company Acts, 1965.
Scope of Audit Standards complied:
Malaysia Accounting Standard Board (MASB)
Business size:
50 employees
Industry:
Refining and Marketing in Oil and Gas Industry
Type of services:
- Shipping and forwarding
- Floating storage and offloading
- Offshores support services
- Bunker
- Ship management
Business hour:
Regular hour, Monday- Friday
Type of audit:
Team Audit
Language:
English
37
High Risk Area:
Liabilities and owner’s equity
Account receivables
Sales and cost of sales
Materiality Level:
5%
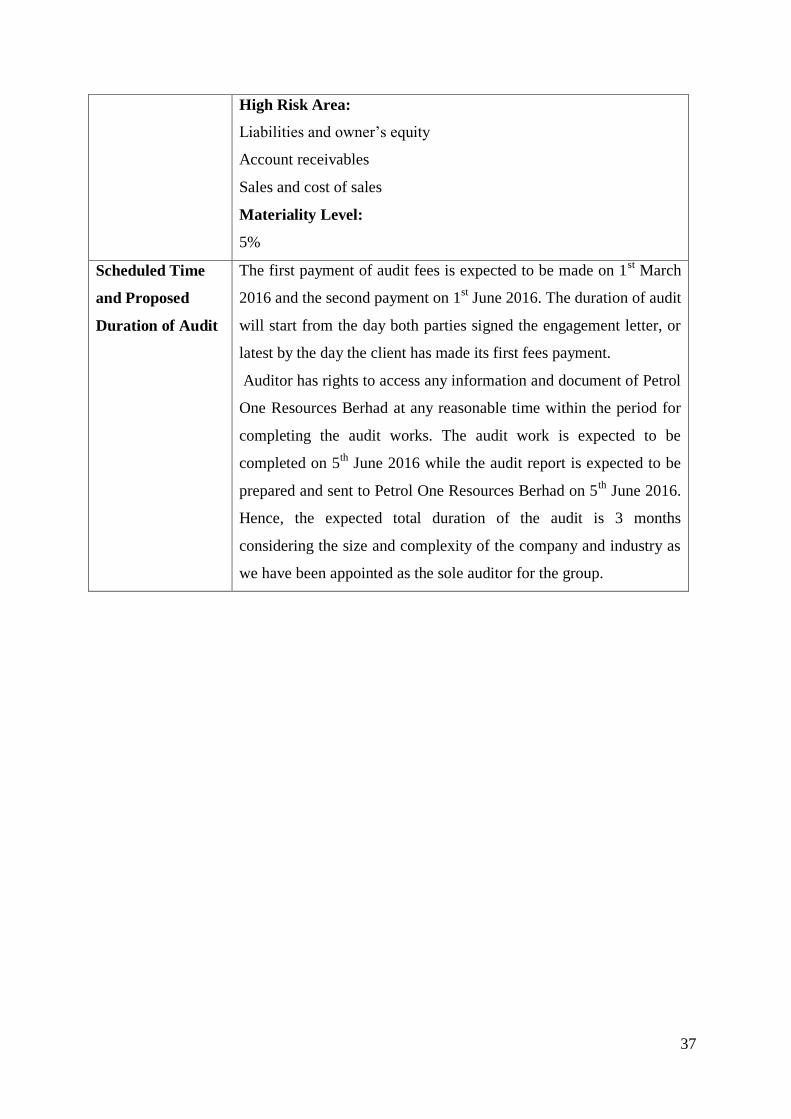
Scheduled Time
and Proposed
Duration of Audit
The first payment of audit fees is expected to be made on 1st March
2016 and the second payment on 1st June 2016. The duration of audit
will start from the day both parties signed the engagement letter, or
latest by the day the client has made its first fees payment.
Auditor has rights to access any information and document of Petrol
One Resources Berhad at any reasonable time within the period for
completing the audit works. The audit work is expected to be
completed on 5th
June 2016 while the audit report is expected to be
prepared and sent to Petrol One Resources Berhad on 5th
June 2016.
Hence, the expected total duration of the audit is 3 months
considering the size and complexity of the company and industry as
we have been appointed as the sole auditor for the group.
38
9. Conclusion
As a closing remark, generally the need of a company being independently audited by
external audit firm has been playing a key roles of gaining the trust and confidence of the
stakeholders of the company is indeed true. In a turbulence economy with less certainty
of what is about to happen tomorrow in the market, auditing and its assurance services
come into the light bringing in-depth analysis and ensuring that the financial statements
and other statements they give their opinions at truly give a true and fair view of the
current economic condition, helping the users to make a sound economic decision.
While many steps have to be taken to achieve that goal, we came to realize that
planning an audit will lead us few steps closer to the success of an audit. Fail to plan an
audit means that we are planning to fail the audit itself. The eight components of audit
planning, starting from understanding the client to forming the overall audit plan, will
guide the auditor, each step at a time in building a comprehensive audit planning which
eventually will serve as a guideline of what to do and what not to do to complete the
whole process of audit.
These results lead to the conclusion that audit planning is a must skill to have for an
auditor considering its importance in conducting a successful audit. Having the hands on
experience on crafting an audit plan for Petrol One Resources Bhd. itself is truly an
enriching and learning journey for us to become the next auditor with integrity.

39
References
ACCA. (2015, August 18). Acceptance Decisions for Audit and Assurance Enggagement.
Retrieved from ACCA: http://www.accaglobal.com/ie/en/student/exam-support-
resources/professional-exams-study-resources/p7/technical-articles/acceptance-
decisions.html
Accounting Tools. (2016). Horizontal Analysis. Retrieved from Accounting Tools:
http://www.accountingtools.com/horizontal-analysis
Accounting Tools. (2016). Vertical Analysis. Retrieved from Accounting Tools:
http://www.accountingtools.com/vertical-analysis
AICPA. (2012). Planning an Audit. Retrieved from AICPA:
http://www.aicpa.org/Research/Standards/AuditAttest/DownloadableDocuments/AU-
C-00300.pdf
Alvin A. Arens, R. J. (2014). The Audit Process. In A. A. Arens, R. J. Elder, M. S. Beasley,
N. A. Amran, R. Shafie, & M. Yusof, Auditing and Assurance Services in Malaysia
(pp. 194-195). Kuala Lumpur: Pearson Malaysia.
Burke, A. (2016). Introduction to Audit Planning. Retrieved from CPA Ireland:
http://www.cpaireland.ie/docs/default-source/Students/Study-Support/P1-
Auditing/introduction-to-audit-planning.pdf?sfvrsn=0
Bursa Malaysia. (2015, January 27). Main Listing Requirement: Criteria and Obligations of
PN 17 Issuers. Retrieved from Bursa Malaysia:
http://customer.bursamalaysia.com:8080/MainLR/Pages/MainPracticeNote17.aspx
EMIS. (2016). Company's Report Generator: Credit Analysis. Retrieved from EMIS
Professional:
http://www.securities.com.proxyvlib.mmu.edu.my/php/companies/index?pc=MY&c
mpy=1660622
Investopedia. (2016). Oil Refinery. Retrieved from Investopedia:
http://www.investopedia.com/terms/o/oil-refinery.asp
Lynn, T. W. (2014, October 30). Petrol One’s auditor expresses disclaimer of opinion for
third time. Retrieved from The Edge Market:
http://www.theedgemarkets.com/my/article/petrol-one%E2%80%99s-auditor-
expresses-disclaimer-opinion-third-time
Manac, A. (2015, May 6). Balancing the Upstream and Downstream Formula. Retrieved
from Malaysia Streaming Oil & Gas Financial Journal:
40
http://www.malaysiangas.com/portal/document/publication/1451874565_Malaysia_S.
html
Ngai, C. (2016, January 11). Oil dive deepens to 12-year low; $20 warning on China.
Retrieved from Reuters: http://www.reuters.com/article/us-global-oil-
idUSKCN0UP01P20160111
Petrol One Resources Bhd. (2015). Petrol One Resources Berhad: Annual Report 2015.
Kuala Lumpur: Petrol One Resources Bhd.
Petrol One Resources Bhd. (2011). Product and Services. Retrieved from Petrol One
Resources Berhad: http://www.petrolonegroup.com/index.php/product-services/
PwC. (2013, January). Understanding a Financial Statement Audit. Retrieved from PwC:
https://www.pwc.com/gx/en/audit-services/publications/assets/pwc-understanding-
financial-statement-audit.pdf
Sidhu, J. S. (2015, September 26). Rightsizing in the oil and gas industry. Retrieved from The
Star: http://www.thestar.com.my/business/business-news/2015/09/26/rightsizing-in-
the-oil-and-gas-industry/
Viren Doshi, A. C. (2016, January n.d). 2016 Oil and Gas Trends. Retrieved from Strategy
PwC: http://www.strategyand.pwc.com/perspectives/2016-oil-and-gas-trends
Yuan, G. C. (2015, December 3). Petrol One appoints special auditor to review its FY15
accounts. Retrieved from The Edge Market:
http://www.theedgemarkets.com/my/article/petrol-one-appoints-special-auditor-
review-its-fy15-accounts