baa (sp) limited results for the nine months ended 30
TRANSCRIPT

Registered in England No 06458621 Registered Office: The Compass Centre, Nelson Road, Hounslow, Middlesex, TW6 2GW
BAA Limited The Compass Centre, Nelson Road
Hounslow, Middlesex, TW6 2GW T: +44 (0)20 8745 7224 F: +44 (0)20 8745 6061
E: [email protected] W: baa.com
28 October 2009
BAA (SP) Limited
Results for the nine months ended 30 September 2009
BAA (SP) Limited owns BAA’s three London airports of Heathrow, Gatwick and Stansted. Throughout this document, BAA (SP) Limited and its subsidiaries are referred to as the Group.
o Adjusted EBITDA up 16.8%
- strong cost control with underlying operating costs down 3.3% - resilient revenues driven by higher tariffs and strong retail performance
o Improved operational performance with Heathrow outperforming competitors and achieving better punctuality and airport service quality scores
o Sale of Gatwick to Global Infrastructure Partners for £1.51 billion announced o Net sale proceeds to be used to repay debt including £1 billion maturing in March 2010 o DfT’s recent announcement on regulation removes key uncertainties for airport investment o Pre-tax loss reflects over £670 million of non-cash charges including:
- £261.7 million exceptional item relating to an increased pension scheme deficit - £225.0 million impairment loss reflecting the difference between Gatwick’s sale price and
its carrying value - £136.1 million of fair value losses on financial instruments
o Outlook for 2009 remains consistent with expectations
At or for nine months ended 30 September
Unaudited
2009(1)
Unaudited pro forma
2008(1)(2)
Change (%)
(figures in £m unless otherwise stated)
Revenues 1,846.0 1,716.2 7.6 Adjusted EBITDA
(3) 804.6 689.0 16.8
Cash generated from operations 742.8 517.7 43.5 Adjusted pre-tax loss
(4) (111.5) (33.2) (235.8)
Pre-tax loss (784.7) (519.5) (51.0) Net debt
(5)(6) 9,771.0 9,426.0 (3.7)
Regulatory Asset Base(6)
13,155.7 12,470.2 5.5
Passengers (m) 90.7 96.0 (5.5) Net retail income per passenger £4.64 £4.37 6.1 (1) Includes the results of Gatwick which is classified as a discontinued operation in the profit and loss account in Appendix 1 (2) Profit and loss figures for 2008 are prepared on a pro forma basis assuming consolidation of Heathrow Express Operating
Company Limited although it was not acquired by the Group until 7 August 2008 (3) Adjusted EBITDA is earnings before interest, tax, depreciation and amortisation and exceptional items (4) Adjusted pre-tax loss is before exceptional items and fair value adjustments (5) Nominal value of net debt excluding intra-BAA group loans and including index-linked derivative accretion (6) 2008 net debt and Regulatory Asset Base figures are as at 31 December 2008 rather than 30 September 2008
Colin Matthews, Chief Executive Officer of BAA, said: "We have delivered a good performance in line with expectations for the first nine months of the year, helped by Heathrow’s continued resilience, higher retail spending by passengers and tight cost control. Our London airports are strongly cash generative and our debt and underlying interest costs are stable. We are pleased to have agreed the sale of Gatwick Airport and our focus for the rest of the year is on improving efficiency and service standards for our customers, and further reducing costs. The accounting losses we are reporting today reflect non-cash exceptional charges and do not reflect the strong underlying performance of the business."

2
For further information please contact
BAA Media enquiries Malcolm Robertson 020 8745 7224 Investor enquiries Andrew Efiong 020 8745 2742 Finsbury Mike Smith or Don Hunter 020 7251 3801 There will be a conference call today at 9.30 am (UK time) for bondholders, bank lenders and analysts to discuss the results for the nine months ended 30 September 2009. The call will be hosted by Colin Matthews and Jose Leo, BAA’s Chief Executive Officer and Chief Financial Officer respectively. Dial-in details for the call are: Conference ID: 35178893; UK free phone: 0800 694 8016; UK local/standard international: +44 (0)1452 557535. It will also be possible to view online the presentation as it is used during the call at: https://www.livemeeting.com/cc/webconnect/join?id=MN25QH&role=attend (to access this site you may need to use the meeting ID: MN25QH)

3
BAA (SP) Limited Results for the nine months ended 30 September 2009 Index 1. Key business developments 1.1 Passenger traffic 1.2 Transforming the Group’s airports 1.3 Competition Commission inquiry into the supply of UK airport services by BAA 1.4 Gatwick disposal 1.5 Department for Transport ('DfT') review of UK airport economic regulation 2. Financial review 2.1 Basis of preparation 2.2 Profit and loss account 2.3 Balance sheet 2.4 Cash flow 2.5 Outlook Appendix 1 Unaudited consolidated financial information for BAA (SP) Limited Appendix 2 Analysis of turnover and operating costs by airport and activity 1. Key business developments 1.1 Passenger traffic Passenger traffic for the nine months ended 30 September 2009 across the Group’s airports is analysed below.
Nine months ended 30 September
(figures in millions unless otherwise stated)
2009
2008
Change (%)(1)
Passengers by airport
Heathrow 49.9 51.1 (2.3)
Gatwick 25.4 27.3 (7.2)
Stansted 15.5 17.6 (12.0)
Passengers by market served
UK 8.2 8.9 (8.2)
Europe(2)
50.9 54.0 (5.9)
Long haul 31.7 33.0 (4.1)
Total passengers(1)
90.7 96.0 (5.5) (1) These figures have been calculated using un-rounded numbers (2) Includes North African charter traffic
In the nine months ended 30 September 2009, passenger traffic across the Group’s airports declined 5.5% to 90.7 million (2008: 96.0 million) with the reduction relative to 2008 reflecting primarily the macroeconomic environment. The rate of decline has moderated substantially as 2009 has progressed having been 10.0% in the first quarter, 5.1% in the second quarter and 2.4% in third quarter. Heathrow has continued to outperform the Group’s other airports and other major European airports, benefiting from its position as a major global hub airport for long haul services. In the nine months ended 30 September 2009, Heathrow’s passenger numbers declined 2.3% to 49.9 million (2008: 51.1 million). Traffic in the third quarter was up 0.3% on 2008, benefiting from strength in the key summer holiday season underlining, as in the 2008 Christmas period, the strength of the leisure market during peak holiday periods. Recent performance has also been characterised by significantly higher capacity utilisation with the number of passengers per air transport movement up 4.1% in the third quarter compared to 2008. This indicates underlying demand resilience in both leisure and business markets. A key driver of Heathrow’s performance has been an increased proportion of transfer passengers (2009: 39%; 2008: 36%).

4
Gatwick’s passenger traffic declined 7.2% to 25.4 million in the nine months ended 30 September 2009 (2008: 27.3 million). Declines have moderated significantly since April 2009, the first anniversary of the introduction of the EU-US Open Skies Agreement when certain airlines moved some US services to Heathrow, with traffic down just 3.4% in the third quarter. At Stansted, passenger traffic declined 12.0% to 15.5 million (2008: 17.6 million), reflecting its higher exposure to airlines more willing to cut capacity during weak trading conditions. The recent moderation in the rate of decline in passenger numbers across the Group’s airports has been driven by non-North Atlantic long haul routes as well as European scheduled traffic. Long haul destinations excluding North Atlantic routes have outperformed the overall market significantly with traffic in the nine months ended 30 September 2009 down just 0.4% to 18.6 million passengers (2008: 18.7 million). Markets such as India (+10.3%) and the Middle East (+8.0%) are driving this performance. North Atlantic traffic continues to reflect the economic environment in Europe and the US. In the nine months ended 30 September 2009, overall European traffic declined 5.9% to 50.9 million (2008: 54.0 million) with traffic down 2.9% in the third quarter. European scheduled traffic declined 4.0% with a decline of only 0.6% in the third quarter. The overall European market was affected by continued weakness in the charter market. Domestic traffic accounts for less than 10% of total traffic at the Group’s airports and in the nine months ended 30 September 2009 it declined 8.2% to 8.2 million passengers (2008: 8.9 million). 1.2 Transforming the Group’s airports The Group has continued to implement its strategy to deliver sustained improvement in passengers’ experience and airlines’ operations through improved service standards and substantial investment in modern airport facilities. This will ensure customers enjoy superior facilities relative to competitors, encouraging greater utilisation of the Group’s airports and supporting their long term growth ambitions. 1.2.1 Service standards The Group continues to focus on delivering consistent high service standards across its airports, a key strategic priority. It also expects improving service standards to play a key part in driving cost efficiency. Operational performance has improved. At Heathrow the proportion of aircraft departing within 15 minutes of schedule averaged 78% in the nine months ended 30 September 2009 (2008: 67%). Further, in this period, the proportion of passengers at Heathrow passing through security in less than five minutes was 98.2% (2008: 94.7%) compared to the 95.0% service standard. 1.2.2 Developing modern airport facilities During the first nine months of 2009, there have been a number of significant milestones achieved as the Group continues to invest significant resources to deliver modern airport facilities. At Heathrow, as well as ongoing construction of one of the satellites to the new Terminal 2, enabling works are underway for the construction of the main Terminal 2 building including the recent start of the demolition of the Queen’s Building and work towards vacating the existing Terminal 2 by the end of 2009. The first phase of the new terminal will have a capacity of 20 million passengers per annum. A second phase will extend the terminal into the existing Terminal 1 site, increasing capacity to 30 million passengers per annum. The new Terminal 2 will produce 40% less carbon than the buildings it replaces. Extensive refurbishment of Terminal 4 continues with recent completion of new forecourt and check-in facilities and ongoing work in the central search area and the immigration hall in arrivals. This is enabling airlines such as Etihad and Jet Airways to move to Terminal 4 and provide their passengers with a new, modern airport building offering improved facilities and higher service standards. In addition, significant sums are being invested in developing what will be the largest integrated baggage handling system in the world and construction of a 1.8 kilometre tunnel between Terminals 3 and 5 commenced in February 2009. Tunnelling work was completed in August 2009 and the tunnel is currently being fitted out. Work also continues on construction of Terminal 5C, the second satellite terminal for Terminal 5, that remains on schedule to be completed in early 2011.

5
At Gatwick, significant developments have included resurfacing of the spare runway and reconfiguration of the South Terminal’s departure lounge together with significant refurbishment of its check-in facilities. Enabling work has also commenced relating to the extension and redevelopment of the North Terminal’s forecourt, concourse and piers to improve capacity. In addition, the existing inter-terminal transit system has now closed with work underway to deliver new trains and improve the stations in each terminal. The new transit service is expected to be fully operational by August 2010. 1.3 Competition Commission inquiry into the supply of UK airport services by BAA On 19 March 2009, the Competition Commission (‘CC’) concluded its investigation on the supply of airport services by BAA in the UK. Its final report called for structural remedies including disposal of Gatwick and Stansted to different owners with the deadline for selling Stansted after that for Gatwick. The report also required behavioural remedies such as strengthening airline consultation processes and provisions on service quality at Heathrow. The CC also recommended that the Department for Transport (‘DfT’) consider adopting a licence based regime of economic regulation of UK airports. On 18 May 2009, BAA applied to the Competition Appeal Tribunal to review the CC’s findings. The Competition Appeal Tribunal hearing took place earlier in October 2009 with the outcome of the appeal expected to be known by early 2010. 1.4 Gatwick disposal
On 21 October 2009, BAA announced the sale of Gatwick airport to an entity controlled by Global
Infrastructure Partners (‘GIP’) for £1.51 billion. Of the sale price, £55 million is conditional on future traffic
performance and the buyer’s future capital structure. The sale is subject to, amongst other things, EU
merger regulation clearance and completion is scheduled for December 2009. 1.5 Department for Transport ('DfT') review of UK airport economic regulation
On 13 October 2009, the Secretary of State for Transport announced to Parliament the measures the
Government intends to introduce to strengthen the financial resilience of major airports. This follows a
consultation by the DfT earlier this year into the economic regulation of airports.
BAA has welcomed the announcement, which removes key uncertainties for BAA and its creditors and
underlines the need for the regulator to ensure airport operators have the necessary resources to operate
and invest in their airports.
The measures will include:
• a new duty on the Civil Aviation Authority (‘CAA’) to ensure that airports can finance their licenced
activities;
• licence conditions to introduce financial ring-fencing;
• an exemption from financial ring-fencing provisions, including those affecting creditor security, where
these would cut across BAA’s existing financing arrangements;
• a requirement that airport operators maintain a minimum creditworthiness (which could be based on
independent credit ratings or some other measures)
The Government will also consult on proposals to require airport operators to maintain a continuity of
service plan and to allow the CAA to switch ring fencing provisions on or off if circumstances were to
change and where a cost benefit analysis confirmed that the benefits outweigh the costs, for example
because an operator had moved from a secured to an unsecured financing structure.
The Government will not proceed with proposals to introduce a special administration regime that had been proposed in its original consultation document. The DfT is expected to issue its full new regulatory proposals before the end of 2009 and to launch the additional consultations outlined above at the same time. Implementation of the final proposals will require changes in law which are unlikely to occur before mid-2010 with the exact timing subject to parliamentary time being available.

6
Whilst there may be a change in law during the current price control periods for the Group’s airports, the DfT has made clear that tariff arrangements for these periods will not be re-opened. 2 Financial review 2.1 Basis of preparation BAA (SP) Limited is the holding company of a group of companies that owns Heathrow, Gatwick and Stansted airports and operates the Heathrow Express rail service (the ‘Group’). This financial review comments on the performance of the Group during the nine months ended 30 September 2009. The Group’s statutory accounts are prepared under UK GAAP including the adoption of merger accounting, enabling comparative financial information to be provided. Unaudited consolidated financial information is set out in Appendix 1 in which Gatwick has been treated as a discontinued operation in both 2008 and 2009 as its sale is expected to be completed within three months of 30 September 2009. In order to provide a better understanding of the Group’s underlying performance particularly in relation to its operating cost base, pro forma financial information has been presented for the 2008 comparatives which assumes consolidation of Heathrow Express Operating Company Limited although it was only acquired from BAA Airports Limited on 7 August 2008. A detailed analysis of turnover and operating costs both by airport and activity, with the 2008 comparatives prepared on the pro forma basis described above, is set out in Appendix 2. 2.2 Profit and loss account 2.2.1 Introduction The profit and loss account below provides more detailed disclosure than the statutory format in Appendix 1 in order to provide a better understanding of the results from operations. The final column of the table sets out pro forma results of the Group for the nine months ended 30 September 2008 prepared on the basis described in section 2.1. The discussion in section 2.2 is based on the pro forma information.
2009
(unaudited)(1)
2008
(unaudited)(1)
2008 (unaudited,
pro forma)(1)
Nine months ended 30 September £m £m £m
Group turnover 1,846.0 1,715.5 1,716.2
Adjusted Operating Costs(2)
(1,041.4) (1,029.3) (1,027.2)
Adjusted EBITDA
(3) 804.6 686.2 689.0
Operating costs – exceptional – pensions(4)
(261.7) (17.1) (17.1)
Operating costs – exceptional – other(4)
1.2 (23.6) (23.6)
EBITDA 544.1 645.5 648.3
Depreciation – ordinary (387.1) (321.6) (321.6)
Depreciation – exceptional(4)
(51.6) (60.5) (60.5)
Operating profit 105.4 263.4 266.2
Impairment arising on the disposal of Gatwick airport
(4) (225.0) - -
Net interest payable and similar charges – ordinary (529.0) (401.6) (400.6)
Net interest payable and similar charges – exceptional - (142.6) (142.6)
Fair value loss on financial instruments (136.1) (242.5) (242.5)
Total net interest payable and similar charges (665.1) (786.7) (785.7)
Loss on ordinary activities before taxation (784.7) (523.3) (519.5)
Tax credit on loss on ordinary activities 148.4 151.0 149.9
Loss on ordinary activities after taxation (636.3) (372.3) (369.6)
(1) Includes the results of Gatwick which is classified as a discontinued operation in the profit and loss account in Appendix 1 (2) Adjusted Operating Costs are stated before depreciation and exceptional items (3) Adjusted EBITDA is earnings before interest, tax, depreciation and amortisation and exceptional items (4) See section 2.2.5 for further discussion of exceptional items and impairment charges

7
2.2.2 Turnover In the nine months ended 30 September 2009, turnover increased 7.6% to £1,846.0 million (2008: £1,716.2 million). This reflects increases of 13.2% in aeronautical income, 1.7% in gross retail income and 1.0% in other income. On a like-for-like basis (the relevant adjustments are discussed in more detail in sections 2.2.2.1, 2.2.2.2 and 2.2.2.3), turnover increased 3.1% to £1,790.2 million.
2009 (unaudited)
2008 (unaudited, pro forma)
Change (%) Nine months ended 30 September £m £m
Aeronautical income 1,013.3 894.8 13.2 Retail income 457.4 449.8 1.7 Other income 375.3 371.6 1.0
Total turnover 1,846.0 1,716.2 7.6
2.2.2.1 Aeronautical income Aeronautical income by airport
2009 (unaudited)
2008 (unaudited, pro forma)
Change (%) Nine months ended 30 September £m £m
Heathrow 723.7 603.1 20.0 Gatwick 189.9 178.2 6.6 Stansted 99.7 113.5 (12.2)
Total 1,013.3 894.8 13.2
In the nine months ended 30 September 2009, aeronautical income increased 13.2% to £1,013.3 million (2008: £894.8 million). This was driven by the revised tariffs at Heathrow and Gatwick from 1 April 2008 but also reflected the phased introduction of the new tariffs over the first year of the new regulatory period. The change in aeronautical income at Stansted reflected the decline in passenger traffic with tariffs remaining flat. After adjusting for £35.8 million of NATS related income in the first quarter of 2009 (as such income was not applicable in the first quarter of 2008), and phasing of the increased Heathrow and Gatwick tariffs that impact reported aeronautical income in both 2008 and 2009, aeronautical income is estimated to have increased 5.3% to £964.0 million. 2.2.2.2 Retail income The Group’s retail business has maintained its recent strong momentum. For the nine months ended 30 September 2009, net retail income (i.e. net of car park management charges) (‘NRI’) per passenger increased 6.1% to £4.64 (2008: £4.37) due to a very strong performance by Heathrow as well as airside and landside shops across all the Group’s airports. This performance was based on gross retail income of £457.4 million (2008: £449.8 million) whilst net retail income was £421.1 million (2008: £419.9 million).
Heathrow Gatwick Stansted Total(1)
Nine months ended 30 September 2008
NRI per passenger(1)
£4.52 £4.47 £3.81 £4.37
Nine months ended 30 September 2009
NRI per passenger(1)
£4.92 £4.54 £3.92 £4.64
Change in NRI per passenger (%)(1)
8.8% 1.6% 2.8% 6.1% (1) These figures have been calculated using un-rounded numbers
At Heathrow, NRI per passenger increased 8.8% to £4.92 (2008: £4.52) or 7.5% to £4.86 after adjusting for £2.9 million of non-recurring income. Its performance was driven by in-terminal shopping, reflecting

8
increased passenger numbers benefiting from Terminal 5’s high quality retail facilities, and a higher proportion of intra-terminal transfer passengers, providing longer departure lounge dwell times for such passengers. It also reflects the improved value of the offer resulting from the depreciation of sterling. NRI per passenger also increased at Gatwick, up 1.6% to £4.54 (2008: £4.47) with strength in airside specialist shops and duty and tax free more than offsetting weakness in car parking. At Stansted, NRI per passenger increased 2.8% to £3.92 (2008: £3.81) with performance improving in recent months due to significant growth in airside specialist shops and duty and tax free. However, car parking and bureaux de change have remained subdued at Stansted. In terms of total net retail income, the main drivers of the improved performance were airside specialist shops, duty and tax free, advertising and car rental with market conditions continuing to challenge car parking income particularly at Gatwick and Stansted. 2.2.2.3 Other income Income from activities other than aeronautical and retail increased 1.0% to £375.3 million (2008: £371.6 million). This included a 4.3% increase in property rental income to £97.0 million (2008: £93.0 million) driven by Heathrow and an increase in rail income of 4.5% to £65.6 million (2008: £62.8 million). Other income includes £3.6 million from the provision of services for passengers with reduced mobility (‘PRM’) in the first quarter of 2009 that were not provided in the corresponding period of 2008. 2.2.3 Adjusted Operating Costs Adjusted Operating Costs discussed in this section exclude depreciation and exceptional costs. Appendix 2 provides a detailed analysis of Adjusted Operating Costs by both airport and activity. The Group’s results for the nine months ended 30 September 2009 reflect the substantial progress made in reducing costs through focus on improving efficiency and reducing overheads. This resulted in Underlying Adjusted Operating Costs declining by 3.3% to £993.4 million. Underlying Adjusted Operating Costs adjust for £24.0 million of general expenses relating to the provision of NATS related and PRM services to airlines (that the Group recovers in its revenues) in the first quarter of 2009 as airlines still paid for these services directly in the comparable period of 2008. They also adjust for £21.1 million in incremental costs of operating Terminal 5 in the three months ended 31 March 2009 as costs in the comparable period in 2008, that pre-dated Terminal 5’s opening, were treated as exceptional costs. A reconciliation between reported and Underlying Adjusted Operating Costs for the nine months ended 30 September 2009 together with a comparison with reported Adjusted Operating Costs for the nine months ended 30 September 2008 is set out below. Figures in £m unless otherwise stated
2009 reported Adjusted Operating Costs 1,041.4
ANS and PRM costs in the first quarter of 2009 (24.0)
Incremental Terminal 5 costs (21.1)
Other non-recurring costs (2.9)
2009 Underlying Adjusted Operating Costs 993.4
2008 reported Adjusted Operating Costs 1,027.2
Change in Underlying Adjusted Operating Costs (3.3%)
The main drivers of lower Underlying Adjusted Operating Costs were a 11.3% reduction in underlying employment costs due particularly to fewer senior managers, lower recruitment costs, lower pensions costs and reduced bonus payments. In addition, underlying general expenses declined 10.9% partly reflecting significantly lower service quality rebates, reinforcing the benefits of our improved operational standards. There was also a reduction in intra-group charges particularly related to 10.6% lower central overheads of the wider BAA group charged to the Group under shared service arrangements. However, underlying utility costs were higher, due primarily to the impact of an electricity contract in place since the beginning of 2009, and underlying rent and rates increased due to additional properties and higher rates.
9
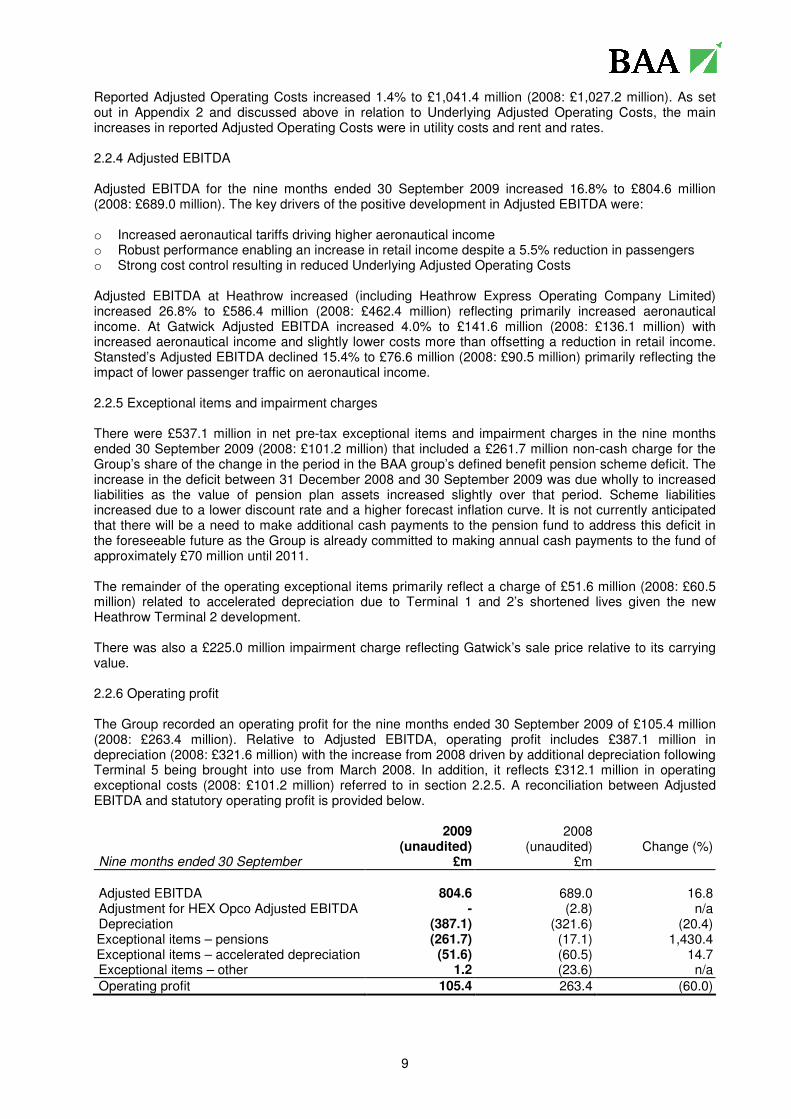
Reported Adjusted Operating Costs increased 1.4% to £1,041.4 million (2008: £1,027.2 million). As set out in Appendix 2 and discussed above in relation to Underlying Adjusted Operating Costs, the main increases in reported Adjusted Operating Costs were in utility costs and rent and rates. 2.2.4 Adjusted EBITDA Adjusted EBITDA for the nine months ended 30 September 2009 increased 16.8% to £804.6 million (2008: £689.0 million). The key drivers of the positive development in Adjusted EBITDA were: o Increased aeronautical tariffs driving higher aeronautical income o Robust performance enabling an increase in retail income despite a 5.5% reduction in passengers o Strong cost control resulting in reduced Underlying Adjusted Operating Costs Adjusted EBITDA at Heathrow increased (including Heathrow Express Operating Company Limited) increased 26.8% to £586.4 million (2008: £462.4 million) reflecting primarily increased aeronautical income. At Gatwick Adjusted EBITDA increased 4.0% to £141.6 million (2008: £136.1 million) with increased aeronautical income and slightly lower costs more than offsetting a reduction in retail income. Stansted’s Adjusted EBITDA declined 15.4% to £76.6 million (2008: £90.5 million) primarily reflecting the impact of lower passenger traffic on aeronautical income. 2.2.5 Exceptional items and impairment charges There were £537.1 million in net pre-tax exceptional items and impairment charges in the nine months ended 30 September 2009 (2008: £101.2 million) that included a £261.7 million non-cash charge for the Group’s share of the change in the period in the BAA group’s defined benefit pension scheme deficit. The increase in the deficit between 31 December 2008 and 30 September 2009 was due wholly to increased liabilities as the value of pension plan assets increased slightly over that period. Scheme liabilities increased due to a lower discount rate and a higher forecast inflation curve. It is not currently anticipated that there will be a need to make additional cash payments to the pension fund to address this deficit in the foreseeable future as the Group is already committed to making annual cash payments to the fund of approximately £70 million until 2011. The remainder of the operating exceptional items primarily reflect a charge of £51.6 million (2008: £60.5 million) related to accelerated depreciation due to Terminal 1 and 2’s shortened lives given the new Heathrow Terminal 2 development. There was also a £225.0 million impairment charge reflecting Gatwick’s sale price relative to its carrying value. 2.2.6 Operating profit The Group recorded an operating profit for the nine months ended 30 September 2009 of £105.4 million (2008: £263.4 million). Relative to Adjusted EBITDA, operating profit includes £387.1 million in depreciation (2008: £321.6 million) with the increase from 2008 driven by additional depreciation following Terminal 5 being brought into use from March 2008. In addition, it reflects £312.1 million in operating exceptional costs (2008: £101.2 million) referred to in section 2.2.5. A reconciliation between Adjusted EBITDA and statutory operating profit is provided below. 2009
(unaudited) 2008
(unaudited)
Change (%) Nine months ended 30 September £m £m
Adjusted EBITDA 804.6 689.0 16.8 Adjustment for HEX Opco Adjusted EBITDA - (2.8) n/a Depreciation (387.1) (321.6) (20.4) Exceptional items – pensions (261.7) (17.1) 1,430.4 Exceptional items – accelerated depreciation (51.6) (60.5) 14.7 Exceptional items – other 1.2 (23.6) n/a
Operating profit 105.4 263.4 (60.0)

10
2.2.7 Interest payable In the nine months ended 30 September 2009, there was £529.0 million of net interest payable (2008: £400.6 million) excluding exceptional interest payable and fair value losses on financial instruments. Excluding £17.8 million in capitalised interest (2008: £88.2 million) and £65.7 million in non-cash amortisation of financing fees and bond fair value adjustments (2008: £11.5 million), underlying interest payable was stable year on year at £481.1 million (2008: £477.3 million). Exceptional costs included within interest payable in 2008 were £142.6 million related to facility and arrangement fees incurred in relation to the refinancing completed in August 2008. Within interest payable is also recorded a non-cash net fair value loss on financial instruments of £136.1 million (2008: £242.5 million) primarily driven by movements in the index-linked swap curve. 2.2.8 Taxation The tax credit for the nine months ended 30 September 2009 has been based on the estimated effective rate for the full year of 18.9% (30 September 2008: 28.9%) with the reduction particularly influenced by the exceptional impairment loss not being tax deductible. The estimated effective tax rate for the continuing businesses, i.e. excluding the impairment loss, for the full year is 26.6%. 2.3 Balance sheet 2.3.1 Summary balance sheet At 30 September 2009
(unaudited) At 31 December 2008
(audited) £m £m
Total fixed assets 13,583.3 13,740.0
Total current assets 448.6 730.1
Total assets 14,031.9 14,470.1
Current borrowings (1,041.4) (43.3)
Other current liabilities (948.4) (1,020.7)
Total current liabilities (1,989.8) (1,064.0)
Non-current borrowings (10,538.8) (11,364.3)
Other non-current liabilities (1,029.2) (903.7)
Total non-current liabilities (11,568.0) (12,268.0)
Net assets 474.1 1,138.1
Gross debt 11,580.2 11,407.6
Cash and liquid resources(1)
(27.2) (182.1)
Net debt 11,553.0 11,225.5
Undrawn committed facilities 2,252.0 2,500.0 (1) At 30 September 2009 represented by current asset investments of £21.5 million (31 December 2008: £157.1 million) and cash
at bank and in hand of £5.7 million (31 December 2008: £25.0 million)
2.3.2 Regulatory Asset Base (‘RAB’) Set out below are RAB figures for the Group’s airports at 31 December 2008 and 30 September 2009. Heathrow Gatwick Stansted Total £m £m £m £m
31 December 2008 9,661.5 1,577.6 1,231.1 12,470.2 30 September 2009 10,231.9 1,650.6 1,273.2 13,155.7

11
2.3.3 Net debt and liquidity The analysis below focuses on external debt and excludes the debenture between BAA (SP) Limited and BAA (SH) Limited. At 30 September 2009, the Group had £4,498.9 million of nominal debt outstanding under various bond issues. There was also £5,283.0 million outstanding under various bank debt facilities. With cash and cash equivalents of £27.2 million and index-linked derivative accretion of £16.3 million, nominal net debt was £9,771.0 million (31 December 2008: £9,426.0 million). At 30 September 2009, the accounting value of net debt was £9,987.2 million. In the third quarter of 2009, the Group invested £240.7 million in capital expenditure but nominal net debt increased by only £72.2 million reflecting the strong cash flow generated in the peak summer travel period. The average cost of the Group’s external debt at 30 September was 5.67% after all hedging including the real cost of index-linked hedges. This compares with a cost of debt of 6.20% using the methodology previously disclosed which was after all hedging other than the benefit of index-linked hedging. At 30 September 2009, the Group’s senior and junior gearing ratios (net debt to RAB) were 0.667x and 0.743x compared with trigger levels of 0.70x and 0.85x. Further, the Group has the flexibility to manage the senior gearing ratio utilising the currently undrawn junior debt tranche of the capital expenditure facility up to the level of senior debt drawings. Therefore, the Group is operating comfortably within required financial ratios. Applying the net proceeds from the sale of Gatwick towards debt repayment is expected to have a neutral impact on the Group’s overall gearing. The Group is strongly cash generative (before accounting for capital expenditure for which it has £2.2 billion of undrawn debt facilities in place) and generated over £375 million of surplus cash after payment of interest in the nine months ended 30 September 2009. Further, the Group expects net proceeds of approximately £1.2 billion from the sale of Gatwick excluding the contingent consideration and after estimated transaction related costs and the cost of terminating derivatives. This will be utilised to repay in full the £1.0 billion maturity in March 2010 under the bank refinancing facility as well as part of subsequent facility maturities. As a result, the Group would have no significant debt maturities until 2011. The recent announcements regarding the sale of Gatwick and clarification of the creditor sensitive aspects of the DfT’s review of economic regulation enhance the Group’s ability to implement longer term financing, consistent with the intent when the refinancing completed in 2008. As a result, subject to market conditions, in the coming months the Group intends to return to the debt capital markets, where investor demand for highly rated regulated utilities, such as the Group, is currently strong. 2.4 Cash flow 2.4.1 Summary cash flow 2009
(unaudited) 2008
(unaudited)
Nine months ended 30 September £m £m
Net cash inflow from operating activities 742.8 517.7 Net interest paid (386.6) (28.5) Taxation – Group relief 22.6 - Net capital expenditure (749.2) (813.2) Acquisition of Heathrow Express Operating Company Limited
-
(3.8)
Management of liquid resources 135.6 (60.8) Financing 215.5 342.2
Decrease in cash in the period (19.3) (46.4)
2.4.2 Cash from operating activities Net cash inflow from operating activities in the nine months ended 30 September 2009 increased 43.5% to £742.8 million (2008: £517.7 million). As exceptional items in the period were almost entirely non-cash, the net cash inflow can be compared with Adjusted EBITDA of £804.6 million. Net cash inflow was lower

12
than Adjusted EBITDA principally reflecting a reduction in trade creditors since 31 December 2008and higher pension cash costs than the ordinary pension cost charged to the profit and loss account. 2.4.3 Net interest paid Net interest paid in the nine months ended 30 September 2009 was £386.6 million (2008: £28.5 million). This consisted of £277.4 million paid primarily in relation to external debt and £109.2 million under the debenture between BAA (SP) Limited and BAA (SH) Limited. The significantly lower interest paid in 2008 is due to the fact that prior to the refinancing completed in August 2008 there was only intra-group debt on which interest was being accrued but not paid. 2.4.4 Capital expenditure In the nine months ended 30 September 2009, the Group spent £749.2 million on capital expenditure (2008: £813.2 million) with £596.1 million at Heathrow, £102.9 million at Gatwick and £50.2 million at Stansted. The major projects at Heathrow included construction of a tunnel between Terminals 3 and 5 for an integrated baggage system. Work also continued on constructing Terminal 5C, the second satellite for Terminal 5, and Terminal 2B, the satellite for the new Terminal 2. There were various other projects in the rest of the Heathrow campus, such as the Terminal 4 refurbishment and improvement of check-in capacity associated with airline relocations. 2.5 Outlook The Group’s outlook for 2009 remains in line with expectations. The Group will provide guidance on forecast performance for 2010 in December 2009.

13
Appendix 1 – Financial information
BAA (SP) Limited
Consolidated profit and loss account for the nine months
ended 30 September 2009
Unaudited
Nine months ended
30 September 2009
Unaudited
Nine months ended
30 September 2008
Audited
Year ended
31 December 2008
£m £m £m
Turnover – continuing operations 1,480.1 1,352.1 1,826.5
Turnover – discontinued operations 365.9 363.4 465.4
Total turnover 1,846.0 1,715.5 2,291.9
Operating costs – ordinary (1,428.5) (1,350.9) (1,820.1)
Operating costs – exceptional: pensions (261.7) (17.1) (17.1)
Operating costs – exceptional: other (50.4) (84.1) (90.7)
Total operating costs (1,740.6) (1,452.1) (1,927.9)
Operating profit – continuing operations 75.7 177.4 260.0
Operating profit – discontinued operations 29.7 86.0 104.0
Total operating profit 105.4 263.4 364.0
Impairment arising on the disposal of Gatwick airport (225.0) - -
Interest receivable 116.1 48.4 111.5
Interest payable and similar charges – ordinary (645.1) (450.0) (731.1)
Interest payable and similar charges – exceptional - (142.6) (142.6)
Fair value (loss)/gain on financial instruments (136.1) (242.5) 74.0
Total net interest payable and similar charges (665.1) (786.7) (688.2)
Loss on ordinary activities before taxation (784.7) (523.3) (324.2)
Tax credit on loss on ordinary activities 148.4 151.0 123.1
Loss on ordinary activities after taxation (636.3) (372.3) (201.1)

14
BAA (SP) Limited
Consolidated balance sheet as at 30 September 2009
Unaudited
30 September 2009
Unaudited
30 September 2008
Audited
31 December 2008
£m £m £m
Fixed assets
Tangible fixed assets 12,860.0 12,808.2 12,910.0
Financial assets – derivative financial instruments 723.3 483.1 830.0
Total fixed assets 13,583.3 13,291.3 13,740.0
Current assets
Stocks 7.7 8.3 7.9
Debtors: due within one year 372.7 426.8 402.1
Financial assets – derivative financial instruments 41.0 27.0 138.0
Current assets investments 21.5 60.8 157.1
Cash at bank and in hand 5.7 1.6 25.0
Total current assets 448.6 524.5 730.1
Current liabilities
Creditors: amounts falling due within one year (1,989.8) (1,198.7) (1,064.0)
Net current liabilities (1,541.2) (674.2) (333.9)
Total assets less current liabilities 12,042.1 12,617.1 13,406.1
Creditors: amounts falling due after more than one year (10,787.8) (10,752.8) (11,713.8)
Provisions for liabilities and charges (780.2) (637.1) (554.2)
Net assets 474.1 1,227.2 1,138.1
Capital and reserves
Called up share capital 10.0 10.0 10.0
Revaluation reserve 1,840.0 2,000.9 2,035.0
Merger reserve (5,629.6) (5,629.6) (5,629.6)
Fair value reserve (152.8) (21.5) (320.1)
Profit and loss account 4,406.5 4,867.4 5,042.8
Total shareholder’s funds 474.1 1,227.2 1,138.1

15
BAA (SP) Limited
Consolidated summary cash flow statement for the nine months
ended 30 September 2009
Unaudited
Nine months ended
30 September 2009
Unaudited
Nine months ended
30 September 2008
Audited
Year ended
31 December 20081
£m £m £m
Operating profit 105.4 263.4 364.0
Adjustments for:
Depreciation (including exceptional depreciation) 438.7 382.1 528.0
Working capital changes:
Decrease/(increase) in stock and debtors 31.9 (192.6) (157.0)
(Decrease)/increase in creditors (56.8) 50.6 76.9
Loss on disposal of fixed assets - 0.6 1.0
Decrease in provisions (12.8) (5.3) (8.1)
Difference between pension charge and cash contributions 236.4 18.9 21.6
Net cash inflow from operating activities 742.8 517.7 826.4
Net interest paid (386.6) (28.5) (100.8)
Taxation - Group relief 22.6 - 21.0
Net capital expenditure (749.2) (813.2) (1,031.7)
Acquisition of Heathrow Express Operating Company Limited - (3.8) (3.8)
Cash outflow before management of liquid resources and financing (370.4) (327.8) (288.9)
Management of liquid resources 135.6 (60.8) (157.0)
Financing 215.5 342.2 470.9
(Decrease)/increase in cash in the period (19.3) (46.4) 25.0
1 The presentation of certain balances for the year ended 31 December 2008 have been restated to be consistent with current year disclosures. There is an overdraft balance of £48.0m included within Creditors: amounts due within one year as at 30 September 2008. There are no overdraft balances as at 30 September 2009 or 31 December 2008.

16
BAA (SP) Limited
Notes to the consolidated financial statements For the nine months ended 30 September 2009
1. General information The interim consolidated financial statements have not been audited. The financial information set out herein does not constitute the Company’s statutory financial statements for the year ended 31 December 2008. A copy of the statutory accounts for that year has been filed with the Registrar of Companies. The annual financial information presented in this announcement for the nine months ended 30 September 2009 is based on, and is consistent with, that in the BAA (SP) Limited’s (‘Group’) audited financial statements for the year ended 31 December 2008. During 2008 the Group was reorganised as part of re-financing the wider BAA group operations resulting in the formation of the Group. Merger accounting has been applied in relation to the group reorganisation and the comparatives have been restated as if the Group was in existence in its current form for the entire period. The auditors report on the 2008 financial statements is unqualified and does not contain any statement under section 237(2) of (3) of the Companies Act 1985. Basis of preparation This financial information has been prepared under the historical cost convention, as modified by the revaluation of certain tangible fixed assets and financial instruments in accordance with the Companies Act 2006 and United Kingdom Accounting Standards (United Kingdom Generally Accepted Accounting Practice). On 21 October 2009, BAA announced the sale of Gatwick airport to an entity controlled by Global Infrastructure Partners (‘GIP’) for £1.51 billion. Of the sale price, £55.0 million is conditional on future traffic performance and the buyer’s future capital structure. The sale is subject to, amongst other things, European Union merger regulation clearance and completion is scheduled for December 2009. Given the disposal is expected to be completed within three months of 30 September 2009 and has a material impact on BAA (SP) Limited’s operations, Gatwick has been classified as discontinued operations in accordance with Financial Reporting Standard (FRS) 3 – Reporting Financial Performance. Comparative balances for 30 September 2008 have been presented on a consolidated basis for the first time. This differs from the treatment in the 30 September 2008 Appendix 1 where the balances were presented for illustrative purposes only. Comparative balances for 31 December 2008 have been presented using millions rounded to one decimal place. This treatment varies from 31 December 2008 where balances were rounded to the nearest million. This has resulted in some immaterial rounding differences. Except for the restatement of comparatives outlined above, the accounting policies have been applied consistently in dealing with items which are considered material in relation to the financial statements. Basis of consolidation In order to present a true and fair view of the Group, the creation of the Group has been accounted for in accordance with FRS 6 – Acquisitions and Mergers and the principles of merger accounting. This represents a departure from the provisions of the United Kingdom Companies Act 2006 which sets out the conditions for merger accounting based on the assumption that a merger is effected through the issue of equity shares. In the opinion of the directors, the creation of the Group was a group reconstruction rather than an acquisition, since the shareholders of the Company are the same as the former shareholders and the rights of each shareholder, relative to the others, are unchanged and no minority interest in the net assets of the Group is altered. In addition the purpose of the transaction was not to move the value out of the Group and return to shareholders, but rather to reorganise the assets and liabilities within the existing group. Therefore, the directors consider that to record the transaction as an acquisition by the Company, attributing fair values to the assets and liabilities of the Group and reflecting only the post transaction results within these financial statements would fail to give a true and fair view of the Group’s results and financial position. Accordingly, having regard to the overriding requirement under section 404(5) of the Companies Act 2006 for the financial statements to give a true and fair view of the Group’s results and financial position, the directors have adopted merger accounting principles in drawing up these financial statements. The main consequence of adopting merger rather than acquisition accounting is that the balance sheet of the merged group includes the assets and liabilities of each of the Group’s subsidiaries at their carrying values prior to the merger, subject to any adjustments to achieve uniformity of accounting policies, rather than at their fair values at the date of the merger. However, the Group applied acquisition accounting on the acquisition of Heathrow Express Operating Company Limited (HEX) which took place on 7 August 2008 as this is not deemed a part of the initial Group reconstruction process.

17
2. Segment information The Group’s primary reporting format is business segments. The operating businesses are primarily the individual airports, which are organised and managed separately.
1 All turnover originated in the UK. 2 The comparatives have been restated to reflect one decimal place. 3 The ‘other entities’ business segment includes Heathrow Express Operating Company Limited, BAA Funding Limited, BAA (AH) Limited and the parent entity BAA (SP) Limited. 4 Other adjustments relate to the BAA (SP) Limited Debenture which has been treated as if it had been issued in the prior year as a result of the application of merger accounting. The remaining balance relates to the
elimination of inter-company transactions and consolidation adjustments. 5 Gatwick net assets include inter-company balances, external debt, derivatives which will be novated or settled on completion of the sale and the impairment arising on the disposal of Gatwick airport.
Turnover1 Operating profit Net assets
Unaudited Nine months ended 30 September 2009
£m
Unaudited Nine months ended 30 September 2008
£m
Audited Year ended
31 December 20082 £m
Unaudited Nine months ended 30 September 2009
£m
Unaudited Nine months ended 30 September 2008
£m
Audited Year ended
31 December 20082 £m
Unaudited 30 September 2009
£m
Unaudited 30 September 2008
£m
Audited
31 December 20082 £m
Continuing operations
Heathrow 1,295.7 1,152.3 1,567.7 59.4 111.8 174.9 1,253.1 1,651.1 1,459.0
Stansted 184.4 199.8 258.8 12.2 64.4 81.2 1,026.6 1,119.9 1,011.6
Other entities3 - - - 4.1 1.2 3.9 (955.8) (995.8) (756.5)
Other adjustments4 - - - - - - (1,566.0) (1,567.2) (1,480.1)
1,480.1 1,352.1 1,826.5 75.7 177.4 260.0 (242.1) 208.0 234.0
Discontinued operations
Gatwick 365.9 363.4 465.4 29.7 86.0 104.0 716.25 1,019.2 904.1
Total 1,846.0 1,715.5 2,291.9 105.4 263.4 364.0 474.1 1,227.2 1,138.1

18
Reconciliation of Adjusted EBITDA and Operating Profit Adjusted EBITDA has been used to provide a clearer indication of the performance of the individual airports and to assist better comparison with the prior period. Adjusted EBITDA is earnings before interest, tax, depreciation, amortisation and exceptional items.
Unaudited Nine months ended 30 September 2009
Adjusted EBITDA Exceptional items1 Depreciation2 Operating profit
£m £m £m £m
Continuing operations
Heathrow 582.3 (216.9) (306.0) 59.4
Stansted 76.6 (35.3) (29.1) 12.2
Other entities and adjustments 4.1 - - 4.1
663.0 (252.2) (335.1) 75.7
Discontinued operations
Gatwick 141.6 (59.9) (52.0) 29.7
Total 804.6 (312.1) (387.1) 105.4
Unaudited Nine months ended 30 September 2008
Adjusted EBITDA Exceptional items1 Depreciation2 Operating profit
£m £m £m £m
Continuing operations
Heathrow 458.4 (95.9) (250.7) 111.8
Stansted 90.5 (2.1) (24.0) 64.4
Other entities and adjustments 1.2 - - 1.2
550.1 (98.0) (274.7) 177.4
Discontinued operations
Gatwick 136.1 (3.2) (46.9) 86.0
Total 686.2 (101.2) (321.6) 263.4
Audited Year ended 31 December 20083
Adjusted EBITDA Exceptional items1 Depreciation2 Operating profit
£m £m £m £m
Continuing operations
Heathrow 634.4 (113.2) (346.3) 174.9
Stansted 117.4 (3.1) (33.1) 81.2
Other entities and adjustments 4.4 - (0.5) 3.9
756.2 (116.3) (379.9) 260.0
Discontinued operations
Gatwick 159.9 8.5 (64.4) 104.0
Total 916.1 (107.8) (444.3) 364.0
1 Includes the push down to the Group’s airports of the change in the period in the deficit in the BAA defined benefit scheme, accelerated depreciation at Heathrow and other exceptional items within operating profit. 2 Depreciation excluding exceptional depreciation. 3 The comparatives have been restated to reflect one decimal place.

19
Exceptional items Under the Shared Services Agreement (‘SSA’) the current period service cost for the BAA Airports Limited pension schemes are recharged to the Group’s airports. Cash contributions are made directly to the pension trustee of the BAA Airports Limited defined benefit pension scheme on behalf of BAA Airports Limited. Each airport also has a legal obligation to fund its relevant share of any pension deficit related to BAA Airports Limited pension plans under the SSA. Costs have been allocated to the Group on the basis of pensionable salaries. For the nine months ended 30 September 2009, exceptional costs of £261.7 million were incurred in relation to the push down of the Group’s share of the deficit on the BAA Airports Limited defined benefit pension scheme. For the nine months ended 30 September 2008 exceptional costs of £17.1 million were charged relating to accumulated past service pension costs not previously charged to the Group by BAA Airports Limited in relation to the Unfunded Pension Scheme and Post Retirement Medical Benefits (‘UURBS’) (31 December 2008: £17.1 million). For the nine months ended 30 September 2009 income of £1.0 million was recognised due to abatement costs being paid for by the trustees (nine months ended 30 September 2008: £nil; year ended 31 December 2008: £nil). With the anticipated development of Terminal 2A, Terminals 1 and 2 at Heathrow airport will be demolished necessitating an additional depreciation charge of £51.6 million in the nine months ended 30 September 2009 to reflect the shortened useful lives of the assets (nine months ended 30 September 2008: £60.5 million; year ended 31 December 2008: £83.6 million). A release of £0.2 million was credited in the nine months ended 30 September 2009 associated with restructuring programmes (nine months ended 30 September 2008: £nil; year ended 31 December 2008: £14.7 million credit). The amount released in 2008 resulted from lower than expected cost for each reduction in headcount and certain headcount reductions not being made due to the decision to sell Gatwick. The nine months ended 30 September 2008 also included Terminal 5 launch / operational readiness costs of £23.6 million (year ended 31 December 2008: £21.8 million). No costs have been incurred in 2009. Impairment arising on disposal of Gatwick airport An impairment loss of £225.0 million was recognised below operating profit in the nine months ended 30 September 2009 as a result of the carrying value of Gatwick airport's assets being greater than its recoverable amount which is determined by the cash inflow expected from disposal. Management believes that the expected cash inflow represents the recoverable value of Gatwick airport to the BAA (SP) Limited group.

20
3. Interest receivable and interest payable and similar charges
Unaudited Nine months ended 30 September 2009
Unaudited Nine months ended 30 September 2008
Audited Year ended
31 December 20081
£m £m £m
Interest receivable on derivatives not in a hedging relationship 115.8 23.2 84.1
Interest receivable from other group undertakings - 24.8 26.0
Interest on money market and bank deposits 0.3 0.4 1.4
Interest receivable 116.1 48.4 111.5
Interest on borrowings
Bonds and related hedging instruments (246.0) (34.5) (115.7)
Bank loans and overdrafts and related hedging instruments (238.0) (36.3) (150.5)
Interest payable on derivatives not in a hedging relationship (86.5) (15.3) (53.2)
Facility fees (20.0) (5.4) (12.7)
Interest on BAA (SP) Limited debenture (68.5) (105.5) (145.2)
Interest payable to other group undertakings - (339.0) (338.5)
Provisions: Terminal 5 land purchase and Cross Border Lease (3.9) (2.2) (15.0)
Interest payable and similar charges (662.9) (538.2) (830.8)
Interest capitalised 17.8 88.2 99.7
Interest payable and similar charges - ordinary (645.1) (450.0) (731.1)
Interest payable and similar charges – exceptional - (142.6)2 (142.6)2
Net interest payable before fair value (loss)/gain (529.0) (544.2) (762.2)
Interest rate swaps: cash flow hedges 19.8 (4.7) (24.1)
Interest rate swaps: not in hedge relationship 0.8 (19.3) (26.0)
Index linked swaps: not in hedge relationship (141.9) (211.7) 81.5
Cross currency interest rate swaps: cash flow hedges (8.6) (7.5) 34.8
Fair value re-measurements of foreign exchange contracts (6.2) 0.7 7.8
Fair value (loss)/gain on financial instruments (136.1) (242.5) 74.0
Net interest payable (665.1) (786.7) (688.2)
1The comparatives have been restated to reflect one decimal place. 2 Fees of £142.6 million were incurred during the nine months ended 30 September 2008 (year ended 31 December 2008: £142.6 million) in relation to facility and arrangement fees that are expensed under UK GAAP. These costs are mainly upfront fees paid for the capital expenditure, working capital, liquidity, initial credit facility and costs attributed to future bond issuance.

21
4. Tax on profit on ordinary activities The tax credit for the nine months ended 30 September 2009 has been based on the estimated effective rate for the full year of 18.9% (30 September 2008: 28.9%). The estimated effective tax rate for continuing operations is 26.6% (30 September 2008: 28.9%). 5. Borrowings Within ‘Creditors: amounts falling due within one year’ are borrowings and financial derivatives of £1,041.4 million and £350.0 million respectively (30 September 2008: £43.3 million and £493.0 million respectively; 31 December 2008: £43.3 million and £324.0 million respectively). Within ‘Creditors: amounts falling due after more than one year’ are borrowings and financial derivatives of £10,538.8 million and £242.5 million respectively (30 September 2008: £10,736.1 million and £2.8 million respectively; 31 December 2008: £11,364.3 million and £342.1 million respectively).
Unaudited
30 September 2009 Unaudited
30 September 2008 Audited
31 December 20081
£m £m £m
Current
Secured
Senior Refinancing Facility 800.0 - -
Junior Refinancing Facility 200.0 - -
Bank loans 41.4 43.3 43.3
Total current 1,041.4 43.3 43.3
Non-current
Secured
Senior Refinancing Facility 2,569.9 3,330.5 3,341.6
Junior Refinancing Facility 791.5 979.4 981.4
Initial Credit Facility 498.0 50.0 250.0
Bank loans 341.3 382.4 371.6
BAA Funding Limited bonds:
3.975% €1,000 million due 2012 863.8 721.8 893.2
5.850% £400 million due 2013 367.0 361.9 363.2
4.600% €750 million due 2014 630.5 529.0 656.3
12.450% £300 million due 2016 379.8 389.0 386.8
4.600% €750 million due 2018 600.5 500.8 627.7
9.200% £250 million due 2021 285.4 287.3 286.8
5.225% £750 million due 2023 610.0 604.1 605.5
7.075% £200 million due 2028 197.3 197.3 197.3
6.450% £900 million due 2031 838.0 836.8 837.1
Total BAA Funding Limited bonds 4,772.3 4,428.0 4,853.9
Unsecured
SP Debenture payable to BAA (SH) Limited 1,565.8 1,565.8 1,565.8
Total non-current 10,538.8 10,736.1 11,364.3
Total current and non-current 11,580.2 10,779.4 11,407.6
1The comparatives have been restated to reflect one decimal place.

22
Appendix 2 – Analysis of turnover and operating costs for the nine months ended 30 September 2009
Heathrow
Airport Ltd HEX Opco Total
Heathrow Gatwick Stansted Total
£m £m £m £m £m £m
Turnover
Aeronautical income 723.7 - 723.7 189.9 99.7 1,013.3
Retail income 262.9 - 262.9 127.0 67.5 457.4
Car parking 51.6 - 51.6 39.9 28.7 120.2
Duty and tax-free 64.1 - 64.1 28.5 10.1 102.7
Airside specialist shops 43.8 - 43.8 13.5 4.4 61.7
Bureaux de change 24.6 - 24.6 10.0 6.3 40.9
Catering 19.4 - 19.4 12.8 7.1 39.3
Landside shops and bookshops 15.0 - 15.0 10.8 4.9 30.7
Advertising 21.7 - 21.7 3.9 1.9 27.5
Car rental 9.4 - 9.4 2.4 1.6 13.4
Other 13.3 - 13.3 5.2 2.5 21.0 Operational facilities and utilities income 104.0 - 104.0 16.8 8.0 128.8
Property rental income 72.0 - 72.0 19.2 5.8 97.0
Rail income 65.6 - 65.6 - - 65.6
Other income 63.5 - 63.5 13.0 3.4 79.9
HEX inter-company elimination (40.5) 44.5 4.0 - - 4.0
Total income 1,251.2 44.5 1,295.7 365.9 184.4 1,846.0
Operating costs
Employment costs 168.3 12.8 181.1 79.7 35.2 296.0
Maintenance expenditure 85.1 13.5 98.6 18.4 7.5 124.5
Utility costs 74.3 0.1 74.4 23.5 15.5 113.4
Rents and rates 85.3 1.5 86.8 17.7 9.2 113.7
General expenses 140.0 10.2 150.2 47.2 22.2 219.6
Retail expenditure 17.6 - 17.6 11.9 6.8 36.3
Other intra-group charges 142.8 2.3 145.1 25.9 11.4 182.4
HEX inter-company elimination (44.5) - (44.5) - - (44.5)
Adjusted Operating Costs 668.9 40.4 709.3 224.3 107.8 1,041.4
Depreciation 306.0 - 306.0 52.0 29.1 387.1
Exceptional items 216.9 - 216.9 59.9 35.3 312.1
Total operating costs 1,191.8 40.4 1,232.2 336.2 172.2 1,740.6
Adjusted EBITDA 582.3 4.1 586.4 141.6 76.6 804.6

23
Analysis of turnover and operating costs for the nine months ended 30 September 2008 (pro forma)(1)
Heathrow
Airport Ltd HEX Opco Total
Heathrow Gatwick Stansted Total
(pro forma)
£m £m £m £m £m £m
Turnover
Aeronautical income 603.1 - 603.1 178.2 113.5 894.8
Retail income 246.4 - 246.4 134.4 69.0 449.8
Car parking 51.2 - 51.2 45.1 30.6 126.9
Duty and tax-free 55.6 - 55.6 28.5 8.4 92.5
Airside specialist shops 42.0 - 42.0 13.0 3.9 58.9
Bureaux de change 21.2 - 21.2 11.4 6.5 39.1
Catering 19.6 - 19.6 13.6 7.9 41.1
Landside shops and bookshops 16.0 - 16.0 11.1 5.4 32.5
Advertising 19.8 - 19.8 4.0 1.9 25.7
Car rental 8.2 - 8.2 2.5 2.0 12.7
Other 12.8 - 12.8 5.2 2.4 20.4 Operational facilities and utilities income 96.9 - 96.9 18.4 9.3 124.6
Property rental income 67.5 - 67.5 20.1 5.4 93.0
Rail income 62.8 - 62.8 - - 62.8
Other income 72.3 - 72.3 12.3 2.6 87.2
HEX inter-company elimination (40.3) 44.3 4.0 - - 4.0
Total income 1,108.7 44.3 1,153.0 363.4 199.8 1,716.2
Operating costs
Employment costs 200.1 13.7 213.8 76.4 39.7 329.9
Maintenance expenditure 83.6 12.2 95.8 19.3 7.2 122.3
Utility costs(2) 58.3 0.1 58.4 19.0 9.9 87.3
Rents and rates 68.2 1.1 69.3 17.9 8.7 95.9
General expenses(2) 135.8 10.6 146.4 46.4 21.2 214.0
Retail expenditure 15.7 - 15.7 12.3 1.9 29.9
Other intra-group charges(2) 132.3 2.6 134.9 36.0 20.7 191.6 Loss on disposal of tangible fixed assets 0.6 - 0.6 - - 0.6
HEX inter-company elimination (44.3) - (44.3) - - (44.3)
Adjusted Operating Costs 650.3 40.3 690.6 227.3 109.3 1,027.2
Depreciation 250.7 - 250.7 46.9 24.0 321.6
Exceptional items(3) 95.9 - 95.9 3.2 2.1 101.2
Total operating costs 996.9 40.3 1,037.2 277.4 135.4 1,450.0
Adjusted EBITDA 458.4 4.0 462.4 136.1 90.5 689.0
(1) The figures for 2008 are prepared on a pro forma basis that assumes consolidation of Heathrow Express Operating Company Limited
(‘HEX Opco’) although it was only acquired from BAA Airports Limited on 7 August 2008. (2) Utility costs, general expenses and other intra-group charges have all been restated, primarily recategorising electricity distribution fees
from general expenses and other intra-group charges into utility costs and ground transportation costs from general expenses into other intra-group charges.
(3) Financing fees previously included within operating exceptional items in the results for the nine months ended 30 September 2008 have been included within ‘Net interest payable’. The amount included within ‘Net interest payable’ as ‘Interest payable and similar charges – exceptional’ in this document is £142.6 million compared with £128.6 million previously included in exceptional items within operating profit. In addition, a charge of £17.1 million relating to Unfunded Pension Scheme and Post Retirement Medical Benefits (‘UURBS’) is included within exceptional items that was not included in the prior year results.