b1) calculation for the cold and hot water demands in the ... · pdf file73 b1) calculation...
TRANSCRIPT

73
B1) Calculation for the Cold and Hot water Demands in the Guest rooms of City Hotel Saburo Murakawa (1), Yasuo Koshikawa(2) Hiroshi Takata (3) Atsushi Tanaka (4) (1) [email protected] (2) [email protected] (3) [email protected] (4) [email protected] (1), (2) Graduate School of Engineering, Hiroshima Univ., Japan (3) Graduate School of Education, Hiroshima Univ., Japan (4) TAKENAKA Corporation, Japan Abstract The authors are developing a calculation method for cold and hot water demands in the different types of buildings by the Monte Carlo Simulation technique. In this method, we suppose to calculate the instantaneous flow rates, hourly and daily demands in time series through a day by using a personal computer easily. So far in the CIB-W62 symposium, we have shown the calculation method applied to apartment houses, office buildings, restaurants and so on. However, when we apply the simulation technique, it is very important to grasp the water usage in each fixture or in each room unit. In this paper, as a series of the developing study, we suggest the calculation method for cold and hot water demands in the guest rooms of city hotel. Firstly, we show the cold and hot water consumption in the three guest rooms of a city hotel measured by interval of one minute through one year. We analyze the volume of cold and hot water consumption classified by the characteristics of the guests such as the number of people and the difference of male and female in a room. Also, we show the detailed fixture usage of cold and hot water measured by interval of five seconds. We analyze the frequency of fixture usage, duration time of pouring water and flow rates in each fixture, and the temperature of water uses. Based on these analyzed results, we propose the simulation models for calculation of cold and hot water demands. Lastly, we show an example of the calculation results for hot water demands carried out by the simulation models. And also, we analyze the relationship between the capacity of storage tank and the heating power on the basis of the simulation results for hot water demands. Keywords Cold Water Consumption, Hot Water Consumption, Hotel, Guest Room, Simulation

74
1. Introduction We are now developing the calculation method for cold and hot water demands in the various types of buildings on the basis of fixture usage in the time series through a day. The method applies the Monte Carlo Simulation technique to calculate the instantaneous flow rate, hourly and daily water demands by a personal computer. We had proposed the calculation method for apartment houses [1,2], office buildings [3,5,7], restaurants [4], etc. in the CIB-W62 Symposium. Also, we showed the loads of hot water consumption in winter that were measured in the guest rooms of a city hotel [6]. In this paper, we propose the calculation models for cold and hot water demands on the basis of the measurement results in the same hotel through one year. With using the models, we estimate the cold and hot water demands in each scale of the number of guest rooms by the Monte Carlo Simulation. Moreover, we analyze the relationship between the capacity of storage tank and the heating power according to the calculation results of hot water demands in one minute interval through a day. 2. Outline of the investigation 2.1 Outline of the hotel and guest room A city hotel, located in downtown Kyoto city, was chosen as the building of the measurement. The outline of the hotel is shown in Table 1. The hotel has 225 guestrooms, 2 banquet rooms, 3 restaurants, etc. Check in time is 13:00[h] and check out time is 12:00[h]. Not only business people but also tourists including foreigners use the hotel. And, it is expected the volumes of hot water consumption are large in the kitchens as well as the guest rooms As an example of the plane, a guest room is shown in Figure 1. The guest room has popular two beds. But, it is possible to have accommodation for three persons with an extra-bed. The room has a combined bathroom and lavatory. The bathroom has a bathtub with two handle mixed faucet, and thermostat mixed shower. The toilet has a low down flush tank Table 1 - Outline of the hotel
Figure 1 - Guest room plane .
Name N Hotel Lot area 2,791.27 [m2 ]Location Kyoto city, Kyoto, Japan Building area 1,716.49 [m2 ]Building use Hotel Total floor area 21,773.00 [m2 ]Scale 14 stories, 2 basement, 2 penthouse Structure Steel-framed Reinforced Concrete structureFacilities 225 guests rooms, 2 banquet rooms, 3 restaurants ( Japanese, French, Chinese ), 1 bar, 1 café
Shops ( Jewelry, Kyoto Specialties ), Conference rooms, Wedding Reception, Wedding Chapels, Photo studio, Hairdressing & Esthetic salon, etc.
PS
BathtubWashbasin
T oilet

75
2.2 Outline of the measurements
Table 2 shows the outline of the measurement, and Figure 2 shows the schematic diagram of cold and hot water supply system in the guest room. Three guest rooms (A, B, C room) were chosen for the measurement of cold and hot water consumption.
The measurements on the volumes and temperatures of cold and hot water consumption in the guest rooms were carried out as follows. The volumes of cold and hot water consumption were measured by setting up the water meters to the cold and hot water supply pipelines respectively. As for the cold water consumption, the volumes of the pipeline of toilet were measured in distribution from the pipeline to the wash basin and bathtub. The temperatures of cold and hot water were measured by thermistor in each supply pipeline individually (Figure 2). In addition, the data for the number and gender of guests in each room were provided by the management company.
The measurements were carried out from February 1st, 2005 to April 1st, 2006. These data were classified into three groups, winter season from December to March, summer season from June to September and middle season April, May, October and November.
The volumes and temperatures of cold and hot water consumption were recorded by one minute or three minutes interval. Furthermore, in the guest rooms, the volumes and temperatures of cold and hot water consumption were recorded by five seconds interval to clarify the water usage in detail. The detail measurements were carried out six times through 24 hours in each guest room as shown in Table 3. The table shows the number and gender of guests as well.
Table 2 - Outline of the measurements
Figure 2 - Cold and hot water supply systems in the guest room Table 3 - Detail measurement period by five seconds interval and the number of
guests
Room Point of measurement Measuring instrument Measurement item IntervalCold water branch pipe (Wash basin and Bathing) Water meter Flow rate [L/min] 1 minute
Cold water branch pipe (Toilet) Water meter Flow rate [L/min] 1 minuteCold water branch pipe Thermistor Cold water supply temperature [°C] 1 minuteHot water branch pipe Water meter Flow rate [L/min] 1 minuteHot water branch pipe Thermistor Hot water supply temperature [°C] 1 minute
Guests writing in Number of guests and their gender per day
3 Guest roomsA roomB roomC room
A room B room C roomWinter • 2005/03/05 14h • 03/06 10h male 1�female 1 male 1�female 1 male 1�female 1Spring • 2005/05/21 10h • 05/22 10h male 1�female 1 male 1�female 0 male 1�female 1
Summer • 2005/08/06 10h • 08/07 10h male 0�female 3 male 1�female 1 male 0�female 1Autumn • 2005/11/26 10h • 11/27 10h male 1�female 1 male 1�female 1 male 0�female 2Winter • 2006/02/18 10h • 02/19 10h male 2�female 1 male 1�female 1 male 0�female 2*Winter • 2006/03/11 10h • 03/12 10h male 1�female 0 male 0�female 1 male 0�female 1
*Except the results with missing some of the temperature data
Season Measurement priod Number of guests [person]
Cold water supply pipe
Hot water supply pipe
Toilet
Washbasin
Bathtub
M
M
M
T
T
T : ThermistorM: W ater meter

76
3. Number of guests
In case of this hotel, the number of guests was large in the Golden Week on the period between late April and early May, the time of the Bon Festival holidays, and the year-end and New Year holidays. The numbers of guests fluctuated periodically in one week.
Table 4 shows the statistics of the numbers of guests in each day of the week without consideration of special holidays. The numbers of guests were larger in Friday and Saturday than the other days of the week.
Figure 3 shows the number and gender of guests in the three rooms. The number of guests occupied by two persons of male and female showed the highest value in all season. Table 4 - Number of guests depending on a day of the week
Figure 3 - Number and gender of guests in the three rooms 4. Cold and hot water consumption in the guest rooms
The average values of hot water supply temperature were 51.6 ~ 51.7[°C] in each season. It showed almost constant values through a year. However, the mean values of cold water temperature in winter, middle and summer season were 17.9[°C], 19.3[°C] and 21.4[°C] respectively. The difference of each season was small value because the city and well water were mixed. Therefore, we did not have the correction values for hot water supply temperature in this Chapter.
4.1 Daily consumption
As for the daily water consumption, the volumes of cold and hot water consumption per room are shown in Table 5, including the average number of guests per room. As the division of a day, it started at 13:00[h] that was the check-in time. The volume of hot
Day Averagevalue
Maximumvalue
Minimumvalue
Standarddeviation
Numberof days
Sun. 271 451 50 105.1 60Mon. 227 440 52 107.1 60Tue. 223 448 78 94.1 61Wen. 219 435 61 94.7 61Thu. 245 440 72 94.0 60Fri. 322 470 172 80.3 60Sat. 370 445 158 80.1 60
Unit: Number of guests [person/day]�Number of days [days]
128
89
103
320
71
52
66
189
68
59
34
161
17
26
20
63
16
24
20
60
20
5
4
4
5 5
30
5 9
9
22 11
2
2
1
8
0.0 0.1 0.2 0.3 0.4 0.5 0.6 0.7 0.8 0.9 1.0
Winter
Middle season
Summer
Total
Frequency ratio 2 persons�male 1 female 1�1 person�male 1�2 persons�female 2�1 person�female 1�2 persons�male 2�3 persons�female 3�3 persons�male 1 female 2�3 persons�male 3�3 persons�male 2 female 1�

77
water consumption in winter was larger than that in summer. The volume of cold water consumption had the contrary tendency for the volume of hot water consumption in winter and summer.
Figure 4 shows the daily average volumes in each usage, which were grouped by season, a day of the week, and the number and gender of guests. There was little difference in each season and in a day of the week. The volumes of cold and hot water consumption per room were caused by the number of guests, the character of guests, the behavior of water usage, etc. When we compared with same number of guests, the volume of hot water consumption by female was larger than that by male. Table 5 - Daily average volumes of cold and hot water consumption per room Figure 4 - Daily average volumes of cold and hot water consumption in period,
weekday, number and gender of guests 4.2 Hourly consumption
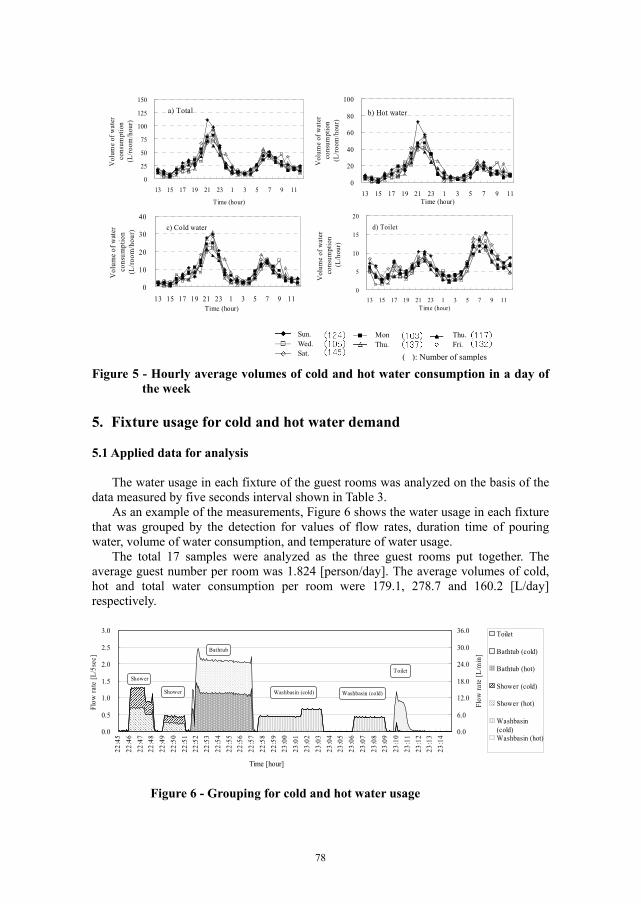
Figure 5 shows the hourly average volumes of cold and hot water consumption that were grouped in a day of the week. The peak hours of cold, hot and total water consumption occurred at the time-zone of 21:00[h] and 22:00[h]. The peak hours of the consumption for toilet occurred at the time-zone of 7:00[h] and 8:00[h]. The night peaks on Friday and Saturday had tendency to get for late time-zone. The same observable fact occurred for male guests in comparison with female guests. The volumes of total water consumption were affected by the peak volumes of hot water consumption on taking a bath.
Period Statistics Hot water Cold water Toilet TotalAverage 355.0 192.7 161.3 708.9 male 0.811S. D. 251.2 123.3 71.6 377.5 female 0.980Max. 3805.2 1338.0 565.5 4099.8 Total 1.792Average 382.2 184.3 162.6 729.1 male 0.803S. D. 299.0 123.1 70.8 403.5 female 0.988Max. 3805.2 1338.0 420.6 4099.8 Total 1.791Average 356.7 193.2 169.3 719.3 male 0.768
Middle S. D. 215.4 111.8 68.8 347.5 female 1.077 season (284) Max. 1511.1 757.2 405.5 2482.1 Total 1.845
Average 319.4 202.4 150.9 672.6 male 0.870S. D. 217.2 134.8 74.4 374.6 female 0.862Max. 1426.9 902.6 565.5 2354.8 Total 1.732
Summer • 260•
Unit• Hot water • Total [L/room/day]• Number of Guests [person/room/day]• ( ) is the number of samples in Period
Number of guests
Total • 864•
Winter • 320•
0
200
400
600
800
1000
1200
Tota
l
Win
ter
Mid
dle
Sum
mer
Sun
.
Mon
.
Tue.
Wen
.
Thu. Fri.
Sat
.
(0,1
)
(1,0
)
(0,2
)
(1,1
)
(2,0
)
(0,3
)
(1,2
)
(2,1
)
(3,0
)Ave
. of v
olum
e [L
/room
/day
]
]
Hot water Cold water Toilet
Period Weekday Number and gender of guests • male• femal•
78
Figure 5 - Hourly average volumes of cold and hot water consumption in a day of
the week 5. Fixture usage for cold and hot water demand 5.1 Applied data for analysis
The water usage in each fixture of the guest rooms was analyzed on the basis of the
data measured by five seconds interval shown in Table 3. As an example of the measurements, Figure 6 shows the water usage in each fixture
that was grouped by the detection for values of flow rates, duration time of pouring water, volume of water consumption, and temperature of water usage.
The total 17 samples were analyzed as the three guest rooms put together. The average guest number per room was 1.824 [person/day]. The average volumes of cold, hot and total water consumption per room were 179.1, 278.7 and 160.2 [L/day] respectively.
Figure 6 - Grouping for cold and hot water usage
Sun. Wed.Sat.
Mon Thu.
Thu.Fri.
( ): Number of samples
b) Hot water
0
20
40
60
80
100
13 15 17 19 21 23 1 3 5 7 9 11Time (hour)
Vol
ume
of w
ater
cons
umpt
ion
(L/ro
om/h
our)
c) Cold water
0
10
20
30
40
13 15 17 19 21 23 1 3 5 7 9 11Time (hour)
Vol
ume
of w
ater
cons
umpt
ion
(L/ro
om/h
our)
d) Toilet
0
5
10
15
20
13 15 17 19 21 23 1 3 5 7 9 11Time (hour)
Vol
ume
of w
ater
cons
umpt
ion
(L/h
our)
a) Total
0
25
50
75
100
125
150
13 15 17 19 21 23 1 3 5 7 9 11
Time (hour)
Vol
ume
of w
ater
cons
umpt
ion
(L/ro
om/h
our)
0.0
0.5
1.0
1.5
2.0
2.5
3.0
22:4
522
:46
22:4
722
:48
22:4
922
:50
22:5
122
:52
22:5
322
:54
22:5
522
:56
22:5
722
:58
22:5
923
:00
23:0
123
:02
23:0
323
:04
23:0
523
:06
23:0
723
:08
23:0
923
:10
23:1
123
:12
23:1
323
:14
Flow
rate
[L/5
sec]
0.0
6.0
12.0
18.0
24.0
30.0
36.0
Flow
rate
[L/m
in]
Toilet
Bathtub (cold)
Bathtub (hot)
Shower (cold)
Shower (hot)
Washbasin(cold)Washbasin (hot)
Shower
Bathtub
Washbasin (cold)
Toilet
Washbasin (cold)Shower
Time [hour]

79
5.2 Frequency of fixture usage Table 6 shows the daily average frequencies and the hourly peak frequencies of fixture usage per room. The total frequencies of all fixtures usage per room were about 39 times. Figure 7 shows the ratios as the hourly average frequencies against the daily average frequencies for each fixture usage. The frequencies of hot water usage such as taking shower and bath were concentrated at the time-zone of 22:00[h] and 23:00[h]. On the other hand, the peak ratios for cold water usage were low, and occurred at the time-zone of 7:00[h]. However, the peak ratios showed a little high in comparison with the values which were analyzed by the measurement data for long term. Therefore, we had the leveling for hourly frequencies as the simulation models on the basis of the measurement results. The modeling will be shown at the next chapter. Table - 6 Daily average frequency and hourly peak frequency
Figure 7 - Hourly frequency in each fixture usage 5.3 Duration time, flow rate and temperature in each fixture usage
Figure 8, Figure 9 and Figure 10 show the duration time of pouring water, flow rate and temperature in each fixture usage respectively as the cumulative frequency distributions, and show the approximate distributions by Erlang or Exponential distribution.
Average duration time and flow rate of pouring hot water into the bathtub; the capacity is about 200[L], were 315[sec] and 26[L/min] respectively. The guests sometimes operated the two handle mixed faucet with wide range; from 10[L/min] to 35[L/min].
Average duration time and flow rate for taking shower for one frequency were 154[sec] and 9.4[L/min] respectively. The duration times were some differences individually in comparison with the flow rates.
0
5
10
15
20
25
30
13 15 17 19 21 23 1 3 5 7 9 11
Time [hour]
Freq
uenc
y ra
tio [%
]
Shower �76� Bathtub (39)Washbasin (hot)�60� Washbasin (cold)�222�Washbasin (cold&hot)�58� Toilet (208) ( ) : Number of samples
Average S. D.4.47 2.72 1.29 22 6.95
hot 3.53 4.98 0.65 22 4.40cold 13.06 7.80 1.82 7 3.35cold & hot 3.41 2.98 0.65 7 4.55
2.29 1.57 0.47 23 4.9212.24 5.68 1.59 7 3.12
Note : Peak ratios were calculated by dividing the volume of water consumption in peak time-zone with the average volume of water consumption per hour
Shower (cold & hot)
Washbasin
Bathtub (cold & hot)Toilet (cold)
PeakratioItem
Frequency [times/day] Frequency in peak time-zone [times/hour]
Peak time-zone[hour]

80
The temperature of water usage was calculated by the flow rates and temperatures of cold and hot water when the water demands were detected by the meters. The temperature distribution for water usage was approximated by the Erlang distribution with large phase. Figure 8 – Cumulative frequency distribution for duration time of pouring water
Figure 9 – Cumulative frequency distribution for flow rate
Figure 10 – Cumulative frequency distribution for temperature of water usage
6. Calculation of hot water demands and equipment capacity 6.1 Simulation model for calculation
Before the proposition of simulation model for calculation of cold and hot water demands in the guest rooms, we set up the three levels of unit value for cold and hot water consumption in the guest rooms occupied by two persons. By setting up the level, it is possible to choice the design values in accordance with the rank and scale of hotel.
Table 7 shows the three level values for cold and hot water consumption. As for the Level 1, we decided the values from the highest consumption used by two persons of male and female. The Level 3 showed the lowest consumption used by two persons of male. The Level 2 was set up by the mean values of Level 1 and Level 3. Also, this table shows two cases according to the difference of water supply temperature. The one case of 17[°C] was decided by measurement. The other case of 8[°C] was set up for the standard calculation model in winter. Besides, we set up 60[°C] for hot water supply temperature as the standard model.
As for the simulation model of hourly frequency in each fixture usage, we applied the statistical technique of moving average to make smooth values in the time series
0.0
0.2
0.4
0.6
0.8
1.0
0 5 10 15 20 25 30
Flow rate [L/min]
Ratio
of c
umul
ativ
efr
eque
ncy
0 1 2 3 4 5 6
Flow rate [L/min]
0 2 4 6 8 10
Flow rate [L/min]
0 20 40 60 80 100
Flow rate [L/min]
ShowerDis tribution•Erlang• K=10Average:9.4 [L/min]
Washbasin (hot)Dis tribution•Erlang• K=2Average:2.7 [L/min]
Washbasin (cold&hot)Dis tribution•Erlang• K=10Average:4.7 [L/min]
BathtubDis tribution•Erlang• K=6Average:26.0 [L/min]
0.0
0.2
0.4
0.6
0.8
1.0
0 100 200 300 400 500
Flow time [sec]
Ratio
of c
umul
ativ
efr
eque
ncy
0 50 100 150
Flow time [sec]
0 50 100 150 200
Flow time [sec]0 200 400 600 800 1000
Flow time [sec]
ShowerDis tribution•Erlang• K=2Average:154 [sec]
W ashbasin (hot)Dis tribution•Erlang• K=3Average:31 [sec]
Washbasin (cold&hot)Dis tribution•Erlang• K=5Average:69 [sec]
BathtubDis tribution• Exp.Average:315 [sec]
ShowerDistribution•Erlang• K=100Average:40.1 [°C]
Washbasin (hot)Distribution•Erlang• K=100Average:50.0 [°C]
Washbasin (cold&hot)Distribution•Erlang• K=20Average:37.3 [°C]
BathtubDistribution•Erlang• K=50Average:41.9 [°C]
0.0
0.2
0.4
0.6
0.8
1.0
0 20 40 60 80 100
Temperature [°C]
Ratio
of c
umul
ativ
efr
eque
ncy
0 20 40 60 80 100
Temperature [°C]
0 20 40 60 80 100
Temperature [°C]
0 20 40 60 80 100
Temperature [°C]

81
fluctuations of Figure 7. On the weighting values, we applied the value 0.5 for the concerned time-zone, and also applied the value 0.25 for the front and the rear time-zone.
Figure 11 shows the hourly frequencies in each fixture usage calculated by two times of moving average operation. We proposed the hourly frequencies as the simulation models to apply for the twin beds room.
We verified the accuracy of the cold and hot water demands calculated by using hourly frequencies shown in Figure 11. And we were satisfied with the calculation results in comparison with the hourly measurement results.
Table 8 shows the simulation models for calculation of cold and hot water demands in each fixture usage. We proposed the three levels calculation models by setting up the different frequencies per day. Table 7 - Daily average water consumption for the three levels
Figure 11 - Hourly frequency in each fixture usage as simulation model Table 8 - Simulation model in each fixture usage 6.2 Calculation of hot water demands
We carried out the calculation of hot water demands by using the Monte Carlo Simulation technique. On the basis of the fixture usage models as shown in Figure 11 and Table 8, the simulation was carried out 100 times with repetition to get the stability for the calculation. From these results, we grasped the fluctuation patterns of hot water demands in the time series through a day. And by using the statistical analysis, we
Cold water Hot water Toilet TotalTemperature of water Level 1 432.7 207.1 178.6 818.1
17 [°C] Level 2 378.7 198.4 167.9 746.3(actual value) Level 3 324.7 189.6 157.3 674.4
Temperature of water Level 1 396.9 242.9 178.6 818.48 [°C] Level 2 358.0 219.1 167.9 744.9
(given value) Level 3 319.0 195.2 157.3 671.5Note: unit[L/room/day], Given temperature of hot water is 60[°C].
Model
Level 1 Level 2 Level 3 Avg. value Distribution Avg. value Distribution Avg. value DistributionShower cold & hot 5.6 5.0 4.5 160 Erl. 2 10.0 Erl.10 41.5 Erl.100
hot 3.9 3.5 3.1 35 Erl. 3 2.5 Erl. 2 60.0 Fixed valuecold 14.9 13.5 12.0 40 Erl .2 3.0 Erl .2 8.0 Fixed value
cold & hot 4.3 3.9 3.5 70 Erl. 5 5.0 Erl.10 37.0 Erl. 20Bathtub cold & hot 3.2 2.8 2.5 315 Exp. 26.0 Erl. 6 42.0 Erl. 50Toilet cold 14.8 13.9 13.0 170 Erl.20 4.5 Erl.20 8.0 Fixed value
*Temperature is used for winter seasons.
Washbasin
Fixture usageFrequency of usage [times/day] Durationtime [sec] Flow rate [L/min] Temperature [°C]*
02468
10121416
13 15 17 19 21 23 1 3 5 7 9 11
Time [hour]
Freq
uenc
y ra
tio[%
]
Shower (cold&hot)Washbasin (hot)Washbasin (cold)Washbasin (cold&hot)Bathtub (cold&hot)Toilet (cold)

82
calculated the instantaneous maximum flow rates, hourly peak values and daily values of hot water demands.
In this study, we carried out the simulation by changing the scale of the number of guest rooms. We selected five kinds of scale that were 50, 100, 200, 300 and 500 guest rooms. These results for hot water demands are shown in Table 9.
The daily average hot water demands per room showed no difference in each scale of the number of guest rooms. These results showed nearly same values in Table 5. Therefore, we evaluated that the simulation was carried out suitably.
As for the hourly peak value of hot water demands, the ratios of peak values were changed within the values of 3.39 ~ 3.55. The ratios showed almost same values with the measurement results through a year.
For the instantaneous flow rates, we showed the values of maximum and failure factor 0.2, 1.0 and 5.0[%]. From the comparison with the measurement results, we suggest to choice the values of failure factor 0.2[%] as the maximum flow rates for practical design.
Figure 12 shows the instantaneous flow rates in each scale of the number of guest rooms. The figure shows the changes of flow rates affected by the number of guest rooms and the values of failure factor as the ratios against to the values of 50 guest rooms. Referring to the declining tendency of the ratios, the more the failure factor is small, the more the decline is large. Table 9 - Calculation results for hot water demands Figure 12 – Relationship between the number of guest rooms and instantaneous
flow rates in each failure factor (In case of Level 3)
Number Thermal valueof Avg. Avg.
rooms per room [MJ/day] Max. 0.2% 1.0% 5.0% Avg.50 404.5 23880 1586 4403 843 2892 3.43 183.5 629.4 179.1 147.9 123.8 96.0 48.2
100 406.5 47335 2056 8849 1694 5874 3.47 368.7 1278.6 267.5 218.1 189.5 158.8 97.9200 403.4 89118 3385 17560 3361 11528 3.43 731.7 2509.4 382.0 341.8 312.0 277.3 192.1300 402.5 130818 3787 26286 5032 17140 3.41 1095.3 3730.9 486.8 461.8 430.3 385.9 285.7500 404.7 214895 4522 44045 8431 28999 3.44 1835.2 6312.4 859.2 739.0 680.9 616.3 483.3
50 355.5 21142 1448 3869 741 2527 3.41 161.2 550.1 139.1 124.2 110.6 88.2 42.1100 359.4 40647 1811 7824 1498 5206 3.48 326.0 1133.3 251.7 206.5 178.4 149.6 86.8200 359.3 78779 2720 15640 2994 10210 3.41 651.7 2222.5 446.2 347.6 303.0 257.6 170.2300 357.1 115461 3420 23322 4464 15135 3.39 971.8 3294.5 518.4 432.7 392.3 351.1 252.2500 356.9 192673 4478 38845 7436 25605 3.44 1618.5 5573.5 734.9 668.0 619.3 560.3 426.7
50 316.8 19098 1512 3447 660 2342 3.55 143.6 509.8 155.3 129.0 105.0 81.8 39.0100 320.4 36661 1936 6974 1335 4592 3.44 290.6 999.5 216.6 192.0 162.3 133.2 76.5200 317.6 70129 2362 13825 2646 9047 3.42 576.0 1969.2 349.8 309.4 271.1 230.5 150.8300 320.2 104144 3200 20909 4002 13809 3.45 871.2 3006.0 470.3 416.3 377.0 327.1 230.2500 319.9 170464 3582 34819 6665 22953 3.44 1450.8 4996.3 656.2 607.7 565.2 506.1 382.6
Note: Each value is 100 trials average value by the results of simulation
Hot water [L/day]
Max. S.D.
Hot water [L/h]
Peak time Peak ratio
Instantaneous value [L/min]Thermal value [MJ/h]
Peak time (at 22:00 - 23:00 hours)Avg. Avg.
01234567
0 100 200 300 400 500Number of guest rooms
Rat
io o
f ins
tant
aneo
us fl
ow ra
te [%
]
Failure factor 5.0[%]
Failure factor 1.0[%]
Failure factor 0.2 [%]
83
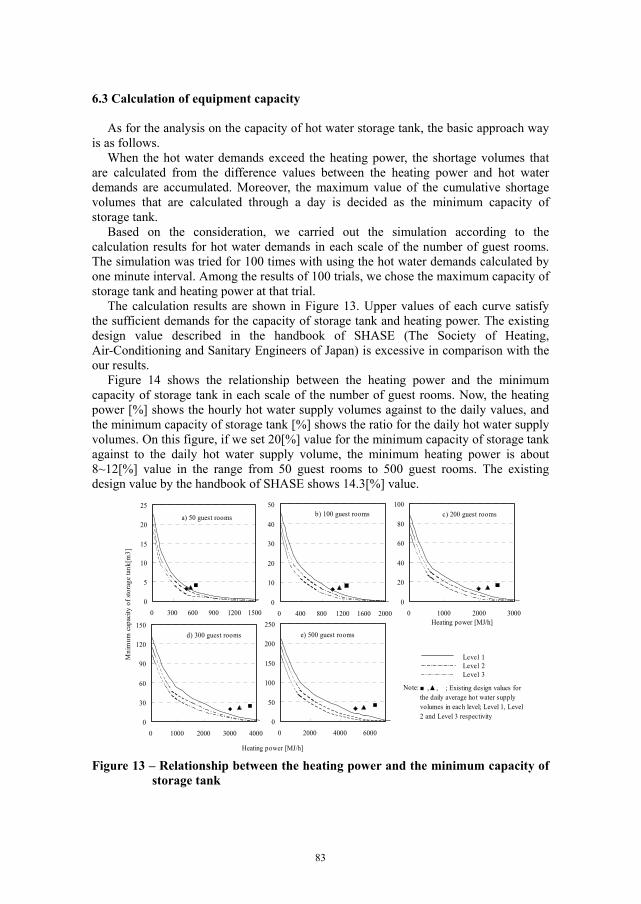
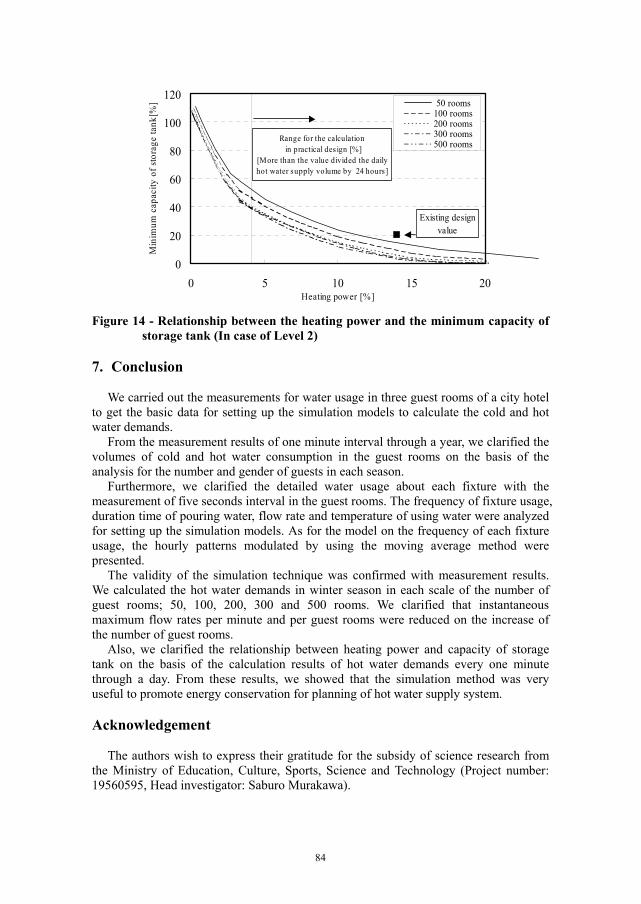
6.3 Calculation of equipment capacity As for the analysis on the capacity of hot water storage tank, the basic approach way is as follows. When the hot water demands exceed the heating power, the shortage volumes that are calculated from the difference values between the heating power and hot water demands are accumulated. Moreover, the maximum value of the cumulative shortage volumes that are calculated through a day is decided as the minimum capacity of storage tank. Based on the consideration, we carried out the simulation according to the calculation results for hot water demands in each scale of the number of guest rooms. The simulation was tried for 100 times with using the hot water demands calculated by one minute interval. Among the results of 100 trials, we chose the maximum capacity of storage tank and heating power at that trial. The calculation results are shown in Figure 13. Upper values of each curve satisfy the sufficient demands for the capacity of storage tank and heating power. The existing design value described in the handbook of SHASE (The Society of Heating, Air-Conditioning and Sanitary Engineers of Japan) is excessive in comparison with the our results. Figure 14 shows the relationship between the heating power and the minimum capacity of storage tank in each scale of the number of guest rooms. Now, the heating power [%] shows the hourly hot water supply volumes against to the daily values, and the minimum capacity of storage tank [%] shows the ratio for the daily hot water supply volumes. On this figure, if we set 20[%] value for the minimum capacity of storage tank against to the daily hot water supply volume, the minimum heating power is about 8~12[%] value in the range from 50 guest rooms to 500 guest rooms. The existing design value by the handbook of SHASE shows 14.3[%] value. Figure 13 – Relationship between the heating power and the minimum capacity of
storage tank
b) 100 guest rooms
0
10
20
30
40
50
0 400 800 1200 1600 2000
c) 200 guest rooms
0
20
40
60
80
100
0 1000 2000 3000Heating power [MJ/h]
a) 50 guest rooms
0
5
10
15
20
25
0 300 600 900 1200 1500
Mni
mum
cap
acity
of s
tora
ge ta
nk[m
3]
e) 500 guest rooms
0
50
100
150
200
250
0 2000 4000 6000
Heating power [MJ/h]
d) 300 guest rooms
0
30
60
90
120
150
0 1000 2000 3000 4000
Level 1Level 2Level 3
Note:■ ,▲ ,� ; Existing design values forthe daily average hot water supplyvolumes in each level; Level 1, Level2 and Level 3 respectivity
84
Figure 14 - Relationship between the heating power and the minimum capacity of
storage tank (In case of Level 2) 7. Conclusion We carried out the measurements for water usage in three guest rooms of a city hotel to get the basic data for setting up the simulation models to calculate the cold and hot water demands. From the measurement results of one minute interval through a year, we clarified the volumes of cold and hot water consumption in the guest rooms on the basis of the analysis for the number and gender of guests in each season. Furthermore, we clarified the detailed water usage about each fixture with the measurement of five seconds interval in the guest rooms. The frequency of fixture usage, duration time of pouring water, flow rate and temperature of using water were analyzed for setting up the simulation models. As for the model on the frequency of each fixture usage, the hourly patterns modulated by using the moving average method were presented. The validity of the simulation technique was confirmed with measurement results. We calculated the hot water demands in winter season in each scale of the number of guest rooms; 50, 100, 200, 300 and 500 rooms. We clarified that instantaneous maximum flow rates per minute and per guest rooms were reduced on the increase of the number of guest rooms. Also, we clarified the relationship between heating power and capacity of storage tank on the basis of the calculation results of hot water demands every one minute through a day. From these results, we showed that the simulation method was very useful to promote energy conservation for planning of hot water supply system. Acknowledgement The authors wish to express their gratitude for the subsidy of science research from the Ministry of Education, Culture, Sports, Science and Technology (Project number: 19560595, Head investigator: Saburo Murakawa).
0
20
40
60
80
100
120
0 5 10 15 20Heating power [%]
Min
imum
cap
acity
of s
tora
ge ta
nk[%
] 50 rooms100 rooms200 rooms300 rooms500 roomsRange for the calculation
in practical des ign [%][More than the value divided the dailyhot water supply volume by 24 hours]
Existing designvalue

85
References 1. S. Murakawa and H. Takata: Development of the Calculating Method for Cold and
Hot Water Consumption based on the Fixture Usage in the Time Series through a Day - A case study of apartment houses -; Proceedings of the CIB/W62 International Symposium on Water Supply and Drainage for Buildings (Iasi), C-1, pp.1-13 (2002)
2. S. Murakawa and H. Takata: Development of the Calculating Method for the Loads of Clod and Hot Water Consumption in the Apartment Houses; Proceedings of the CIB/W62 International Symposium on Water Supply and Drainage for Buildings (Ankara), pp.281-295 (2003)
3. H. Takata, S. Murakawa, and Y. Yamane: Development of the Calculating Method for the Loads of Water Consumption in the Office Buildings; Proceedings of the CIB/W62 International Symposium on Water Supply and Drainage for Buildings (Ankara), pp.249-264 (2003)
4. S. Murakawa and H. Takata: Development of the Calculating Method for the Loads of Water Consumption in Restaurant; Proceedings of the CIB/W62 International Symposium on Water Supply and Drainage for Buildings (Paris), A-7, pp.1-14 (2004)
5. H. Takata, S. Murakawa, D. Nishina, and Y. Yamane: Development of the Calculating Method for the Loads of Cold and Hot Water Consumption in Office Building; Proceedings of the CIB/W62 International Symposium on Water Supply and Drainage for Buildings (Paris), A-2, pp.1-16 (2004)
6. H. Takata, S. Murakawa, D. Nishina and A. Tanaka: An Analysis on the Loads of Hot Water Consumption of Guest Rooms in a Hotel; Proceedings of the CIB/W62 International Symposium on Water Supply and Drainage for Buildings (Brussels), F-2, pp.1-9 (2005)
7. S. Murakawa, H. Takata, K. Sakamoto: Calculation Method for the Loads of Cold and Hot Water Consumption in Office Buildings based on the Simulation Technique; Proceedings of the CIB/W62 International Symposium on Water Supply and Drainage for Buildings (Taipei), G-2, pp.1-14 (2006)
Main author presentation Saburo Murakawa is the Professor at Graduate School of Engineering, Hiroshima University. His special fields are building and city environment engineering, plumbing engineering and environmental psychology. He is now studying to develop the new calculation technique for cold and hot water demands in various buildings to establish the standard method. .

86