b reaking the c ycle - michigan state university
TRANSCRIPT
BREAKING THE CYCLE: AN INTERNATIONAL COMPARISON
OF U.S. MATHEMATICS TEACHER PREPARATION
INITIAL FINDINGS FROM THE TEACHER EDUCATION AND DEVELOPMENT STUDY IN MATHEMATICS (TEDS-M) IN THE UNITED STATES
BREAKING THE CYCLE AN INTERNATIONAL COMPARISON OF U.S. MATHEMATICS
TEACHER PREPARATION
THE CENTER FOR RESEARCH IN MATH AND SCIENCE EDUCATION MICHIGAN STATE UNIVERSITY
CONTRIBUTORS (IN ALPHABETIC ORDER)
JACQUELINE BABCOCK
PHILIP BABCOCK JEAN BUHLER
JENNIFER CADY LELAND COGAN
RICHARD HOUANG NEELAM KHER
JEANNIE PATRICK KAMILA ROSOLOVA
WILLIAM H. SCHMIDT KATHY WIGHT
INITIAL FINDINGS FROM THE TEACHER EDUCATION AND DEVELOPMENT STUDY IN MATHEMATICS (TEDS-M)
© 2010 Michigan State University Center for Research in Mathematics and Science Education
Suggested Citation:
Center for Research in Mathematics and Science Education. (2010). Breaking the Cycle: An International Comparison of U.S. Mathematics Teacher Preparation. East Lansing: Michigan State University.
UNITED STATES TEACHER EDUCAT ION STUDY IN MATHEMAT ICS (U.S. TEDS-M)
© 2010 Michigan State University Center for Research in Mathematics and Science Education
The United States Teacher Education Study in Mathematics (U.S. TEDS-M) project was conducted by the Center for Research in Mathematics and Science Education at Michigan State University which is supported by the GE Foundation, The Boeing Company, The Carnegie Corporation of New York, and The Bill and Melinda Gates Foundation. Any opinions, findings, and conclusions or recommendations expressed in this report are those of the author and do not necessarily reflect the views of the funders. This U.S. TEDS-M report is based on the United States’ participation in the TEDS-M project. TEDS-M is sponsored by the International Association for the Evaluation of Educational Achievement under the direction of Michigan State University, in collaboration with the Australian Council for Educational Research and the participating countries. The international costs for TEDS-M were funded by the International Association for the Evaluation of Educational Achievement, a major grant to MSU from the US National Science Foundation NSF REC 0514431 (M.T. Tatto, PI) and funding from each participating country. Each participating country was responsible for funding national project costs and implementing TEDS-M in accordance the international procedures and standards. Any opinions, findings, and conclusions or recommendations expressed in this material are those of the authors and do not necessarily reflect the views of the IEA, MSU, ACER or the National Science Foundation. This analysis is based on the IEA TEDS-M International Database which contains confidential data collected in 2007/2008 as part of the IEA TEDS-M study. All computations were prepared by the U.S. TEDS-M National Research Center and the responsibility for the use and interpretation of these data is entirely that of the authors. The authors gratefully acknowledge the support and contributions of the following: the IEA for sponsoring the international study; the International Study Center at Michigan State University especially Maria Teresa Tatto, John Schwille, Sharon Senk and Inese Berzina-Pitcher for their coordination and support; Mark Reckase and Eun-Hye Ham for their technical assistance; The Funders of U.S. TEDS-M: The GE Foundation, The Boeing Company, The Carnegie Corporation of New York and the Bill and Melinda Gates Foundation; the National Science Foundation for its funding of the IEA and the International Study Center at Michigan State University. Thank you to the research coordinators and research participants at all of the colleges and universities who participated in the data collection activities without which this report would not have come to light. Additional copies of this report can be downloaded at http://usteds.msu.edu.
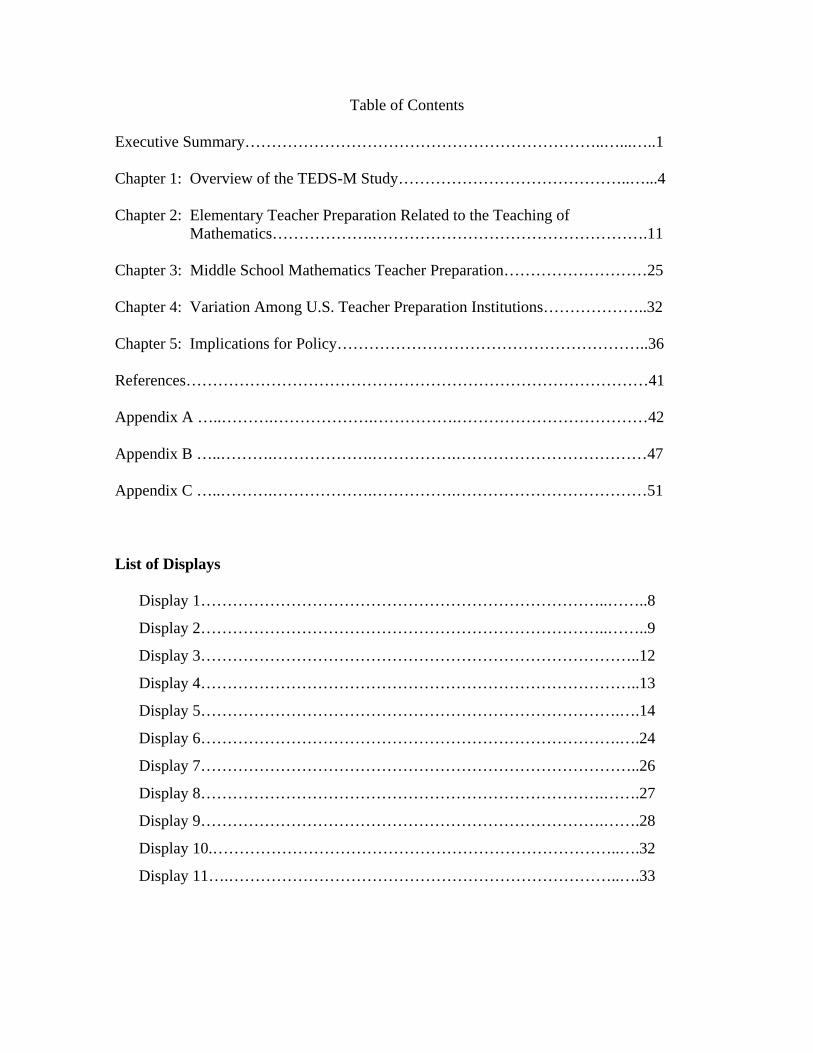
Table of Contents Executive Summary…………………………………………………………..…...…..1 Chapter 1: Overview of the TEDS-M Study……………………………………..…...4 Chapter 2: Elementary Teacher Preparation Related to the Teaching of Mathematics……………….…………………………………………….11 Chapter 3: Middle School Mathematics Teacher Preparation………………………25 Chapter 4: Variation Among U.S. Teacher Preparation Institutions………………..32 Chapter 5: Implications for Policy…………………………………………………..36 References……………………………………………………………………………41 Appendix A …..……….……………….…………….………………………………42 Appendix B …..……….……………….…………….………………………………47 Appendix C …..……….……………….…………….………………………………51 List of Displays
Display 1…………………………………………………………………..……..8
Display 2…………………………………………………………………..……..9
Display 3………………………………………………………………………..12
Display 4………………………………………………………………………..13
Display 5…………………………………………………………………….….14
Display 6…………………………………………………………………….….24
Display 7………………………………………………………………………..26
Display 8………………………………………………………………….…….27
Display 9………………………………………………………………….…….28
Display 10.…………………………………………………………………..….32
Display 11….………………………………………………………………..….33
Executive Summary
The Teacher Education and Development Study in Mathematics (TEDS-M)1
examined teacher preparation in 16 countries looking at how primary level and middle school level teachers of mathematics were trained. The study examined the course taking and practical experiences provided by teacher preparation programs at colleges, universities and normal schools. (The study did not include what are often referred to as alternative programs.) Future teachers near the end of their programs were assessed both in terms of their knowledge of mathematics as well as their knowledge of how to teach mathematics (pedagogical knowledge). For the U.S. nearly 3300 future teachers from over 80 public and private colleges and universities in 39 states were involved. Data were collected over two years. The public colleges and universities were sampled and the data were collected in 2007 while the private data were collected in the spring of 2008.
The study reveals that middle school mathematics teacher preparation is not up to the task. U.S. future teachers find themselves, straddling the divide between the successful and the unsuccessful, leaving the U.S. with a national choice of which way to go.
The findings of TEDS-M additionally revealed that the preparation of elementary teachers to teach mathematics was comparatively somewhat better as the U.S. found itself in the middle of the international distribution, along with other countries such as the Russian Federation, Germany and Norway but behind Switzerland, Chinese Taipei (Taiwan – throughout this report) and Singapore.
U.S. future teachers are getting weak training mathematically, and are just not prepared to teach the demanding mathematics curriculum we need especially for middle schools if we hope to compete internationally. This is especially true given that 48 of the states are currently considering the adoption of the more rigorous “Common Core” standards.
It is important for us as a nation to understand that teacher preparation programs are critical, not only for future teachers, but also for the children they will be teaching. It is quite striking that the performance of the future teachers in terms of their mathematics content knowledge at both levels parallels so closely that of the students they teach.
The real issue is how teachers are prepared – the courses they take and the experiences they have while in their preparation programs. It is not just the amount of formal mathematics they study. It also involves studying the theoretical and practical aspects of teaching mathematics and of teaching in general.
The TEDS-M findings support previous international research, including the Third International Mathematics and Science Study (TIMSS), showing average achievement at third and fourth grade for the U.S., but low achievement in mathematics compared to other countries at seventh and eighth grades. Another TIMSS finding indicated that one of the major factors related to this low performance was a U.S. middle school curriculum that was unfocused, lacking coherence and not demanding.
The National Governors Association and the Council of Chief State School Officers are completing work on K-12 mathematics standards called the “Common Core.” These are to be released soon with the expectation that a majority of states will adopt them. These
1 The analyses prepared for this report and the views expressed are those of the author’s and do not necessarily reflect the views of the International Association for the Evaluation of Educational Achievement (IEA).
1
standards are internationally competitive addressing the problems identified through TIMSS and, as a result, require teachers at the elementary, but especially the middle school level, to have a deeper understanding of mathematics.
We are going from “The Gathering Storm” to the “Perfect Storm” as we as a nation move to mathematics content standards that are more demanding and rigorous with teachers who are not being prepared to have high levels of mathematics knowledge themselves.
We must address this. We can make our mathematics curriculum more demanding instead of a mile wide and an inch deep, but we also need teachers who are well prepared to teach it to all children.
Middle school teacher preparation is accomplished through three types of certification programs, elementary programs granting K-8 certification, middle school programs, usually providing certification for grades 6-8 or 7-9, or secondary programs certifying future teachers to teach sixth or seventh grade up through twelfth grade.
In terms of the mathematics content and pedagogical content knowledge, those future teachers prepared in secondary programs outperformed those in the other two programs by a substantial amount – almost by a full standard deviation.
This raises a serious policy question as to the type of certification rules states should mandate for the preparation of middle school mathematics teachers as these then impact what universities and colleges require.
The different preparation programs have major implications in terms of what future teachers have in the way of opportunities to learn the mathematics as well as to learn the ways to teach it. Such opportunities are related to their performance. Time for teacher preparation is limited and how it is spent reflects the teacher preparation institution’s vision of how best to prepare future teachers. For middle school teachers the top achieving countries on average allocated half of the course taking related specifically to teacher preparation to the study of formal mathematics. The other half was allocated to either mathematics pedagogy (30%) – which focuses on such things as how students learn mathematics and how it is best taught – or general pedagogy (20%) which includes instructional design, classroom management as well as the foundation courses related to schooling. By contrast the average for the 81 U.S. institutions was 40% for the study of mathematics and 60% for the two pedagogy areas evenly split.
This difference is best illustrated by the pattern of course taking associated with two fundamental mathematics courses which are the gateway to the study of formal mathematics – linear algebra and a basic two-course sequence in calculus. Such differences in course taking were found to be related to the knowledge of the future teacher as they left their teacher preparation institution.
While those countries achieving at the top level had on average 90% of their future teachers taking these courses, in the United States about two-thirds of the future middle school mathematics teachers took linear algebra and only slightly more than half took the basic two-course sequence in calculus. Differences also existed in other areas of mathematics preparation such as the number of advanced mathematics courses taken – the six top-achieving countries took two more courses in this area.
Increasing the mathematics course-taking requirements by expecting future teachers to be prepared in secondary programs alone might not solve the problem. Such a requirement could have the unintended consequence of creating a shortage of middle
2
school mathematics teachers as many who are interested in middle school might not want to be part of a secondary preparation program.
It is here where the middle school conundrum is similar to the main issue facing elementary teacher preparation. For elementary future teachers the issue, unlike that for the middle school future teachers, is not so much about the teacher preparation curriculum but about who chooses to become a teacher. The top-achieving countries’ relative allocation of topic coverage across mathematics and pedagogy was about one-third vs. two-thirds which was the same for the U.S.
The pool from which the U.S. recruits its future teachers is weak internationally as TIMSS data illustrate. Future teachers as they enter their preparation programs have been exposed to a less demanding curriculum and on average have lower levels of mathematics knowledge than in other countries. For future elementary teachers they start out behind those in other countries and given that no striking patterns of cross-country differences in course taking are evident the result is we end up in a similar position – behind as well.
For middle school teacher preparation the same is true with respect to who enters teacher preparation but there are also clear indications of large differences in course taking across countries which only exacerbates the differences.
In part we must break the vicious cycle in which we find ourselves – where the weak K-12 mathematics curriculum taught by teachers with an inadequate mathematics background produces high school graduates who are similarly weak. Some of them then become future teachers who are not given a strong preparation in mathematics and then they teach and the cycle continues. Perhaps the force is with us at this moment in time to begin to break the cycle. The “Common Core” standards are more challenging and the study gives evidence of how teacher education might be shaped differently. The challenge is now with the states who set the certification policies and the universities and colleges that interpret them.
How teacher preparation is defined in terms of courses taken varies across universities and colleges in the U.S. The level of knowledge of the mathematics necessary for the teaching of middle school topics also varies such that some of the U.S. teacher preparation institutions on average produced future teachers at a level commensurate with the level of performance of developing countries such as Botswana, but that other institutions within the United States have future teachers who have a knowledge level consistent with the average performance of some institutions in both Taiwan and the Russian Federation. In fact, those same institutions perform at a level that outperforms the average level of knowledge of the sole institution for the preparation of teachers in Singapore. Similar variation was also found at the elementary level.
Such variation is both encouraging and discouraging for obvious reasons – the high levels of mathematics and pedagogical knowledge commensurate with the highest performing countries’ institutions, even after adjusting for differences in who enters the program, suggests it can be done, but the variability and the fact that there are some U.S. institutions where the average performance places them in the middle of the distribution for countries such as Botswana suggests the depth of the problem.
3
CHAPTER 1
OVERVIEW OF THE TEDS-M STUDY
The Teachers Education and Development Study in Mathematics (TEDS-M) 2008
is an international comparative study of teacher education with a focus on the preparation
of teachers of mathematics at the primary (elementary) and lower secondary (middle
school) levels. The study was carried out under the aegis of the International Association
for the Evaluation of Educational Achievement (IEA), an independent, international
consortium of countries representing national research institutions and governmental
research agencies – the same organization that sponsored the Third International
Mathematics and Science Study (TIMSS). TEDS-M is the first international study of
higher education and the first international study focusing on teacher preparation.
Participating countries in addition to the U.S. included Germany, Norway, Poland, the
Russian Federation, Spain, Switzerland, Taiwan, Singapore, Thailand, Malaysia,
Botswana, the Philippines, Chile, Georgia, and Oman.
The TIMSS K-8 curriculum and grade 8 achievement data revealed that countries
with higher achievement also had teachers who taught substantially different content than
that found elsewhere (see Schmidt et al., 1996; Schmidt et al., 2001; Schmidt, Wang, &
McKnight, 2005). Other reports have highlighted the idea that what teachers know and do
in the classroom is consequential for students’ learning (National Commission on Teaching
and America's Future, 1996). U.S. reform efforts, consistent with this line of thought, have
introduced standards to measure teacher quality in connection with student achievement
which has led to accountability concerns regarding teacher preparation programs
4
(INTASC, 1995; Murray, 2000; Leithwood, Edge & Jantzi, 1999; NCATE 2000). Given
the substantial differences in the coherence, rigor, and focus seen in the mathematics
curriculum among the highest achieving countries as identified by the outstanding
performance of their students on international assessments, a critical question to be
addressed is, how do high performing countries prepare their teachers to teach challenging
curriculum to lower secondary students? This question was the motivation for the small-
scale Mathematics Teaching in the 21st Century study that contributed to the conceptual
framework and instrument development for the TEDS-M project (Schmidt, Tatto, Bankov,
Blömeke, Cedillo, Cogan, L., et al, 2007; Tatto, Schwille, Senk, Ingvarson, Peck, &
Rowley, 2008).
Apart from rankings of student performance, the value of international (cross-
national) comparative research stems from insight each participating country may gain
through comparisons with other systems and models. These comparisons from other
countries can help develop insights on policy that may help to improve education in one’s
own country.
The earlier MT21 project identified three distinct approaches across the six
participating countries to preparing lower secondary teachers of mathematics. The first
prepares teachers to teach all secondary mathematics – including the curriculum and
students of the lower secondary (middle school) grades. The second route focuses
specifically and exclusively on preparing teachers for the lower secondary/middle school
grades. The third approach prepares lower secondary/middle school teachers as an
extension of elementary teacher preparation. All three of these are represented among the
TEDS-M participating countries. While a few countries such as Chile, Germany, and
5
Norway combine two of these approaches to prepare all the needed teachers for lower
secondary mathematics, the U.S. is unique in having programs at various institutions in
different states that exemplify each of these three.
Two approaches for the preparation of primary teachers were found in Germany
and Poland. The first prepares generalists who, as in all of the other 15 TEDS-M countries
other than the U.S., teach mathematics along with most of the other subject areas included
in a primary curriculum. These teachers are not specifically trained to teach mathematics
but are prepared to teach mathematics only as one of the many topics they will be teaching.
The second approach in these two countries prepares future mathematics teachers as
specialists for the primary grades.
The U.S. also has two approaches but neither one focuses on the preparation of
specialists in mathematics. Actually one of the two approaches was described for lower
secondary teacher preparation where future teachers are prepared to teach grades 1 – 8
resulting in future teachers who could teach mathematics at the primary or middle school
level. The other approach focuses on preparing generalists for grades 1 – 5.
SAMPLE
Future Teachers near the end of their final year of teacher preparation were the
focus of the study. Two different assessments were used to measure what future teachers
knew about mathematics: one for those who had been prepared to teach mathematics at the
primary level and another for those who had been prepared to teach mathematics at the
lower secondary level. Three sampling approaches were used to obtain nationally
representative data for participating countries. A few countries such as Norway, Singapore,
6
and Thailand, obtained a census of all teacher preparation institutions in their country and a
census of all future teachers fitting the TEDS-M target population definitions. Other
countries such as Poland, Switzerland, and Taiwan, obtained a census of teacher
preparation institutions and randomly sampled from eligible future teachers. The last set of
countries including the Philippines, the Russian Federation, Spain, and the U.S. obtained
random samples of both teacher preparation institutions and eligible future teachers within
each teacher preparation institution. In each case, the specific sampling plan was developed
in consultation with the IEA sampling referee and deemed appropriate for representing the
country’s production of possible future teachers of mathematics2.
No attempt was made to adjust the data obtained from the groups of potential future
teachers to reflect who might actually end up teaching in the classroom. The national
recruitment and training contexts in each country vary considerably making any such
attempt difficult at best. Therefore, the focus of TEDS-M must be understood to be directly
on the preparation of potential future teachers of mathematics for either the primary or
lower secondary grades and not on characterizing the teaching force in general nor
necessarily those who enter the classroom for the first time. The total number of
participating institutions and future teachers for each country is listed in Display 1.
2 See the TEDS-M technical manual for a full description of project details including random sampling, translation,
weight creation, and quality control. A brief summary of the technical issues is included in Appendix A to this report.
7
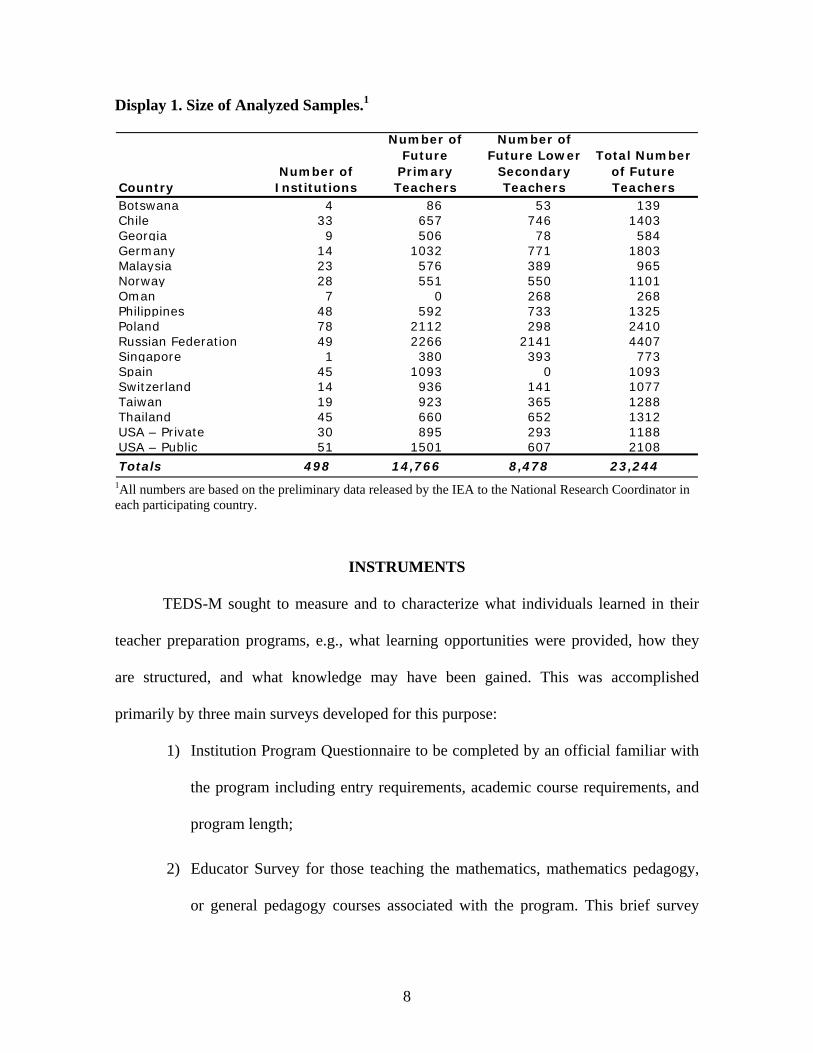
Display 1. Size of Analyzed Samples.1
CountryNumber of Institutions
Number of Future
Primary Teachers
Number of Future Lower
Secondary Teachers
Total Number of Future Teachers
Botswana 4 86 53 139Chile 33 657 746 1403Georgia 9 506 78 584Germany 14 1032 771 1803Malaysia 23 576 389 965Norway 28 551 550 1101Oman 7 0 268 268Philippines 48 592 733 1325Poland 78 2112 298 2410Russian Federation 49 2266 2141 4407Singapore 1 380 393 773Spain 45 1093 0 1093Switzerland 14 936 141 1077Taiwan 19 923 365 1288Thailand 45 660 652 1312USA – Private 30 895 293 1188USA – Public 51 1501 607 2108
Totals 498 14,766 8,478 23,244 1All numbers are based on the preliminary data released by the IEA to the National Research Coordinator in each participating country.
INSTRUMENTS
TEDS-M sought to measure and to characterize what individuals learned in their
teacher preparation programs, e.g., what learning opportunities were provided, how they
are structured, and what knowledge may have been gained. This was accomplished
primarily by three main surveys developed for this purpose:
1) Institution Program Questionnaire to be completed by an official familiar with
the program including entry requirements, academic course requirements, and
program length;
2) Educator Survey for those teaching the mathematics, mathematics pedagogy,
or general pedagogy courses associated with the program. This brief survey
8
included questions about their academic and professional background and the
type of learning activities employed in the courses taught; and
3) Future Teacher Survey and Assessment. These are described in more detail
below and the initial results presented in this report are derived solely from this
survey.
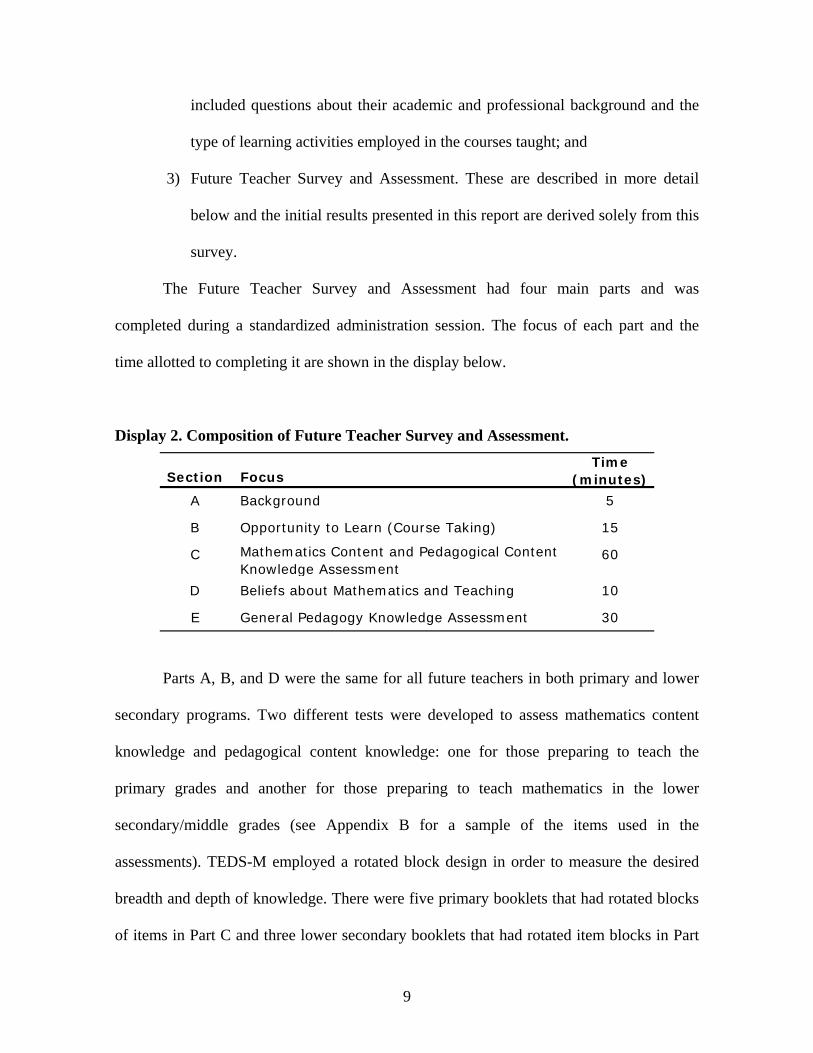
The Future Teacher Survey and Assessment had four main parts and was
completed during a standardized administration session. The focus of each part and the
time allotted to completing it are shown in the display below.
Display 2. Composition of Future Teacher Survey and Assessment.
Section FocusTime
(minutes)
A Background 5
B Opportunity to Learn (Course Taking) 15
C Mathematics Content and Pedagogical Content Knowledge Assessment
60
D Beliefs about Mathematics and Teaching 10
E General Pedagogy Knowledge Assessment 30
Parts A, B, and D were the same for all future teachers in both primary and lower
secondary programs. Two different tests were developed to assess mathematics content
knowledge and pedagogical content knowledge: one for those preparing to teach the
primary grades and another for those preparing to teach mathematics in the lower
secondary/middle grades (see Appendix B for a sample of the items used in the
assessments). TEDS-M employed a rotated block design in order to measure the desired
breadth and depth of knowledge. There were five primary booklets that had rotated blocks
of items in Part C and three lower secondary booklets that had rotated item blocks in Part
9

C. Rasch scaling was used to create individual scaled scores for each future teacher (see
Tatto, Schwille, Senk, Ingvarson, Peck, & Rowley, 2008, for details of item development,
cognitive domain frameworks, and scaling.) Results from Part E which was administered
only in Germany, Taiwan, and the U.S. are not included in this report but will be the focus
of a subsequent report.
REPORT ORGANIZATION
The report is organized around the two levels of most educational systems –
primary (elementary) and lower secondary (middle school). They share some similarities
but there also are some striking differences. The first story concerns elementary school
which, for most of the United States involves grades 1 – 5, however, for some states it also
includes grades 6-8. The story centers on the future teachers who are prepared to teach
those grades – who they are, what they studied, and what they know – see Chapter 2.
The second story also concerns future teachers but centers on those who are trained
specifically to teach mathematics at the lower secondary or middle school level, typically
grades 6 – 8. There are several variations across different states but the grade range across
the U.S. typically covers grades 5 – 9. This is the focus of Chapter 3. Chapter 4 examines
the variation across institutions while Chapter 5 looks at the policy implications.
10
CHAPTER 2
ELEMENTARY TEACHER PREPARATION RELATED TO THE TEACHING OF MATHEMATICS
The mathematics content knowledge measured in TEDS-M focused on the
mathematics supporting the topics that would typically be covered in grades 1 – 8. The test
itself, however, measured the type of advanced knowledge teachers should possess in order
to teach the more elementary topics typically included in the primary grades. In other
words the test itself was not about the mathematics that would be taught to the students but
about the mathematics related to and supporting those topics typically taught to children in
these early grades. The test itself was developed internationally reflecting what was viewed
as the international standard of mathematics knowledge that would be expected of future
teachers at the primary level.
WHAT THEY KNOW
International comparative studies present us with the temptation to focus on the
ranking of the countries. However, statistically this is not desirable since the rankings are
relatively unstable and the differences when characterized by rankings may well suggest
differences that are very small and insignificant among pairs of countries. For this reason,
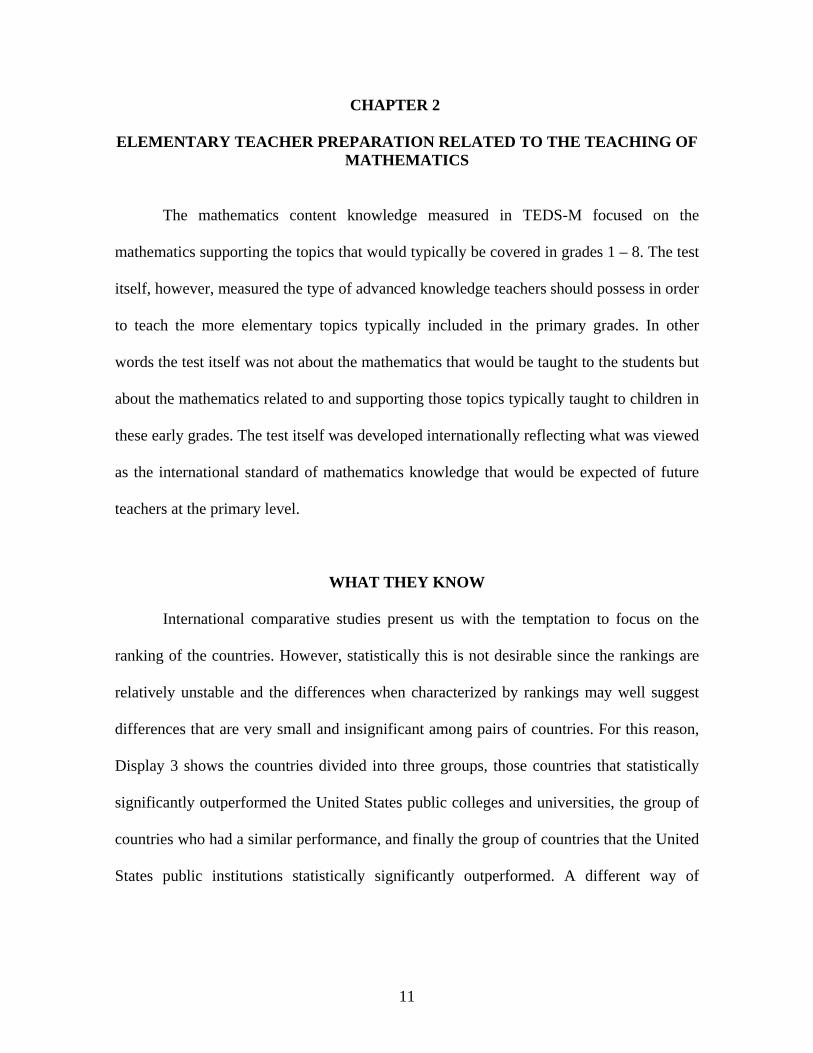
Display 3 shows the countries divided into three groups, those countries that statistically
significantly outperformed the United States public colleges and universities, the group of
countries who had a similar performance, and finally the group of countries that the United
States public institutions statistically significantly outperformed. A different way of
11
representing these results, characterizing not only the mean but the full distribution
together with the estimated confidence intervals, is given in Appendix C.
Display 3. TEDS-M Countries’ Overall Performance with Respect to Mathematics Content Knowledge at the Primary Level.
Country Mn (se) Taiwan 623 (4.2) Singapore 590 (3.1) Switzerland 543 (1.9) Russian Federation 535 (9.9) Thailand 528 (2.3) United States-Private 527 (3.6) Norway 519 (2.6) United States-Public 518 (4.1) Germany 510 (2.7) Poland 490 (2.2) Malaysia 488 (1.8) Spain 481 (2.6) Botswana 441 (5.9) Philippines 440 (7.6) Chile 413 (2.1) Georgia 345 (3.9)
Significantly above US-Public Not significantly different from US-Public
Significantly below US-Public
Looking at the display, the United States is found somewhat near the middle of the
international distribution suggesting a performance similar to that of Germany, Norway
and the Russian Federation, but not at a level of performance consistent with the top-
achieving countries such as Taiwan, Singapore and Switzerland. This would suggest the
mathematical content knowledge of future teachers in the United States is neither
distinctive in terms of being particularly low, nor being particularly strong. In any case this
is not, where we as a nation would like the knowledge level of our primary teachers to be.
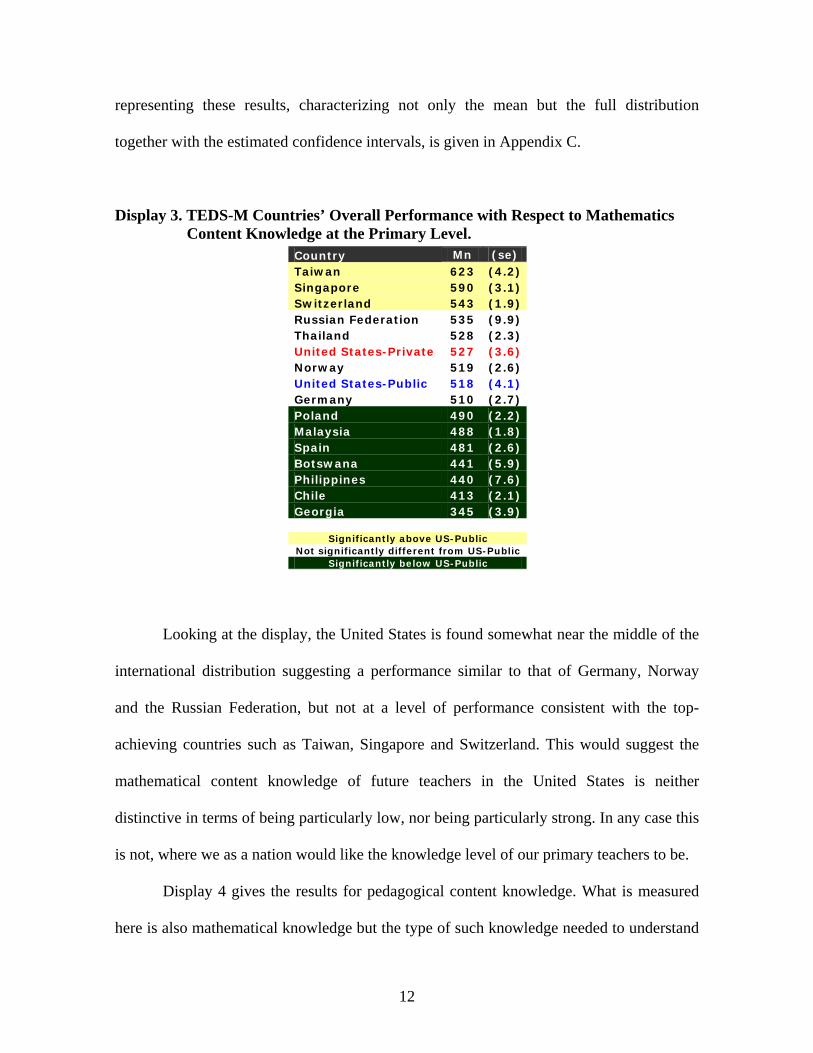
Display 4 gives the results for pedagogical content knowledge. What is measured
here is also mathematical knowledge but the type of such knowledge needed to understand
12
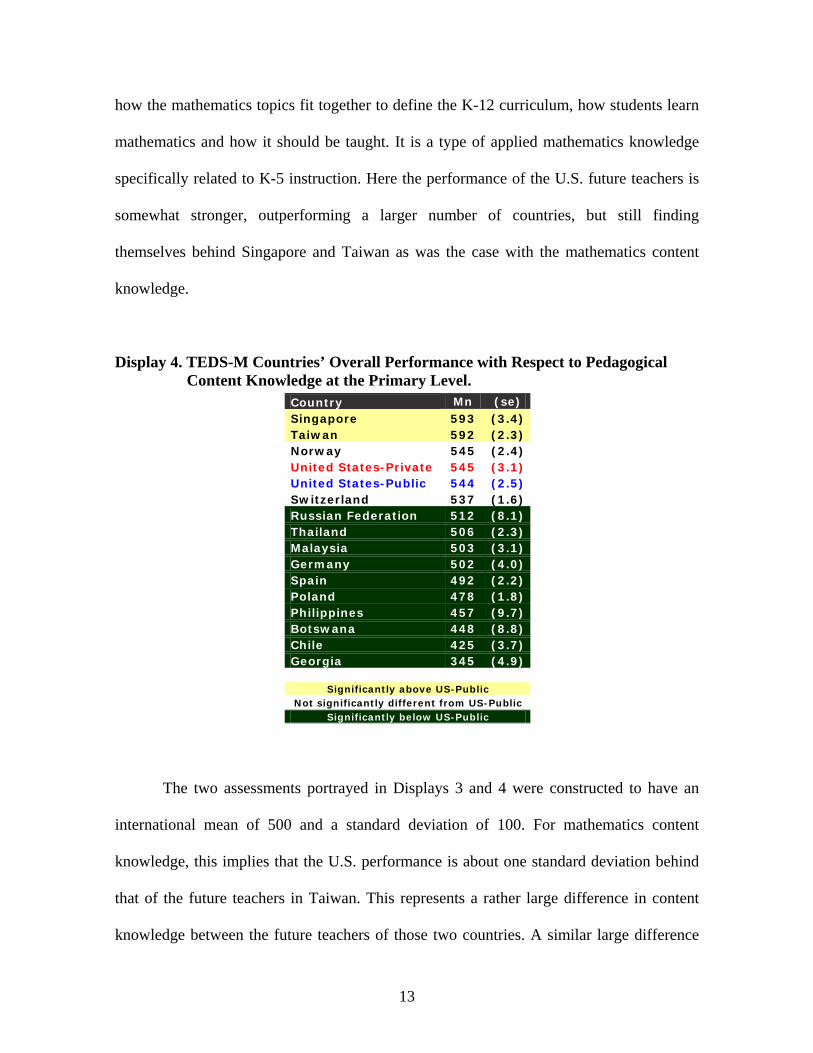
how the mathematics topics fit together to define the K-12 curriculum, how students learn
mathematics and how it should be taught. It is a type of applied mathematics knowledge
specifically related to K-5 instruction. Here the performance of the U.S. future teachers is
somewhat stronger, outperforming a larger number of countries, but still finding
themselves behind Singapore and Taiwan as was the case with the mathematics content
knowledge.
Display 4. TEDS-M Countries’ Overall Performance with Respect to Pedagogical Content Knowledge at the Primary Level.
Country Mn (se) Singapore 593 (3.4) Taiwan 592 (2.3) Norway 545 (2.4) United States-Private 545 (3.1) United States-Public 544 (2.5) Switzerland 537 (1.6) Russian Federation 512 (8.1) Thailand 506 (2.3) Malaysia 503 (3.1) Germany 502 (4.0) Spain 492 (2.2) Poland 478 (1.8) Philippines 457 (9.7) Botswana 448 (8.8) Chile 425 (3.7) Georgia 345 (4.9)
Significantly above US-Public Not significantly different from US-Public
Significantly below US-Public
The two assessments portrayed in Displays 3 and 4 were constructed to have an
international mean of 500 and a standard deviation of 100. For mathematics content
knowledge, this implies that the U.S. performance is about one standard deviation behind
that of the future teachers in Taiwan. This represents a rather large difference in content
knowledge between the future teachers of those two countries. A similar large difference
13
exists with respect to Singapore as well. Display 3 indicates the relative country positions
with respect to the overall mathematics content knowledge scale.
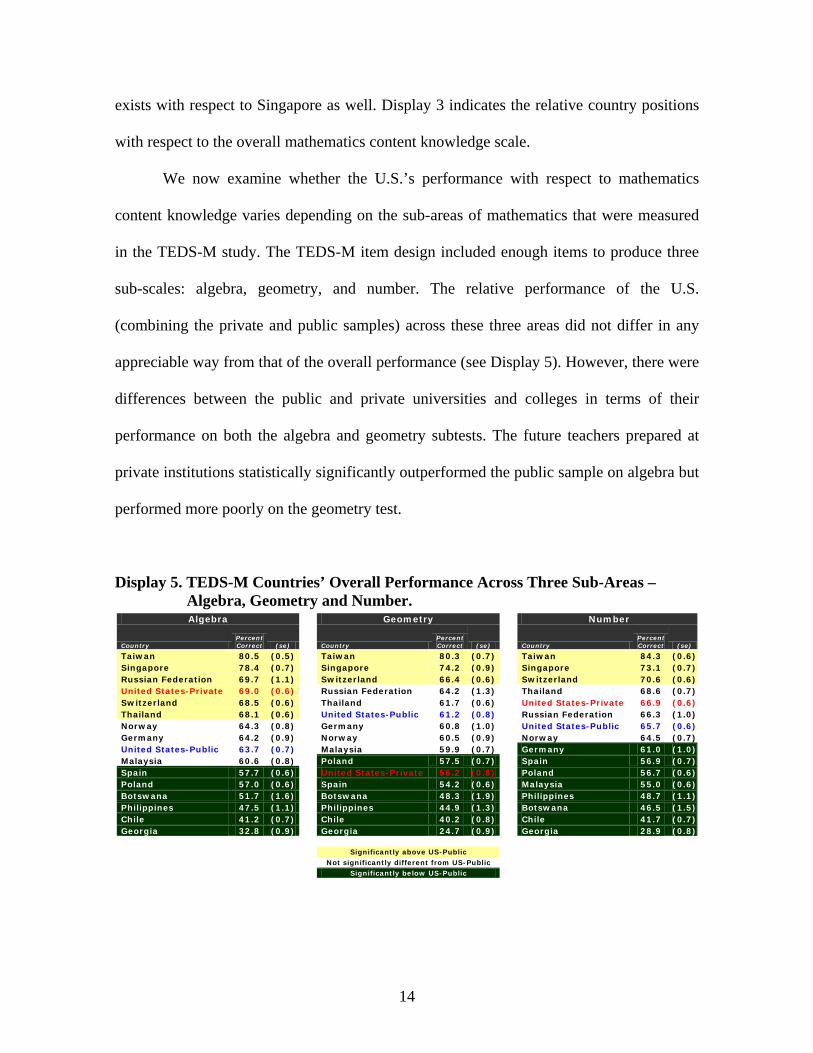
We now examine whether the U.S.’s performance with respect to mathematics
content knowledge varies depending on the sub-areas of mathematics that were measured
in the TEDS-M study. The TEDS-M item design included enough items to produce three
sub-scales: algebra, geometry, and number. The relative performance of the U.S.
(combining the private and public samples) across these three areas did not differ in any
appreciable way from that of the overall performance (see Display 5). However, there were
differences between the public and private universities and colleges in terms of their
performance on both the algebra and geometry subtests. The future teachers prepared at
private institutions statistically significantly outperformed the public sample on algebra but
performed more poorly on the geometry test.
Display 5. TEDS-M Countries’ Overall Performance Across Three Sub-Areas – Algebra, Geometry and Number. Algebra Geometry Number
Country Percent Correct (se) Country
Percent Correct (se) Country
Percent Correct (se)
Taiwan 80.5 (0.5) Taiwan 80.3 (0.7) Taiwan 84.3 (0.6) Singapore 78.4 (0.7) Singapore 74.2 (0.9) Singapore 73.1 (0.7) Russian Federation 69.7 (1.1) Switzerland 66.4 (0.6) Switzerland 70.6 (0.6) United States-Private 69.0 (0.6) Russian Federation 64.2 (1.3) Thailand 68.6 (0.7) Switzerland 68.5 (0.6) Thailand 61.7 (0.6) United States-Private 66.9 (0.6) Thailand 68.1 (0.6) United States-Public 61.2 (0.8) Russian Federation 66.3 (1.0) Norway 64.3 (0.8) Germany 60.8 (1.0) United States-Public 65.7 (0.6) Germany 64.2 (0.9) Norway 60.5 (0.9) Norway 64.5 (0.7) United States-Public 63.7 (0.7) Malaysia 59.9 (0.7) Germany 61.0 (1.0) Malaysia 60.6 (0.8) Poland 57.5 (0.7) Spain 56.9 (0.7)
United States-Private 56.2 (0.8) Spain 57.7 (0.6) Poland 56.7 (0.6) Poland 57.0 (0.6) Spain 54.2 (0.6) Malaysia 55.0 (0.6) Botswana 51.7 (1.6) Botswana 48.3 (1.9) Philippines 48.7 (1.1) Philippines 47.5 (1.1) Philippines 44.9 (1.3) Botswana 46.5 (1.5) Chile 41.2 (0.7) Chile 40.2 (0.8) Chile 41.7 (0.7) Georgia 32.8 (0.9) Georgia 24.7 (0.9) Georgia 28.9 (0.8) Significantly above US-Public Not significantly different from US-Public Significantly below US-Public
14
With respect to pedagogical content knowledge, there were also three sub-scales
dealing with the future teachers’ knowledge of the K-8 curriculum; the pedagogical
knowledge related to instructional practices in the classroom, and finally, knowledge
related to the planning of instruction. Here again the future teachers performed at about the
same level in all three of these sub-areas and similar to that of the overall scale. In effect,
what this suggests is that the knowledge of the U.S. future elementary teachers, both in
terms of mathematics content as well as pedagogical content related to mathematics, is
neither weak nor particularly strong when placed in an international context. The overall
scale-scores were consistent with the sub-areas for the country as a whole suggesting that
the results indicated in Displays 3 and 4 essentially characterize the country differences
and the relative position of the United States with respect to that international distribution.
It is clearly not where we want our teachers’ knowledge level to be in order to be able to
teach the more demanding curriculum put forth by the National Governors Association
(NGA) and Council of Chief State School Officers (CCSSO). The standards defining this
curriculum, called the “Common Core,” are being considered for adoption by 48 states.
Perhaps, not surprisingly, the performance of the U.S. elementary future teachers
internationally is quite consistent with the performance of third and fourth graders in the
TIMSS studies – mired near the international mean. The data characterized in the previous
displays represent the United States as a whole. Teacher preparation at the elementary level
as indicated previously can be done through at least two types of programs – elementary
programs focused on grades 1 – 5 and secondly elementary programs allowing for
certification up through grade 8. Actually the number of different types of programs is
much larger, but to make the study manageable, the elementary certification programs
15
were classified into these two broad types. The main question behind the TEDS-M
research project was to understand the relationship of various teacher preparation programs
with respect to the knowledge acquired during that preparation program. Ultimately in one
sense the question was: does teacher education matter, at least in terms of the knowledge
acquired during the preparation program?
We now look at the relationship of the two different types of elementary teacher
preparation programs in terms of their relationship to knowledge of mathematics content
and knowledge of mathematics pedagogy. In addition, we look more closely as to whether
there is any difference between the teacher preparation programs provided by public versus
private universities and colleges.
Consider first, mathematics content knowledge: the difference between the two
types of programs was relatively small. In fact, for the public institutions, the difference in
the two means was trivial – 520 versus 518 with the higher average score associated with
those programs allowing certification up through middle school. For the private institutions
the difference was more substantial with a difference of 8 points (533 versus 525).
Although larger, the differences are not statistically significant. A similar pattern emerges
with respect to the pedagogical content knowledge, where the difference between the two
program types for the public universities was again trivial, but with respect to the private
institutions, the difference was substantial. The average test score of those prepared to be
certified at the K-8 level was 16 points higher than was the case for those prepared to teach
only at the primary level (558 versus 542).
It is interesting to note that with respect to teacher preparation at public universities
and colleges there were essentially no differences between the two types of preparation
16
programs, but this was not the case for the private institutions where the differences
between the two programs for both the content knowledge and the pedagogical content
knowledge favored those prepared to be able to teach at both the primary and middle
school level.
The other major dimension we examined is the difference between public and
private teacher preparation itself. This comparison was confounded by the fact that
typically the students entering private universities have higher levels of mathematics
knowledge upon entering the university. So the differences that might be noted with
respect to what the future teachers knew as they left their programs, especially in
mathematics content knowledge, could be influenced by the entry level knowledge of those
students.
Ignoring this caveat for the moment, Display 3 indicates that with respect to
mathematics content knowledge the future teachers prepared through private universities
and colleges scored about 8 points higher than their counterparts at public institutions of
higher learning. The difference, however, was not statistically significant. For pedagogical
content knowledge, the difference between the preparation programs in the two types of
universities was negligible and not significant. The latter is not surprising since one would
imagine that most of the pedagogical content knowledge that students would have at the
end of their programs would have come primarily through those preparation programs not
through course experiences in the K-12 system. However, the mathematics content
knowledge could have been influenced by the level of knowledge of those students as they
entered the teacher preparation program. As mentioned previously there likely would be
such differences given the U.S. admissions procedures associated with college attendance.
17
In fact, the data show that there are such differences on average between those
students who enter teacher preparation programs at private universities and colleges versus
those who enter such programs at public institutions. The data upon which that is based are
of three types. We used the Barron rankings of university prestige as one such measure.
Additionally we used the 25th and 75th percentiles of ACT scores for those matriculating
at the universities. Finally we also have from the students themselves an indication of the
highest level of mathematics they took while in high school. Using those three variables
we found statistically significant differences between public and private schools with the
differences in the expected direction. We then adjusted the TEDS-M scale scores for these
initial differences and the small, insignificant differences were eliminated after adjusting
for these entry level differences. In other words, the apparent and small differences in
mathematics content knowledge of the future teachers upon finishing their teacher
preparation programs was probably more the result of the differences in admission
procedures between the two types of universities and colleges and not some systemic
difference in the nature of teacher preparation between the public and private sector.
WHAT THEY STUDIED: CHARACTERIZING FUTURE TEACHER COURSE
TAKING
The previous section characterized the mathematics knowledge of U.S. future
elementary teachers as being somewhat adequate as represented by their relative position
in the international distribution but also suggested that the level of knowledge does not put
them where we would hope they might be, that is among the top performing countries. The
desire that these future elementary teachers would possess higher levels of mathematics
18
knowledge is especially important as this nation confronts the international realities
suggested by PISA and TIMSS detailing how far behind we are. In addition, the TIMSS
curriculum analysis has pointed out that our K-12 curricular expectations are not
competitive internationally.
The U.S. has recently responded calling for curriculum that are focused, coherent,
and rigorous. The new “Common Core” standards put forth by NGA and CCSSO have
such high level expectations for students. As these standards are adopted by the states, this
places an increasingly high level of demand that our teachers have a more sophisticated
and deeper understanding of mathematics.
How can we as a nation meet that challenge? That question can be addressed by
focusing on the curricular experiences that the future elementary teachers had while in
their teacher preparation programs. Our hypothesis was that the differences among the
countries would be related at least in part to differences in terms of the experiences and
course requirements that these students had while part of those teacher preparation
programs. In this section we examine that issue.
Future teachers were asked which courses they took in each of three areas – formal
mathematics, mathematics pedagogy and general pedagogy. Mathematics content was
defined in the traditional way and there was little difficulty internationally in specifying
those topic areas. Future teachers were asked to indicate whether they had studied each of
15 different content topics associated with university level mathematics. These included
such things as: calculus, differential equations, linear algebra, topology, real analysis, and
probability, among others. In many of the countries including the U.S., these various topics
would represent particular courses but in other countries, these were topics that could have
19
been covered in multiple courses. Consequently, there is an ambiguity as to whether the
sum of these represents the total number of courses taken or the total number of topics
studied while in their preparation programs. Whichever the case, the indicator suggests the
amount of exposure to the area of formal mathematics. In describing these results we refer
to them as courses, which is essentially the way they would typically be designated here in
the United States, although the reader should keep in mind the caveat that in some places
these are not formal courses but simply topics covered as a part of multiple courses.
Course work in mathematics pedagogy included courses on the foundations of
mathematics including the philosophical underpinnings of mathematics, the history of
school mathematics, the development of mathematical ability and thinking in children. It
also included methods of teaching mathematics, practical experiences with respect to
developing, and forming instructional lesson plans for the teaching of mathematics, as well
as practical experiences such as teaching elementary students or observing them in their
classes as they are taught mathematics.
The third area was general pedagogy and included traditional courses such as the
history, philosophy, and sociology of education, as well as educational psychology. Also
included were courses focusing on generalized methods of teaching as well as classroom
management. In both general pedagogy and mathematics pedagogy these are likely to be
different topics that might be considered in one or more courses of pedagogy but, again,
they represent the breadth of exposure to various areas of pedagogy and are used in that
vein. Again for simplicity sake we refer to these as the number of courses.
20
We look first at the relative allocation of course work across the three areas as
reported by the future teachers. It is our belief that the allocation of the limited amount of
time – typically four years of course work – across the three areas is one of the key, if not
the central, policy issue confronting teacher preparation.
Such relative allocations serve in some way as an institutional definition of what
constitutes quality teacher preparation. Surely all teacher preparation institutions have as
their goal to prepare a high quality future primary teacher. What the relative allocation
across the three areas defines, no matter how many total hours might be required for the
program, is their definition of the type of expertise future teachers should possess as they
finish their teacher preparation program.
For the U.S. the distribution across the three areas is roughly characterized as one-
third, one-third, one-third. More specifically, mathematics course work constituted
somewhere around 29-34% of the teacher preparation course taking (ignoring other course
work such as liberal arts, electives, etc.) with about 35% focused on mathematics
pedagogy. The remaining 32-35% focused on general pedagogy.
U.S. private institutions devoted more time to pedagogy, both general and
mathematics pedagogy, but not by a large amount. However, the public university teacher
preparation programs devoted conversely, more time to course taking in mathematics. So
in general, given the small differences between public and private teacher preparation
programs we can approximate the time distribution as a one-third allocation across the
three areas implying that students took about the same amount of course work in all three
areas.
21
How does this compare with the other countries, especially those whose future
teachers performed particularly well on the mathematics content and pedagogical content
knowledge tests? The distributions were very similar. The average across the top achieving
countries showed a slightly greater allocation in mathematics and correspondingly less in
the general pedagogy area. The differences, however, were not substantial. For example,
Taiwanese future teachers on average had a ratio that approximated a 38/34/28 percent
time allocation across the three areas, thus implying slightly more mathematics course
work taken as a part of the preparation program. Singapore’s distribution can be
summarized as a 35/40/25 percent distribution. To understand the different opportunities
provided by teacher preparation programs in Taiwan and Singapore as opposed to the U.S.
we focused on specific course taking differences among countries.
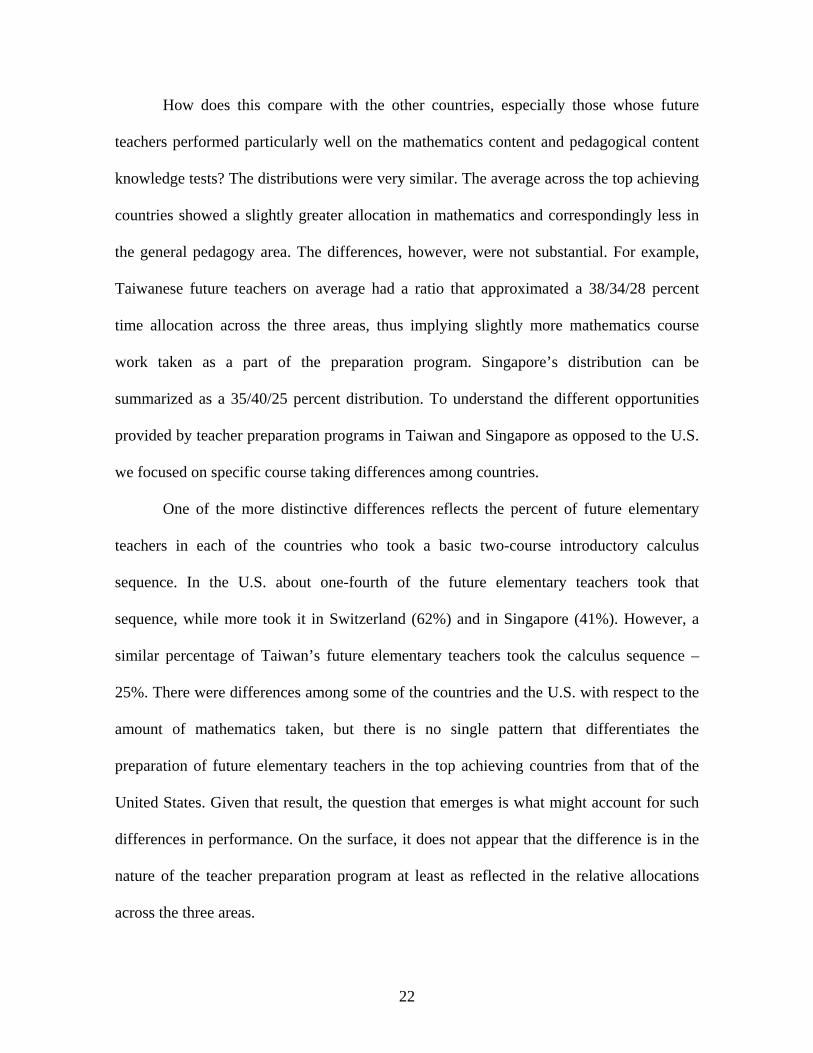
One of the more distinctive differences reflects the percent of future elementary
teachers in each of the countries who took a basic two-course introductory calculus
sequence. In the U.S. about one-fourth of the future elementary teachers took that
sequence, while more took it in Switzerland (62%) and in Singapore (41%). However, a
similar percentage of Taiwan’s future elementary teachers took the calculus sequence –
25%. There were differences among some of the countries and the U.S. with respect to the
amount of mathematics taken, but there is no single pattern that differentiates the
preparation of future elementary teachers in the top achieving countries from that of the
United States. Given that result, the question that emerges is what might account for such
differences in performance. On the surface, it does not appear that the difference is in the
nature of the teacher preparation program at least as reflected in the relative allocations
across the three areas.
22

This leads to an hypothesis that for primary future teachers, the differences among
countries may simply go back to the fact that the pool from which future teachers are
selected within each of those nations differs. In other words, from international studies, we
know that the country distributions of mathematics achievement are quite different. For
example, we used international TIMSS eighth grade mathematics data to define the pool
from which primary future teachers would be drawn. We can then make assumptions as to
where in that distribution the U.S. typically draws its primary teachers and then compare
that to the distribution for Taiwan and Singapore as representatives of the top achieving
TEDS-M countries. Given that all three of the countries are on a common international
scale, this makes such analyses possible.
For example, if Taiwan and Singapore were to draw their future elementary
teachers from the middle of their distributions (the 50th percentile) as represented by the
eighth grade TIMSS 2003 results, this would correspond to the U.S.’s having to draw its
future elementary teachers from above the 75th percentile –actually closer to the 85th –
90th percentile – to be comparable in their entry level knowledge of mathematics (see
Display 6). The pool from which future elementary teachers are drawn in those three
countries is radically different, and those differences may well account for the differences
at the end of teacher preparation, more so than the differences among the countries in terms
of their teacher preparation requirements and the actual course taking. This implies that an
important issue is one of recruitment and admission policies. So, for example, even if
Taiwan were drawing its pool of future elementary teachers from somewhere below its
country mean, in order for the U.S. to be comparable, the U.S. would have to draw its pool
23
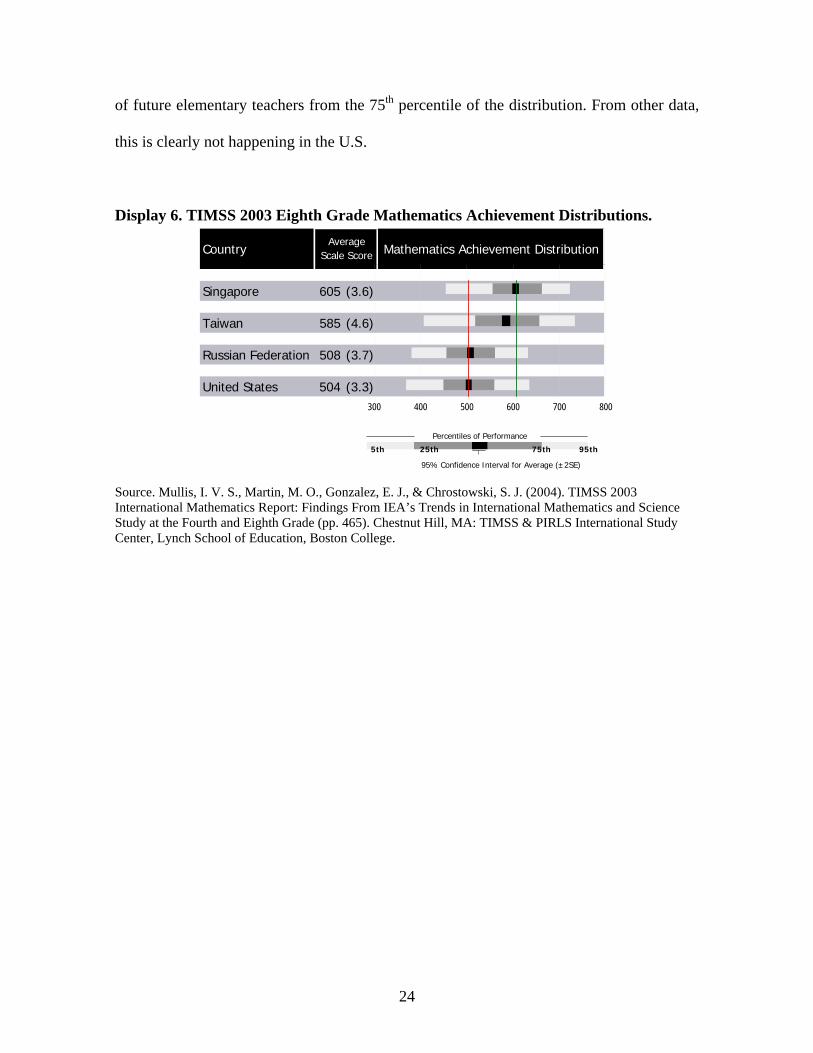
of future elementary teachers from the 75th percentile of the distribution. From other data,
this is clearly not happening in the U.S.
Display 6. TIMSS 2003 Eighth Grade Mathematics Achievement Distributions.
Country Mathematics Achievement Distribution
X XSingapore 605 (3.6)
X XTaiwan 585 (4.6)
X XRussian Federation 508 (3.7)
X XUnited States 504 (3.3)
AverageScale Score
300 400 500 600 700 800
75th 95th5th 25th
95% Confidence Interval for Average (±2SE)
Percentiles of Performance
Source. Mullis, I. V. S., Martin, M. O., Gonzalez, E. J., & Chrostowski, S. J. (2004). TIMSS 2003 International Mathematics Report: Findings From IEA’s Trends in International Mathematics and Science Study at the Fourth and Eighth Grade (pp. 465). Chestnut Hill, MA: TIMSS & PIRLS International Study Center, Lynch School of Education, Boston College.
24
CHAPTER 3
MIDDLE SCHOOL TEACHER PREPARATION
WHAT THEY KNOW
We now turn our attention to the preparation of future middle school teachers of
mathematics. Here the focus is only on mathematics teachers, whereas at the primary level
just described teachers were typically prepared to teach all subjects and not exclusively for
mathematics instruction. As a result one would expect a greater focus and concentration on
mathematics course taking and preparation than was the case for elementary future
teachers.
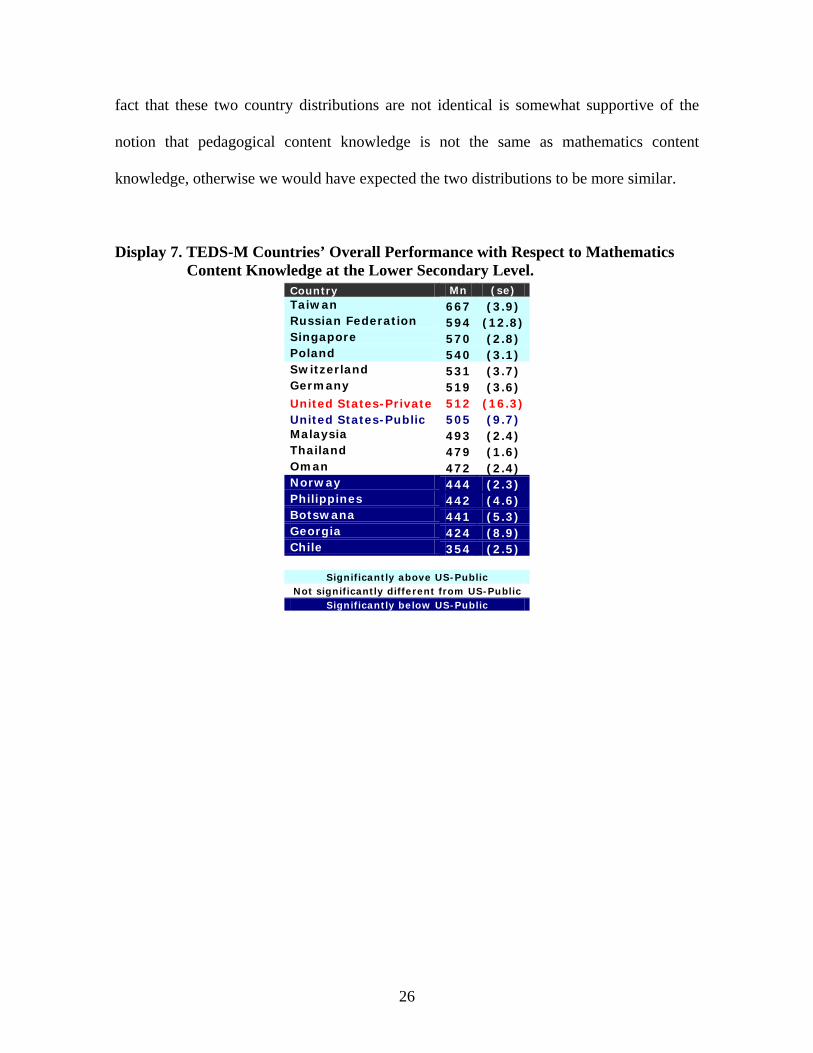
Displays 7 and 8 give the results for mathematics content knowledge (focusing on
the mathematics that provides the background that supports the topics typically taught at
the lower to upper secondary level internationally) and pedagogical content knowledge for
future middle school teachers. Here the story is much more disconcerting than was the case
for elementary future teachers as U.S. future middle school teachers, both public and
private, found themselves on mathematics content knowledge, in the middle of the
international distribution dividing the TEDS-M countries into two distinct groups, those
countries whose middle school students do better than the U.S. on international tests and
those who don’t – the only exception being Malaysia.
Those countries that outperformed the United States include: Taiwan, the Russian
Federation, Singapore, Poland, Switzerland and Germany although for Switzerland and
Germany the differences were not statistically significant. Display 8 shows the same
results for pedagogical content knowledge, which yields much the same set of results. The
25
fact that these two country distributions are not identical is somewhat supportive of the
notion that pedagogical content knowledge is not the same as mathematics content
knowledge, otherwise we would have expected the two distributions to be more similar.
Display 7. TEDS-M Countries’ Overall Performance with Respect to Mathematics Content Knowledge at the Lower Secondary Level.
Country Mn (se) Taiwan 667 (3.9) Russian Federation 594 (12.8) Singapore 570 (2.8) Poland 540 (3.1) Switzerland 531 (3.7) Germany 519 (3.6) United States-Private 512 (16.3) United States-Public 505 (9.7) Malaysia 493 (2.4) Thailand 479 (1.6) Oman 472 (2.4) Norway 444 (2.3) Philippines 442 (4.6) Botswana 441 (5.3) Georgia 424 (8.9) Chile 354 (2.5)
Significantly above US-Public Not significantly different from US-Public
Significantly below US-Public
26

Display 8. TEDS-M Countries’ Overall Performance with Respect to Pedagogical Content Knowledge at the Lower Secondary Level.
Country Mn (se)
Taiwan 649 (5.2) Russian Federation 566 (10.1) Singapore 553 (4.7) Switzerland 549 (5.9) Germany 540 (5.1) Poland 524 (4.2) United States-Private 505 (13.0) United States-Public 502 (8.7) Thailand 476 (2.5) Oman 474 (3.8) Malaysia 472 (3.3) Norway 463 (3.4) Philippines 450 (4.7) Georgia 443 (9.6) Botswana 425 (8.2) Chile 394 (3.8)
Significantly above US-Public Not significantly different from US-Public
Significantly below US-Public
The story for the United States is serious. Given that these are future teachers of
mathematics, it is rather disconcerting that the future Taiwanese teachers scored over one
and a half standard deviations higher on the mathematics content knowledge test. This is a
substantially large difference in performance between the United States and Taiwan. For
the Russian Federation and Singapore their future teachers outperformed those of the
United States by a half a standard deviation or more. The parallelism of the results between
the knowledge base of the future teachers and the corresponding knowledge level of those
whom they will teach is most likely more than just a coincidence.
Display 9 shows the results for mathematics content knowledge on the three
subtests where the metric is again as with the elementary teachers the percent correct. As
was the case previously there are no major differences in performance across the various
27
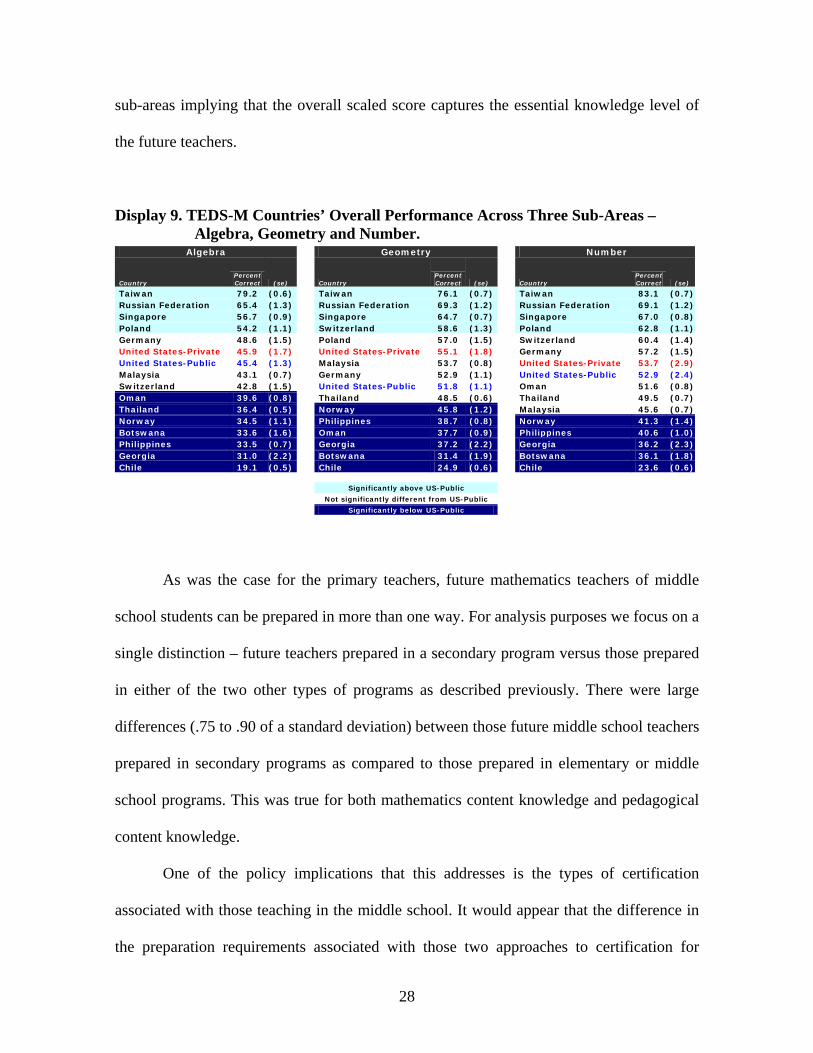
sub-areas implying that the overall scaled score captures the essential knowledge level of
the future teachers.
Display 9. TEDS-M Countries’ Overall Performance Across Three Sub-Areas – Algebra, Geometry and Number.
Algebra Geometry Number
Country Percent Correct (se) Country
Percent Correct (se) Country
Percent Correct (se)
Taiwan 79.2 (0.6) Taiwan 76.1 (0.7) Taiwan 83.1 (0.7) Russian Federation 65.4 (1.3) Russian Federation 69.3 (1.2) Russian Federation 69.1 (1.2) Singapore 56.7 (0.9) Singapore 64.7 (0.7) Singapore 67.0 (0.8) Poland 54.2 (1.1) Switzerland 58.6 (1.3) Poland 62.8 (1.1) Germany 48.6 (1.5) Poland 57.0 (1.5) Switzerland 60.4 (1.4) United States-Private 45.9 (1.7) United States-Private 55.1 (1.8) Germany 57.2 (1.5) United States-Public 45.4 (1.3) Malaysia 53.7 (0.8) United States-Private 53.7 (2.9) Malaysia 43.1 (0.7) Germany 52.9 (1.1) United States-Public 52.9 (2.4) Switzerland 42.8 (1.5) United States-Public 51.8 (1.1) Oman 51.6 (0.8) Oman 39.6 (0.8) Thailand 48.5 (0.6) Thailand 49.5 (0.7) Thailand 36.4 (0.5) Norway 45.8 (1.2) Malaysia 45.6 (0.7) Norway 34.5 (1.1) Philippines 38.7 (0.8) Norway 41.3 (1.4) Botswana 33.6 (1.6) Oman 37.7 (0.9) Philippines 40.6 (1.0) Philippines 33.5 (0.7) Georgia 37.2 (2.2) Georgia 36.2 (2.3) Georgia 31.0 (2.2) Botswana 31.4 (1.9) Botswana 36.1 (1.8) Chile 19.1 (0.5) Chile 24.9 (0.6) Chile 23.6 (0.6) Significantly above US-Public
Not significantly different from US-Public
Significantly below US-Public
As was the case for the primary teachers, future mathematics teachers of middle
school students can be prepared in more than one way. For analysis purposes we focus on a
single distinction – future teachers prepared in a secondary program versus those prepared
in either of the two other types of programs as described previously. There were large
differences (.75 to .90 of a standard deviation) between those future middle school teachers
prepared in secondary programs as compared to those prepared in elementary or middle
school programs. This was true for both mathematics content knowledge and pedagogical
content knowledge.
One of the policy implications that this addresses is the types of certification
associated with those teaching in the middle school. It would appear that the difference in
the preparation requirements associated with those two approaches to certification for
28
teaching mathematics in middle school has major implications in terms of what the
students may have in the way of opportunities to learn more difficult mathematics such as
is suggested by the new “Common Core” standards. The result of such differential levels
of knowledge raises a question of equality of opportunity for middle school students
depending on the preparation of their teachers.
The other distinction we examined as was the case with primary teachers is whether
there are any differences in teacher preparation between the public and private universities
and colleges. The simple answer is that there were no statistically significant differences at
the secondary level nor at the other two levels between public and private schooling in
terms of the mathematics content knowledge that they have upon completing their
program.
WHAT THEY STUDIED: CHARACTERIZING FUTURE TEACHER COURSE TAKING
We turn to what future middle school teachers told us in terms of their relative
distribution of coursework across the 40 topics listed in the questionnaires. The two top
achieving countries, Taiwan and the Russian Federation had, on average, a rounded ratio
across the three areas of formal mathematics, mathematics pedagogy, and general
pedagogy of 50/30/20 percent. In other words, half (actually 48.5%) of the indicated
courses or topics that the students took were in the area of mathematics, with the remaining
half split between the two types of pedagogy. The greater emphasis within the pedagogy
area was with respect to mathematics pedagogy which represented 60% of the pedagogy
courses taken.
29

By contrast, the average ratio for the United States was approximately 40/30/30,
indicating 40% (actually 38%) of the coursework taken being allocated to mathematics. It
is interesting to note the percentage of course work focusing on mathematics pedagogy
was the same but the amount allocated to general pedagogy was higher in the United States
compensating for the lower amount allocated to the study of formal mathematics. That
difference represents a significant amount in terms of a four year preparation program.
Recall that the relative emphasis in primary programs was approximately one-third across
the three areas. Given the traditional unchallenging nature of the U.S. middle school
mathematics curriculum perhaps it isn’t much of a surprise that those who are preparing to
teach mathematics in these grades receive not much more of an emphasis in mathematics
than their counterparts preparing to teach at the elementary level.
What were some of the differences between the United States and the top-achieving
countries in terms of specific course taking? Two of the biggest differences in course
taking occur for courses that serve as an introduction to the more formal aspects of
mathematics. These include linear algebra and a basic year long sequence in calculus.
While the four highest achieving countries had on average 80-100% of their future teachers
taking these three courses, in the United States only about two-thirds of the future middle
school mathematics teachers took linear algebra and around 50-60% took the basic two-
course sequence in calculus.
Differences also existed in other areas of mathematics preparation such as the
number of advanced mathematics courses taken. The six top-achieving countries took two
more courses in this area on average than did U.S. future middle school mathematics
teachers. However, these U.S. future teachers took more Education Foundation courses
30
covering topics such as the history of education, sociology of education, or educational
psychology than any of those that outperformed them except for the future teachers in the
Russian Federation. This may be explained, in part, by the fact that those in the Russian
Federation reported taking more courses (topics) in all areas than the future teachers in any
other country.
31
CHAPTER 4
VARIATION AMONG U.S. TEACHER PREPARATION INSTITUTIONS
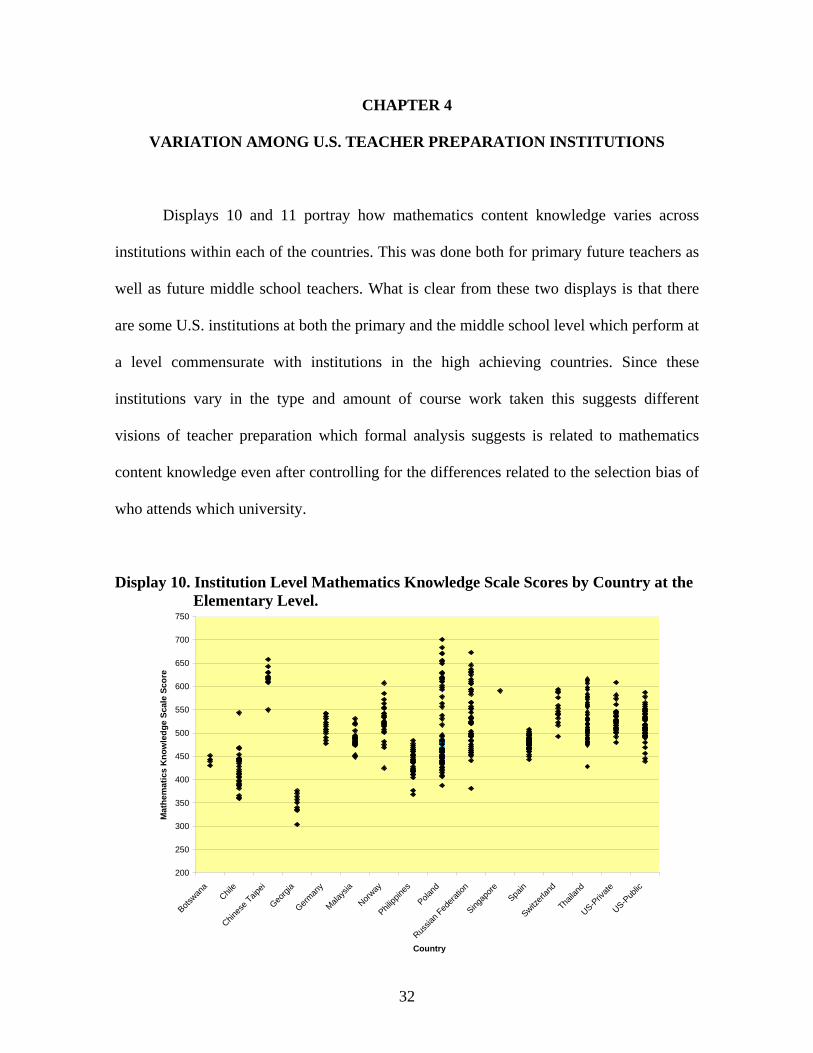
Displays 10 and 11 portray how mathematics content knowledge varies across
institutions within each of the countries. This was done both for primary future teachers as
well as future middle school teachers. What is clear from these two displays is that there
are some U.S. institutions at both the primary and the middle school level which perform at
a level commensurate with institutions in the high achieving countries. Since these
institutions vary in the type and amount of course work taken this suggests different
visions of teacher preparation which formal analysis suggests is related to mathematics
content knowledge even after controlling for the differences related to the selection bias of
who attends which university.
Display 10. Institution Level Mathematics Knowledge Scale Scores by Country at the Elementary Level.
200
250
300
350
400
450
500
550
600
650
700
750
Botswan
aChil
e
Chines
e Taip
ei
Georgi
a
German
y
Malays
ia
Norway
Philipp
ines
Poland
Russia
n Fed
eratio
n
Singap
oreSpa
in
Switzerl
and
Thaila
nd
US-Priv
ate
US-Pub
lic
Country
Mat
hem
atic
s K
now
ledg
e Sc
ale
Scor
e
32
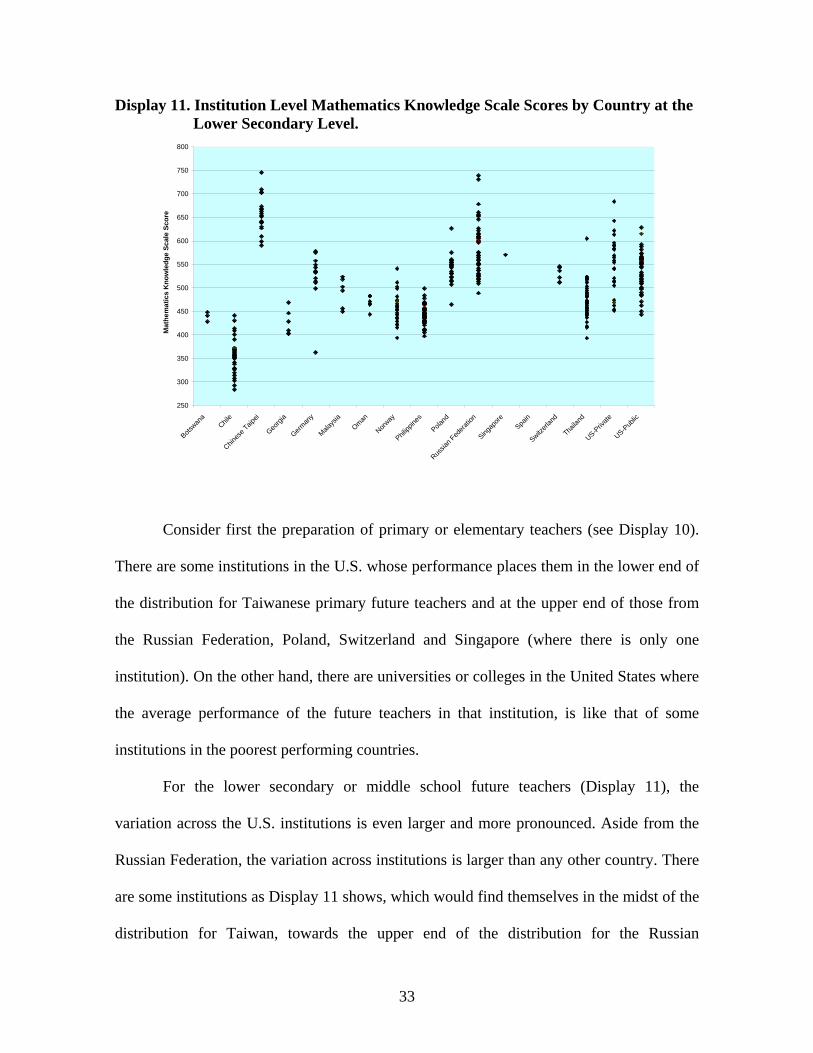
Display 11. Institution Level Mathematics Knowledge Scale Scores by Country at the Lower Secondary Level.
250
300
350
400
450
500
550
600
650
700
750
800
Botswan
aChil
e
Chines
e Taip
ei
Georgi
a
German
y
Malays
iaOman
Norway
Philipp
ines
Poland
Russia
n Fed
eratio
n
Singap
oreSpa
in
Switzerl
and
Thaila
nd
US-Priv
ate
US-Pub
lic
Mat
hem
atic
s K
now
ledg
e Sc
ale
Scor
e
Consider first the preparation of primary or elementary teachers (see Display 10).
There are some institutions in the U.S. whose performance places them in the lower end of
the distribution for Taiwanese primary future teachers and at the upper end of those from
the Russian Federation, Poland, Switzerland and Singapore (where there is only one
institution). On the other hand, there are universities or colleges in the United States where
the average performance of the future teachers in that institution, is like that of some
institutions in the poorest performing countries.
For the lower secondary or middle school future teachers (Display 11), the
variation across the U.S. institutions is even larger and more pronounced. Aside from the
Russian Federation, the variation across institutions is larger than any other country. There
are some institutions as Display 11 shows, which would find themselves in the midst of the
distribution for Taiwan, towards the upper end of the distribution for the Russian
33

Federation, and well above the single teacher preparation institution in Singapore. So
clearly, there are U.S. teacher preparation universities or colleges whose students perform
at the highest levels in terms of mathematics content knowledge as is found in the top-
achieving countries. On the other hand, there are certain U.S. institutions where the
average level of knowledge of mathematics, of its future teachers places them in the
middle among the Georgia institutions and at the upper end of the Chile and Botswana
distributions.
What the data in Display 11 show is that one of the outcomes of teacher
preparation, that is the level of knowledge of the mathematics necessary for the teaching of
middle school topics, varies such that some of the U.S. teacher preparation institutions on
average produce future teachers at a level commensurate with the level of performance of
countries with emerging and developing economies such as Botswana and Georgia, yet
other institutions within the United States have future teachers who in the end have a
knowledge level consistent with the performance of institutions in both Taiwan and the
Russian Federation. In fact, those same institutions perform at a level that outperforms the
average level of knowledge of the sole institution for the preparation of teachers in
Singapore.
Such variation across U.S. institutions exists even after adjusting for the selection
factors discussed previously. Assuming that these adjustments are reasonable, this implies
that the institutional variation likely reflects differences in the definitions of what course
work is necessary to prepare future teachers of mathematics in the U.S. Much like the K-12
schools there are no commonly required curriculum standards that define a quality teacher
preparation program. Without such standards, variation is understandable. Now as such
34
standards are being defined for K-12 schools at least in mathematics (“Common Core”) the
question is: are such standards also needed for teacher preparation?
We could ask the question as to why it is that the average performance of U.S.
institutions especially at the secondary level varies so much. To examine this issue we
looked at the proportional allocation of coursework across the three areas of mathematics,
mathematics pedagogy and general pedagogy. What we found were ratios consistent with
those of the top achieving countries where 50% or more of the course work taken, as
indicated by the future teachers, was taken in the area of formal mathematics. Elsewhere,
future teachers in other U.S. institutions, indicated taking, on average, as little as one-third
of their course work in mathematics and taking much more in either general pedagogy or
mathematics pedagogy. A formal analysis suggests there is a relationship between those
relative content allocations in terms of course taking across the three areas and the
corresponding average performance at the institutional level in terms of mathematics
knowledge even after controlling for selection factors related to differences in admissions
policies.
35
CHAPTER 5
IMPLICATIONS FOR POLICY
There are no statistically significant differences in mathematics content knowledge
or mathematics pedagogy knowledge between public and private universities and colleges
at either the primary or secondary level. This is in spite of the fact that characteristics of
the institutions do vary between private and public universities. In the sampled institutions
the 25th and 75th percentile of matriculating students’ ACT mathematics scores were higher
in the private schools as was the Barron rating associated with the prestige of those
institutions. Assuming that this would be true of the future teachers at that institution and
hence the sample we drew, the selection bias associated with the private schools would
suggest that their knowledge of mathematics would likely be greater at the outset,
however, at the end there were no significant differences between the public and private
colleges and universities. This was true in spite of the private institutions’ more selective
admission policies.
Considering those prepared to teach at the middle school level, there were large
differences between the various program types. Those prepared in secondary programs
scored much higher than those prepared in middle-school-specific or elementary programs.
This raises the clear policy question as to state certification defining the types of
preparation that would allow a person to be certified to teach middle school mathematics.
Those states, where certification is such that a person obtaining their teacher preparation in
an elementary or middle school program, need to realize that the average level of
mathematics content knowledge of future teachers trained in this way was substantially
36
lower than what it was for those that are prepared as a part of secondary programs. This is
related to the fact that those prepared in the secondary programs take more formal
mathematics as a part of their teacher preparation especially basic courses such as linear
algebra and calculus.
Perhaps one thing that has emerged from both this study and the earlier MT21
study is that in most of the top-achieving countries a very large proportion if not all of the
future teachers take a course in linear algebra and a basic calculus sequence. These seem to
be the minimum mathematics course requirements from an international point of view
necessary for the preparation of middle school mathematics teachers.
At the elementary level, the patterns are not as clear as the course taking for the
U.S. does not seem that dissimilar from the other countries especially those whose future
teachers performed the best on the mathematics content knowledge test. This suggests that
there are other differences related to the relative position of the mathematics knowledge of
U.S. future elementary teachers. One hypothesis is that the difference may have to do with
the nature of the K-12 mathematics curriculum itself. We know from the TIMSS study that
the K-12 curriculum is more demanding and challenging in countries such as Singapore,
Taiwan and the Russian Federation, whose future teachers demonstrated greater
knowledge of mathematics upon completion of their program. Those teachers came to the
teacher preparation program with a stronger background enabling them to likely take more
advanced mathematics, but relative to the amount of pedagogy preparation it would still be
similar to the United States. In the U.S. the one-third of the teacher preparation that is
formal mathematics would perhaps need to be at a lower level of mathematics than would
be the case in a country such as the Russian Federation or Taiwan since the high school
37
curriculum in the U.S. is weaker and does not have as high expectations as is the case in
those other countries.
Coupled with this is the fact that in some of these countries, such as Taiwan, the
students who enter an elementary teacher preparation program likely come from a higher
percentile of the international distribution of mathematics performance as reflected in
TIMSS at the eighth grade. This would imply that the U.S., given its relatively lower
position in that international distribution, would have to draw from the very high end of the
distribution in order to even be comparable to future teachers being drawn from the middle
or even the lower end of the mathematics knowledge distribution in other countries.
This places U.S. future elementary teachers at a disadvantage both in terms of their
entry level knowledge as well as the substance of the mathematics they would encounter as
a part of their teacher preparation program. If students enter the program with a higher
level of mathematics knowledge from high school, the corresponding coursework that they
would experience while at the university would be of a higher level. This was made clear
from the data where, in these other countries, a larger percentage took at least one of the
two calculus courses than was the case in the United States. This is in spite of the fact that
the relative allocation across the three areas of preparation is constant, but the nature of the
mathematics taken was different. Much additional analysis needs to be pursued in order to
understand more fully the relationship of what the future teachers studied in their teacher
preparation program and what knowledge they possessed as they left that program.
In the end the real question is whether these professional competencies such as the
knowledge level in mathematical content, mathematical pedagogical content and general
38
pedagogical content makes any difference as to how much mathematics the K-8 students
learn and achieve.
So where should the United States go toward improving the professional
competence of its future primary teachers and middle school mathematics teachers? The
answer has some similarities across both types of teachers but also some dissimilarities.
Consider first, the middle school mathematics teachers. One could imagine that one policy
in response to these data would be that we need to demand a higher level of mathematics
training as found in secondary programs and since this is a closed system, the increase in
formal mathematics coursework would suggest the lowering of coursework in general
pedagogy, for example, as would be suggested by the allocation distribution associated
with those countries whose future teachers performed the best on the mathematics content
knowledge score.
The inclusion of more mathematics in teacher preparation is consistent with the
above recommendation as it is typically those secondary programs which require a stronger
course background in mathematics. This might imply that middle school mathematics
teachers should be trained only in secondary programs where half of the coursework
required would be in formal mathematics. This, however, might have unintended negative
consequences.
One of the difficulties is that students who enter a secondary teacher preparation
program would more often have the motivation to teach at the high school level where they
could teach more formal mathematics than is typically the case at the middle school level.
Pushing this requirement might also reduce the number of middle school mathematics
39
teachers available as many would choose some other field rather than to take a formal
secondary preparation with its more formal mathematics course requirements.
So what might be a good approach to this problem? It seems that this issue is
intertwined with the admission and selection issues discussed previously. It might be a
better option for the United States to recruit more students to enter teacher preparation
programs that focus on middle school mathematics with a better mathematics background
with which to begin. In other words only if one is able to recruit students from the higher
end of the mathematics distribution within the United States would we be able to compete
internationally.
It would appear that the solution may well lie in some combination of recruitment
and inducement to enter teaching for those who have quantitative backgrounds together
with a more demanding curriculum even if it is a preparation program that is not a
secondary preparation program. The other serious issue that needs to be addressed is the
certification issue which states control and consequently should be looked at carefully
because, as is indicated by these data, that choice has likely consequential impact on what
students learn.
40
REFERENCES INTASC. (1995). Model standards in mathematics for beginning teacher licensing and
development: A resource for state dialogue. Washington, DC: Interstate New Teacher Assessment & Support Consortium.
Leithwood, K., Edge, K., & Jantzi, D. (1999). Educational accountability: The state of the art.
Gutersloh, Germany: Bertelsmann Foundation Publishers. Mullis, I. V. S., Martin, M. O., Gonzalez, E. J., & Chrostowski, S. J. (2004). TIMSS 2003
International Mathematics Report: Findings from IEA’s Trends in International Mathematics and Science Study at the Fourth and Eighth Grade (pp. 465). Chestnut Hill, MA: TIMSS & PIRLS International Study Center, Lynch School of Education, Boston College.
Murray, F. B. (2000). The role of accreditation reform in teacher education. Educational Policy,
14(1), 40-59. National Commission on Teaching & America's Future. (1996). What matters most: Teaching for
America's future. Report of the National Commission on Teaching & America's Future. Woodbridge, VA: National Commission on Teaching America’s Future.
National Council for Accreditation of Teacher Education (NCATE). (2000). Professional
standards for the accreditation of schools, colleges, and departments of education. Washington D.C.: National Council for Accreditation of Teacher Education.
Schmidt, W. H., Blömeke, S. & Tatto, M.T. (in press). Teacher education matters: A study of
middle school mathematics teacher preparation in six countries. New York: Teachers College Press.
Schmidt, W. H., Jorde, D., Cogan, L. S., Barrier, E., Gonzalo, I., Moser, U., et al. (1996).
Characterizing Pedagogical Flow: An Investigation of Mathematics and Science Teaching in Six Countries. New York: Springer.
Schmidt, W. H., McKnight, C. C., Houang, R. T., Wang, H., Wiley, D., Cogan, L. S., et al. (2001).
Why Schools Matter: A Cross-National Comparison of Curriculum and Learning. San Francisco, CA: Jossey-Bass.
Schmidt, W. H., Tatto, M. T., Bankov, K., Blömeke, S., Cedillo, T., Cogan, L., et al. (2007). The
preparation gap: Teacher education for middle school mathematics in six countries (p. 47). East Lansing: Michigan State University. Available online at http://usteds.msu.edu/mt21report.pdf
Schmidt, W. H., Wang, H. A., & McKnight, C. C. (2005). Curriculum coherence: An examination
of US mathematics and science content standards from an international perspective. Journal of Curriculum Studies, 37(5), 525-529.
Tatto, M. T., Schwille, J., Senk, S. L., Ingvarson, L., Peck, R., & Rowley, G. (2008). Teacher
Education and Development Study in Mathematics (TEDS-M): Policy, practice, and readiness to teach primary and secondary mathematics. Conceptual framework. East Lansing, MI: Teacher Education and Development International Study Center, College of Education, Michigan State University.
41
APPENDIX A
TECHNICAL BACKGROUND
This appendix provides additional information about the participant selection and data collection of the U. S. samples. As mentioned in Chapter 1, TEDS-M 2008 was an international comparative study sponsored by IEA. The TEDS-M Teacher Education International Study Center (ISC) provided coordination of all international activities including the development and pilot-testing of survey instruments. The ISC also established sampling guidelines and procedures for the National Research Centers (NRCs) of the participating countries. The NRCs provided the sampling frames while the sample selection, weighting, participation rate determination and adjudication were conducted by the IEA Data Processing Center (DPC) in Hamburg, Germany. The NRCs were responsible for data collection and DPC for processing and assemblage of the international dataset. Technical details will be available from the Teacher Education Study in Mathematics (TEDS-M): Technical Report available from the ISC. Much of the information reported here is drawn from a parallel Technical Summary (Tatto, et.al., 2009) released to NRCs in December 2009. The recommended sampling strategy was to draw a 2-stage cluster sample drawn with probability proportional to the size of the institutions (TEDS-M ISC, Sample Preparation Manual, 2007). The rationale was that with few exceptions, teachers in the participating countries were prepared by identifiable institutions such as universities, colleges, teacher colleges, normal schools, etc. The first stage was to identify and select institutions with probability proportional to the size of the institutions. Then a sample was drawn randomly from eligible training programs within each institution.
U.S. TEDS SAMPLING FRAME
The desired target population was to have national coverage. For TEDS-M, the target population should include Level 1 (primary/elementary) teachers who are prepared by their teacher education programs and certified by the states to teach mathematics, and Level 2 (lower secondary/middle grades) teachers. In the U.S., Level 1 teachers are prepared by primary or elementary programs (K-5, K-6, K-8, 1-5, etc.). Level 2 teachers are prepared by programs for secondary and middle school mathematics. The U.S. TEDS-M sampling frame focused on the 1351 colleges and universities that have teacher preparation programs approved by the U.S. Department of Education. The sampling frame, therefore, excluded a proportion of teachers prepared under “alternate routes” that were outside these institutions. Currently in the U.S., the issue of alternative routes to becoming a classroom teacher generates considerable discussion and controversy. Although the U.S. has no central government unit that regulates teacher preparation practice across and within states, states have traditionally relied on colleges and universities to provide teacher preparation. As these programs have produced an insufficient number of teachers – particularly in the high needs areas of mathematics and science – states have introduced non-traditional pathways to becoming a teacher. These state-defined
42
non-traditional or alternative routes to teacher certification are producing significant numbers of new teachers in some states and do not even exist in other states. The best available information on all these various alternatives or non-traditional approaches suggest that about half of the programs are actually headquartered within a traditional college or university; the other half are located within and run by individual local school districts. Therefore, those associated with traditional colleges or universities are likely to be included in the U.S. TEDS sampling frame. Participants in the other programs typically are hired as mathematics teachers with temporary certifications. They would already have an undergraduate degree in a related field and attend classes in pedagogy while they teach. As such, their programs would not qualify for the study. Unfortunately, it is impossible to determine the proportion of teachers that would be prepared outside this frame that fits the TEDS-M future teacher definition. Information about alternative routes for teacher certification was obtained from reports prepared by the National Center for Education Information (NCEI – http://www.ncei.com/). NCEI maintains a database of alternative routes.
DATA SOURCES FOR SAMPLING FRAME
Information about the production of mathematics teachers and elementary teachers was obtained from two sources: the IPEDS (Integrated Post-Secondary Education Data System) maintained by the National Center for Education Statistics (NCES – http://nces.ed.gov/ipeds/), and the American Association of Colleges for Teacher Education (AACTE – http://www.aacte.org/). NCES collects data from nearly all colleges/universities; AACTE collects data only from member institutions. Missing data from one source was supplied by the data from the other source to the extent possible. Since about 95% of teacher preparation institutions prepare both elementary and secondary teachers, the production of these two were combined to form a total production number that was used as a measure of size (MOS). About four percent of institutions were missing these data so an imputation was done based on the total enrollment of the institution, U.S. Census Bureau geographical regions, and the Carnegie Classification of institutions of higher education (McCormick, 2000). The resulting U.S. sampling frame includes 498 publicly controlled institutions and 853 privately controlled institutions. Based on the sampling frame, publicly controlled institutions represent 37% of all institutions but they are responsible for 60% of the total institutional production. SAMPLING STRATEGY The sampling frame represented a very diverse group of institutions. To minimize the sampling variability, the list was stratified. Four variables were used to stratify the institutions. The first
43
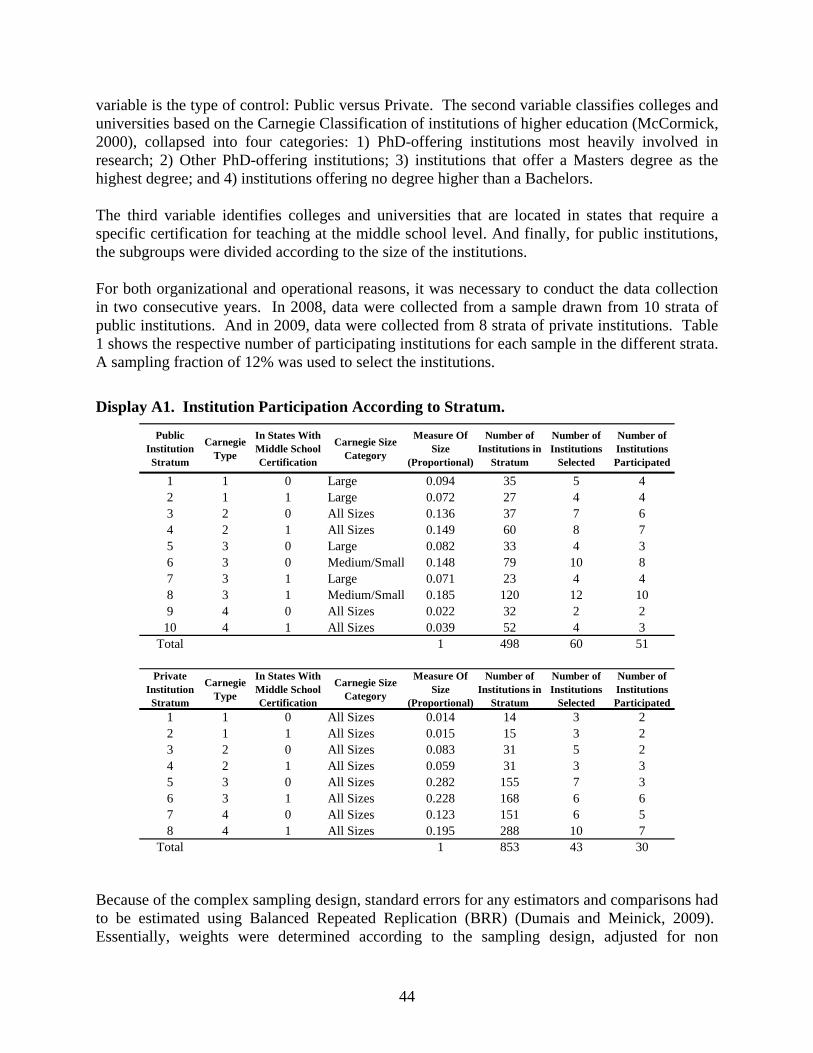
variable is the type of control: Public versus Private. The second variable classifies colleges and universities based on the Carnegie Classification of institutions of higher education (McCormick, 2000), collapsed into four categories: 1) PhD-offering institutions most heavily involved in research; 2) Other PhD-offering institutions; 3) institutions that offer a Masters degree as the highest degree; and 4) institutions offering no degree higher than a Bachelors. The third variable identifies colleges and universities that are located in states that require a specific certification for teaching at the middle school level. And finally, for public institutions, the subgroups were divided according to the size of the institutions. For both organizational and operational reasons, it was necessary to conduct the data collection in two consecutive years. In 2008, data were collected from a sample drawn from 10 strata of public institutions. And in 2009, data were collected from 8 strata of private institutions. Table 1 shows the respective number of participating institutions for each sample in the different strata. A sampling fraction of 12% was used to select the institutions.
Display A1. Institution Participation According to Stratum.
Public Institution Stratum
Carnegie Type
In States With Middle School Certification
Carnegie Size Category
Measure Of Size
(Proportional)
Number of Institutions in
Stratum
Number of Institutions
Selected
Number of Institutions Participated
1 1 0 Large 0.094 35 5 42 1 1 Large 0.072 27 4 43 2 0 All Sizes 0.136 37 7 64 2 1 All Sizes 0.149 60 8 75 3 0 Large 0.082 33 4 36 3 0 Medium/Small 0.148 79 10 87 3 1 Large 0.071 23 4 48 3 1 Medium/Small 0.185 120 12 109 4 0 All Sizes 0.022 32 2 210 4 1 All Sizes 0.039 52 4 3
Total 1 498 60 51
Private Institution Stratum
Carnegie Type
In States With Middle School Certification
Carnegie Size Category
Measure Of Size
(Proportional)
Number of Institutions in
Stratum
Number of Institutions
Selected
Number of Institutions Participated
1 1 0 All Sizes 0.014 14 3 22 1 1 All Sizes 0.015 15 3 23 2 0 All Sizes 0.083 31 5 24 2 1 All Sizes 0.059 31 3 35 3 0 All Sizes 0.282 155 7 36 3 1 All Sizes 0.228 168 6 67 4 0 All Sizes 0.123 151 6 58 4 1 All Sizes 0.195 288 10 7
Total 1 853 43 30
Because of the complex sampling design, standard errors for any estimators and comparisons had to be estimated using Balanced Repeated Replication (BRR) (Dumais and Meinick, 2009). Essentially, weights were determined according to the sampling design, adjusted for non
44
participation and non respondents. Replicates were then created for computing the desired standard errors. DATA COLLECTION After agreements to participate were secured, the NRC worked with coordinators identified by the institutions to secure IRB approval, identify teacher preparation units (TPUs) and eligible future teachers, and administer the surveys. As state and/or institutional requirements dictated, the identities of the future teachers were kept with the coordinators. The coordinators contacted and administered the surveys as well as followed up with non-respondents if necessary. Data collection followed strictly the guidelines and procedures provided by the ISC (Institution Contact and Site Coordinator Manual, 2008). Because the survey included an assessment section, administration of the survey was timed and monitored according to the international standardized procedure. Since it was necessary to complete the study in two separate years, only the public institution sample collected in 2008 was part of the international dataset. Nonetheless, the private institution sample collected in 2009 followed exactly the same guidelines and procedures. The data were processed in the same manner by DPC and sampling weights were computed by Statistics Canada, the sampling consultant for TEDS-M. Display 1 in Chapter 1 shows the sample sizes for both samples. Because data collection spanned two academic years, a second sample was collected from 8 of participating public institutions in 2009 for comparison. These 8 institutions were selected randomly after the sample of participating public institutions was stratified according to the response rates. The comparison revealed that there were no significant differences between institutional samples from the two years. The two samples were compared on a set of variables relating to the future teachers’ background (high school GPA, highest course taken in mathematics in high school, SAT, and ACT scores), as well as mathematics courses taken in college. The analysis was performed controlling for differences among the institutions. There were no statistically significant differences between data collected from the 2 years.
45
REFERENCES Dumais, J. & Meinick, S. (2009). Estimation weights, participation rates and sampling error. In
Tatto, M. T., Schwille, J., Senk, S., Rodriguez, M., Bankov, K., Reckase, M.D. et al. Teacher Education Study in Mathematics (TEDS-M): Technical Report. (Available from Teacher Education International Study Center, College of Education, Michigan State University, East Lansing, MI 48824).
McCormick, A.C. (2000). The Carnegie Classification of Institutions of Higher Education, 2000
Edition. Menlo Park, CA: The Carnegie Foundation for the Advancement of Teaching. Tatto, M. T., Schwille, J., Senk, S., Rodriguez, M., Bankov, K., Reckase, M. D. et al. (2009).
Teacher Education Study in Mathematics (TEDS-M): Technical Summary. (Available from Teacher Education International Study Center, College of Education, Michigan State University, East Lansing, MI 48824).
TEDS-M International Study Center (2008). Institution Contact and Site Coordinator Manual.
TEDS-M ref. No. MS-03-02. (Available from Teacher Education International Study Center, College of Education, Michigan State University, East Lansing, MI 48824).
TEDS-M International Study Center (2007). Sample Preparation Manual. TEDS-M ref. No. MS-
02-01. (Available from Teacher Education International Study Center, College of Education, Michigan State University, East Lansing, MI 48824).
46
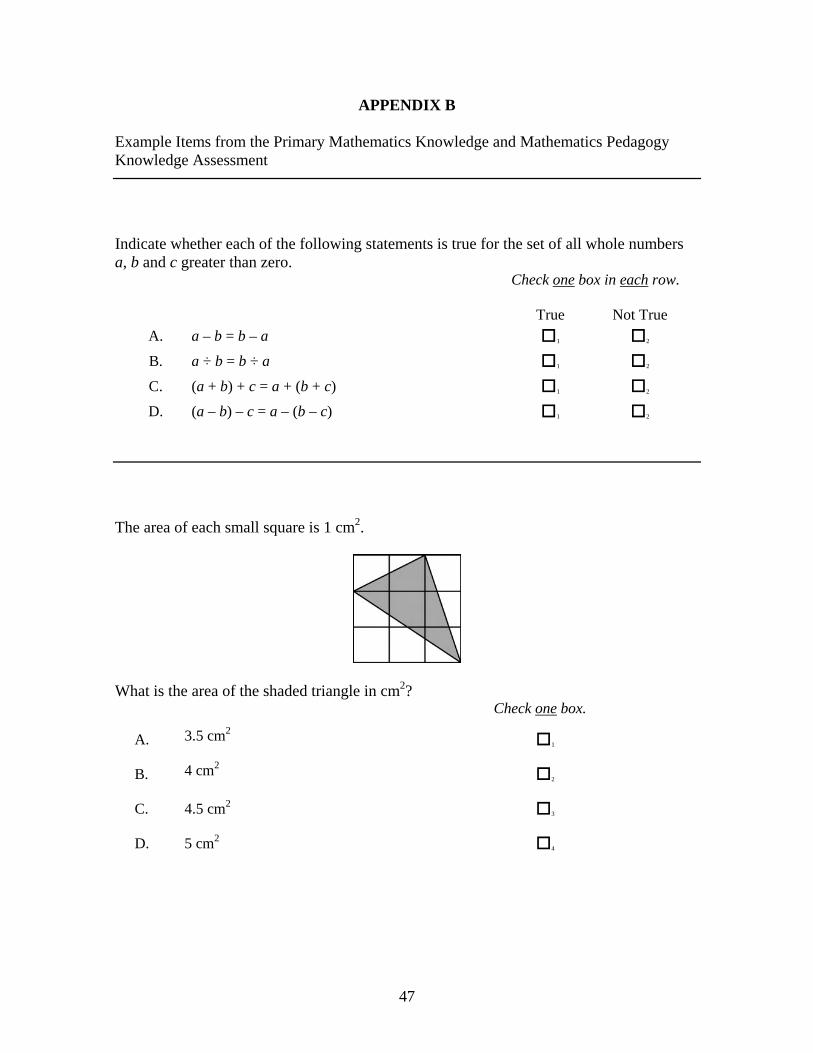
APPENDIX B Example Items from the Primary Mathematics Knowledge and Mathematics Pedagogy Knowledge Assessment
Indicate whether each of the following statements is true for the set of all whole numbers a, b and c greater than zero.
Check one box in each row.
True Not TrueA. a – b = b – a 1 2 B. a ÷ b = b ÷ a 1 2 C. (a + b) + c = a + (b + c) 1 2 D. (a – b) – c = a – (b – c) 1 2
The area of each small square is 1 cm2.
What is the area of the shaded triangle in cm2?
Check one box.
A. 3.5 cm2 1
B. 4 cm2 2
C. 4.5 cm2 3
D. 5 cm2 4
47
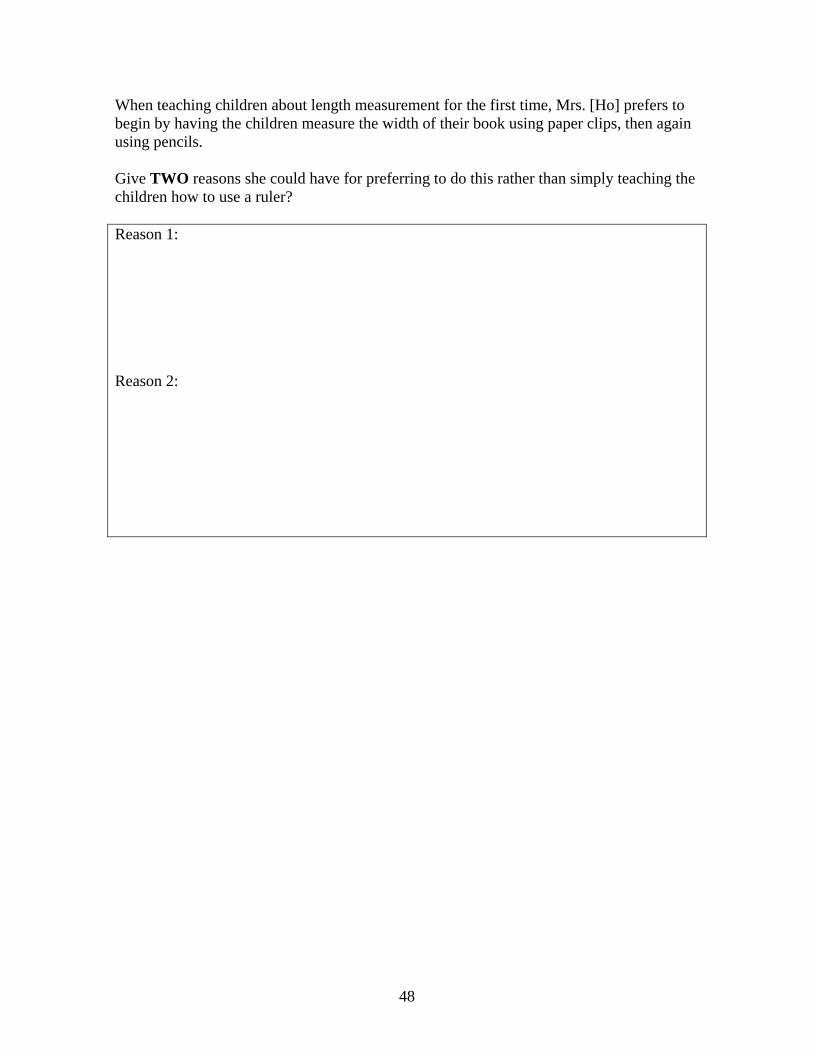
When teaching children about length measurement for the first time, Mrs. [Ho] prefers to begin by having the children measure the width of their book using paper clips, then again using pencils. Give TWO reasons she could have for preferring to do this rather than simply teaching the children how to use a ruler? Reason 1: Reason 2:
48
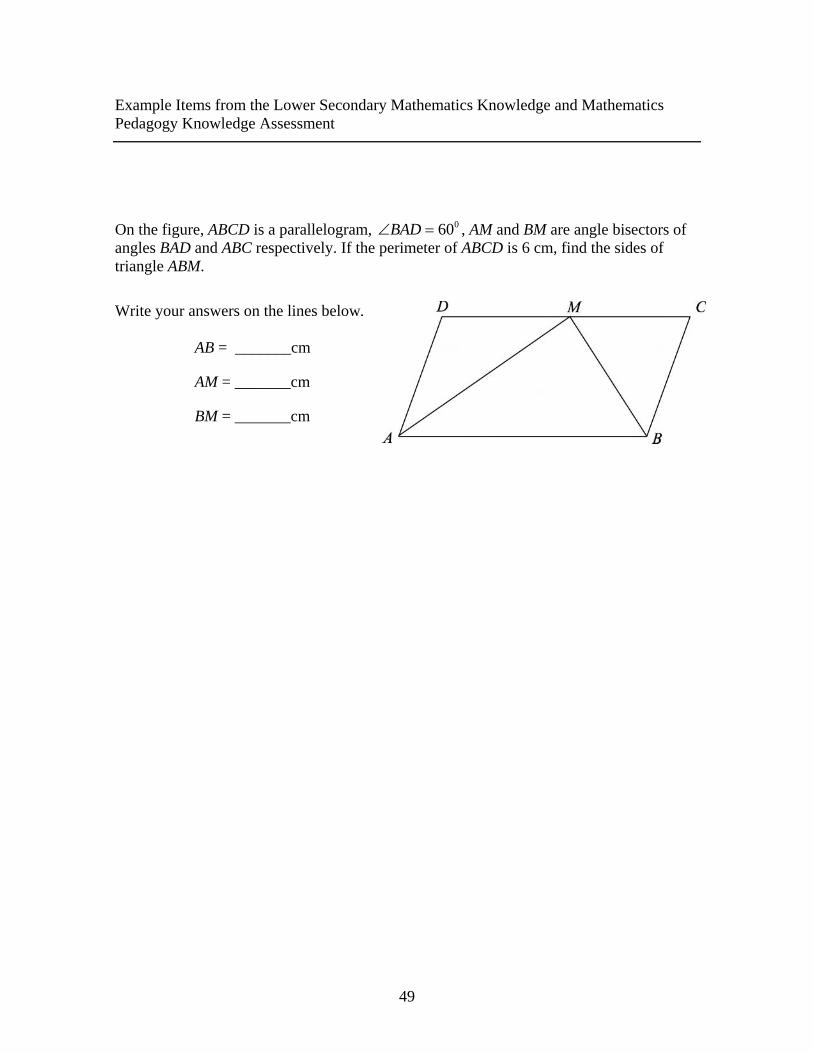
Example Items from the Lower Secondary Mathematics Knowledge and Mathematics Pedagogy Knowledge Assessment
On the figure, ABCD is a parallelogram, ∠BAD = 600 , AM and BM are angle bisectors of angles BAD and ABC respectively. If the perimeter of ABCD is 6 cm, find the sides of triangle ABM.
Write your answers on the lines below.
AB = _______cm
AM = _______cm
BM = _______cm
49
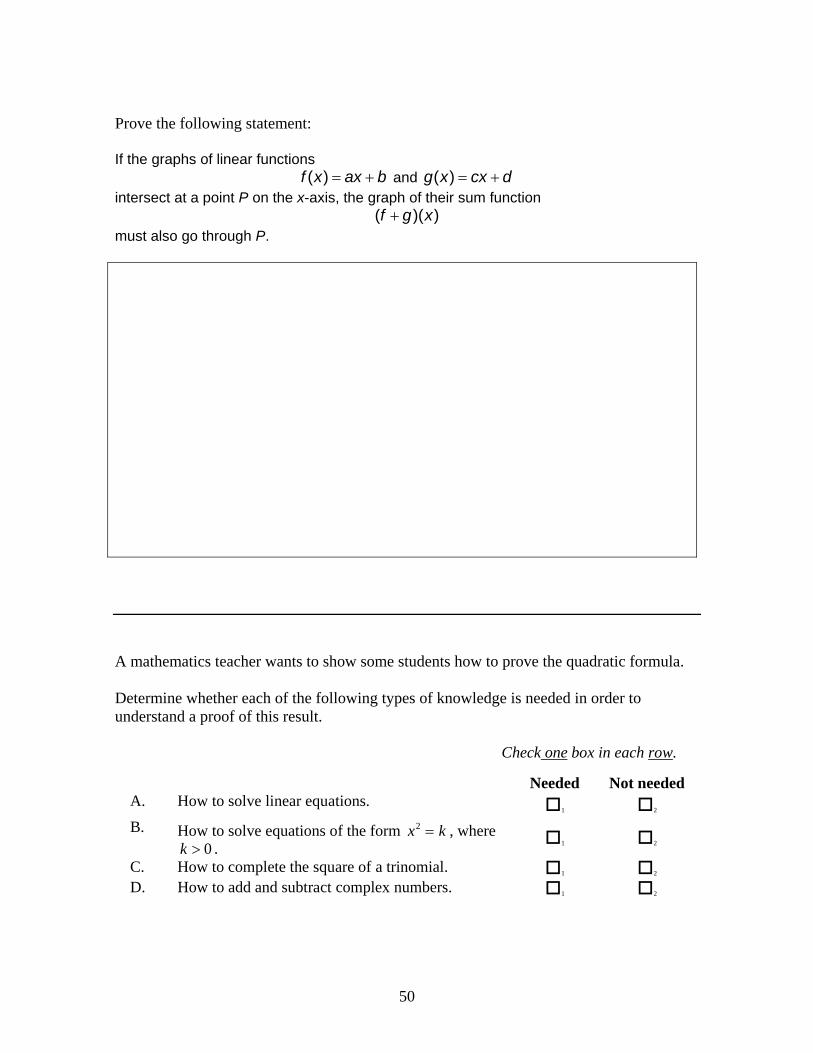
Prove the following statement: If the graphs of linear functions
= +( )f x ax b and = +( )g x cx d intersect at a point P on the x-axis, the graph of their sum function
+( )(f g x) must also go through P. A mathematics teacher wants to show some students how to prove the quadratic formula. Determine whether each of the following types of knowledge is needed in order to understand a proof of this result.
Check one box in each row. Needed Not needed A. How to solve linear equations.
1 2 B. How to solve equations of the form x2 = k , where
k > 0 . 1 2
C. How to complete the square of a trinomial. 1 2 D. How to add and subtract complex numbers. 1 2
50
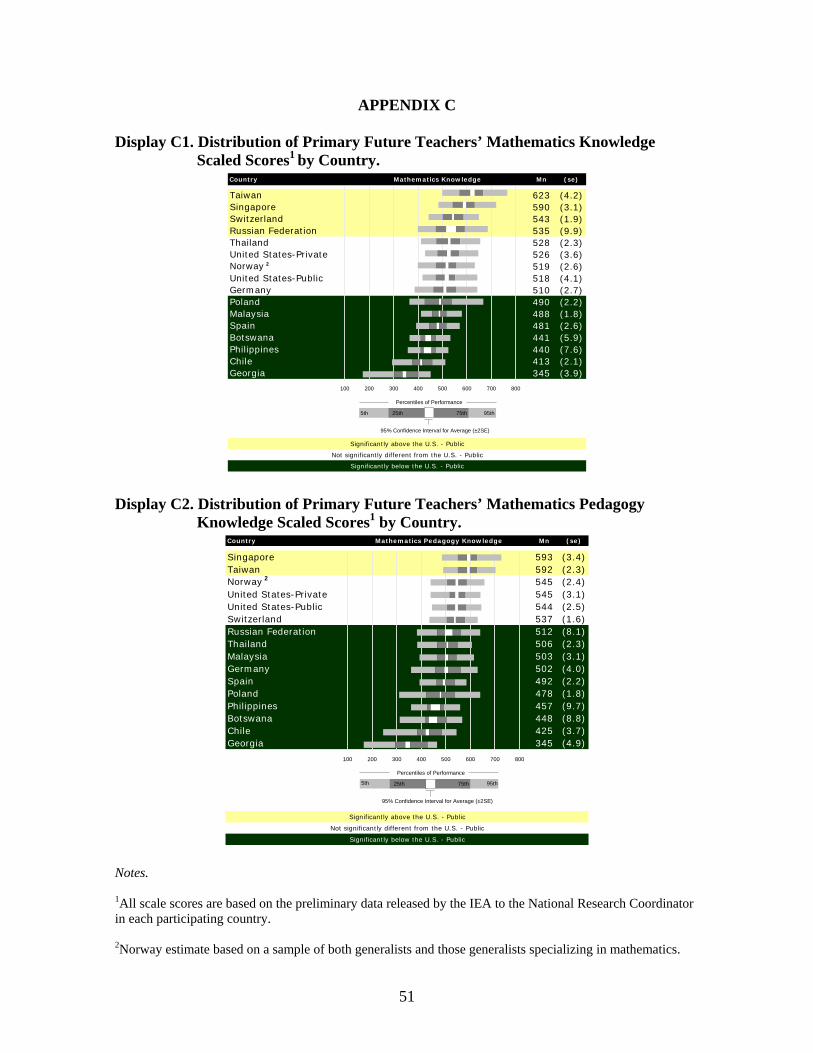
APPENDIX C
Display C1. Distribution of Primary Future Teachers’ Mathematics Knowledge Scaled Scores1 by Country.
Country Mathematics Knowledge Mn (se)
Taiwan 623 (4.2)Singapore 590 (3.1)Switzerland 543 (1.9)Russian Federation 535 (9.9)Thailand 528 (2.3)United States-Private 526 (3.6)Norway 2 519 (2.6)United States-Public 518 (4.1)Germany 510 (2.7)Poland 490 (2.2)Malaysia 488 (1.8)Spain 481 (2.6)Botswana 441 (5.9)Philippines 440 (7.6)Chile 413 (2.1)Georgia 345 (3.9)
Significantly above the U.S. - Public
Not significantly different from the U.S. - Public
Significantly below the U.S. - Public
100 200 300 400 500 600 700 800
75th 95th5th 25th
95% Confidence Interval for Average (±2SE)
Percentiles of Performance
Display C2. Distribution of Primary Future Teachers’ Mathematics Pedagogy
Knowledge Scaled Scores1 by Country. Country Mathematics Pedagogy Knowledge Mn (se)
Singapore 593 (3.4)Taiwan 592 (2.3)Norway 2 545 (2.4)United States-Private 545 (3.1)United States-Public 544 (2.5)Switzerland 537 (1.6)Russian Federation 512 (8.1)Thailand 506 (2.3)Malaysia 503 (3.1)Germany 502 (4.0)Spain 492 (2.2)Poland 478 (1.8)Philippines 457 (9.7)Botswana 448 (8.8)Chile 425 (3.7)Georgia 345 (4.9)
Significantly above the U.S. - Public
Not significantly different from the U.S. - Public
Significantly below the U.S. - Public
100 200 300 400 500 600 700 800
75th 95th5th 25th
95% Confidence Interval for Average (±2SE)
Percentiles of Performance
Notes.
1All scale scores are based on the preliminary data released by the IEA to the National Research Coordinator in each participating country.
2Norway estimate based on a sample of both generalists and those generalists specializing in mathematics.
51
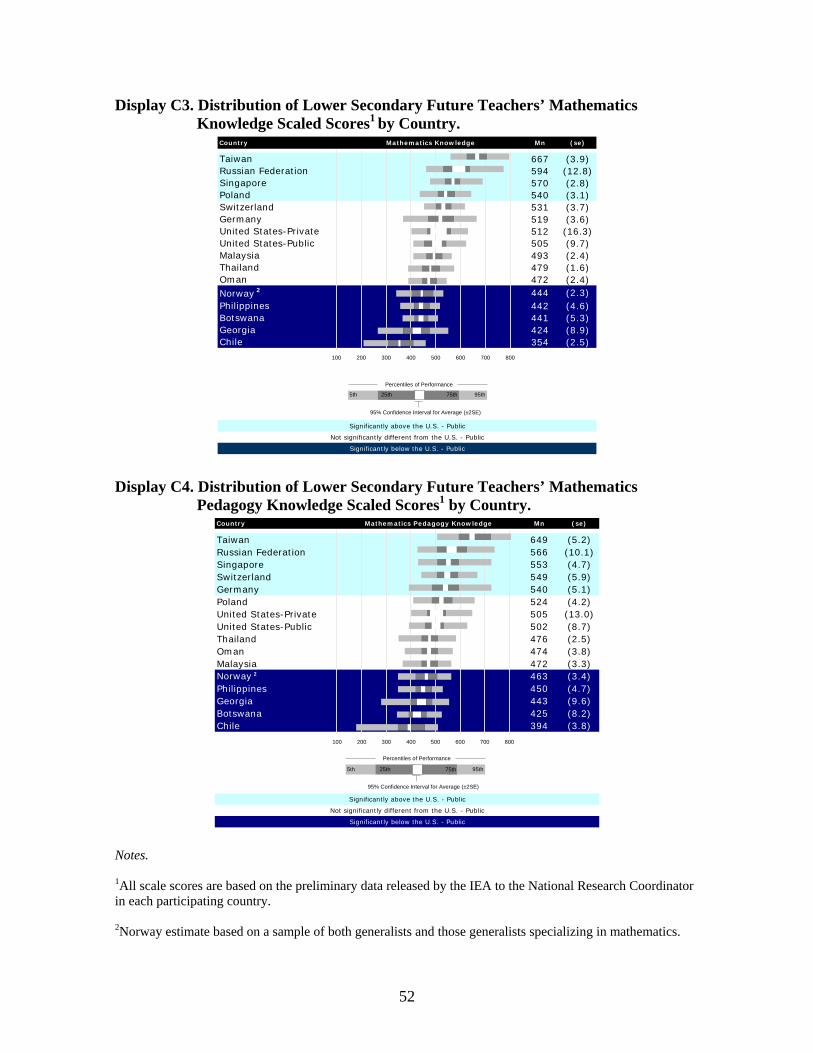
Display C3. Distribution of Lower Secondary Future Teachers’ Mathematics Knowledge Scaled Scores1 by Country.
Country Mathematics Knowledge Mn (se)
Taiwan 667 (3.9)Russian Federation 594 (12.8)Singapore 570 (2.8)Poland 540 (3.1)Switzerland 531 (3.7)Germany 519 (3.6)United States-Private 512 (16.3)United States-Public 505 (9.7)Malaysia 493 (2.4)Thailand 479 (1.6)Oman 472 (2.4)Norway 2 444 (2.3)Philippines 442 (4.6)Botswana 441 (5.3)Georgia 424 (8.9)Chile 354 (2.5)
Significantly above the U.S. - Public
Not significantly different from the U.S. - Public
Significantly below the U.S. - Public
100 200 300 400 500 600 700 800
75th 95th5th 25th
95% Confidence Interval for Average (±2SE)
Percentiles of Performance
Display C4. Distribution of Lower Secondary Future Teachers’ Mathematics
Pedagogy Knowledge Scaled Scores1 by Country. Country Mathematics Pedagogy Knowledge Mn (se)
Taiwan 649 (5.2)Russian Federation 566 (10.1)Singapore 553 (4.7)Switzerland 549 (5.9)Germany 540 (5.1)Poland 524 (4.2)United States-Private 505 (13.0)United States-Public 502 (8.7)Thailand 476 (2.5)Oman 474 (3.8)Malaysia 472 (3.3)Norway 2 463 (3.4)Philippines 450 (4.7)Georgia 443 (9.6)Botswana 425 (8.2)Chile 394 (3.8)
Significantly above the U.S. - Public
Not significantly different from the U.S. - Public
Significantly below the U.S. - Public
100 200 300 400 500 600 700 800
75th 95th5th 25th
95% Confidence Interval for Average (±2SE)
Percentiles of Performance
Notes.
1All scale scores are based on the preliminary data released by the IEA to the National Research Coordinator in each participating country.
2Norway estimate based on a sample of both generalists and those generalists specializing in mathematics.
52
This report presents the United States results from an international study of mathematics teacher preparation for the elementary or lower secondary (middle) grades. The Teacher Education and Development Study in Mathematics (TEDS-M) was sponsored by the IEA and conducted in 16 countries: Botswana, Chile, Germany, Georgia, Malaysia, Norway, Oman, the Philippines, Poland, the Russian Federation, Singapore, Spain, Switzerland, Taiwan, Thailand, and the United States. Potential future teachers near the end of their programs completed a survey about their background, learning opportunities, and an assessment of their mathematics knowledge and their knowledge of mathematics for teaching. Involved in the US were nearly 3300 future teachers from over 80 public and private colleges and universities in 39 states.!
Center for Research in Mathematics and Science Education College of Education
Additional copies of this report can be downloaded at http://usteds.msu.edu