b. more biopotentials - university of...
TRANSCRIPT

Biomedical Instrumentation B18/BME2
Biomedical
Instrumentation B. More Biopotentials
B18/BME2
Dr Gari Clifford
(Based on slides from
Prof. Lionel Tarassenko)

Biomedical Instrumentation B18/BME2
Diagnostic uses of ECG Foetal monitoring (both before birth & during)
Patient monitoring in Ambulance, Intensive Care
Unit or Coronary Care Unit
S-T segment elevation to diagnose heart attacks
Evidence of cardiac muscle damage (infarct)
Detection of precursors to heart attacks:
Abnormal heart beats (e.g. many ectopic beats, TWA)
Abnormal heart rhythms

Biomedical Instrumentation B18/BME2
Use of ECG in CCU
The ECG is highly informative in the diagnosis of a heart
attack (Myocardial Infarct). Insufficient blood supply to the
cardiac cells due to a blockage in the coronary arteries
(ischaemic heart condition) causes S-T segment elevation.
Following the heart attack, cardiac muscle damage (infarct)
generally leads to a loss of amplitude in the ECG.

Biomedical Instrumentation B18/BME2
ECG abnormalities
(possible precursors to heart attacks)
Analysis of the ECG can provide early warning of potential
problems.
Ectopic beats originate somewhere other than the Sino-
Atrial (SA) node and often have different shapes
(morphologies).
Abnormal heart rates (arrhythmias) can be treated.
Biomedical Instrumentation B18/BME2
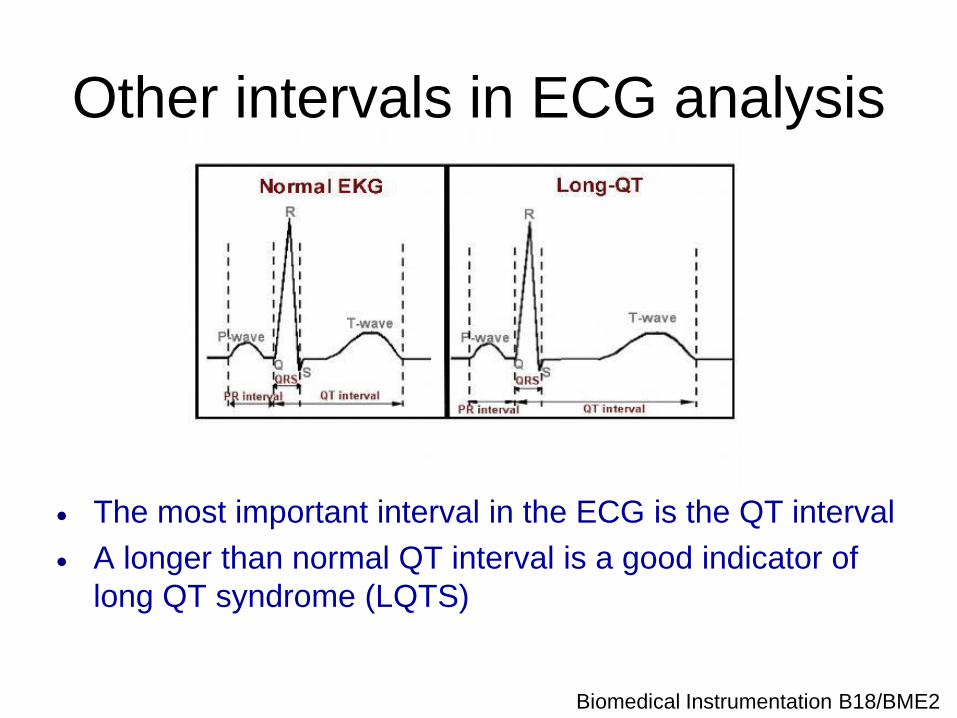
Other intervals in ECG analysis
The most important interval in the ECG is the QT interval
A longer than normal QT interval is a good indicator of
long QT syndrome (LQTS)

Biomedical Instrumentation B18/BME2
Q-T interval measurement
LQTS is a potentially fatal condition that renders
sufferers vulnerable to an arrhythmia known as torsade
de pointes.
When this rhythm occurs the heart is unable to beat
effectively and the blood flow to the brain falls
dramatically.
The result is a sudden loss of consciousness and
possible cardiac death.

Biomedical Instrumentation B18/BME2
Detecting ECG abnormalities
Two methods are in common use:
Ambulatory monitoring
Exercise stress ECGs

Biomedical Instrumentation B18/BME2
Ambulatory ECG monitoring
ECG monitored for 24 hours.
Results printed out:
24-hour summary detailing the heart rate and S-T
segment changes over the period of the test.
Detailed information on ECG recorded at the time
of a significant event (e.g. arrhythmia).

Biomedical Instrumentation B18/BME2
Analysis of ECG waveform
Diagnostic information can be obtained by
analysis of the amplitude and relative timing
of the various segments.
The simplest interval to measure is the R-R
interval (from which the heart rate is derived).
Two types of heart rate meters:
Averaging heart rate meter
Beat-to-beat heart rate meter

Biomedical Instrumentation B18/BME2
Heart Rate Meters
Heart rate is usually given in beats per minute
(BPM).
The easiest way to obtain this is to count an
identifying feature in the ECG which occurs once
per heart beat.
The most obvious such feature is the QRS
complex which is a sharp spike.
Both averaging and beat-to-beat devices need
to perform this detection.

Biomedical Instrumentation B18/BME2
QRS detection
There are 4 main problems in detecting the QRS
complex in ECG traces:
Artefacts due to electrode motion
Biomedical Instrumentation B18/BME2
QRS detection
There are 4 main problems in detecting
the QRS complex in ECG traces:
Artefacts due to electrode motion
Baseline wander (mostly caused by breathing
and torso movements)
Muscle artefact (broadband)
T-waves with high-amplitude content

Biomedical Instrumentation B18/BME2
QRS detection
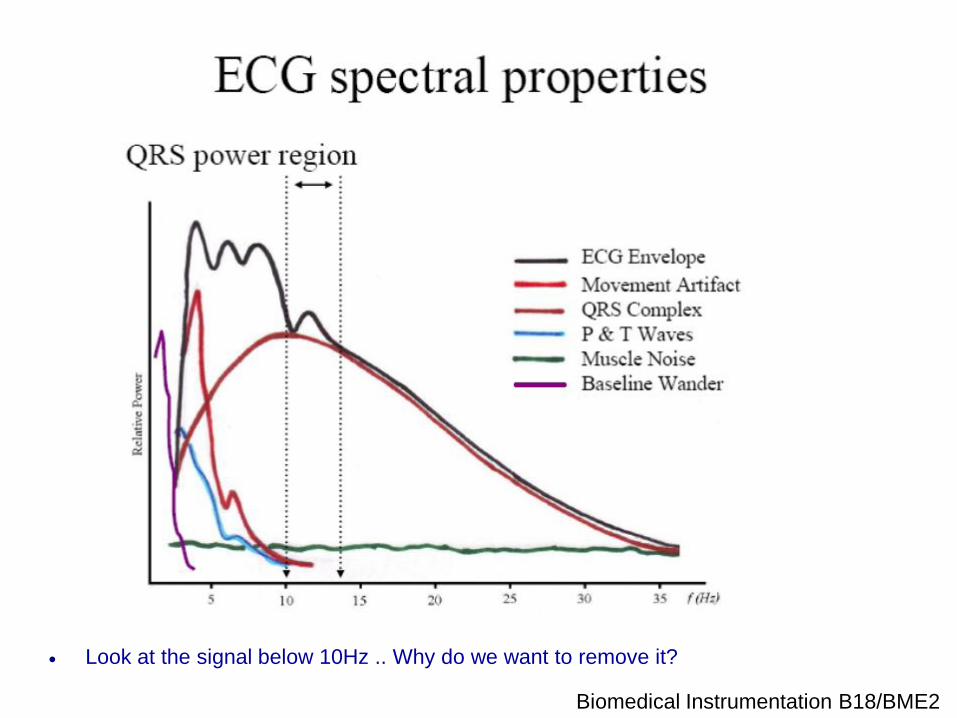
The solution to these problems is to use a band-
pass filter to remove:
Low-frequency changes such as baseline wander
High-frequency changes e.g. movement/muscle artefact
Most of the frequencies in the QRS complex are
around 5-20 Hz.
A pass-band of 10 – 40 Hz is therefore
appropriate.... Why?
Biomedical Instrumentation B18/BME2
Look at the signal below 10Hz .. Why do we want to remove it?
Biomedical Instrumentation B18/BME2
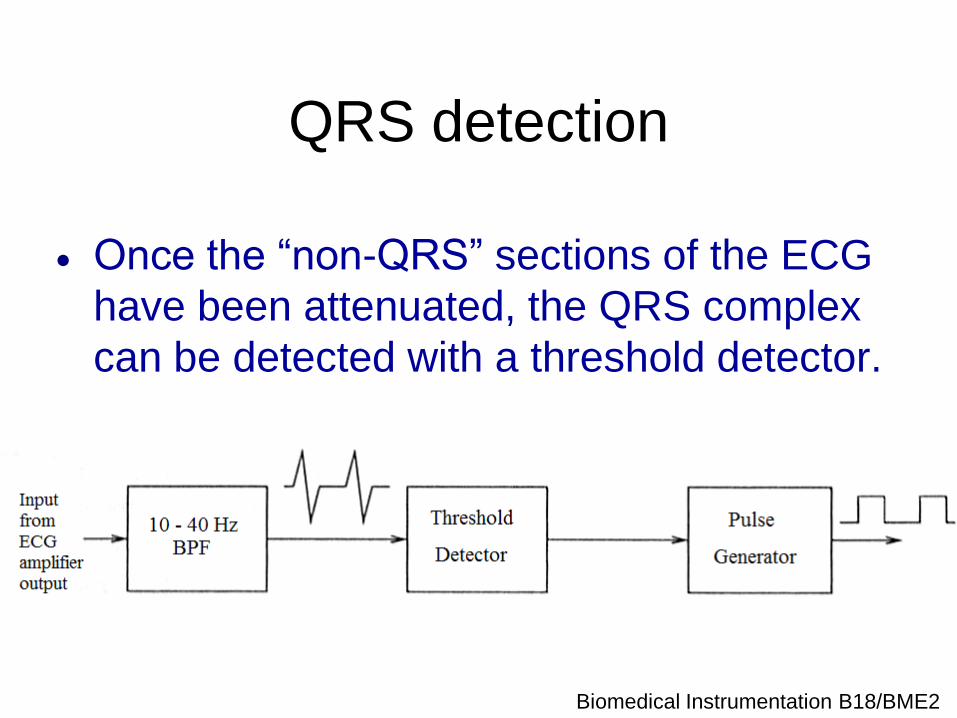
QRS detection
Once the “non-QRS” sections of the ECG
have been attenuated, the QRS complex
can be detected with a threshold detector.

Biomedical Instrumentation B18/BME2
R-Wave pulse generator
This should trigger a pulse generator so
that a short pulse of a fixed duration is
generated once (and only once) for each
QRS complex.

Biomedical Instrumentation B18/BME2
Averaging heart rate meter
The “average power” of the pulse train from the
pulse generator circuit will be indicative of the
Heart Rate.
This can be determined using a “leaky integrator”
(a form of low-pass filter).
The time-constant of the R-C circuit should be
several beats long to minimise output ripple.

Biomedical Instrumentation B18/BME2
Averaging heart rate meter

Biomedical Instrumentation B18/BME2
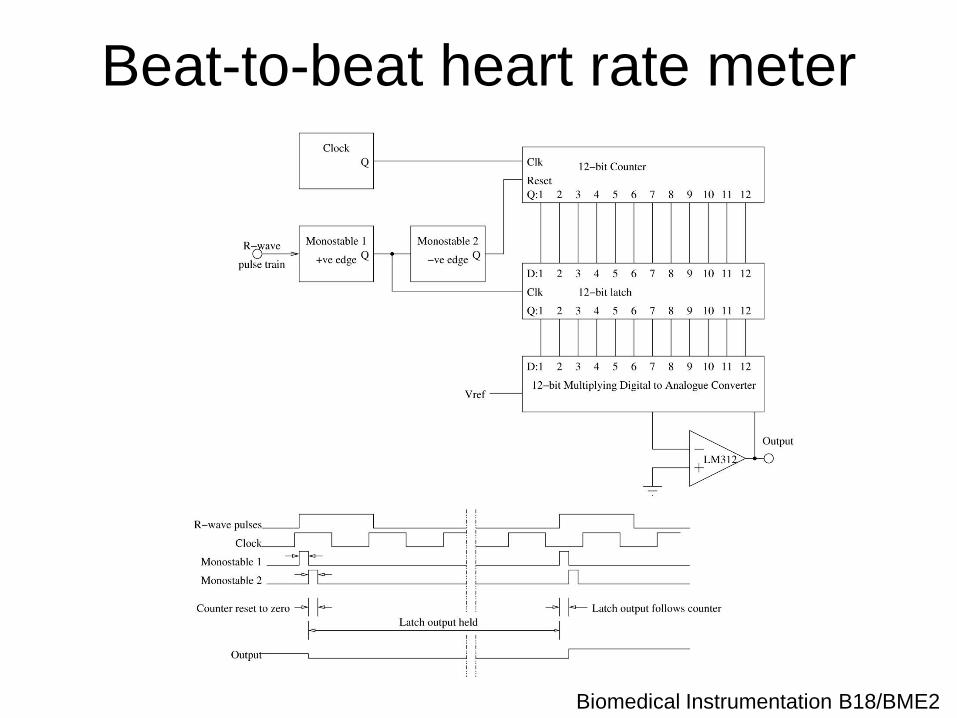
Beat-to-beat heart rate meter
This is best achieved using a digital circuit which:
- Counts the time between consecutive QRS complexes
- Inverts this in order to obtain a heart rate (rather than interval)
Biomedical Instrumentation B18/BME2
Beat-to-beat heart rate meter

Biomedical Instrumentation B18/BME2
Heart rate variability
Under resting conditions, the heart rate of a healthy individual is not
constant. (Notice compressions and rarefactions above)
During expiration, the vagus nerve is stimulated, which slows down
the heart rate (the right vagus innervates the sinoatrial node).
During inspiration, the vagus nerve is not stimulated.
This gives rise to a phenomenon known as respiratory sinus
arrhythmia (RSA); cardio-acceleration during inspiration, cardio-
deceleration during expiration.

Biomedical Instrumentation B18/BME2
Autonomic Regulation
Rest & Digest Fight & Flight

Biomedical Instrumentation B18/BME2
Heart rate variability
Upper trace: respiration rate from electrical impedance
plethysmography – see next lecture.
Middle trace: beat-to-beat R-R interval.
Lower trace: R-R interval series re-sampled at 4Hz and
cubic spline fitted to time series (smoothing).

Biomedical Instrumentation B18/BME2
The sympathovagal balance:
Ratio of LF power to HF power in PSD of heart rate
time series is though to reflect sympathovagal balance

Biomedical Instrumentation B18/BME2
The circadian rhythm

Biomedical Instrumentation B18/BME2
HRV and sleep state
HRV is also circadian
Autonomic balance
changes over 24 hours
Significantly in different
sleep cycles
Also changes based on
disease.
Wakefulness Deep Sleep
Light Sleep REM (Dream) Sleep
• HR & HRV are not specific enough to identify sleep stages
• So what is ...?

Biomedical Instrumentation B18/BME2
Other biopotentials
There are other biopotentials which can be
recorded from the body using similar circuitry:
The Electroencephalogram (EEG, electrical activity of
the brain)
The Electromyogram (EMG, electrical activity of
muscle)
The Electro-oculogram (EOG, electrical activity of the
eyes)
All are used in sleep staging

Biomedical Instrumentation B18/BME2
Brief intro to the Electroencephalogram
The EEG signal is also
measured with Ag-AgCl
electrodes
Placed in standard positions
on the scalp
Signal is <100μV – Why?
(Recall ECG is ~1mV)
Heart: ~3x10⁹
Brain: ~1011
Due to skull attenuation

Biomedical Instrumentation B18/BME2
Characteristics of the EEG The important information is in the frequency domain.
The frequency range from 0.5 to 30 Hz has been
arbitrarily divided into 5 bands:
Delta 0.5-4Hz Deep Sleep
Theta 4-8 Hz Drowsiness / light sleep
Alpha 8-13 Hz Relaxed
Beta 13-22 Hz Alert
Gamma 22-30 Hz Short term memory tasks?

Biomedical Instrumentation B18/BME2
Diagnosis use of EEG
EEG helps the diagnosis of brain death, epilepsy and sleep
disorders
EEG during an epileptic seizure
10-20 Montage

Biomedical Instrumentation B18/BME2
Sleep analysis
Quality of life is heavily dependent on quality of sleep.
Between 5 and 10% of the adult population suffers from some form
of sleep disorder (insomnia, heavy snoring, Obstructive Sleep
Apnoea (OSA), etc…)
Such people may be referred to a “sleep clinic” by their GP where
various signals, including four channels of EEG, the EOG and
oxygen saturation, will be recorded throughout the night.
The EEG and the other signals are printed out and reviewed by a
trained sleep technician (requiring 2 to 5 hours for each record).

Biomedical Instrumentation B18/BME2
Sleep EEG The channels of sleep EEG are analysed using a rule-
based system
Consecutive 30s segments are assigned to one of six
stages (to form hypnogram)
Wake, Stage 1, Stage 2, Stage 3, Stage 4 & REM sleep
1= light, 3 & 4 = deep sleep
(Recently stages 3 &4 merged)

Biomedical Instrumentation B18/BME2
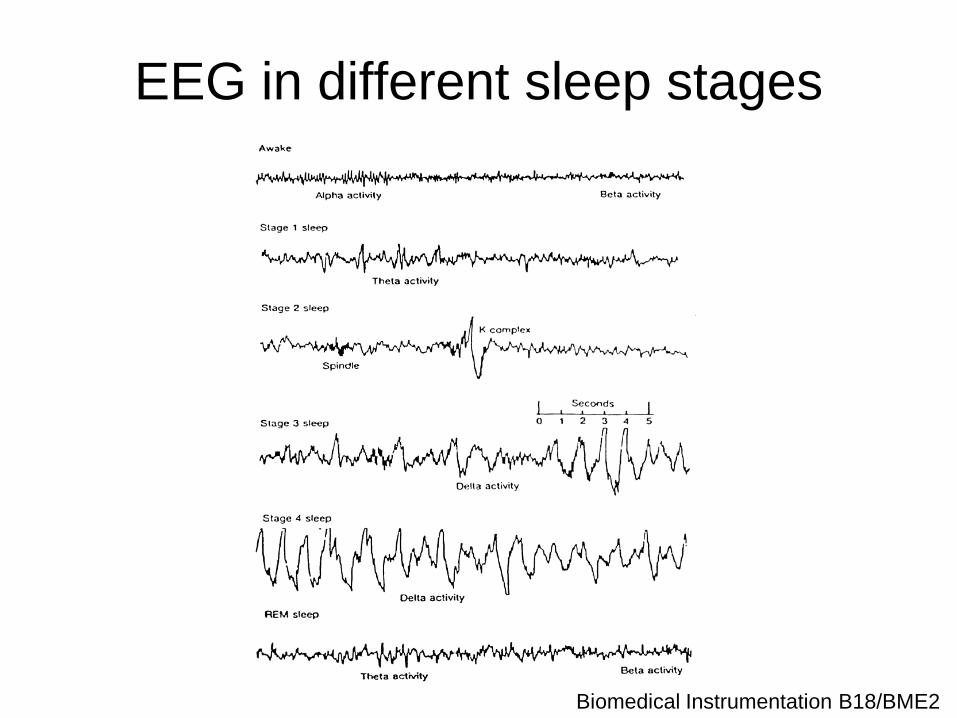
EEG rules for scoring ...
For example, two rules for stage 3:
an EEG record in which at least 20% but not
more than 50% of the epoch consists of waves of
frequency 2 Hz or lower which have amplitudes
greater than 75 μV peak to peak.
sleep spindles may or may not be present in
stage 3.
Biomedical Instrumentation B18/BME2
EEG in different sleep stages
Biomedical Instrumentation B18/BME2
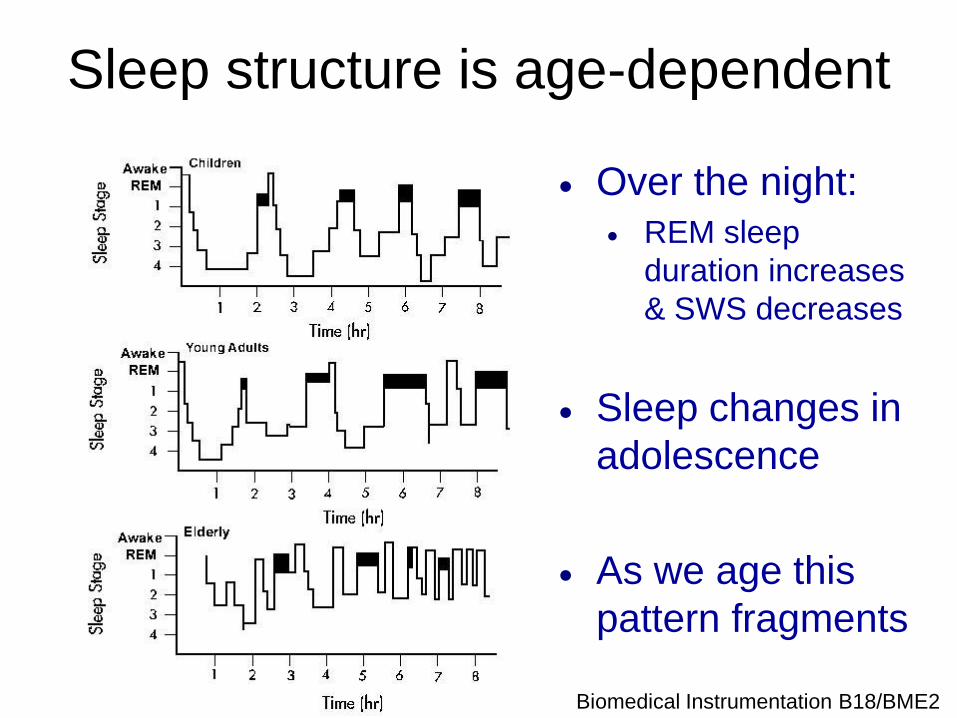
Sleep structure is age-dependent
Over the night:
REM sleep
duration increases
& SWS decreases
Sleep changes in
adolescence
As we age this
pattern fragments
Biomedical Instrumentation B18/BME2
Automating sleep analysis
The important information is in the
frequency domain.
Use the Short-term Fourier Transform or
an Auto-Regressive (AR) model to extract
the frequency-domain information.

Biomedical Instrumentation B18/BME2
Automated sleep analysis Work performed in the 90’s and 00’s (in this Department)
has led to methods for analysing sleep on a 1s basis.
Sleep is treated as having three states:
Wakefulness, REM/light sleep, deep sleep
Sleep-wake continuum is represented by interpolation
between these states.

Biomedical Instrumentation B18/BME2
Short-term Fourier transform
First extract N samples of signal and then window
(using Hamming, Kaiser or Hanning windows) to
avoid sharp discontinuities at edges.
Then apply the Discrete Fourier Transform
[O(N2) operations] or the Fast Fourier Transform
[O(N log N) operations] if N is a power of 2.

Biomedical Instrumentation B18/BME2
AR models for spectral estimation
The notation AR(p) refers to the autoregressive model of
order p. The AR(p) model is written as follows:
X t = ai X t-i + t (1 i p)
where the ai’s are the parameters of the model and εt is a white-noise process with zero mean.
An autoregressive model is essentially an infinite
impulse response filter which shapes the white-noise
input. The poles are the resonances of the filter and
correspond to the spectral peaks in the signal.

Biomedical Instrumentation B18/BME2
AR-model vs FFT spectra (for EEG)
AR model is
parametric
Requires only a
few coefficients
Useful for
estimation on
short time series

Biomedical Instrumentation B18/BME2
Automated sleep analysis AR model parameters inputted to a neural network
Sleep is treated as having three states:
Wakefulness, REM/light sleep, deep sleep
1s epochs – continuous scoring ... But it maps to sleep
stages too ...

Biomedical Instrumentation B18/BME2
EMG
The electromyogram is used to identify
muscle activity
In sleep is it used to identify mastication
Eye flicks are not constant, so EMG under
chin increases confidence in REM score

Biomedical Instrumentation B18/BME2
EOG
The electro-oculogram is used to identify
rapid eye movement (indicates dreaming)
Try it in the lab!
Biomedical Instrumentation B18/BME2
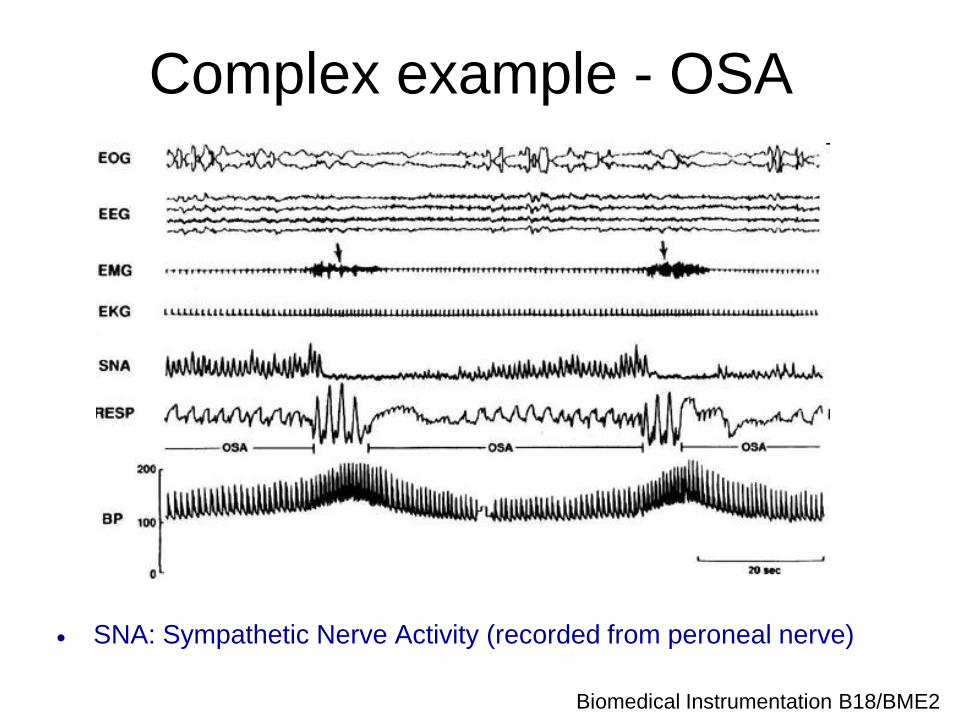
Complex example - OSA
SNA: Sympathetic Nerve Activity (recorded from peroneal nerve)

Biomedical Instrumentation B18/BME2
EEG is also used for sedation
Look at coherence between different regions of
the brain
E.g. BIS monitor
Scale of 1:100 ... Proportional to hypnotic dose of
intravenous or volatile agents used, correlating well with
the hypnotic state and importantly is agent independent.
Does not identify movement or non-movement
response, especially in the presence of opiates
Anaesthesia is more than just a loss of
consciousness
Biomedical Instrumentation B18/BME2
Evoked potentials
This is a technique whereby a stimulus, such as a light
flash or loud click, is repeatedly applied.
The EEG signal is recorded from a particular area of the
brain.
Normal EEG activity, however, masks the brains response
to a single stimulus.
Repetitive stimuli have to be used and the evoked
response is distinguished from the background activity by
using the technique of signal averaging.