b elfer c enterfor science & internationala ffairs · b elfer c enterfor science & ... gea...
TRANSCRIPT

Assessing Extreme Outcomes:The Strategic Treatment of Low
Probability Impacts of Climate Change
Anthony Patt
E-97-10 August 1997
Belfer Center for Science &International Affairs
Global Environmental Assessment Project
Environmental and Natural Resources Program
John F. Kennedy School of Government
Harvard University
CITATION, CONTEXT, AND REPRODUCTION
This paper may be cited as: Anthony G. Patt. “Assessing Extreme Outcomes: The Strategic Treatment ofLow Probability Impacts of Climate Change.” ENRP Discussion Paper E-97-10, Kennedy School ofGovernment, Harvard University, August 1997 and also as International Institute for Applied SystemsAnalysis Interim Report IR-97-037/August.
This document appears as ENRP Discussion Paper E-97-10 of the Environment and Natural ResourcesProgram (ENRP), Belfer Center for Science and International Affairs (BCSIA). ENRP Discussion papersare works in progress. This paper may be reproduced for personal and classroom use. Any otherreproduction is not permitted without written permission. Comments are welcome and may be directed tothe author in care of Nancy Dickson, GEA Project Associate Director, BCSIA, Kennedy School ofGovernment, Harvard University, 79 JFK Street, Cambridge, MA 02138, telephone (617) 496-9469,telefax (617) 495-8963, Email [email protected]. The views expressed in this paper are thoseof the author(s) and publication does not imply their endorsement by BCSIA and Harvard University.
The Global Environmental Assessment (GEA) project is a collaborative team study of globalenvironmental assessment as a link between science and policy. The Team is based at HarvardUniversity, but includes substantial contributions from the International Institute for Applied SystemsAnalysis (IIASA) in Austria, Cornell University, Duke University and the Center for Integrated Study ofthe Human Dimensions of Global Change at Carnegie Mellon University. The project has two principalobjectives. The first is to develop a more realistic and synoptic model of the actual relationships amongscience, assessment, and management in social responses to global change, and to use that model tounderstand, critique, and improve current practice of assessment as a bridge between science and policymaking. The second is to elucidate a strategy of adaptive assessment and policy for global environmentalproblems, along with the methods and institutions to implement such a strategy in the real world.
The GEA Project is supported by a core grant from the National Science Foundation (Award No. SBR-9521910) for the "Global Environmental Assessment Team.” Additional support is provided by theDepartment of Energy (Award No. DE-FG02-95ER62122) for the project "Assessment Strategies forGlobal Environmental Change," the National Institute for Global Environmental Change Great PlainsOffice (Award No. LWT 62-123-06518) for the project "Towards Useful Integrated Assessments: ABottom-up Approach,” the Belfer Center for Science and International Affairs, the International Institutefor Applied Systems Analysis, and the Center for Integrated Study of the Human Dimensions of GlobalChange at Carnegie Mellon University.
Publication abstracts of the GEA Project can be found on the GEA Web Page athttp://environment.harvard.edu/gea. Further information on the Global Environmental Assessmentproject can be obtained from the Project Associate Director, Nancy Dickson, Belfer Center for Science andInternational Affairs, Kennedy School of Government, Harvard University, 79 JFK Street, Cambridge,MA 02138, telephone (617) 496-9469, telefax (617) 495-8963, Email [email protected].
1997 by Anthony G. Patt. All rights reserved.

ABSTRACT
Many assessments of climate change fail to consider the possibility of low probability, yetcatastrophic, outcomes of greenhouse warming. A noteworthy example is the potential rapiddeterioration of the West Antarctic ice sheet. If the ice sheet were to melt, as a minority ofscientists believe it may, sea levels could rise by five meters or more in the next century. This studyseeks to develop a theory that can predict why certain classes of assessments assess extremeoutcomes, while other classes of assessments ignore them. Work in behavioral psychology arguesthat individual decision-makers display predictable bias when interpreting low probability events,either underestimating or overestimating the associated risks. Drawing on this work, this studytheorizes that assessors who operate by consensus, and who are trying not to create controversy,will avoid issue areas, such as low probability outcomes, where biased interpretations are likely.Staff advisors who are asked to assess such issue areas will seek to offer explanations thatovercome people’s propensity for bias. Finally, advocates writing assessments will seek to takeadvantage of people’s bias. Using a case study of the West Antarctic ice sheet issue, this studyfinds empirical evidence that supports these predictions.
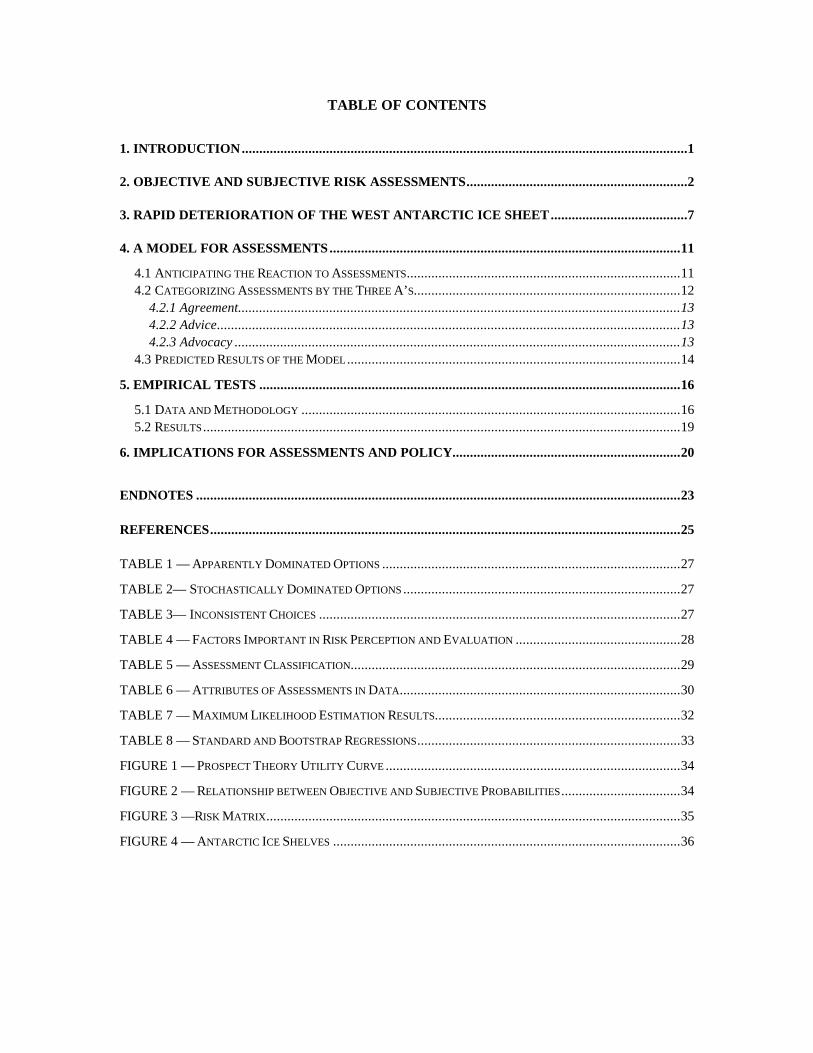
TABLE OF CONTENTS
1. INTRODUCTION...............................................................................................................................1
2. OBJECTIVE AND SUBJECTIVE RISK ASSESSMENTS...............................................................2
3. RAPID DETERIORATION OF THE WEST ANTARCTIC ICE SHEET.......................................7
4. A MODEL FOR ASSESSMENTS....................................................................................................11
4.1 ANTICIPATING THE REACTION TO ASSESSMENTS..............................................................................114.2 CATEGORIZING ASSESSMENTS BY THE THREE A’S............................................................................12
4.2.1 Agreement..............................................................................................................................134.2.2 Advice....................................................................................................................................134.2.3 Advocacy ...............................................................................................................................13
4.3 PREDICTED RESULTS OF THE MODEL ...............................................................................................14
5. EMPIRICAL TESTS ........................................................................................................................16
5.1 DATA AND METHODOLOGY ............................................................................................................165.2 RESULTS ........................................................................................................................................19
6. IMPLICATIONS FOR ASSESSMENTS AND POLICY.................................................................20
ENDNOTES ..........................................................................................................................................23
REFERENCES......................................................................................................................................25
TABLE 1 — APPARENTLY DOMINATED OPTIONS .....................................................................................27
TABLE 2— STOCHASTICALLY DOMINATED OPTIONS ...............................................................................27
TABLE 3— INCONSISTENT CHOICES .......................................................................................................27
TABLE 4 — FACTORS IMPORTANT IN RISK PERCEPTION AND EVALUATION ...............................................28
TABLE 5 — ASSESSMENT CLASSIFICATION..............................................................................................29
TABLE 6 — ATTRIBUTES OF ASSESSMENTS IN DATA................................................................................30
TABLE 7 — MAXIMUM LIKELIHOOD ESTIMATION RESULTS......................................................................32
TABLE 8 — STANDARD AND BOOTSTRAP REGRESSIONS...........................................................................33
FIGURE 1 — PROSPECT THEORY UTILITY CURVE ....................................................................................34
FIGURE 2 — RELATIONSHIP BETWEEN OBJECTIVE AND SUBJECTIVE PROBABILITIES..................................34
FIGURE 3 —RISK MATRIX......................................................................................................................35
FIGURE 4 — ANTARCTIC ICE SHELVES ...................................................................................................36

ACRONYM LIST
ADB Asian Development BankCEQ Council on Environmental QualityDOE Department of EnergyEES Environmental Energy Solutions
EPA Environmental Protection AgencyICSU International Council of Scientific UnionsIEA International Energy AssociationIIASA International Institute for Applied Systems AnalysisIPCC Intergovernmental Panel on Climate ChangeNRC National Research CouncilOTA Office of Technology AssessmentSEI Stockholm Environmental InstituteUNEP United Nations Environmental ProgrammeWCP World Climate ProgramWRI World Resources Institute

1. INTRODUCTION1
Of all the possible effects of climate change, the sudden deterioration of the West Antarctic icesheet is one of the least likely, and yet one of the more disastrous. Most evidence points to theinherent stability of the marine based ice, yet scientists have not entirely eliminated the possibilitythat it could collapse in the next hundred years, due to warming caused by anthropogenicgreenhouse gas emissions. If it were to deteriorate, sea levels would rise by as much as ten meters,flooding vast areas of coastal floodplain and urban development. So even if the possibility of theice sheet’s sudden collapse is trivially low, we would still expect responsible climate experts todiscuss its potential. When measured in terms of expected damages—the probability of the eventtimes its magnitude—the threat of the sudden collapse of the West Antarctic ice sheet may well beas important as other, more likely outcomes of global climate change.
Several of the larger assessments in recent years have not explained the likelihood of the WestAntarctic ice sheet deterioration. One example is the Second Assessment Report of theIntergovernmental Panel on Climate Change (IPCC) Working Group III, which did not discuss theissue. In that same assessment, one finds little attention given to other “surprise” scenarios. Rather,the volume focuses almost exclusively on the implications of the most likely outcome. Why shouldthe assessment community largely ignore impacts and outcomes of climate change that are deemedunlikely yet possible, when the scientific community continues to publish findings related to theseevents?
Several explanations have been suggested for the failure of many assessments to give serioustreatment to outlier possibilities. One view is that scientists want to protect their legitimacy, andhence avoid issues that are out of the scientific mainstream. This explanation fails in three respects.First, one often observes scientists tackling issues that are associated with small probabilities,whether it is investigating the possibility of life on Mars, or attempting to find a cure for AIDS.Second, one would expect that as the number of scientists in a particular field decreased, becausethe issue is considered an outlier, some scientists would perceive a greater possibility of makingoriginal findings. If one treats the choice of research topics as a competitive market, there shouldalways be some scientists in every niche of research. Third, and in the case of West Antarcticamost important, is that the science itself is being done. Contributions to journals such as Natureand Science are frequent. For example, a number of scientists have devoted their careers tostudying the stability of the West Antarctic ice sheet, and the possibility that it will collapse rapidlyas a result of anthropogenic climate change. Rather, one observes a paucity of assessments thatdiscuss the issue seriously. Something about assessors, distinguished from scientists, makes themreluctant to examine extreme events.
I propose that a model of strategic action by assessors, combined with their knowledge thatdecision makers display systematic bias when presented with low probability risks, can offer amore accurate and more useful explanation. The model explains why some groups, such as theenvironmental advocacy community, might wish to highlight the “tails” of the distribution. Othergroups, consensus seekers like the IPCC, might shy away from even mentioning the possibility ofsurprise. I test the model using multivariate regression analysis, and find significant correlation

ANTHONY G. PATT—ASSESSING EXTREME OUTCOMES
2
between the type of assessment and the treatment of a particular extreme outcome, in accordancewith the theoretical model.
This paper follows the following outline. In Part 2, I discuss the literature in behavioral psychologyand decision theory that relates to the framing of risk and uncertainty. I can not hope to cover all ofthe literature in this area. Rather, I seek to provide an understanding of some of the ways thatpeople typically depart from a “rational actor” model in situations involving risk and uncertainty.This discussion contributes to the paper by providing the basis for assumptions about how peoplemay react to assessments, and why reactions to events of low probability may be especially subjectto issue framing by assessors. In Part 3, I discuss the theory of a possible West Antarctic ice sheetcollapse. The purpose of this discussion is not so much to convince readers that such an event willor will not occur, but to give a feel for the lack of understanding surrounding this issue and othersof its type. Because of the high level of uncertainty and low probability of this outcome, I choose itas a case study to test the model. In Part 4, I apply the theories from Part 2 to the study ofassessments of climate change. Because my model relies upon the assumption of rational strategicbehavior on the part of those doing assessments, I attempt to distinguish different motivesassociated with different types of assessment. Thus, I categorize assessments according to theirmotive, and use that categorization to predict the treatment of extreme events. I use the example ofWest Antarctica, from Part 3, to ground the discussion and hypotheses in a real issue area. In Part5 I test the hypotheses by examining the treatment of West Antarctic ice sheet issue by a setassessments. I rely on quantitative tests, using both multinomial logit and standard logit regressionmodels, in which I control for several other variables, such as the year in which a given assessmentwas written. Because the sample size is small, I supplement these regressions with a simulationusing the non-parametric bootstrap technique. My purpose is to examine whether a correlation doesexist between type of assessment and the treatment given to extreme events. In Part 6, I discuss theimplication of the model presented in this paper for assessors and for policy makers.
2. OBJECTIVE AND SUBJECTIVE RISK ASSESSMENTS
A body of research points to the failure of most decision-makers to take proper account of outcomeprobability distributions. The literature points to people’s difficulty and unwillingness to compareand analyze risks when making decisions. People are especially bad at making decisions whenassessed outcomes have probabilities very close to one or zero. They display systematic bias inover weighting the chance of very low probability events, and under weighting very highprobability events. Their decisions in these contexts are highly sensitive to how problems areframed.
Some of the earliest, and best known, work in this field was conducted by Daniel Kahneman andAmos Tversky, both psychologists, who called their work “prospect theory”.2 The initial basis forprospect theory lay in three empirical observations: (1) people tend to demonstrate risk aversebehavior with respect to potential positive changes in wealth; (2) people tend to demonstrate risktaking behavior with respect to negative changes in wealth; (3) people tend to place more emphasison potential losses in wealth than to equally sized gains in wealth. That is, a gain of $2,000 dollarsis less than twice as good as a gain of $1,000, a loss of $2,000 is less than twice as bas as a loss of
ANTHONY G. PATT—ASSESSING EXTREME OUTCOMES
3
$1,000, and the magnitude of the loss of value associated with losing $1,000 is greater than themagnitude of gain of value associated with a gain of $1,000. Figure 1 represents this function.
People who are confronted with the choice between a certain outcome of a net gain in wealth, and arisky gamble that has the same mathematical expected payoff as the certain outcome, usuallychoose the certain outcome. The same people, however, when confronted with a choice between acertain negative outcome and a gamble over losses with the same mathematical expected payoff,will prefer to take the gamble. For example, Tversky and Kahneman posed a hypothetical situationto a group of people: a rare disease is breaking out in a community, and is expected to kill 600people. With treatment A, 200 people will be saved for sure. With treatment B, there is a two-thirdschance that nobody will be saved, and a one-third chance that all 600 people will be saved. Over70% of those surveyed preferred treatment A. Tversky and Kahneman posed the same problem to adifferent group, but phrased the implications differently. If treatment C is adopted, 400 people willdie for sure. If treatment D is adopted, there is a two-thirds chance that 600 people will die, and aone-third chance that nobody will die. In this case, over 70% of those surveyed preferred treatmentD. As is apparent, treatments A and C were the same, as were B and D, yet people’s preferenceschanged when confronted with the possibility of gain or loss. In this case, people’s decisions weresensitive to how the question is framed, whether it was framed as a choice involving risks of gainsor risks of losses.
A second finding of prospect theory is that people keep separate mental accounts. For instance,people were posed a hypothetical situation involving theater tickets, which cost $40 each. Imaginethat you have already bought the ticket, the researchers asked, but when you arrive at the theater,you find it missing. Do you buy another one? Most people said no, citing $80 as too much to spendon a single theater ticket. Imagine, however, that you have yet to buy the ticket, and just as youarrive at the theater to purchase it you discover that you have lost two twenty dollar bills from yourwallet. Do you still purchase the ticket? Most people said yes, noting that the missing $40 hadnothing to do with the price of the theater ticket. In each case, one has a choice between being fortydollars poorer, or eighty dollars poorer but well entertained. People’s decisions appear sensitive tohow losses are categorized.
Tversky and Kahneman identify four key assumptions implicit in a normative decision theorybased on “rational” utility functions. The first is cancellation, also known as the elimination ofirrelevant alternatives. For example, if I prefer winning A to winning B, then I should preferwinning A if it rains tomorrow than winning B if it rains tomorrow, unless they are weatherdependent, such as playing tennis outside or going skating inside. The second is transitivity. If Iprefer A to B, and prefer B to C, then I must prefer A to C. The third assumption is dominance, ormore strongly, stochastic dominance. One option purely dominates another if in every possiblestate of the world it has an outcome at least as good. It stochastically dominates the other if acrossall levels of cumulative probability, it has an outcome that is superior. The final assumption ofexpected utility theory is invariance: different representation of the same problem should yield thesame result. We have already seen this fail in the case of the 600 sick people.
To see how these assumptions about rational behavior fail in practice, Tversky and Kahnemanidentify two distinct phases of the decision process. In the first phase, a preliminary analysis of the

ANTHONY G. PATT—ASSESSING EXTREME OUTCOMES
4
problem, people frame the effective acts, contingencies, and outcomes. During this phase, peoplenote what they perceive to be dominant, dominated, and irrelevant alternatives. Since the level ofanalysis is not deep in this stage, people are highly susceptible to how a problem is framed, forthey tend to draw out those conclusions that are most obvious. Imagine a problem involving a caseof stochastic dominance. States A, B, and C are each equally likely outcomes of a lottery. I shouldprefer the gamble for one dollar in state A, five dollars in state B, and ten dollars in state C to thegamble for four dollars in state A, ten dollars in state B, and one dollar in state C. The two possiblelotteries are presented below:
Many people, in their preliminary analysis, might convert the problem into one where they see thatin two of the three states (A and B), Option 2 provides the better payoff, whereas in one of the threestates (C), Option 1 is preferable. In the first stage, people do not typically go so far as torearrange the boxes as follows, where it is obvious that Option 1 is the better choice:
The level of analysis that reveals that Option 1 stochastically dominates Option 2 would probablynot be reached. Instead, people make their preliminary framing, and then enter the second phase ofdeciding, in which they select the prospect of highest value. The first part of the decision processoften determines the final outcome.
Because the analysis in the first stage is not as deep, this stage is highly susceptible to howproblems are presented, as well as by “norms, habits, and expectations” of the decision maker(Tversky and Kahneman 1988, 172). The first stage of decision can include people’s emotionalreactions to a problem. The bias that can result in the first stage of decision, due to mistakenjudgments about dominated or irrelevant alternatives, can lead to people’s violating each of thefour assumptions underlying the normative model of decision making under uncertainty. Problemsthat are prone to misevaluation in the critical first step of the process are most sensitive to themanner in which they are framed and presented.
An important result of this bifurcated decision process is that events are not necessarily weightedaccording to their true probabilities. Events with probabilities very close to zero register in the firststage of the decision process as having some positive probability; often, they are over weighted.Events with probabilities very close to one register in the first stage of the decision process as beingless than sure outcomes; often, they are under weighted. Students of decision theory are often giventhe following hypothetical choice: between two lotteries, A and B. Lottery A involves a 99% chanceof winning $1000, and a 1% chance of winning nothing. Lottery B involves a 100% chance to win$900. Most subjects choose option B. They are then given the choice between two other lotteries, Cand D. Lottery C involves a 90% chance to win $5000, and a 10% chance to win nothing. LotteryD involves an 89% chance to win $5050, and an 11% chance to win nothing. Most subjects preferlottery D. The lotteries can be seen in terms of payoffs for each level of probability in the tablebelow:
In both cases, people tend to pick the outcome with the lower expected value, although in the firstcase their answer minimizes the variance of the expected outcome, while in the second case itmaximizes it. One explanation for this result is that they place too much emphasis on the 1%chance of failure in lottery A, a probability close to zero. At the same time, they tend to disregard
ANTHONY G. PATT—ASSESSING EXTREME OUTCOMES
5
the difference between the 90% chance of success in lottery C and the 89% chance of success inlottery D.
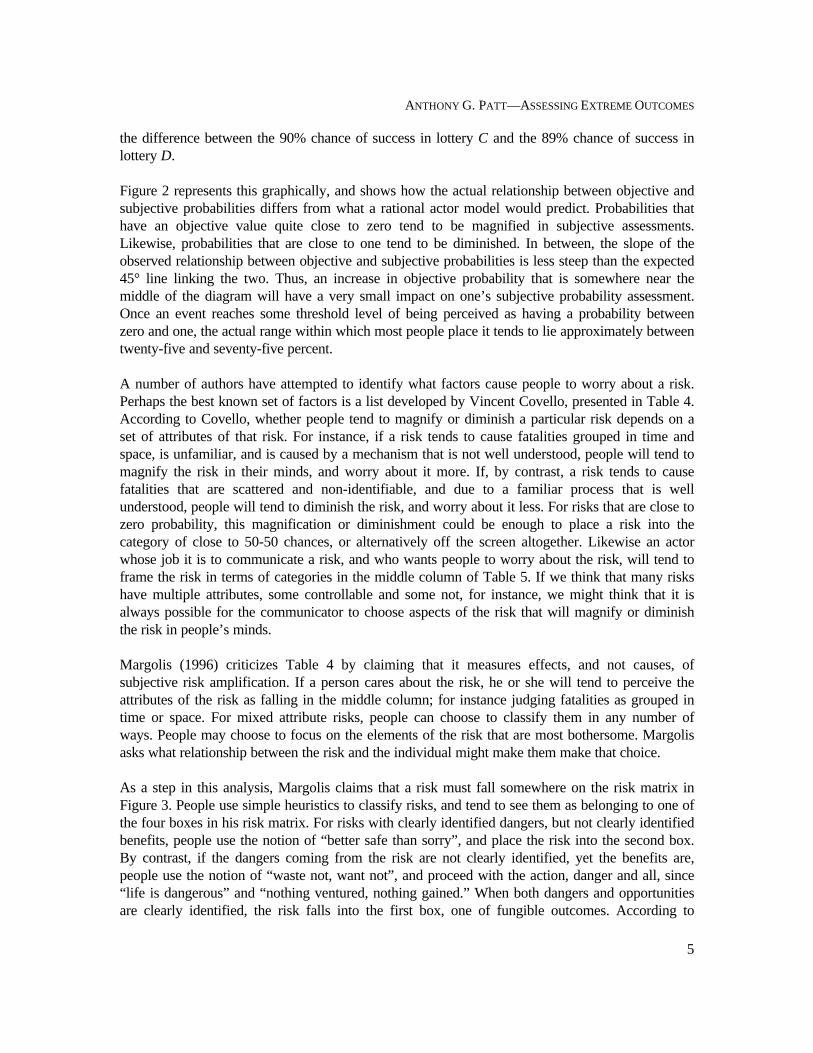
Figure 2 represents this graphically, and shows how the actual relationship between objective andsubjective probabilities differs from what a rational actor model would predict. Probabilities thathave an objective value quite close to zero tend to be magnified in subjective assessments.Likewise, probabilities that are close to one tend to be diminished. In between, the slope of theobserved relationship between objective and subjective probabilities is less steep than the expected45° line linking the two. Thus, an increase in objective probability that is somewhere near themiddle of the diagram will have a very small impact on one’s subjective probability assessment.Once an event reaches some threshold level of being perceived as having a probability betweenzero and one, the actual range within which most people place it tends to lie approximately betweentwenty-five and seventy-five percent.
A number of authors have attempted to identify what factors cause people to worry about a risk.Perhaps the best known set of factors is a list developed by Vincent Covello, presented in Table 4.According to Covello, whether people tend to magnify or diminish a particular risk depends on aset of attributes of that risk. For instance, if a risk tends to cause fatalities grouped in time andspace, is unfamiliar, and is caused by a mechanism that is not well understood, people will tend tomagnify the risk in their minds, and worry about it more. If, by contrast, a risk tends to causefatalities that are scattered and non-identifiable, and due to a familiar process that is wellunderstood, people will tend to diminish the risk, and worry about it less. For risks that are close tozero probability, this magnification or diminishment could be enough to place a risk into thecategory of close to 50-50 chances, or alternatively off the screen altogether. Likewise an actorwhose job it is to communicate a risk, and who wants people to worry about the risk, will tend toframe the risk in terms of categories in the middle column of Table 5. If we think that many riskshave multiple attributes, some controllable and some not, for instance, we might think that it isalways possible for the communicator to choose aspects of the risk that will magnify or diminishthe risk in people’s minds.
Margolis (1996) criticizes Table 4 by claiming that it measures effects, and not causes, ofsubjective risk amplification. If a person cares about the risk, he or she will tend to perceive theattributes of the risk as falling in the middle column; for instance judging fatalities as grouped intime or space. For mixed attribute risks, people can choose to classify them in any number ofways. People may choose to focus on the elements of the risk that are most bothersome. Margolisasks what relationship between the risk and the individual might make them make that choice.
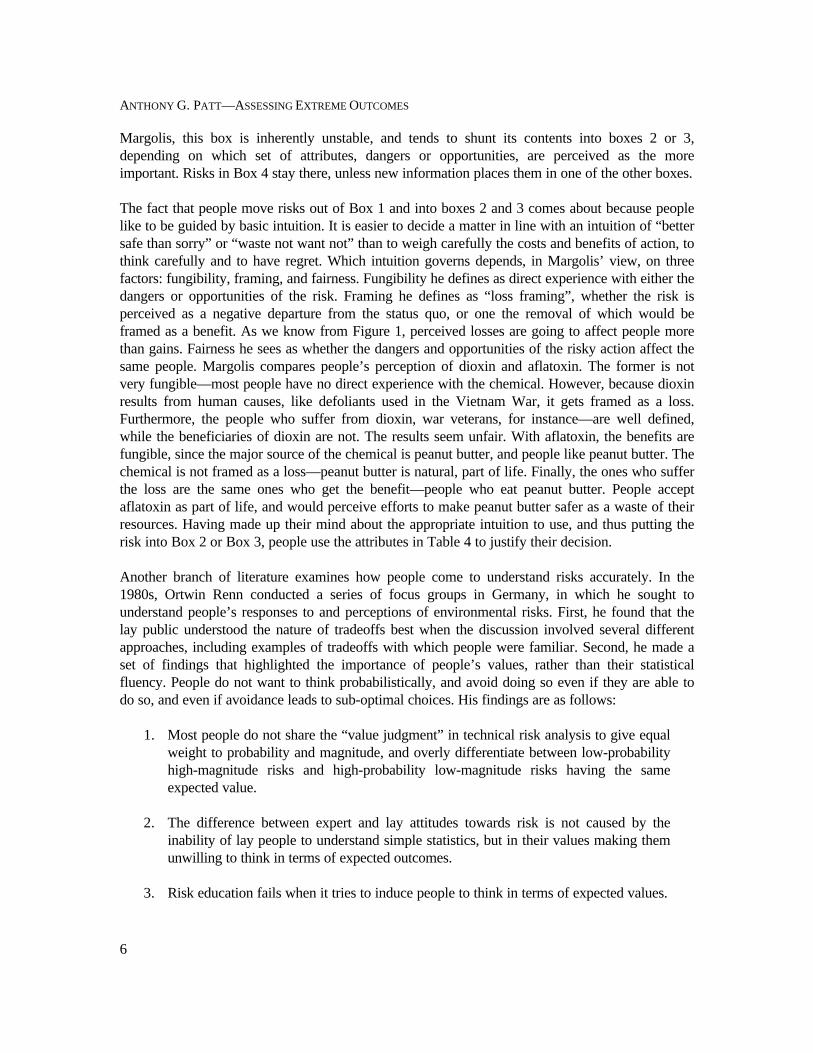
As a step in this analysis, Margolis claims that a risk must fall somewhere on the risk matrix inFigure 3. People use simple heuristics to classify risks, and tend to see them as belonging to one ofthe four boxes in his risk matrix. For risks with clearly identified dangers, but not clearly identifiedbenefits, people use the notion of “better safe than sorry”, and place the risk into the second box.By contrast, if the dangers coming from the risk are not clearly identified, yet the benefits are,people use the notion of “waste not, want not”, and proceed with the action, danger and all, since“life is dangerous” and “nothing ventured, nothing gained.” When both dangers and opportunitiesare clearly identified, the risk falls into the first box, one of fungible outcomes. According to
ANTHONY G. PATT—ASSESSING EXTREME OUTCOMES
6
Margolis, this box is inherently unstable, and tends to shunt its contents into boxes 2 or 3,depending on which set of attributes, dangers or opportunities, are perceived as the moreimportant. Risks in Box 4 stay there, unless new information places them in one of the other boxes.
The fact that people move risks out of Box 1 and into boxes 2 and 3 comes about because peoplelike to be guided by basic intuition. It is easier to decide a matter in line with an intuition of “bettersafe than sorry” or “waste not want not” than to weigh carefully the costs and benefits of action, tothink carefully and to have regret. Which intuition governs depends, in Margolis’ view, on threefactors: fungibility, framing, and fairness. Fungibility he defines as direct experience with either thedangers or opportunities of the risk. Framing he defines as “loss framing”, whether the risk isperceived as a negative departure from the status quo, or one the removal of which would beframed as a benefit. As we know from Figure 1, perceived losses are going to affect people morethan gains. Fairness he sees as whether the dangers and opportunities of the risky action affect thesame people. Margolis compares people’s perception of dioxin and aflatoxin. The former is notvery fungible—most people have no direct experience with the chemical. However, because dioxinresults from human causes, like defoliants used in the Vietnam War, it gets framed as a loss.Furthermore, the people who suffer from dioxin, war veterans, for instance—are well defined,while the beneficiaries of dioxin are not. The results seem unfair. With aflatoxin, the benefits arefungible, since the major source of the chemical is peanut butter, and people like peanut butter. Thechemical is not framed as a loss—peanut butter is natural, part of life. Finally, the ones who sufferthe loss are the same ones who get the benefit—people who eat peanut butter. People acceptaflatoxin as part of life, and would perceive efforts to make peanut butter safer as a waste of theirresources. Having made up their mind about the appropriate intuition to use, and thus putting therisk into Box 2 or Box 3, people use the attributes in Table 4 to justify their decision.
Another branch of literature examines how people come to understand risks accurately. In the1980s, Ortwin Renn conducted a series of focus groups in Germany, in which he sought tounderstand people’s responses to and perceptions of environmental risks. First, he found that thelay public understood the nature of tradeoffs best when the discussion involved several differentapproaches, including examples of tradeoffs with which people were familiar. Second, he made aset of findings that highlighted the importance of people’s values, rather than their statisticalfluency. People do not want to think probabilistically, and avoid doing so even if they are able todo so, and even if avoidance leads to sub-optimal choices. His findings are as follows:
1. Most people do not share the “value judgment” in technical risk analysis to give equalweight to probability and magnitude, and overly differentiate between low-probabilityhigh-magnitude risks and high-probability low-magnitude risks having the sameexpected value.
2. The difference between expert and lay attitudes towards risk is not caused by theinability of lay people to understand simple statistics, but in their values making themunwilling to think in terms of expected outcomes.
3. Risk education fails when it tries to induce people to think in terms of expected values.

ANTHONY G. PATT—ASSESSING EXTREME OUTCOMES
7
4. Communication that focuses on exchanging information on perspectives and valuesystems, without claiming one or another position to be superior, does well at inducingpeople to understand the risks involved in more statistical terms, and to compromise onvarious tradeoffs involved in choosing among competing risks (Renn 1991, 470-471).
A related question is whether policy makers react to risk issues in the same way as the generalpublic. Studies of managers and administrators in the public and private sectors indicate that policymakers are not necessarily better than lay people in making decisions. They tend to fall into thesame traps of bounded rationality and misperception of probabilities that plague most people.(March 1988). For instance, when Kahneman and Tversky performed their experiment, in whichsubjects could choose to save 200 people out of 600, or all 600 with a 33% chance of success, theyfound that doctors performed no more in accordance with a rational actor model than members ofthe lay public. (Kahneman and Tversky 1988). Shlyakhter et al. (1994) found that energy modelswere subject to consistent and predictable biases. Gordon and Kammen (1996) found a similarresult in forecasts of stock behavior. Both of these involved predictions by experts in a field. ButKammen et al. (1994) note instances when trained experts in government, such as physicians whodecide matters of public health, do perceive risks correctly, but face a voting public that insists onanother interpretation. We could anticipate, then, that whether a policy maker falls victim to thestandard misperception of risks would depend on a number of factors. First, we might expect somebureaucrats to be trained experts in the particular policy field, and thus to understand the nature ofthe risks involved. Decisions that are subject to their discretion may receive proper analysis.Second, we might expect members of congress or parliament, who are rarely scientific experts, toperform little better than the lay public. Third, we would expect that in the context of decisions thatare highly publicized, policy makers would be more likely to follow public, rather than expert,opinion. Perhaps the best example of this is with the issue of nuclear energy. (Dooley 1987) Inthese cases, policy makers would perform no better than the lay public.
3. RAPID DETERIORATION OF THE WEST ANTARCTIC ICE SHEET
In 1978, J.H. Mercer, a glaciologist from Ohio State University, published an article in the journalNature, in which he hypothesized that the West Antarctic ice sheet could disintegrate rapidly if anumber of ice shelves, the floating masses of ice at the fringe of the ice sheet, were to deteriorate,something possible under a global warming scenario. Building on theory developed four yearsearlier by J. Weertman, he noted that the ice shelves buttress the ice sheet behind them, blockingwhat would otherwise be a rapid stream of ice into the sea. Since the West Antarctic ice sheetappears to be a marine ice sheet, resting not on dry land but on a bed well below sea level, it couldundergo a rapid change. Two ice shelves in particular, the Ross ice shelf and the Ronne-Filchnerice shelf, potentially hold the entire West Antarctic ice sheet together, and prevent it fromcollapsing into the sea adjacent to the Antarctic peninsula. However, these two ice shelves arethemselves fragile. In order to survive, they require mean summer (January) temperatures toremain below 0°C. This is roughly equivalent to having mean annual temperatures remain below –5°C. At present, their climatic zone is well below this threshold. Since its original publication,Mercer’s theory has received attention from both the scientific literature and the popular press.
ANTHONY G. PATT—ASSESSING EXTREME OUTCOMES
8
Here, I present an overview both of the theory, the controversy surrounding it, and the attention itreceived in the public eye.
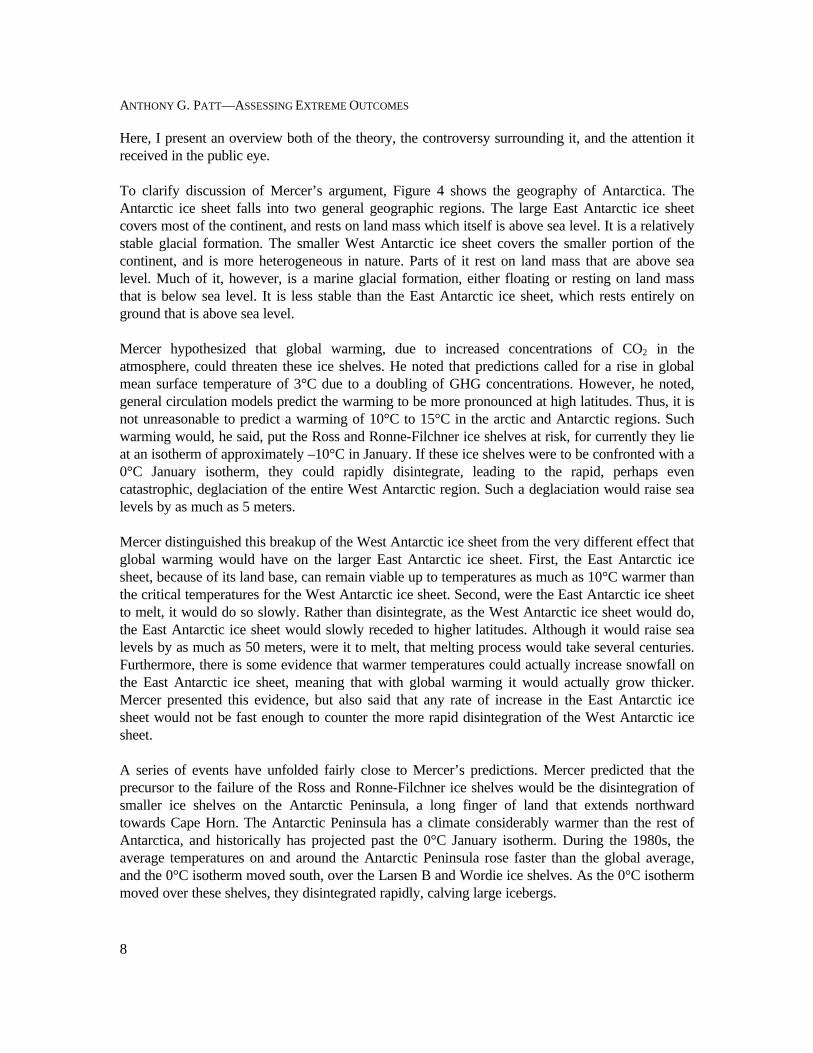
To clarify discussion of Mercer’s argument, Figure 4 shows the geography of Antarctica. TheAntarctic ice sheet falls into two general geographic regions. The large East Antarctic ice sheetcovers most of the continent, and rests on land mass which itself is above sea level. It is a relativelystable glacial formation. The smaller West Antarctic ice sheet covers the smaller portion of thecontinent, and is more heterogeneous in nature. Parts of it rest on land mass that are above sealevel. Much of it, however, is a marine glacial formation, either floating or resting on land massthat is below sea level. It is less stable than the East Antarctic ice sheet, which rests entirely onground that is above sea level.
Mercer hypothesized that global warming, due to increased concentrations of CO2 in theatmosphere, could threaten these ice shelves. He noted that predictions called for a rise in globalmean surface temperature of 3°C due to a doubling of GHG concentrations. However, he noted,general circulation models predict the warming to be more pronounced at high latitudes. Thus, it isnot unreasonable to predict a warming of 10°C to 15°C in the arctic and Antarctic regions. Suchwarming would, he said, put the Ross and Ronne-Filchner ice shelves at risk, for currently they lieat an isotherm of approximately –10°C in January. If these ice shelves were to be confronted with a0°C January isotherm, they could rapidly disintegrate, leading to the rapid, perhaps evencatastrophic, deglaciation of the entire West Antarctic region. Such a deglaciation would raise sealevels by as much as 5 meters.
Mercer distinguished this breakup of the West Antarctic ice sheet from the very different effect thatglobal warming would have on the larger East Antarctic ice sheet. First, the East Antarctic icesheet, because of its land base, can remain viable up to temperatures as much as 10°C warmer thanthe critical temperatures for the West Antarctic ice sheet. Second, were the East Antarctic ice sheetto melt, it would do so slowly. Rather than disintegrate, as the West Antarctic ice sheet would do,the East Antarctic ice sheet would slowly receded to higher latitudes. Although it would raise sealevels by as much as 50 meters, were it to melt, that melting process would take several centuries.Furthermore, there is some evidence that warmer temperatures could actually increase snowfall onthe East Antarctic ice sheet, meaning that with global warming it would actually grow thicker.Mercer presented this evidence, but also said that any rate of increase in the East Antarctic icesheet would not be fast enough to counter the more rapid disintegration of the West Antarctic icesheet.
A series of events have unfolded fairly close to Mercer’s predictions. Mercer predicted that theprecursor to the failure of the Ross and Ronne-Filchner ice shelves would be the disintegration ofsmaller ice shelves on the Antarctic Peninsula, a long finger of land that extends northwardtowards Cape Horn. The Antarctic Peninsula has a climate considerably warmer than the rest ofAntarctica, and historically has projected past the 0°C January isotherm. During the 1980s, theaverage temperatures on and around the Antarctic Peninsula rose faster than the global average,and the 0°C isotherm moved south, over the Larsen B and Wordie ice shelves. As the 0°C isothermmoved over these shelves, they disintegrated rapidly, calving large icebergs.
ANTHONY G. PATT—ASSESSING EXTREME OUTCOMES
9
In the March 28, 1991 issue of Nature, Doake and Vaughan reported that the Wordie ice shelf hadbroken up as a result of climatic warming in the region. They hypothesized that large amount ofmelt water had seeped into the lower portions of the glacial formation, destabilizing it and leadingto a series of fractures. Further, they hypothesized that its break up would allow the streams of iceon the West Antarctic Ice Sheet, already moving at rates of up to 1,000 meters per year, toaccelerate. In the same issue of Nature, Jay Zwally referred to the stability of the West Antarcticice sheet as “glaciology’s grand unsolved problem.”
Four years later, the northern part of the Larsen ice shelf underwent a process of rapiddeterioration, this time attracting the attention of the popular press. On March 26, 1995, theSunday Telegraph reported
The recent breaking off from Antarctica of an iceberg the size of Oxfordshire has producedhowls from doomsayers, who see it as the first serious sign of global warming that couldmelt the icecaps and submerge the planet’s coastal cities. But ministers meeting in Berlinthis week to discuss the climate need not be too concerned by the iceberg’s appearance.Glaciologists are convinced that the break-off had nothing to do with global warming, andthat fears of a catastrophic rise in sea levels in the near future are groundless (Berry 1995,19)
Later that week Newsweek ran a story on the event, describing the implications of the new icebergthe size of Rhode Island:
The ice shelves, says glaciologist David Vaughan of the British Antarctic Survey, “havebeen around for a very, very long time”; that they are piles of ice cubes leaves no doubtthat Antarctica is experiencing “regional warming.” Without intact ice shelves to coolthem, winds blowing over Antarctica will be warmer than usual, says geophysicist CharlesEbert of the State University of New York at Buffalo. If the winds melt even a tenth of thecontinent’s ice, sea levels worldwide would rise 12 to 30 feet. . . . That prospect addsurgency to a meeting in Berlin this week, where more than 100 countries will discuss theclimate-change treaty. . . . The Caribbean nation Trinidad and Tobago, for one, fears thatrising sea levels will turn it into the new Atlantis (Begley et al. 1995, 56).
A few days after that, the story played on National Public Radio in the United States.
Mark Meyer, a glacier expert at the University of Colorado, says the temperature changecould have been enough to bring about the dramatic changes now being witnessed. . . .This prospect raises two questions. First, is the higher temperature at the AntarcticPeninsula a sign of global warming due to air pollution? And second, is the rest of thefrozen continent showing any discomforting signs as well. Meyer says scientists simplycan’t answer either question. . . . The fate of Antarctica is key in the story of globalwarming. If the continent’s huge ice sheets melted, global sea levels could rise more than20 feet, flooding many of the world’s major cities. . . . Because there is so much naturalvariability though, scientists may never know whether human activity is helping to melt theice shelves of the Antarctic Peninsula (Harris 1995).

ANTHONY G. PATT—ASSESSING EXTREME OUTCOMES
10
Doake and Vaughan themselves reached the conclusion that the break up could be attributed to,and was an indicator of, global climate change. In the January 25, 1996 issue of Nature theyreported
On millennial time scales these retreats may not be unique or even unusual . . . but in theshort term Mercer’s predictions have been borne out, and the spatial and temporal patternof ice-shelf retreat is similar to that he proposed.... The pattern of the retreat providesevidence of warming in both climatic regimes on the Antarctic Peninsula, but due to thehigh spatial gradients of mean annual air temperature, the warming was achieved by amodest migration of the climate pattern. We have still, however, to determine the precisemechanisms whereby the atmospheric warming had such a catastrophic effect on the iceshelves of the Antarctic Peninsula but it is clear that the ice shelves cannot survive periodsof warming that last more than a few decades...We cannot determine whether the AntarcticPeninsula warming can be ascribed to a global warming magnified by regionaltemperature/sea-ice feedback, or if this is a natural oscillation as a result of the samefeedback. We offer no prediction that the warming will continue, but if it does, other iceshelves are threatened. The Filchner-Ronne and Ross ice shelves, which may stabilize theWest Antarctic Ice Sheet, are not immediately threatened by this mechanism, as it wouldrequire a further warming of 10°C before the -5°C mean annual isotherm reached their icefronts.
There are signs that the warming trend in Antarctica is continuing. On February 6, 1997, the Timesreported that the 4,600 square mile Larsen B ice shelf, the southern part of the shelf, was showingsigns of stress, with “huge cracks” appearing in the ice (Hawkes 1997). The paper reported thatexperts predict it will disintegrate, in a manner similar to the Larsen A ice shelf, within the nexttwo years. The paper also reported that the Greenpeace vessel, Arctic Sunrise, had been in theregion for two weeks to document the changes. Meanwhile, in London, Greenpeace created icesculptures in the shape of penguins, and left them to melt in central London. If the ice shelves melt,Greenpeace said, the penguins will lose their homes.
Sometimes it is hard to distinguish news reports related to the breakup of the West Antarctic icesheet from reports speaking of sea level rise in general, due to thermal expansion of the oceans, ora combination of the two. Often, the news reports themselves do not draw the distinction. On thefront page of its Sunday edition, the New York Times reported that flooding in the South Pacific“has helped focus minds here on warnings that global warming could cause the seas to rise enoughin the next century or so to obliterate island nations like [Kiribati] scattered in the middle of thePacific Ocean.” (Kristof 1997, 1). Like other stories, this one does not speak of the possibility ofthe West Antarctic ice sheet melting; rather, it discusses the implications of slight sea level rise—inthe order of 50 centimeters—combined with increased storm activity.
The events on the Antarctic Peninsula coincided with two other events, which could have led toincreased visibility of the issue. One event was the Berlin Conference, the first meeting of thedelegates to the Framework Convention on Climate Change since the Rio Earth Summit. Thesecond was the anticipated release of the Kevin Costner film Waterworld, in which the melting ice
ANTHONY G. PATT—ASSESSING EXTREME OUTCOMES
11
caps are portrayed as covering nearly all landmass on the planet. The Houston Chroniclereassured us, however, that “if the polar ice caps were actually to melt, the globe’s oceans wouldrise only between 237 feet and 240 feet. That would cover every coastal city in the United States –as well as low-lying regions like Florida, Louisiana and most of Texas – with water. But itwouldn’t cover the continents.” (Houston Chronicle 1995, 2)
Mercer’s predictions have not failed to incite criticism. Some scientists have hypothesized that theWest Antarctic ice sheet is actually floating, and thus its disintegration would have no impact onsea levels. Scientists have also attacked his claim that it would disintegrate rapidly were it to losethe support of the northern ice shelves. Still others claim that the rate of additional snowaccumulation on the entire Antarctic continent would exceed the rate of disintegration of the WestAntarctic ice sheet (Jacobs 1992, 29). Finally, people take issue with the projection thattemperatures in the West Antarctic region will rise by 10°C.
Indeed the science remains far from clear, although most of it points to it being less likely thanoriginally thought that the ice sheet could undergo a sudden collapse. In one recent article, CharlesBentley made the following comments on the theory:
In light of the evidence for recent stability, it is difficult to see how climate warming(whether anthropogenic or natural) could trigger a collapse of the WAIS (West AntarcticIce Sheet) in the next century or two. Ice sheets take thousands of years to respond tochanges in surface temperature, because it takes that long for the temperature changes topenetrate close to the bed and only at the bed could increasing temperatures affect the flowrates in any major way. . . . Thus, I believe that a rapid rise in sea level in the next centuryor two from a West Antarctic cause could only occur if natural (not induced) collapse ofthe WAIS is imminent, the chances of which, based on the concept of a randomly timedcollapse on the average of once every 100,000 years, are on the order of 0.1% (Bentley1997, 1078).
After an initial bout of enthusiasm for the story of West Antarctic collapse, research has beenmoving in the direction of seeing the West Antarctic ice sheet as inherently stable, and sea level risefrom its collapse as unlikely. For instance, estimates of the additional deposition of snow on theAntarctic continent, because of warmer, wetter air, have been revised upwards. And the streams ofice that disgorge into the Ross ice shelf appear less ominous; indeed one of them appears to havestopped, after “it lost lubrication at its base.” (Schneider 1997, 114).
4. A MODEL FOR ASSESSMENTS
4.1 Anticipating the Reaction to Assessments
The rapid collapse of the West Antarctic ice sheet is the type of risk for which people’s perceptionwould be sensitive to how the risk is framed. Most importantly, the chances of the event occurringare slight, indeed close to zero. The risk is one with a class of identifiable effects—coastalflooding—as well as a host of potential other effects, such as increased storm surges and loss of
ANTHONY G. PATT—ASSESSING EXTREME OUTCOMES
12
wildlife. Contrast with this risk the anticipated change in mean global surface temperature of 3°Cover the next century. According to best available scientific consensus, the latter is an outcome thatis likely to occur, although the effects of the change on local conditions are uncertain.
For potential extreme outcomes of climate change, such as the rapid melting of the West Antarcticice sheet, we would expect people to form subjective probability assessments that miss the mark oneither side of scientists’ “objective probability”. Those people who form a subjective riskassessment below the level of objective probability will view the chances of rapid sea level rise astrivial. Those people who amplify the risk will see the chances of extreme outcomes as substantial,and likely to happen. Since the damages to society that would result from an extreme outcome likerapid sea level rise are large, people’s perception of the issue will have a large impact on howserious an issue they consider climate change in general.
Applying the literature on risk perception to a model of assessments relies on three assumptions.First, we must assume that assessors understand the nature of the risks involved. That is, they donot suffer from the same biases that plague the general public. Such an assumption is fullyconsistent with the work of Renn and others. As people become very familiar with a risk or anuncertainty, they tend to analyze it more methodically, and to perceive it more accurately, or atleast more in accordance with the prevailing scientific paradigm. We would expect that assessorsare such experts in the field they are assessing that would not be subject to the same biases thataffect the lay public or generalist policy makers. Second, we must assume that assessors are awarethat most people have a difficult time interpreting risks. The assessors need not be familiar with allof prospect theory. Rather, they might draw from personal experience in framing risks incorrectly,or their intuition about people’s abilities. The third assumption is that assessors—or in some casesthe people who commission assessments—act strategically. “To be strategic usually requires thatwe anticipate the responses of other parties, possibly ourselves, at a later moment.” (Zeckhauser1991, 1). Assessors will take into account people’s difficulty understanding certain risks anduncertainties. Depending on their motives in performing the assessment, they will write theirassessments either to avoid people’s difficulty, to overcome people’s difficulty, or to takeadvantage of people’s difficulty. In order to model assessor’s strategic choice of issue framing, Ifirst identify the assessor’s strategic objective in performing the assessment, and categorize theassessments accordingly. I can then use the particular strategic objective to predict the treatment ofissues involving extreme outcomes.
4.2 Categorizing Assessments by the Three A’s
In this section, I classify assessments according to the objectives of the assessors, or in some casesauthorizers, responsible for their production. The three categories are agreement assessments,advisory assessments, and advocacy assessments. Clearly, any attempt to classify to assessments isgoing to be somewhat arbitrary, both in the drawing of borders, and in the assigning of assessmentsto one side or the other. My attempt at classification is no exception. One could argue that threeclasses I have defined are not the most useful, or even that they are misleading. Furthermore, manyassessments will possess features of two or even three classes. However, assessments within eachof the three classes do share many features. While not perfect, this attempt at classification is stilluseful.
ANTHONY G. PATT—ASSESSING EXTREME OUTCOMES
13
4.2.1 Agreement
Some assessments, like those of the IPCC, the National Research Council (NRC), and the variousagencies of the United Nations (UN), appear to be undertaken in order to reach consensus, oragreement, among a panel of national or global experts. Often, governments hesitate to take actionto address climate change because of a perceived lack of information, and commission panels ofexperts to study the issue, as an alternative to substantive policy. Only after these reports havegiven an unambiguous answer does policy change become possible. For instance when the IPCCissued a report, in 1996, that anthropogenic greenhouse gas emissions were having a “discernibleimpact” on climate, the pressure for negotiators to formulate a plan to reduce that impact becamefar more urgent. Countries were no longer able to hide behind the call for more research beforetaking action. These types of assessments are often ongoing and lengthy efforts, made up of a panelof experts who represent a broad range of disciplines, interest groups, and stakeholders. The IPCC,for instance, is made up of scientists from a number of different countries with divergent interestsin the climate change debate. One of the distinguishing features of these assessments is that theassessors participate on a volunteer basis, and not under contract or as an employee of the agencysponsoring the assessment.
4.2.2 Advice
A second objective of assessors is the giving of advice. Many assessments are undertaken in orderto sort through difficult questions that relate to policy, and to reach the best conclusions possible.In many cases, these assessments have been commissioned by a group within industry orgovernment. Often, these assessments are prepared under contract for a specific user group orcommunity. Indeed, many of these assessments go unobserved, since as the property of thecontracting party they may not be part of the public domain. The experts preparing theseassessments may represent a range of disciplines, but the purpose is to bring together minds whocan sort through the issues and analyze the results, not to make sure that different political interestsare heard. For instance, the assessment “Climate Change and the Insurance Industry: UncertaintyAmong the Risk Community” was a short assessment commissioned by the insurance industry, andprepared by a private consultant, in order to brief insurance industry executives on the impacts ofclimate change on their industry. Other times it is the employees of agencies such as theDepartment of Energy (DOE) who write these assessments. In either case, the assessor is beingpaid to give the best and most comprehensive piece of advice within a specifically defined area andthe constraints imposed on them by their budget and mandate. Their purpose is to serve theinterests of their audience, and they can best serve those interests by presenting a balanced,unbiased, and objective a view of the relevant issues. A defining feature of these assessments isthat they are prepared for use within the organization paying for its preparation.
4.2.3 Advocacy
A third purpose of assessments is advocacy. To varying extents, industry groups, non-profit andnon-governmental organizations, and even government agencies have interests at stake in theclimate change issue. They prepare assessments to further those interests. While these assessments
ANTHONY G. PATT—ASSESSING EXTREME OUTCOMES
14
often outwardly appear to be consensus or advisory documents, in truth they represent one set ofinterests, and one set of opinions on the climate change issue. If they do appear to portrayconsensus, it is within the narrow set of opinions they represent, and not across the spectrum ofscientific views and government stakeholders. These reports may be commissioned by anorganization, but if so, they are designed to be read primarily outside that organization.Assessments such as “A Matter of Degrees”, prepared by Irving Mintzer of the World ResourcesInstitute, “Solar Revolution: Insurers and Bankers Waking Up To Climate Change”, found on theGreenpeace web site fall into this category. Whether overt or not, the purpose of these assessmentsis to present one side of the climate change debate.
4.3 Predicted Results of the Model
If we can classify assessments by the goals of the assessors, or in some cases their authorizers, wecan predict how each of these purposes can be furthered by the strategic treatment of sea level risedue to Antarctic melting. The easiest to predict are the advocacy assessments. We would expectthem to act like lawyers trying to make a case for guilt or innocence. They will present evidencesupporting their side of the debate as much as possible, and discredit the evidence that the otherside of the debate uses, all within the constraint of maintaining credibility. Let us first focus onthose groups advocating climate change as a cause for concern. These actors want people toprotect the climate, even if doing so involves sacrificing economic growth. Recall from Figure 1that people place a higher absolute value on losses than they do on gains. In terms of overallframing, they will try to frame the benefits from economic activity as gains over the status quo, andthe dangers that climate change prevents as losses. Recall also from Figure 1 that people are risktaking when it comes to losses—they are willing to accept the small risk of a large loss more thanthey are willing to accept a smaller yet more certain loss. They will want to convince people thatthe losses from climate change are relatively certain. Climate change advocates will thus want toportray those losses which are relatively certain as quite large. They will also want to magnify thelikelihood of the less certain, yet large magnitude, risks. Rapid sea level rise from Antarctic meltingfalls into this latter category. We would expect climate change advocates to devote resources todiscussing this risk in order to magnify people’s subjective probability assessment of its occurring.We would not expect them to focus on this risk to the exclusion of more certain outcomes.
Next consider advocates on the other side of the issue. As to climate change in general, we wouldexpect them to frame the status quo as including the economic returns to be had in the absence ofclimate change policy. Efforts to control emissions of greenhouse gases would incur an economiccost, equal to the losses in GDP from reduced productivity. The global warming that does notoccur would be framed as a benefit of those policies. Since people place a higher absolute value onlosses than they do on gains, to the extent that the climate change debate can be framed in this waypeople will be less likely to take action to prevent it. Remember also from Figure 1 that people arerisk averse with respect to gains—they will value the gains much less if they are seen as uncertain.Advocates will thus want to frame the benefits of climate change policy as risky; they will portraythe negative consequences of high greenhouse gas emissions as highly unlikely. We would thusexpect them to spend resources to convince people that the major effects of climate change are theones subject to uncertainty—such as rapid sea level rise due to Antarctic melting—and that theprobability of that occurring is insignificantly different from zero. Furthermore, by adopting this

ANTHONY G. PATT—ASSESSING EXTREME OUTCOMES
15
strategy, they can undercut the credibility of those people advocating aggressive policies to combatclimate change. We do not expect them to spend all of their resources on issues such as rapid sealevel rise, since they do not want to bring to much attention to the potential for catastrophe. Rather,they want to devote enough energy to the issue so that people perceive of climate change asinvolving a great deal of uncertainty, yet the potential problems, such as changes in averagetemperature. These impacts are smaller and more subject to natural variation.
Advisory assessments fall into the next group. We expect these assessors to be trying to be asuseful as possible in providing information that is balanced and honest. Furthermore, to the extentthat advocacy groups are sensed as a threat to the legitimacy and perceived accuracy of thisinformation, we would expect advisory assessors to try and reveal the advocates’ tactics. In orderto provide unbiased information, advisors will attempt to avoid framing issues in any particularway. We would predict them to explain the different ways in which the issues can be framed, aswell as why advocates on either side of the debate might to choose to frame the issues in one wayor another. If they are to be useful, advisors must confront those issues which are most susceptibleto misleading problem frames, issues such as rapid sea level rise due to Antarctic melting. Indeed,this type of issue is an excellent one to use as the context for discussing misperceptionssurrounding risk and uncertainty. At the same time, it is true that many advisory assessmentsaddress only limited aspects of the problem. For instance, the Department of Energy commissioneda series of studies specifically to address and advise on the issue of sea level rise. These woulddevote substantial attention to the issue of the West Antarctic ice sheet collapse. Other assessmentshad a different purpose. EPA has prepared advisory assessments that deal not with the implicationsof climate change, but with the policy options and tools for avoiding it. These, we would expect,would not waste pages devoting serious attention to sea level rise since it is not relevant to theirpurpose, and would avoid the issue altogether. We would thus expect advisory assessments todevote a substantial amount of attention to this type of risk, if they devote any attention at all. Wewould not expect them to devote limited attention to the issue.
The final type of assessment is the agreement-seeking assessment, the consensus document. Likethe advisory assessment, the agreement-seeking assessment usually comes out of an effort toinform policy-makers. Unlike the advisory assessments, however, the agreement document does nothave to compete with the advocacy groups for attention and legitimacy; consensus assessmentstend to be large, lengthy, and established efforts, which will be respected and quoted because of thefact that they represent the combined opinion of so many experts in the field. Thus, they do nothave to respond to every point raised in the advocacy assessments, but can choose to ignore wholeissue areas. Furthermore, like the advocacy assessments, agreement-seeking assessments are theproduct of parties with a stake in the climate change debate. Often, representatives of industry, ofgovernments, and of NGOs participate in the process of drafting or reviewing the assessment.While their views may cancel each other out, and prevent consensus assessments from appearinglike advocacy efforts, it is only the issues on which agreement is reached that typically become apart of the final document. We would thus imagine that agreement-seeking assessments wouldfocus their attention on the issues that are well-understood, or where the potential formisunderstanding is small. For two reasons, we would expect them largely to ignore issues such asrapid sea level rise from Antarctic melting. First, the parties to the assessment would be unable toreach agreement among themselves as to the proper problem frame to place the issue in. Some
ANTHONY G. PATT—ASSESSING EXTREME OUTCOMES
16
would insist on its being treated as a major threat. Others would insist that by discussing it as aserious potential problem, even one with low probability, they are lending the theory a legitimacy itdoes not deserve. Second, the parties would avoid issues such as rapid sea level rise because of thepotential controversy they could bring to the entire assessment. Consensus-seeking assessments arean attempt to put a certain amount of uncertainty to rest, so that actual policy-making, based onwhat knowledge does exist, can begin. Hence we would expect them to focus on issues where risksare well defined and far from zero. Were the assessors to focus on issues marked by high levels ofuncertainty, the effect might well be for governments that are reluctant to take action to call formore study, rather than substantive policy. Were the assessors to focus on issues marked byconsensus around low probability and high impact, there would be a danger of peoplemisinterpreting the risk because of the way that it was framed. For both of these reasons, we wouldexpect this last class of assessments to avoid the issue of rapid sea level rise.
We can predict that different assessments will treat extreme outcomes differently. When weclassify assessments according to the three distinct purposes they serve—agreement-seeking,advisory, and advocacy—we would expect to see variance in treatment of these issues by group.We would expect advisory assessments to give the greatest treatment of the issue. We wouldexpect advocacy assessments, on both sides of the issue, to give moderate treatment to the issue.We would expect agreement-seeking assessments to ignore the issue. Table 5 summarizes thesepredictions.
5. EMPIRICAL TESTS
5.1 Data and Methodology
My data consist of a set of 38 assessments published between 1981 and 1997. I attempt to includeall of the major assessments conducted during this time, as well as a large number of the smallerassessments. If I omit any particular assessment, it is either because it was not available to me forreview, or because I did not include it in my definition of assessment. In order to test thehypothesis that assessment type is a good predictor of the treatment of extreme outcomes, such as arapid rise in sea level due to the melting of the West Antarctic ice sheet, I use a multinomial logitregression technique, to generate estimators for each of my explanatory variables. The primaryadvantage of this technique is that it allows me to control for a number of variables, such as theyear of the assessment and the length of the assessment, in order better to isolate the effect of theassessment type. By using a qualitative choice regression model, such as the logit, I can determinewhether the effect of the assessment type is significantly different from zero, and in the directionthat the model I have developed would predict. I use the multinomial logit model because it allowsme to set up my dependent variable—treatment of sea level rise—as a choice among three possibleoutcomes. Thus it is possible to have as the dependent variable options no treatment, limitedtreatment, or detailed treatment of the issue.
The principal limitation of the multinomial logit technique becomes critical in a data set such asmine, which has only 38 observations. Often, one is not able to generate results that aresignificantly different from zero. I do not encounter this difficulty with these data, however. A
ANTHONY G. PATT—ASSESSING EXTREME OUTCOMES
17
second limitation of the multinomial and standard logit techniques is that it is difficult to interpretthe results. I provide a brief explanation of the regression models in the footnote to this sentence.3
In this paper, I generally interpret only the sign and significance, and not the absolute magnitude,of the regression coefficient estimates. Finally, the results I generate may not be reliable because ofthe small sample size involved. As I explain in the footnote, the multinomial and standard logitregression models assume that the error terms are distributed according to particular distributions.With large numbers of observations this may not be a bad assumption to make, but with so fewdata points, this assumption may not be valid. To correct for this, I use the bootstrap regressiontechnique, and analyze its results to interpret the reliability of my maximum likelihood estimators.4
Clearly one decision is what to treat as an assessment, and thus include in the data. For this, I turnto the working definition developed by the Global Environmental Assessments (GEA) project, outof which this paper grew. I treat as an assessment those social processes that seek to communicatethe results of scientific knowledge to policy makers or the public. It does not include those papersappearing in journals of natural or social science that seek to expand the knowledge base or derivethe biogeophysical, economic, or political implications of climate change. It does include, however,works that seek to derive specific policy implications using interdisciplinary research and results.Assessments are not limited to those performed by a group or team of authors. A major limitationof my method is that I look only at the published report of the assessment effort. This ignored thefact that assessment efforts often span years, and that the major impacts on policy may arise out ofinformal communication with policy makers during the assessment process, or through mediachannels after the assessment is finished. Because I observe only the actual assessment document, Iignore these other products of the assessment process. Certainly an area for research is whether thesubstantive content of assessments is similar across formal and informal paths of communication.
The second, and greater difficulty is in classifying the type of assessment, according to thefunctional definitions—agreement, advisory, and advocacy—that I developed in the last section.There are two problems that arise. First, I am unable to measure the extent to which an assessmentdisplays one of the functional characteristics. For instance, we would expect a document byGreenpeace or the Global Climate Coalition5 to be highly biased, while assessments coming fromorganizations like World Resources Institute (WRI) or Stockholm Environmental Institute (SEI) tobe less driven by ideology, even taking on the characteristics of advisory documents. It would benice to have a model that took into account the degree to which a document assumes a particulartype. If my type variable were simply a binary choice, it might be possible to have it take on amore continuous distribution. For instance, I could rate each assessment on a scale of one to ten,with one being the most advocacy oriented, and ten being most agreement oriented. However, withan independent variable that takes on three potential values, it is more difficult to define thespectrum over which I will rank the assessments. Indeed, I do not even try. The second problem isthat there is the tendency to classify assessments according to how they treat certain issues ofclimate change such as the one I am studying. If, for instance, a particular assessment could beclassified as either agreement or advisory, such as a work by the NRC, it would be tempting to usethe assessment’s substantive treatment of the specific issues as an indicator of the assessment’spurpose. This is merely using the model to validate the model. To avoid this, I attempt to classifyeach of the assessments strictly in accordance with the criteria in Table 5, and without regard to theactual substance of the assessment. Judgment calls will surface, but I make them as transparent as

ANTHONY G. PATT—ASSESSING EXTREME OUTCOMES
18
possible by listing how my data are classified. This information appears in Table 6. I use theagreement oriented assessment as my base case in the regression models.
A third and related difficulty is classifying the degree of treatment of the dependent variable byeach assessment. One could imagine close judgment calls over whether a given assessmentprovided limited or detailed issue treatment. The first step is specifying the variable itself. I defineno treatment as just that – not even mentioning the possibility of the rapid deterioration of theWest Antarctic ice sheet due to climate change. I define limited treatment as the discussing of theissue, without providing a detailed or balanced account of the scientific theory and the probabilitiesassociated with the possible outcomes. I define detailed treatment as a discussion of the issue froma balanced perspective, presenting the scientific theory, qualified by statements about its likelihoodof occurrence. I attempt to make the best judgment calls possible, and again present those choicesin Table 6. The more difficult judgment call is between limited treatment and extensive treatment.To address this special concern, I run a separate logit regression, using any treatment as thedependent variable.
In order to isolate the effect of the assessment type, I control for two other sets of variables. First, Icontrol for the year in which the assessment was published. This may be important given thedevelopment of the theory surrounding West Antarctica and climate change. Shortly after Mercerpublished his paper in 1978, the issue gained widespread attention. Soon, however, other scientistsbegan publishing findings critical of Mercer’s hypothesis. We might expect the assessed medianprobability of the ice sheet’s collapse to decrease as these later findings were published.Accordingly, we might expect to see less treatment of the issue by assessments as the yearsprogressed from 1978 onward. However, we might see a rapid decrease in issue treatment duringthe time when the theory lost acceptance, followed by a leveling off. Later, we might expect to seea leveling off. Two ways of modeling this are by defining the time variable in logs, or by modelingit as a quadratic function. Having done both, I found the latter method to provide a substantiallybetter fit with the data. I thus present coefficients for two variables: years after 1978, and years2
after 1978.
I also control for the length of the assessment. I define short assessments as those of 100 pages orfewer, medium assessments as those of 100 to 500 pages, and long assessments as those of morethan 500 pages. My expectation is that longer assessments tend to devote more attention to all ofthe issues involved in climate change, and thus would be more likely to devote more space to issuesof rapid sea level rise. The reasons I use dummy variables, as opposed to a single variable for thenumber of pages are two-fold. First, it is often difficult to define exactly how long an assessmentis, especially if it is long, with many appendixes. Furthermore, since some assessments appear onthe world wide web, it is difficult to define the number of physical pages. Second, I expect a non-linear response of treatment to length. The difference between a 50 and a 100 page assessment isprobably much more than the difference between a 600 and a 650 page assessment. One alternativewould be to express the length of the assessment in log form. Because of the first concern,however, I have chosen not to do this. I found, however, that the difference between short andmedium assessments was significant in all models, whereas there was no discernible differencebetween medium and long assessments. In order to preserve degrees of freedom, I compare onlythose assessments that are short with those that are medium and long.
ANTHONY G. PATT—ASSESSING EXTREME OUTCOMES
19
5.2 Results
Table 7 presents the results of two regression models. Model A is a multinomial logit regression.The left hand column shows the coefficients associated with increased or decreased likelihood ofgiving limited issue treatment, compared with no issue treatment. The right hand column showscoefficients associated with detailed issue treatment, also compared with no issue treatment. It isdifficult to interpret the magnitude of the coefficients, for their marginal impact on the likelihood ofissue treatment depends on the values of all of the variables. Instead, I focus on significance andsign.
We see that nearly all coefficients are significant, either at the 5% or 10% error level. Second, wesee that both advisory assessments and advocacy assessments are more likely to give limited issuetreatment. The effect is larger for the advocacy assessments. Assessments were less likely to givelimited issue treatment with time, although the negative coefficient for the years2 after 1978estimator indicates a decreasing marginal effect, one that may even change direction. If we look atthe second column of Model A, we see that advisory assessments are more likely to give detailedissue treatment, while advocacy assessments are less likely than agreement assessments to givedetailed issue treatment. We note an unusually large standard error associated with the advocacyestimator. This may be due to the absence of a single advocacy assessment giving detailed issuetreatment. The time effect is the same as with the left hand column. As the pseudo R2 valueindicates, Model A explains more than half of the variance in the dependent variable.
I present results from a standard logit regression in order to present results that are robust to thejudgment call between limited and detailed issue treatment. These results appear as Model B inTable 7. We observe results similar in sign and significance to those of Model A. Furthermore, wedo not encounter the difficulty computing a standard error for the advocate estimator. Instead, wesee that both advisory and advocacy assessments are more likely than agreement assessments totreat the issue at all. The effect is larger for advocacy assessments, although its estimator issignificant only at the 10% error level. Again, the model explains more than half of the variance inthe dependent variable. We notice that the coefficients in Model B resemble quite closely those ofthe left hand column of Model A. It would appear that the limited treatment component of the anytreatment variable dominates the results of Model B.
I use the bootstrap primarily to test my earlier results for robustness, because of my concern that38 observations may be too small a sample from which to generate meaningful results. To simplifymatters, I run ordinary least squares (OLS) regressions within the bootstrap.6 Although OLS is notordinarily used in the context of a binary choice dependent variable, it typically gives results whichqualitatively agree, in terms of sign and significance, with the more complicated logit techniques.The most important results from the bootstrap technique are the lower and upper bounds on the95% confidence interval. These are obtained using actual percentiles; in the case of a bootstrapwith 1,000 repetitions, they represent the 25th lowest and 25th highest observations, respectively.These can be compared with the confidence interval bounds calculated in a single regression,calculated using the standard error and assumptions of normality. In Table 8, we see that thebootstrap confidence interval lower and upper bounds lie close to those determined with the single

ANTHONY G. PATT—ASSESSING EXTREME OUTCOMES
20
regression. Indeed, we do not observe a single estimator which is significant at the 5% level in theOLS model, yet not significant when using the bootstrap. What this demonstrates is that the earlierresults are robust to small changes in the assessments that I include in the data, assuming that thesample of 38 assessments itself is unbiased.
6. IMPLICATIONS FOR ASSESSMENTS AND POLICY
These empirical results observed in the four regression models are consistent with a theory thatexplains variance in extreme event issue treatment by strategic objective. Essentially, the resultsshow that the type of assessment, defined according the three A’s that I have discussed, explainssome of the variance in issue treatment. Clearly, there could be other theories of assessor behaviorthat could explain these results. What this model does not predict, and what the empirical tests donot address, is how users of assessments respond to the treatment of extreme events.
Assessment writers can use these results in two ways. First, they can understand the limitationsthat users of assessments have in understanding issues of risk and uncertainty. By applying thelessons of behavioral psychology, assessors can do a better job of conveying the message they wishto make. For advocates, this means taking advantage of people’s attitudes towards gains andlosses. For advisors, this means paying extra attention to issues that are subject tomisunderstanding. Advisors may want to apply many of the recent methods developed in the fieldof risk communication, so as better to educate their readers about the tradeoffs involved. Forconsensus seekers, this may mean understanding why consensus is difficult to reach on someissues. They may want to explain, in the assessments, why they have omitted certain areas, andguide the reader to those advisory assessments that give more comprehensive treatment to the issue.Alternatively, the leaders of agreement assessment efforts may want to structure the processes andparticipation structures to overcome the difficulties associated with discussing extreme outcomes.
Second, assessors may benefit from knowing that other assessments are acting strategically in themanner described in this paper. Authors of advisory assessments may want to alert their readers asto why certain issues receive little treatment in the large, agreement-oriented assessments. Theymay also want to be explicit about addressing and responding to the claims of the advocacycommunity. Authors of agreement assessments may benefit from understanding how the limitedissue treatment by advocates may undercut the formation of political consensus. They may alsowant to address some of the claims of advocacy assessments.
Policy makers can only benefit from understanding some of the bias present in assessments. Even ifan agreement-oriented assessments steers clear of controversy, bias can enter in by what theauthors choose to assess, and what they choose to ignore. By knowing that agreement-orientedassessments have a bias towards omitting extreme outcomes, they can search for those theories inthe more advisory-style assessments. They can understand why certain outcomes of climate changemay be important—based on scientific criteria—yet omitted from the large, agreement orientedassessments. At the same time they can understand the ways in which advocacy assessments frameextreme outcomes, and how their treatment of issues to highlight may be other than benign. Byunderstanding what is happening, policy makers may be less likely to fall victim to these

ANTHONY G. PATT—ASSESSING EXTREME OUTCOMES
21
techniques. Ultimately, policy makers may realize that the best source for information on extremeevents may come out of advisory assessments devoted to particular issues. They may want tocommission advisory assessments to examine those very issues that the scientific literaturediscusses, but that the agreement oriented assessments omit.

ANTHONY G. PATT—ASSESSING EXTREME OUTCOMES
22

ANTHONY G. PATT—ASSESSING EXTREME OUTCOMES
23
ENDNOTES 1 The author wishes to thank the following people for their comments, advice, and suggestions: WilliamClark, Jill Jaeger, Sheila Jasanoff, Joanne Linerooth-Bayer, Edward Parson, and Richard Zeckhauser
2 According to Bernstein (1996), they chose the name “prospect theory” not because it clearly describedtheir theory, but because it was a name that people were likely to remember and use.
3 For those not familiar with the multinomial logit model, I discuss briefly its derivation and mathematicalform. It is based on an assumption that actors choose the outcome of a qualitative dependent variable,such as outcome 1, 2, or 3, according to the utility that they derive from each of those choices. Thoseutilities, in turn, are a function of a vector of characteristics attributable to the particular actor, plus somelevel of random disturbance, not accounted for by the model. We assume that an individual will chooseoutcome 1 if the utility of that choice exceeds the utility of the second and third choices for thatindividual. Likewise, the individual will choose outcome 2 if the utility of that choice exceeds the utility offirst and third choices for that individual. What we observe in the data are a choice of outcome for eachindividual actor i, as well as the vector of personal characteristics for each actor. The multinomial model,then, seeks to pick those parameter vectors of for each outcome, β1, β2, and β3, that maximize thelikelihood of observing the data. This is not difficult to do if we assume an extreme value distribution forthe error terms. Then, the probability that an individual actor i will choose outcome 1, 2, or 3 can beexpressed as:
Pe e
Pe
e e
Pe
e e
i x x
i
x
x x
i
x
x x
i i
i
i i
i
i i
1
2
3
1
1
1
1
2 3
2
2 3
3
2 3
=+ +
=+ +
=+ +
β β
β
β β
β
β β
With the parameter estimates in hand, we can calculate the probability that any given actor with a vectorof personal characteristics xi will choose each of the three possible outcomes. Note that the threeprobabilities must, by definition, sum to one. For each of the parameters within the vector β, we can testfor sign and significance.
The logit regression model is merely is specific case of the multinomial logit model, a case in which thedependent variable has only two possible outcomes. It is built on the assumption that the probability thatan individual i, in this case a particular assessment, will choose a given outcome, is a function of a set ofcharacteristics, the vector xi, and random disturbance term. If we assume that the two error terms areindependent and distributed according to an extreme value function, than we can set their difference equalto εi, which is itself distributed according to the extreme value function. These assumptions allows us tosay:
Pe
if x
i x
i
i=
+=
=→ → ∞→ → ∞
−
1
1
0
0
12
β
βββ
as x -
1 as x i
i
ANTHONY G. PATT—ASSESSING EXTREME OUTCOMES
24
Again, we normalize by setting one of the two possible outcomes as the base case, against which wemeasure the probability of observing the other outcome. To calculate that, we need to use the functionalform of the prior equation, a function of the product of our coefficient vector βi and our vector of personalcharacteristics, xi. As this product becomes very negative, the probability approaches zero; as the productbecomes very large, the probability approaches unity.
4 The bootstrap technique is a method that uses computer simulation to give more accurate measures ofkey statistics and their potential range of values. It is most useful when the standard assumptionsunderlying statistical models may not hold. One such case is where the sample size available is quitesmall, which it is in this paper. In performing a bootstrap, the computer draws a random “pseudo-sample”from the original data. In drawing the pseudo-sample, the computer uses replacement of observations.Thus, if my original sample has 38 observations, the computer will draw a random pseudo-sample, also of38 observations, but which may include some of the original observations more than once, or not at all.The computer then calculates the statistics needed on the pseudo-sample. After this, the computerreplicates this process a specified number of times. For a small sample size, the bootstrap technique teststhe robustness of results to omission of one or more observations, and is thus useful. For more informationon the validity of bootstrapped data, see Mooney and Duval (1993).
5 The Global Climate Coalition is a trade organization composed of representatives from industriesthreatened by policies seeking to protect the climate. It engages in lobbying and the preparation ofassessments.
6 The functional form of the logit and multinomial logit models creates problems when trying to bootstrapthese data. Occasionally, the computer draws a pseudo-sample in which all of the observations contain thesame value for either the advisory or advocacy variables. The computer is not able to compute anestimator for that variable, and must drop it in that pseudo-sample. Doing so, of course, leads to biasedbootstrap results. The use of an ordinary least squares regression technique avoids this difficulty.

ANTHONY G. PATT—ASSESSING EXTREME OUTCOMES
25
REFERENCES
Note: Assessments Cited Appear In Table 6.
Begley, Sharon, Bruce Shenitz, and William Underhill (1995). “Ice Cubes for Penguins,”Newsweek (United States Edition), 3 April 1995: 56.
Bell, David E., Howard Raiffa, and Amos Tversky (eds.) (1988) Decision Making: Descriptive,Normative, and Prescriptive Interactions, Cambridge: Cambridge University Press.
Bentley, Charles (1997). “Rapid Sea-Level Rise Soon from West Antarctic Ice Sheet Collapse?”Science 275: 1077-1078.
Bernstein, Peter (1996). Against the Gods: The Remarkable Story of Risk, New York: John Wileyand Sons.
Berry, Adriane (1995). “Scientists keep cool over giant iceberg,” Sunday Telegraph (London) , 26March 1995: 19.
Covello, Vincent T. (1990). “Risk comparisons and risk communication: Issues and problems incomparing health and environmental risks,” in Kasperson and Stallen (eds.) CommunicatingRisks to the Public: International Perspectives, Dordrecht, NL: Kluwer Academic Publishers,pp. 79–124.
Doake, C.S.M. and D.G. Vaughan (1996). “Recent atmospheric warming and retreat of ice shelveson the Antarctic Peninsula,” Nature 379: 328-331.
Dooley, James, Bengt Hansson, Jeanne X. Kasperson, Roger E. Kasperson, Timothy O’Riordan,and Herbert Paschen (1987) “The emergence of risk analysis on the international scene.” inKasperson and Kasperson (eds.), Nuclear Risk Analysis in Comparative Perspective. Boston :Allen & Unwin, pp. 1–26.
Harris, Richard (1995). “Warming Temperatures Breaking Up Antarctic Ice Shelf,” NationalPublic Radio Morning Edition, 6 April 1995, transcript # 1579-7.
Hawkes, Nigel (1997). “Big rifts appear in Antarctic ice shelf,” The Times (London), 6 February1997.
Houston Chronicle (1995). “Snippets: Meltdown Exaggerated,” 30 August 1995: 2.
Jacobs, S.S. (1992) “Is the Antarctic Ice Sheet growing?” Nature 360: 29.
Kahneman, D. and A. Tversky (1974). “Judgment under uncertainty: Heuristics and biases.”Science 185: 1124 – 1131.
ANTHONY G. PATT—ASSESSING EXTREME OUTCOMES
26
Kammen, Daniel M., Alexander Shlyakhter, and Richard Wilson (1994). “What Is the Risk of theImpossible?” Journal of the Franklin Institute 331A: 97–116.
Kasperson, Roger E. and Pieter Stallen (eds.) (1990). Communicating Risks to the Public:International Perspectives, Dordrecht, NL : Kluwer Academic Publishers.
Kasperson, Roger E. and Jeanne X. Kasperson (eds.) (1987) Nuclear Risk Analysis inComparative Perspective. Boston: Allen & Unwin.
Kristof, Nicholas (1997). “In Pacific, Growing Fear of Paradise Engulfed,” New York Times, 2March 1997: 1.
March, James G. (1988). “Bounded rationality, ambiguity, and the engineering of choice,” in Bellet al. (eds.) Decision Making: Descriptive, Normative, and Prescriptive Interactions,Cambridge: Cambridge University Press.
Margolis, Howard (1996). Dealing with Risk: Why the Public and Experts Disagree onEnvironmental Issues, Chicago: University of Chicago Press.
Mercer, J.H. (1978). “West Antarctic ice sheet and CO2 greenhouse effect: a threat of disaster,”Nature 271: 321-25.
Mooney, C.Z. and R.D. Duval (1993). Bootstrapping: A Non-Parametric Approach to StatisticalInference, Newbury Park, CA : Sage Publications.
Renn, Ortwin (1991). “Strategies of Risk Communication,” ,” in Roger Kasperson and PieterStallen (eds.) Communicating Risks to the Public: International Perspectives, Dordrecht, NL:Kluwer Academic Publishers, pp. 457–481.
Schneider, David (1997). “The Rising Seas,” Scientific American 276(3): 112–117.
Shlyakhter, Alexander, Daniel Kammen, Claire Broido, and Richard Wilson (1994). “Quantifyingthe credibility of energy projections from trends in past data: The US energy sector,” EnergyPolicy 22(2): 119–130.
Kahneman, Daniel and Amos Tversky (1988). “Rational Choice and the Framing of Decisions,” inBell et al. (eds.) Decision Making: Descriptive, Normative, and Prescriptive Interactions,Cambridge: Cambridge University Press, pp. 167–192.
Zeckhauser, Richard J. (1991). “The Strategy of Choice” in Richard J. Zeckhauser (ed.) Strategyand Choice, Cambridge: MIT Press, pp. 1–21.
Zeckhauser, Richard J. (ed.) (1991). Strategy and Choice, Cambridge: MIT Press.
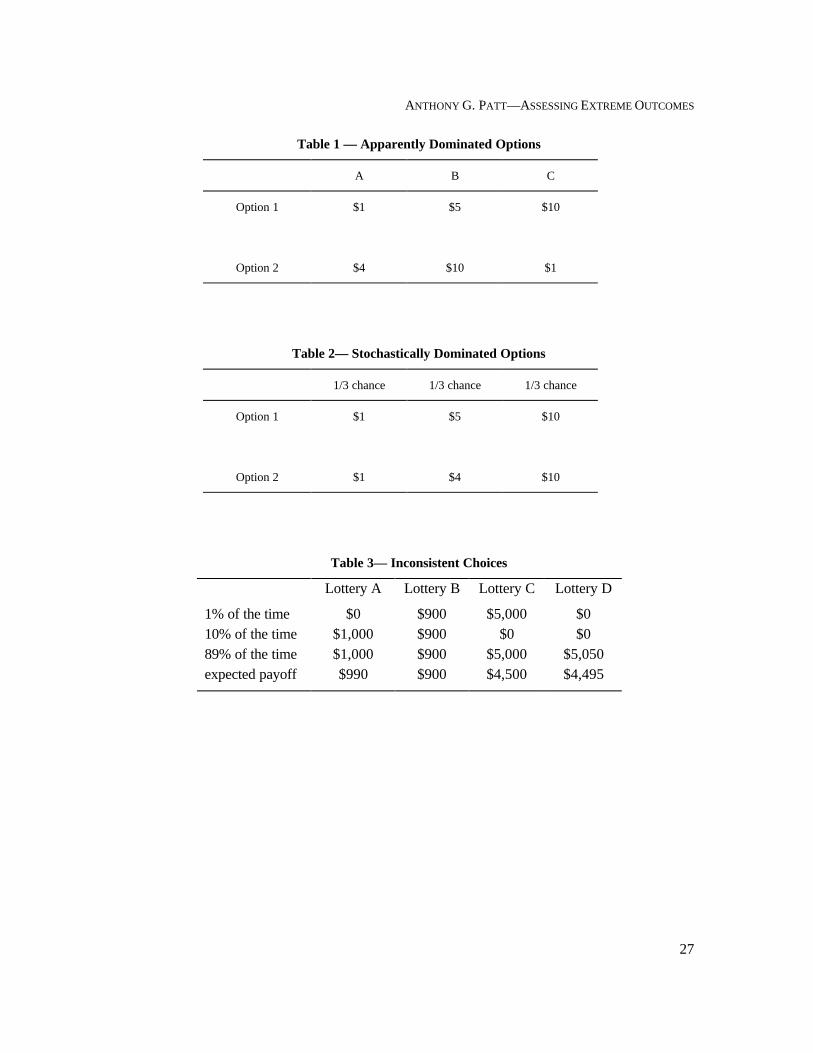
ANTHONY G. PATT—ASSESSING EXTREME OUTCOMES
27
Table 1 — Apparently Dominated Options
A B C
Option 1
Option 2
$1
$4
$5
$10
$10
$1
Table 2— Stochastically Dominated Options
1/3 chance 1/3 chance 1/3 chance
Option 1
Option 2
$1
$1
$5
$4
$10
$10
Table 3— Inconsistent Choices
Lottery A Lottery B Lottery C Lottery D
1% of the time $0 $900 $5,000 $010% of the time $1,000 $900 $0 $089% of the time $1,000 $900 $5,000 $5,050expected payoff $990 $900 $4,500 $4,495
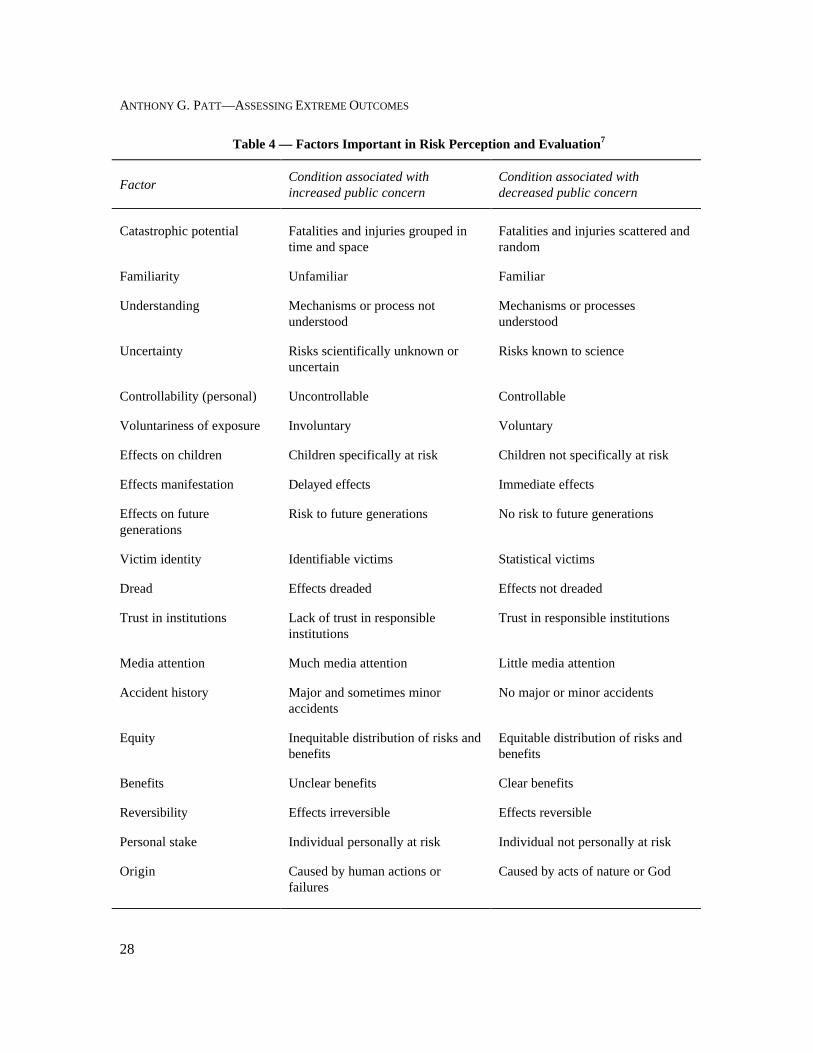
ANTHONY G. PATT—ASSESSING EXTREME OUTCOMES
28
Table 4 — Factors Important in Risk Perception and Evaluation7
FactorCondition associated withincreased public concern
Condition associated withdecreased public concern
Catastrophic potential Fatalities and injuries grouped intime and space
Fatalities and injuries scattered andrandom
Familiarity Unfamiliar Familiar
Understanding Mechanisms or process notunderstood
Mechanisms or processesunderstood
Uncertainty Risks scientifically unknown oruncertain
Risks known to science
Controllability (personal) Uncontrollable Controllable
Voluntariness of exposure Involuntary Voluntary
Effects on children Children specifically at risk Children not specifically at risk
Effects manifestation Delayed effects Immediate effects
Effects on futuregenerations
Risk to future generations No risk to future generations
Victim identity Identifiable victims Statistical victims
Dread Effects dreaded Effects not dreaded
Trust in institutions Lack of trust in responsibleinstitutions
Trust in responsible institutions
Media attention Much media attention Little media attention
Accident history Major and sometimes minoraccidents
No major or minor accidents
Equity Inequitable distribution of risks andbenefits
Equitable distribution of risks andbenefits
Benefits Unclear benefits Clear benefits
Reversibility Effects irreversible Effects reversible
Personal stake Individual personally at risk Individual not personally at risk
Origin Caused by human actions orfailures
Caused by acts of nature or God
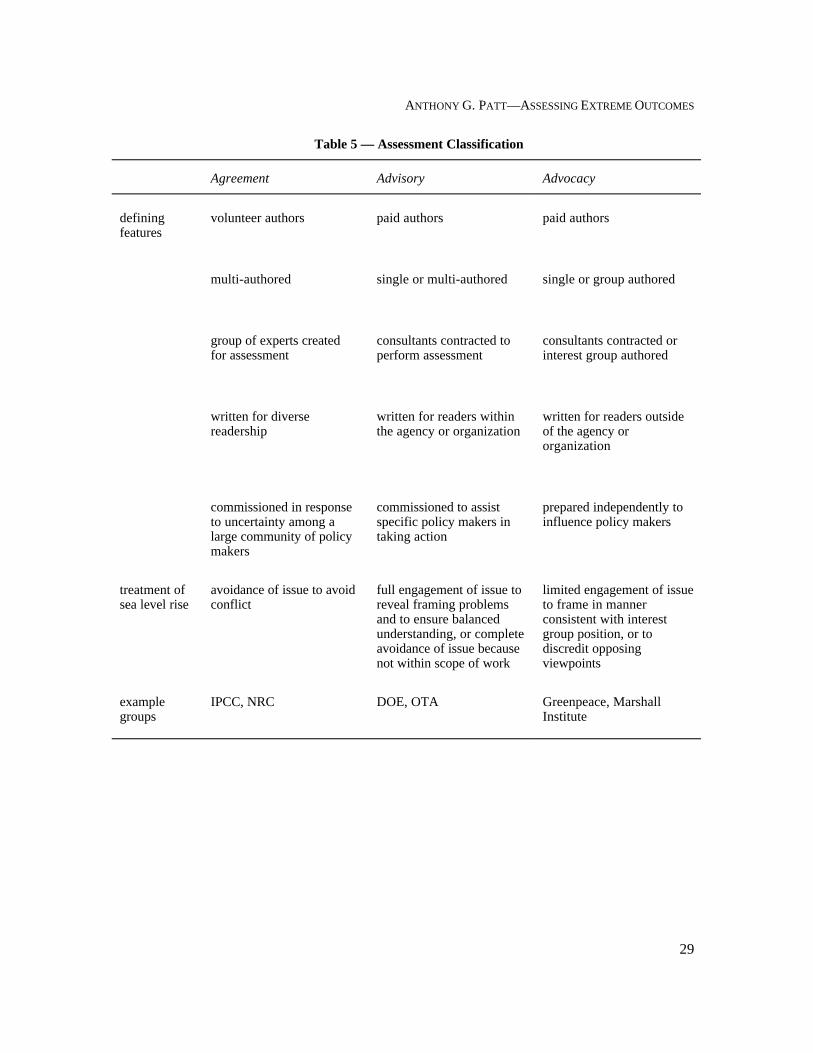
ANTHONY G. PATT—ASSESSING EXTREME OUTCOMES
29
Table 5 — Assessment Classification
Agreement Advisory Advocacy
definingfeatures
volunteer authors
multi-authored
group of experts createdfor assessment
written for diversereadership
commissioned in responseto uncertainty among alarge community of policymakers
paid authors
single or multi-authored
consultants contracted toperform assessment
written for readers withinthe agency or organization
commissioned to assistspecific policy makers intaking action
paid authors
single or group authored
consultants contracted orinterest group authored
written for readers outsideof the agency ororganization
prepared independently toinfluence policy makers
treatment ofsea level rise
avoidance of issue to avoidconflict
full engagement of issue toreveal framing problemsand to ensure balancedunderstanding, or completeavoidance of issue becausenot within scope of work
limited engagement of issueto frame in mannerconsistent with interestgroup position, or todiscredit opposingviewpoints
examplegroups
IPCC, NRC DOE, OTA Greenpeace, MarshallInstitute
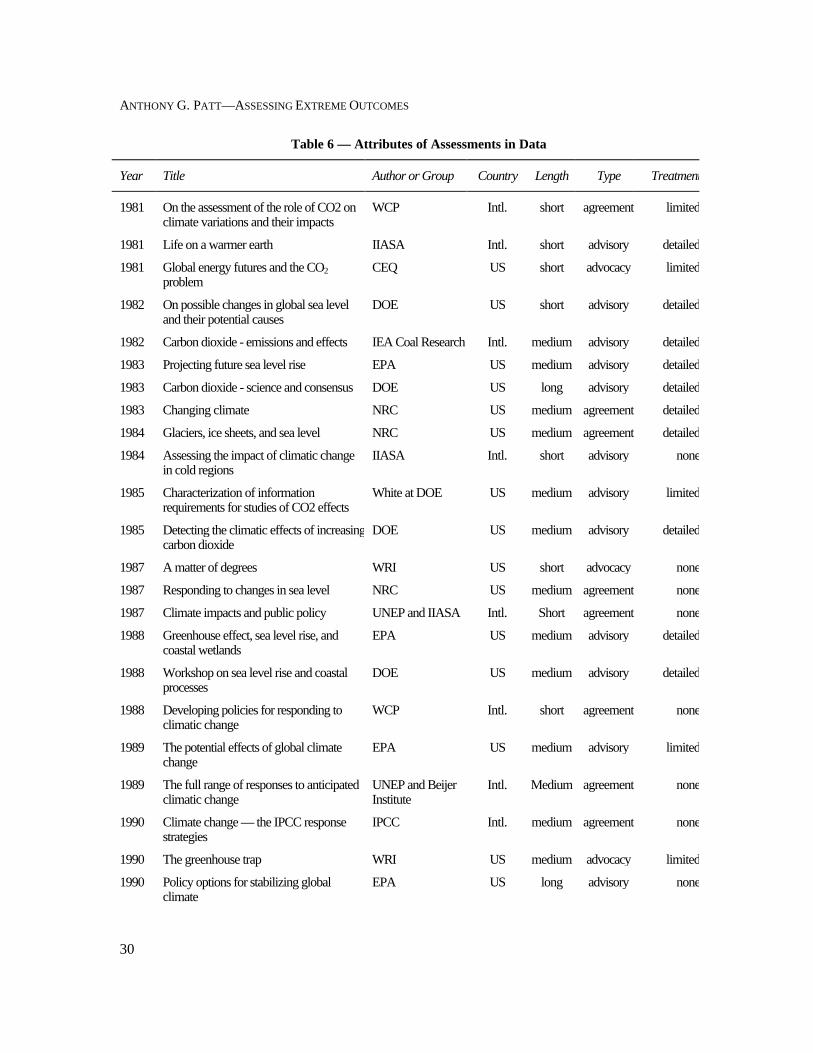
ANTHONY G. PATT—ASSESSING EXTREME OUTCOMES
30
Table 6 — Attributes of Assessments in Data
Year Title Author or Group Country Length Type Treatment
1981 On the assessment of the role of CO2 onclimate variations and their impacts
WCP Intl. short agreement limited
1981 Life on a warmer earth IIASA Intl. short advisory detailed
1981 Global energy futures and the CO2
problemCEQ US short advocacy limited
1982 On possible changes in global sea leveland their potential causes
DOE US short advisory detailed
1982 Carbon dioxide - emissions and effects IEA Coal Research Intl. medium advisory detailed
1983 Projecting future sea level rise EPA US medium advisory detailed
1983 Carbon dioxide - science and consensus DOE US long advisory detailed
1983 Changing climate NRC US medium agreement detailed
1984 Glaciers, ice sheets, and sea level NRC US medium agreement detailed
1984 Assessing the impact of climatic changein cold regions
IIASA Intl. short advisory none
1985 Characterization of informationrequirements for studies of CO2 effects
White at DOE US medium advisory limited
1985 Detecting the climatic effects of increasingcarbon dioxide
DOE US medium advisory detailed
1987 A matter of degrees WRI US short advocacy none
1987 Responding to changes in sea level NRC US medium agreement none
1987 Climate impacts and public policy UNEP and IIASA Intl. Short agreement none
1988 Greenhouse effect, sea level rise, andcoastal wetlands
EPA US medium advisory detailed
1988 Workshop on sea level rise and coastalprocesses
DOE US medium advisory detailed
1988 Developing policies for responding toclimatic change
WCP Intl. short agreement none
1989 The potential effects of global climatechange
EPA US medium advisory limited
1989 The full range of responses to anticipatedclimatic change
UNEP and BeijerInstitute
Intl. Medium agreement none
1990 Climate change — the IPCC responsestrategies
IPCC Intl. medium agreement none
1990 The greenhouse trap WRI US medium advocacy limited
1990 Policy options for stabilizing globalclimate
EPA US long advisory none
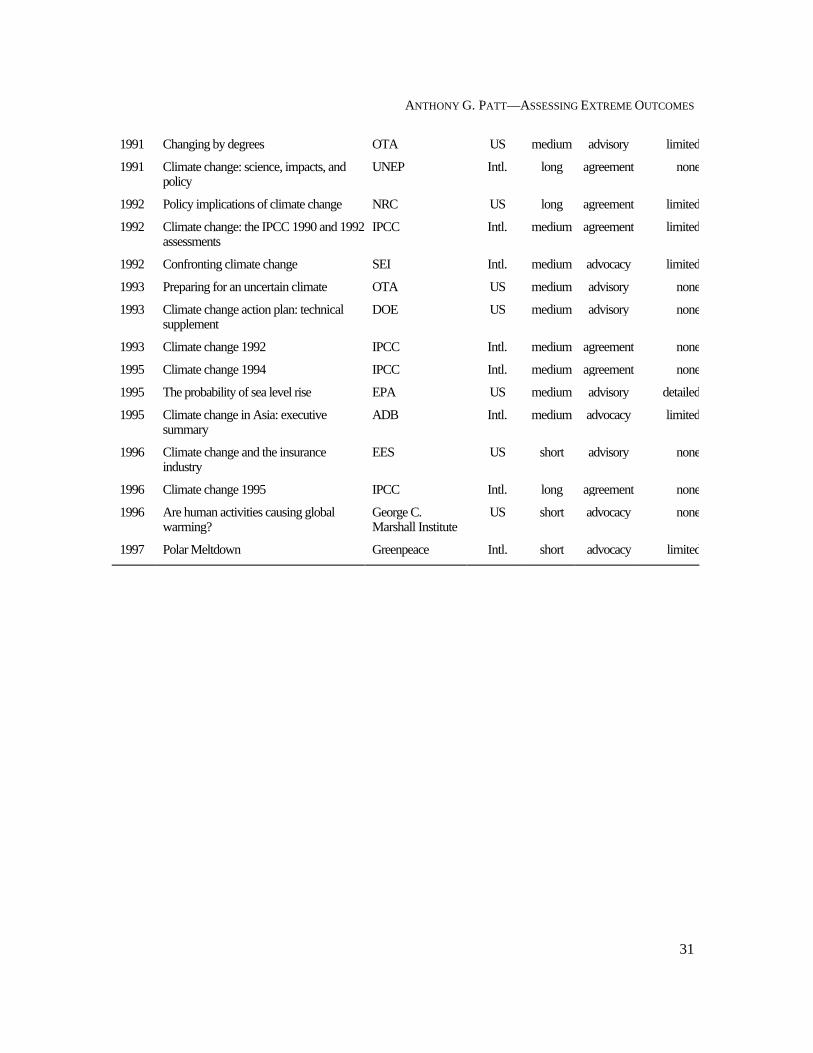
ANTHONY G. PATT—ASSESSING EXTREME OUTCOMES
31
1991 Changing by degrees OTA US medium advisory limited
1991 Climate change: science, impacts, andpolicy
UNEP Intl. long agreement none
1992 Policy implications of climate change NRC US long agreement limited
1992 Climate change: the IPCC 1990 and 1992assessments
IPCC Intl. medium agreement limited
1992 Confronting climate change SEI Intl. medium advocacy limited
1993 Preparing for an uncertain climate OTA US medium advisory none
1993 Climate change action plan: technicalsupplement
DOE US medium advisory none
1993 Climate change 1992 IPCC Intl. medium agreement none
1995 Climate change 1994 IPCC Intl. medium agreement none
1995 The probability of sea level rise EPA US medium advisory detailed
1995 Climate change in Asia: executivesummary
ADB Intl. medium advocacy limited
1996 Climate change and the insuranceindustry
EES US short advisory none
1996 Climate change 1995 IPCC Intl. long agreement none
1996 Are human activities causing globalwarming?
George C.Marshall Institute
US short advocacy none
1997 Polar Meltdown Greenpeace Intl. short advocacy limited

ANTHONY G. PATT—ASSESSING EXTREME OUTCOMES
32
Table 7 — Maximum Likelihood Estimation Results
A BLimited Treatment Detailed Treatment Any Treatment
advisory
advocacy
years after 1978
years2 after 1978
short
constant
2.2925*
(1.3742)
6.2788*
(3.4152)
-2.4513**
(1.2433)
.0904*
(.0473)
-6.9209 *
(3.6920)
14.4795*
(7.8055)
5.5909**
(2.3145)
-35.9389(1.74 x 10⁹)
-4.6536**
(1.8801)
.1752**
(.0750)
-12.0163**
(5.1517)
24.8923**
(10.3587)
2.9506**
(1.3002)
6.8984*
(3.5430)
-2.8387**
(1.2287)
.1049**
(.0466)
-7.8420**
(3.7310)
16.9860**
(7.7368)
type of regression
sample size
pseudo R2
multinomial logit
38
0.5698
standard logit
38
0.5660
** Significant at 0.05 probability level * Significant at 0.10 probability level
(standard errors in parentheses)

ANTHONY G. PATT—ASSESSING EXTREME OUTCOMES
33
Table 8 — Standard and Bootstrap Regressions
coefficient standard error 95% lower bound 95% upper bound
advisory .3712.3712
.1450
.1600.0757.0672
.6666
.6947
advocacy .5883.5883
.1849
.1860.2116.1880
.9650
.9311
years after 1978 -.1852-.1852
.0738
.0725-.3356-.3173
-.0349-.0388
year2 after 1978 .0066.0066
.0033
.0033-.0002-.0001
.0133
.0128
short -.5292-.5292
.1623
.1577-.8598-.8483
-.1986-.2048
numbers on top result from single least-squares regressionnumbers on bottom result from bootstrapped least-squares regressions
number of repetitions in bootstrap: 1,000sample size: 38

ANTHONY G. PATT—ASSESSING EXTREME OUTCOMES
34
value
losses gains
Figure 1 — Prospect Theory Utility Curve8
0
1
1
Sub
ject
ive
Pro
babi
lity
Objective Probability
Expec
ted R
espo
nse
Observe
d
Figure 2 — Relationship between Objective and Subjective Probabilities9
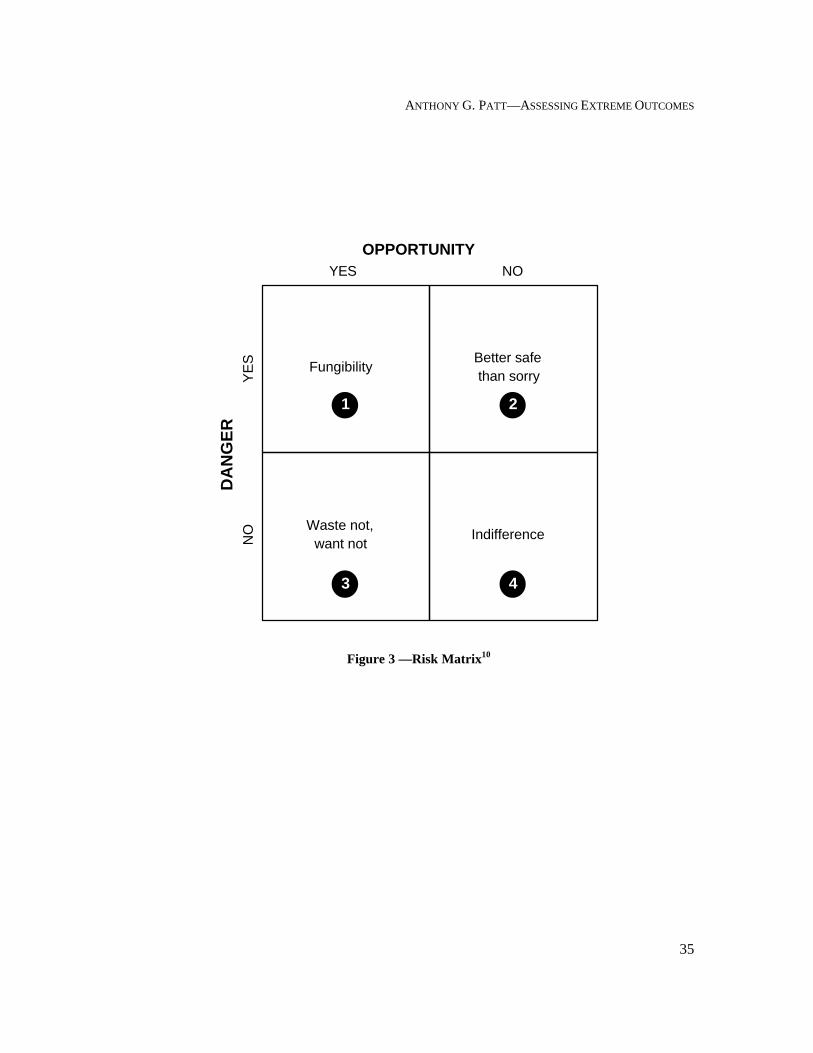
ANTHONY G. PATT—ASSESSING EXTREME OUTCOMES
35
FungibilityBetter safe than sorry
Waste not, want not
Indifference
YES NO
YE
SN
OOPPORTUNITY
DA
NG
ER
1 2
3 4
Figure 3 —Risk Matrix10
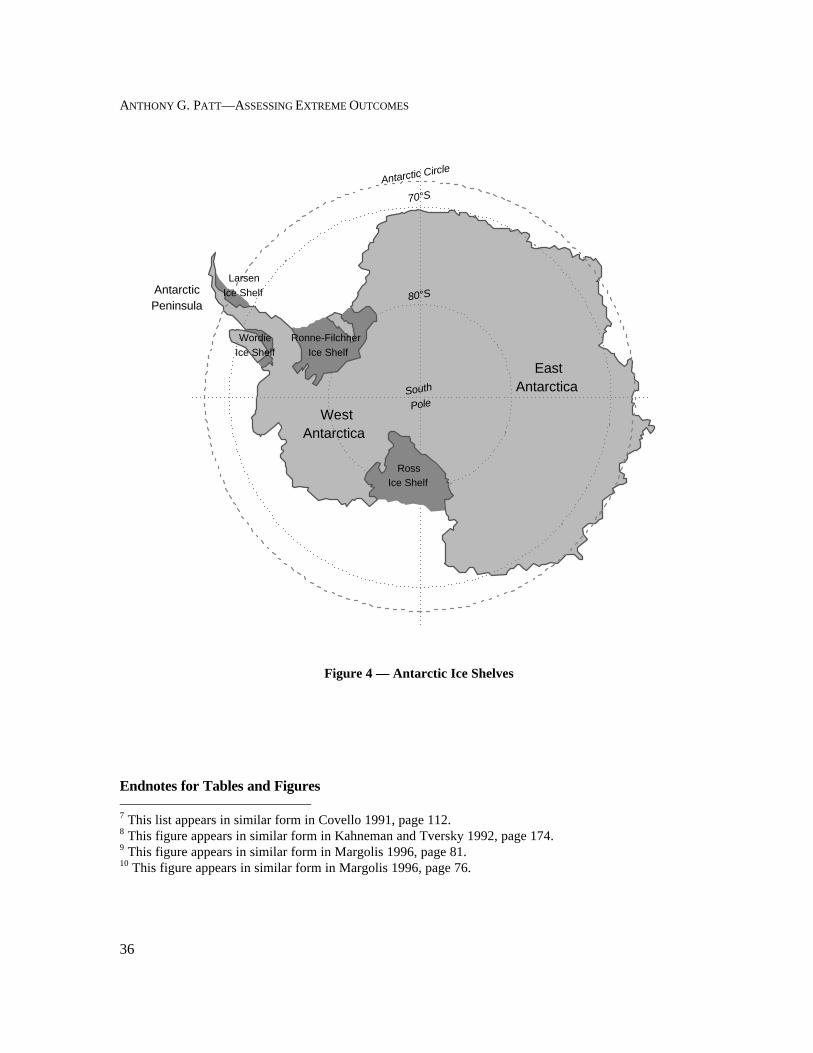
ANTHONY G. PATT—ASSESSING EXTREME OUTCOMES
36
East Antarctica
West Antarctica
South
Pole
80°S
70°S
Antarctic Circle
Wordie Ice Shelf
Larsen Ice ShelfAntarctic
Peninsula
Ronne-Filchner Ice Shelf
Ross Ice Shelf
Figure 4 — Antarctic Ice Shelves
Endnotes for Tables and Figures 7 This list appears in similar form in Covello 1991, page 112.8 This figure appears in similar form in Kahneman and Tversky 1992, page 174.9 This figure appears in similar form in Margolis 1996, page 81.10 This figure appears in similar form in Margolis 1996, page 76.