azo-functionalized microporous organic … microporous organic polymers: synthesis and applications...
TRANSCRIPT
1
Azo-functionalized microporous organic polymers:
Synthesis and applications in CO2 capture and conversion
Zhenzhen Yang, Hongye Zhang, Bo Yu, Yanfei Zhao, Zhishuang Ma, Guipeng Ji,
Buxing Han & Zhimin Liu*
Beijing National Laboratory for Molecular Sciences, Key Laboratory of Colloid,
Interface and Thermodynamics, Institute of Chemistry, Chinese Academy of Sciences,
Beijing 100190, PR China; Tel: (+) 86-10-62562852; E-mail: [email protected]
Table of contents
1. General experimental methods ........................................................................................ 2
2. Synthetic procedures ......................................................................................................... 2
Figure S1. ................................................................................................................................... 7
Figure S2. ................................................................................................................................... 8
Figure S3. ................................................................................................................................... 9
Figure S4. ................................................................................................................................. 10
Figure S5. ................................................................................................................................. 11
Figure S6. ................................................................................................................................. 11
Figure S7. ................................................................................................................................. 13
Figure S8. ................................................................................................................................. 14
Figure S9. ................................................................................................................................. 15
Figure S10. ............................................................................................................................... 16
Figure S11. ............................................................................................................................... 19
Figure S12. ............................................................................................................................... 19
Table S1. .................................................................................................................................. 20
Figure S13. ............................................................................................................................... 21
Scheme S1. .............................................................................................................................. 21
3. Characterization (NMR) of the methylamine products ................................................... 22
Electronic Supplementary Material (ESI) for ChemComm.This journal is © The Royal Society of Chemistry 2015
2
1. General experimental methods
Materials
All reagents and solvents were purchased from commercial sources and were used without further
purification, unless indicated otherwise. Tetrakis(4-aminophenyl)methane (A-1) and
2,6,14-triaminotriptycene (A-2) were prepared following procedures reported in the literature.
Instrumentation
Liquid 1H NMR spectra was recorded in CDCl3 as internal reference (7.26 ppm) on Bruck 400
spectrometer. Liquid 13
C NMR was recorded at 100.6 MHz in CDCl3 as internal reference (77.0
ppm). Solid-state NMR experiments were performed on a Bruker WB Avance II 400 MHz
spectrometer. The 13
C CP/MAS NMR spectra were recorded with a 4-mm double-resonance MAS
probe and with a sample spinning rate of 10.0 kHz; a contact time of 2 ms (ramp 100) and pulse
delay of 3 s were applied. FTIR spectra of the samples were collected on a TENSOR 27 FTIR at a
resolution of 2 cm-1
. The nitrogen adsorption and desorption isotherms were measured at 77 K
using a Micromeritics ASAP 2020M system. The samples were outgassed at 120 oC for 8 h before
the measurements. Surface areas were calculated from the adsorption data using Langmuir and
Brunauer-Emmett-Teller (BET) methods. The pore-size-distribution curves were obtained from
the adsorption branches using non-local density functional theory (NLDFT) method. Field
emission scanning electron microscopy (SEM) observations were performed on a Hitachi S-4800
microscope operated at an accelerating voltage of 15.0 kV. Transmission electron microscopy
(TEM) images were obtained with a JEOL JEM-1011 instrument operated at 200 kV. The thermal
properties of the materials were evaluated using a thermogravimetric analysis (TGA) instrument
(STA PT1600 Linseis) over the temperature range of 25 to 800 °C under air atmosphere with a
heating rate of 10 °C/min. X-ray photoelectron spectroscopy (XPS) was performed on an ESCAL
Lab 220i-XL spectrometer at a pressure of ~3×10⁻⁹
mbar (1 mbar = 100 Pa) using Al Ka as the
excitation source (hn=1486.6 eV) and operated at 15 kV and 20 mA. The binding energies were
referenced to the C1s line at 284.8 eV from adventitious carbon. The loading content of Ru in the
catalysts was determined by ICP-AES (VISTA-MPX). ESI-MS were recorded on a Thermo
Finnigan LCQ Advantage spectrometer in ESI mode with a spray voltage of 4.8 kV.
2. Synthetic procedures
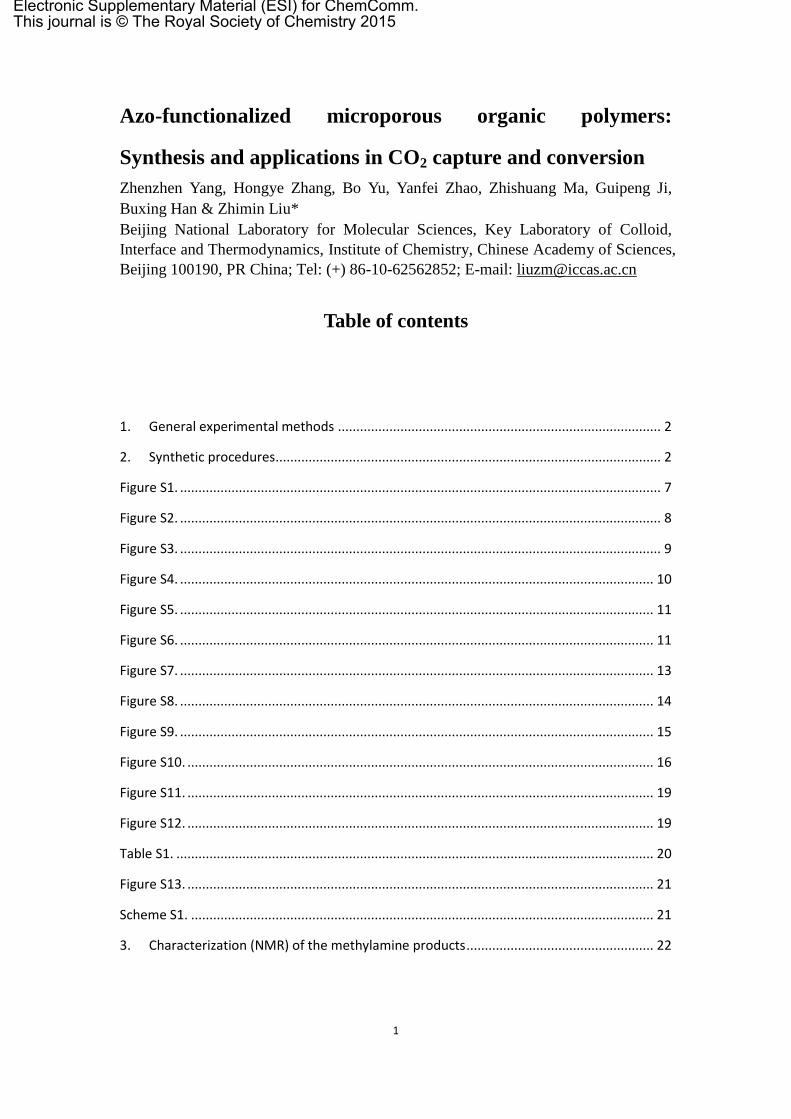
(1) Synthesis of tetrakis(4-aminophenyl)methane (A-1)
Ref.: Macromolecules 2013, 46, 3058-3066; J. Org. Chem. 2006, 71, 6626-6629.
3
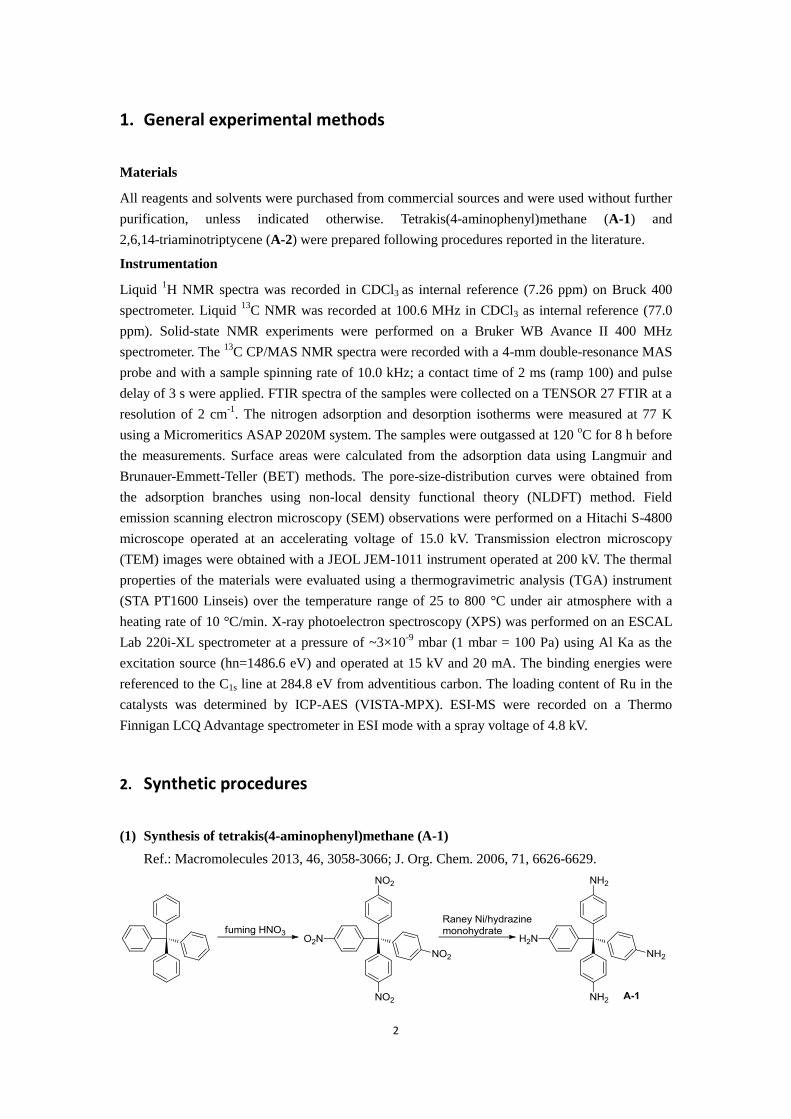
Tetrakis(4-nitrophenyl)methane was first synthesized as follows. Tetraphenylmethane (23 mmol)
was added into fuming nitric acid (40 mL) at -40 oC under vigorous stirring. Then acetic
anhydride (12.5 mL) and acetic acid (25 mL) were slowly added and stirred for 10 h. After
filtration, the precipitate was washed with H2O and dried at 60 oC under vacuum for 10 h. The
resultant yellow solid was used directly for the next step without further purification.
For the synthesis of tetrakis(4-aminophenyl)methane (A-1), hydrazine monohydrate (1.5 mL)
and Raney Ni (~1.0 g) were added to a solution of tetrakis(4-nitrophenyl)methane (2 mmol) in
THF (20 mL). After heating at 60 oC until all hydrazine was quenched, the mixture was cooled to
room temperature and then filtered. The filtrate was concentrated by rotary evaporation to remove
the solvent, and tetrakis(4-aminophenyl)methane (A-1) was obtained as a white solid in
quantitative yield. 1H NMR (d6-DMSO, 400 MHz) δ 4.84 (s, 8H), 6.33-6.42 (m, 8H), 6.66-6.73 (m,
8H); 13
C NMR (d6-DMSO, 100.6 MHz) δ 61.09, 112.55, 131.01, 135.82, 145.63; ESI-MS calcd
for C25H24N4 380.2, found 381.1 [M+H]+.

4
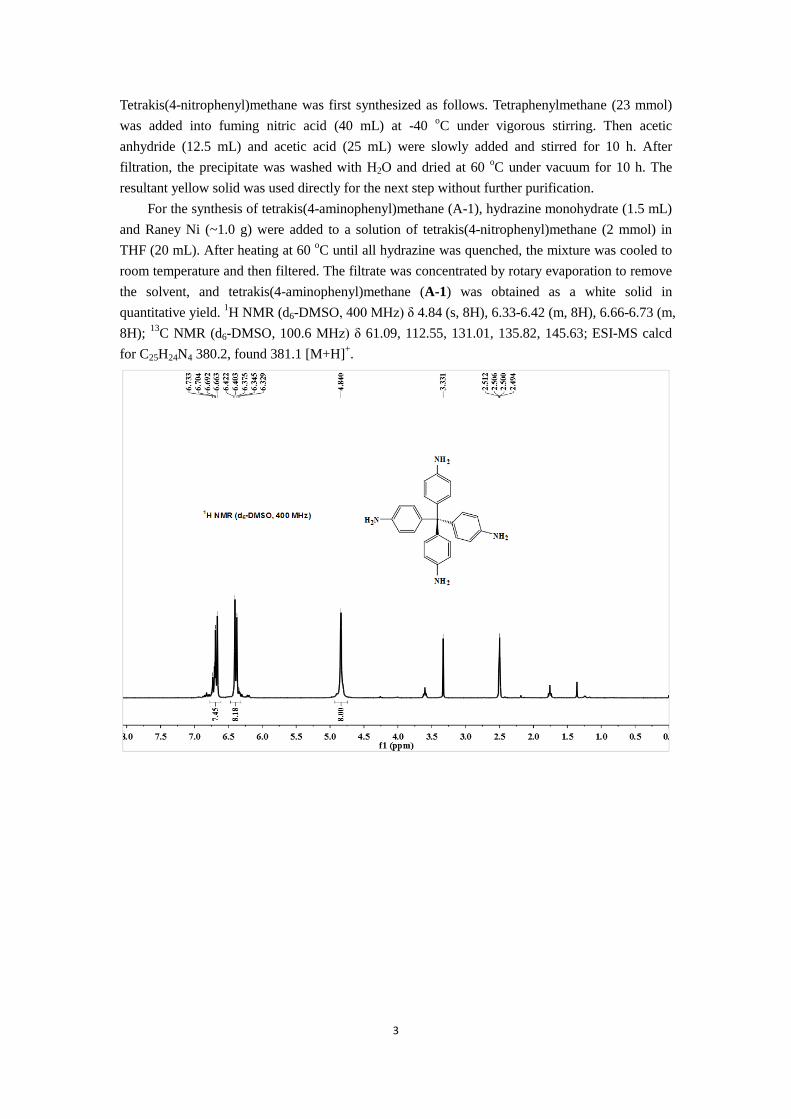
(2) Synthesis of 2,6,14-triaminotriptycene (A-2)
Ref.: Macromolecules 2013, 46, 3058-3066; J. Org. Chem. 2006, 71, 6626-6629.
2,6,14-Trinitrotriptycene was first synthesized as follows. To triptycene (1 mmol) was added
concentrated HNO3 (10 mL), and the mixture was heated at 75 oC for 24 h. The brown solution
was cooled to R.T., then poured into H2O (100 mL) and stirred. The precipitate was collected,
washed with cold water, and then dried at 60 oC under vacuum for 10 h. The crude products were
separated by column chromatography on silica gel with dichloromethane/petroleum ether (1:1) as
eluent to afford the desired 2,6,14-trinitrotriptycene.
2,6,14-Triaminotriptycene (A-2) was prepared by a procedure similar to that for except that the
precursor compound is 2,6,14-trinitrotriptycene. 1H NMR (CDCl3, 400 MHz) δ 4.81 (s, 6H), 4.88
(s, 2H), 6.05-6.09 (m, 3H), 6.55-6.62 (m, 3H), 6.87-6.94 (m, 3H). 13
C NMR (d6-DMSO, 100.6
MHz) δ 51.25, 52.42, 108.18, 108.43, 108.66, 109.81, 110.18, 110.55, 122.51, 122.90, 123.26,
133.17, 134.08, 135.05, 145.06, 145.28, 145.47, 146.17, 146.95, 147.78. ESI-MS calcd for
C20H17N3 299.1, found 300.2 [M+H]+.
5
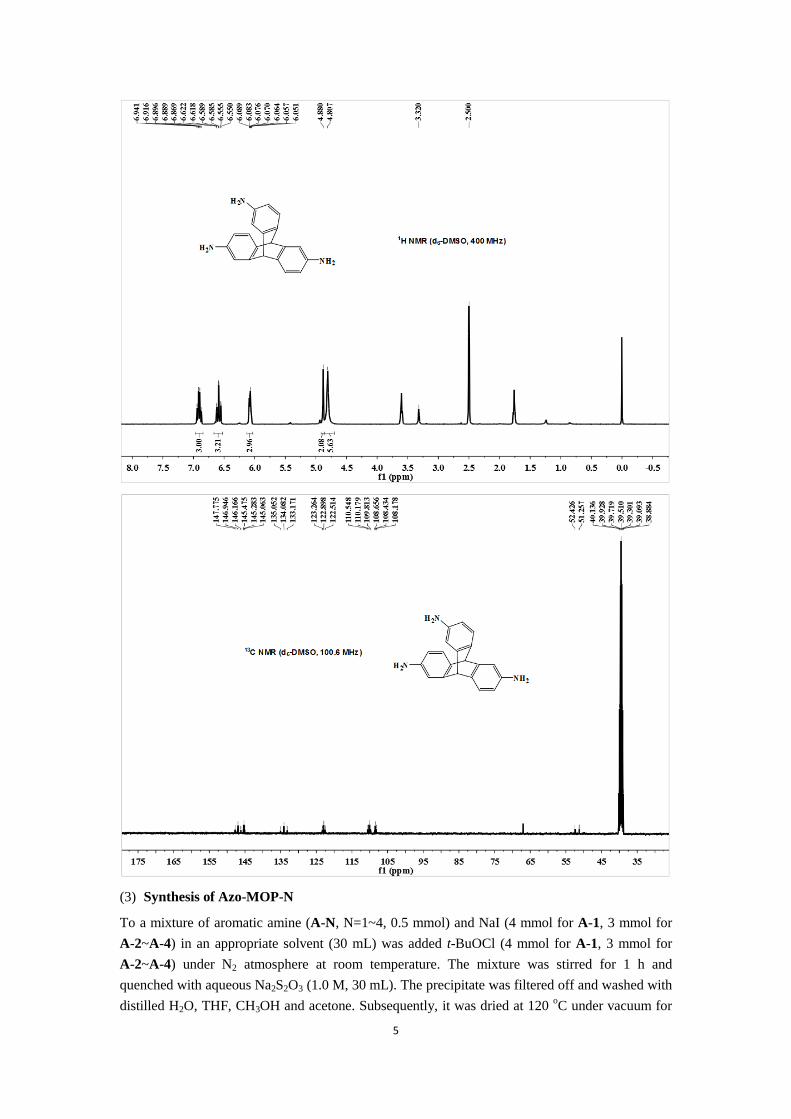
(3) Synthesis of Azo-MOP-N
To a mixture of aromatic amine (A-N, N=1~4, 0.5 mmol) and NaI (4 mmol for A-1, 3 mmol for
A-2~A-4) in an appropriate solvent (30 mL) was added t-BuOCl (4 mmol for A-1, 3 mmol for
A-2~A-4) under N2 atmosphere at room temperature. The mixture was stirred for 1 h and
quenched with aqueous Na2S2O3 (1.0 M, 30 mL). The precipitate was filtered off and washed with
distilled H2O, THF, CH3OH and acetone. Subsequently, it was dried at 120 oC under vacuum for

6
48 h to yield Azo-MOP-N. Yields were 95%, 97%, 96%, 95% for Azo-MOP-1, Azo-MOP-2,
Azo-MOP-3 and Azo-MOP-4, respectively. Elemental analysis data: Azo-MO-1 (C 65.86%, H
4.24%, N 11.33%), Azo-MO-2 (C 69.64%, H 4.45%, N 8.52%), Azo-MO-3 (C 68.99%, H 4.41%,
N 8.48%), Azo-MO-4 (C 57.23%, H 4.00%, N 11.99%).
(4) Synthesis of Azo-MOP-N-Ru
RuCl3·3H2O (130 mg) was dissolved in 25 mL of EtOH, and then Azo-MOP-N (1 g) was added.
The mixture was kept stirring for 24 h at room temperature. The resulting solid was isolated by
filtration and washed with EtOH, and then purified using Soxhlet extraction (EtOH) for 24 h.
Azo-MOP-N-Ru was obtained as a brown powder after drying at 100 oC under vacuum for 12 h.
(5) Typical procedure of the methylation of amines catalyzed by Azo-MOP-N-Ru
A stainless steel autoclave with a Teflon tube (25 mL inner volume) was purged with CO2 to
evacuate air, and then Azo-MOP-3-Ru (42.6 mg), PPh3 (0.1 mmol, 26.2 mg), N-methylaniline
(0.5 mmol, 53.6 mg) PhSiH3 (4 mmol, 432.8 mg) and THF (2 mL) were added successively. CO2
(0.5 MPa) was charged in the reactor at room temperature. The autoclave was stirred at 120 oC for
24 h. After reaction, the autoclave was cooling to 0 oC then the excess of gas was vented. The
product yields were determined by GC with a flame ionization detector using dodecane as an
internal standard and were further identified using GC-MS by comparing retention times and
fragmentation patterns with authentic samples. For the substrate scope investigation, the products
were isolated by column chromatography on silica gel (eluent: petroleum and dichloromethane)
and identified by NMR spectra as shown in ESI. For catalyst recycling, the catalyst was recycled
by filtration, washed with THF and ethanol, and then dried under vacuum at 60 oC for 24 h,
followed by being reused for the next run.

7
Figure S1. Yield and BET plot (P/P0 = 0.06-0.2) from N2 isotherms at 77 K of Azo-MOP-1
obtained by adopting various solvents. The yield of Azo-MOP-1 was 23% and 5% with acetone
and THF as solvent, respectively.
0.000434
0.000634
0.000834
0.001034
0.001234
0.001434
0.001634
0.001834
0.002034
0.06 0.11 0.16 0.21
1/[
Q(P
o/P
-1)]
Relative pressure/(P/Po)
CH3CN
0.000434
0.005434
0.010434
0.015434
0.020434
0.025434
0.030434
0.06 0.11 0.16 0.21
1/[
Q(P
o/P
-1)]
Relative pressure/(P/Po)
CHCl3
0.000434
0.002434
0.004434
0.006434
0.008434
0.010434
0.012434
0.014434
0.016434
0.06 0.11 0.16 0.21
1/[
Q(P
o/P
-1)]
Relative pressure/(P/Po)
CH3OCH2OCH3
0.000434
0.005434
0.010434
0.015434
0.020434
0.025434
0.030434
0.06 0.11 0.16 0.21
1/[
Q(P
o/P
-1)]
Relative pressure/(P/Po)
CH3CH2OCH2CH3
Yield: 95%BET surface area: 456 m2 g-1
Yield: 70%BET surface area: 34 m2 g-1
Yield: 58%BET surface area: 62 m2 g-1
Yield: 43%BET surface area: 31 m2 g-1
8
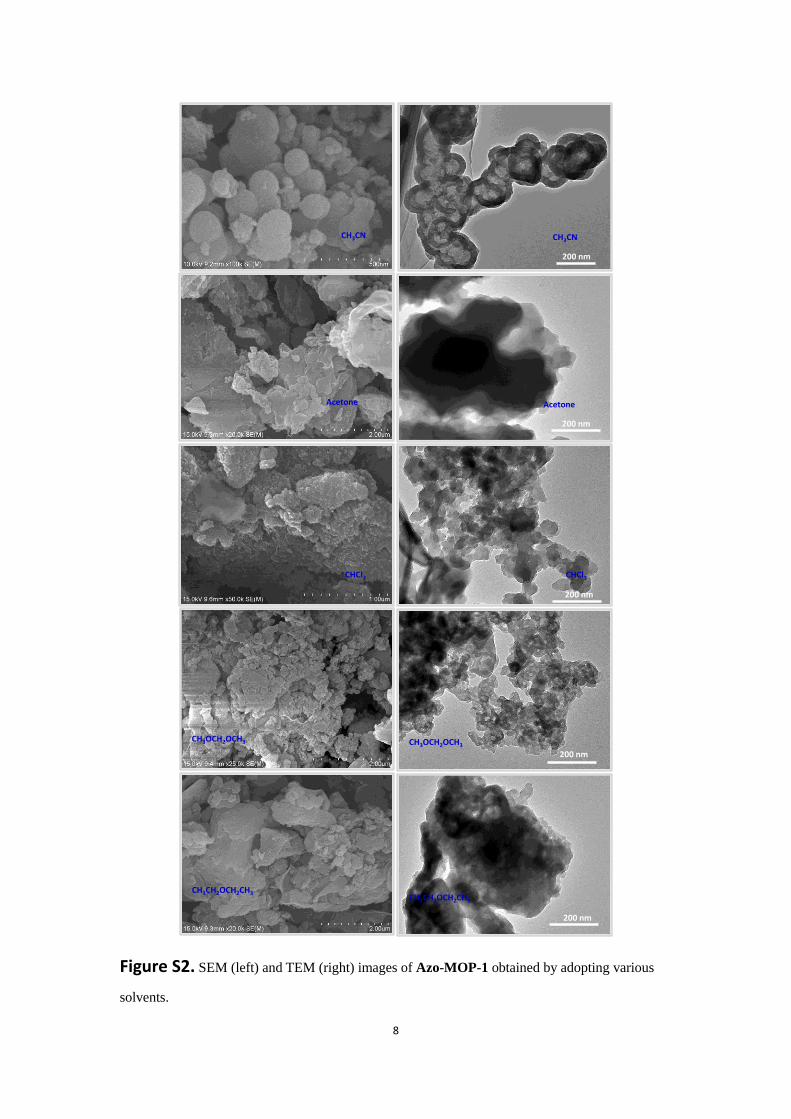
Figure S2. SEM (left) and TEM (right) images of Azo-MOP-1 obtained by adopting various
solvents.
200 nm
CH3CN CH3CN
200 nm
Acetone Acetone
CHCl3
200 nm
CHCl3
200 nm
CH3OCH2OCH3
200 nm
CH3OCH2OCH3
CH3CH2OCH2CH3
CH3CH2OCH2CH3
9
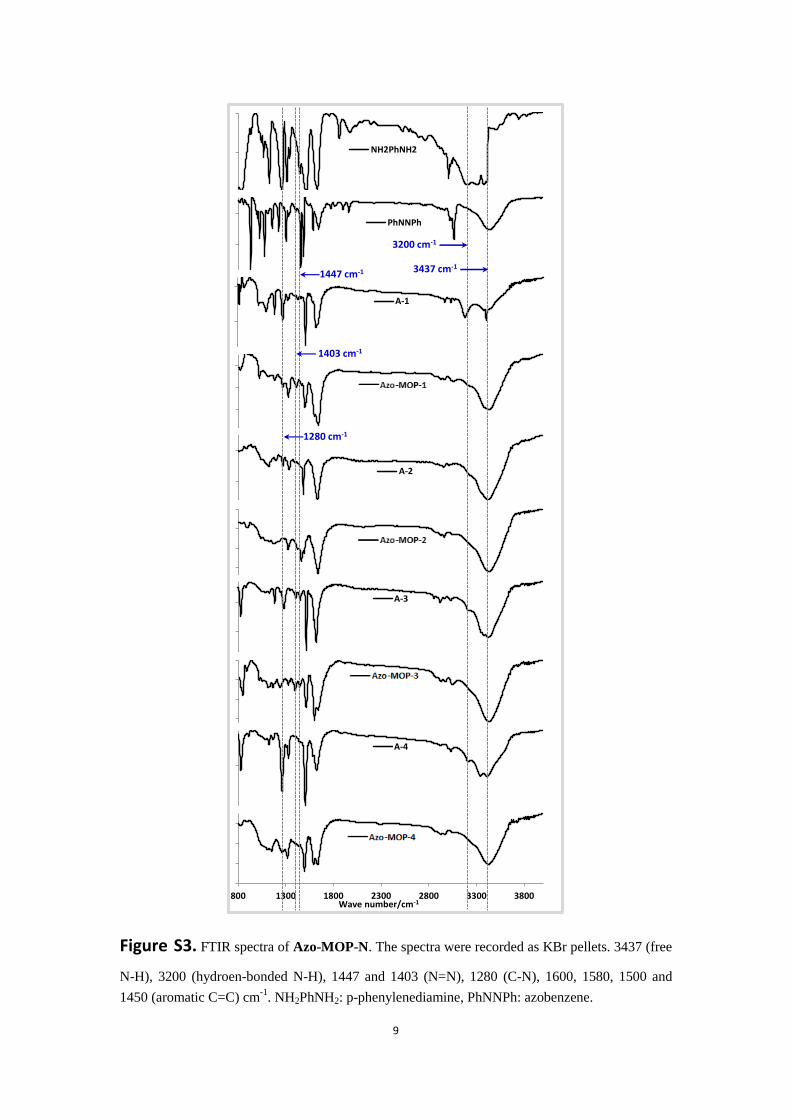
Figure S3. FTIR spectra of Azo-MOP-N. The spectra were recorded as KBr pellets. 3437 (free
N-H), 3200 (hydroen-bonded N-H), 1447 and 1403 (N=N), 1280 (C-N), 1600, 1580, 1500 and
1450 (aromatic C=C) cm-1
. NH2PhNH2: p-phenylenediamine, PhNNPh: azobenzene.
0
0.5
1
800 1300 1800 2300 2800 3300 3800标题
标题
NH2PhNH2
0.5
0.7
0.9
800 1300 1800 2300 2800 3300 3800
标题
标题
PhNNPh
0.55
0.75
0.95
800 1300 1800 2300 2800 3300 3800Tran
smit
tan
ce
Wavenumber/cm-1
A-1
0.65
0.75
0.85
0.95
800 1300 1800 2300 2800 3300 3800
标题
标题
Azo-CMP-1
0.5
0.7
0.9
800 1300 1800 2300 2800 3300 3800
标题
标题
A-2
0.6
0.7
0.8
0.9
1
800 1300 1800 2300 2800 3300 3800
标题
标题
Azo-CMP-2
0.45
0.65
0.85
800 1300 1800 2300 2800 3300 3800
标题
标题
A-3
0.6
0.7
0.8
0.9
1
800 1300 1800 2300 2800 3300 3800
标题
标题
Azo-CMP-3
0.1
0.6
800 1300 1800 2300 2800 3300 3800
标题
标题
A-4
0.65
0.75
0.85
0.95
800 1300 1800 2300 2800 3300 3800
标题
Wave number/cm-1
Azo-CMP-4
3437 cm-1
3200 cm-1
1403 cm-1
1447 cm-1
1280 cm-1

10
Figure S4. FTIR spectra of RuCl3·3H2O and Azo-MOP-N-Ru (N = 1~4). The spectra were
recorded as KBr pellets. 1609 (H2O bending vibration), 1076 (Ru-Cl).
0.2
0.4
0.6
0.8
1
800 1300 1800 2300 2800 3300 3800
标题
标题
RuCl3 3H2O
0.6
0.7
0.8
0.9
1
800 1300 1800 2300 2800 3300 3800
标题
标题
Azo-MOP-1-Ru
0.65
0.75
0.85
0.95
800 1300 1800 2300 2800 3300 3800
标题
标题
Azo-MOP-2-Ru
0.6
0.7
0.8
0.9
1
800 1300 1800 2300 2800 3300 3800
标题
标题
Azo-MOP-3-Ru
0.2
0.4
0.6
0.8
1
800 1300 1800 2300 2800 3300 3800
标题
标题
Azo-MOP-4-Ru
0.2
0.4
0.6
0.8
1
800 1300 1800 2300 2800 3300 3800
标题
Wave number/cm-1
Azo-MOP-4-Ru
1609 cm-1
1076 cm-1

11
Figure S5. CP/MAS 13
C NMR spectra of Azo-MOP-N. Azo-MOP-1: δ = 64.2, 116.3, 129.3,
143.2, 150.0; Azo-MOP-2: δ = 53.9, 113.3, 123.3, 145.6, 149.8; Azo-MOP-3: δ = 123.3, 127.4,
142.1, 152.1; Azo-MOP-4: δ = 129.5, 143.9, 148.4.
Figure S6. Thermogravimetric analysis (TGA) of Azo-MOP-N under air up to 800 oC at a
ramping rate of 10 oC min
-1.
Azo-MOP-1
Azo-MOP-2
Azo-MOP-3
Azo-MOP-4
0
20
40
60
80
100
0 200 400 600 800
Re
sid
ual
we
igh
t/%
Temperature/oC
Azo-MOP-1
Azo-MOP-2
Azo-MOP-3
Azo-MOP-4

12
200 nmAzo-MOP-1Azo-MOP-1
Azo-MOP-2Azo-MOP-2
200 nm
200 nm
Azo-MOP-3Azo-MOP-3
200 nm
Azo-MOP-4Azo-MOP-4

13
Figure S7. SEM (left) and TEM (right) images of Azo-MOP-N and Azo-MOP-N-Ru.
100 nm
100 nm
100 nm
100 nm
Azo-MOP-1-Ru Azo-MOP-1-Ru
Azo-MOP-2-RuAzo-MOP-2-Ru
Azo-MOP-3-RuAzo-MOP-3-Ru
Azo-MOP-4-RuAzo-MOP-4-Ru
14
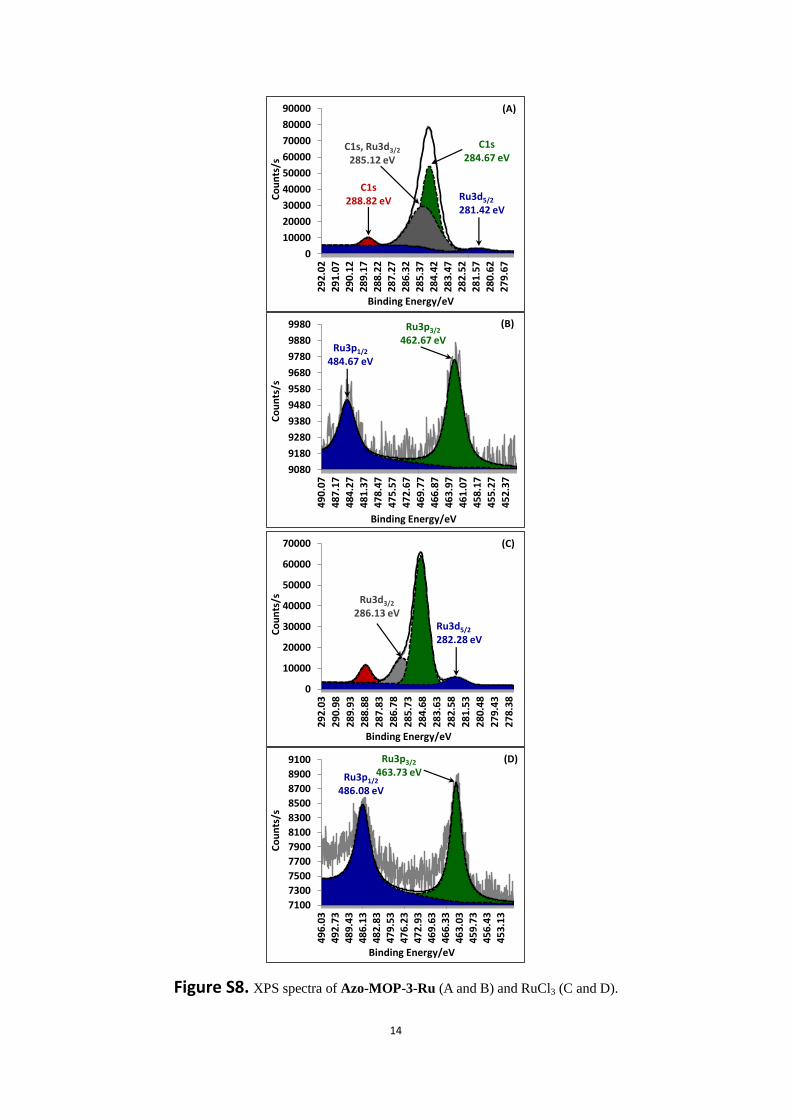
Figure S8. XPS spectra of Azo-MOP-3-Ru (A and B) and RuCl3 (C and D).
0
10000
20000
30000
40000
50000
60000
70000
80000
90000
292.
02
291
.07
290.
12
289
.17
288.
22
287.
27
286.
32
285.
37
284.
42
283.
47
282
.52
281.
57
280
.62
279.
67
Co
un
ts/s
Binding Energy/eV
(A)
Ru3d5/2
281.42 eV
C1s284.67 eV
C1s, Ru3d3/2
285.12 eV
C1s288.82 eV
9080
9180
9280
9380
9480
9580
9680
9780
9880
998049
0.07
487.
17
484.
27
481.
37
478.
47
475.
57
472
.67
469
.77
466
.87
463
.97
461
.07
458.
17
455.
27
452.
37
Co
un
ts/s
Binding Energy/eV
Ru3p1/2
484.67 eV
Ru3p3/2
462.67 eV
(B)
0
10000
20000
30000
40000
50000
60000
70000
292
.03
29
0.9
8
28
9.9
3
288
.88
28
7.8
3
28
6.7
8
28
5.7
3
284
.68
28
3.6
3
28
2.5
8
281
.53
28
0.4
8
27
9.4
3
27
8.3
8
Co
un
ts/s
Binding Energy/eV
Ru3d5/2
282.28 eV
Ru3d3/2
286.13 eV
(C)
7100
7300
7500
7700
7900
8100
8300
8500
8700
8900
9100
496
.03
492.
7348
9.43
486.
1348
2.83
479
.53
476
.23
472.
9346
9.63
466.
3346
3.03
459
.73
456
.43
453.
13
Co
un
ts/s
Binding Energy/eV
Ru3p1/2
486.08 eV
Ru3p3/2
463.73 eV(D)
15
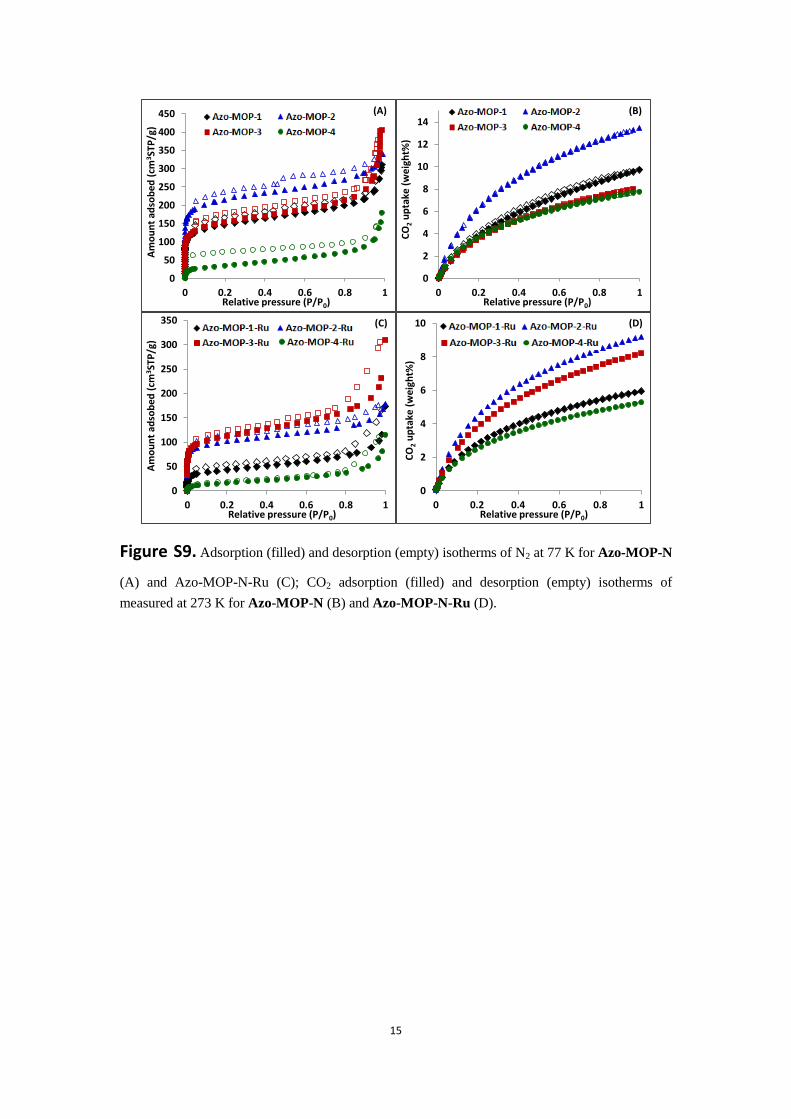
Figure S9. Adsorption (filled) and desorption (empty) isotherms of N2 at 77 K for Azo-MOP-N
(A) and Azo-MOP-N-Ru (C); CO2 adsorption (filled) and desorption (empty) isotherms of
measured at 273 K for Azo-MOP-N (B) and Azo-MOP-N-Ru (D).
0
50
100
150
200
250
300
350
400
450
0 0.2 0.4 0.6 0.8 1
Am
ou
nt
adso
bed
(cm
3ST
P/g
)
Relative pressure (P/P0)
0
2
4
6
8
10
12
14
0 0.2 0.4 0.6 0.8 1
CO
2u
pta
ke (
wei
ght%
)
Relative pressure (P/P0)
0
50
100
150
200
250
300
350
0 0.2 0.4 0.6 0.8 1
Am
ou
nt
adso
bed
(cm
3ST
P/g
)
Relative pressure (P/P0)
(A) (B)
(C)
0
2
4
6
8
10
0 0.2 0.4 0.6 0.8 1
CO
2u
pta
ke (
wei
ght%
)
Relative pressure (P/P0)
(D)
16
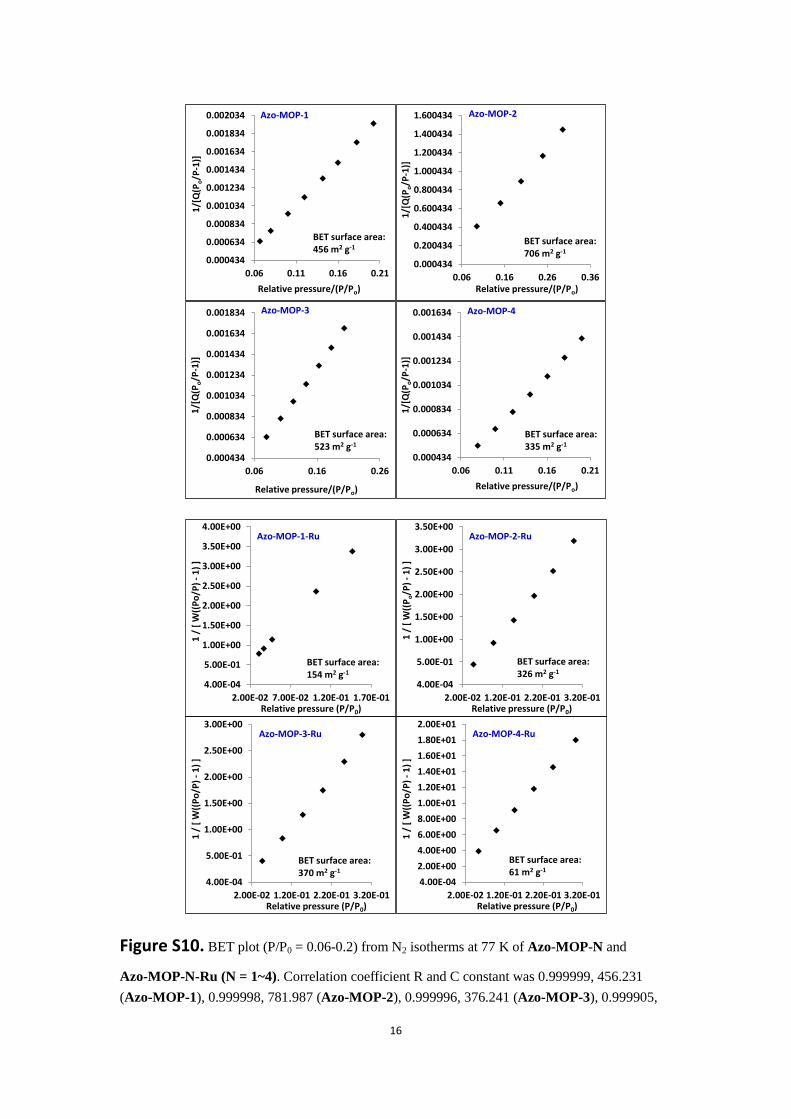
Figure S10. BET plot (P/P0 = 0.06-0.2) from N2 isotherms at 77 K of Azo-MOP-N and
Azo-MOP-N-Ru (N = 1~4). Correlation coefficient R and C constant was 0.999999, 456.231
(Azo-MOP-1), 0.999998, 781.987 (Azo-MOP-2), 0.999996, 376.241 (Azo-MOP-3), 0.999905,
0.000434
0.000634
0.000834
0.001034
0.001234
0.001434
0.001634
0.06 0.11 0.16 0.21
1/[
Q(P
o/P
-1)]
Relative pressure/(P/Po)
0.000434
0.000634
0.000834
0.001034
0.001234
0.001434
0.001634
0.001834
0.06 0.16 0.26
1/[
Q(P
o/P
-1)]
Relative pressure/(P/Po)
0.000434
0.200434
0.400434
0.600434
0.800434
1.000434
1.200434
1.400434
1.600434
0.06 0.16 0.26 0.36
1/[
Q(P
o/P
-1)]
Relative pressure/(P/Po)
0.000434
0.000634
0.000834
0.001034
0.001234
0.001434
0.001634
0.001834
0.002034
0.06 0.11 0.16 0.21
1/[
Q(P
o/P
-1)]
Relative pressure/(P/Po)
BET surface area: 456 m2 g-1
BET surface area: 706 m2 g-1
BET surface area: 523 m2 g-1
BET surface area: 335 m2 g-1
Azo-MOP-1 Azo-MOP-2
Azo-MOP-3 Azo-MOP-4
4.00E-04
5.00E-01
1.00E+00
1.50E+00
2.00E+00
2.50E+00
3.00E+00
3.50E+00
4.00E+00
2.00E-02 7.00E-02 1.20E-01 1.70E-01
1 /
[ W
((P
o/P
) -
1)
]
Relative pressure (P/P0)
Azo-MOP-1-Ru
BET surface area:154 m2 g-1
4.00E-04
5.00E-01
1.00E+00
1.50E+00
2.00E+00
2.50E+00
3.00E+00
2.00E-02 1.20E-01 2.20E-01 3.20E-01
1 /
[ W
((P
o/P
) -
1)
]
Relative pressure (P/P0)
Azo-MOP-3-Ru
BET surface area:370 m2 g-1
4.00E-04
2.00E+00
4.00E+00
6.00E+00
8.00E+00
1.00E+01
1.20E+01
1.40E+01
1.60E+01
1.80E+01
2.00E+01
2.00E-02 1.20E-01 2.20E-01 3.20E-01
1 /
[ W
((P
o/P
) -
1)
]
Relative pressure (P/P0)
Azo-MOP-4-Ru
BET surface area:61 m2 g-1
4.00E-04
5.00E-01
1.00E+00
1.50E+00
2.00E+00
2.50E+00
3.00E+00
3.50E+00
2.00E-02 1.20E-01 2.20E-01 3.20E-01
1 /
[ W
((P
o/P
) -
1)
]
Relative pressure (P/P0)
Azo-MOP-2-Ru
BET surface area:326 m2 g-1

17
133.243 (Azo-MOP-4), 0.999993, 288.920 (Azo-MOP-1-Ru), 0.999963, 789.426
(Azo-MOP-2-Ru), 0.999988, 539.287 (Azo-MOP-3-Ru) and 0.999918, 63.272
(Azo-MOP-4-Ru).
0
20
40
60
80
100
120
140
160
180
200
0 0.2 0.4 0.6 0.8 1
Am
ou
nt
adso
rbed
(cm
3ST
P/g
)
Relative pressure (P/P0)
0
50
100
150
200
250
300
350
400
450
0 0.2 0.4 0.6 0.8 1
Am
ou
nt
adso
rbe
d (
cm3
STP
/g)
Relative pressure (P/P0)
0
50
100
150
200
250
300
350
400
0 0.2 0.4 0.6 0.8 1
Am
ou
nt
adso
rbe
d (
cm3
STP
/g)
Relative pressure (P/P0)
0
50
100
150
200
250
300
350
0 0.2 0.4 0.6 0.8 1
Am
ou
nt
adso
rbe
d (
cm3
STP
/g)
Relative pressure (P/P0)
Azo-MOP-2
Azo-MOP-3
Azo-MOP-4
Azo-MOP-1
0 1 2 3 4 5 6 7 8 9 10Pore width/nm
0.79 nm
0 1 2 3 4 5 6 7 8 9 10Pore width/nm
0.79 nm
0 1 2 3 4 5 6 7 8 9 10Pore width/nm
1.11 nm
0 5 10 15 20 25 30Pore width/nm
1.78 nm
18
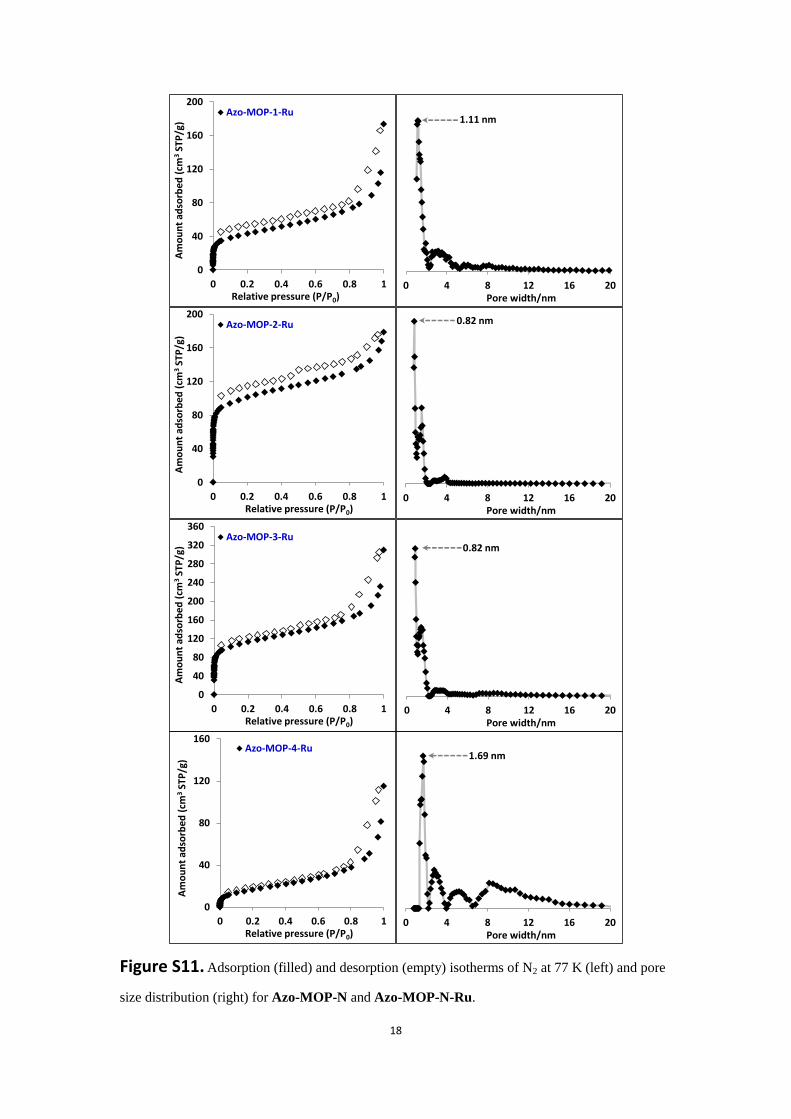
Figure S11. Adsorption (filled) and desorption (empty) isotherms of N2 at 77 K (left) and pore
size distribution (right) for Azo-MOP-N and Azo-MOP-N-Ru.
0
40
80
120
160
0 0.2 0.4 0.6 0.8 1
Am
ou
nt
adso
rbed
(cm
3ST
P/g
)
Relative pressure (P/P0)
Azo-MOP-4-Ru
0 4 8 12 16 20Pore width/nm
1.69 nm
0
40
80
120
160
200
240
280
320
360
0 0.2 0.4 0.6 0.8 1
Am
ou
nt
adso
rbed
(cm
3ST
P/g
)
Relative pressure (P/P0)
Azo-MOP-3-Ru
0 4 8 12 16 20Pore width/nm
0.82 nm
0
40
80
120
160
200
0 0.2 0.4 0.6 0.8 1
Am
ou
nt
adso
rbed
(cm
3ST
P/g
)
Relative pressure (P/P0)
Azo-MOP-2-Ru
0 4 8 12 16 20Pore width/nm
0.82 nm
0
40
80
120
160
200
0 0.2 0.4 0.6 0.8 1
Am
ou
nt
adso
rbed
(cm
3ST
P/g
)
Relative pressure (P/P0)
Azo-MOP-1-Ru
0 4 8 12 16 20Pore width/nm
1.11 nm
19
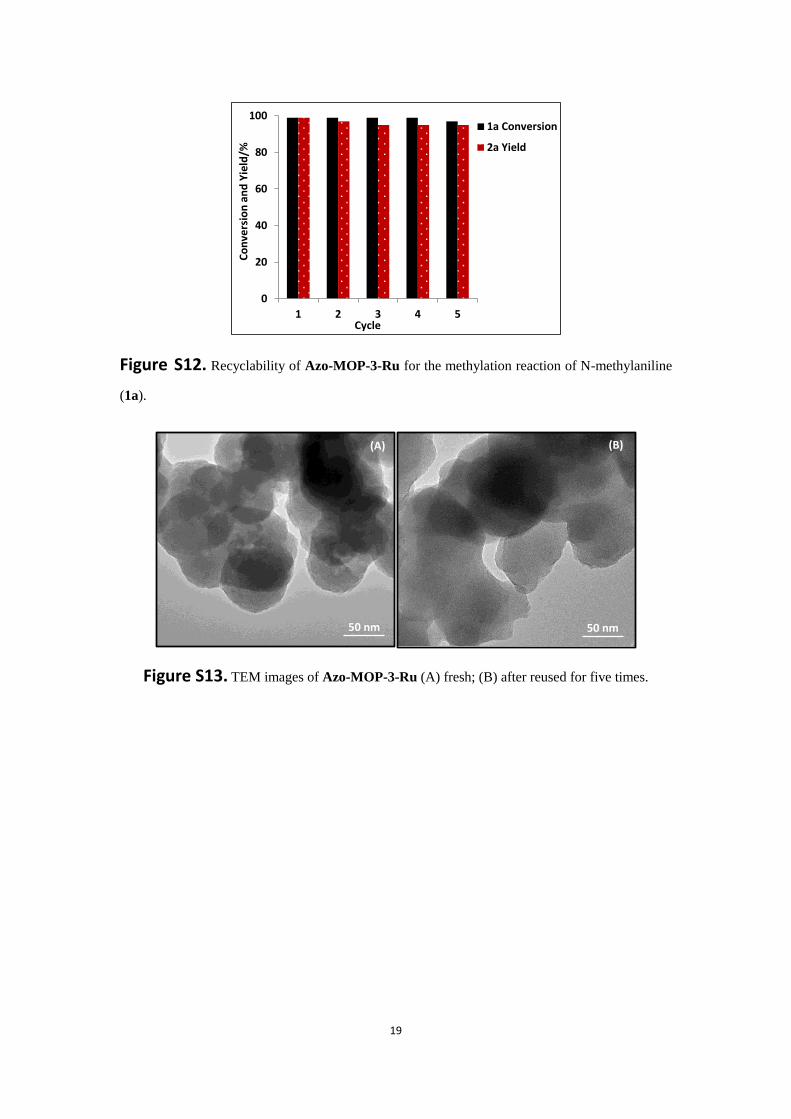
Figure S12. Recyclability of Azo-MOP-3-Ru for the methylation reaction of N-methylaniline
(1a).
Figure S13. TEM images of Azo-MOP-3-Ru (A) fresh; (B) after reused for five times.
0
20
40
60
80
100
1 2 3 4 5
Co
nve
rsio
n a
nd
Yie
ld/%
Cycle
1a Conversion
2a Yield
50 nm50 nm
(A) (B)
20
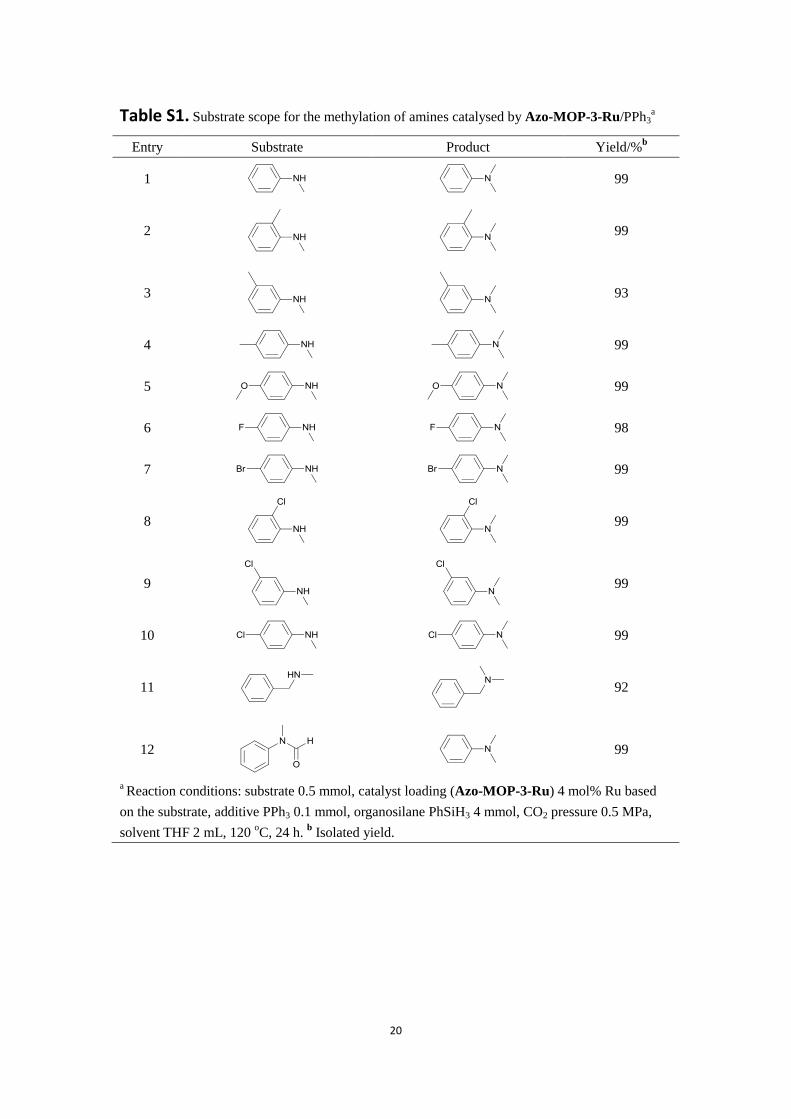
Table S1. Substrate scope for the methylation of amines catalysed by Azo-MOP-3-Ru/PPh3a
Entry Substrate Product Yield/%b
1
99
2
99
3
93
4
99
5
99
6
98
7
99
8
99
9
99
10
99
11
92
12
99
a Reaction conditions: substrate 0.5 mmol, catalyst loading (Azo-MOP-3-Ru) 4 mol% Ru based
on the substrate, additive PPh3 0.1 mmol, organosilane PhSiH3 4 mmol, CO2 pressure 0.5 MPa,
solvent THF 2 mL, 120 oC, 24 h.
b Isolated yield.
21
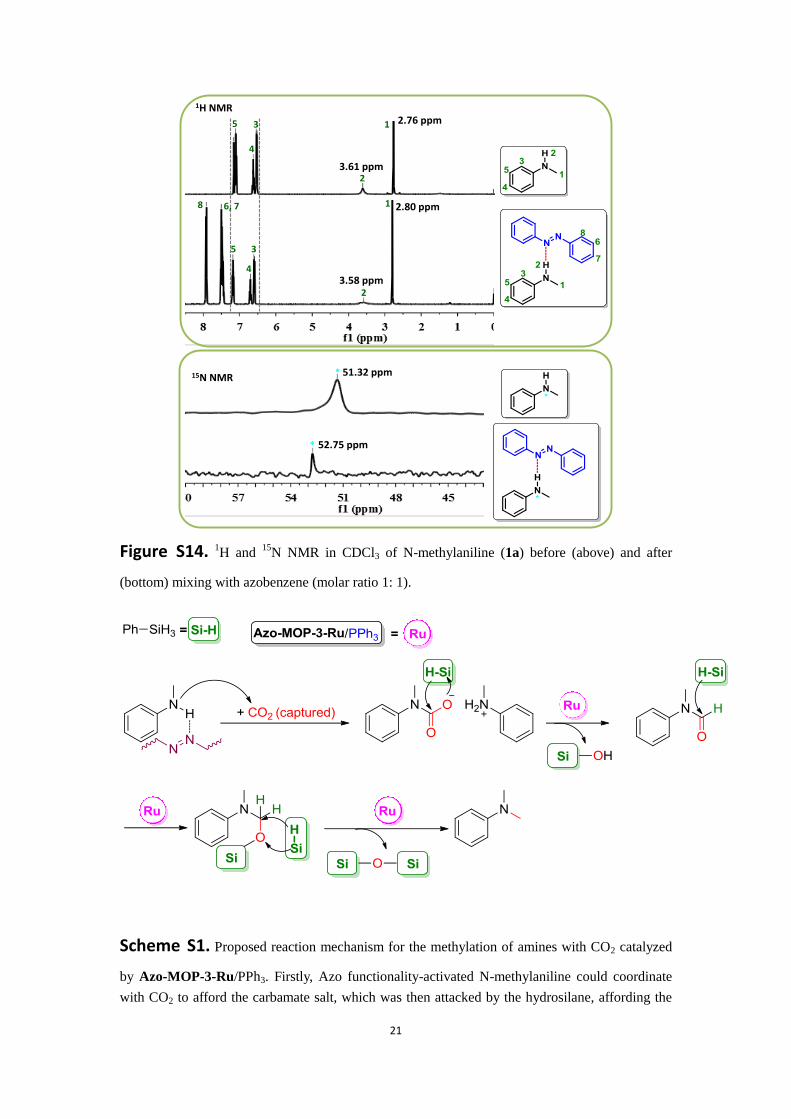
Figure S14. 1H and
15N NMR in CDCl3 of N-methylaniline (1a) before (above) and after
(bottom) mixing with azobenzene (molar ratio 1: 1).
Scheme S1. Proposed reaction mechanism for the methylation of amines with CO2 catalyzed
by Azo-MOP-3-Ru/PPh3. Firstly, Azo functionality-activated N-methylaniline could coordinate
with CO2 to afford the carbamate salt, which was then attacked by the hydrosilane, affording the
1H NMR 2.76 ppm
3.61 ppm
2.80 ppm
3.58 ppm
1
2
3
4
5
1
2
3
4
5
6, 78
15N NMR 51.32 ppm
52.75 ppm
*
*
22
formylation intermediate in the presence of Ru species. Subsequent hydrosilation of the
formamide afforded the methylamine product.
3. Characterization (NMR) of the methylamine products
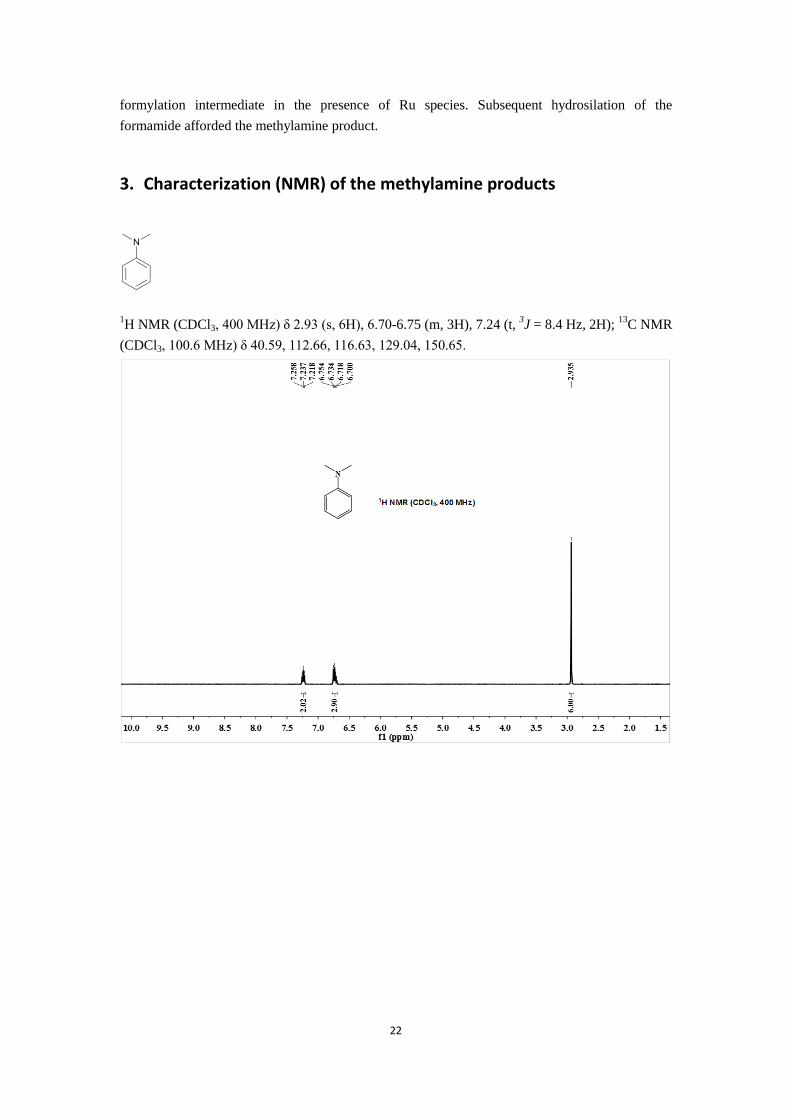
1H NMR (CDCl3, 400 MHz) δ 2.93 (s, 6H), 6.70-6.75 (m, 3H), 7.24 (t,
3J = 8.4 Hz, 2H);
13C NMR
(CDCl3, 100.6 MHz) δ 40.59, 112.66, 116.63, 129.04, 150.65.
23
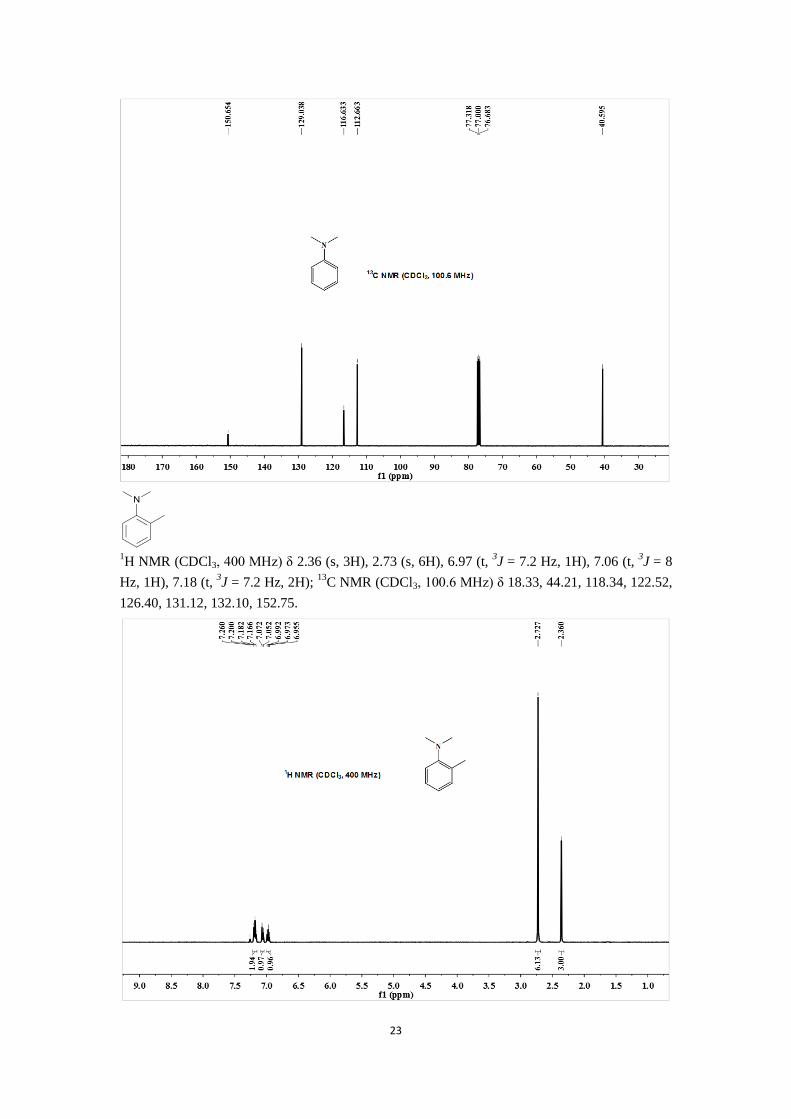
1H NMR (CDCl3, 400 MHz) δ 2.36 (s, 3H), 2.73 (s, 6H), 6.97 (t,
3J = 7.2 Hz, 1H), 7.06 (t,
3J = 8
Hz, 1H), 7.18 (t, 3J = 7.2 Hz, 2H);
13C NMR (CDCl3, 100.6 MHz) δ 18.33, 44.21, 118.34, 122.52,
126.40, 131.12, 132.10, 152.75.
24
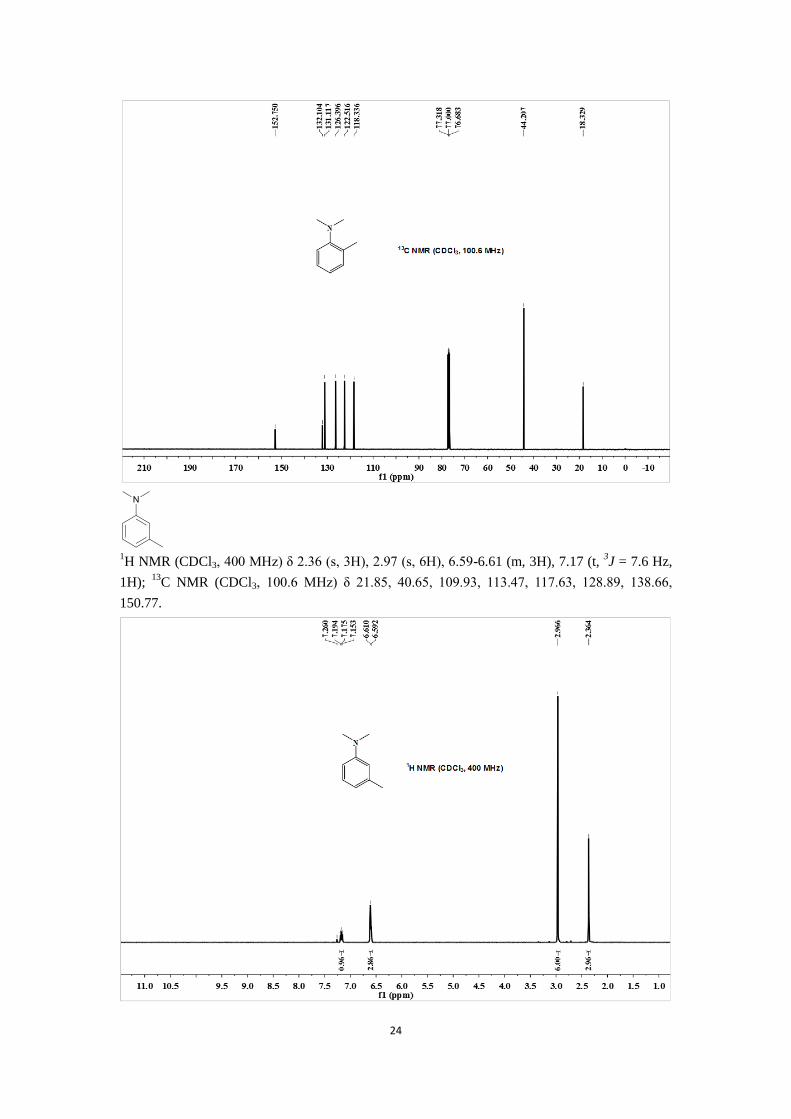
1H NMR (CDCl3, 400 MHz) δ 2.36 (s, 3H), 2.97 (s, 6H), 6.59-6.61 (m, 3H), 7.17 (t,
3J = 7.6 Hz,
1H); 13
C NMR (CDCl3, 100.6 MHz) δ 21.85, 40.65, 109.93, 113.47, 117.63, 128.89, 138.66,
150.77.

25
1H NMR (CDCl3, 400 MHz) δ 2.28 (s, 3H), 2.92 (s, 6H), 6.72 (d,
3J = 8.8 Hz, 2H), 7.08 (d,
3J =
8.4 Hz, 2H); 13
C NMR (CDCl3, 100.6 MHz) δ 20.21, 41.05, 113.21, 126.11, 129.56, 148.82.

26
1H NMR (CDCl3, 400 MHz) δ 2.88 (s, 6H), 3.78 (s, 3H), 6.76-6.79 (m, 2H), 6.85-6.87 (m, 2H);
13C NMR (CDCl3, 100.6 MHz) δ 41.81, 55.71, 114.58, 114.90, 145.69, 151.98.

27
1H NMR (CDCl3, 400 MHz) δ 2.90 (s, 6H), 6.67-6.70 (m, 2H), 6.93-6.97 (m, 2H);
13C NMR
(CDCl3, 100.6 MHz) δ 41.37, 113.8 (d, 3J = 7.3 Hz), 115.36 (d,
3J = 22.0 Hz), 147.52, 154.47,
28
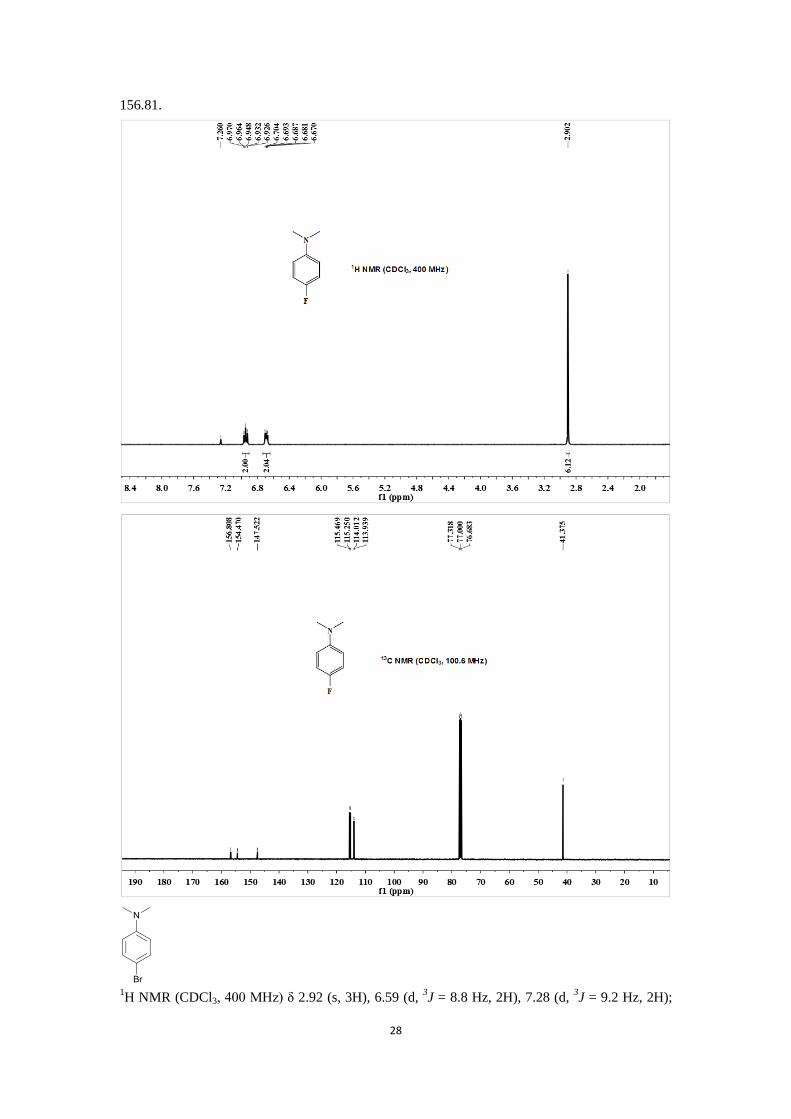
156.81.
1H NMR (CDCl3, 400 MHz) δ 2.92 (s, 3H), 6.59 (d,
3J = 8.8 Hz, 2H), 7.28 (d,
3J = 9.2 Hz, 2H);
29
13C NMR (CDCl3, 100.6 MHz) δ 40.55, 108.53, 114.11, 131.67, 149.53.
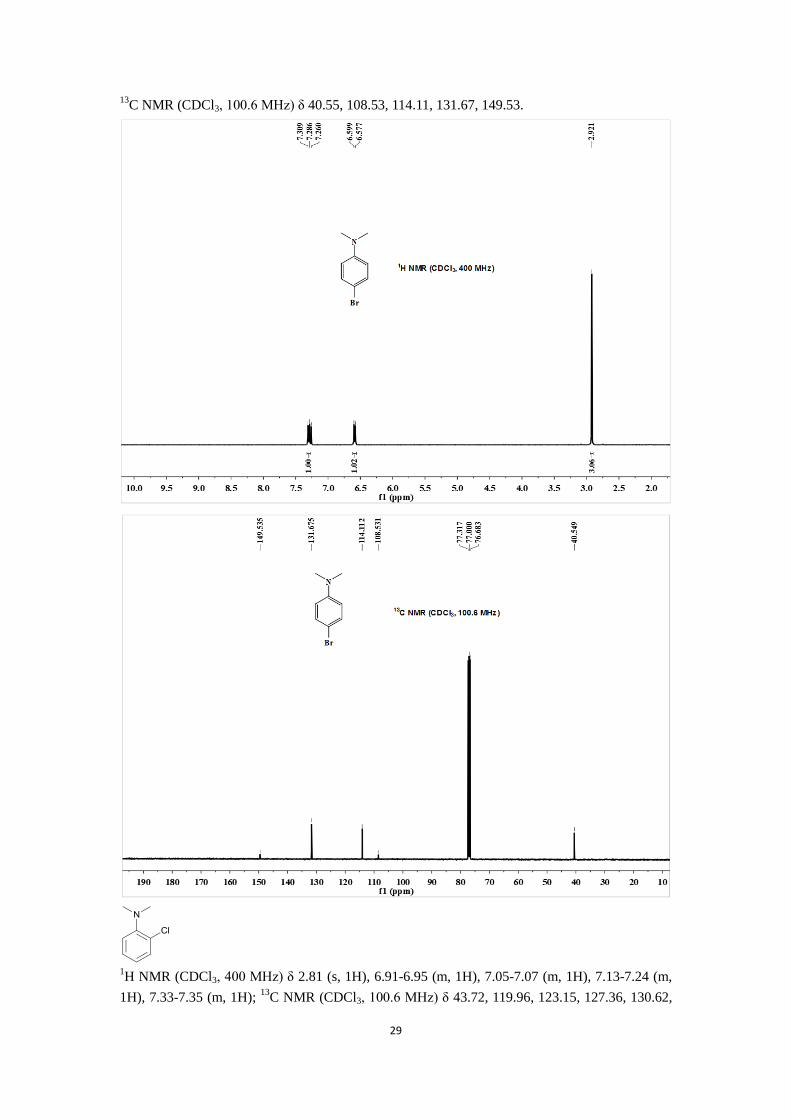
1H NMR (CDCl3, 400 MHz) δ 2.81 (s, 1H), 6.91-6.95 (m, 1H), 7.05-7.07 (m, 1H), 7.13-7.24 (m,
1H), 7.33-7.35 (m, 1H); 13
C NMR (CDCl3, 100.6 MHz) δ 43.72, 119.96, 123.15, 127.36, 130.62,

30
144.94, 150.36.
1H NMR (CDCl3, 400 MHz) δ 2.95 (s, 1H), 6.58-6.60 (m, 1H), 6.67-6.69 (m, 2H), 7.14 (t,
3J = 8.4
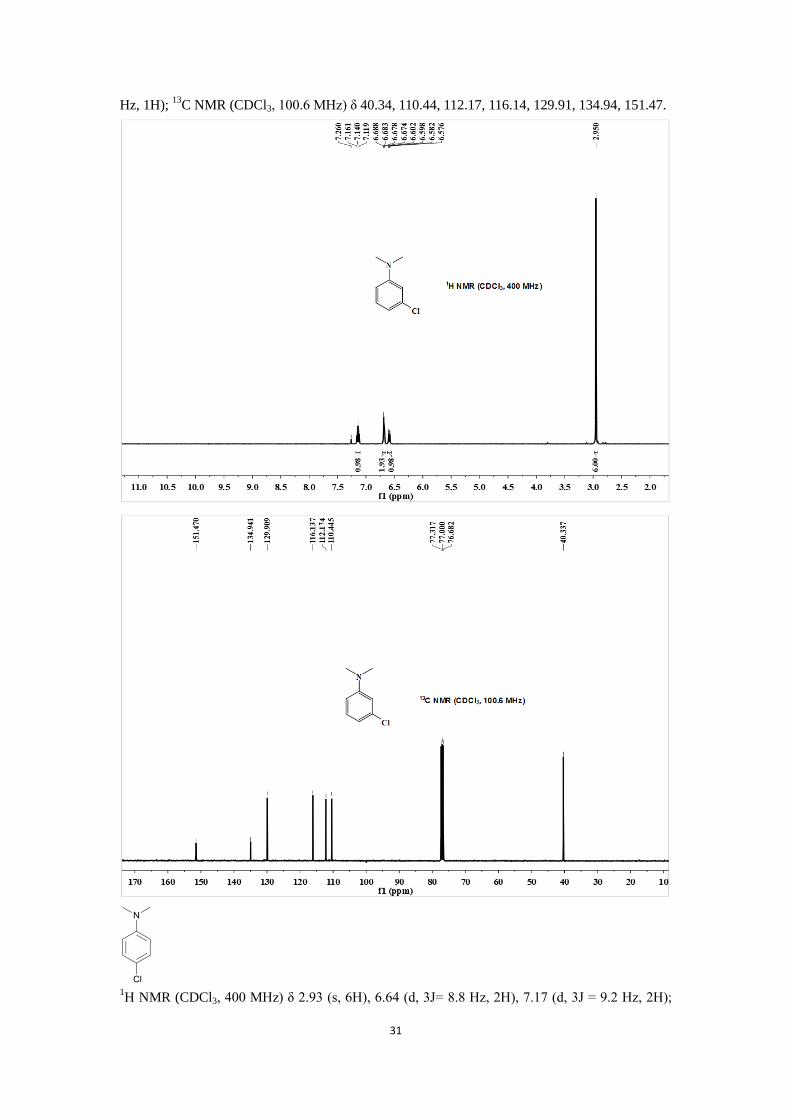
31
Hz, 1H); 13
C NMR (CDCl3, 100.6 MHz) δ 40.34, 110.44, 112.17, 116.14, 129.91, 134.94, 151.47.
1H NMR (CDCl3, 400 MHz) δ 2.93 (s, 6H), 6.64 (d, 3J= 8.8 Hz, 2H), 7.17 (d, 3J = 9.2 Hz, 2H);

32
13C NMR (CDCl3, 100.6 MHz) δ 40.64, 113.64, 121.44, 128.78, 149.19.
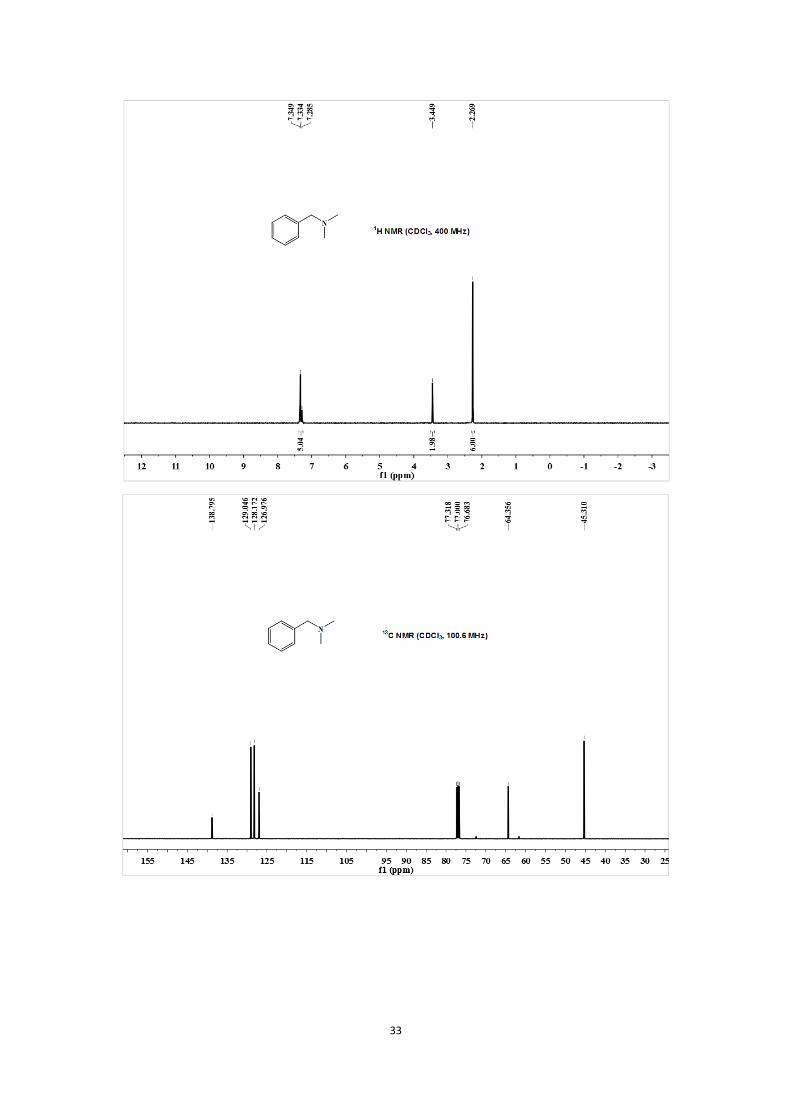
1H NMR (CDCl3, 400 MHz) δ 2.27 (s, 6H), 3.45 (s, 2H), 7.29-7.35 (m, 5H);
13C NMR (CDCl3,
100.6 MHz) δ 45.31, 64.36, 126.98, 128.17, 129.05, 138.80.
33