axisymmetric calculations of a low-boom inlet in a ... calculations of a low-boom inlet in a ......
TRANSCRIPT

American Institute of Aeronautics and Astronautics
Axisymmetric Calculations of a Low-Boom Inlet in a Supersonic
Wind Tunnel
Rodrick V. Chima1 and Stefanie M. Hirt
2,
NASA Glenn Research Center, Cleveland, OH, 44135
Robert Reger3
University of Florida, Gainesville, FL, 32603
This paper describes axisymmetric CFD predictions made of a supersonic low-boom inlet
with a facility diffuser, cold pipe, and mass flow plug within wind tunnel walls, and
compares the CFD calculations with the experimental data. The inlet was designed for use
on a small supersonic aircraft that would cruise at Mach 1.6, with a Mach number over the
wing of 1.7. The inlet was tested in the 8-ft by 6-ft Supersonic Wind Tunnel at NASA Glenn
Research Center in the fall of 2010 to demonstrate the performance and stability of a
practical flight design that included a novel bypass duct. The inlet design is discussed here
briefly. Prior to the test, CFD calculations were made to predict the performance of the inlet
and its associated wind tunnel hardware, and to estimate flow areas needed to throttle the
inlet. The calculations were done with the Wind-US CFD code and are described in detail.
After the test, comparisons were made between computed and measured shock patterns,
total pressure recoveries, and centerline pressures. The results showed that the dual-stream
inlet had excellent performance, with capture ratios near one, a peak core total pressure
recovery of 96 percent, and a large stable operating range. Predicted core recovery agreed
well with the experiment but predicted bypass recovery and maximum capture ratio were
high. Calculations of off-design performance of the inlet along a flight profile agreed well
with measurements and previous calculations.
I. Introduction
In October and November of 2010 two similar low-boom supersonic inlets (LBSI) were tested in the 8-ft by 6-ft
Supersonic Wind Tunnel (SWT) at NASA Glenn Research Center (GRC)1, 2
. The tests were conducted by a team of
researchers from NASA GRC, Gulfstream Aerospace Corporation (GAC), the University of Illinois at Urbana-
Champaign (UIUC) and the University of Virginia (UVA). The inlets were designed for use on a small aircraft that
would cruise at a Mach number of 1.6 at 45,000 feet3. The inlets were designed to capture nearly 100 percent of the
incoming supersonic flow, and to have low or zero external cowl angles to minimize external shock waves and
thereby reduce the sonic boom signature of the aircraft. The two inlets, known as the single- and dual-stream inlets,
are compared in Figure 1. They had identical centerbodies, struts, and cowl diameters. Both inlets were tested with
and without flow control devices, including micro-ramps on the forebody, and micro-ramps or vane vortex
generators in the subsonic diffuser. The flow control devices will be covered in other publications4 7
and are not
discussed here.
The single-stream inlet was tested to demonstrate a zero cowl angle design, and to provide CFD validation data.
An inlet with an external cowl angle of zero degrees would theoretically produce no external disturbances, if it could
be made infinitely thin. The single-stream inlet had a single flow path leading directly to the aerodynamic interface
plane (AIP.) A glass window was installed in the cowl and a video camera was mounted externally and used to view
pressure sensitive paint (PSP) and oil flow visualization on the centerbody8. The simple axisymmetric geometry and
the flow visualization data make this inlet especially useful for validation of CFD codes. The single-stream inlet and
the results of these experiments will also be described elsewhere.
1 Aerospace Engineer, Inlets and Nozzles Branch, MS 5-12, Associate Fellow AIAA
2 Aerospace Engineer, Inlets and Nozzles Branch, MS 5-12, Senior Member AIAA
3 Undergraduate Student Research Program Researcher, Member AIAA

American Institute of Aeronautics and Astronautics
2
The dual-stream inlet was intended to
model flight hardware. It had a low external
cowl angle of eight degrees, and had two
concentric flow paths. The inner, or core, flow
path led to the AIP, where the engine would be
attached. The outer, or bypass, flow path was
designed to route the low momentum air from
the strongest part of the normal shock around
the engine and gearbox, and back to the nozzle
stream. The dual-stream inlet is discussed in
this paper.
Models of the inlets were constructed at
1/4.86 scale for tests in the SWT. To throttle
the inlets and to measure the mass flow
through them, they were mounted on a facility
diffuser followed by a long cold-pipe and a
mass flow plug (MFP). On the dual-stream
inlet the bypass channels were throttled with
interchangeable exit plates vented to the
freestream.
Research team members performed many CFD analyses of the two inlets prior to the test. The analyses were
done with several different CFD codes and at different levels of fidelity, ranging from design of the compression
spike using a method of characteristics code3 to 3-D analyses of the inlets including struts and bypass geometry
6, 9.
Although many CFD analyses were performed of isolated inlets before the test, little was known about how they
would perform in a wind tunnel environment with all the associated hardware attached. In particular, several
questions were posed before the test:
• What size exit plates were needed to give the desired bypass/core mass flow ratio?
• How would the flow behave after leaving the exit plates?
• What range of travel of the MFP would give the desired inlet operating range?
To answer these questions, an axisymmetric CFD analysis was performed of the dual-stream inlet, bypass duct
and exit plates, facility diffuser, cold pipe, and mass flow plug within the SWT walls. This paper describes the inlet
model, the SWT test, and the axisymmetric CFD analysis. The results of the analysis are compared to the
experimental data to validate the predictions, to answer the previous questions, and to explain the operation of the
dual-stream inlet in more detail.
II. Dual-Stream Low-Boom Supersonic Inlet
Engineers at Gulfstream Aerospace Corporation have been investigating technologies that would enable the use
of a small, low-boom supersonic aircraft3. Their reference aircraft is designed to cruise at 45,000 feet at a Mach
number of 1.6, with an over-wing Mach number of 1.7. The aircraft would use radical aerodynamic shaping and a
Quiet Spike10
to minimize sonic boom. The inlets make up much of the frontal area of the aircraft, so they were
designed carefully to minimize their contribution to the overall sonic boom characteristics. Axisymmetric, external-
compression inlets were chosen for simplicity.
Reference 3 also describes an innovative approach for designing the external compression surface of the inlet.
This approach gives higher recovery and lower sonic boom overpressures than conventional designs. Inlets designed
with this approach have been tested experimentally at small scale11
, modeled computationally12,
13
, and shown to
have good recovery and stability characteristics.
In the present study a large-scale dual-stream inlet was designed, analyzed computationally, and tested
experimentally. The inlet was designed to reduce the Mach number from 1.7 over the wing to about 0.65 at the fan
face, with high total pressure recovery, minimal distortion, and with minimal external over pressures.
The dual-stream inlet consists of an isentropic compression spike, a curved throat region, and a subsonic
diffuser. The compression spike was designed to produce a variable-strength normal shock at the throat. The Mach
number ahead of the shock is about 1.3 on the centerbody, which is low enough to avoid boundary-layer separation.
The Mach number at the cowl is close to the free stream value of 1.7, which generates a strong normal shock with
high total pressure loss. A novel bypass duct was used to capture the high-loss flow near the cowl and divert it
Figure 1. Comparison of the single- and dual-stream inlets.

American Institute of Aeronautics and Astronautics
3
around the engine and back to the nozzle stream. This removes the high-loss flow from the core stream and
maximizes the total pressure recovery at the fan face.
The dual-stream inlet was sized for a Rolls-Royce Tay engine, whose gearbox extends almost 160 degrees
around the perimeter. The bypass duct was used to keep the engine gearbox out of the external flow, where it would
contribute to boom. The duct used 10 curved vanes to direct the flow around the gearbox region. To keep the bypass
flow subsonic it was necessary to increase the cowl area downstream of the lip, which led to an eight-degree
external cowl angle.
Figure 2. Dual-stream inlet in the NASA Glenn
8-ft by 6-ft Supersonic Wind Tunnel.
Figure 3. Equivalent axisymmetric model of the inlet
in the wind tunnel.
III. 8-ft by 6-ft Supersonic Wind Tunnel Test
The inlets were tested in the SWT at NASA Glenn Research Center14
. The test section of the tunnel is 8 feet high
by 6 feet wide, and 23.5 feet long. The tunnel walls are perforated and surrounded by an evacuated balance chamber
to remove the wall boundary layers. Figure 2 shows a photograph of the dual-stream inlet in the SWT test section.
For this test the tunnel was run in a closed-loop cycle, with the air passing through a dryer and a cooler to permit
continuous operation. Data was taken at Mach numbers of 0.5 and 1.4 to 1.8. The SWT is an atmospheric tunnel that
operates at high dynamic pressure and temperature. At M = 1.8 the nominal total pressure is 23.2 psia and the total
temperature is 631 R. The models and instrumentation were designed to handle those conditions.
Gulfstream engineers performed the initial aerodynamic and mechanical design of the models, and TriModels,
Inc. in Huntington Beach, CA did the detailed design and fabrication. The models were instrumented with a total of
241 static or total pressure taps on the centerbody, cowl, two boundary-layer rakes, and eight AIP rakes. Standard
SAE ARP1420 total pressure rakes15
were located at the AIP, using 8 rakes with 5 probes located at the centers of
equal areas. A sixth probe was added to each rake near the hub to better resolve the hub boundary layers, which
were expected to be large.
The inlet models were mounted on a hydraulic strut that could be rotated to vary the angle of attack from -2 to
+5 degrees. Yaw angles could not be varied. The core stream of each model expanded through a facility diffuser into
a 16-inch diameter cold pipe. The core flow was throttled using a hydraulically actuated conical mass flow plug at
the exit of the cold pipe. The mass flow plug was calibrated to give the core-stream mass flow to within a few tenths
of a percent.
The dual–stream bypass channels were throttled using interchangeable choke plates at the channel exit. Baseline
exit plates were designed to produce a mass flow ratio of mbypass / mcore = 0.7 . These plates were designated the Aex
= 1.0 plates. Since the plates had sharp, semi-annular openings, they were not expected to pass the full 1-D flow but
some lesser amount. Thus, four sets of plates were made with relative areas Aex = 1.0, 1.1, 1.2, and 1.3. The CFD
described here was used to investigate the effects of exit plate area, and to predict the exit plate area that would give
the desired mass flow ratio. The choke plate area was then verified by trying the different plate sets early in the test.
The dual–stream inlet also had total pressure rakes at the exit of each bypass channel, with five probes in each
rake. The mass flow through each channel was estimated using the average total pressure, the tunnel total

American Institute of Aeronautics and Astronautics
4
temperature, and by assuming that M = 1.0 at the exit plate. A discharge coefficient CD = 0.873 was needed to
correct the overall capture ratio to 1.0 at M = 1.8 with the mass flow plug fully open. Since the discharge coefficient
probably varies with operating conditions, the accuracy of bypass flow rate measurement is uncertain.
Large 26.5-inch diameter windows provided optical access to the test section, and a schlieren system was used to
visualize the flow ahead of the inlet. A high-speed Phantom camera operating at 2000 4000 frames per second
recorded steady or unsteady schlieren images.
IV. Computational Model
A. Computational Grids
For the axisymmetric CFD model the 8- by 6-foot cross section of the SWT was modeled as a circle with an area
of 48 ft2, i.e., a radius of 3.91 ft. as shown in Figure 3.
Figure 4. Computational grid for the inlet, facility diffuser, cold pipe, and mass flow plug.
The computational grid for the inlet, bypass, facility diffuser, cold pipe, and mass flow plug within the tunnel
walls was generated using Pointwise16
. The grid, shown mirrored top-to-bottom in Figure 4, had 144,525 points in 7
zones. The proportions of this side view of the axisymmetric grid are almost the same as the side view of the tunnel.
The grid spacing at the walls was 1 10 5 inches, giving y+ = 1 to 2 at the first point off the walls. Leading edges
of the cowl and splitter were modeled as 2:1 ellipses with 6-10 points along each surface, to give adequate resolution
of bow shocks.
The inlet, bypass, and external zones were
comparable to grids used in Ref. 13, where a
grid refinement study showed that the grid
resolution was sufficient to predict the inlet
recovery within 0.13 percent of a much coarser
grid. The remaining zones had similar
resolution, but they were not tested explicitly
here.
The bypass duct of the actual inlet model
was not axisymmetric. It was split into 10
curved passages designed to route the inlet
flow around a 160-degree area where the
gearbox of an engine would be located. Half
way through the duct the 10 passages merged
into five passages that were partially closed by
the exit plates described earlier. To model the Figure 5. Bypass duct exit plate model.

American Institute of Aeronautics and Astronautics
5
gearbox blockage using an axisymmetric CFD model, the radius of the cowl inner mold line was reduced to make
the axisymmetric passage area equal to the actual 3-D area at each axial location. The outer mold line was not
modified. This is seen in Figure 5, which shows an enlargement of the grid near the bypass exit plates. While the
actual cowl on the model was a thin shell, the CFD cowl was very thick to account for gearbox blockage.
The bypass exit plates were modeled computationally by applying inviscid wall boundary conditions over part of
the radial grid line at the location of the plates, also shown in Figure 5. The height of the inviscid wall was chosen to
leave an axisymmetric area equivalent to the semi-annular area of the exit plates. Slight modifications were made to
the grid clustering in this region to accommodate the four different plate areas with Aex ranging from 1.0 to 1.3.
Due to limitations of the axisymmetric model, changes in the cowl geometry, and the crude exit plate model, the
CFD analysis was not expected to give detailed information about the bypass flow. However, it was expected to give
reasonable predictions of bypass recovery characteristics, which will be shown later.
In the experiment, the core flow was
throttled using a 16-inch diameter
hydraulically actuated mass flow plug17
,
shown in outline in Figure 6. For the
computations, a grid was generated
around the MFP, shaft, and hydraulic
cylinder using Pointwise16
. The MFP
geometry was specified using a database
surface, and the grid was attached to the
database. Translating the database in
Pointwise automatically transformed the
surrounding grid, allowing grids to be
produced at new MFP positions with a
single operation. When the calculations
were made, Pointwise did not export grids in a format suitable for Wind-US, so the grids were imported to Gridgen,
where boundary conditions were applied using a glyph script. Thirty different grids were generated to model all of
the exit plates and MFP positions considered in this paper.
B. CFD Solution Scheme
The dual-stream inlet was analyzed using the Wind-US code18, 19
. The Reynolds-averaged Navier-Stokes
(RANS) equations were discretized using the Roe upwind scheme with a minmod limiter and the Menter SST
turbulence model. The equations were solved using an alternating-direction-implicit (ADI) time-marching scheme
with a Courant number of 1.0.
Boundary conditions were specified as follows:
• Tunnel inlet conditions were supersonic inflow with Mach number specified.
• Tunnel exit conditions were all extrapolated.
• The actual tunnel had porous walls to remove wall boundary layers and reduce shock/boundary-layer
interaction. The bleed flow was unknown, so the tunnel walls were modeled using inviscid wall boundary
conditions.
• Viscous wall boundary conditions were used for the entire inlet model, except for the bypass exit plates
described above.
The solution was initialized to M = 0.6 and run a few hundred iterations to establish subsonic flow in the facility
diffuser and cold pipe. Then the freestream conditions were reset to M = 1.7, and all the external flow blocks were
reinitialized. The solution was run 15,000 iterations, which converged the capture ratio and recovery to plotting
accuracy.
Subsequent cases were restarted from previous solutions and run 15,000 iterations to convergence. All
calculations were run on a cluster of 6 CPUs running at 3.2 GHz, which took about 1.5 hours per case.
V. Comparison of CFD and Test Results
A. Bypass Exit Plate Selection
One objective of the present work was to determine the size of bypass exit plates that would give the desired
flow rates through the inlet. CFD predictions of inlet performance maps were made for four relative plate sizes,
Aex = 1.0, 1.1, 1.2, and 1.3.
Figure 6. Mass flow plug translation.

American Institute of Aeronautics and Astronautics
6
The computed performance maps, sometimes known as cane curves because of their shape, are shown in Figure
7. For each exit plate area, the MFP position was varied to produce a curve of core total pressure recovery versus
inlet capture ratio, where capture ratio = (mcore + mbypass ) / ( V rcowl2 ) .
The Aex = 1.0 plate had low recovery
and a maximum capture ratio less than
0.95. The Aex = 1.1 plate had better
recovery and a maximum capture ratio
of 0.98. The two largest plates, Aex = 1.2
and 1.3, had the highest recoveries and
maximum capture ratios of 0.99. It was
clear that the two smaller plate areas
could not pass the desired flow through
the bypass stream, so the Aex = 1.2
plates were recommended for the test.
Some initial experimental data was
taken using the plates with Aex = 1.2.
Later these plates were replaced with
each of the other three sets, and one
cane curve was generated for each set.
The results were similar to the
predictions, and the plates with Aex =
1.2 were used for the remainder of the
tests.
A second objective of this work was to determine the range of MFP travel that would be needed to cover the
desired inlet operating range. A nominal core mass flow rate was estimated by assuming a core recovery of 0.95 and
an AIP Mach number of 0.65. The MFP plug exit area was found with the continuity equation, and the plug position
was found from the plug angle. A CFD solution for this position gave a capture ratio around 0.97. Subsequent
calculations were made by moving the MFP in increments of 0.1 or 0.2 inches. The maximum opening occurred
when the core flow choked. The minimum opening occurred when the capture ratio was around 0.9, which was
thought to be near the stall point of the engine. The total range of MFP travel was found to be one inch for all the
cases shown in Figure 7.
In the experiment the MFP was set fully open to minimize blockage during SWT startup. The plug was then
closed in regular increments until the inlet went into buzz, at a capture ratio of 0.60 for this case. No attempt was
made to determine the buzz point computationally.
B. Design Point Performance
This section compares the CFD predictions of the dual-stream inlet using the exit plates with Aex = 1.2 to the
experimental data at the design point, M = 1.7. First the CFD results are used to describe the overall flow, and then
detailed comparisons are made of AIP profiles, recovery and mass flow characteristics, and a centerbody pressure
distribution.
Figure 7. Computed core recovery vs. capture ratio for
four bypass exit plate areas.

American Institute of Aeronautics and Astronautics
7
Figure 8. Schlieren image and computed Mach number contours, M = 1.7.
The overall flow field is shown in Figure 8, where a schlieren image is compared to computed Mach number
contours. The images were taken at equivalent MFP positions near the peak recovery operating point, and the shocks
line up nicely. The compression waves from the spike extend slightly outside the cowl, indicating that the inlet is
operating just below full capture.
The core flow decelerates to M 0.65, the desired fan face Mach number, at the AIP. The flow decelerates
further in the facility diffuser, which has a large recirculating region along the centerline. The computed size of this
region depends on MFP position and on the turbulence model, and it probably contributes to an under prediction of
the computed core flow discussed later. The core flow chokes near the exit of the MFP, and then expands to
supersonic speeds downstream.
The bypass flow chokes at the exit plates, over expands to M 3.0 just downstream, and then shocks to subsonic
speeds along the cold pipe. This high loss flow hugs the cold pipe to the exit of the grid.
Recoveries were measured at the AIP using eight
total pressure rakes spaced 45 degrees apart. Six
static probes and one dynamic probe were located
on each rake, and wall static pressures were
measured on the centerbody. Figure 9 shows
spanwise profiles of recovery at the operating points
indicated by diamonds in Figure 7. Seven of the
eight rakes were located away from wakes from the
centerbody struts, and they measured nearly
identical recoveries (blue circles). The axisymmetric
solution (solid black line) agrees closely with these
seven rakes, except in the hub boundary layer,
where the computed recovery is 2-3 percent higher
than the measured recoveries. One rake was located
at bottom dead center immediately behind a strut,
and measured recoveries 5-6 percent lower than the
rest (red squares). The axisymmetric CFD model
does not include the struts and cannot predict this
feature.
Figure 9. Recovery profiles along the AIP rakes.
American Institute of Aeronautics and Astronautics
8
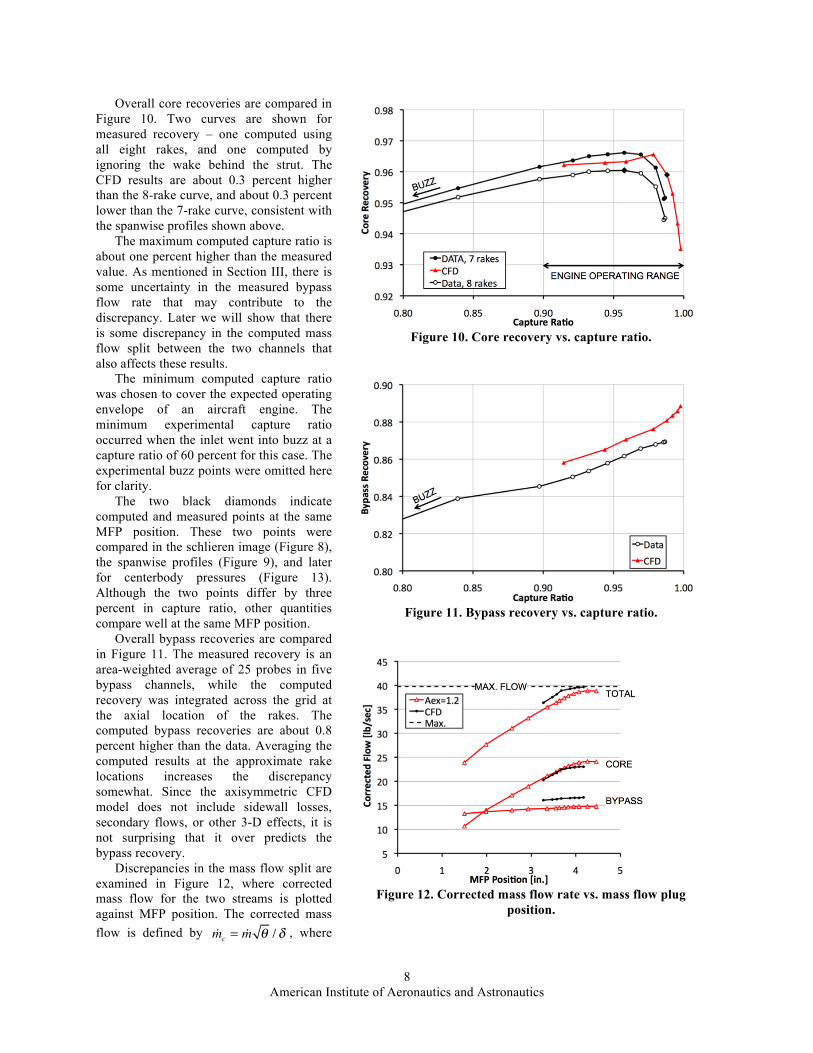
Overall core recoveries are compared in
Figure 10. Two curves are shown for
measured recovery – one computed using
all eight rakes, and one computed by
ignoring the wake behind the strut. The
CFD results are about 0.3 percent higher
than the 8-rake curve, and about 0.3 percent
lower than the 7-rake curve, consistent with
the spanwise profiles shown above.
The maximum computed capture ratio is
about one percent higher than the measured
value. As mentioned in Section III, there is
some uncertainty in the measured bypass
flow rate that may contribute to the
discrepancy. Later we will show that there
is some discrepancy in the computed mass
flow split between the two channels that
also affects these results.
The minimum computed capture ratio
was chosen to cover the expected operating
envelope of an aircraft engine. The
minimum experimental capture ratio
occurred when the inlet went into buzz at a
capture ratio of 60 percent for this case. The
experimental buzz points were omitted here
for clarity.
The two black diamonds indicate
computed and measured points at the same
MFP position. These two points were
compared in the schlieren image (Figure 8),
the spanwise profiles (Figure 9), and later
for centerbody pressures (Figure 13).
Although the two points differ by three
percent in capture ratio, other quantities
compare well at the same MFP position.
Overall bypass recoveries are compared
in Figure 11. The measured recovery is an
area-weighted average of 25 probes in five
bypass channels, while the computed
recovery was integrated across the grid at
the axial location of the rakes. The
computed bypass recoveries are about 0.8
percent higher than the data. Averaging the
computed results at the approximate rake
locations increases the discrepancy
somewhat. Since the axisymmetric CFD
model does not include sidewall losses,
secondary flows, or other 3-D effects, it is
not surprising that it over predicts the
bypass recovery.
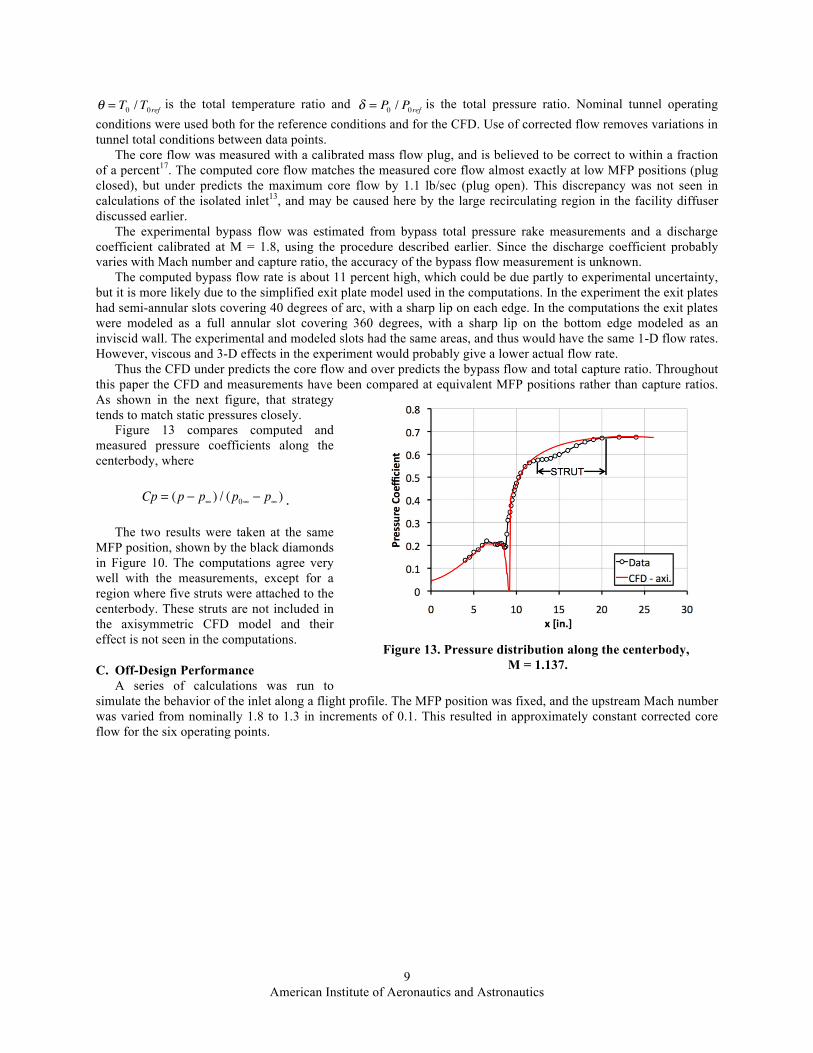
Discrepancies in the mass flow split are
examined in Figure 12, where corrected
mass flow for the two streams is plotted
against MFP position. The corrected mass
flow is defined by mc = m / , where
Figure 10. Core recovery vs. capture ratio.
Figure 11. Bypass recovery vs. capture ratio.
Figure 12. Corrected mass flow rate vs. mass flow plug
position.
American Institute of Aeronautics and Astronautics
9
= T0 /T0ref is the total temperature ratio and = P0 / P0ref is the total pressure ratio. Nominal tunnel operating
conditions were used both for the reference conditions and for the CFD. Use of corrected flow removes variations in
tunnel total conditions between data points.
The core flow was measured with a calibrated mass flow plug, and is believed to be correct to within a fraction
of a percent17
. The computed core flow matches the measured core flow almost exactly at low MFP positions (plug
closed), but under predicts the maximum core flow by 1.1 lb/sec (plug open). This discrepancy was not seen in
calculations of the isolated inlet13
, and may be caused here by the large recirculating region in the facility diffuser
discussed earlier.
The experimental bypass flow was estimated from bypass total pressure rake measurements and a discharge
coefficient calibrated at M = 1.8, using the procedure described earlier. Since the discharge coefficient probably
varies with Mach number and capture ratio, the accuracy of the bypass flow measurement is unknown.
The computed bypass flow rate is about 11 percent high, which could be due partly to experimental uncertainty,
but it is more likely due to the simplified exit plate model used in the computations. In the experiment the exit plates
had semi-annular slots covering 40 degrees of arc, with a sharp lip on each edge. In the computations the exit plates
were modeled as a full annular slot covering 360 degrees, with a sharp lip on the bottom edge modeled as an
inviscid wall. The experimental and modeled slots had the same areas, and thus would have the same 1-D flow rates.
However, viscous and 3-D effects in the experiment would probably give a lower actual flow rate.
Thus the CFD under predicts the core flow and over predicts the bypass flow and total capture ratio. Throughout
this paper the CFD and measurements have been compared at equivalent MFP positions rather than capture ratios.
As shown in the next figure, that strategy
tends to match static pressures closely.
Figure 13 compares computed and
measured pressure coefficients along the
centerbody, where
Cp = (p p ) / (p0 p ) .
The two results were taken at the same
MFP position, shown by the black diamonds
in Figure 10. The computations agree very
well with the measurements, except for a
region where five struts were attached to the
centerbody. These struts are not included in
the axisymmetric CFD model and their
effect is not seen in the computations.
C. Off-Design Performance
A series of calculations was run to
simulate the behavior of the inlet along a flight profile. The MFP position was fixed, and the upstream Mach number
was varied from nominally 1.8 to 1.3 in increments of 0.1. This resulted in approximately constant corrected core
flow for the six operating points.
Figure 13. Pressure distribution along the centerbody,
M = 1.137.

American Institute of Aeronautics and Astronautics
10
M = 1.779
M = 1.452
M = 1.664
M = 1.352
M = 1.555
(Schlieren image at different MFP position)
M = 1.253
(No data was taken at this Mach number)
Figure 14. Variation of schlieren images and computed Mach number contours with tunnel Mach number.
Color bar ranges from M = 0.0 to 1.9.
Mach number contours with corresponding schlieren images at the six operating points are shown in Figure 14.
At Mach 1.779 all the compression waves from the spike enter the cowl because the inlet is at full capture. As the
Mach number decreases the wave angles decrease, the normal shock moves forward on the spike, and the inlet spills
more flow. In all cases the computed shock positions match the schlieren images, except at M = 1.555 where no
schlieren image was taken at the correct MFP position. And in all cases the Mach number stays around 0.65 at the
AIP, which is the design fan face Mach number. At M = 1.253 a normal shock spans the tunnel at the bypass exit.
No data was taken at this Mach number, but the normal shock was observed to pass across the inlet every time the
tunnel was started or stopped.
Core recovery is plotted as a function of Mach number in Figure 15. The computed recovery curve (green
triangles) is in excellent agreement with the measured recovery (black circles) and a previous inlet-fan calculation12
(red dots.) For comparison, the recovery of a pitot inlet for an F-16 aircraft is also shown20
(dashed line). The
recovery of the F-16 inlet is very similar to the present inlet up to M = 1.4, but then it decreases rapidly with normal
shock losses. The core recovery of the present inlet stays high up to M = 1.6, partly due to the isentropic
compression design, and partly because losses are confined to the bypass stream.

American Institute of Aeronautics and Astronautics
11
VI. Summary and Conclusions
This paper describes axisymmetric CFD
predictions made of a low-boom dual-stream
inlet, a facility diffuser, cold pipe, and mass flow
plug in a supersonic wind tunnel. The inlet was
designed for use on a small supersonic aircraft
that would cruise at a Mach number of 1.6, with
an over-wing Mach number of 1.7. It was tested
in the 8-ft by 6-ft Supersonic Wind Tunnel at
NASA Glenn Research Center in the fall of 2010.
The paper discusses the inlet design and the test
briefly, and discusses the calculations in detail.
Test results showed that the dual-stream inlet
had excellent performance, with capture ratios
near one and peak core total pressure recoveries
of 96 percent at the design point. The bypass
recovery was much lower, between 84 and 87
percent.
CFD predictions were made with the Wind-US CFD code on a grid with 144,525 grid points. The Roe upwind
differencing scheme and SST turbulence model were used. Bypass duct blockage was modeled by decreasing the
radius of the outer bypass wall. Bypass exit plates were modeled by applying inviscid wall boundary conditions
along grid lines normal to the inner bypass wall. The mass flow plug grid was transformed for each plug location.
Predictions were compared with the experimental data, and the following results were found:
• Computed shock positions agreed well with schlieren images.
• The computations were used to select the initial bypass plate area used in the experiment. This area was
expected to give nearly full capture with the mass flow plug wide open. Four plate areas were tested, and the
predicted plate area gave the desired capture ratio.
• The calculations slightly under predicted the core flow, possibly due to blockage from a large recirculating
region predicted in the facility diffuser. It is not known if this recirculation occurred in the experiment.
• The calculations over predicted the bypass flow, probably due the simple exit plate model used in the
calculations.
• Predicted core recoveries were within 0.3 percent of the measured recoveries.
• Predicted bypass recoveries were 0.8 percent higher than the measured recoveries, probably due to lack of 3-D
effects and viscous walls in the axisymmetric CFD model.
• Predicted centerbody pressure distributions agreed very well with the experiment, except near struts that were
not included in the axisymmetric analysis.
• The CFD was used to predict off-design performance of the inlet for a simulated flight profile. The predicted
core recovery agreed well with the experiment, and with a previous inlet/fan calculation.
Despite discrepancies between the computed and measured flow rates, the computations provided a useful
system-level model of the inlet with all its associated wind-tunnel hardware. They were used to select the bypass
exit plate areas, and to specify mass flow plug travel before the test. Finally, they have provided the only look at the
SWT flow field away from the schlieren window.
Acknowledgment
This work was supported by the Supersonics Project of the NASA Fundamental Aeronautics Program.
References
1. Hirt, S. M., Vyas, M. A., Chima, R. V., Reger, R. W., and Wayman, T. R., "Experimental Investigation of a Large-Scale
Low- Boom Inlet Concept," AIAA 29th Applied Aerodynamics Conference, June 27-30, 2011 (to be published.)
2. Conners, T. R. and Wayman, T. R., “The Feasibility of a High-Flow Nacelle Bypass for Low Sonic Boom Propulsion
System Design,” AIAA 29th
Applied Aerodynamics Meeting, June 27-30, 2011 (to be published.)
3. Conners, T. R., and Howe, D. C., “Supersonic Inlet Shaping for Dramatic Reductions in Drag and Sonic Boom Strength,”
AIAA Paper 2006-30, Jan. 2006.
4. Rybalko, M., Loth, E., Chima, R. V., Hirt, S. M., and DeBonis, J. R., “Micro Ramps for External Compression Low-Boom
Inlets,” NASA TM-2010-216350, May 2010.
Figure 15. Inlet core recovery vs. Mach number.

American Institute of Aeronautics and Astronautics
12
5. Vyas, M. A., Hirt, S. M., Chima, R. V., Davis, D. O., Wayman, T. R., “Experimental Investigation of Micro-Vortex
Generators on a Low Boom Supersonic Inlet,” 29th AIAA Applied Aerodynamics Conference, June 27-30, 2011 (to be
published.)
6. Gillen, T. and Loth, E., “Vortex Generators for a Dual-Stream Low-Boom Inlet,” AIAA 29th Applied Aerodynamics
Conference, June 27-30, 2011 (to be published.)
7. Rybalko, M. and Loth, E., “Vortex Generators for a Single-Stream Low-Boom Inlet,” AIAA 29th Applied Aerodynamics
Conference, June 27-30, 2011 (to be published.)
8. Herges, T. G., Dutton, J. C., Elliott, D. S., Hirt, S. M., and Bencic, T. J., “Surface Flow and PSP Measurements in the Large-
Scale Low-Boom Inlet,” AIAA 29th
Applied Aerodynamics Meeting, June 27-30, 2011 (to be published.)
9. Chima, R. V., “Computational Analysis of a Low-Boom Supersonic Inlet,” AIAA 29th
Applied Aerodynamics Meeting,
June 27-30, 2011 (to be published.)
10. Wilson, J. R., “Quiet Spike Softening the Sonic Boom”, Aerospace America, Oct. 2007, pp. 38- 42.
11. Conners, T. R., Merret, J. M., Howe, D. C., Tacina, K. M., and Hirt, S. M., “Wind Tunnel Testing of an Axisymmetric
Relaxed External Compression Inlet at Mach 1.97 Design Speed,” AIAA Paper 2007-5066, July, 2007.
12. Hirt, S. M., Tacina, K. M., Conners, T. R., Merret, J. M., and Howe, D. C., “CFD Results for an Axisymmetric Isentropic
Relaxed Compression Inlet,” AIAA Paper 2008-0092, Nov. 2008. Also NASA TM-2008-215416.
13. Chima, R. V., Conners, T. R., and Wayman, T. R., “Coupled Analysis of an Inlet and Fan for a Quiet Supersonic Jet,” AIAA
Paper 2010-479, Jan. 2010. Also NASA TM-2010-216350.
14. Soeder, R. H., “NASA Lewis 8- by 6-Foot Supersonic Wind Tunnel User Manual,” NASA TM-105771, Feb. 1993.
15. SAE S-16 Committee, ARP 1420, Revision B, “Gas Turbine Inlet Flow Distortion Guidelines,” Society of Automotive
Engineers, Feb. 2002.
16. Pointwise and Gridgen CFD mesh generation software, Pointwise, Inc., 213 S. Jennings Ave., Fort Worth, TX 76104.
17. Friedlander, D. J., Saunders, J. D., and Frate, F. C., “Computational Fluid Dynamics Analysis of the NASA Glenn Research
Center 16 Mass Flow Plug,” (NASA TM to be published.)
18. Towne, C. E., “Wind-US User’s Guide, Version 2.0,” NASA TM-2009-215804, Oct. 2009.
19. Nelson, C. C., “An Overview of the NPARC Alliance’s Wind-US Flow Solver,” AIAA Paper 2010-27, Jan. 2010.
20. Hunter, L. G., and Cawthon, J. A., “Improved Supersonic Performance for the F-16 Inlet Modified for the J79 Engine,” J.
Propulsion, Vol. 1, Jan. – Feb. 1985.