awwi technical report - home - american wind wildlife
TRANSCRIPT

AWWI TECHNICAL REPORT:
Evaluating a Commercial-Ready Technology for Raptor Detection and Deterrence at a Wind Energy Facility in California
Prepared By:
H. T. Harvey & Associates
September 17, 2018

Evaluating a Commercial-Ready Technology for Raptor Detection and Deterrence at a Wind Energy Facility in California
American Wind Wildlife Institute 2 September 17, 2018
AWWI Technical Report:
Evaluating a Commercial-Ready Technology for Raptor Detection and Deterrence at a Wind Energy Facility in California
American Wind Wildlife Institute 1110 Vermont Ave NW, Suite 950 Washington, DC 20005 www.awwi.org For Release September 17, 2018 AWWI is a partnership of leaders in the wind industry, wildlife management agencies, and science and environmental organizations who collaborate on a shared mission: to facilitate timely and responsible development of wind energy while protecting wildlife and wildlife habitat. Find this document online at www.awwi.org/resources/dtbird-technical-report/ Acknowledgments The H. T. Harvey & Associates team extends our sincere thanks to Avangrid Renewables for hosting this study at their Manzana Wind Power Project site; to Kevin Martin of Alta Environmental Services and Joe Aletky of Sauvx for providing initial pilot services and a UAV aircraft used during the study; and to Craig Baldwin and Al Renkel of AUV Flight Services for providing a second UAV aircraft and additional pilot support for the project. This document benefited from reviews by project sponsors from Avangrid Renewables (Amy Parsons and Laura Nagy) and EDF Renewables (Mike Azeka), and by several independent and anonymous (from the perspective of H.T. Harvey & Associates) reviewers organized by AWWI. Prepared By H. T. Harvey & Associates Contributors
Scott B. Terrill, Ph.D., Principal, Wildlife Ecology—Principal-in-Charge Judd A. Howell, Ph.D., Senior Associate Wildlife Ecologist—Technical Advisor Jeff P. Smith, Ph.D., Associate Wildlife Ecologist—Project Manager Jeff A. Zirpoli, M.S., Senior Wildlife Ecologist Kristina M. Wolf, Ph.D., Quantitative Ecologist Ken L. Lindke, M.S., Quantitative Ecologist Steve Watt, M.S., Senior GIS Specialist
Suggested Citation Format H. T. Harvey & Associates. 2018. AWWI Technical Report: Evaluating a Commercial-Ready Technology for Raptor Detection and Deterrence at a Wind Energy Facility in California. American Wind Wildlife Institute, Washington, DC, 96 pages. Available at www.awwi.org. © 2018 American Wind Wildlife Institute
Evaluating a Commercial-Ready Technology for Raptor Detection and Deterrence at a Wind Energy Facility in California
American Wind Wildlife Institute 3 September 17, 2018
Table of Contents
Executive Summary ............................................................................................................................................. 8
Introduction ........................................................................................................................................................ 12
1.1 Study Objectives ...................................................................................................................................... 14
1.2 Study Approach ....................................................................................................................................... 15
Section 2. Methods ............................................................................................................................................ 16
2.1 Study Area and Site Characterization..................................................................................................... 16
2.2 DTBird Systems and Data Processing ................................................................................................... 17
2.2.1 Installation Layout .......................................................................................................................... 17
2.2.2 System Setup and Performance Standards .................................................................................. 19
2.2.3 Digital Analysis Platform (DAP) ..................................................................................................... 25
2.2.4 Video Review and Sampling Strategy ............................................................................................ 26
2.2.5 Classification of Detected Objects ................................................................................................ 26
2.2.6 Classification of the Deterrence Responses of In Situ Raptors ................................................... 27
2.3 UAV Flight Trials and Data Processing .................................................................................................. 28
2.3.1 Sampling Design ............................................................................................................................. 30
2.3.2 Flight Operations and Logistics ..................................................................................................... 30
2.3.3 Post-Flight Data Processing ........................................................................................................... 32
2.4 Analytical Methods .................................................................................................................................. 34
2.4.1 Modeling DTBird Detection and Deterrent-Triggering Distances as a Function of UAV Flight Characteristics and Environmental Covariates................................................................... 34
2.4.2 Quantifying Probability of Detection Based on UAV Flight Trials ................................................ 37
2.4.3 Quantifying Probability of Deterrence Based on Evaluation of DTBird Video Records of In Situ Raptors ............................................................................................................................. 37
2.4.4 Estimating Risk Reduction from Deploying the DTBird System ................................................... 39
Section 3. Results .............................................................................................................................................. 40
3.1 DTBird Detected-Object Classification Summary .................................................................................. 40

Evaluating a Commercial-Ready Technology for Raptor Detection and Deterrence at a Wind Energy Facility in California
American Wind Wildlife Institute 4 September 17, 2018
3.2 UAV Flight Trial Sampling Characteristics ............................................................................................. 42
3.3 Detection and Deterrent-Triggering Response Distances as a Function of Flight and Landscape Characteristics ..................................................................................................................... 44
3.4 Probability of Detection Based on UAV Flight Trials ............................................................................. 51
3.5 Probability of Deterrence Based on Evaluation of DTBird Video Records of In Situ Raptors ............. 55
3.6 Estimated Risk Reduction from Deploying DTBird System ................................................................... 57
Section 4. Discussion ........................................................................................................................................ 58
4.1 DTBird Targeting Efficiency .................................................................................................................... 58
4.2 Orchestrating UAV Flight Trials to Evaluate DTBird Detection and Deterrent-Triggering Performance ............................................................................................................................................ 59
4.3 Influence of Flight and Landscape Characteristics on DTBird Detection and Deterrent-Triggering Response Distances .............................................................................................................. 60
4.4 Probability of Detection Based on UAV Flight Trials ............................................................................. 61
4.5 Probability of Deterrence Based on Evaluation of DTBird Video Records of In Situ Raptors ............. 62
4.6 Potential Reduction in Take of Golden Eagles from Deploying DTBird System .................................. 63
Section 5. References ........................................................................................................................................ 64
Tables
Table 1. Approximate Viewshed Orientations and Ranges for Numbered Cameras Associated with DTBird Installations........................................................................................ 20
Table 2. DTBird DAP Records Classification Summary: December 2016 – August 2017 ................... 40
Table 3. DTBird DAP Avian Records Classification Summary ............................................................... 41
Table 4. DTBird DAP Raptor Records Classification Summary ............................................................. 42
Table 5. Summary of UAV Flight Trials ................................................................................................... 43
Table 6. DTBird Event Response Distances (m) for UAV Flights .......................................................... 45
Table 7. Generalized Linear Mixed Model Results Relating DTBird Detection and Deterrence Event Response Distances to Various UAV Flight Characteristics and Environmental Factors............................................................................................................... 47
Table 8. Logistic Regression Model Results Illustrating the Influence of Hour of the Day and Flight Exposure Direction on the Probability of DTBird Detecting a UAV Flight ............. 52

Evaluating a Commercial-Ready Technology for Raptor Detection and Deterrence at a Wind Energy Facility in California
American Wind Wildlife Institute 5 September 17, 2018
Table 9. Classified Responses of Raptors Exposed to DTBird Warning and/or Dissuasion Deterrent Signals ....................................................................................................................... 55
Table 10. Logistic Regression Model Illustrating the Influence of Month and Wind Speed on the Probability of DTBird Deterring Raptors as Group ............................................................. 56
Figures
Figure 1. Study Site Map ........................................................................................................................... 14
Figure 2. Locations of DTBird Installations ............................................................................................. 18
Figure 3. DTBird System Setup on a Study Turbine ................................................................................ 19
Figure 4. Approximate 2D Viewsheds of Numbered Cameras at DTBird Study Installations ............. 21
Figure 5. DTBird Single-Camera Video Image Illustrating Conceptual Delineation of Boundary Between Low and High Collision Risk Zones Used to Define Deterrent Trigger Distances ....................................................................................................................... 22
Figure 6. Vertical Cross-Section (upper panel, with gray center illustrating rotor swept zone) and 3D Illustrations of Theoretical DTBird Detection (blue colors; shades represent different camera viewsheds), Warning Signal Trigger (green colors), and Dissuasion Signal Trigger (yellow colors) Envelopes for Golden Eagles with a Wingspan of 1.8 Meters ............................................................................................................ 24
Figure 7. UAV Aircraft Used During the Study to Evaluate the Detection and Deterrent-Triggering Responses of the DTBird System. (a) left = UAV1; (b) right = UAV2. ................... 29
Figure 8. Conceptual Illustration of Approximately 100 Randomly Selected UAV Flight Transects in Relation to the Theoretical Maximum DTBird Detection Envelope for Golden Eagles at 240 Meters Radial Distance from the Cameras on a Study Turbine ........................................................................................................................................ 31
Figure 9. Example Layout of UAV Navigation Loiter Points and 200-Meter-Radius Placement Buffers (yellow circles) in Relation to Theoretical Maximum Detection Range for Golden Eagles (red circle), Overlain with Flight Tracks from a Half-Day Flight Trial ................................................................................................................................... 31
Figure 10. Monthly Numbers of Overall, Confirmed Bird, False Positive, and Flight-Trial UAV Detection Events Recorded by DTBird Systems During the Study .......................................... 42
Figure 11. Example Array of UAV Flight Tracks (blue dots) and Resulting DTBird Detection (yellow dots, many covered by co-occurring red or orange dots) and Deterrence (orange = warning signal, red = dissuasion signal) Event Locations from a Half-Day Flight Trial Session at a Study Turbine. Inner Sphere Represents Rotor Swept Zone. Outer Hemisphere Represents 240-m Theoretical Maximum Detection Range for Eagles. ....................................................................................................................... 44
Figure 12. Distribution of Response Distances for UAV Flights by DTBird Event Type........................... 46

Evaluating a Commercial-Ready Technology for Raptor Detection and Deterrence at a Wind Energy Facility in California
American Wind Wildlife Institute 6 September 17, 2018
Figure 13. GLMM Model Results Depicting Predicted Differences in Average DTBird Event Response Distances for the Two UAVs Used in the Study ...................................................... 48
Figure 14. GLMM Model Results Depicting Predicted Differences in Average DTBird Event Response Distances with Different Levels of Cloud Cover ..................................................... 48
Figure 15. GLMM Model Results Depicting the Predicted Influence of UAV Climb Rate on DTBird Event Response Distances............................................................................................ 50
Figure 16. GLMM Model Results Depicting the Predicted Influence of Wind Speed on DTBird UAV Event Response Distances ................................................................................................ 50
Figure 17. GLMM Model Results Depicting the Predicted Interactive Influence of UAV Roll Angle and Pitch Angle on DTBird Event Response Distances ................................................ 50
Figure 18. Probability of the DTBird System Detecting a UAV Flight by Turbine and Across All Turbines Combined ................................................................................................................... 51
Figure 19. Probability of DTBird Detecting a UAV Flight Based on its Average Lateral Distance from the Turbine ......................................................................................................... 52
Figure 20. Modeled Influence of Hour of the Day and Flight Exposure Direction (Negative = West, Positive = East) on the Probability of DTBird Detecting a UAV Flight .......................... 53
Figure 21. DTBird Detection Events by Camera Recorded Across the Study Period .............................. 54
Figure 22. All Detections and UAV Detections by Camera and Hour Recorded Across the Study Period ............................................................................................................................... 54
Figure 23. Modeled Influence of Month and Wind Speed on the Probability of DTBird Deterring Raptors ....................................................................................................................... 56
Appendices
Appendix A. Deterrence Response Classification Protocol ......................................................................... 69
Appendix B. UAV Flight Transect Selection Protocol ................................................................................... 72
Appendix C. UAV Flight Trial Orchestration Protocol ................................................................................... 73
Appendix D. DAP and UAV Data Postprocessing Protocol .......................................................................... 78
Appendix E. Tasks Not Considered Due to Practical Constraints and Funding Limitations ...................... 80
Appendix F. Selected Examples of Candidate Models Evaluated to Produce Final Generalized Linear Mixed Model (GLMM) Relating DTBird Detection and Deterrent-Triggering Response Distances to Various Covariates ............................................................................. 82
Appendix G. DTBird System Reliability .......................................................................................................... 83

Evaluating a Commercial-Ready Technology for Raptor Detection and Deterrence at a Wind Energy Facility in California
American Wind Wildlife Institute 7 September 17, 2018
Contributors
Scott B. Terrill, Ph.D., Principal, Wildlife Ecology—Principal-in-Charge
Judd A. Howell, Ph.D., Senior Associate Wildlife Ecologist—Technical Advisor
Jeff P. Smith, Ph.D., Associate Wildlife Ecologist—Project Manager
Jeff A. Zirpoli, M.S., Senior Wildlife Ecologist
Kristina M. Wolf, Ph.D., Quantitative Ecologist
Ken L. Lindke, M.S., Quantitative Ecologist
Steve Watt, M.S., Senior GIS Specialist

Evaluating a Commercial-Ready Technology for Raptor Detection and Deterrence at a Wind Energy Facility in California
American Wind Wildlife Institute 8 September 17, 2018
Executive Summary
Bird collisions with anthropogenic objects are well documented in the literature, including those involving wind turbines. The purpose of this study was to evaluate and help improve the effectiveness of an automated detection and deterrent system designed to minimize the risk of raptors colliding with wind turbines. We evaluated the DTBird® system (Liquen Consultoría Ambiental, S.L., Madrid, Spain), which is designed to detect and deter raptors flying near and in the risk zone of wind turbines. The DTBird system includes a camera/video-based detection module that detects and tracks objects based on settings calibrated for birds with specific wingspans, and a collision-avoidance or deterrence module that emits sounds designed to discourage birds from proceeding into the collision risk zone of an operational turbine. The deterrence module first emits an audible warning signal when the surveillance system estimates that a detected flying object (whether a bird or an inanimate object) has crossed a calibrated distance threshold. If the surveillance system estimates that the tracked object crosses a second, closer distance threshold, then it emits a stronger dissuasion signal intended to scare the bird away from the signal noise and turbine.
The ultimate goal of the study was to quantify the effectiveness of the DTBird system as a measure to reduce collision risk for golden eagles (Aquila chrysaetos) and other large raptors. If found to be effective, and if accepted by the U.S. Fish and Wildlife Service (USFWS), the DTBird system or other risk-reduction technologies could be considered for use by commercial wind energy facilities in eagle conservation plans as a Best Management Practice (BMP) under the Eagle Rule, a minimization measure for take permits or habitat conservation plans, or as an adaptive management measure in a Bird and Bat Conservation Strategy. Determining whether DTBird is suitable for use in eagle conservation plans or other minimization measures was beyond the scope of this study.
As the first in-depth study of DTBird with raptors in the United States, this study estimated detection and deterrence of eagles and buteos, and identified several important limitations of the technology and the study design for evaluating detection and deterrence of the target raptor species. Limitations included a large number of false-positive detections (i.e., detections that were not large raptors), unclear deterrent responses from in situ eagles and other raptors, potential bias from use of eagle-like unmanned aerial vehicles (UAVs) as surrogates for live eagles, and detection degradation from sun glare, clouds, and visual clutter. These limitations suggest future studies that could build on our initial findings.
The study was hosted by the Manzana Wind Power Project, which is owned and operated by Avangrid Renewables and located in Kern County, California. Over the course of a 9-month study period from December 2016 through August 2017, we used fixed-wing UAVs as surrogates for live eagles in experimental flight trials to evaluate the performance of the DTBird detection and deterrent-triggering systems installed at this facility. The UAVs used for the study were similar in size and painted to resemble a golden eagle, and carried onboard avionics that provided high temporal and spatial resolution Geographic Positioning System (GPS) tracking data. We also evaluated the effectiveness of the DTBird deterrence module by examining the behavioral responses of in situ raptors evident in videos recorded by the seven DTBird systems installed at the facility. We derived estimates of the probability of detection from the UAV flight trials as a surrogate for live eagles and estimates of the probability of deterrence from classifying the responses of in situ raptors. We then estimated the probability of collision-risk reduction from deploying DTBird as the cross-products of the estimated probabilities of detection and deterrence.

Evaluating a Commercial-Ready Technology for Raptor Detection and Deterrence at a Wind Energy Facility in California
American Wind Wildlife Institute 9 September 17, 2018
Modeling the Influence of UAV Flight Characteristics and Environmental Covariates on the DTBird Detection and Deterrent-Triggering Functions
Based on more than 1,200 response samples, we developed generalized linear mixed models (GLMMs) to evaluate how various UAV flight characteristics, location parameters, and lighting, visibility, and environmental conditions influenced the DTBird detection and deterrent-triggering response distances during the UAV flight trials. We quantified the overall probability of detecting an eagle-like UAV and described how the probability of detection varied depending on distance from the turbine and exposure direction.
Characterizing the response-distance data for detection, warning-trigger, and dissuasion-trigger events pertaining to UAV flights revealed some unexpected patterns. The average response distance for triggering a dissuasion signal (154 m) matched the expected response distance of 170 m across much of the surveillance area and 100 m in an outer, lower band of the surveillance area. The primary unexpected result was that the response distances for all three event types extended across broad ranges, well beyond the expected 240-m maximum detection distance for eagle-sized birds, and considerably closer than the expected 100-m minimum trigger distance for warning signals.
The GLMM results identified the relative influence of various flight characteristics and environmental/visibility factors on DTBird event response distances during the UAV flight trials. The final model included a complex array of main effects, second-order terms, and selected two-way interactions, conformed to all necessary assumptions, passed all diagnostic evaluations, and had a high R2 of 0.922. The primary results and insights were as follows:
• Average response distances differed for the two UAVs used during the flight trials, indicating that differences in the physical characteristics of the aircraft (i.e., differences in their body morphology, size, and coloration) influenced the probability of detection.
• The cloud cover behind a UAV influenced the response distances, presumably by affecting the system’s ability to detect and track flying objects depending on the degree of contrast between the sky backdrop and the tracked object. Average response distances were longest, indicating earlier detection, under mostly cloudy skies, moderate under clear blue skies and darker overcast skies, and lowest under more variable partly cloudy skies.
• The degree of solar irradiation impinging on the UAV and cameras influenced the response distances, presumably by limiting the system’s ability to detect and track objects when moderate solar intensity corresponded to sun positioning that maximized glare for certain cameras.
• Metrics describing the UAV climb rate, roll angle and pitch angle, and wind speed at the time a detection, warning-trigger, or dissuasion-trigger event was recorded all contributed significantly to the final model, presumably because they affected the degree to which the UAV profile was exposed to the cameras, and thus the size of the tracked object registered by the DTBird system.
• The elevation angle from the first-detection camera to a UAV influenced the response distances in complex ways, as reflected in the inclusion of both a second-order term for this variable and significant interactions with event type (detection, warning-trigger, or dissuasion trigger) and the relative altitude of the UAV. The complexity of the relationships captured variation in the response distances resulting from both the system calibration settings and the influence of position within the camera viewshed.

Evaluating a Commercial-Ready Technology for Raptor Detection and Deterrence at a Wind Energy Facility in California
American Wind Wildlife Institute 10 September 17, 2018
Quantifying the Probability of Detection Based on UAV Flight Trials
The probability of a UAV flight being detected averaged 63 ± 10.0% (mean ± standard deviation), varying from 47–75% across the seven turbine installations. A logistic regression analysis evaluating the probability of UAV detection in relation to hour of the day and the average flight exposure direction suggested that the probability of detection was lower toward the southeast in the morning (i.e., facing the morning sun), but improved there as the sun rotated westward. An additional investigation demonstrated that the rate of detection was consistently lower for cameras that faced south, with the detection rates in different cameras varying through the day in ways that further emphasized the apparent influence of solar glare on the performance of the DTBird detection and deterrent-triggering system.
The probability of detection and response-distance modeling results suggested that optimal detection and deterrent triggering occurred when the following applied:
• The sun was not shining directly into the camera; south-facing cameras were particularly susceptible to glare.
• The sky was mostly covered in clouds but not dark overcast skies, with relatively dynamic and variable partly cloudy skies most problematic.
• The tracked object entered the detection envelope toward the middle of a camera’s viewshed, rather than first appearing over the high center of the detection envelope or close in and rising up from a low trajectory.
• The profile exposure of the tracked object was enhanced by turning/rolling, pitching up and down, rapidly descending flight, or general bouncing around in the wind, as might be the case with dynamic or otherwise unstable flight patterns of real birds.
We believe the use of UAVs to simulate eagles was a useful approach to estimate detection of eagles, but we acknowledge that there is a potential for bias that we did not quantify in this study.
Quantifying the Probability of Deterrence Based on the Behavioral Responses of In Situ Raptors Detected by the DTBird System
During the 9-month study period, the DTBird digital analysis platform (DAP) recorded a total of 12,805 individual detection events across the seven DTBird installations, including 877 detections of the UAVs flown during the flight trials. To support investigating the deterrence responses of in situ raptors, we sampled 5,079 (40%) of the DAP records. Species-level identification was routinely problematic except for birds that passed relatively close to the cameras. Of 2,600 screened records that we classified as some form of bird, 469 (18%) were raptors, and we confirmed that 98 (21%) of these detections involved one of five species, including 52 golden eagles.
We classified the deterrence responses of 255 individual raptors, including 42 confirmed golden eagles and 46 confirmed buteos. Focusing only on cases that we classified as unequivocally successful deterrence events, the overall deterrence rate for all raptors was 36%, for buteos 39%, and for golden eagles 52%. Including potential successes increased the deterrence rate for all raptors to 76%, for buteos to 78%, and for golden eagles to 83%.
We investigated how the probability of deterrence varied across months of the study and in relation to average wind speed. Although the limited data for golden eagles suggested no temporal patterns, we determined that the probability of deterrence for buteos and all raptors as a group was higher during light winds early in the study period, but was high only during stronger winds later in the study period. This pattern suggested possible positive habituation with heightened sensitivity to the deterrent signals when

Evaluating a Commercial-Ready Technology for Raptor Detection and Deterrence at a Wind Energy Facility in California
American Wind Wildlife Institute 11 September 17, 2018
the turbine blades were spinning rapidly, but possible negative habituation to the signals when lighter winds prevailed and the turbines were spinning slower but still represented a potential collision risk.
Estimating Collison Risk Reduction from Deployment of DTBird
The cross products of minimum and maximum estimated probabilities of detection (0.47, 0.75; derived from the UAV flight trials) and probabilities of deterrence (0.36, 0.76; derived from evaluating DTBird videos of in situ raptors) produced estimates of risk reduction for all raptors combined from deploying DTBird ranging from 17–57%. Multiplying the estimated overall probability of detection for golden eagles (63%) and the most-confident estimate of the probability of successfully deterring an eagle (52%) yielded a probable minimum risk-reduction estimate from deploying DTBird of 33% for golden eagles. Multiplying the estimated overall probability of detection for golden eagles (63%) and the estimated probability of deterring an eagle based on both confident and probable deterrence events (83%) yielded a probable maximum risk-reduction estimate from deploying DTBird of 53% for golden eagles.
Deployment of the DTBird systems at the seven turbines potentially reduced golden eagle collision risk by 33–53%, but these study results cannot be extrapolated to estimate facility-wide risk reduction for eagles or other raptors from deployment of DTBird. Additional well-designed, experimental studies will be needed to evaluate how the many factors that could influence risk reduction across entire facilities, including the site-specific layout of turbines, e.g., spacing and location relative to eagle activity, the number and placement of DTBird systems relative to the timing and locations of eagle activity, and the relative abundance of transient/migratory birds.
Other important factors for managers and wind-energy facility operators to consider in deciding whether to install DTBird at a given facility, selecting installation locations, and evaluating potential risk reduction include:
• The potential for deterrent signals to disturb nearby residents and non-target wildlife.
• The limited effectiveness of DTBird cameras that face south into the sun.
• The climatic conditions and effects of solar intensity and cloud cover on DTBird detection efficiency.
• Extra-limital detections and excessive false positives (i.e., cases where the system responds to objects other than target birds) that could exacerbate the disturbance of neighbors and non-target wildlife and reduce the effectiveness of the deterrent signaling through negative habituation of targeted birds.
• Feasibility, cost, and upgrades for integration of systems into existing infrastructure.
• Operations and maintenance (O&M) and licensing fees, as well as site personnel hours required for annual and ongoing system maintenance.
• Ongoing data evaluation that may be necessary to determine continued effectiveness over long periods.
• Longevity and durability of the equipment.
Evaluating a Commercial-Ready Technology for Raptor Detection and Deterrence at a Wind Energy Facility in California
American Wind Wildlife Institute 12 September 17, 2018
Introduction
Bird collisions with anthropogenic objects are well documented, including those involving wind turbines (Hunt 2002, Erickson et al. 2005, de Lucas et al. 2007, Smallwood 2013). Although the environmental consequences of wind power may be relatively benign compared to fossil fuel consumption, wind-energy production can result in ecological issues such as bird and bat fatalities caused by collisions with turbines. Erickson et al. (2001) state, “…even if wind‐plants were quite numerous (for example, 1 million turbines), they would likely cause no more than a few percent of all collision deaths related to human structures.” Nevertheless, disproportionate population‐level effects could occur for individual species with small populations or for specific taxa such as golden eagles (Aquila chrysaetos) (Whitfield 2004, Tack and Fedy 2015). Additionally, the Bald and Golden Eagle Protection Act (Eagle Act) (16 U.S.C. §668–668c) protects eagles from human-related mortality and disturbance sufficient to cause a decline in eagle survival or productivity. Bird mortality remains an environmental and regulatory issue for wind‐energy development in California and the nation. At the same time, the rapidly growing demand for renewable energy to help reduce use of fossil fuels and offset current trends in global climate change is stimulating the development of impact-reduction technologies designed to allow wind energy to be widely developed while minimizing the risk of bird and bat fatalities (Sinclair and DeGeorge 2016).
The purpose of this study was to evaluate and help improve the effectiveness of DTBird® (Liquen Consultoría Ambiental, S.L., Madrid, Spain), an automated detection and deterrent system, in minimizing the risk of raptors colliding with wind turbines. Efforts to develop bird detection and deterrent systems have evolved through initiatives such as the U.S. Air Force Bird Aircraft Strike Hazard (BASH) program (U.S. Department of Defense 2010), where protection of human life and property were at risk. Detection systems for birds have included sophisticated technologies such as radar (Stevens et al. 2000, Ronconi and Cassady St. Clair 2006, DeFusco 2007) and camera and video-aided detection (Reis and Resca 1997, May et al. 2012), while development of classification algorithms that correctly identify the desired objects continues to evolve (van den Broek et al. 2000; also see May et al. 2015 for an overview of approaches to reducing avian collisions with wind turbines).
May et al. (2012) evaluated the ability of the DTBird system to detect and deter raptors flying near and in the risk zone of wind turbines in Norway, with the system calibrated to detect and deter large raptors such as white-tailed sea eagles (Haliaeetus albicilla) and golden eagles. The authors of that study compared the detection rates of the DTBird camera and video surveillance system against detections documented by a radar system. Using this approach, they were able to quantify the probability of false positives (defined as video recordings without birds) and false negatives (defined as the detection system failing to trigger video surveillance of a targeted bird that the radar system indicated passed by in detectable range). This study, as well as other preliminary DTBird evaluations (Aschwanden et al. 2015, Litsgård et al. 2016), did not, however, explicitly address potential limitations in the spatial coverage provided by the surveillance system, nor did it evaluate detectability as a function of factors such as 1) distance from the turbine; 2) flight altitude, trajectory, and angle of approach relative to the camera(s); and 3) variation in visibility conditions caused by weather, ambient lighting, and different visual backdrops. A comprehensive test of the detection system that effectively addresses the influence of such covariates requires controlled experiments with objects manipulated to fly under specified conditions and in predefined patterns.
The DTBird system also includes a collision-avoidance or deterrence module. The deterrence module first emits an audible warning signal when the surveillance system estimates that a tracked object has crossed a calibrated distance threshold. If the surveillance system registers that the tracked object has crossed a second, closer distance threshold, then the deterrence module emits a stronger dissuasion signal intended to aggressively scare the bird away from the turbine. The warning signal is a distinctly mechanical but relatively benign sound designed to draw a bird’s attention and encourage it to move
Evaluating a Commercial-Ready Technology for Raptor Detection and Deterrence at a Wind Energy Facility in California
American Wind Wildlife Institute 13 September 17, 2018
away. The dissuasion signal is a much more raucous and annoying sound composed of combinations of avian distress calls and mechanical sounds designed to actively discourage birds from continuing toward the turbine. Hereafter, we frequently refer to warning and dissuasion signals collectively as deterrent signals.
The DTBird system also has the capacity to shut down relevant turbines automatically if the surveillance system registers that a tracked bird is at imminent risk of colliding with a turbine; however, this part of the system has not been well tested and was not a functional component of the system evaluated in this study.
The DTBird system has evolved since deployments and testing began in 2009 (DTBird Team 2016). Most notably, typical installations have expanded from two to as many as eight cameras per turbine, the resolution of the cameras has increased from 1 megapixel standard definition units to 6 megapixel high-definition units, the number of speakers used to broadcast deterrent signals has increased from two to as many as eight per turbine, and the system now automatically records relevant meteorological data. The numbers and placements of cameras and speakers, as well as their surveillance orientation and sound projection, can be tailored to meet the needs of specific projects, turbine and landscape configurations, species of interest, and legal constraints (relative to sound projection). Surveillance envelopes now routinely provide 360° coverage around the turbine, with the cameras typically arrayed to optimize surveillance at the rotor hub height with the field of view centered at 1–2 times the blade length. A typical installation on a modern turbine provides surveillance coverage beginning at 4–5 meters (m) above ground level (agl) at the turbine tower and extending outward from there angling upward at approximately 10–12° above horizontal; this angle can be adjusted depending on turbine and site characteristics and other project-specific surveillance interests. Standard speaker installations also typically provide 360° sound projection; however, those installations can and often must be customized to focus the sound in certain directions and adjust the intensity of the sound depending on local noise-abatement ordinances and other project-specific needs and priorities.
Previous European evaluations provided preliminary insight about DTBird’s ability to detect and deter raptors and other birds from approaching turbines (May et al. 2012, Aschwanden et al. 2015, Litsgård et al. 2016). Those researchers accomplished this objective primarily by comparing the frequency and turbine-approach distances of in situ raptors that they visually observed flying near turbines with and without the DTBird deterrent signals muted.
Aligning with the recommendations of May et al. (2012), we used unmanned aerial vehicles (UAVs, also commonly known as drones) in experimental trials to further evaluate the performance of the DTBird detection and deterrence system at an operational wind-energy facility. In support of its wildlife protection program, Avangrid Renewables offered to host the study at its Manzana Wind Power Project in Kern County, California (Figure 1). This 189 MW facility has been operational since December 2012.
We combine insight gained from these trials with data on the detection and deterrence responses of in situ raptors evident in data and video footage concurrently recorded at the facility by the DTBird systems. The study aimed to improve understanding of the capabilities and limitations of the system for detecting and deterring selected raptors. Golden eagles were the primary focus of this study; however, red-tailed hawks (Buteo jamaicensis) and American kestrels (Falco sparverius) often experience high fatality rates around wind turbines (Erickson et al. 2001, Smallwood et al. 2009, Mockrin and Gravenmier 2012). Therefore, to the degree possible given logistical, practical, and financial constraints, we also evaluated the efficacy of the system for detecting and deterring buteos and kestrels.
The ultimate goal of the study was to quantify the effectiveness of the DTBird system as a measure to reduce collision risk for golden eagles and other large raptors. If found to be effective, and if accepted by the U.S. Fish and Wildlife Service (USFWS), the DTBird system could be considered for use by commercial

Evaluating a Commercial-Ready Technology for Raptor Detection and Deterrence at a Wind Energy Facility in California
American Wind Wildlife Institute 14 September 17, 2018
wind energy facilities in conservation plans, including as a Best Management Practice (BMP) under the Eagle Rule, a minimization measure for take permits or habitat conservation plans, or as an adaptive management measure in a Bird and Bat Conservation Strategy. Determining whether DTBird is suitable for use in such conservation plans in coordination with the USFWS was beyond the scope of this study.
1.1 Study Objectives
To accomplish this purpose, we designed the study to:
1) Evaluate DTBird’s ability to detect and deter golden eagles and other raptors at individual wind turbines based on:
a. Operation of seven DTBird detection and deterrent systems installed on selected turbines,
b. Experimental UAV flight trials at these DTBird-equipped turbines when the turbines were not operating, and
c. Evaluation of DTBird data and video footage pertaining to in situ raptors.
2) Evaluate the detection and deterrent-triggering functions of DTBird based on flight trials using eagle-like UAVs equipped with high-resolution GPS tracking devices:
a. Characterize the targeting characteristics and efficiency, and the detection, warning-signal, and dissuasion-signal response envelopes with the system calibrated for golden eagles,
Figure 1. Study Site Map

Evaluating a Commercial-Ready Technology for Raptor Detection and Deterrence at a Wind Energy Facility in California
American Wind Wildlife Institute 15 September 17, 2018
b. Model the influence of flight characteristics and visibility factors on detection and deterrent-triggering response distances, and
c. Quantify the probability of detecting an eagle-like UAV and evaluate that probability in relation to selected environmental covariates.
3) Quantify the probability of deterring in situ golden eagles and other raptors from entering the RSZ of study turbines by reviewing DTBird data and video footage and evaluating the behavioral responses of in situ raptors exposed to warning and/or dissuasion deterrent signals evident in the video footage.
4) Estimate the reduction in take of golden eagles expected from implementation of the DTBird system.
5) Based on the study results and in consultation with the American Wind Wildlife Institute (AWWI), translate the study methodology to standardized protocols that can be implemented at other study sites to facilitate further evaluation of the DTBird system and comparing results across studies and technologies.
1.2 Study Approach
Sinclair and DeGeorge (2016) discussed a variety of approaches and criteria to consider in setting up a study to evaluate the effectiveness of impact-reduction techniques for reducing bird and bat fatalities at wind-energy facilities. For example, our study did not incorporate concurrent fatality monitoring, because eagle fatalities are rare events. Therefore, inference about the effectiveness of the DTBird system for reducing fatalities of golden eagles and other raptors is limited to evaluating “alternative metrics” as indirect indicators of potential risk reduction, such as behavioral responses of raptors to deterrent signals (Sinclair and DeGeorge 2016). More specifically, our approach involved independent evaluations of the detection and deterrence functions of the DTBird system and combined insight from those investigations to estimate expected reductions in fatality risk. We rigorously evaluated the accuracy, primary dependent factors, and limitations of the DTBird system for efficiently and effectively detecting golden eagles and other raptors in the context of the chosen study site, and applied a multifaceted approach to evaluating the apparent effectiveness of the DTBird warning and dissuasion signals in deterring representative raptors from approaching turbines. This combination of insights enabled an effective quantification of the probability that the DTBird system would deter golden eagles and other raptors from entering the RSZ of turbines in landscape situations similar to those found at the chosen study site.
Our study represented a novel effort to develop a rigorous approach to evaluating the DTBird system, subject to situational, financial, and practical resource constraints. As such, we implemented the study with a variety of uncertainties concerning the degree to which our proposed approach would yield adequate samples to support comprehensive modeling of predictor variables that might influence DTBird’s ability to detect and deter raptors of interest. As a result, conducting the study was a dynamic process in which we sought to maximize the utility of the UAV flight trials, take best advantage of the DTBird data and video footage of in situ birds, develop analytical models that yielded the most robust and useful insights possible given the available data, and maintain a financially viable effort.

Evaluating a Commercial-Ready Technology for Raptor Detection and Deterrence at a Wind Energy Facility in California
American Wind Wildlife Institute 16 September 17, 2018
Section 2. Methods
2.1 Study Area and Site Characterization
The Manzana Wind Power Project is located in the southwestern foothills of the Tehachapi Mountains in northwestern Antelope Valley, which constitutes the westernmost extension of the Mojave Desert (Figure 1). The landscape is a gradually sloping alluvial fan incised by dry desert washes. The northwestern sector of the facility features more complex foothill topography adjacent to a primary riparian drainage, and the topography grades downslope to the southeast into a more-uniform plain. The vegetation is typical of the upper Mojave Desert region, featuring cover types such as Mojave Desert scrub communities, southern willow scrub, native and nonnative grasslands, juniper and Joshua tree woodlands, and, at the upper margins of the facility, pine-oak woodlands characteristic of middle elevations in the Tehachapi Mountains (Sapphos Environmental 2006).
Biologists conducted raptor nest surveys and winter and migration-season activity surveys before the facility was constructed to help describe raptor activity in the area (Sapphos Environmental 2006). These surveys confirmed one occupied golden eagle breeding territory in 2004, centered 3–4 kilometers (km) west-northwest of the facility boundary. A pair has continued to occupy this territory, with at least two known nest sites and a home range that overlaps the facility (Bloom Biological 2015a, Kuehn 2016). Several other recently occupied golden eagle breeding territories are known within 16 km of the facility, but are located mainly on the north-side slopes of the Tehachapi Mountains (Chatfield and Erickson 2011; Sapphos Environmental 2011a, 2011b; Bloom Biological 2015a). Historically, golden eagles also nested in some of the isolated, hilly areas of Antelope Valley east of the facility, as well as west of the facility near Gorman (California Department of Fish and Wildlife 2016). Preconstruction surveys also revealed that golden eagles occurred in the facility area routinely but infrequently throughout the year and included both small numbers of resident birds and occasional winter residents and transients that passed through during spring and especially autumn migration periods (Sapphos Environmental 2006; also see Sapphos Environmental 2009 and 2011b concerning documented activity at neighboring facilities).
Post-construction raptor activity surveys conducted on and around the facility between December 2013 and April 2015 (Bloom Biological 2015b, 2015c; Bloom Biological and Cardno ENTRIX 2015) revealed that golden eagle activity typically was greatest in the northern sector of the facility and farther northwest, in the nearby golden eagle breeding territory, and that observed activity was often highest in spring. These surveys also confirmed that golden eagles routinely but infrequently occurred across the facility footprint throughout the year, often flying above the RSZ of turbines but also flying/hunting at lower altitudes (<200 m) where they might be exposed to risk of collision with operational turbines. The pre- and post-construction activity surveys also confirmed that red-tailed hawks and American kestrels breed nearby and commonly occur in the facility area (Sapphos Environmental 2006; Bloom Biological 2015b, 2015c; Bloom Biological and Cardno ENTRIX 2015).
Diurnal raptors and vultures known to occur at least periodically in the area include turkey vulture (Cathartes aura), California condor (Gymnogyps californianus), golden eagle, bald eagle (Haliaeetus leucocephalus), osprey (Pandion haliaetus), northern harrier (Circus cyaneus), sharp-shinned hawk (Accipiter striatus), Cooper’s hawk (A. cooperii), red-tailed hawk, Swainson’s hawk (Buteo swainsoni), ferruginous hawk (B. regalis), white-tailed kite (Elanus leucurus), American kestrel, merlin (Falco columbarius), peregrine falcon (F. peregrinus), and prairie falcon (F. mexicanus).

Evaluating a Commercial-Ready Technology for Raptor Detection and Deterrence at a Wind Energy Facility in California
American Wind Wildlife Institute 17 September 17, 2018
2.2 DTBird Systems and Data Processing
2.2.1 Installation Layout
We considered several criteria as the basis for installing four of the seven DTBird systems on the northwestern perimeter of the facility in the D and E turbine strings and three systems in the southeastern sector of the facility in the T, U, and V turbine strings (Figure 2).
Seven DTBird systems were insufficient to characterize the behavior of the systems across the entire wind facility. Thus, we did not randomize the selection of installation locations and instead focused our selection of study turbines to capture important features at the facility and to maximize the chances of recording the activities of in situ raptors. We did not consider individual DTBird installations as sampling units for this study. Instead, they represented multiple situations where we gathered detection and deterrence response data. The sampling units for the evaluations were individual UAV flight segments and individual deterrence-response events for in situ birds. We did, however, represent the individual DTBird installations as a random variable in the generalized linear mixed models (GLMM) we used to evaluate how various covariates influenced detection and deterrent-triggering response distances (see Section 2.4.1). Our non-random selection of turbines was specifically designed to achieve other objectives, including maximizing sample sizes of deterrent-response events for in situ raptors (based on existing raptor use data), providing necessary spacing of the installations to ensure that deterrent responses at one installation were not influenced by deterrent signals emitted at another installation, and maximizing the cost and logistical efficiency of installing the DTBird systems.
Insight from post-construction activity surveys suggested that the combination of favorable topography, proximity to nesting areas, and prey availability (California ground squirrels Otospermophilus beecheyi) contributed to greater in situ eagle and general raptor activity in the northwest section of the facility (Bloom Biological 2015b, c; Bloom Biological and Cardno ENTRIX 2015; Kuehn 2016). Concentrating several of the systems on the periphery of this sector increased the likelihood of obtaining sufficient sample sizes for using DTBird data and video footage to evaluate the responses of in situ eagles, red-tailed hawks, kestrels, and other transient/wintering buteos to the DTBird deterrent signals.
Conducting UAV flight trials could influence the activities of in situ raptors by altering their normal hunting or loafing behaviors, or stimulating territorial or predatory responses directed at the UAV (e.g., see Junda et al. 2016). During all flight trials, the Project Manager, a highly experienced raptor observer, maintained a vigilant watch for in situ raptors and restricted the flight trials when necessary to prevent adverse interactions between the UAV and in situ raptors. To reduce the potential for adverse interactions with in situ raptors and thereby increase the overall efficiency of the flight trials, we recommended installing the other three DTBird systems on turbines in the southeastern section of the facility where the overall in situ raptor activity was expected to be lower (Figure 2). These installations also increased the landscape diversity represented among the installation locations.

Evaluating a Commercial-Ready Technology for Raptor Detection and Deterrence at a Wind Energy Facility in California
American Wind Wildlife Institute 18 September 17, 2018
Figure 2. Locations of DTBird Installations

Evaluating a Commercial-Ready Technology for Raptor Detection and Deterrence at a Wind Energy Facility in California
American Wind Wildlife Institute 19 September 17, 2018
To minimize the complexity and cost of integrating the DTBird systems into the facility’s existing network of control “fibers” (i.e., wiring and fiber optic circuits connecting up to 21 turbines each), our seven recommended installations involved only three fibers. Within the selected fibers, we chose locations that provided sufficient spacing to ensure that each DTBird installation would serve as an independent unit for evaluating the effectiveness of the DTBird deterrent signals. Installing one or two additional systems within the selected fibers might have increased the probability of obtaining additional samples of in situ
raptor responses to deterrent signals, but would also have increased the logistical complexity of orchestrating UAV flight trials at more turbines. Furthermore, installing additional systems would not have yielded substantial benefits unless the number increased to at least 15–20 units spread throughout facility, sufficient to enable other controlled experiments, which was beyond the scope of this study.
2.2.2 System Setup and Performance Standards
The DTBird systems used in this study were set up with four 6-megapixel HD cameras arrayed in approximate cardinal directions on the turbine towers at a height of 4 m agl, and four speakers arrayed in similar fashion around the tower at a height close to the lower RSZ (Figure 3). Field measurements correlated with known assigned camera numbers confirmed that the orientation of cameras of a given number was variable but nonetheless coarsely consistent across the seven installations (Table 1). Camera 1 always faced to the west, Camera 2 to the south, Camera 3 to the east, and Camera 4 to the north (Figure 4). The systems included a light monitor that restricted their operation to periods when the lighting exceeded 50 lux, which translates to operation from civil dawn to civil twilight. In addition, during normal operations, the collision-avoidance module (deterrent signals) operated only when the turbine blades were spinning at a rate of ≥3 rpm. At the minimum cut-in wind speed for turbines at the study site (3.5 m/second [sec]), the blade rotors spun at a rate of approximately 12–14 rpm.
The broadcast volume of the deterrent signals can be adjusted depending on site-specific needs pertaining to the targeted bird species, local noise-management ordinances, and the specific facility layout. The factory setting broadcasts sounds at approximately 121 decibels (dB) at 1 m from the turbine. Sound-attenuation models and testing by Liquen during installation of the systems confirmed that broadcasting at the factory setting would not exceed the Kern County noise-ordinance restriction of ≤65 dB at the exterior of the residence closest to a DTBird installation (approximately 0.5 km). On days when UAV flight trials occurred, deterrent signals were muted at the focal turbine during all daylight hours. This arrangement was necessary to allow the operations team to maintain clear verbal communication at all times, and because the local time difference between the study site in the United States and the DTBird control operation in Spain precluded timelier coordination during the actual trials.
camera
speakers
Figure 3. DTBird System Setup on a Study Turbine

Evaluating a Commercial-Ready Technology for Raptor Detection and Deterrence at a Wind Energy Facility in California
American Wind Wildlife Institute 20 September 17, 2018
Table 1. Approximate Viewshed Orientations and Ranges for Numbered Cameras Associated with DTBird Installations
Turbine Camera Center Bearing Center Azimuth (°)1 Viewshed Range (°)2
D1 1 W 270 218–322
D1 2 S 180 128–232
D1 3 E 90 38–142
D1 4 N 0 308–52
D4 1 W 270 218–322
D4 2 S 180 128–232
D4 3 E 90 38–142
D4 4 N 0 308–52
D8 1 WSW 258 206–310
D8 2 SSE 168 116–220
D8 3 ENE 78 26–130
D8 4 NNW 348 296–40
E11 1 WSW 238 186–290
E11 2 SSE 148 96–200
E11 3 ENE 58 6–110
E11 4 NNW 328 276–20
T13 1 W 275 223–327
T13 2 S 185 133–237
T13 3 E 95 43–147
T13 4 N 5 313–57
U7 1 W 262 210–314
U7 2 S 172 120–224
U7 3 E 82 30–134
U7 4 N 352 300–44
V17 1 W 268 216–320
V17 2 S 178 126–230
V17 3 E 88 36–140
V17 4 N 358 306–50 1 Approximate (±2–3°) measurements made at the facility by H. T. Harvey & Associates personnel using a compass. 2 Based on the 104° viewshed specification provided by the DTBird Team and center azimuths measured by the H. T.
Harvey & Associates.

Evaluating a Commercial-Ready Technology for Raptor Detection and Deterrence at a Wind Energy Facility in California
American Wind Wildlife Institute 21 September 17, 2018
Figure 4. Approximate 2D Viewsheds of Numbered Cameras at DTBird Study Installations

Evaluating a Commercial-Ready Technology for Raptor Detection and Deterrence at a Wind Energy Facility in California
American Wind Wildlife Institute 22 September 17, 2018
The surveillance and deterrent-triggering system is calibrated to preferentially focus on birds of certain target wingspans, depending on the conservation priorities of a given facility operator. The detection system locks onto and tracks objects based on the number of pixels the object occupies on a video image, and calibrated relationships between the known size of the target bird species and how many pixels a bird of that size should occupy at different distances from the camera. Thus, birds of the targeted size should trigger detection and deterrence events at distances approximating those anticipated given the calibration settings; however, the actual event-triggering distances vary depending on the degree to which bird profiles are exposed to the camera. A bird whose full, spread-winged, ventro-dorsal profile is exposed to the camera will trigger detection and deterrence events at distances close to the expected maximums. Conversely, a bird that is flying directly toward a camera with tucked wings and no flapping exposes a minimum profile and would not trigger detection or deterrence events until it passes closer to the camera and effectively fills the number of image pixels required to trigger a detection or deterrence event. Birds that are much smaller than the targeted size range may trigger detection or deterrence events, but only if they pass very close to a camera and fill enough image pixels to register as large enough to stimulate a system response.
The DTBird systems in this study were calibrated to detect and respond preferentially to birds with a wingspan of approximately 1.8 m. Golden eagles have wingspans ranging from 1.8–2.2 m in North America (Kochert et al. 2002). Calibrated for birds with a wingspan of 1.8 m, the theoretical outer detection range of the DTBird system for birds fully exposed to the camera with spread wings was expected to be approximately 240 m from the cameras. For comparison, if calibrated for birds the size of red-tailed hawks (approximate wingspan of 1.2 m), the outer perimeter of the expected maximum detection envelope would be approximately 150 m.
The trigger distances for warning and dissuasion signals can be set at whatever ranges are projected to be effective to provide sufficient time and space for a successful deterrence response to occur. For this study, the calibrated deterrent-triggering distances were set differently for when the system registered a tracked object to be at high risk of entering the RSZ versus at lower risk because it was traveling below the RSZ. The boundary between the two zones was defined as depicted in Figure 5: the camera is positioned at the apex of an imaginary, upturned, partial cone, with the cross-sectional dimension of the cone defined by the lower arc of the RSZ plus a 10% buffer (illustrated by the red line in Figure 5). If the surveillance system registered a tracked object of appropriate size entering the inner high-risk airspace, it was calibrated to emit a warning signal as soon as the object passed close enough to initiate a detection (e.g., approximately 240 m if an eagle-sized object was fully exposed to the camera) and to emit a dissuasion signal once the object traveled within 170 m of the camera. If, however, a tracked object remained in the low-risk zone from the perspective of the camera, then the system was calibrated to emit an initial warning signal only if an eagle-sized object passed within 170 m of the camera, and a dissuasion signal only if an eagle-sized object passed within 100 m of the camera (Figure 6).
Upon detecting an object and registering that it had passed close enough to trigger a deterrent signal, the expected response time for the DTBird system to emit a relevant signal was <2 sec (DTBird Team 2016). Once triggered, a given signal continued to operate as long as the tracked object remained within the sound-trigger distance, and for an additional 25 sec beyond that, or in the case of warning signals, until the tracked object passed from the warning signal range into the dissuasion signal range.

Evaluating a Commercial-Ready Technology for Raptor Detection and Deterrence at a Wind Energy Facility in California
American Wind Wildlife Institute 23 September 17, 2018
Figure 5. DTBird Single-Camera Video Image Illustrating Conceptual Delineation of Boundary Between Low and High Collision Risk Zones Used to Define Deterrent Trigger Distances

Evaluating a Commercial-Ready Technology for Raptor Detection and Deterrence at a Wind Energy Facility in California
American Wind Wildlife Institute 24 September 17, 2018
Figure 6. Vertical Cross-Section (upper panel, with gray center illustrating rotor swept zone) and 3D Illustrations of Theoretical DTBird Detection (blue colors; shades represent different camera viewsheds), Warning Signal Trigger (green colors), and Dissuasion Signal Trigger (yellow colors) Envelopes for Golden Eagles with a Wingspan of 1.8 Meters

Evaluating a Commercial-Ready Technology for Raptor Detection and Deterrence at a Wind Energy Facility in California
American Wind Wildlife Institute 25 September 17, 2018
2.2.3 Digital Analysis Platform (DAP)
Once the system detected a relevant object, it recorded the detection event in the digital analysis platform (DAP) database and initiated a video extraction to document the event. The DAP is a web-based software interface developed by Liquen, which stores and displays information and videos of objects detected by the DTBird system in an on-line format accessible to registered users. For each detection event, the system automatically populates the DAP database with the following information about the event circumstances:
• Date and Hour: date and time (local internet time, including adjustment for daylight savings time, where relevant) of initial object detection, resolved to the second.
• Flight Length: duration of flight (sec), based on time elapsed between when an object was first detected and the last time the object was detected within one video record.
• Azimuth: direction (°) turbine nacelle was facing when initial detection event occurred, as reported by the turbine supervisory control and data acquisition (SCADA) system.
• Anemometer: wind speed (m/sec) when initial detection event occurred, as reported by turbine SCADA system.
• Rotor: 0 (rotor not spinning; i.e., <3 rpm) or 1 (rotor spinning; i.e., ≥3 rpm), as reported by turbine SCADA system.
• Lux: illuminance level (lumens/m2) when initial detection event occurred, as measured by camera-based sensors.
• Warning initiation (init.), Warning end, Dissuasion init., and Dissuasion end timestamps: start and stop times for when one or both deterrent signals was active, resolved to the second.
• Warning duration and Dissuasion duration times (sec): length of time that a given deterrent signal was active.
• First detection camera: the camera in which the object that initiated the relevant detection event was first detected.
Authorized analysts can augment the record by classifying the detected object (see Section 2.2.5), adding standard risk-exposure metrics, recording notes about the detection and, if relevant, associated deterrence events, and adding additional user-specific information in customizable data fields (see Sections 2.2.6 and 2.3.3.3). The DAP also allows analysts to simultaneously or independently view the video clips stored to represent the four camera viewsheds during the relevant detection event, as well as download the stored video clips from the DAP for archiving and viewing with other video playback software that supports, for example, frame-by-frame viewing, image zooming, and image enhancements. Analysts can also export the data stored in the DAP to spreadsheet format for further evaluation and analysis.
The system continues to track the object as long as it remains in detection range, recording in the same DAP record information about related deterrent-triggering events, if relevant, as well as other metrics to describe the event circumstances. The video recordings attached to the DAP record represent clips extracted from bulk video footage that is recorded for all cameras during all operational periods. The extracted clips begin 10 sec before the detection event occurred and continue for 25 sec after the tracked object was last detected by the system; clips from all four cameras are saved with every event record. Once the detection module begins tracking an object, camera networking allows that tracking to cross the viewsheds of additional cameras without triggering the creation of a new DAP event record. If the tracked object passes out of the detection range of all cameras again for more than 25 sec after it has been tracked once, subsequent detection after re-entry into the detection zone initiates a new DAP event

Evaluating a Commercial-Ready Technology for Raptor Detection and Deterrence at a Wind Energy Facility in California
American Wind Wildlife Institute 26 September 17, 2018
record, and the bird’s activities might result in additional deterrence events being added to this new record. Analysts have the option to later merge such records if they obviously pertain to the same bird.
When multiple objects pass into the viewsheds of a system’s cameras around the same time, the detection module may start tracking multiple objects simultaneously, or the detection and tracking of multiple objects may occur sequentially at slightly different times as each object proceeds close enough to the camera(s) to be registered as a target of interest based on its estimated size. In either case, only a single event record is recorded in the DAP, until such time as there are no objects tracked in any camera for a period of at least 25 sec. A similar scenario applies to the triggering of warning and dissuasion deterrent signals. The first of multiple objects registered as having crossed the relevant distance threshold triggers the deterrent signal (warning or dissuasion depending on location) and stimulates the recording of a trigger timestamp in the associated DAP detection event record. No more than three timestamps are recorded in a given event record: one for the initial detection event, one for the initial triggering of a warning signal (if relevant), and one for the initial triggering of a dissuasion signal (if relevant). When multiple objects are being tracked simultaneously, it often is not possible for the analyst to confidently determine which specific object triggered a given timestamp. For this reason we generally excluded multiple-bird records from the analysis of deterrence responses, because confident timestamp correlations were required for that purpose (see Section 2.2.6).
2.2.4 Video Review and Sampling Strategy
Between mid-December 2016, when the systems went online, and 31 August 2017, the DTBird systems recorded 877 detection events involving a UAV flight trial, 845 of which triggered a virtual deterrent signal. The systems recorded another 11,928 detection events that did not involve UAV flight trials, of which 6,264 triggered a deterrent signal. For the purpose of evaluating the detection and deterrent-triggering response characteristics of the DTBird system, we reviewed and classified all of the event records pertaining to the UAV flight trials. Screening all of the non-UAV event records was impractical, however. The recorded detection and deterrent-triggering activity was greatly inflated by many detections of common ravens (Corvus corax), other non-focal birds, some insects, and other aircraft (also see May et al. 2012, Aschwanden et al. 2015). Therefore, to support investigating the deterrence responses of in situ raptors, we applied a sampling strategy. For each DTBird installation, we randomly selected two days during December 2016 (operational period limited to 13 days) and 10 days during each subsequent month through August 2017, and we reviewed and classified the tracked objects associated with all of the detection events recorded on those days that triggered a deterrent signal. For a given DTBird installation, this sampling excluded days when UAV flight trials occurred, because on those days the deterrent signals were muted at the relevant turbine during all daylight hours. For each installation, we also randomly selected five non-UAV days per month and classified all detection-only events recorded on those days.
Approximately half of the screened and classified detection-only events occurred at times when the relevant turbine blades were not spinning. At such times, the deterrent signals did not broadcast regardless of how close a given target passed. The remaining 86 classified detection-only events occurred when the relevant turbine blades were spinning. Under this scenario, the lack of deterrent triggers reflected passage at detection distances beyond the trigger zones for deterrent signals (e.g., see Figure 6). Of the 6,748 detection events recorded during the study at times when the relevant rotor was spinning, 603 (9%) did not trigger a deterrent signal because the tracked objects remained beyond the deterrent trigger distances and zone of collision risk.
2.2.5 Classification of Detected Objects
The detection system records no automatically generated information about the nature of detected and tracked objects. Confidently classifying tracked objects detected by the DTBird system and recorded in

Evaluating a Commercial-Ready Technology for Raptor Detection and Deterrence at a Wind Energy Facility in California
American Wind Wildlife Institute 27 September 17, 2018
relevant video clips was challenging. Species-level identification proved straightforward only when birds passed relatively close to the cameras. For birds, the standard, generic classification categories in the DAP included very big (wingspan >1.5 m), big (0.75–1.5 m), medium (0.25–0.75 m), small (<0.25 m), and unknown. The classification of birds not identifiable to species into these generic size categories was a largely subjective undertaking by analysts, who focused on discerning behavioral and flight characteristic indicative of size (e.g., flapping style and rate, complexity of maneuvers, and turning radius while soaring). Analysts may also customize the classification categories to represent key species and species groups expected in a given facility location. For this study, we used primarily the following customized avian categories:
• Golden eagle (very big bird)
• Red-tailed hawk (big bird)
• Ferruginous hawk (big bird)
• American kestrel (medium bird)
• Turkey vulture (very big bird)
• Eagle / vulture (very big bird)
• Unknown buteo (big bird)
• Unknown falcon (big or medium bird)
• Unknown raptor (potentially very big, big, or medium bird, but mostly big/medium birds)
• Common raven (big bird)
Standard classifications in the DAP also included the false-positive category used to identify detection events not triggered by birds, including classification subcategories such as insect, aircraft, turbine blade, and sky artifact (dynamic, high contrast elements of moving cloud cover and raindrops sometimes trigger detections).
We also customized the classification codes to include UAV and Likely UAV, to support proper classification of those event records for purposes of our study. Upon classifying a DAP record as involving a UAV that we flew for our flight trials, we used a customized user variable field to classify the sky backdrop at the time the UAV was detected or triggered a deterrent signal. The classification categories were: fair sky (<25% cloud cover), partly cloudy (25–50%), mostly cloudy (50–75%), and overcast (>75%). Although small portions (1–7%) of every camera viewshed encompassed some landscape background, this was not a relevant category for our backdrop classifications, because the pixel-based DTBird targeting system does not support effective detection of birds or other objects flying against complex landscape backdrops (Liquen Consultoría Ambiental, personal communication, 2017). Although a potential limitation of the system, the notion is that birds moving against a landscape backdrop are flying low and out of range of the collision risk zone and, therefore, are not a tracking priority.
2.2.6 Classification of the Deterrence Responses of In Situ Raptors
To develop a dataset for evaluating the responses of in situ raptors to the deterrent signals, we applied a standardized approach to classifying the responses of most non-vulture raptors and unknown eagles/vultures identified in the screened video records, and a limited sample of confirmed turkey vultures. As described in Section 2.2.3, we generally excluded event records with multiple birds in view from our deterrence-response classification efforts (as did May et al. 2012), except in a few cases where the deterrent signaling could be unambiguously associated with an individual bird of interest.

Evaluating a Commercial-Ready Technology for Raptor Detection and Deterrence at a Wind Energy Facility in California
American Wind Wildlife Institute 28 September 17, 2018
Our sampling objective was to amass a temporally and taxonomically representative dataset sufficient to support a robust integrated assessment of the probability of effective deterrence for in situ golden eagles and other raptors as a group, as well as reasonable independent assessments for golden eagles, eagles/vultures as a combined group, and buteos (mostly red-tailed hawks). We also intended to focus independent attention on American kestrels, which are common fatalities at many wind-energy facilities; however, except when very close to a camera, confidently distinguishing kestrels from other longer-tailed raptors, such as harriers and accipiters, and from other similarly sized non-raptors, such as pigeons and doves, proved difficult.
To classify deterrence responses, we used the DAP and an on-screen protractor (Straffi 2016) to determine through 2D on-screen measurements whether a bird’s flight path diverged appreciably and away from the RSZ within 5 sec of a warning or dissuasion signal being emitted. For comparative purposes, similar to the approach Liquen personnel typically use to classify deterrence responses, we considered a sustained flight path divergence of >15° away from the deterrent signal that precluded passage through the overall spherical RSZ of the turbine as indicative of a meaningful avoidance response. We also examined the video footage for evidence of correlations between detectable changes in flapping pattern or flight style and emittance of warning and dissuasion signals.
Appendix A contains a step-by-step account of the classification process we used to categorize the responses of relevant raptors to the deterrent signals. The process incorporated several subjective and objective criteria for classifying the behavioral response of a given raptor upon exposure to a warning signal and/or dissuasion signal, culminating in a final classification of the response as one of the following:
Y Yes Bird reacted in a way that, based on the change in flight pattern and direction, reduced the risk of collision with the turbine blades
P Potential Bird appeared to react to signal, but response was not definitive enough to be confident that the bird was at less risk after signal emission
N No Bird reacted to signal (e.g., temporarily altered its flapping rate) but did not alter its flight path away from RSZ
Z Not relevant Bird did not visibly react to signal
U Unknown/ undetermined
Bird was already moving away from turbine when signal was emitted; the video or bird image quality was not favorable for determining the 3D reaction on a 2D video screen; or it simply was not possible to determine with any sense of confidence whether a reaction occurred or not due to other factors.
2.3 UAV Flight Trials and Data Processing
The UAV flight trials provided data for evaluating the performance of the DTBird detection and deterrent-triggering modules. We developed statistical models to describe how various UAV flight characteristics, environmental conditions, and visibility factors influenced the DTBird detection and deterrent-triggering response distances (see Section 2.4.1).
We ran the flight trials using two custom-made GPS-instrumented, fixed-wing, primarily foam-bodied UAVs that resembled a golden eagle in size and coloration, and had similar overall dimensions but different body and tail styles (Figure 7). Both UAVs were painted mostly brownish with lighter patches on the wings to resemble younger golden eagles. Both had wingspans of approximately 2 m, which is mid-range for golden eagles in North America (1.8–2.2 m), and flight weights (including battery packs) of

Evaluating a Commercial-Ready Technology for Raptor Detection and Deterrence at a Wind Energy Facility in California
American Wind Wildlife Institute 29 September 17, 2018
approximately 3 kilograms (kg), which is similar to a male golden eagle (overall species range in North America 2.5–6+ kg).
Figure 7. UAV Aircraft Used During the Study to Evaluate the Detection and Deterrent-Triggering Responses of the DTBird System. (a) left = UAV1; (b) right = UAV2.
The body style of UAV1 and, at just over 1.0 m in length, its overall body dimensions were most similar to an eagle (body length 0.7-0.9 m), whereas UAV2 had a different body style that was longer from nose to tail (1.4 m), but effectively presented a relatively compact, though deeper, main body profile (Figure 7). We included UAVID as a random variable in the statistical models (see Section 2.4.1) to account for potential variation in response distances that may have resulted from differences in UAV coloration, size, and body style. We hypothesized that the latter factors might resemble the effect of variation in the size and coloration of different eagles, including males and females, for example.
The battery-powered UAVs were driven by single propellers and were equipped with Pixhawk flight controllers (see https://www.pixhawk.org), which provided GPS tracking data with vertical and horizontal spatial accuracy of ±3 m at timestamped intervals of ≤1 sec (variable up to as high a rate as approximately 80 records/sec). The avionics recorded other data in each timestamped record to document the tracking, operational, and flight characteristics of the UAV, and the wind conditions
Evaluating a Commercial-Ready Technology for Raptor Detection and Deterrence at a Wind Energy Facility in California
American Wind Wildlife Institute 30 September 17, 2018
experienced during the flight. We offloaded the recorded avionics data after each day’s flight trials using Mission Planner software (ArduPilot Dev Team 2017) and a USB interface.
2.3.1 Sampling Design
To provide data for evaluating the spatial accuracy of the DTBird detection and deterrent-triggering systems, we orchestrated predefined series of UAV flight transects to yield representative sampling of accessible portions of the expected detection and deterrent-triggering response envelopes around each of the seven study turbines. We augmented these automated flight series with manually controlled flights designed to safely sample the low-altitude portions of response envelopes and to mimic variable soaring/circling flights.
The predetermined series of linear transects encompassed various distances from and orientations relative to the turbines, representative flight altitudes and trajectories, and a range of visibility conditions influenced by sun exposure and variable sky backdrops. We developed the transect layouts based on stratified random selection algorithms (depending on altitude, distance from turbine, and heading) and using tools in ArcGIS 10.5.1 (ESRI Inc., Redlands, CA) to select the spatially explicit transects and translate the information for implementing flight missions using Mission Planner. We developed the transect layouts by selecting vertical slices of envelope space randomly placed at different distances from, and orientations relative to, the focal turbines, and then randomly selecting individual linear transects from within those slices to represent different altitudes and flight trajectories spanning the range from 15° descents to 15° ascents. We further stratified the selection of transects to ensure representative sampling of both the overall detection/warning-trigger envelope and the inner dissuasion-trigger envelope. Appendix B includes a step-by-step account of the routine we used to select transects.
We laid out the individual transects to begin 50 m outside the theoretical maximum detection range of 240 m and proceed in linear fashion until reaching 50 m outside the detection envelope on the other side. In some cases, we further modified the start and end points and exit strategies of the automated flight transects to conform to the altitude limit mandated by the Federal Aviation Administration (FAA) for UAV flights (discussed further in Section 2.3.2), and to maintain safe altitudes above ground for operating the UAV. We prepared transects in batches of 100, corresponding to what we expected to accomplish during a four-hour flight trial. Figure 8 illustrates what approximately 100 transects looks like in relation to the theoretical 240-m maximum detection envelope at one of the study turbines.
2.3.2 Flight Operations and Logistics
We organized each batch of 100 turbine-specific transects into individual mission packages that could be orchestrated efficiently and would require close to a full UAV battery charge over a 30–40-minute operating period. A gap in active targeting of a given object (e.g., bird or UAV) of at least 25 sec is required for the DTBird system to register a new detection event. Therefore, to ensure that each new transect constituted a new sampling event, the automated flight sequences included a loiter flight protocol after each transect endpoint was reached. The loiter protocol involved navigating to one of several predetermined points located 500 m from the focal turbine (i.e., well outside of the detection envelope), circling there for 30 sec, and then heading for the next transect start point (e.g., see Figure 9).

Evaluating a Commercial-Ready Technology for Raptor Detection and Deterrence at a Wind Energy Facility in California
American Wind Wildlife Institute 31 September 17, 2018
Figure 8. Conceptual Illustration of Approximately 100 Randomly Selected UAV Flight Transects in Relation to the Theoretical Maximum DTBird Detection Envelope for Golden Eagles at 240 Meters Radial Distance from the Cameras on a Study Turbine
Figure 9. Example Layout of UAV Navigation Loiter Points and 200-Meter-Radius Placement Buffers (yellow circles) in Relation to Theoretical Maximum Detection Range for Golden Eagles (red circle), Overlain with Flight Tracks from a Half-Day Flight Trial
Evaluating a Commercial-Ready Technology for Raptor Detection and Deterrence at a Wind Energy Facility in California
American Wind Wildlife Institute 32 September 17, 2018
After packaging the 100 transects into 6–8 individual missions, we implemented a flight trial session at a given turbine by randomly selecting and running missions from the available pool created for that installation and sampling event. This approach ensured that conducting multiple sessions of variable length at the seven sites ultimately produced both sufficient and unbiased, randomized sampling of the detection and deterrent-triggering envelopes at each installation.
Our study design projected needing to fly at least 180 flight segments per response variable to provide a minimum of 10 samples per parameter to support building GLMMs that could include as many as 18 estimable parameters. We projected that each successful, full flight-trial field day would yield at least 100 transect samples, and that 13–15 successful flight trial days would yield far more than the projected minimum sample-size requirements.
All flight trials proceeded with an operations team comprising (a) a licensed pilot that flew the aircraft; (b) a “laptop pilot” that implemented automatic flight sequences in Mission Planner, provided support information to the pilot, and recorded other pertinent data; and (c) a skilled observer that ensured there were no adverse interactions with local raptors or other aircraft (see Appendix C for further detail about roles and responsibilities).
The maximum FAA-permitted altitude for UAV flights is 122 m (400 feet) agl or no more than 400 feet above structures, including wind turbines. Because of this limitation, we were able to use the UAVs to evaluate the DTBird detection systems only up to altitudes of 225.5 m agl (103.5 m upper rotor-swept height + 122 m altitude clearance). This limitation precluded testing and sampling approximately 1% of the expected 240-m-radius maximum detection envelope (top center). Of the 83-m-radius cross-sectional area omitted from coverage because of this limitation, the DTBird detection and targeting systems are unable to surveil the central 17-m-radius portion (see Figure 6). Therefore, although unimpeded sampling throughout the entire detection envelope would have been preferable, we think the altitude limitation was largely inconsequential for the study.
We conducted all flight trials with the focal turbine and adjacent turbines located within <350 m of the focal turbine curtailed to preclude adverse interactions between spinning turbine blades and the UAVs. This allowed flight transects to begin approximately 50 m outside of the lower bound of the expected maximum detection range for golden eagles (240 m), and leave an additional 50-m navigation buffer to allow for factors such as wind buffeting. Five of the seven DTBird installations required that a single adjacent turbine be curtailed during flight trials at those locations; no additional curtailments were required at the other two installations. We also ran all flight trials with the deterrent signals muted at the focal turbine, because effective communication among the operations team was not possible with the deterrents operating. Otherwise, however, the systems were set so that virtual deterrent-triggering events occurred and were recorded in the DAP as during normal operations.
Conducting this study required advanced planning and careful coordination with Avangrid staff. Appendix C contains a protocol summary and additional details about logistic feasibility and constraints.
2.3.3 Post-Flight Data Processing
In this section we outline the procedures followed to extract and translate the UAV avionics flight data, match relevant UAV avionics and DAP event data, refine the datasets by adding relevant covariates, and classify UAV flight segments as detected or not (see Appendix D for a protocol summary).
2.3.3.1 Extracting and Translating Avionics Data
Following the flight trials, we offloaded the avionics data from the UAV and used the custom software package TLogDataExtractor (Fernie 2012) to translate the data into a form compatible with spreadsheet

Evaluating a Commercial-Ready Technology for Raptor Detection and Deterrence at a Wind Energy Facility in California
American Wind Wildlife Institute 33 September 17, 2018
and GIS-based manipulation and rendering. To support matching the UAV data with detection-event data recorded in the DAP, it was necessary to filter the avionics records and select only one record to stand for each second of operation. After confirming that within-second variation of important flight parameters was of little consequence for our investigations, we used an R programming script to randomly select one record to represent each 1-sec period for use in analyses. We then used ArcGIS tools to remove from the UAV data all tracking points located more than 400 m lateral distance from the focal turbine; i.e., points associated with extra-limital travel to and from loiter points and the loitering activity itself.
2.3.3.2 Matching UAV and DTBird Records
After we completed screening and classifying the DAP records (Sections 2.2.3–2.2.6), and extracting and post-processing the UAV avionics data (Section 2.3.3.1), we integrated the DAP and avionics data by matching timestamps (resolved to the 1-sec level) to join relevant DAP event records to appropriate UAV avionics records. To ensure that each individual event was matched with the appropriate UAV coordinate record, we split the DAP event records into separate records for detection, warning-trigger, and dissuasion-trigger events, each with its own timestamp recorded in the original integrated DAP record. After completing the initial matches, we reviewed the combined file and GIS-based depictions of relevant flights and matched event records to search for and correct any erroneous matches.
2.3.3.3 Refining Datasets and Adding Covariates
After removing extra-limital UAV tracking points as described above, we used ArcGIS tools to calculate for each UAV GPS point various supplementary parameters to augment the avionics data, including lateral and line-of-sight distances from UAV to turbine at camera height, elevation angle above or below horizontal from camera to UAV, and direction from turbine to UAV.
In addition, to evaluate how solar intensity and glare influenced the DTBird detection and deterrent-triggering response distances, we used various tools to estimate solar irradiation levels and positioning at relevant event times. Specifically, we used the points solar radiation tool in ArcGIS Spatial Analyst to estimate the solar irradiation level (T0) impinging on the UAV at times when the aircraft triggered a detection or deterrent-triggering event. We also used a solar position calculator (National Renewable Energy Laboratory 2003, Reda and Andreas 2004) to obtain metrics describing the sun’s position in the sky relative to a given camera position at times when relevant detection and deterrent-triggering events occurred. The two metrics we were interested in were solar azimuth angle (compass direction of sun relative to camera) and solar elevation angle (vertical angle to sun, ranging from 0° [on the horizon] to 90° [straight up vertical). We used the calculator to estimate these metrics for each UAV record that we matched to a DAP event.
2.3.3.4 Identification of False Negatives
Preparing the dataset for quantifying false negatives required using ArcGIS 3D Analyst to clip out all tracking data related to loiter-point activity and segment the remaining flight data into individual flight paths that represented independent transect samples suited to evaluating the probability of detection. To accomplish this, we used 3D Analyst to plot the locations of all of the UAV positions matched with a DTBird event. Based on these plots, we developed dome-shaped clipping masks to truncate all of the UAV flight paths 10–20 m farther way from the turbine than the most distant DTBird match point. The selected clipping masks typically extended 250–300 m line-of-sight distance from the turbine center point at 4 m agl (i.e., the approximate position of the DTBird cameras on the turbine tower).
This clipping and segmentation approach resulted in a good balance between maximizing elimination of extraneous flight data related to loiter point navigation and minimizing elimination of valid flight transects that passed through the outer fringes of the detection envelope but were not detected. The output dataset

Evaluating a Commercial-Ready Technology for Raptor Detection and Deterrence at a Wind Energy Facility in California
American Wind Wildlife Institute 34 September 17, 2018
coded flight paths with a matched detection event as “detected” and those without a matched detection event as “not detected.” This classification data then formed the basis for quantifying the probability of detection at each of the DTBird turbines.
2.4 Analytical Methods
2.4.1 Modeling DTBird Detection and Deterrent-Triggering Distances as a Function of UAV Flight Characteristics and Environmental Covariates
We used GLMMs to evaluate how various UAV flight characteristics, location parameters, and lighting and visibility factors influenced the DTBird detection and deterrent-triggering response distances during the UAV flight trials. The response variable for this analysis was the line-of-sight distance between the UAV and the closest DTBird camera at the time a detection or deterrence event occurred. We calculated the distances based on the UAV GPS coordinates at the time of the event, using tools in ArcGIS 3D Analyst. Flight samples included in these analyses were necessarily those that triggered a relevant DTBird response at any distance.
Rather than undertake independent modeling efforts to potentially discern subtle differences between how different covariates may have influenced the three response types (detection, warning, and dissuasion events), we instead included EventType as a fixed-effect predictor in the models. This accounted for the expected differences in average response distances among the three categories, while enabling a more robust integrated evaluation of the overall influences of relevant covariates on the system’s response performance. We included as individual sample points all detection, warning-trigger, and dissuasion-trigger events that were separated in time by at least 1 sec. For cases where a warning or dissuasion event occurred simultaneously with a detection event, we retained only the detection event record. This meant that interpreting the comparative results for the three event types required attention to the nature of differences in the sample representation for each category (see Section 3.3). The modeling of deterrent-trigger events reflected only a subset of all instances when a deterrent signal was triggered; i.e., only those cases where a warning or dissuasion signal was triggered at a different time (≥1 sec later) than the initial detection event.
We acknowledge that the dataset derived in this manner did not represent a collection of truly independent observations, because all the deterrent-trigger events were preceded by a related detection event. However, even UAV movements spanning only 1 sec frequently resulted in noteworthy spatial displacements (>10 m) and attendant variation in modeled predictors. Therefore, we felt justified in including all events that occurred at different points in time in the analysis to bolster our ability to discern meaningful relationships between event response distances and relevant predictor variables (see below).
To fit the response distance data as described above, we built GLMMs with a Gaussian distribution and log-link function to ensure positive predictions using the ‘glmmADMB’ package in R (function glmmadmb; Fournier et al. 2012, Skaug et al. 2015), modeling Turbine ID as a random effect and EventType as a fixed-effect predictor. The full suite of variables considered as potential predictive factors in the GLMMs was as follows:
Random Effects
TurbineID: D1, D4, D8, E11, T13, U7, or V17
Fixed Effects
UAVID: categorical; UAV1 (used January–March; Figure 7a) or UAV2 (used in August; Figure 7b)
EventType: detection, warning signal, or dissuasion signal (categorical)

Evaluating a Commercial-Ready Technology for Raptor Detection and Deterrence at a Wind Energy Facility in California
American Wind Wildlife Institute 35 September 17, 2018
CloudCover: fair, partly cloudy, mostly cloudy, or overcast (as defined in Section 2.2.5) (categorical)
WindSpeed: wind speed impinging on UAV as measured in the ground plane (avionics: m/sec; continuous)
SunElevAngle: angle above horizontal from camera to sun (GIS: 0–90° converted to radians; continuous); second-order term also considered
SunAzimuth: azimuth angle from camera to sun (GIS: 1–360° converted to radians; continuous); second-order term also considered
SolarIrrad: solar irradiation intensity directed at UAV and camera (GIS: watt-hours/m2; continuous) second-order term also considered
UAVElevAngle: angle above horizontal from camera to UAV (GIS: 0–90° converted to radians; continuous)
DirFromTurbine: direction from turbine to UAV (GIS: 1–360° converted to radians; continuous)
RelAltitude: UAV altitude relative to turbine base (avionics: 0 up to ~225 m; continuous)
COG: UAV course over ground (avionics: 1–360° compass heading, converted to radians; continuous)
GroundSpeed: UAV ground speed (avionics: m/sec; continuous)
ClimbRate: UAV climb rate (avionics: m/sec; continuous); second-order term also considered
RollAngle: degree to which UAV has rolled to one side or the other (avionics: radians, theoretically from –2Pi [rolled 180° left] to +2Pi [rolled 180° right], but limited to approximately <60° roll left or right; converted to absolute values for analysis; continuous)
PitchAngle: degree to which UAV has tipped up or down relative to the direction of travel (avionics: radians, theoretically from –2Pi [pitched 180° downward] to +2Pi [pitched 180° upward], but limited to approximately <30° up or down; converted to absolute values for analysis; continuous)
Because the predictor variables were on different scales, we centered and scaled all continuous predictors (listed above) after applying necessary transformations. We transformed roll and pitch angles to absolute values, because we expected that rolling left versus right, and pitching up versus down would modify exposure of the UAV profile to the camera similarly, dependent on travel direction. For the three variables recorded in degrees and for which the potential values ranged around the compass (DirFromTurbine, SunAzimuth, and COG), we transformed the values using sine(x) and cosine(x) transformations, with the sine-transformed predictor representing a west (negatives values) to east (positive values) vector, and the cosine-transformed predictor representing a south (negatives values) to north (positive values) vector.
In addition to modeling the main fixed effects, we evaluated second-order terms for SolarIrrad, SunAzimuth, SunElevAngle, and ClimbRate. For the sun variables, we hypothesized that both low and high exposure to the sun might reduce detectability and decrease response distances. For ClimbRate, we expected that both high positive (ascending trajectory) and low negative (descending trajectory) rates would translate to greater exposure of the UAV profile to the cameras and thereby result in reduced response distances.

Evaluating a Commercial-Ready Technology for Raptor Detection and Deterrence at a Wind Energy Facility in California
American Wind Wildlife Institute 36 September 17, 2018
We also evaluated the explanatory power of the following two-way interactions:
EventType * UAVElevAngle2 and EventType * RelAltitude: meant to capture expected variation in response distances resulting from the differential system calibration settings for detection, warning-signal triggering, and dissuasion-signal triggering events.
UAVElevAngle2 * RelAltitude: meant to capture potential variation in response distances related to the interactive influence of camera viewing angle and UAV altitude on DTBird’s ability to effectively detect and track an object of interest.
CloudCover * SolarIrrad2: meant to capture potential variation in response distances related to the interactive influence of variable cloud cover and solar irradiation intensity in affecting how ambient lighting and sun glare influence DTBird’s ability to effectively detect and track an object of interest.
SunAzimuth * SunElevAngle: a potential option for capturing variation in response distances related to how sun positioning and attendant effects on ambient lighting and sun glare influence DTBird’s ability to effectively detect and track an object of interest.
ClimbRate2 * RollAngle, ClimbRate2 * WindSpeed, WindSpeed * RollAngle, WindSpeed * PitchAngle, and PitchAngle * RollAngle: potential options for capturing variation in response distances related to how buffeting winds, flight trajectory, and flight stability affect the degree to which a target’s profile is exposed to the DTBird cameras, which in turn influences DTBird’s ability to effectively detect and track an object of interest.
We decided to forgo consideration of more complex interactions, because (1) the model fit without them was already very high, with strong diagnostic validation of meeting necessary model assumptions; and (2) applying logical interpretations to the higher-order interactions generally proved untenable.
Development of candidate model sets should be guided as much as possible by a thorough understanding of the system being studied (Burnham and Anderson 2010). Because this was a largely novel undertaking, before beginning the study we had little concrete understanding of the factors that might affect performance of the DTBird detection and deterrence systems. Therefore, we constructed candidate model sets to evaluate based in large part on insight gained during the flight trials. The analysis consisted of evaluating candidate models using Akaike’s Information Criteria corrected for small sample sizes (AICc), as well as other parameter-specific statistical tests and goodness-of-fit diagnostics, to determine which combination of predictor variables best explained variation in the observed response distances. Given the large number of predictors and unbalanced categorical factors with some groups having relatively small sample sizes, we used AICc to compare candidate models to avoid overfitting. We compared both step-up and step-down model-building procedures and used the following criteria and metrics to select the best model: AICc scores; R2 values for GLMMs (Nakagawa and Schielzeth 2013); ANOVA-based comparisons of nested candidate models; parsimony; interpretability; and residual plots, Shapiro tests for normally distributed residuals, and other diagnostics to ensure conformity to model assumptions and to avoid multicollinearity among the predictor variables (e.g., see Symonds and Moussalli 2011, Mazerolle 2017, R Core Team 2017). We evaluated for final model selection using AICc only models that met the assumptions of GLMMs, and all analytical approaches were compatible and validated the conclusions of our final model. We also compared the predicted values from the final candidate model against the observed data using training and validation data to ensure at least 90% accuracy in predictions and an appropriate fit of the selected model.
Along with other diagnostic considerations and evaluation of AICc scores as indicators of comparative explanatory power, we carefully evaluated potential combinations of predictors to avoid the confounding effects of including highly correlated and collinear predictors. We checked for collinearity between

Evaluating a Commercial-Ready Technology for Raptor Detection and Deterrence at a Wind Energy Facility in California
American Wind Wildlife Institute 37 September 17, 2018
predictors by examining Cholesky decompositions of correlation matrixes to look for collinear patterns in matrix diagonals (e.g., see Hawkins and Eplett 1982, Pourahmadi 2007), and avoided variable combinations that produced variance inflation factors (VIFs) >4 (Zuur et al. 2010).
2.4.2 Quantifying Probability of Detection Based on UAV Flight Trials
For this study, we did not undertake complex statistical modeling to evaluate the influence of flight and environmental covariates on the probability of detection (i.e., with false negatives included), preferentially focusing this level of inquiry on the response-distance analysis described above (also see Appendix E). However, upon noticing in the detection data an apparently strong negative effect of bright sun, we conducted a logistic regression analysis to evaluate the interplay of hour of the day and transect exposure direction on the probability of a successful detection. We hypothesized that the probability of detection would be lower for transects that passed primarily south of the DTBird monitoring systems, and that the problematic exposure direction would shift during the day from east to west with the sun. To accomplish this analysis, we used ArcGIS tools to calculate the direction from the turbine to each individual GPS point along a given flight path, and circular statistics to calculate the average direction of exposure for each flight segment (Zar 1998).
After calculating the average exposure direction for each independent flight segment, we conducted a logistic regression analysis with Detected or Not Detected as the binary response variable, and Hour (e.g., 0900 or 1500 H Pacific Standard Time [PST]; using majority value if the flight segment overlapped two hourly periods) and ExposureDirection as main effects.
Given that cameras of a given number were oriented in similar directions at all seven of the DTBird installations, to further bolster insight about the degree to which exposure to direct sun in the south influenced detection probabilities, we compared the DTBird first-detection-camera event recording rates for UAVs during the flight trials, for all non-UAV detections, and for all detection events combined. We also graphically portrayed overall detection activity and UAV detection activity by camera across hours of the day to further evaluate whether there appeared to be spatial and temporal patterns in the first-detection-camera event rates that were indicative of the solar exposure effects.
Analyzing the distribution of response distances also enabled calculating the probability of detection within specific distance bands. We estimated the detection probability at different distances from the turbine by dividing all independent UAV flight segments into 30-m distance bands based on the average distance to the turbine from all points on the flight segment. We then calculated the probability of detection in each distance band as the proportion of flight segments classified in the distance band that resulted in a detection event.
2.4.3 Quantifying Probability of Deterrence Based on Evaluation of DTBird Video Records of In Situ Raptors
We used logistic regression to evaluate how the probability of deterrence (binomial response variable: successful deterrence or not) varied from month to month between January and August. We evaluated models for all raptors combined, buteos, eagles/vultures as a group, and golden eagles alone. The successful response category included deterrence responses that we classified (see Section 2.2.6) as effective (Y) and potentially effective (P), whereas the unsuccessful category included responses we classified as ineffective (N) or no response (Z) (see Section 2.2.6). We conducted independent analyses for responses to warning signals and responses to dissuasion signals, but also conducted a combined-response analysis with the response variable indicating whether the warning and dissuasion signals acting solo or in combination successfully deterred the raptor from entering the RSZ of the relevant turbine (e.g., see May et al. 2012).

Evaluating a Commercial-Ready Technology for Raptor Detection and Deterrence at a Wind Energy Facility in California
American Wind Wildlife Institute 38 September 17, 2018
We also included wind speed as a covariate in this analysis, because the DTBird system attached that information to each event record, and because we thought that (1) variation in the average wind speed could influence a bird’s ability to hear and respond to the deterrent signals, and (2) the interplay of deterrent signals and turbine rotation speed could influence how a bird responds to the signals. The analyses included Month and WindSpeed as main effects and an interaction term.
2.4.3.1 Potential Influence of Habituation
The overall effectiveness of deterrent signals may depend on whether birds exposed to the signals repeatedly habituate to them (May et al. 2015, Sinclair and DeGeorge 2016). Assuming the objective is deterring birds from entering the RSZ, habituation could be either positive or negative. Positive habituation could occur if birds either (a) responding more quickly to the initial warning signal once they learn that a more irritating dissuasion signal follows if they do not move away quickly or (b) avoiding the installation turbines all together once they learn that annoying sounds emanate from them. Conversely, negative habituation could occur if birds get used to hearing the warning and dissuasion signals and begin to ignore them because they do not perceive turbines as a threat. In either case, the potential for habituation should apply more strongly to permanently or seasonally resident birds than for short-term transient birds. However, for purposes of this study, we generally had no basis for distinguishing residents from transients, other than noting the occurrence of seasonal residents, such as an occasional ferruginous hawk during winter.
To provide insight about the possibility of habituation occurring among in situ raptors, we included Month as a factor in the statistical model described above to determine if trends through time were evident in the probability of deterrence. Our sampling of DTBird video records extended only from late winter through August, so while the screened records spanned the spring period when winter residents depart and transient migrants may pass through, they only marginally overlapped the relatively busy late-summer dispersal and fall migration period. Therefore, although variation in the representation of resident and transient raptors might have confounded the evaluation to some degree, the first and last few months of the analyzed dataset likely provided a good initial representation of the resident raptor population for purposes of evaluating potential trends in the average deterrence rate that may be indicative of habituation.
2.4.3.2 Sample-Size Considerations
When using logistic generalized linear models (GLMs), simulation studies have suggested that a minimum of 10 responses (successes or failures, but not both combined) is needed per independent variable to avoid major statistical integrity problems and provide reasonable statistical power for detecting differences (Peduzzi et al. 1996, Vittinghoff and McCulloch 2006). These authors did not evaluate categorical variables, so we assumed that a minimum of 10 responses is needed for each estimable parameter for each variable; i.e., 10 responses for each continuous variable, and 10 responses each for the n–1 categories of a categorical variable.
Before undertaking this study, we had little information on expected deterrence response rates. Estimates from previous studies range from a 7% positive deterrence response to 82% of bird flights showing visible responses (May et al. 2012, Hanagasioglu et al. 2015). A middle-of-the-road projection of a 50% success rate translates to needing at least 20 successful deterrence responses per estimated parameter to compose a solid logistic GLMM. Based on this standard, our deterrence-response video sampling protocol produced enough samples to conduct the analyses described above for all raptors combined and for buteos, eagles/vultures, and unidentified raptors as individual groups (see Sections 3.1 (table 2) and 3.5).

Evaluating a Commercial-Ready Technology for Raptor Detection and Deterrence at a Wind Energy Facility in California
American Wind Wildlife Institute 39 September 17, 2018
2.4.4 Estimating Risk Reduction from Deploying the DTBird System
The Bayesian risk analysis approach described in USFWS (2013) and New et al. (2015) is used to estimate fatality risk for eagles using existing information on eagle activity and collision risk to estimate annual fatalities. However, we quickly discovered that there was essentially a linear relationship between reductions in the exposure rate and resulting reductions in the estimated fatality rate. By simply quantifying the expected reduction in collision risk as the product of the estimated probability of DTBird detecting an object (a UAV in this case) and the estimated probability of DTBird deterring a golden eagle (or other surrogate species or species grouping) we calculated an index of the expected risk reduction, without having to run the actual Bayesian model to estimate that risk reduction.
For DTBird to cause effective avoidance behavior in an approaching eagle, three events must occur: (1) DTBird must detect the incoming eagle; (2) detection must trigger the DTBird deterrence system to emit warning and/or dissuasion signals; and (3) the incoming eagle must react to the deterrent signals in a manner that reduces risk of collision. The effectiveness of DTBird in achieving event (1) constitutes the detection probability. The effectiveness of DTBird in achieving events (2) and (3) constitutes the deterrence probability.
We estimated the detection probability as the proportion of UAV flights that DTBird detected when the UAV passed through relevant airspace (see Sections 2.4.2 and 3.4). We estimated the deterrence probability based on data collected for in situ raptors detected by DTBird (see Sections 2.4.3 and 3.5), as the proportion of sampled birds that exhibited relevant avoidance behavior in response to the warning and/or dissuasion signals. The product of the estimated detection and deterrence probabilities then equaled the probability of avoiding entry into the collision risk zone and determined the difference in estimated collision risk from deployment of the DTBird system. We generated the estimate of detection probability as the mean ± standard deviation (SD) for seven turbine-specific values. Limited sample sizes restricted our ability to generate turbine-specific estimates as a basis for incorporating uncertainty in the overall estimate of deterrence probability. This limitation was relatively unimportant, however, because we generated a range of estimates to reflect uncertainty in species classification and our ability to confidently classify deterrence responses and incorporated this uncertainty in the projections of risk reduction.
An estimate of the probability that a bird entering the risk zone results in a collision also is required to render an accurate prediction of reduced fatalities, but we were unable to estimate this parameter with data collected during the study. An extensive observational study coupled with standardized fatality monitoring, or an extensive GPS-tracking study of in situ birds, would be required to quantify the proportion of flights in the risk zone that result in collisions.
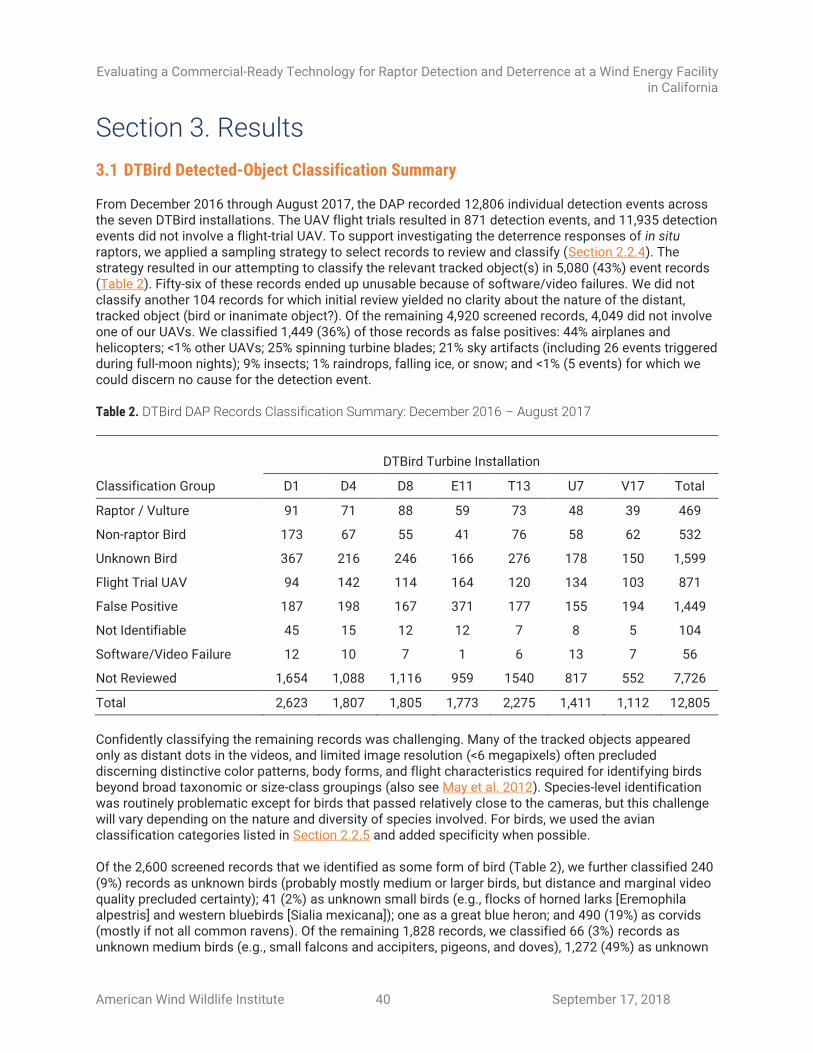
Evaluating a Commercial-Ready Technology for Raptor Detection and Deterrence at a Wind Energy Facility in California
American Wind Wildlife Institute 40 September 17, 2018
Section 3. Results
3.1 DTBird Detected-Object Classification Summary
From December 2016 through August 2017, the DAP recorded 12,806 individual detection events across the seven DTBird installations. The UAV flight trials resulted in 871 detection events, and 11,935 detection events did not involve a flight-trial UAV. To support investigating the deterrence responses of in situ raptors, we applied a sampling strategy to select records to review and classify (Section 2.2.4). The strategy resulted in our attempting to classify the relevant tracked object(s) in 5,080 (43%) event records (Table 2). Fifty-six of these records ended up unusable because of software/video failures. We did not classify another 104 records for which initial review yielded no clarity about the nature of the distant, tracked object (bird or inanimate object?). Of the remaining 4,920 screened records, 4,049 did not involve one of our UAVs. We classified 1,449 (36%) of those records as false positives: 44% airplanes and helicopters; <1% other UAVs; 25% spinning turbine blades; 21% sky artifacts (including 26 events triggered during full-moon nights); 9% insects; 1% raindrops, falling ice, or snow; and <1% (5 events) for which we could discern no cause for the detection event.
Table 2. DTBird DAP Records Classification Summary: December 2016 – August 2017
DTBird Turbine Installation
Classification Group D1 D4 D8 E11 T13 U7 V17 Total
Raptor / Vulture 91 71 88 59 73 48 39 469
Non-raptor Bird 173 67 55 41 76 58 62 532
Unknown Bird 367 216 246 166 276 178 150 1,599
Flight Trial UAV 94 142 114 164 120 134 103 871
False Positive 187 198 167 371 177 155 194 1,449
Not Identifiable 45 15 12 12 7 8 5 104
Software/Video Failure 12 10 7 1 6 13 7 56
Not Reviewed 1,654 1,088 1,116 959 1540 817 552 7,726
Total 2,623 1,807 1,805 1,773 2,275 1,411 1,112 12,805
Confidently classifying the remaining records was challenging. Many of the tracked objects appeared only as distant dots in the videos, and limited image resolution (<6 megapixels) often precluded discerning distinctive color patterns, body forms, and flight characteristics required for identifying birds beyond broad taxonomic or size-class groupings (also see May et al. 2012). Species-level identification was routinely problematic except for birds that passed relatively close to the cameras, but this challenge will vary depending on the nature and diversity of species involved. For birds, we used the avian classification categories listed in Section 2.2.5 and added specificity when possible.
Of the 2,600 screened records that we identified as some form of bird (Table 2), we further classified 240 (9%) records as unknown birds (probably mostly medium or larger birds, but distance and marginal video quality precluded certainty); 41 (2%) as unknown small birds (e.g., flocks of horned larks [Eremophila alpestris] and western bluebirds [Sialia mexicana]); one as a great blue heron; and 490 (19%) as corvids (mostly if not all common ravens). Of the remaining 1,828 records, we classified 66 (3%) records as unknown medium birds (e.g., small falcons and accipiters, pigeons, and doves), 1,272 (49%) as unknown

Evaluating a Commercial-Ready Technology for Raptor Detection and Deterrence at a Wind Energy Facility in California
American Wind Wildlife Institute 41 September 17, 2018
big birds, and 21 (1%) as unknown very big birds (eagles or vultures). The big bird classification category likely included many common ravens, many buteos, some eagles, a few large falcons, and possibly a few northern harriers.
Of the 469 records (18% of all bird records) that we were able to confidently classify as some form of raptor or vulture, we were able to identify to species 98 (21%) of those records, including 52 golden eagles (Table 4). Most (59%) of the other raptor/vulture records remained classified only as unknown raptors, but we were able to confidently classify 87 (18%) as some form of buteo, with most of those red-tailed hawks but including at least a few ferruginous hawks.
The overall DTBird event-recording rate increased from January through March, declined steadily after that through July, and then increased again slightly in August (Figure 10). Based on our equitable sampling of the records across months, the numbers of confirmed bird detections followed a similar pattern, whereas the number of false positives was relatively high December through January, but lower after that (Figure 10).
Table 3. DTBird DAP Avian Records Classification Summary
DTBird Turbine Installation
Species / Group D1 D4 D8 E11 T13 U7 V17 Total
Raptor / vulture 39 59 73 91 71 88 48 469
Common raven / corvid 151 64 55 38 69 52 61 490
Great blue heron (Ardea herodias) 1 1
Very big bird (wingspan >1.5 m)
2 1 1 1 11 2 3 21
Big bird (wingspan ~0.75–1.5 m)
280 168 206 117 238 144 119 1,272
Medium bird (wingspan ~0.25–0.75 m)
21 7 8 11 12 3 4 66
Small bird (wingspan ~<0.25 m)
14 2 2 3 3 1 25
Flock of small birds 8 1 4 3 16
Unknown bird 64 40 31 37 15 29 24 240
Total 631 354 389 266 425 284 251 2,600
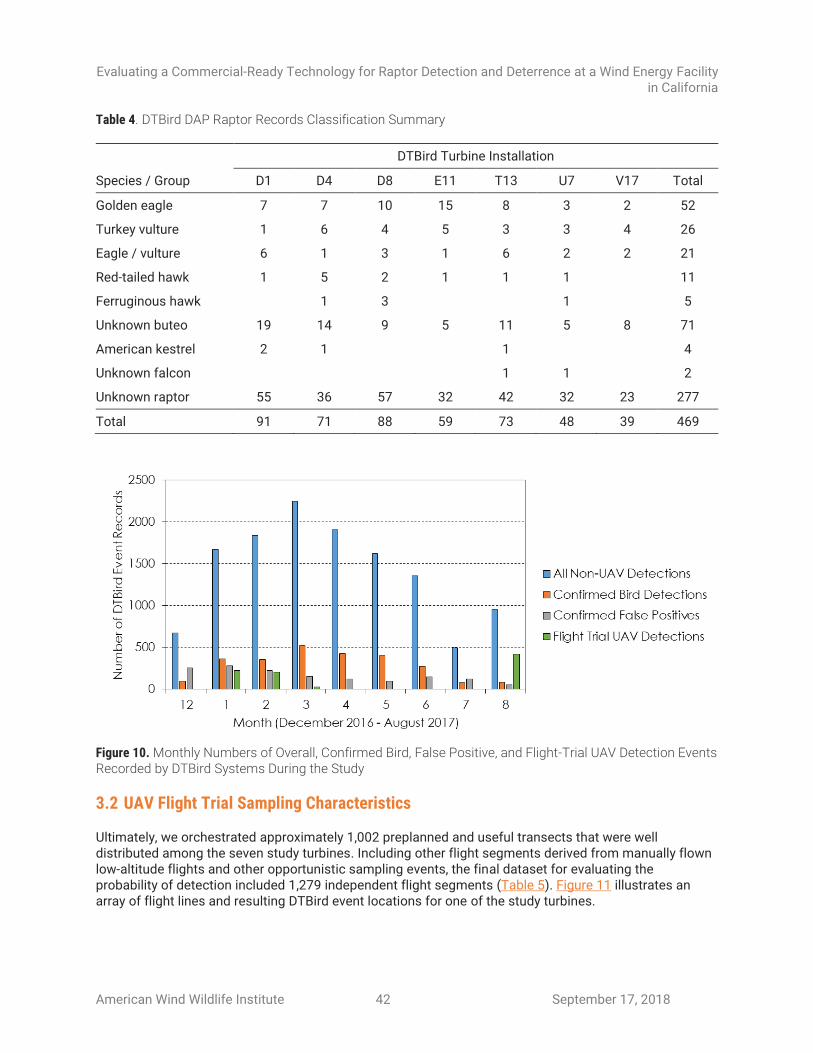
Evaluating a Commercial-Ready Technology for Raptor Detection and Deterrence at a Wind Energy Facility in California
American Wind Wildlife Institute 42 September 17, 2018
Table 4. DTBird DAP Raptor Records Classification Summary
DTBird Turbine Installation
Species / Group D1 D4 D8 E11 T13 U7 V17 Total
Golden eagle 7 7 10 15 8 3 2 52
Turkey vulture 1 6 4 5 3 3 4 26
Eagle / vulture 6 1 3 1 6 2 2 21
Red-tailed hawk 1 5 2 1 1 1 11
Ferruginous hawk 1 3 1 5
Unknown buteo 19 14 9 5 11 5 8 71
American kestrel 2 1 1 4
Unknown falcon 1 1 2
Unknown raptor 55 36 57 32 42 32 23 277
Total 91 71 88 59 73 48 39 469
Figure 10. Monthly Numbers of Overall, Confirmed Bird, False Positive, and Flight-Trial UAV Detection Events Recorded by DTBird Systems During the Study
3.2 UAV Flight Trial Sampling Characteristics
Ultimately, we orchestrated approximately 1,002 preplanned and useful transects that were well distributed among the seven study turbines. Including other flight segments derived from manually flown low-altitude flights and other opportunistic sampling events, the final dataset for evaluating the probability of detection included 1,279 independent flight segments (Table 5). Figure 11 illustrates an array of flight lines and resulting DTBird event locations for one of the study turbines.
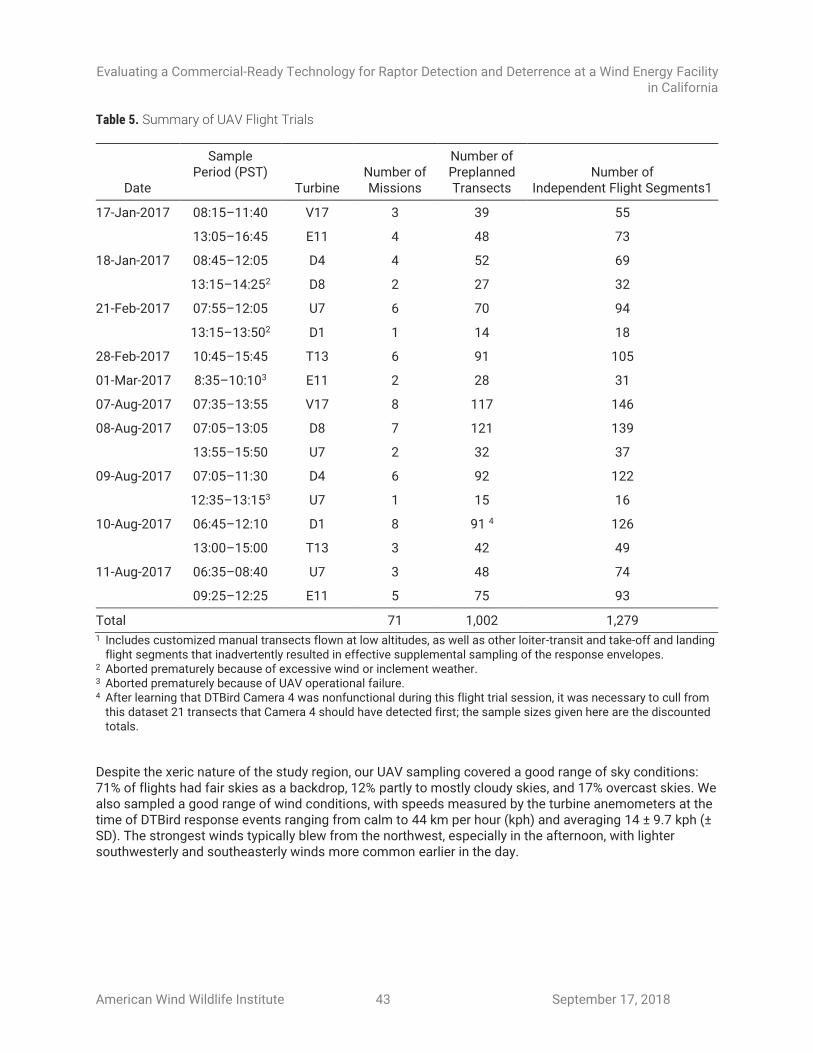
Evaluating a Commercial-Ready Technology for Raptor Detection and Deterrence at a Wind Energy Facility in California
American Wind Wildlife Institute 43 September 17, 2018
Table 5. Summary of UAV Flight Trials
Date
Sample Period (PST)
Turbine Number of Missions
Number of Preplanned Transects
Number of Independent Flight Segments1
17-Jan-2017 08:15–11:40 V17 3 39 55
13:05–16:45 E11 4 48 73
18-Jan-2017 08:45–12:05 D4 4 52 69
13:15–14:252 D8 2 27 32
21-Feb-2017 07:55–12:05 U7 6 70 94
13:15–13:502 D1 1 14 18
28-Feb-2017 10:45–15:45 T13 6 91 105
01-Mar-2017 8:35–10:103 E11 2 28 31
07-Aug-2017 07:35–13:55 V17 8 117 146
08-Aug-2017 07:05–13:05 D8 7 121 139
13:55–15:50 U7 2 32 37
09-Aug-2017 07:05–11:30 D4 6 92 122
12:35–13:153 U7 1 15 16
10-Aug-2017 06:45–12:10 D1 8 91 4 126
13:00–15:00 T13 3 42 49
11-Aug-2017 06:35–08:40 U7 3 48 74
09:25–12:25 E11 5 75 93
Total 71 1,002 1,279 1 Includes customized manual transects flown at low altitudes, as well as other loiter-transit and take-off and landing
flight segments that inadvertently resulted in effective supplemental sampling of the response envelopes. 2 Aborted prematurely because of excessive wind or inclement weather. 3 Aborted prematurely because of UAV operational failure. 4 After learning that DTBird Camera 4 was nonfunctional during this flight trial session, it was necessary to cull from
this dataset 21 transects that Camera 4 should have detected first; the sample sizes given here are the discounted totals.
Despite the xeric nature of the study region, our UAV sampling covered a good range of sky conditions: 71% of flights had fair skies as a backdrop, 12% partly to mostly cloudy skies, and 17% overcast skies. We also sampled a good range of wind conditions, with speeds measured by the turbine anemometers at the time of DTBird response events ranging from calm to 44 km per hour (kph) and averaging 14 ± 9.7 kph (± SD). The strongest winds typically blew from the northwest, especially in the afternoon, with lighter southwesterly and southeasterly winds more common earlier in the day.

Evaluating a Commercial-Ready Technology for Raptor Detection and Deterrence at a Wind Energy Facility in California
American Wind Wildlife Institute 44 September 17, 2018
Figure 11. Example Array of UAV Flight Tracks (blue dots) and Resulting DTBird Detection (yellow dots, many covered by co-occurring red or orange dots) and Deterrence (orange = warning signal, red = dissuasion signal) Event Locations from a Half-Day Flight Trial Session at a Study Turbine. Inner Sphere Represents Rotor Swept Zone. Outer Hemisphere Represents 240-m Theoretical Maximum Detection Range for Eagles.
3.3 Detection and Deterrent-Triggering Response Distances as a Function of Flight and Landscape Characteristics
As expected, common outer boundaries of the calibrated, theoretical response envelopes (see Figure 6) frequently resulted in the simultaneous triggering of detections and warning signals (n = 313 cases), and detections and dissuasion signals (n = 381 cases), whereas there were no cases when only a warning and a dissuasion signal were triggered simultaneously. Unexpectedly, the DTBird system simultaneously recorded all three event types for a given UAV occurrence on 31 occasions. Though theoretically possible where the outer bounds of the warning and dissuasion response envelopes converge on the outer lower margins of the overall detection envelope (Figure 6), we expected the probability of that occurring to be very low.
The filtered dataset used to analyze the influence of various predictors on the DTBird detection and deterrent-triggering response distances included 856 detection events, 114 unique warning-trigger events (25% of all recorded warning-trigger events), and 244 unique dissuasion-trigger events (39% of all recorded dissuasion-trigger events). The modeling results for deterrent-trigger events represented only those cases where a deterrent signal was triggered subsequent to an initial detection event and must be interpreted accordingly.

Evaluating a Commercial-Ready Technology for Raptor Detection and Deterrence at a Wind Energy Facility in California
American Wind Wildlife Institute 45 September 17, 2018
Characterizing the response-distance data for three event types revealed some unexpected patterns (Table 6). The average response distance for triggering a dissuasion signal (154 m) matched expectations, reflecting a mix of expected response distances of approximately 170 m across much of the surveillance area and 100 m in the outer, lower band of the surveillance area (Figure 6). Where the expected trigger distance was 170 m, dissuasion events generally were not expected to occur simultaneously with either detection or warning events, because the outer boundaries of the respective response envelopes generally were not expected to converge. Conversely, where the expected trigger distance was 100 m, dissuasion events were expected to occur simultaneously with the initial detection event (Figure 6).
The average response distance for detection events (169 m) was higher than for dissuasion signals, as expected. This distance was considerably lower than the 240-m theoretical maximum detection distance for birds with a wingspan of 1.8 m, perhaps because many detections occurred when the UAV flew in low and first entered the detection envelope from the underside of the overall, inverted-cone-shaped envelope at relatively close distances to the turbine. This may also explain why the average response distance for warning events (179 m) was higher than for detection events; detections often occurred relatively close to the turbine at low altitudes without triggering a deterrent signal or triggering a dissuasion signal without first triggering a warning signal.
Table 6. DTBird Event Response Distances (m) for UAV Flights
Event Type Number of
Events Range Median Average Standard Deviation
Detection 856 14–375 170 169 66.0
Warning Trigger 458 35–353 178 179 59.6
Dissuasion Trigger
625 14–310 152
154 61.8
Total 1939 134–375 166 166 63.9
The response distances for all three event types extended across unexpectedly broad ranges, including both well beyond the theoretical maximum detection distance for birds with a wingspan of 1.8 m, and considerably closer than the expected 100-m minimum trigger distance for warning signals (Table 6, Figure 12). The shorter trigger distances for detection and dissuasion events were not surprising, because a flying bird or UAV can come in low and not enter the lower detection/dissuasion zone until it gets very close to the turbine. In addition, although the range of response distances for all three event types extended beyond the expected maximum of 240 m for birds with wingspans of 1.8 m, some exceedance was expected because the UAVs had wingspans closer to 2 m. Moreover, only 13% of the detections occurred at distances >240 m and only 4% occurred at distances >290 m (the planned starting point for UAV transects). Therefore, we do not think this result influenced the integrity of our intended sampling design to any appreciable degree.
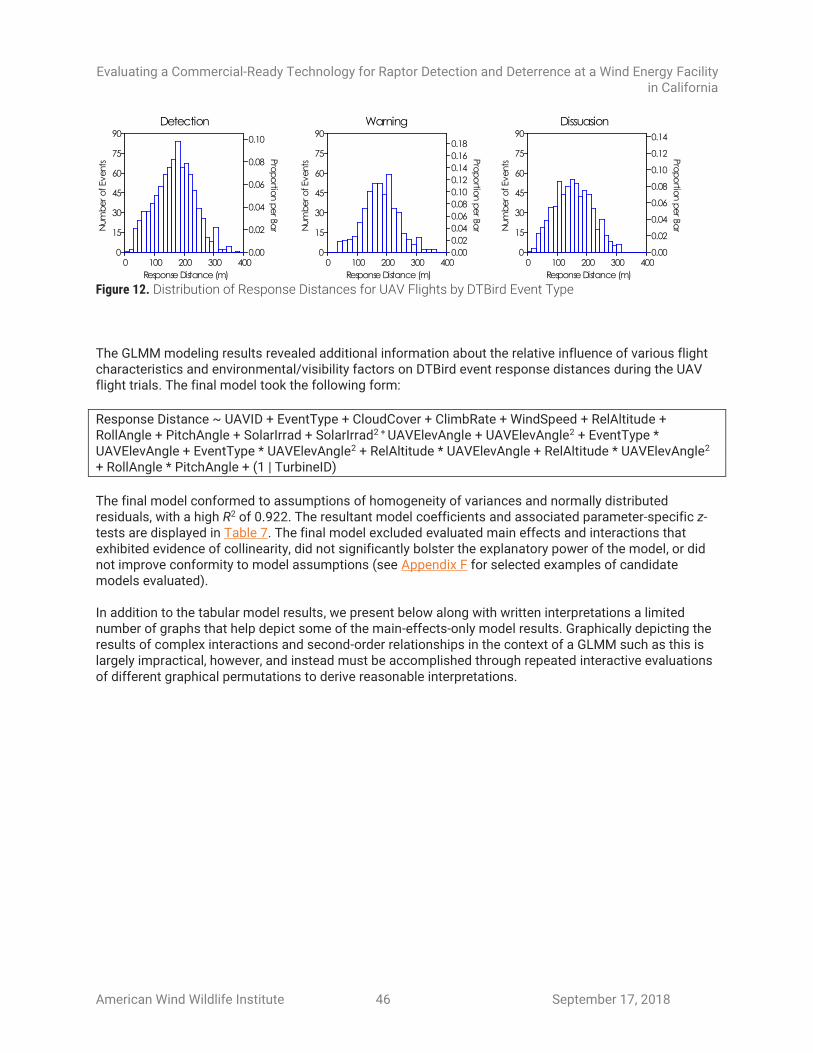
Evaluating a Commercial-Ready Technology for Raptor Detection and Deterrence at a Wind Energy Facility in California
American Wind Wildlife Institute 46 September 17, 2018
Figure 12. Distribution of Response Distances for UAV Flights by DTBird Event Type
The GLMM modeling results revealed additional information about the relative influence of various flight characteristics and environmental/visibility factors on DTBird event response distances during the UAV flight trials. The final model took the following form:
Response Distance ~ UAVID + EventType + CloudCover + ClimbRate + WindSpeed + RelAltitude + RollAngle + PitchAngle + SolarIrrad + SolarIrrad2 + UAVElevAngle + UAVElevAngle2 + EventType * UAVElevAngle + EventType * UAVElevAngle2 + RelAltitude * UAVElevAngle + RelAltitude * UAVElevAngle2 + RollAngle * PitchAngle + (1 | TurbineID)
The final model conformed to assumptions of homogeneity of variances and normally distributed residuals, with a high R2 of 0.922. The resultant model coefficients and associated parameter-specific z-tests are displayed in Table 7. The final model excluded evaluated main effects and interactions that exhibited evidence of collinearity, did not significantly bolster the explanatory power of the model, or did not improve conformity to model assumptions (see Appendix F for selected examples of candidate models evaluated).
In addition to the tabular model results, we present below along with written interpretations a limited number of graphs that help depict some of the main-effects-only model results. Graphically depicting the results of complex interactions and second-order relationships in the context of a GLMM such as this is largely impractical, however, and instead must be accomplished through repeated interactive evaluations of different graphical permutations to derive reasonable interpretations.
Detection
0 100 200 300 400
Response Distance (m)
0
15
30
45
60
75
90
Num
be
ro
fEve
nts
0.00
0.02
0.04
0.06
0.08
0.10
Pro
po
rtion
pe
rBa
r
Dissuasion
0 100 200 300 400
Response Distance (m)
0
15
30
45
60
75
90
Num
be
ro
fEve
nts
0.00
0.02
0.04
0.06
0.08
0.10
0.12
0.14P
rop
ortio
np
erBa
r
Warning
0 100 200 300 400
Response Distance (m)
0
15
30
45
60
75
90
Num
be
ro
fEve
nts
0.00
0.02
0.04
0.06
0.08
0.10
0.12
0.14
0.16
0.18
Pro
po
rtion
pe
rBa
r

Evaluating a Commercial-Ready Technology for Raptor Detection and Deterrence at a Wind Energy Facility in California
American Wind Wildlife Institute 47 September 17, 2018
Table 7. Generalized Linear Mixed Model Results Relating DTBird Detection and Deterrence Event Response Distances to Various UAV Flight Characteristics and Environmental Factors
Parameter Coefficient Standard
Error z P
(Intercept) 5.1488 0.0129 398.45 <0.0001
UAVID: 2 0.0606 0.0139 4.36 <0.0001
EventType: Warning 0.0664 0.0306 2.17 0.0299
EventType: Dissuasion -0.0407 0.0106 -3.86 0.0001
CloudCover: Partly cloudy -0.0613 0.0147 -4.18 <0.0001
CloudCover: Mostly cloudy 0.0196 0.0136 1.44 0.1504
CloudCover: Overcast -0.0115 0.0123 -0.94 0.3497
RelAltitude.c 0.5108 0.0054 94.17 <0.0001
UAVElevAngle.c -0.8011 0.0243 -32.95 <0.0001
UAVElevAngle2.c 0.5015 0.0246 20.42 <0.0001
SolarIrrad.c -0.0499 0.0127 -3.94 0.0001
SolarIrrad2.c 0.0379 0.0136 2.79 0.0052
ClimbRate.c -0.0151 0.0031 -4.82 <0.0001
WindSpeed.c 0.0108 0.0032 3.39 0.0007
RollAngle_abs.c -0.0098 0.0032 -3.09 0.0020
PitchAngle_abs.c -0.0086 0.0030 -2.92 0.0035
RelAltitude.c x UAVElevAngle.c -0.2635 0.0121 -21.75 <0.0001
RelAltitude.c x UAVElevAngle2.c 0.1362 0.0123 11.04 <0.0001
UAVElevAngle.c x EventType: Warning -0.4482 0.1033 -4.34 <0.0001
UAVElevAngle.c x EventType: Dissuasion 0.2093 0.0441 4.75 <0.0001
UAVElevAngle2.c x EventType: Warning 0.5299 0.1508 3.51 0.0004
UAVElevAngle2.c x EventType: Dissuasion -0.1507 0.0389 -3.88 0.0001
RollAngle_abs.c x PitchAngle_abs.c -0.0067 0.0028 -2.42 0.0154
Notes: “.c” suffixes on variable names indicate that the continuous variable was standardized and centered prior to analysis. “_abs” suffixes on variable names indicate that the continuous variable, with equivalent natural ranges from negative to positive values, was transformed to absolute values prior to analysis (see Section 2.4.1 for further explanations of variables and relevant transformations). Reference categories: UAVID = 1 (see Figure 7), EventType = Detection, CloudCover = Clear. Log-likelihood: -5216.73. AICc null model: 9598.9. AICc final model: 10483.5.

Evaluating a Commercial-Ready Technology for Raptor Detection and Deterrence at a Wind Energy Facility in California
American Wind Wildlife Institute 48 September 17, 2018
The primary summary points from the modeling effort are as follows:
• Average response distances differed for the two UAVs used during the flight trials, suggesting that differences in the physical characteristics of the aircraft (e.g., size, body form, and color) affected detectability, much as would be expected to result from birds of different sizes, shapes, and colors. The modeling results indicated that, with other factors accounted for in the model, the response distances for UAV 2 averaged about 10 m greater than for UAV 1 (Figure 13).
Figure 13. GLMM Model Results Depicting Predicted Differences in Average DTBird Event Response Distances for the Two UAVs Used in the Study
• The cloud cover behind a UAV influenced responses distances, presumably by affecting the system’s ability to detect and track objects depending on the degree of contrast between the sky and the tracked object. Response distances averaged longest under mostly cloudy skies, slightly shorter under clear or overcast skies, and significantly shorter (indicating poorer detectability) under partly cloudy skies (Figure 14). Partly cloudy skies contributed to approximately a 13-m reduction in the average response distance compared to mostly cloudy skies, and approximately a 7–10-m reduction compared to overcast and clear skies.
Figure 14. GLMM Model Results Depicting Predicted Differences in Average DTBird Event Response Distances with Different Levels of Cloud Cover

Evaluating a Commercial-Ready Technology for Raptor Detection and Deterrence at a Wind Energy Facility in California
American Wind Wildlife Institute 49 September 17, 2018
• The degree of solar irradiation impinging on the UAV/cameras influenced response distances, presumably by affecting object detection and tracking depending on the degree of solar glare and general lighting intensity. A second-order, trough-shaped relationship indicated that detectability was lowest at moderate solar intensities and improved with lower (low sun) and higher (sun high in sky) intensities.
• ClimbRate, WindSpeed, RollAngle, and PitchAngle all contributed significantly to the model, presumably because they influence the profile exposure of the UAV to the camera and thereby affect the system’s targeting based on the number of pixels the object appears to occupy. For ClimbRate, a negative relationship with response distance indicated that detectability was greater when the UAV was descending relatively rapidly, but declined when the trajectory was flatter or ascending (Figure 15). For WindSpeed, a positive relationship with response distance indicated that detectability improved at higher wind speeds (Figure 16). Negative coefficients for both the RollAngle and PitchAngle main effects appeared to contradict expectations that increased rolling and pitching should increase response distances by increasing the profile exposure of the UAV to the cameras (i.e., making the UAV appear larger). The interactive relationship between the two variables suggested, however, that combinations of high roll angles and low pitch angles, or the opposite, increased detectability, whereas combinations of high roll angles and high pitch angles lowered detectability (Figure 17).
• The elevation angle from a camera to a UAV influenced response distances in complex ways, as reflected in the inclusion of both a second-order term for this variable and significant interactions between UAVElevAngle and both EventType and RelAltitude. The second-order relationship between response distances and UAVElevAngle reflected that, when considered in relation to EventType, response distances averaged comparatively low (i.e., decreased detectability) at moderate UAV elevation angles, but increased at both lower and higher elevation angles. The interactive relationship with EventType further indicated that the influence of decreasing elevation angles on increasing response distances was more acute for unique (i.e., not triggered simultaneously with a detection event and therefore not filtered from the dataset) warning events than for unique dissuasion events and especially detection events. The relative difference among EventTypes then diminished at moderate UAV elevation angles, where the probability of unique deterrence events of both types was relatively high because of zonal variation in expected triggering distances at elevation angles ranging from approximately +10–12° to +28–30°; see Figure 6, but then increased again at higher elevation angles. The interactive results for RelAltitude and UAVElevAngle reflected that response distances generally increased (improved detectability) with combinations of relatively high altitude but lower UAV Elevation angles. Conversely, response distances generally averaged lower (poorer detectability) when both predictors were either simultaneously high or simultaneously low, as well as when the UAV elevation angle was high, but its relative altitude was low.

Evaluating a Commercial-Ready Technology for Raptor Detection and Deterrence at a Wind Energy Facility in California
American Wind Wildlife Institute 50 September 17, 2018
Figure 15. GLMM Model Results Depicting the Predicted Influence of UAV Climb Rate on DTBird Event Response Distances
Figure 16. GLMM Model Results Depicting the Predicted Influence of Wind Speed on DTBird UAV Event Response Distances
Figure 17. GLMM Model Results Depicting the Predicted Interactive Influence of UAV Roll Angle and Pitch Angle on DTBird Event Response Distances

Evaluating a Commercial-Ready Technology for Raptor Detection and Deterrence at a Wind Energy Facility in California
American Wind Wildlife Institute 51 September 17, 2018
3.4 Probability of Detection Based on UAV Flight Trials
Based on classifying independent flight segments as described in Section 2.3.3.4, the probability of a UAV flight being detected averaged 63 ± 10.0% overall, varying from 47–75% at the seven individual turbines (Figure 18). The probability of detection increased from approximately 51% for flights with average distances from the cameras >230 m to ≥85% for flights with average distances of 80–140 m (Figure 19). The probability of detection declined again to approximately ≤60% for flight segments that averaged distances of <80 m, which included relatively short, low-altitude flights that skimmed the underside of the detection envelope.
Figure 18. Probability of the DTBird System Detecting a UAV Flight by Turbine and Across All Turbines Combined
The logistic regression analysis evaluating the probability of UAV detection in relation to hour of the day and flight exposure direction revealed significant main effects for Hour and sine (Exposure), and a significant interaction between these two main effects (Table 8). The resulting predictive model suggested that the probability of detection was substantially lower toward the east-southeast in the morning, progressively improved in that exposure direction as the day advanced and rose to the highest observed levels toward the east in the afternoon (Figure 20). The depressive morning effect in the southeast declined with exposures rotating westward. The results suggested that the probability of detection for exposures with a strong westerly component remained relatively stable through the day; however, our sampling represented only periods from 0600 H to 1600 H PST, so we did not represent evening/sundown conditions as well as we represented morning/sunrise conditions.

Evaluating a Commercial-Ready Technology for Raptor Detection and Deterrence at a Wind Energy Facility in California
American Wind Wildlife Institute 52 September 17, 2018
Figure 19. Probability of DTBird Detecting a UAV Flight Based on its Average Lateral Distance from the Turbine
Table 8. Logistic Regression Model Results Illustrating the Influence of Hour of the Day and Flight Exposure Direction on the Probability of DTBird Detecting a UAV Flight
Parameter Estimate Standard Error t P
Constant -1.409 0.273 -5.159 <0.001
Hour 0.187 0.026 7.154 <0.001
sine(Exposure) -1.852 0.405 -4.574 <0.001
Hour* sine(Exposure) 0.142 0.039 3.678 0.001
Parameter Odds Ratio Upper 95% CI Lower 95% CI
Hour 1.206 1.269 1.146
sine(Exposure) 0.157 0.347 0.071
Hour* sine(Exposure) 1.152 1.243 1.068
Notes: Records for analysis: 1279; Detected n = 798, Not Detected (REFERENCE) n = 481. Log Likelihood of model (LL[N]) = -800.07. Log Likelihood of constants only model (LL[0]) = -846.84. Model χ2 = 2*(LL[N]-LL[0]) = 93.5, degrees of freedom = 3, P <0.001.

Evaluating a Commercial-Ready Technology for Raptor Detection and Deterrence at a Wind Energy Facility in California
American Wind Wildlife Institute 53 September 17, 2018
Figure 20. Modeled Influence of Hour of the Day and Flight Exposure Direction (Negative = West, Positive = East) on the Probability of DTBird Detecting a UAV Flight
Later sampling might have revealed a greater depressive effect on detection probabilities of low sun angles to the west in the evening.
To further bolster insight about the degree to which exposure to direct sun in the south influenced detection probabilities, we compared the DTBird first-detection-camera event recording rates for UAVs during the flight trials, for all non-UAV detections, and for all detection events combined. These simple comparisons revealed that, across all installations and the entire study period, the first-detection-camera event recording rates were consistently the lowest for south-facing Camera 2, slightly better for east-facing Camera 3, and considerably higher for north-facing Camera 4 and west-facing Camera 1 (Figure 21). Portraying overall detection activity and UAV detection activity by camera across hours of the day provided further corroboration of southerly exposure reducing detection probabilities (Figure 22). This portrayal also illustrated the expected pattern of variation through the day, with the probability of detection in the west/southwest higher during the first half of the day and declining in the afternoon, and the opposite pattern evident in the east-southeast exposure direction. In contrast, detection activity in the north-facing cameras followed a bell- or hill-shaped pattern, with detections increasing as morning progressed and decreasing again as evening settled in (Figure 22). This pattern may reflect primarily the typical pace of general raptor and raven activity through the day (for the non-UAV detections), but may also reflect that general illumination is better for detections to the north through the middle of the day, when the sun is higher in the sky.

Evaluating a Commercial-Ready Technology for Raptor Detection and Deterrence at a Wind Energy Facility in California
American Wind Wildlife Institute 54 September 17, 2018
Figure 21. DTBird Detection Events by Camera Recorded Across the Study Period
Figure 22. All Detections and UAV Detections by Camera and Hour Recorded Across the Study Period
0
500
1000
1500
2000
2500
3000
3500
4000
4500
5000
Camera 1
(West)
Camera 2
(South)
Camera 3
(East)
Camera 4
(North)
Nu
mb
er
of
De
tec
tio
n E
ve
nts
All Detections
Confirmed Non-
UAV Detections
Confirmed UAV
Detections x 5

Evaluating a Commercial-Ready Technology for Raptor Detection and Deterrence at a Wind Energy Facility in California
American Wind Wildlife Institute 55 September 17, 2018
3.5 Probability of Deterrence Based on Evaluation of DTBird Video Records of In Situ Raptors
Of the 469 DTBird DAP records classified as raptors, 255 individual raptors triggered deterrent signals (Table 9). We were unable to confidently identify the species of most of these birds; nevertheless, the sample included 42 confirmed golden eagles and 46 confirmed buteos, and it is likely that sizeable portions of the unknown raptors were also golden eagles and red-tailed hawks. Focused only on cases that we classified as unequivocally successful deterrence events (Y; Section 2.2.6), the overall deterrence rate for all raptors was 36%, for buteos 39%, and for golden eagles 52%. Including potential successes (P; Section 2.2.6) increased the deterrence rate for all raptors to 76%, for buteos to 78%, and for golden eagles to 83%.
Table 9. Classified Responses of Raptors Exposed to DTBird Warning and/or Dissuasion Deterrent Signals
Species Number of
Cases Successful Deterrence
Possible Deterrence
Ineffective Response No Response
Golden Eagle 42 22 (52%) 13 (31%) 2 (5%) 5 (12%)
Bald Eagle? 1 1 (100%) – – –
Turkey Vulture 7 3 (43%) 2 (29%) – 2 (29%)
Vulture / Eagle 5 1 (20%) 2 (40%) 1 (20%) 1 (20%)
Red-tailed Hawk 5 1 (20%) 3 (60%) (0%) 1 (20%)
Ferruginous Hawk 5 2 (40%) 1 (20%) 2 (40%) –
Unknown Buteo 36 15 (42%) 14 (39%) 2 (6%) 5 (14%)
American Kestrel 2 – 2 (100%) – –
Unknown Raptor 152 47 (31%) 65 (43%) 8 (5%) 32 (21%)
All Raptors 255 92 (36%) 102 (40%) 15 (6%) 46 (18%)
The logistic regression analysis indicated that the probability of deterrence for raptors as a group varied in relation to the interactive influences of month and wind speed (Table 10). Early in the study period, the probability of deterrence was higher under low wind-speed conditions; however, by March/April the opposite pattern emerged, and by August successful deterrence was almost twice as likely under relatively high wind conditions (>8–9 m/sec) than under low wind conditions (<2–3 m/sec) (Figure 23). Further evaluation indicated that this relationship was also evident for buteos as group, with a bit more dramatic shift through time from high response during low winds and low response during high winds early on, to responses primarily during stronger winds later in the study period.
In contrast, although the smaller dataset limited the statistical power for detecting differences, no significant relationships were evident for golden eagles. Confirmed eagle activity recorded by the DTBird systems increased markedly between January (n = 4 cases evaluated) and February (11 cases), then declined gradually again thereafter, and February was the only month in which the probability of successful and unsuccessful deterrence was close to equal (55% positive responses). The only other occasions when confirmed eagles were not effectively deterred by the signals was once in March (89% positive responses; n = 9) and once in June (67% positive responses; n = 3).
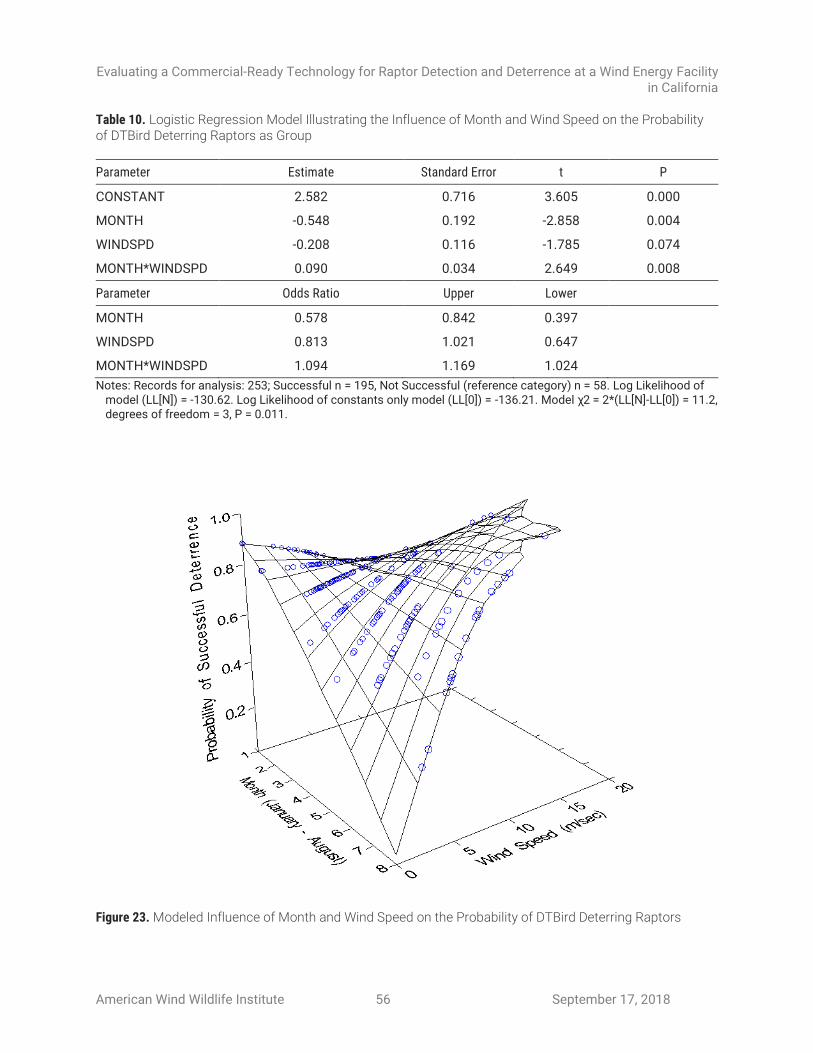
Evaluating a Commercial-Ready Technology for Raptor Detection and Deterrence at a Wind Energy Facility in California
American Wind Wildlife Institute 56 September 17, 2018
Table 10. Logistic Regression Model Illustrating the Influence of Month and Wind Speed on the Probability of DTBird Deterring Raptors as Group
Parameter Estimate Standard Error t P
CONSTANT 2.582 0.716 3.605 0.000
MONTH -0.548 0.192 -2.858 0.004
WINDSPD -0.208 0.116 -1.785 0.074
MONTH*WINDSPD 0.090 0.034 2.649 0.008
Parameter Odds Ratio Upper Lower
MONTH 0.578 0.842 0.397
WINDSPD 0.813 1.021 0.647
MONTH*WINDSPD 1.094 1.169 1.024
Notes: Records for analysis: 253; Successful n = 195, Not Successful (reference category) n = 58. Log Likelihood of model (LL[N]) = -130.62. Log Likelihood of constants only model (LL[0]) = -136.21. Model χ2 = 2*(LL[N]-LL[0]) = 11.2, degrees of freedom = 3, P = 0.011.
Figure 23. Modeled Influence of Month and Wind Speed on the Probability of DTBird Deterring Raptors

Evaluating a Commercial-Ready Technology for Raptor Detection and Deterrence at a Wind Energy Facility in California
American Wind Wildlife Institute 57 September 17, 2018
3.6 Estimated Risk Reduction from Deploying DTBird System
The cross products of minimum and maximum estimated probabilities of detection (0.47, 0.75; derived from the UAV flight trials) and probabilities of deterrence (0.36, 0.76; derived from evaluating DTBird videos of in situ raptors) produced estimates of risk reduction for all raptors combined from deploying DTBird ranging from 17–57%. Multiplying the estimated overall probability of detection for golden eagles (UAV average = 63%) and the most-confident estimate of the probability of deterring an eagle (52%) yielded a risk-reduction estimate from deploying DTBird of 33% for golden eagles. Multiplying the estimated overall probability of detection for golden eagles (63%) and the estimated probability of deterring an eagle based on both confident and potential deterrence events (83%) yielded a risk-reduction estimate from deploying DTBird of 53% for golden eagles. Thus, based on the results of this study, we estimated the range of DTBird effectiveness in deterring golden eagles from entering the collision risk zone of individual turbines to be 33–53%.

Evaluating a Commercial-Ready Technology for Raptor Detection and Deterrence at a Wind Energy Facility in California
American Wind Wildlife Institute 58 September 17, 2018
Section 4. Discussion
The goal of the study was to quantify the effectiveness of the DTBird system in detecting golden eagles and other raptors and deterring them from entering the collision risk zone of equipped turbines. The following subsections discuss our findings related to the primary objectives outlined in Section 1.1 and, in combination with additional information and insights provided in Appendices C and G, identify limitations and topics for further study. One of the key objectives outlined in Section 1.1 was to translate our experiences into standardized protocols that can be used to facilitate further investigations of the DTBird system. Appendices A–D serve that purpose, along with supplementary analytical insight gleaned from Section 2.4.
4.1 DTBird Targeting Efficiency
Our screening of detection events indicated a false-positive rate of 36% among the 4,049 non-UAV screened and effectively classified records. False-positive detections resulted in unwanted data and video records, and also led to unnecessary triggering of the deterrent signals, which could have adversely affected nontarget wildlife and excessively disturbed facility neighbors and staff. Nearly 45% of the false positives involved aircraft, including several other UAVs that were not part of the study, and 80% of these false detections triggered one or both deterrent signals.
We asked Liquen to limit continued “tuning” of the system during our study period—in part to support maintaining a consistent probability of detection for the UAVs we used to evaluate the detection and deterrent-triggering functions—and this may have inflated the aircraft false-positive rate to some degree. On the other hand, finding that spinning turbine blades caused 25% of the false positives reflects an issue that was largely, but not entirely, resolved by further tuning early in the study period during December and January, which also contributed to the decline in false positives after January (Figure 10). We are uncertain whether further system tuning might have reduced the probability of rain, snow, and various sky artifacts causing 22% of the false positives, or the probability of insects flying close to the cameras causing 9% of the false positives. These sources of false positives were also well represented in other evaluation studies (May et al. 2012, Aschwanden et al. 2015).
May et al. (2012) determined that approximately 40% of the DAP records recorded during their 7-month study in Norway were false positives, which equated to an average rate of 1.2 false positives per turbine per day (with two study turbines involved). Because we generally did not review and classify all the detection events recorded on specific days, we cannot provide a comparable daily-rate estimate. Nevertheless, our documenting proportional representation of 36% false positives among the randomly selected events we screened represented an improvement compared to the 40% proportional representation documented by May et al. (2012) in Norway, and especially the 69% proportion documented by Aschwanden et al. (2015) in Switzerland. Aircraft, sky artefacts, insects, raindrops, and spinning turbine blades were responsible for sizeable portions of the false positives in our study and in Norway and Switzerland. The lower false positive rate found in this study may indicate that the detection system has improved since earlier models, suggesting that with further tuning, the false-positive rate may be lowered further. It is also possible that the differences in false-positive rates are not due to changes in technology performance, but differences in the relative abundance of raptors and various sources of false positives between study sites. Adjusting the sensitivity of the DTBird system to reduce false positives may result in a corresponding drop in the detection rate. In future studies, it will be important to assess the impacts of such adjustments to the detection system.
At least 20% (probably much more) of all detections that we classified as birds were corvids, and most, if not all, were common ravens. Moreover, distinguishing ravens from larger raptors, including distant eagles, was often challenging, which translated to a large collection of unknown big birds that likely

Evaluating a Commercial-Ready Technology for Raptor Detection and Deterrence at a Wind Energy Facility in California
American Wind Wildlife Institute 59 September 17, 2018
included many ravens. Despite the relatively high abundance of common ravens around most western wind-energy facilities, their fatality rates tend to be much lower than the rates for red-tailed hawks, despite similar or greater abundance levels. Raven fatality rates are comparable or lower than golden eagle fatality rates, despite ravens typically being considerably more abundant than eagles (e.g., Thelander and Rugge 2000, Erickson et al. 2001, ICF International 2016). The sheer volume of corvid detections and deterrent signal triggering (63%) could be considered an important nuisance factor. Neighbors occupying a residence in proximity to a DTBird installation (0.5 km) complained about the emitted deterrent signals. The event trigger rate at that turbine was the highest among the seven installations, and the rate of confirmed corvid detections there was more than twice as high as at any other installation.
Litsgård et al. (2016) suggested that a DTBird signal typically did not exceed 40 dB (the equivalent of typical bird songs or nominal urban background noise) at 750 m from the speakers at their studied wind facility in Sweden, and only one of nine neighbors within 1 km reported finding the signals irritating. In our study, with a factory setting for broadcast volume of 121 dB, we often heard the warning and especially dissuasion signals at distances of 1 km or more from the installation turbine, unless masked by strong winds.
May et al. (2012) determined that birds in their study were generally farther away when targeted for deterrent signaling than the corresponding trigger distances defined in the system’s calibration settings, which resulted in a higher than expected rate of deterrent signaling. Our finding that the distance ranges across which UAV detection and deterrent-triggering events occurred were much broader than expected was consistent with these results and suggested the same potential for excessive deterrent signaling and possible negative habituation.
4.2 Orchestrating UAV Flight Trials to Evaluate DTBird Detection and Deterrent-Triggering Performance
A key objective of this study was to evaluate the DTBird detection and deterrent-triggering system using experimental UAV flights around nonoperational turbines equipped with DTBird. Although we believe the use of UAVs to simulate eagles was a valid and useful approach to measure detection, we did not attempt to quantify the potential bias introduced by this approach, because such comparisons were beyond the scope of the study. However, our novel attempt to use UAVs for this purpose revealed a variety of important insights about the logistical feasibility and practicality of that approach.
Deploying UAVs for this purpose presented some challenges (see Appendix C), but it allowed us to efficiently amass enough flight-trial sample sizes to evaluate the DTBird response characteristics under representative ranges of flight conditions and flight characteristics. Moreover, based on our more than 30 years of experience as raptor observers and migration watchers, we can confidently state that a foam-bodied, fixed-wing, battery-powered UAV, with a body size, coloration, and especially wingspan similar to a golden eagle, served as a remarkably good mimic for soaring and gliding golden eagles, especially at distances where triggering of DTBird detection and deterrence events was expected. Moreover, although the style differences between the two UAVs used during the study might not have effectively mimicked relevant variation among golden eagles, the fact that they did vary in size, shape, and coloration confirmed that the targeting responses of the DTBird system were sensitive to such variation.
A modified UAV that can flap and tuck its wings would be even better for representing a broader range of flight circumstances and behaviors. However, although flying golden eagles constantly manipulate their wings in subtle ways to adjust to air currents and travel efficiently, to conserve energy they spend much more time with wings fully spread soaring and contouring on wind currents than they do actively flapping. Therefore, the UAVs’ inability to flap and tuck their wings precluded mimicking only a small portion of a typical eagle’s flight repertoire. Fixed-wing UAVs were not able to effectively mimic behaviors that could

Evaluating a Commercial-Ready Technology for Raptor Detection and Deterrence at a Wind Energy Facility in California
American Wind Wildlife Institute 60 September 17, 2018
be particularly risky around wind turbines, such as aggressive prey attacks or defensive maneuvers involving temporary bouts of intensive flapping or rapid, steep descents from on high with wings tucked. Such insight could be gained only by conducting flight trials with GPS-equipped trained raptors; however, orchestrating flight trials with trained golden eagles in an operating wind facility would be a great challenge.
4.3 Influence of Flight and Landscape Characteristics on DTBird Detection and Deterrent-Triggering Response Distances
The modeling effort presented some challenges concerning choices of specific predictor variables and the best model structure to represent the complex interplay of system features, UAV/bird morphology, flight characteristics, and environmental factors on the detection and deterrent-triggering performance of the DTBird system. In combination with the probability of detection analyses presented in Section 3.4 and discussed further below in Section 4.4, the modeling results suggested that optimal detection and deterrent triggering occurred when the following applied:
• The sky was mostly covered in clouds but not dark overcast skies; clear blue skies were less optimal, and relatively dynamic and variable partly cloudy skies were most problematic.
• The sun was not shining directly into the camera, with south-facing cameras particularly susceptible to glare.
• The profile exposure of the tracked object was enhanced by turning/rolling, pitching up and down, rapidly descending flight, or general bouncing around in the wind (with logical extensions to real birds involved in variable/dynamic or otherwise unstable flight patterns).
• The tracked object entered the detection envelope toward the middle of a camera’s viewshed, as opposed to first appearing over the high center of the detection envelope or close to the turbine as it popped up from a low trajectory.
Partly cloudy skies, which are inherently variable, reduced the DTBird response distances by 7–13 m compared to other sky conditions; mostly cloudy skies resulted in more responsive, earlier detections and deterrent triggering. Biologists conducting raptor migration counts know that detecting birds flying overhead against bright blue skies is difficult, whereas cloud cover generally improves detectability by increasing the contrast between the birds and sky backdrop (Bildstein et al. 2007). The modeling results partly conformed to this detectability scenario, but suggested that the DTBird detection and targeting systems operated with similar efficacy under clear skies and relatively uniform cloud cover, but had greater difficulty locking onto flying objects when the skies included variable mixes of blue sky and partial cloud cover. “Sky artefacts” frequently triggered false positives, with the detection system inappropriately responding to variable, high-contrast circumstances evident around the edges of rapidly moving and changing clouds set against bright blue skies.
The cameras installed for this study all had some landscape backdrop within their viewshed, varying from <1–7%. Although flights recorded in the DTBird videos frequently included a bird or UAV flying within a landscape backdrop for brief periods without the system being able to detect them, such birds typically were not at risk at those times, because they were too far away and flying below the RSZ. The exception was when a bird or UAV flew toward the turbine at a low altitude within the landscape backdrop and was not detected and did not trigger a deterrent signal until it popped up suddenly relatively close to the turbine. This scenario could place a bird at risk without enough forewarning from a deterrent signal, and represents a potentially significant limitation of the detection and deterrent triggering setup.
The influence of solar irradiation on DTBird detection and deterrent-triggering responses (see Section 3.3) suggested that detectability was compromised when the solar intensity was moderate, which presumably
Evaluating a Commercial-Ready Technology for Raptor Detection and Deterrence at a Wind Energy Facility in California
American Wind Wildlife Institute 61 September 17, 2018
corresponded to when the sun was moderately high in the sky. A moderately high sun azimuth tended to produce more glare on the cameras, thereby hindering detectability, whereas a low sun and especially a sun high up in the sky presumably did not shine as directly on the cameras and may have better illuminated the UAV (or bird) without causing excessive glare from the camera’s perspective. When false negatives were considered, the modeling results presented in Section 3.4 suggested that the probability of a UAV flight being detected was generally reduced when the exposure direction of the flight corresponded to the direction of the sun. Evidence that the rate of first detections was consistently lowest for the south-facing number 2 cameras further bolstered the notion that direct solar exposure generally hindered DTBird’s detection and targeting capabilities.
The positive relationship between wind speed and response distances appeared to confirm our expectations that, as the wind speed increases, the UAV (or bird) bounces and wobbles around more, variably exposing more of its profile to the cameras and, thereby, increasing detectability. The results for ClimbRate, RollAngle, and PitchAngle in large measure matched expectations that flight dynamics influenced detectability. Descending flights and increased rolling/turning and pitching up or down should increase the profile exposure of the tracked object and increase detectability; however, the combination of both significant rolling and significant pitching lowered rather than improved detectability.
The modeling results portrayed the complex interactive influences on response distances of EventType, UAVElevAngle, and RelAltitude. For example, low UAV elevation angles generally were associated with greater response distances reflecting that the probability of detecting an object at lower elevation angles (a) generally declined as the angles approached and dropped below the lower +10–12°-pitch boundary of the detection envelope, and (b) at those lower angles, tended to be greater for tracked objects that were farther out and higher up, rather than low and close to the turbine. Similarly, interactive relationships between EventType and UAVElevAngle indicated that when compared to detection and unique dissuasion events, response distances for unique warning events tended to increase more rapidly as UAV elevation angles dropped very low or rose to relatively high angles. Finally, the interactive results for RelAltitude and UAVElevAngle appeared to reflect that detectability was highest in the middle of the camera viewsheds and declined toward both the upper and lower margins of the viewsheds.
The results of response-distance modeling also suggested that the average DTBird response distances differed for the two UAVs used in the study. Noteworthy differences in the coloration and body morphology of the two UAVs likely contributed to this finding, much as would be expected to pertain to detection responses for birds of different morphologies. Iterative consideration of candidate models with and without UAVID as a predictor confirmed that inclusion of that variable accounted for a significant source variation that other predictors could not explain.
4.4 Probability of Detection Based on UAV Flight Trials
Given the apparent importance of sun exposure on detectability and the fact that the response-distance modeling effort (Section 2.4.2) did not include information for flights that were not detected (false negatives), we conducted simple analyses that included false negatives to confirm that the probability of detection was generally depressed in south-facing cameras, more to the east in the morning and perhaps also more to the west in the afternoon. An additional refinement of our approach would be to further trim the individual flight segments to constrain them to the minimum spatial extent best suited to evaluating whether a flight was detected or not. Such trimming would not alter the calculations that we used to estimate the overall probability of detection; however, further judicious clipping of the flight segments might influence the outcome of comparing detection rates within different distance bands from the turbines, because that could alter the average distance estimates for some of the flights.
Our estimate of the overall probability of detecting a UAV flight across the seven DTBird installations was 62%, with turbine-specific estimates ranging from 47–75%. Considered in relation to specific distance

Evaluating a Commercial-Ready Technology for Raptor Detection and Deterrence at a Wind Energy Facility in California
American Wind Wildlife Institute 62 September 17, 2018
bands, we estimated that DTBird detected 51% of the flights with average distances >230 m from the turbine, but more than 85% of the flights with average distances from the cameras of 80–140 m. By comparing DTBird bird detection rates against radar detection rates around two turbines in Norway, May et al. (2012) documented slightly higher detection rates. They estimated that their DTBird systems detected 76% of the daylight flights detected by the radar systems within a 300-m radius of the turbines, and 96% of the flights that passed within a 150-m radius of the turbines. It is possible that the difference between the two studies reflects that the DTBird system is more adept at detecting real birds than UAV mimics; however, differences caused by cloud conditions, other landscape setting and visibility factors, as well as important differences in the camera setups at the two sites, also might be involved.
4.5 Probability of Deterrence Based on Evaluation of DTBird Video Records of In Situ Raptors
Similar to May et al. (2012), we evaluated the probability of deterrence by classifying the behavioral responses of in situ raptors exposed to the deterrent signals and recorded in the DAP video records. In contrast to their approach, however, we did not calculate tortuosity metrics to describe changes in bird flights, but instead used a combination of objective on-screen measurements of flight trajectory changes and subjective visual assessments of behavioral changes. Confidently assessing whether or not raptors responded in risk-reducing ways to the deterrent signals based on reviewing the DTBird video records was challenging, because of a combination of (a) the small size of most birds at expected detection and deterrent-triggering distances, (b) modest video resolution that did not provide clear views of distant birds, (c) the small red boxes generated by DTBird around tracked objects often hindered obtaining clear impressions of subtle flight behaviors and complicated species identification, and (d) the difficulties of assessing three-dimensional patterns based on a two-dimensional perspective. Further, careful evaluation of relevant DTBird video records and associated environmental conditions that affect the probability of deterrence was challenged by our ability to discern behaviors and accurately correlate deterrent-trigger timestamps with the activities of individual birds involved in group interactions.
Nevertheless, we were able to estimate that the DTBird collision avoidance model effectively deterred at least 52% of the golden eagles we evaluated, and at least 30–40% of the buteos, vultures, and other raptors that we evaluated. Adding in cases where we were mostly certain about the effectiveness of the responses elevated the estimated probability of deterrence for golden eagles to 83%, and for other raptor species and groups to at least 60% and generally greater than 70%. While our confirmed sample size was modest, the sensitivity of golden eagles to the deterrent signals did not appear to vary appreciably during the study period. In contrast, the results for buteos and the larger combined raptor group suggested that the birds responded more strongly to the DTBird signals during strong winds later in the study period (potential positive habituation), but sensitivity diminished during lighter winds when the turbines were spinning less rapidly (potential negative habituation). An apparent lack of deterrence effectiveness during low wind conditions could still constitute a significant risk factor, because even at initial cut-in speed when the rotor is turning slowly at 12–14 rpms, the blade tips are moving at speeds in excess of 150 kph.
In contrast to our findings, May et al. (2012) detected visible flight responses to the deterrent signals in only 7% of the video sequences they classified; however, they also acknowledged that they often were unable to visually confirm whether or not a deterrence response occurred. Aschwanden et al. (2015) also reported that a relatively low 19% of the 274 birds they recorded responded effectively to a deterrent signal. Conversely, although stated only as a brief summary, Litsgård et al. (2016) reported that the DTBird system they evaluated in Sweden reduced the “dwell time” of large birds in the turbine risk zone by 61–87%, a deterrence level similar to our study. Differences among these studies likely reflect differences in analytical methodology, relevant bird species, and the DTBird system calibrations at each site.

Evaluating a Commercial-Ready Technology for Raptor Detection and Deterrence at a Wind Energy Facility in California
American Wind Wildlife Institute 63 September 17, 2018
4.6 Potential Reduction in Take of Golden Eagles from Deploying DTBird System
Our results indicated that deployment of DTBird systems likely reduced risk to golden eagles at the seven strategically but non-randomly selected wind turbines. Multiple factors may influence risk reduction across turbine arrays at different facilities, however, including the site-specific layout of turbines (e.g., spacing and location relative to eagle activity), the number and placement of DTBird systems relative to both the timing and locations of eagle activity, the relative abundance of transient and migratory birds expected to be exposed to the DTBird system, and the specific behavioral characteristics of the eagles and other raptors that occur in a given area. Further, although our study was not long enough to effectively evaluate positive or negative habituation, our results suggested that non-eagle raptors likely showed a degree of positive habituation correlated with high-risk wind conditions as the study progressed.
Other important factors for managers and wind-energy facility operators to consider in deciding whether to install DTBird at a given facility, selecting installation locations, and evaluating potential risk reduction include:
• The potential for warning and deterrent signals to disturb nearby residents and nontarget wildlife
• The limited effectiveness of DTBird cameras that face south into the sun (at northern latitudes)
• The climatic conditions and effects of solar intensity and cloud cover on DTBird detection efficiency
• The possibility that extra-limital detections as well as excessive false positives may both exacerbate the disturbance of neighbors and nontarget wildlife, and reduce the effectiveness of the deterrent signaling through negative habituation of targeted birds
• Feasibility, cost, and upgrades for integration of system into existing infrastructure
• Operations and maintenance (O&M) and licensing fee, as well as site personnel hours required for
annual and ongoing system maintenance
• Whether ongoing data evaluation will be necessary to determine continued effectiveness over
long periods
• Longevity and durability of the equipment
It is important to recognize that this study examined the effectiveness of DTBird only at a turbine-specific level. Quantifying average deterrence tendencies across seven non-randomly distributed DTBird installations cannot be construed as accurately representing risk reduction that could be achieved at a facility-wide level given a well-designed network of DTBird systems. For this reason, additional studies will be needed to evaluate how variable DTBird network configurations influence risk reduction across entire facilities.

Evaluating a Commercial-Ready Technology for Raptor Detection and Deterrence at a Wind Energy Facility in California
American Wind Wildlife Institute 64 September 17, 2018
Section 5. References
ArduPilot Dev Team. 2017. Mission Planner. Version 1.3.49. Software created by Michael Osborne. http://ardupilot.org/planner/index.html Accessed August 2017.
Aschwanden, J., S. Wanner, and F. Liechti. 2015. Investigation on the Effectivity of Bat and Bird Detection at a Wind Turbine: Final Report Bird Detection. Prepared for Interwind AG, Swiss Federal Office of Energy, and Federal Office for the Environment. Schweizerische Vogelwarte, Sempach, Switzerland.
United States Fish and Wildlife Service (USFWS). 2009a. Final Environment Assessment – Proposal to Take Provided Under the Bald and Golden Eagle Protection Act. Prepared by the Branch of Policy, Permits and Regulations: Division of Migratory Bird Management. https://www.fws. gov/midwest/MidwestBird/EaglePermits/bagepa.html Accessed August 2017.
Bildstein, K. L., J. P. Smith, and R. Yosef. 2007. Migration counts and monitoring. Pages 101–116 in D. M. Bird and K. L. Bildstein (Editors), Raptor Research and Management Techniques. Hancock House Publishers, Blaine, Washington, USA, and Surrey, British Columbia, Canada.
Bloom Biological. 2015a. Results of 2015 Aerial Inspection of Cottonwood Canyon Golden Eagle Nest and Additional Eagle Nest Surveys for the Manzana Wind Energy Plant Located in the Vicinity of the City of Rosamond, Kern County, California. Santa Ana, California. 1 April 2015. Letter report prepared for Iberdrola Renewables, Portland, Oregon.
Bloom Biological. 2015b. Bird Use Count Surveys at the Manzana Wind Energy Plant: Spring 2015 Final Report. Santa Ana, California. Prepared for Iberdrola Renewables, Portland, Oregon.
Bloom Biological. 2015c. Results of Bird Use Count (BUC) Surveys at BUC Station #12 North of the Manzana Wind Energy Plant Located in Kern County, California. Santa Ana, California. 26 February 2015. Letter report prepared for Iberdrola Renewables, Portland, Oregon.
Bloom Biological and Cardno ENTRIX. 2015. Bird Use Count Surveys at the Proposed Tylerhorse Wind Energy Plant: 2013–2014 Final Report. Bloom Biological, Inc., Santa Ana, California, and Cardno ENTRIX, Salt Lake City, Utah. Prepared for Iberdrola Renewables, Portland, Oregon.
Burnham, K. P., and D. R. Anderson. 2010. Model Selection and Multimodel Inference: A Practical Information-Theoretic Approach. Second edition. Springer, New York, New York.
California Department of Fish and Wildlife. 2016. California Natural Diversity Database. Sacramento, California. https://www.wildlife.ca.gov/Data/CNDDB/Maps-and-Data Accessed March 2016.
Chatfield, A., and W. Erickson. 2011. Golden Eagle Information for the North Sky River Wind Resource Area, Kern County, California. Western EcoSystems Technology, Inc., Cheyenne, Wyoming. Prepared for NextEra Energy, Juno Beach, Florida.
DeFusco, R. P. 2007. A successful case study: the bird control program of Waste Management Outer Loop Recycling and Disposal Facility, Louisville, Kentucky, USA. Paper 5 in Proceedings of Bird Strike Committee USA/Canada, 9th Annual Meeting, Kingston, Ontario. http://digitalcommons. unl.edu/birdstrike2007/5 Accessed June 2015.
Evaluating a Commercial-Ready Technology for Raptor Detection and Deterrence at a Wind Energy Facility in California
American Wind Wildlife Institute 65 September 17, 2018
de Lucas, M., G. E. E. Janss, and M. Ferrer (Editors). 2007. Birds and Wind Farms: Risk Assessment and Mitigation. Quercus, Madrid, Spain.
DTBird Team. 2017. Marcos de la Puente Nilsson, Biologist, Liquen Consultoría Ambiental, S.L., Madrid, Spain. 10 October 2017—email communication to Jeff Smith and Jeff Zirpoli of H. T. Harvey & Associates stating that DTBird does not detect birds that overlap a landscape backdrop in view of the cameras.
DTBird Team. 2016. DTBird® System Evolution. Ref: DTB0116EV. Liquen Consultoría Ambiental, S.L., Madrid, Spain. http://www.dtbird.com/images/Downloads/DTBird_System_Evolution.pdf Accessed May 2016.
ECPG (Eagle Conservation Plan Guidance) (2013) Technical Appendix D. U.S. Fish and Wildlife Service, Division of Migratory Bird Management. Available:
Erickson, W. P., G. D. Johnson, M. D. Strickland, D. P. Young, Jr., K. J. Sernka, and R. E. Good. 2001. Avian Collisions with Wind Turbines: A Summary of Existing Studies and Comparisons to Other Sources of Avian Collision Mortality in the United States. National Wind Coordinating Committee, Washington, D.C.
Erickson, W. P., G. D. Johnson, and D. P. Young, Jr. 2005. A Summary and Comparison of Bird Mortality from Anthropogenic Causes with an Emphasis on Collisions. General Technical Report PSW-GTR-191. USDA Forest Service, Pacific Southwest Research Station, Albany, California.
Fernie, A. 2012. TLogDataExtractor. Version 1.1. https://onedrive.live.com/?cid=2B4DC8F6BD223F57 &id=2B4DC8F6BD223F57%212440 Accessed February 2017.
Fournier, D. A., H. J. Skaug, J. Ancheta, J. Ianelli, A. Magnusson, M. N. Maunder, and J. Sibert. 2012. AD model builder: using automatic differentiation for statistical inference of highly parameterized complex nonlinear models. Optimization Methods and Software 27:233–249.
Hanagasioglu, M., J. Aschwanden, R. Bontadina, and M. de la Puente Nilsson. 2015. Investigation of the Effectiveness of Bat and Bird Detection of the DTBat and DTBird Systems at Calandawind Turbine. Final Report. Prepared for the Swiss Federal Office of Energy Research Program, Wind Energy and Federal Office for the Environment Species, Ecosystems, Landscapes Division. Bern, Switzerland.
Hawkins, D. M., and W. J. R. Eplett. 1982. The Cholesky factorization of the inverse correlation or covariance matrix in multiple regression. Technometrics 24:191–198.
Hunt, G. 2002. Golden Eagles in a Perilous Landscape: Predicting the Effects of Mitigation for Wind Turbine Blade-strike Mortality. Consultant Report P500-02-043F. Public Interest Energy Research (PIER) Program, California Energy Commission, Sacramento, California.
ICF International. 2016. Altamont Pass Wind Resource Area Bird Fatality Study, Monitoring Years 2005–2013. Final Report. Sacramento, California. Prepared for Alameda County Community Development Agency, Hayward, California.
Junda, J. H., E. Greene, D. Zazelenchuk, and D. M. Bird. 2016. Nest defense behaviour of four raptor species (osprey, bald eagle, ferruginous hawk, and red-tailed hawk) to a novel aerial intruder – a small rotary-winged UAV. Journal of Unmanned Vehicle Systems 4:217–227.

Evaluating a Commercial-Ready Technology for Raptor Detection and Deterrence at a Wind Energy Facility in California
American Wind Wildlife Institute 66 September 17, 2018
Kochert, M. N., C. L. Steenhof, and E. H. Craig. 2002. Golden eagle Aquila chrysaetos. No 684 in A. Poole and F. Gill (Editors), The Birds of North America. The Birds of North America, Inc., Philadelphia, Pennsylvania.
Kuehn, M. 2016. Senior Biologist, Bloom Biological, Inc., Santa Ana, California. 26 February 2016—personal communication with J. P. Smith, H. T. Harvey & Associates, Los Gatos, California, concerning golden eagle and other raptor activity during a visit to the Manzana Wind Power Project, Rosamond, California.
Litsgård, F., A. Eriksson, T. Wizelius, and T. Säfström. 2016. DTBird System Pilot Installation in Sweden. Possibilities for Bird Monitoring Systems Around Wind Farms. Experiences from Sweden’s First DTBird Installation. Ecocom AB, Kalmar, Sweden. (English summary provided by DTBird Team)
May, R., Ø. Hamre, R. Vang, and T. Nygård. 2012. Evaluation of the DTBird Video-System at the Smøla Wind-Power Plant: Detection Capabilities for Capturing Near-Turbine Avian Behaviour. NINA Report 910. Norwegian Institute for Nature Research, Trondheim, Norway.
May, R., O. Reitan, K. Bevanger, S.-H. Lorensten, and T. Nygård. 2015. Mitigating wind-turbine induced avian mortality: Sensory, aerodynamic and cognitive constraints and options. Renewable and Sustainable Energy Reviews 42:170–181.
Mazerolle, M. J. 2017. AICcmodavg: Model selection and multimodel inference based on (Q)AIC(c). R package version 2.1-1. https://cran.r-project.org/package=AICcmodavg.
Mockrin, M. H., and R. A. Gravenmier. 2012. Synthesis of Wind Energy Development and Potential Impacts on Wildlife in the Pacific Northwest, Oregon and Washington. General Technical Report PNW-GTR-863. U.S. Forest Service, Pacific Northwest Research Station, Portland, Oregon.
Nakagawa, S., and H. Schielzeth. 2013. A general and simple method for obtaining R2 from generalized linear mixed-effects models. Methods in Ecology and Evolution 4:133–142.
National Renewable Energy Laboratory. 2003. MIDC SPA calculator. Solar Radiation Research Laboratory, https://midcdmz.nrel.gov/solpos/spa.html Accessed August 2017.
New, L., E. Bjerre, B. Millsap, M. C. Otto, and M. C. Runge. 2015. A collision risk model to predict avian fatalities at wind facilities: An example using golden eagles, Aquila chrysaetos. PLoS ONE 10(7):e0130978.
Peduzzi, P., J. Concato, E. Kemper, T. R. Holford, and A. R. Feinstein. 1996. A simulation study of the number of events per variable in logistic regression analysis. Journal of Clinical Epidemiology 49:1373–1379.
Pourahmadi, M. 2007. Cholesky decompositions and estimation of a covariance matrix: orthogonality of variance–correlation parameters. Biometrika 94:1006–1013.
Reda, I., and A. Andreas. 2004. Solar position algorithm for solar radiation applications. Solar Energy 76:577–589.
Reis, J. M., and P. J. Resca. 1997. Integration of commercial video motion detection into USAF flightline applications. In A. T. DePersia, S. Yeager, and S. M. Ortiz (Editors), Proceedings SPIE 2935, 18 November 1996, Boston, Massachusetts—Surveillance and Assessment Technologies for Law Enforcement. SPIE Digital Library doi:10.1117/12.266806.

Evaluating a Commercial-Ready Technology for Raptor Detection and Deterrence at a Wind Energy Facility in California
American Wind Wildlife Institute 67 September 17, 2018
R Core Team. 2017. R: A language and environment for statistical computing. Version 3.4.2. R Foundation for Statistical Computing, Vienna, Austria. ISBN 3-900051-07-0. http://www.R-project.org.
Ronconi, R. A., and C. Cassady St. Clair. 2006. Efficacy of a radar-activated on-demand system for deterring waterfowl from oil sands tailings ponds. Journal of Applied Ecology 43:111–119.
Sapphos Environmental, Inc. 2006. PdV Wind Energy Project Biological Resources Technical Report. Pasadena, California. Prepared for EnXco, Inc., Mojave, California.
Sapphos Environmental, Inc. 2009. Pacific Wind Energy Project Biological Resources Technical Report. Pasadena, California. Prepared for EnXco Development Corporation, San Ramon, California.
Sapphos Environmental, Inc. 2011a. Tylerhorse Wind Energy Project Biological Resources Technical Report. Pasadena, California. Prepared for Bureau of Land Management Renewable Energy Coordinating Office, California Desert District, Moreno Valley, California.
Sapphos Environmental, Inc. 2011b. Catalina Renewable Energy Project Biological Resources Technical Report. Pasadena, California. Prepared for EnXco Development Corporation, San Ramon, California.
Skaug, H., D. Fournier, B. Bolker, A. Magnusson, and A. Nielsen. 2015. glmmADMB: generalized linear mixed models using AD model builder. R package v. 0.8.1. http://glmmadmb.r-forge.r-project.org Accessed September 2017.
Sinclair, K., and E. DeGeorge. 2016. Framework for Testing the Effectiveness of Bat and Eagle Impact-Reduction Strategies at Wind Energy Projects. Technical Report NREL/TP-5000-65624. U.S. Department of Energy, National Renewable Energy Laboratory, Golden, Colorado.
Smallwood, K. S., L. Rugge, and M. L. Morrison. 2009. Influence of bird behavior on bird mortality in wind energy developments. Journal of Wildlife Management 73:1082–1098.
Smallwood, K. S. 2013. Comparing bird and bat fatality-rate estimates among North American wind-energy projects. Wildlife Society Bulletin 37:19–33.
Stevens, G. R., J. Rogue, R. Weber, L. Clark. 2000. Evaluation of a radar-activated, demand-performance bird hazing system. International Biodeterioration and Biodegradation 45:129–137.
Straffi, P. 2016. On Screen Protractor. v0.5. https://sourceforge.net/projects/osprotractor Accessed August 2017.
Symonds, M. R., and A. Moussalli. 2011. A brief guide to model selection, multimodel inference and model averaging in behavioural ecology using Akaike’s information criterion. Behavioral Ecology and Sociobiology 65:13–21.
Tack, J. D., and B. C. Fedy. 2015. Landscapes for energy and wildlife: conservation prioritization for golden eagles across large spatial scales. PLOS One 10(8):e0134781.
Thelander, C. G., and L. Rugge. 2000. Avian Risk Behavior and Fatalities at the Altamont Wind Resource Area: March 1998 to February 1999. NREL/SR-500-27545. National Renewable Energy Laboratory, Golden, Colorado.

Evaluating a Commercial-Ready Technology for Raptor Detection and Deterrence at a Wind Energy Facility in California
American Wind Wildlife Institute 68 September 17, 2018
U.S. Department of Defense. 2010. Bird/Animal Aircraft Strike Hazard (BASH) Linking Aviation Safety and Conservation. Fact Sheet #4. Partners in Flight. https://www.denix.osd.mil/nr/priorities/birds/ bash/bird-aircraft-strike-hazard-bash/ Accessed July 2015.
van den Broek, S. P., E. J. Bakker, D.-J. de Lange, and A. Theil. 2000. Detection and classification of infrared decoys and small targets in a sea background. In W. R. Watkins, D. Clement, and W. R. Reynolds (Editors), Proceedings SPIE 4029, 24 April 2000, Orlando, Florida—Targets and Backgrounds VI: Characterization, Visualization, and the Detection Process. SPIE Digital Library doi:10.1117/ 12.392513.
Vittinghoff, E., and C. E. McCulloch. 2006. Relaxing the rule of ten events per variable in logistic regression and Cox regression. American Journal of Epidemiology 165(6):710–718.
Whitfield, D. 2004. Modelling the effects of persecution on the population dynamics of golden eagles in Scotland. Biological Conservation 119:319–333.
Zar, J.H. 1998. Biostatistical Analysis. Fourth edition. Prentice Hall, New Jersey.
Zuur, A. F., E. N. Ieno, and C. S. Elphick. 2010. A protocol for data exploration to avoid common statistical problems. Methods in Ecology and Evolution 1:3–14.

Evaluating a Commercial-Ready Technology for Raptor Detection and Deterrence at a Wind Energy Facility in California
American Wind Wildlife Institute 69
August 27, 2018
Appendix A. Deterrence Response Classification Protocol
Objectives:
• Subjectively evaluate risk and reaction.
• Determine if changes in flight trajectory resulting from emission of deterrent signal suggest a significantly altered flight path; i.e., change in direction >15°.
General Guidance:
• Use onscreen protractor (Straffi 2016) to assist with measurements.
• Record data in the DTBird digital analysis platform (DAP) Behavior field.
• Some steps require watching videos multiple times to properly arrange the protractor and classify risk and reaction.
• For subjective determinations, include notes describing basis for choosing a particular category.
• Use recorded DAP timestamps and clock in lower left corner of video as precise timing guides, not the onscreen appearance of corresponding colored boxes (red around tracked object = detection, green around video = warning signal triggered, yellow around video = dissuasion signal triggered).
1. Watch entire video and classify the flight travel direction BEFORE the signal was emitted as follows:
a. T: Toward – bird moving toward turbine.
b. A: Away – bird moving away from turbine
c. G: Tangential – bird moving neither toward nor away from the turbine but tangential to it (i.e., passing by the turbine on any side)
2. Watch the entire video and classify the level of risk BEFORE the signal was emitted as follows:
a. H: high risk – moving toward turbine at a trajectory and height that could take it near the current RSZ (defined for this purpose as the current, approximate 2D plane of rotation).
b. M: medium risk – moving toward turbine at a trajectory and height that may take it near the turbine, but either below or above the RSZ
c. L: low risk – moving perpendicular to or away from the turbine well away from the RSZ, or at high altitude well above the RSZ
3. Watch the entire video and subjectively classify whether the bird appeared to react to a deterrent signal as follows:
a. Y: Yes – obviously reacted to signal by noticeably changing flight pattern (e.g., circling to direct flight, or gliding to powered flight), reversing course, modifying airspeed, and/or altering flapping frequency
b. P: Potential – appeared to react to signal, but not definitively enough to be confident that the reaction was solely a response to the signal emission
c. N: No – maintained similar flight pattern (course, speed, and flapping frequency) before and after signal was emitted

Evaluating a Commercial-Ready Technology for Raptor Detection and Deterrence at a Wind Energy Facility in California
American Wind Wildlife Institute 70
August 27, 2018
d. U: Unknown/undetermined – potential reaction was too subtle to confidently determine if a response occurred; the bird was already moving away from the signal or away from the turbine when the signal was emitted; and/or the video/bird-image quality was not favorable for discerning a reaction.
4. Watch the entire video and classify the flight direction AFTER the signal was emitted as follows:
a. T: toward – moving toward turbine.
b. A: Away – moving away from turbine
c. G: Tangential – moving neither toward nor away from the turbine but tangential to it (i.e., passing by the turbine on any side)
5. Make the deflection measurement:
a. Measure diversion angles for Warning signals only if either:
i. no Dissuasion signal was triggered, or
ii. >5 sec elapsed between Warning and Dissuasion signals
b. Adjust webpage zoom factor or use full screen mode to make measurement easier
c. On the View drop-down menu of the protractor, select to show the 360°-AOB
d. Resize onscreen protractor to fit the DAP video, ensuring that the protractor does not cover the DAP video controls.
e. Center the protractor Origin of Axis at either 1) the location where the bird is when a deterrent signal is triggered, or 2) the point within 5 sec after the relevant signal is triggered at which the bird visibly responds to the deterrent by diverting its flight path:
iii. Use the Warning Init. and Dissuasion Init. times and the clock in the lower left portion of the video screen to mark relevant signal events. Appearance of the green or yellow boxes around the screen are also helpful markers, but those appearances may lag 1–2 sec behind that actual event trigger.
iv. Use your best judgement when deciding where to put the Origin of Axis if not using the Warning or Dissuasion Init. times.
f. Move the protractor A point (and associated line) onto the path the bird flies during the 1–5 sec before the signal is emitted
v. Move the A box past the Origin of Axis in the direction the bird is travelling
vi. When the bird is flying a very nonlinear flight path before the signal is emitted, attempt to define the trajectory during the 3 sec before the signal trigger. If this is not possible because the bird is flying too curvy a trajectory, place a U (for unknown) where the angle measurement would normally go.
g. Move the protractor B point (and associated line) onto the “after” location of the bird at least 3 sec and preferably 5 sec after the signal was triggered, depending on how long the bird remains in view.
h. Record angle in degrees between the A and B lines
vii. Round to whole numbers
viii. Measurement ≤180°

Evaluating a Commercial-Ready Technology for Raptor Detection and Deterrence at a Wind Energy Facility in California
American Wind Wildlife Institute 71
August 27, 2018
6. After making the deflection measurement, classify the response based on whether it had the desired effect of moving the bird away from the RSZ as follows (do this for both Warning and Dissuasion signals, when appropriate, as detailed above in 5a):
a. Y: Yes – reacted in a way that, based on the change in flight pattern and direction, reduced the risk of collision with the turbine blades
b. P: Potential – appeared to react to signal, but response was not definitive enough to be confident that the bird was at less risk after signal emission
c. N: No – reacted to signal (e.g., temporarily altered its flapping rate) but did not alter its flight path away from RSZ
d. Z: Not relevant – did not visibly react to signal
e. U: Unknown/undetermined – bird was already moving away from the turbine when the signal was emitted; the video quality or bird image quality was not favorable for determining the 3D reaction of the bird on the 2D video screen; or it simply was not possible to determine with any sense of confidence whether a reaction occurred or not due to other factors.
7. Order data recorded in the Behavior field as follows: Direction Before (No. 1), Risk Level (No. 2), Reaction Observed (No. 3), Direction After (No. 4), Deflection Angle (No. 5i), Desired Reaction (No. 6).
8. Following are examples of recorded data:
a. Warning signal only: 09052017gmyg22u-xxxxxx
b. Dissuasion signal only: 09052017xxxxxx-thya20y
c. Warning and Dissuasion signals triggered ≥5 sec apart: 09052017glng55n-glya90y
d. Warning and Dissuasion signals triggered <5 sec apart: 09052017gmng10z-gmng10z
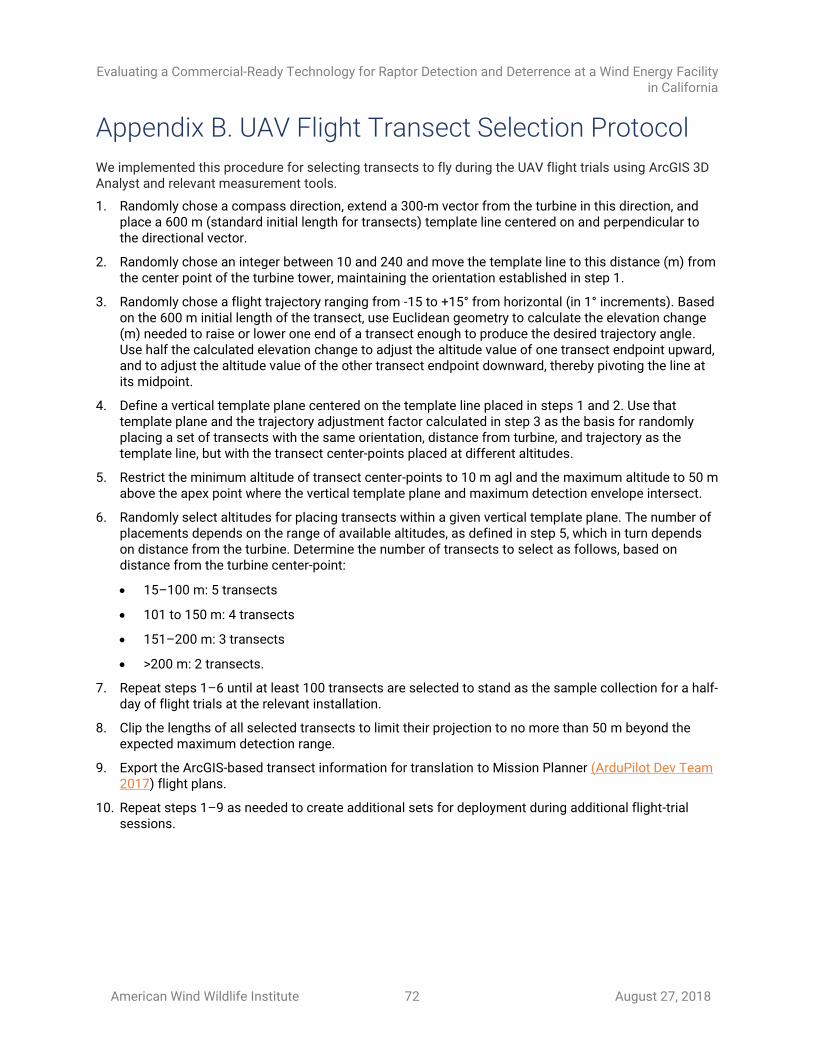
Evaluating a Commercial-Ready Technology for Raptor Detection and Deterrence at a Wind Energy Facility in California
American Wind Wildlife Institute 72
August 27, 2018
Appendix B. UAV Flight Transect Selection Protocol
We implemented this procedure for selecting transects to fly during the UAV flight trials using ArcGIS 3D Analyst and relevant measurement tools.
1. Randomly chose a compass direction, extend a 300-m vector from the turbine in this direction, and place a 600 m (standard initial length for transects) template line centered on and perpendicular to the directional vector.
2. Randomly chose an integer between 10 and 240 and move the template line to this distance (m) from the center point of the turbine tower, maintaining the orientation established in step 1.
3. Randomly chose a flight trajectory ranging from -15 to +15° from horizontal (in 1° increments). Based on the 600 m initial length of the transect, use Euclidean geometry to calculate the elevation change (m) needed to raise or lower one end of a transect enough to produce the desired trajectory angle. Use half the calculated elevation change to adjust the altitude value of one transect endpoint upward, and to adjust the altitude value of the other transect endpoint downward, thereby pivoting the line at its midpoint.
4. Define a vertical template plane centered on the template line placed in steps 1 and 2. Use that template plane and the trajectory adjustment factor calculated in step 3 as the basis for randomly placing a set of transects with the same orientation, distance from turbine, and trajectory as the template line, but with the transect center-points placed at different altitudes.
5. Restrict the minimum altitude of transect center-points to 10 m agl and the maximum altitude to 50 m above the apex point where the vertical template plane and maximum detection envelope intersect.
6. Randomly select altitudes for placing transects within a given vertical template plane. The number of placements depends on the range of available altitudes, as defined in step 5, which in turn depends on distance from the turbine. Determine the number of transects to select as follows, based on distance from the turbine center-point:
• 15–100 m: 5 transects
• 101 to 150 m: 4 transects
• 151–200 m: 3 transects
• >200 m: 2 transects.
7. Repeat steps 1–6 until at least 100 transects are selected to stand as the sample collection for a half-day of flight trials at the relevant installation.
8. Clip the lengths of all selected transects to limit their projection to no more than 50 m beyond the expected maximum detection range.
9. Export the ArcGIS-based transect information for translation to Mission Planner (ArduPilot Dev Team 2017) flight plans.
10. Repeat steps 1–9 as needed to create additional sets for deployment during additional flight-trial sessions.

Evaluating a Commercial-Ready Technology for Raptor Detection and Deterrence at a Wind Energy Facility in California
American Wind Wildlife Institute 73
August 27, 2018
Appendix C. UAV Flight Trial Orchestration Protocol
A key objective of this study was to evaluate the DTBird system using UAVs to mimic eagle flights around nonoperational turbines equipped with DTBird. We summarize insight gleaned about the logistical feasibility of this approach, outline recommended procedures to orchestrate UAV flight trials based on preselected transects (see Appendix B) while guarding against adverse interactions with in situ raptors, and summarize our observations during the study concerning interactions between the UAVs and in situ raptors.
The advantages of using UAVs for the flight trials were that: (1) we could precisely orchestrate their flights by preprogramming the aircraft to fly specific GPS-controlled routes; (2) UAVs are tireless (except for needing to replace/recharge batteries); and (3) UAVs were more easily flown in a range of environmental conditions than trained raptors. Use of UAVs also avoided risking the safety of a living, trained raptor, and reduced the need for turbine curtailment during the flight trials.
The limitations for flying the fixed-winged UAVs were that they could not be operated safely in turbulent winds in excess of about 30 kph or when there was moisture in the air (fog, dense clouds, or rain/snow). Moisture that penetrates the aircraft can kill the avionics system and crash the aircraft. That said, most raptors typically experience similar wind-condition limitations when operating in a local environment. Although when migrating or otherwise traversing long distances they may take advantage of stronger tail winds, excessive turbulence and wind speeds greater than 30–40 kph generally constrain home-range and foraging activity. Using trained raptors instead of UAVs would have been constrained by inclement weather and strong winds, and summer heat, and individual birds could have been flown only for limited periods each day.
We recommend that the very early stages of planning to conduct UAV flight trials at a facility include submitting an application to the FAA (or another relevant entity if outside the U.S.) for an exemption to authorize exceeding the usual 400-foot above structures altitude limit for UAV flights. We attempted to secure such an exemption, but after months of waiting to receive a response, we were forced to proceed without, though the lack of an exemption did not hinder our investigation to a substantial degree (see Section 2.3.2).
Creating Mission Plans for Implementation in Mission Planner
1. Use ArcGIS to calculate the direction from turbine for each transect start and end point.
2. Organize the preselected transects into sequential order using custom spreadsheet, database, or R-based sorting algorithms:
a. Randomly select one transect from the batch of preselected transects.
b. Identify the next transect by finding the start point with a direction from the turbine that is closest to the end point of the randomly selected transect.
c. Repeat this process until all transects are selected and ordered.
3. For each turbine installation where flight trials will occur, preselect a series of loiter points that are located at least 200 m outside of the expected DTBird maximum detection envelope and at least 200 m from any operational turbines near the focal turbine.
4. Use a spreadsheet to integrate the coordinates for a predetermined loiter point after each transect end point, in each case selecting a loiter point that is between the previous transect endpoint and the next transect start point in the ordered sequence.

Evaluating a Commercial-Ready Technology for Raptor Detection and Deterrence at a Wind Energy Facility in California
American Wind Wildlife Institute 74
August 27, 2018
5. Set loiter altitudes at the midpoint altitude between the last transect end point and the next sequential transect start point to maximize flight efficiency.
6. Organize each batch of turbine-specific transects into individual mission packages that are expected to require close to a full UAV battery charge to fly (i.e., a 30–40-minute period, expected to yield approximately 15 transects per mission) (see Appendix B).
7. Add necessary mission control coding to the individual mission packages to set loiter time to 30 sec (based on guidance provided with Mission Planner software [ArduPilot Dev Team 2017]).
8. Export the spreadsheet-based mission packages to *.txt files for uploading to Mission Planner.
Flight Trial Days:
1. A three-person team is necessary to ensure safe operation of the UAV, record useful ancillary data, and avoid adverse interactions with in situ birds and other aircraft. The roles and responsibilities of the operations team are as follows:
• Licensed Pilot
- Ensure proper aircraft maintenance and operation
- Ensure proper settings and operation of Mission Planner software used to control automated flights
- Manually controls UAV during takeoffs and landings and customized low-altitude flights
- Constantly monitors automated flights visually and using a UAV video feed from a nose-mounted camera to assist with precise navigation
- Prepared to take active control at any time, as needed, to avoid collisions with turbines, adverse interactions with in situ raptors and other aircraft, and adjust to problematic wind conditions
- Curtails flight trials when flight conditions are no longer compatible with safely operating the UAV
• “Laptop” Pilot
- Programs flight sequences to run in Mission Planner and control the automated UAV flights
- Uses laptop with Mission Planner software to implement automated flight sequences and track UAV flights
- Verbally communicates to Licensed Pilot information about battery voltage, the characteristics and sequencing of the automated flight tracks, and other essential operational parameters
- Documents timing of flight trials and other operational details
- Records data on occurrences of, and interactions with, raptors, other birds, and other aircraft in the relevant sampling domains during the trials, as communicated by the Observer
• Observer
- Skilled raptor observer maintains constant watch during all flight trials for local raptors, other birds, and other aircraft that represent either a potential conflict for continued operation of the UAV or could trigger DTBird detection and deterrent-triggering events that conflict with documenting responses to the UAV
- Verbally communicates with Licensed Pilot and Laptop Pilot to coordinate flight modifications required to avoid adverse interactions with in situ raptors or other aircraft
- Verbally communicates details of relevant observations to Laptop Pilot for recordkeeping

Evaluating a Commercial-Ready Technology for Raptor Detection and Deterrence at a Wind Energy Facility in California
American Wind Wildlife Institute 75
August 27, 2018
2. Request in advance to have Liquen mute the deterrent signals at focal turbines throughout daylight hours on relevant flight-trial days, so that the operations team can communicate effectively during the trials. Advanced communication is required to accommodate the time zone difference between the U.S. and Spain (Liquen headquarters).
3. Following preapproved and standardized radio communication protocols, request that the facility operators curtail the focal turbine and adjacent turbines located within 375 m immediately prior to implementing the flight trials. This curtailment buffering is necessary to enable sufficient 360° sampling coverage around the turbine and preclude adverse interactions between spinning turbine blades and the UAV.
4. Load mission package *.txt files into Mission Planner on the operations laptop.
5. Load fully charged batteries into UAV.
6. Verify operational integrity of Mission Planner software system, UAV, controller system, and video feed.
7. Verify airspace is clear of local raptors and other birds.
8. Launch aircraft and commence automated mission sequence, recording start and stop times for all missions.
9. Record start and end times for all transects based on waypoint tracking in Mission Planner.
10. Monitor battery power closely through Mission Planner interface and culminate mission before stored battery power drops to a critical level.
11. Remove used batteries from UAV and begin recharging.
12. Swap in second UAV battery pack and commence new mission.
Avoiding Adverse Interactions with Local Eagles and Other Raptors
We documented occurrences of in situ raptors that represented possible interactions with the UAVs and recorded relevant behavioral observations. These observations are detailed below:
Date (2017) Description of Interaction
January 18 A second-year golden eagle briefly interacted with the UAV. The eagle appeared from the southeast flying high and made a weak dive at the UAV before departing the area. Once the observer informed him of the eagle’s presence, the pilot immediately took manual control of the UAV and performed evasive maneuvers. No contact occurred between the UAV and the eagle, and when the engine throttled up and the aircraft accelerated, the eagle moved away and headed north out of view.
A probable adult golden eagle traveled south from northwest of the facility, then circled to the west and southwest while being harassed by common ravens. Traveling south initially, the eagle passed within approximately 1.2 km of the active UAV. After circling and wandering around to the southwest for a while, the eagle ultimately flew back north and out of view, never exhibiting any response toward the UAV. We did not alter the UAV flight trials in response to this eagle, with the aircraft always at least 1–2 km from the eagle.

Evaluating a Commercial-Ready Technology for Raptor Detection and Deterrence at a Wind Energy Facility in California
American Wind Wildlife Institute 76
August 27, 2018
Date (2017) Description of Interaction
February 21 A second-year golden eagle flew within 200 m over the UAV and exhibited no reaction. The eagle continued circling east to high altitudes and out of view to the north-northeast.
Also on this day, within a span of approximately 5 minutes, two ferruginous hawks flew over the UAV but did not appear to react to it.
August 8 We observed a variety of raptors near the flight trials operations.
A juvenile red-tailed hawk flew over the UAV and appeared to mimic its circling pattern, at which point the pilot immediately took manual control of the UAV and, as the UAV throttled up, the hawk moved away. Then an adult red-tailed hawk appeared to briefly investigate the UAV, but otherwise did not interact with it.
Later that day, an adult red-tailed hawk, as well as a potential broad-winged hawk (Buteo platypterus), flew by high over the UAV, but showed no signs of reacting to it.
A Cooper’s hawk flew near the UAV and appeared to flinch as the UAV turned but otherwise continued on its way.
An adult peregrine falcon followed the UAV for a few seconds, circled above it, then departed out of view with no further ado.
Around that same time, an adult red-tailed hawk and a juvenile red-tailed hawk soared over the UAV without responding to the UAV.
August 10 We observed a juvenile golden eagle within approximately 0.8 km of the UAV. This eagle did not appear to react to the UAV and ultimately departed to the north and out of view.
We sighted a peregrine falcon and prairie falcon within ~1 km of the UAV, but they were primarily interested in harassing one another and showed no sign of reacting to the UAV.
Eagle and other raptor interactions with the UAV were short-lived and never resulted in harm to the UAV or birds, with most raptors indicating little or no interest in the UAV. Beyond the specific interactions described above, we also observed American kestrels foraging and interacting with one another in the vicinity of our flight trial operations on several occasions. These birds never showed any signs of purposefully investigating the UAV, but may have been scared off by the aircraft on a few occasions.
To minimize the potential for adverse interactions with, and disturbance effects on, in situ raptors, a qualified ornithologist/raptor biologist should watch for in situ raptors during all UAV flight trials, and directs avoidance actions, if required, following these protocols:
• The observer will operate from visually advantageous locations and remain in visual contact with the UAV, and in visual and auditory contact with the UAV pilot, at all times while flight trials are underway;
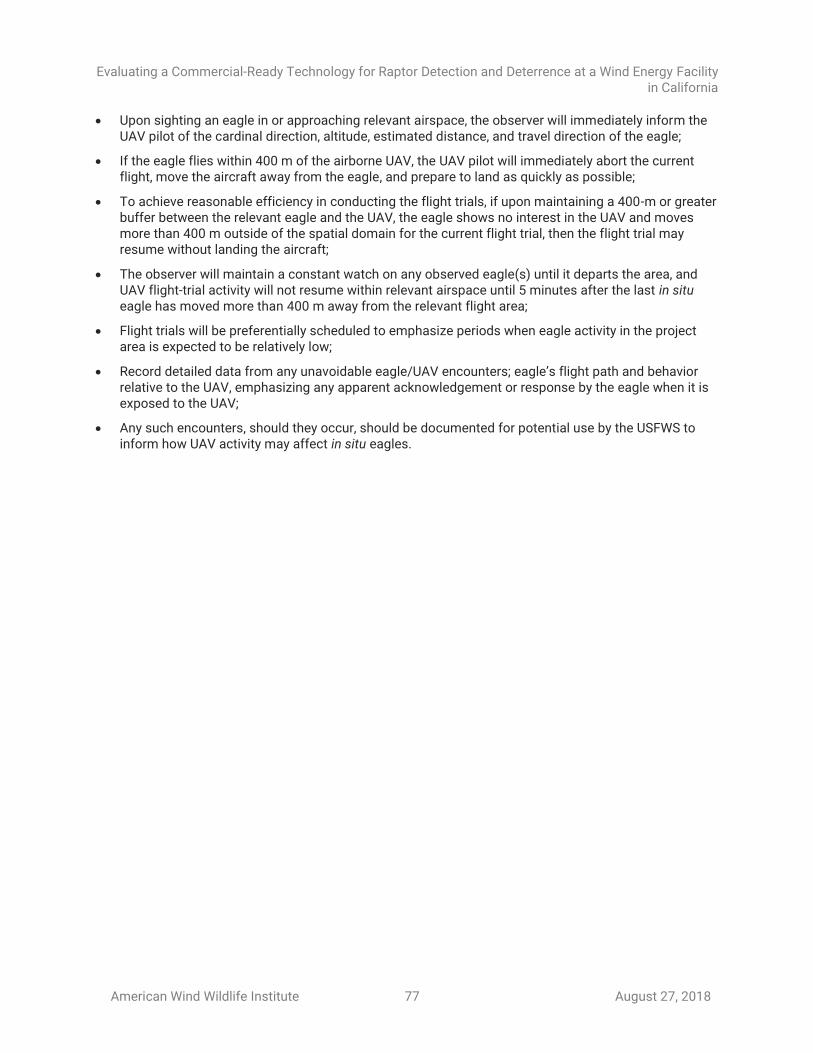
Evaluating a Commercial-Ready Technology for Raptor Detection and Deterrence at a Wind Energy Facility in California
American Wind Wildlife Institute 77
August 27, 2018
• Upon sighting an eagle in or approaching relevant airspace, the observer will immediately inform the UAV pilot of the cardinal direction, altitude, estimated distance, and travel direction of the eagle;
• If the eagle flies within 400 m of the airborne UAV, the UAV pilot will immediately abort the current flight, move the aircraft away from the eagle, and prepare to land as quickly as possible;
• To achieve reasonable efficiency in conducting the flight trials, if upon maintaining a 400-m or greater buffer between the relevant eagle and the UAV, the eagle shows no interest in the UAV and moves more than 400 m outside of the spatial domain for the current flight trial, then the flight trial may resume without landing the aircraft;
• The observer will maintain a constant watch on any observed eagle(s) until it departs the area, and UAV flight-trial activity will not resume within relevant airspace until 5 minutes after the last in situ eagle has moved more than 400 m away from the relevant flight area;
• Flight trials will be preferentially scheduled to emphasize periods when eagle activity in the project area is expected to be relatively low;
• Record detailed data from any unavoidable eagle/UAV encounters; eagle’s flight path and behavior relative to the UAV, emphasizing any apparent acknowledgement or response by the eagle when it is exposed to the UAV;
• Any such encounters, should they occur, should be documented for potential use by the USFWS to inform how UAV activity may affect in situ eagles.

Evaluating a Commercial-Ready Technology for Raptor Detection and Deterrence at a Wind Energy Facility in California
American Wind Wildlife Institute 78
August 27, 2018
Appendix D. DAP and UAV Data Postprocessing Protocol
In this section we outline the procedures followed to process the UAV avionics data collected during flights, process the DTBird DAP data, and match the UAV avionics data with relevant DAP event records.
Process UAV Avionics Data
1. Offload data from the UAV avionics in *.tlog file format.
2. Import the *.tlog files into Mission Planner (ArduPilot Dev Team 2017) and convert to *.txt format.
3. Open the *.txt files with the custom software package TLogDataExtractor (Fernie 2012).
4. In TLogDataExtractor, select the parameters that are relevant for the analysis.
5. Save the selected parameters from TLogDataExtractor to a spreadsheet format.
6. As needed, apply transformations to render the extracted data in desired units.
7. To support matching the UAV data (many records per second) to the DAP data (timestamps limited to 1-sec accuracy), randomly select one UAV record to represent each 1-sec interval.
Process DAP Data
1. After classifying DAP event records of interest and entering customized user-specific data, export the DAP data to spreadsheet format.
2. Split the DAP event records into separate records for detection, warning signal, and dissuasion signal events, each with its own timestamp from the original integrated DAP record.
Integrate UAV Avionics Data and DAP Data
1. Match timestamps (resolved to the 1-sec level) from the DAP data to the UAV avionics data and merge the relevant DAP event records with the appropriate UAV avionics records.
2. Review the combined file and GIS-based depictions of relevant flights and matched event records to search for and correct any erroneous matches.
Add Covariates
1. Collect solar data for each UAV GPS point
a. Use the points solar radiation tool in ArcGIS Spatial Analyst to estimate the solar irradiation level (T0) impinging on the UAV at a given time.
b. Use a solar position calculator (National Renewable Energy Laboratory 2003, Reda and Andreas 2004) to obtain solar azimuth angle (compass direction of sun relative to observer) and solar elevation angle (vertical angle to sun, ranging from 0° [on the horizon] to 90° [straight up vertical).
c. Append the solar data to the UAV avionics data using matching timestamps and UAV GPS coordinates
2. Use GIS software to calculate supplementary parameters to augment the avionics data; i.e., lateral distance from UAV to turbine, line-of-sight distance (Response Distance) from UAV to nearest DTBird camera, and elevation angle from camera to UAV.

Evaluating a Commercial-Ready Technology for Raptor Detection and Deterrence at a Wind Energy Facility in California
American Wind Wildlife Institute 79
August 27, 2018
Isolate Independent Flight Segments
1. Use ArcGIS 3D Analyst to develop clipping masks with outer boundaries located beyond the calibrated maximum DTBird detection distance for a given targeted species but shy of all loiter point buffer areas.
2. Using the custom clipping mask, clip out all avionics records that reflect flight activity outside the area of interest.
3. Segment the remaining flight data into individually identified flight paths that can be considered independent transect and flight-segment samples.

Evaluating a Commercial-Ready Technology for Raptor Detection and Deterrence at a Wind Energy Facility in California
American Wind Wildlife Institute 80
August 27, 2018
Appendix E. Tasks Not Considered Due to Practical Constraints and Funding Limitations
Controlled Experiment to Evaluate Probability of Deterrence
We considered implementing a controlled experiment to help evaluate the responses of in situ raptors confronted with deterrent signals by operating some DTBird systems with the deterrent signals operational and some with the signals muted for extended periods. Indication of a lower dissuasion-signal triggering rate at turbines with the deterrence module operating would suggest that the warning signals were effective in reducing the likelihood of continued passage toward the RSZ. In addition, if learning and habituation occurred, we might also expect to see different indicative temporal trends in the detection and warning-signal triggering rates at control versus treatment turbines.
A viable experiment would have required either at least 2–3 times more DTBird installations or shifting the locations of the seven installations every few months to provide sufficient numbers of control and treatment samples and reasonable statistical power for detecting meaningful differences and supporting relevant time-series analyses, while accounting for the influence of potential learning and habituation among resident raptors. Decreasing the number of fully functional deterrence modules also might reduce the number of samples available for evaluating the behavioral responses of in situ raptors to an insufficient level.
A controlled experiment run with enough installations for a long enough period would be a powerful way to evaluate the long-term effectiveness of the DTBird deterrence module. Given the limited number of DTBird installations and a short 9-month study period, we considered it a higher priority to focus on directly evaluating the behavioral responses of in situ raptors exposed to the deterrent signals.
Evaluation of False-Positive Detection Rates
Quantifying the rate of false positives is an important component of evaluating the overall performance and efficiency of the DTBird surveillance system. Resource limitations precluded our conducting an intensive analysis of false positives for this report; however, we will be preparing a more detailed assessment of false positives as part of an expansion of this research sponsored by the U.S. Department of Energy.
Modeling the Probability of Detection and Deterrent-Triggering at Expected Distances
Our approach for modeling observed detection and deterrent-triggering distances yielded robust insight about how various flight characteristics, landscape features, and ambient lighting influenced DTBird’s ability to detect relevant objects and emit deterrent signals when appropriate. One limitation of our approach was that it necessarily excluded cases where DTBird failed to detect a UAV flight (false negatives). Quantifying false-negative rates and understanding the factors that result in false negatives is an important component of evaluating the efficacy of the DTBird system. In the context of this study, we included some simple analyses of the probability of detection at specific distances and modeling the influence of various covariates on detection and deterrent-triggering response distances provided insight about what drives effective detection. However, our approach did not allow for independent isolation of the relative importance of different covariates in predicting false negatives. An alternative modeling approach that would allow for such an evaluation would be to develop logistic GLMMs with binary response variables representing whether or not the UAV is detected at an expected distance (given the specific calibration of the DTBird system) and whether or not deterrent signals are triggered at expected distances.

Evaluating a Commercial-Ready Technology for Raptor Detection and Deterrence at a Wind Energy Facility in California
American Wind Wildlife Institute 81
August 27, 2018
We did not promote this modeling approach as a primary analytical tool in this study for several reasons: (1) we assumed a low probability of yielding additional novel insight about the influence of predictors of interest on detection and deterrent-triggering responses; (2) we could independently estimate the probability of detection and deterrent-triggering at expected distances from the response-distance data; (3) developing models with response distance as a continuous dependent variable was more straightforward than analyzing logistic GLMMs; and (4) developing meaningful covariates to support a modeling analysis of the conditions precluding detection would be difficult because of the need to represent flight and landscape characteristics that vary over the spatial extent of individual flights.

Evaluating a Commercial-Ready Technology for Raptor Detection and Deterrence at a Wind Energy Facility in California
American Wind Wildlife Institute 82
August 27, 2018
Appendix F. Selected Examples of Candidate Models Evaluated to Produce Final Generalized Linear Mixed Model (GLMM) Relating DTBird Detection and Deterrent-Triggering Response Distances to Various Covariates
Description of Candidate Model GLMM Model Structurea AICcb Model R2
Null model Response Distance ~ (1|TurbineID) 13473.0 0.028
Additive model including all potential main effects and second-order terms
Response Distance ~ UAVID + EventType + CloudCover + sin(SunAzimuth).c + cos(SunAzimuth).c + SolarIrrad.c + SolarIrrad2.c + ClimbRate.c + ClimbRate2.c + WindSpd.c + abs(RollAngle).c + abs(PitchAngle).c + sin(DirFromTurbine).c + cos(DirFromTurbine).c + UAVElevAngle.c + RelAltitude.c + GroundSpeed.c + sin(COG).c + cos(COG).c + (1|TurbineID)
11321.7 0.842
UAVElevAngle * RelAltitude interaction added
Response Distance ~ UAVID + EventType + CloudCover + sin(SunAzimuth).c + cos(SunAzimuth).c + SolarIrrad.c + SolarIrrad2.c + ClimbRate.c + ClimbRate2.c + WindSpd.c + abs(RollAngle).c + abs(PitchAngle).c + sin(DirFromTurbine).c + cos(DirFromTurbine).c + UAVElevAngle.c * RelAltitude.c + GroundSpeed.c + sin(COG).c + cos(COG).c + (1|TurbineID)
11168.4 0.862
Unimportant main effects dropped; EventType * UAVElevAngle interactions added
Response Distance ~ UAVID + EventType * UAVElevAngle.c + EventType * UAVElevAngle2.c + CloudCover + SolarIrrad.c + SolarIrrad2.c + ClimbRate.c + WindSpd.c + UAVElevAngle.c * RelAltitude.c + UAVElevAngle2.c * RelAltitude.c + abs(RollAngle).c + abs(PitchAngle).c + (1|TurbineID)
10488.4 0.922
Final model Response Distance ~ UAVID + EventType * UAVElevAngle.c + EventType * UAVElevAngle2.c + CloudCover + SolarIrrad.c + SolarIrrad2.c + ClimbRate.c + WindSpd.c + UAVElevAngle.c * RelAltitude.c + UAVElevAngle2.c * RelAltitude.c + abs(RollAngle).c * abs(PitchAngle).c + (1|TurbineID)
10484.6 0.922
a See Section 2.4.1 for variable descriptions. Common model framework: glmmADMB family = Gaussian, link function = log, degrees of freedom = 375. For all models: Shapiro test W = 0.995 confirmed normally distributed residuals, and variance inflation factor (VIF) <4 indicated multicollinearity was not a problem.
b Akaike’s information criterion corrected for small samples sizes.

Evaluating a Commercial-Ready Technology for Raptor Detection and Deterrence at a Wind Energy Facility in California
American Wind Wildlife Institute 83
August 27, 2018
Appendix G. DTBird System Reliability
The DTBird team provided records of DTBird performance data and maintenance activity in the DAP. That report included events that came to the attention of the DTBird Team and typically involved some manner of maintenance intervention, either remotely or on site. Power-supply failures hindered service for 5 days at turbine T13 and 12 days at turbine E11, and other hardware issues caused individual cameras to malfunction at turbines D1, T13, and V17 for variable periods lasting up to 83 days. Other than because of complete system failures, no known failures of the collision avoidance (deterrent signaling) module were recorded. The details of the DTBird Team system performance report and maintenance summary are detailed in Table G-1.
Besides the events reflected in the table below, our video screening identified that all seven DTBird installations periodically experienced other camera-video failures that lasted for at least portions of 1–13 days and were problematic for screening and classifying the detection records; see Table 2 for the number of individual event records involved. Given that our screening covered only approximately one-third of the service days, the total number of days when one or more cameras or video feeds did not function properly was most likely higher than we observed.
In combination, the available data indicated that DTBird system failures or partial malfunctions compromised an estimated 231 of 1,715 (13%) installation service days (i.e., number of installations x number of service days) during the study. According to Avangrid, Manzana personnel dedicated approximately 22 hours to maintenance of the DTBird units during the study. We also note, however, that the temporary failure of an individual camera did not eliminate system functionality. Failure of a single camera compromised approximately 21% of the detection system at a given turbine (given 14° of overlap with adjacent camera viewsheds). The consequences of such coverage gaps for ultimate system effectiveness will depend on the degree to which the detection viewshed gap faces a direction from which relevant bird activity is likely to originate.

Evaluating a Commercial-Ready Technology for Raptor Detection and Deterrence at a Wind Energy Facility in California
American Wind Wildlife Institute 84
August 27, 2018
Table G-1. DTBird System Maintenance Summary Provided by DTBird Team Covering 21 December 2016 – 31 August 2017
WTG Failure
Period
Maintenance Intervention
Maintenance Hours Cause of Failure Begin End
Days out of Service1
Days in Service
D1 No failure 0 100% 0
D4 No failure 0 100% 0
D8 No failure 0 100% 0
E11
Power supply to DTBird System
3/10/17 03/13/17 3 99% Power supply restored - Client/WTG component
Power supply to DTBird System
03/17/17 03/22/17 5 98% Power supply restored - Client/WTG component
Power breaker activated
07/13/17 07/16/17 4 98% Power breaker reset 1 Voltage peak?
T13 Power breaker
activated 08/18/17 08/22/17 5 98% Power breaker reset 1 Voltage peak?
U7 No failure 0 100% 0
V17 No failure 0 100% 0
Average days in service: 99.2% Total maintenance hours: 2
Detection Module
WTG Camera Failure
Period
Maintenance Intervention
Maintenance Hours Cause of Failure Begin End
Days out of Service1
Days in Service
D1 1 No failure 0 100% 0
D1 2 No failure 0 100% 0
D1 3 No failure 0 100% 0
D1 4 Lost
communication with HD camera
08/09/17 08/12/17 4 98% DTBird Cabinet rebooted 1 HD Camera/Switch
hung up
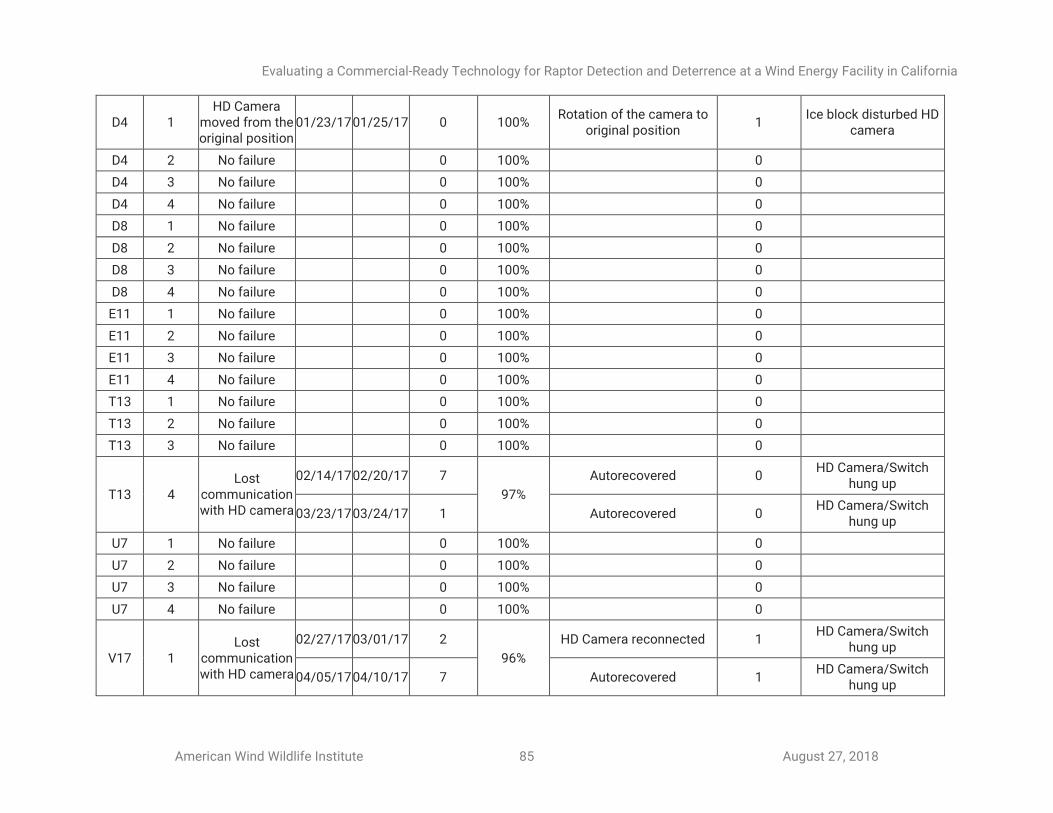
Evaluating a Commercial-Ready Technology for Raptor Detection and Deterrence at a Wind Energy Facility in California
American Wind Wildlife Institute 85
August 27, 2018
D4 1 HD Camera
moved from the original position
01/23/17 01/25/17 0 100% Rotation of the camera to
original position 1
Ice block disturbed HD camera
D4 2 No failure 0 100% 0
D4 3 No failure 0 100% 0
D4 4 No failure 0 100% 0
D8 1 No failure 0 100% 0
D8 2 No failure 0 100% 0
D8 3 No failure 0 100% 0
D8 4 No failure 0 100% 0
E11 1 No failure 0 100% 0
E11 2 No failure 0 100% 0
E11 3 No failure 0 100% 0
E11 4 No failure 0 100% 0
T13 1 No failure 0 100% 0
T13 2 No failure 0 100% 0
T13 3 No failure 0 100% 0
T13 4 Lost
communication with HD camera
02/14/17 02/20/17 7
97%
Autorecovered 0 HD Camera/Switch
hung up
03/23/17 03/24/17 1 Autorecovered 0 HD Camera/Switch
hung up
U7 1 No failure 0 100% 0
U7 2 No failure 0 100% 0
U7 3 No failure 0 100% 0
U7 4 No failure 0 100% 0
V17 1 Lost
communication with HD camera
02/27/17 03/01/17 2
96%
HD Camera reconnected 1 HD Camera/Switch
hung up
04/05/17 04/10/17 7 Autorecovered 1 HD Camera/Switch
hung up

Evaluating a Commercial-Ready Technology for Raptor Detection and Deterrence at a Wind Energy Facility in California
American Wind Wildlife Institute 86
August 27, 2018
V17 2 Lost
communication with HD camera
04/26/17 05/17/17 21 91% Autorecovered 0 HD Camera/Switch
hung up
V17 3 Intermittent
communication with HD camera
03/09/17
04/17/17
83 66%
Replaced the Ethernet tips and surge arrester bypass
1.5
HD Camera hardware failure
04/24/17
- Replaced switch (Not requested)
- Replaced Ethernet tips and the electricity
capsule outdoor
1.5
05/31/17 Replacement of the camera
outdoor 2
V17 4 No failure 0 100% 0
Average days in service: 98.2% Total maintenance hours: 9
Collision Avoidance Module
WTG Failure
Period
Maintenance Intervention
Maintenance Hours Cause of Failure Begin End
Days out of Service1
Days in Service
D1 No failure 0 100% 0
D4 No failure 0 100% 0
D8 No failure 0 100% 0
E11 No failure 0 100% 0
T13 No failure 0 100% 0
U7 No failure 0 100% 0
V17 No failure 0 100% 0
Average days in service: 100% Total maintenance hours: 0
1 Days out of service, includes failures that cause the System or a System Module do not give service. Failures that do not affect the normal service (i.e., flight detection, flight video recordings, and collision avoidance actions) are excluded.