awra national conference –tyson corner, virginia ... · • dilution is primary controlling...
TRANSCRIPT

AWRA National Conference –Tyson Corner, Virginia, November 5, 2014 Water Quality Modeling for Evaluation of Potential Surface Water and Groundwater Impacts: Aurora Gold Projects, Guyana Felix Kristanovich, PhD, PE, ENVIRON - Seattle Farid Achour, PhD, ENVIRON - Irvine

Site Location – Guyana, South America
Cuyuni River
Project Site

Outline
• Proposed Mining Operation • Contaminants of Concern and International
Finance Corporation (IFC) Effluent Guidelines • Overall Modeling Approach • Surface Water Modeling and Conclusions • Groundwater Modeling and Conclusions

Mining Operation
Source: TT, 2013

Mine – Overall Site Plan
Source: TT, 2013

Selected Potential Contaminants of Concern
Mine Water Pond (MWP): • Petroleum hydrocarbons (benzene) – leakage
from mining operations, accidental spills • Leachate metals (As, Cr, Cu, Ni) - leaching from
mine pit and mining rocks
Tailing Management Area (TMA): • Fe and residual CN (post gold leaching and
cyanide detoxification processes)

Project Regulatory Obligations
• This project is part of an updated ESIA study. • These studies are developed to meet current IFC
environmental/social performance standards and mine effluent guidelines, International Cyanide Management Code (ICMC), and other BMPs.
• IFC mine effluent guidelines are invoked by the environmental permit, and provide regulatory basis for tailings/water management facility design.
• All discharges, releases, and/or spills from the project are subject to IFC/ICMC discharge guidelines.

Modeling Approach
Surface Water Impacts: • EFDC and WMS models through TMA Diversion
Ponds 1 and 2 to receiving stream, and from FWP through MWP and to receiving stream
Groundwater Impacts: • WHI Unsat Suite (HELP & VS2DT)(unsaturated
zone) and Visual MODFLOW (saturated zone) (conversion from Mine-DW model) (unsaturated zone and aquifer under TMA)

SURFACE WATER IMPACTS

Attenuation Mechanisms of PCOIs

Water Quality Boundary Conditions
TMA • PCOIs (CNT, CNF, Fe, TSS) conc. of spillway overflow
from TMA pond • TSS conc. Of spillway overflow from TMA-D1 • TSS conc. From local runoffs
MWP • PCOIs (As, Cr, Cu, Ni, Benzene, TSS) conc. of
pumped inflow from the mine pit sump areas • TSS conc. from local runoffs

Input PCOI and IFC Standards
Facility PCOI
PCOIs Input Concentrations and Data
IFC Effluent Standard (mg/L) Runoff Conc. –
modeling (mg/L)
Leaching Conc. – Lab Test (mg/L)
Decant Conc. –
modeling (mg/L)
Decant Conc. – Lab Test (mg/L)
TMA
CNT N/A N/A 0.36 0.29 1
CNF
N/A
N/A 0.04 0.02 0.1
Fe N/A
N/A 0.66 1.82 2
TSS – decant runoff
Seasonal average: 114 N/A
Seasonal average: 72
- 50
MWP
As 0.027 0.027 N/A N/A 0.1
Cr 0.0035 0.0035 N/A N/A 0.1
Cu 0.019 0.019 N/A N/A 0.3
Ni 0.0023 0.0023 N/A N/A 0.5
Benzene 95 N/A N/A N/A 10 (total oil and grease)
TSS – pumped runoff
Seasonal average:
(1183, 268)
-
-
- 50
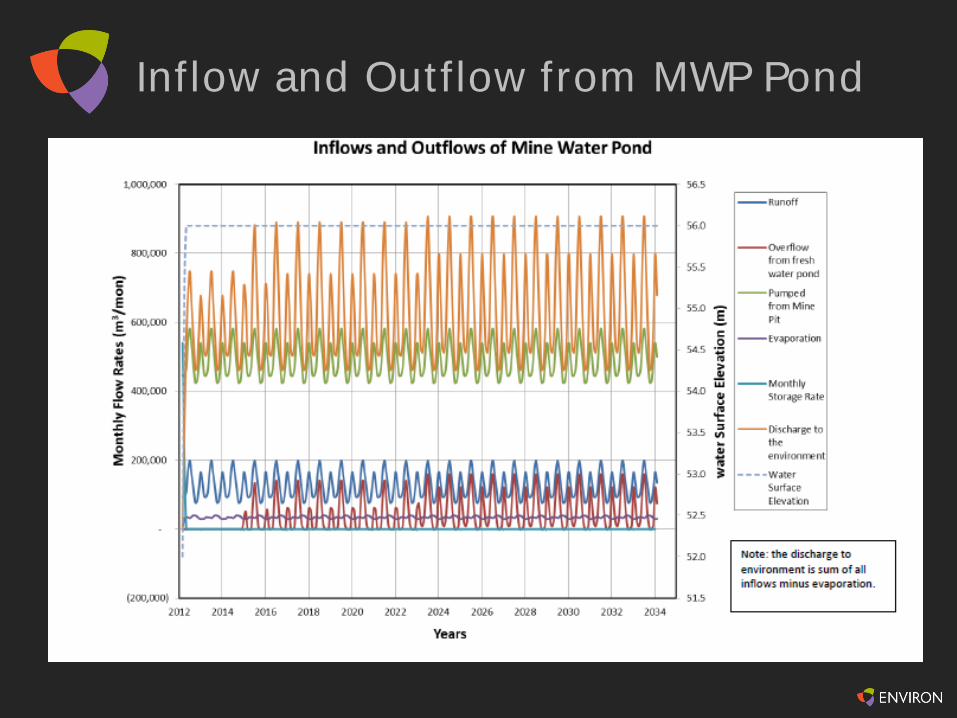
Inflow and Outflow from MWP Pond

Inflow and Outflow from TMA-D2

Modeling Input and Assumptions
• Leachate input concentrations are low under site geochemical conditions
• Simulations - monthly average operating conditions
• Dilution is primary controlling factor • Distribution of metal concentrations have
downstream gradient along plume trajectory • Wind – more pronounced in TSS simulation, and for
simulations of metals enhances mixing in deeper pond areas
• Metal concentrations satisfactory, but TSS concentrations may be elevated

Predicted Discharge Concentrations at TMA and MWP Outlets
Facility Contaminants Predicted Average (mg/L)
Predicted Maximum (mg/L)
C out/C in Runoff Conc. Modeling (mg/L)
TMA
CNT 0.129 0.241 0.37/0.69 1
CNF 0.006 0.013 0.15/0.35 0.1
Fe 0.261 0.481 0.40/0.73 2
TSS 21 62.9 0.29/0.55 50
MWP
As 0.0209 0.0237 0.77/0.88 0.1
Cr 0.0027 0.0031 0.77/0.89 0.1
Cu 0.0147 0.0167 0.77/0.88 0.3
Ni 0.0018 0.002 0.78/0.87 0.5
Benzene 0.0032 0.4354 3.4E-5/4.6E-3 10 (total oil)
TSS 79.1 145 0.07/0.12 50

TSS Concentration -MWP Pond

Copper Concentration-MWP Pond

Arsenic Concentration-MWP Pond

Free Cyanide, TMA-D2 Pond

Total Cyanide, TMA-D2 Pond

Predicted TSS, TMA-D2 Pond

Predicted Concentrations – TMA-D2

Conclusions – Surface Water Simulation Results –TMA-D2 Pond System
• Concentrations of Free CN are predicted to be below IFC guidelines.
• Concentrations of Total CN are also below IFC guidelines. • Concentrations of TSS may slightly exceed IFC guidelines
during wet seasons.
Simulation Results –MWP Pond System • Concentrations of leachate metals are far below IFC guidelines. • Discharge concentration of petroleum hydrocarbons (i.e.
benzene) is far below IFC guidelines (quick biodegradation). • Concentration of TSS consistently exceeds the IFC guideline of
50 mg/L during most operational periods, except for dry seasons; indicates additional treatment or polishing for TSS may be required in development of mine design

GROUNDWATER IMPACTS

Assumptions for data input • Volatilization rate for CN was assumed conservatively
low • Nominal leaching concentration for runoff input into
MWP • Nominal performance for CNWAD from CN detoxification
plant, and estimate of CNF and CNT based on decant test results
• Spill concentrations were based on the maximum spill from a typical truck (in a mining pit), that is then pumped during 12-hour period into MWP
• Solute transport of metals and CN was simulated by including retardation parameter for each solute (representing its adsorption onto particles in subsurface)

Modeling procedure Under TMA:
• Input concentrations of Fe (20 mg/L) and CNT (2 mg/L) in dissolved state (daily basis)
• Unsaturated flow through 30 m layer (27 m sand, 3 m clay) – VS2SDT model
• MODFLOW used to simulate flow into groundwater
Under MWP: • Input concentrations of As (0.27 mg/L), Cr (0.035
mg/L), Cu (0.19 mg/L), Ni (0.023 mg/L) • Unsaturated flow through 3 m layer (2 m sand, 1
m clay) – VS2SDT model • MODFLOW used to simulate flow into groundwater

Selected Modeling Parameters - Groundwater
Facility Contaminants
Primary Attenuation Mechanisms and Model Parameter Values
Model Input Concentration of Contaminants
Volatilization (day-1)
Adsorption (log L/kg)
KOC
Settling (mm/s)
Runoff Conc.
Modeling (mg/L)
Leaching Conc.
Lab Test (mg/L)
Decant Conc.
Modeling (mg/L)
Decant Conc.
Lab Test (mg/L)
IFC Effluent Standard (mg/L)
TMA CNT 0.186 0.996 N/A N/A N/A 2.6 0.29 1
Fe N/A 0.7 N/A N/A N/A 0.73 1.63 2
MWP
As N/A 1.398 N/A 0.5 0.027 N/A N/A 0.1
Cr N/A 3.079 N/A 0.1 0.0035 N/A N/A 0.1
Cu N/A 1.602 N/A 0.3 0.019 N/A N/A 0.3
Ni N/A 1.204 N/A 0.5 0.0023 N/A N/A 0.5
Benzene 0.2 1.82 N/A 95 N/A N/A N/A 10 (total oil and
grease)
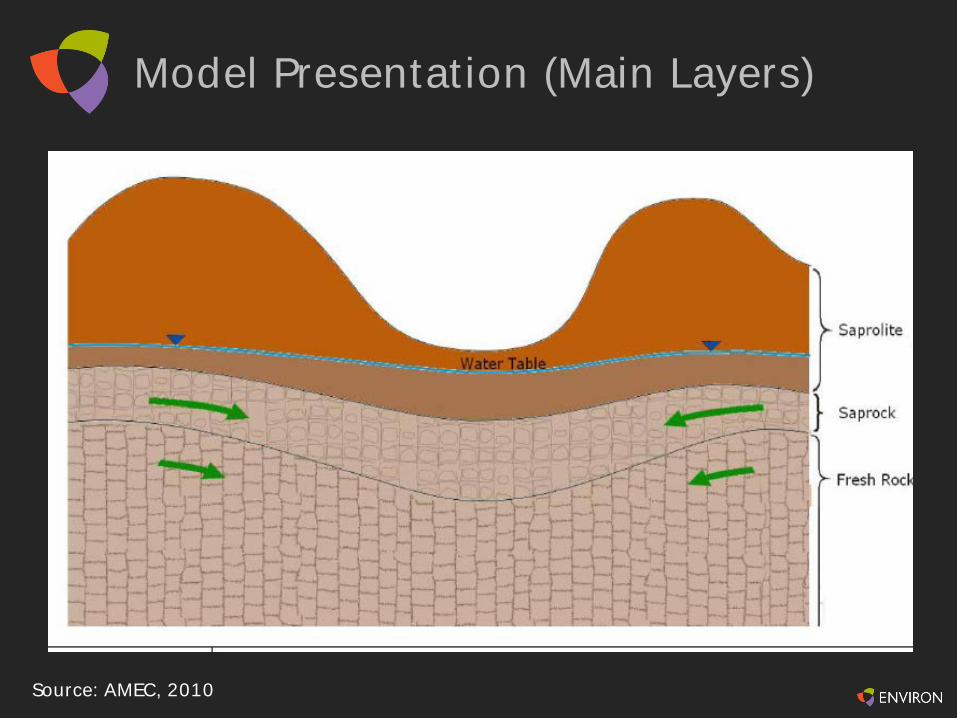
Model Presentation (Main Layers)
Source: AMEC, 2010

Vertical Concentration Profile of Cyanide (under TMA) in 18 years

Transient Simulation of CN – Continuous injection from TMA (at 2mg/L)

Transient Simulation of CN – Continuous injection from TMA (at 2mg/L)

Vertical Concentration Profile of Arsenic (under MWP) after 18 years

Transient Simulation of As – Continuous injection from MWP (at 0.27 mg/L)

Transient Simulation of As – Continuous injection from MWP (at 0.27 mg/L)

Conclusions - Groundwater
• Simulation results through unsaturated zone showed that only portion of contaminants reach groundwater (leading edge stops at 10 m depth)
• If contaminants were continuously being released into groundwater (worst case scenario): – At TMA, there is a very slow movement of Zn and Fe
generally towards open pits. – At MWP, most of the plumes are contained in the area
immediately adjacent to the MWP, and do not reach the mine pit (in one area, plume may be captured by dewatering well)
– Simulation of benzene spills show that the spread of benzene plume is limited to the area of MWP and does not reach the open pit or its wells