average percent of 1st & 2nd year students in classes under 50, by type of university,...
TRANSCRIPT

Average Percent of 1st & 2nd Year Students in Classes Under 50, by Type of University, Maclean's 2004
Percent of 1st & 2nd Year Students in Classes Under 50, Top Ranked Undergraduate Universities, Maclean's 2004
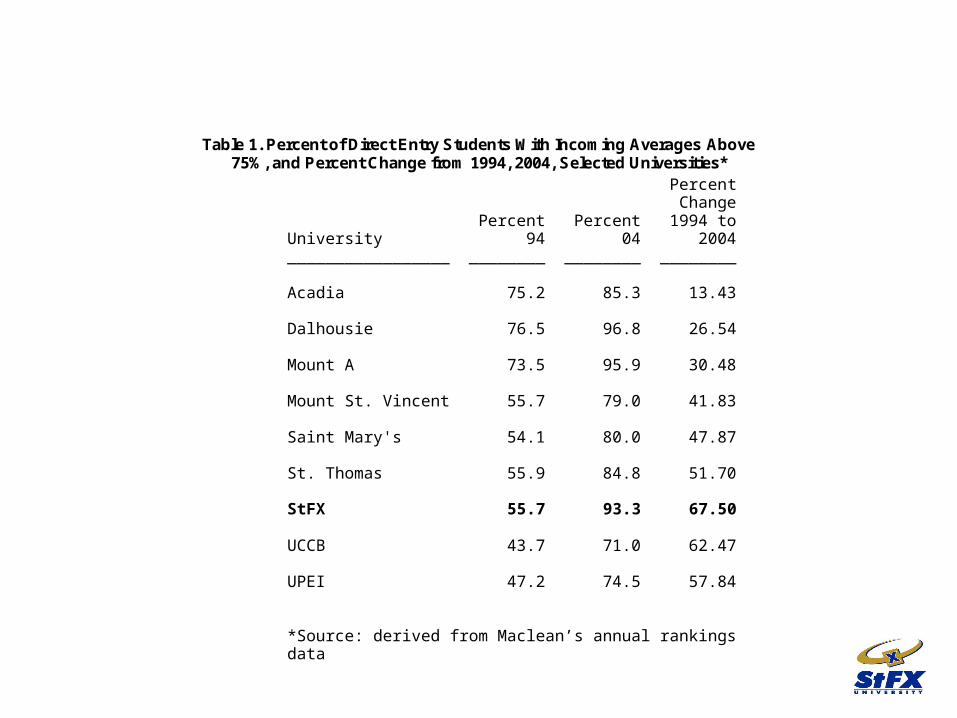
Table 1. Percent of Direct Entry Students With Incoming Averages Above 75%, and Percent Change from 1994, 2004, Selected Universities*
Percent Change Percent Percent 1994 to University 94 04 2004 _________________ ________ ________ ________ Acadia 75.2 85.3 13.43 Dalhousie 76.5 96.8 26.54 Mount A 73.5 95.9 30.48 Mount St. Vincent 55.7 79.0 41.83 Saint Mary's 54.1 80.0 47.87 St. Thomas 55.9 84.8 51.70 StFX 55.7 93.3 67.50 UCCB 43.7 71.0 62.47 UPEI 47.2 74.5 57.84 *Source: derived from Maclean’s annual rankings data
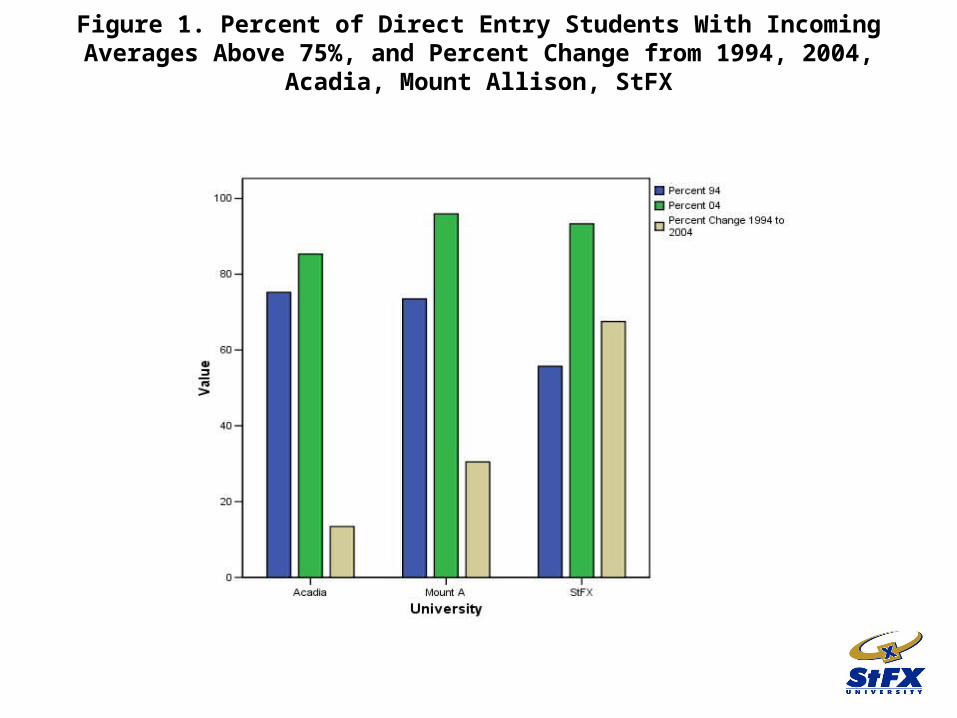
Figure 1. Percent of Direct Entry Students With Incoming Averages Above 75%, and Percent Change from 1994, 2004, Acadia, Mount Allison, StFX
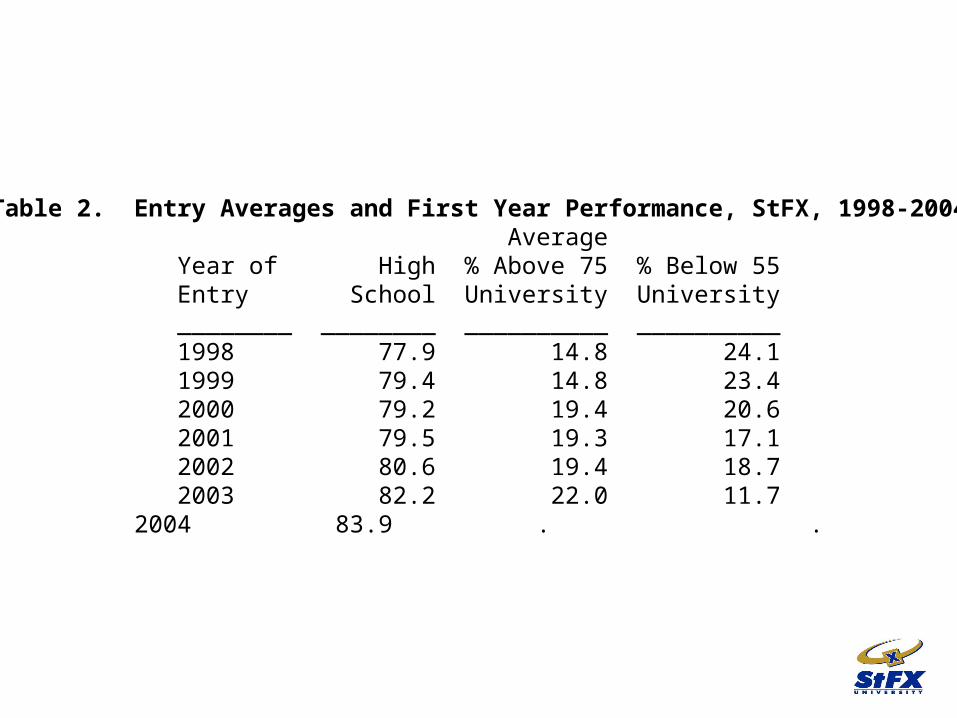
Table 2. Entry Averages and First Year Performance, StFX, 1998-2004 Average
Year of High % Above 75 % Below 55Entry School University University
________ ________ __________ __________1998 77.9 14.8 24.11999 79.4 14.8 23.42000 79.2 19.4 20.62001 79.5 19.3 17.12002 80.6 19.4 18.72003 82.2 22.0 11.72004 83.9 . .
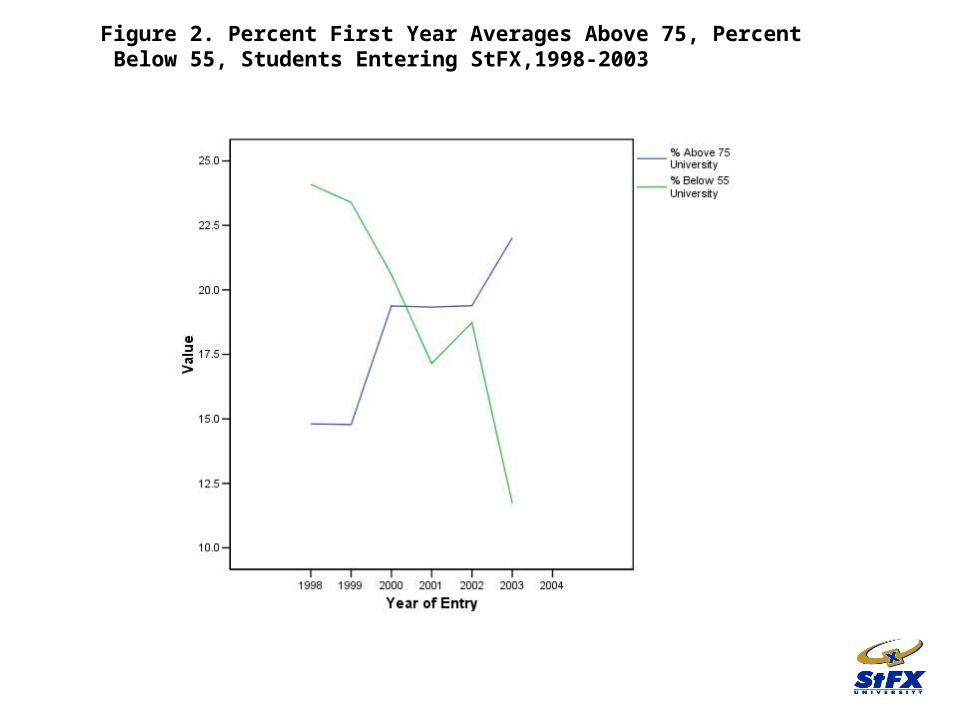
Figure 2. Percent First Year Averages Above 75, Percent Below 55, Students Entering StFX,1998-2003
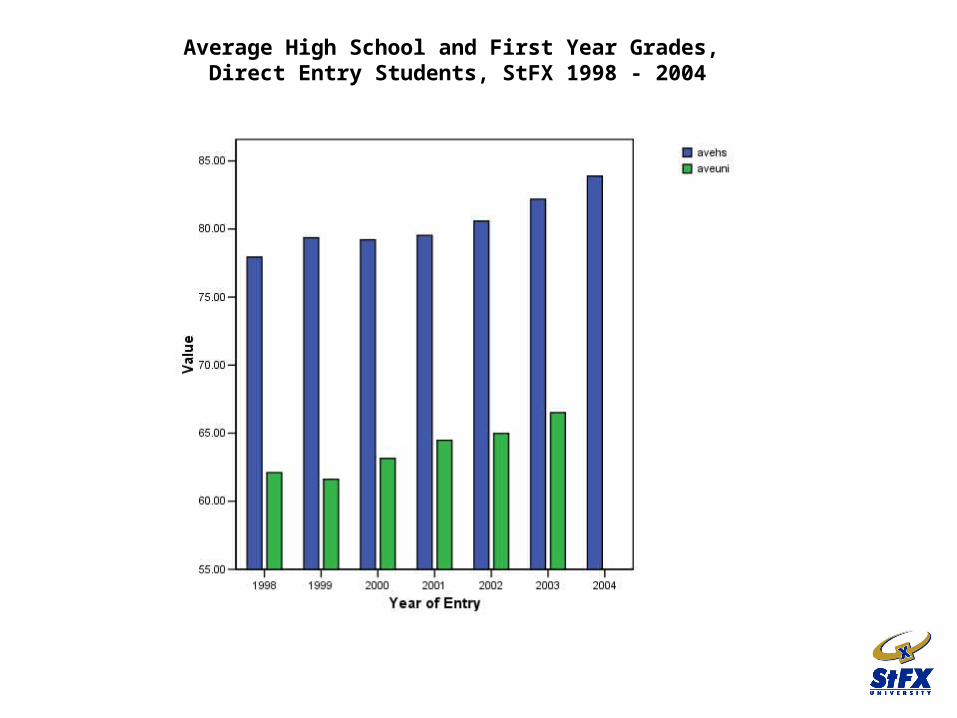
Average High School and First Year Grades, Direct Entry Students, StFX 1998 - 2004
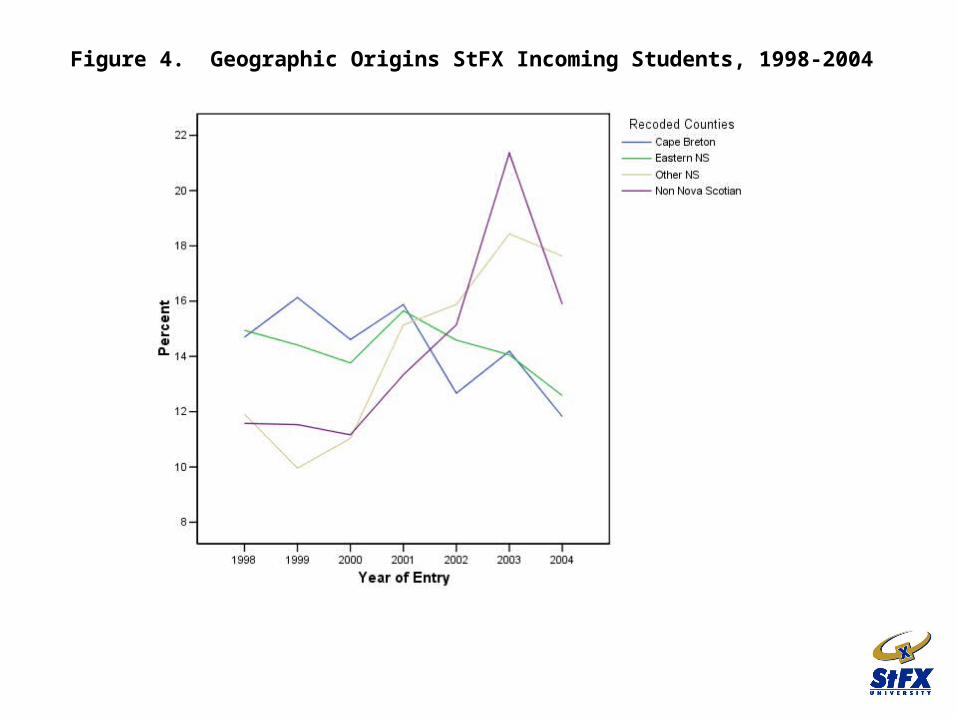
Figure 4. Geographic Origins StFX Incoming Students, 1998-2004
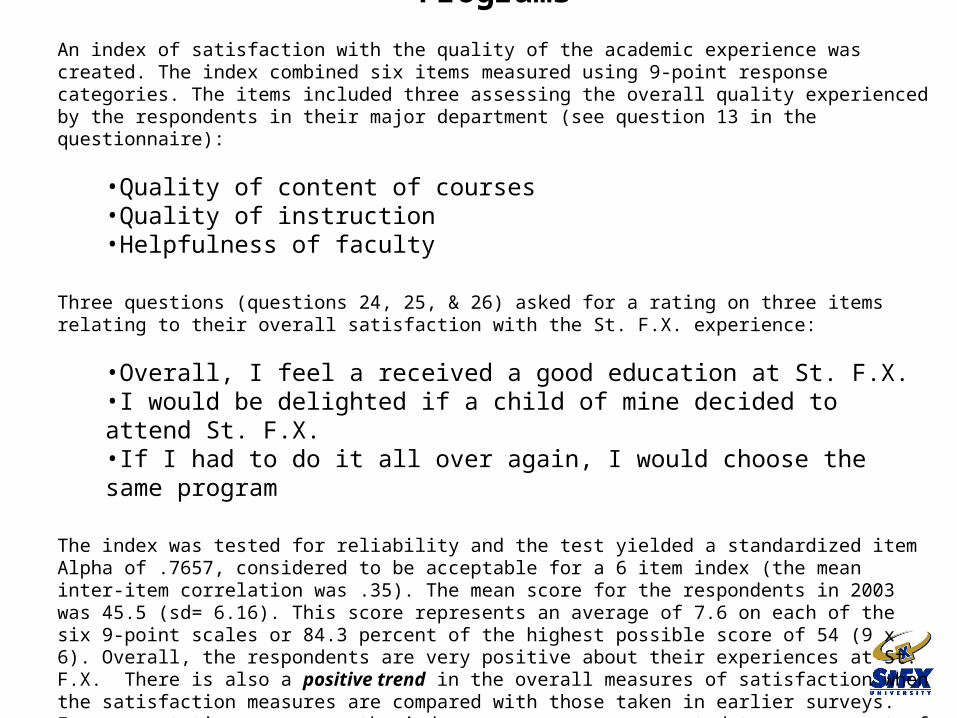
Measuring Satisfaction with Academic Programs
An index of satisfaction with the quality of the academic experience was created. The index combined six items measured using 9-point response categories. The items included three assessing the overall quality experienced by the respondents in their major department (see question 13 in the questionnaire):
•Quality of content of courses•Quality of instruction•Helpfulness of faculty
Three questions (questions 24, 25, & 26) asked for a rating on three items relating to their overall satisfaction with the St. F.X. experience:
•Overall, I feel a received a good education at St. F.X.•I would be delighted if a child of mine decided to attend St. F.X.•If I had to do it all over again, I would choose the same program
The index was tested for reliability and the test yielded a standardized item Alpha of .7657, considered to be acceptable for a 6 item index (the mean inter-item correlation was .35). The mean score for the respondents in 2003 was 45.5 (sd= 6.16). This score represents an average of 7.6 on each of the six 9-point scales or 84.3 percent of the highest possible score of 54 (9 x 6). Overall, the respondents are very positive about their experiences at St. F.X. There is also a positive trend in the overall measures of satisfaction when the satisfaction measures are compared with those taken in earlier surveys. For presentation purposes, the index measures were converted to a score out of 100.
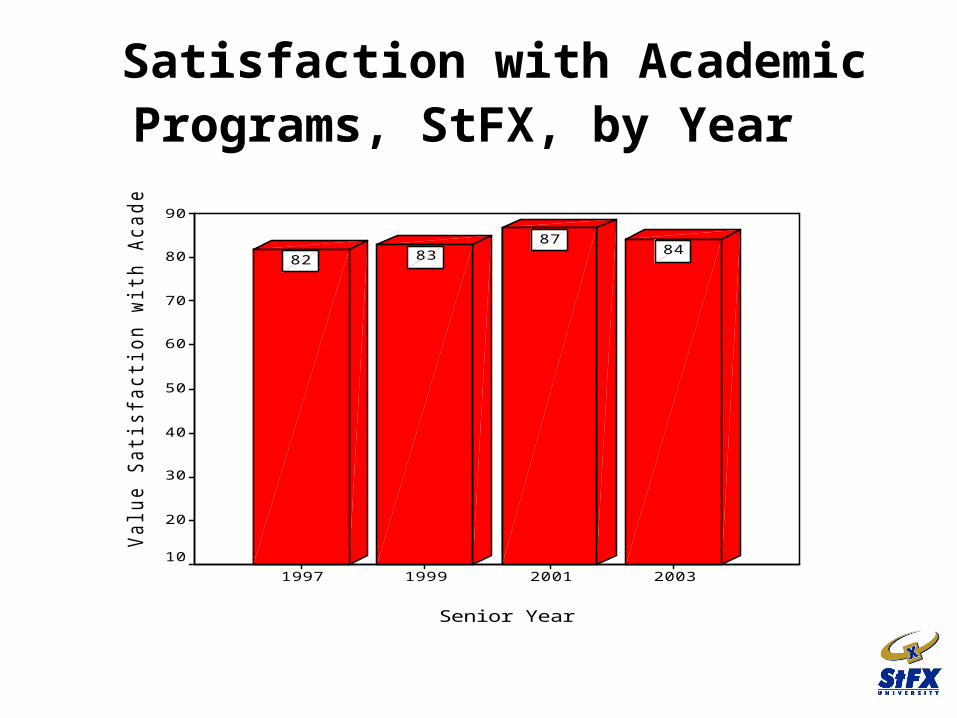
Satisfaction with Academic Programs, StFX, by Year
Senior Year
2003200119991997
Va
lue
Sa
tisfa
ctio
n w
ith
Aca
de
mic
Pro
gra
ms
90
80
70
60
50
40
30
20
10
8487
8382
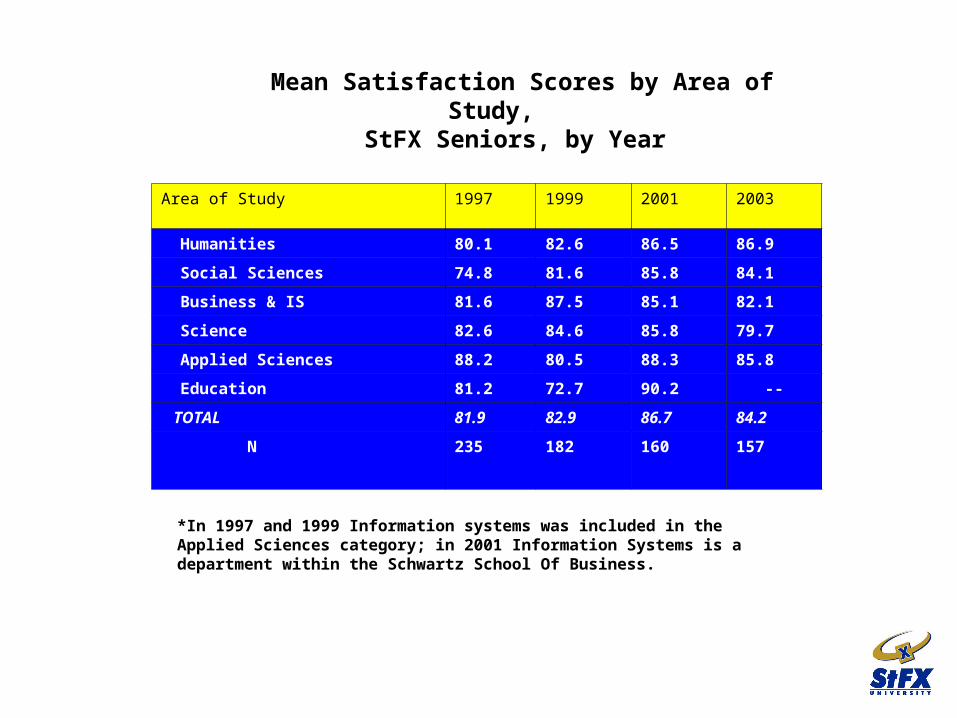
Mean Satisfaction Scores by Area of Study,StFX Seniors, by Year
Area of Study 1997 1999 2001 2003
Humanities 80.1 82.6 86.5 86.9
Social Sciences 74.8 81.6 85.8 84.1
Business & IS 81.6 87.5 85.1 82.1
Science 82.6 84.6 85.8 79.7
Applied Sciences 88.2 80.5 88.3 85.8
Education 81.2 72.7 90.2 --
TOTAL 81.9 82.9 86.7 84.2
N 235 182 160 157
*In 1997 and 1999 Information systems was included in the Applied Sciences category; in 2001 Information Systems is a department within the Schwartz School Of Business.

Percent of students Who Would Choose StFX
If They Could Do It Over Again, by Year
Area of Study 1997 1999 2001 2003
Humanities 90.7 78.6 100.0 94.4
Social Sciences 69.0 83.8 86.4 96.8
Business & IS 85.7 97.4 95.1 80.8
Science 84.3 86.2 85.0 91.3
Applied Sciences 96.4 88.9 92.0 84.6
Education 84.6 77.8 100.0 --
TOTAL 85.9 87.0 92.5 89.7
N 234 190 160 155
*In 1997 and 1999 Information systems was included in the Applied Sciences category; in 2001 Information Systems is a department within the Schwartz School of Business. Education graduates were inadvertently missed in the ’03 survey
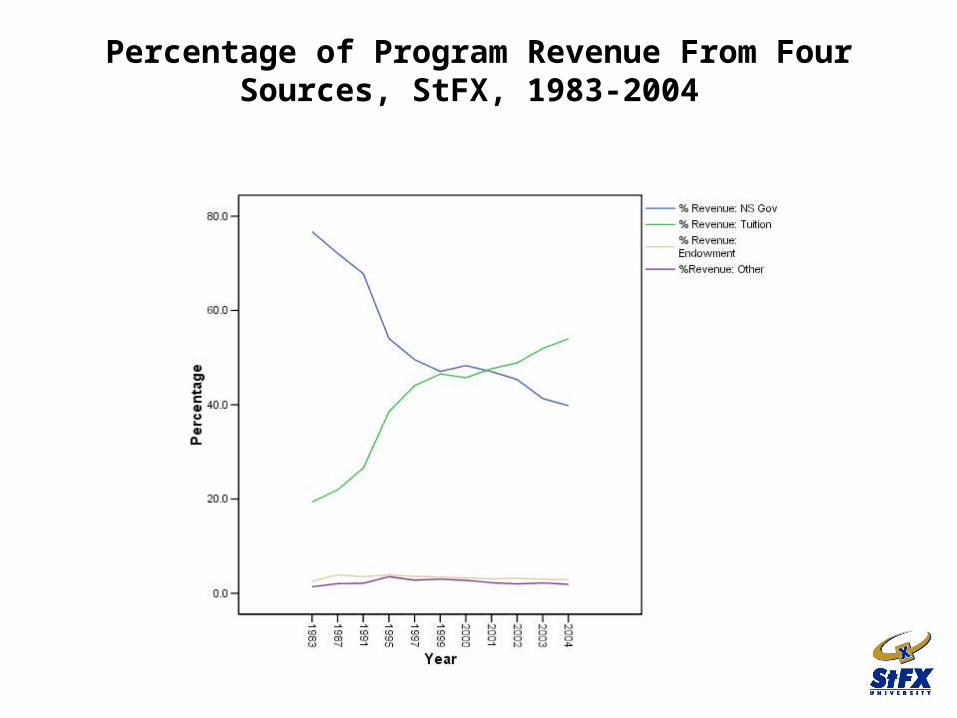
Percentage of Program Revenue From Four Sources, StFX, 1983-2004
Scholarship Expenditures as % of Program Expenditures,
StFX, 1983 - 2004
Endowment as % of Program Expenditures, StFX, 1983 - 2004
Unfunded Debt as % of Program
Expenditures, StFX, 1983 - 2004