average decline in material hardship during the pandemic
TRANSCRIPT
Michael Karpman and Stephen Zuckerman
April 2021
More than one year after the COVID-19 pandemic triggered a sharp economic
contraction, millions of adults remain unemployed.1 Congress has responded to the
crisis with several relief packages to mitigate the impact of the recession on families’
abilities to meet their basic needs. In this study, we assess how material hardship
changed during the first year of the pandemic, between December 2019 and December
2020. We also explore the recession’s unequal impacts and the association of job and
income losses with hardship.
Our analysis provides the first probability-based national survey estimates of changes in material
hardship from a prepandemic baseline. We used data from the Urban Institute’s Well-Being and Basic
Needs Survey (WBNS), a nationally representative annual survey of more than 7,500 adults ages 18 to
64, to estimate these changes. Despite a steep drop in employment, we find the share of nonelderly
adults reporting food insecurity and problems paying utility and medical bills declined between 2019
and 2020. However, this average change obscures the substantial hardships among families who lost
work during the pandemic. Safety net programs and pandemic-related income supports likely
prevented even more severe deprivation among families who lost jobs and income and provided
buffers against hardship for many other families, improving the average adult’s ability to meet their
family’s basic needs. We find the following:
◼ About 9 million fewer adults were employed in December 2020 than in December 2019, and
nearly all of the decline occurred among hourly workers.
◼ Despite substantial job losses, the share of adults reporting material hardships in the past 12
months fell between December 2019 and December 2020, with significant declines in food
F R O M S A F ET Y N ET T O S O L I D GR O U N D
Average Decline in Material Hardship during the Pandemic Conceals Unequal Circumstances Findings from the December 2020 Well-Being and Basic Needs Survey
Support for this research was provided by the Robert Wood Johnson Foundation. The views expressed here do not necessarily reflect the views of the Foundation.

2 A V E R A G E D E C L I N E I N MA TE R I A L H AR D SH I P C O N C E ALS U N E Q U A L C IR C UM S TA N CE S
insecurity (from 23.9 percent to 20.5 percent), utility shutoffs (from 3.8 percent to 2.6
percent), and problems paying medical bills (from 18.8 percent to 14.9 percent).
◼ Average improvements in material hardship conceal wide disparities in well-being in 2020.
Compared with adults whose family employment was unaffected by the pandemic, adults
whose families lost jobs during the pandemic were twice as likely to report food insecurity
(33.2 percent versus 16.0 percent), nearly three times as likely to report problems paying
utility bills (20.2 percent versus 7.2 percent), and nearly four times as likely to report problems
paying the rent or mortgage (20.3 percent versus 5.3 percent).
◼ Adults whose families did not lose jobs but experienced furloughs, had work hours reduced, or
lost income were also more likely than adults whose family employment was unaffected by
the pandemic to report food insecurity (23.1 percent versus 16.0 percent), problems paying
the rent or mortgage (11.9 percent versus 5.3 percent), and other hardships.
◼ To replace lost income and help cover their basic needs, many families have turned to safety
net programs and other relief measures. Three-quarters of adults whose families lost jobs
during the pandemic (75.5 percent) and about half of adults whose families experienced
furloughs, had work hours reduced, or lost income (49.5 percent) reported their families
received support from unemployment insurance, Medicaid or the Children’s Health Insurance
Program (CHIP), the Supplemental Nutrition Assistance Program (SNAP), rental assistance, or
charitable food programs in 2020.
These findings reveal the complexities of how family well-being has changed during the pandemic
and the role of safety net programs and other income supports in protecting families. The average
decline in reported hardship is consistent with other data sources showing improvements in personal
income, credit health, and savings rates during the pandemic.2 But beneath these averages, the pain of
the recession has been concentrated among the families of hourly workers, who lost jobs and whose
industries are unlikely to fully recover until the pandemic is contained. Relief measures likely mitigated
the recession’s effects for families who lost jobs and income and, in some cases, increased incomes
beyond what families previously earned at their jobs (Ganong, Noel, and Vavra 2020). Most adults
whose employment was unaffected by the pandemic also received economic impact payments from
the federal government. Combined with other factors, these efforts contributed to the average decline
in reported hardship between 2019 and 2020. The most recent relief legislation, the American Rescue
Plan Act, signed into law in March 2021, is designed to provide an additional bridge to economic
recovery. Making some of the act’s policies permanent could establish a more robust safety net that
helps families meet their basic needs in an increasingly unequal economy.
A V E R A G E D E C L I N E I N MA TE R I A L H AR D SH I P C O N C E ALS U N E Q U A L C IR C UM S TA N CE S 3
Results
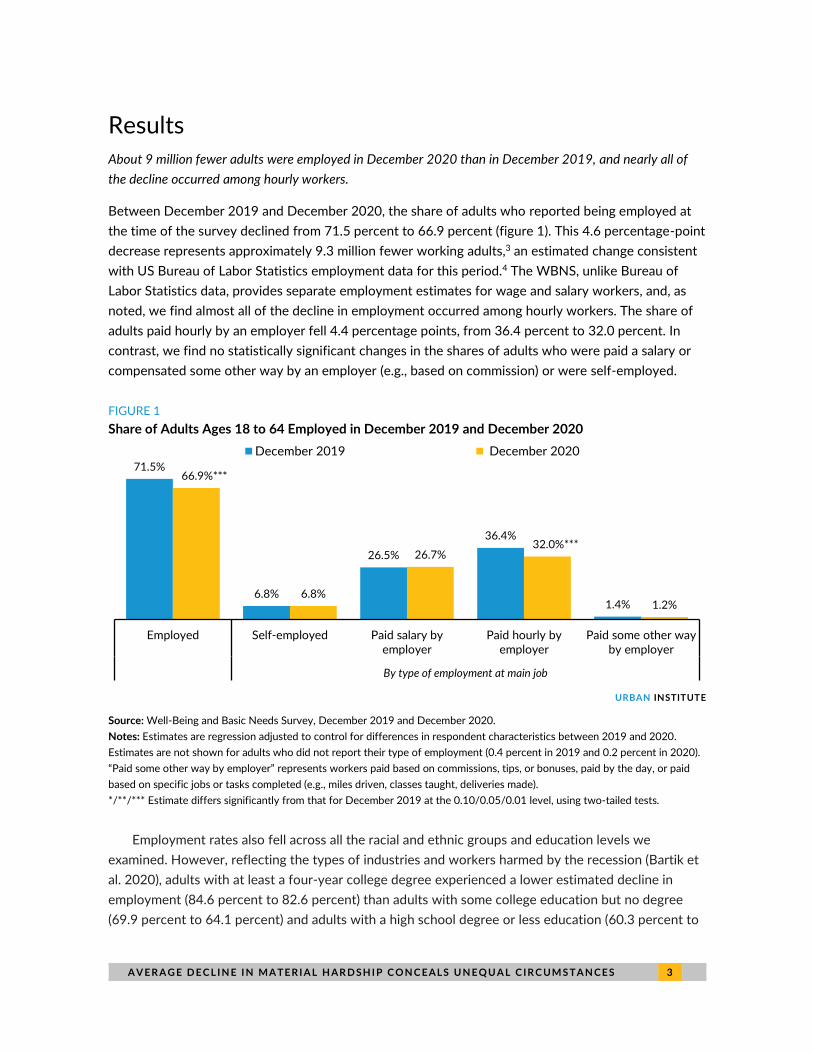
About 9 million fewer adults were employed in December 2020 than in December 2019, and nearly all of
the decline occurred among hourly workers.
Between December 2019 and December 2020, the share of adults who reported being employed at
the time of the survey declined from 71.5 percent to 66.9 percent (figure 1). This 4.6 percentage-point
decrease represents approximately 9.3 million fewer working adults,3 an estimated change consistent
with US Bureau of Labor Statistics employment data for this period.4 The WBNS, unlike Bureau of
Labor Statistics data, provides separate employment estimates for wage and salary workers, and, as
noted, we find almost all of the decline in employment occurred among hourly workers. The share of
adults paid hourly by an employer fell 4.4 percentage points, from 36.4 percent to 32.0 percent. In
contrast, we find no statistically significant changes in the shares of adults who were paid a salary or
compensated some other way by an employer (e.g., based on commission) or were self-employed.
FIGURE 1
Share of Adults Ages 18 to 64 Employed in December 2019 and December 2020
URBAN INSTITUTE
Source: Well-Being and Basic Needs Survey, December 2019 and December 2020.
Notes: Estimates are regression adjusted to control for differences in respondent characteristics between 2019 and 2020.
Estimates are not shown for adults who did not report their type of employment (0.4 percent in 2019 and 0.2 percent in 2020).
“Paid some other way by employer” represents workers paid based on commissions, tips, or bonuses, paid by the day, or paid
based on specific jobs or tasks completed (e.g., miles driven, classes taught, deliveries made).
*/**/*** Estimate differs significantly from that for December 2019 at the 0.10/0.05/0.01 level, using two-tailed tests.
Employment rates also fell across all the racial and ethnic groups and education levels we
examined. However, reflecting the types of industries and workers harmed by the recession (Bartik et
al. 2020), adults with at least a four-year college degree experienced a lower estimated decline in
employment (84.6 percent to 82.6 percent) than adults with some college education but no degree
(69.9 percent to 64.1 percent) and adults with a high school degree or less education (60.3 percent to
71.5%
6.8%
26.5%
36.4%
1.4%
66.9%***
6.8%
26.7%32.0%***
1.2%
Employed Self-employed Paid salary byemployer
Paid hourly byemployer
Paid some other wayby employer
By type of employment
December 2019 December 2020
By type of employment at main job

4 A V E R A G E D E C L I N E I N MA TE R I A L H AR D SH I P C O N C E ALS U N E Q U A L C IR C UM S TA N CE S
54.4 percent; data not shown). Black adults experienced a significantly larger decline in employment
(67.1 percent to 58.4 percent) than white adults (73.7 percent to 70.1 percent), and the share of
Hispanic/Latinx adults who were employed fell from 67.7 percent to 62.5 percent (data not shown).5
These patterns by educational attainment and race and ethnicity largely align with patterns in the
Bureau of Labor Statistics employment report for the corresponding period.
Despite substantial job losses, the share of adults reporting material hardships in the past 12 months fell
between December 2019 and December 2020, with significant declines in food insecurity, utility shutoffs,
and problems paying medical bills.
Between December 2019 and December 2020, the share of adults reporting household food
insecurity in the past 12 months fell from 23.9 percent to 20.5 percent (figure 2), and such decreases
were significant for white, Black, and Hispanic/Latinx adults (data not shown).6 We also observe
declines in the shares of adults reporting problems paying utility bills (12.3 percent to 10.8 percent)
and utility shutoffs (3.8 percent to 2.6 percent).7 The change in the estimated share of adults reporting
problems paying the rent or mortgage was not statistically significant.8 Adults also reported declines in
problems paying family medical bills (18.8 percent to 14.9 percent) and unmet needs for medical care
because of cost (18.5 percent to 15.9 percent). However, other data show many adults have delayed
or forgone needed care because they worried about exposure to the coronavirus or health care
providers had limited services during the pandemic (Gonzalez et al. 2021).9
FIGURE 2
Material Hardships Experienced in the Past 12 Months among Adults Ages 18 to 64, December 2019
and December 2020
URBAN INSTITUTE
Source: Well-Being and Basic Needs Survey, December 2019 and December 2020.
Notes: Estimates are regression adjusted to control for differences in respondent characteristics between 2019 and 2020.
Unmet need for medical care is for the respondent.
*/**/*** Estimate differs significantly from that for December 2019 at the 0.10/0.05/0.01 level, using two-tailed tests.
23.9%
12.3%
3.8%
10.3%
18.8% 18.5%20.5%***
10.8%**
2.6%***
9.3%
14.9%***15.9%***
Food insecurity Problems payingutility bills
Utility shutoff Problems payingrent or mortgage
Problems payingfamily medical bills
Unmet need formedical care
because of costs
December 2019 December 2020
A V E R A G E D E C L I N E I N MA TE R I A L H AR D SH I P C O N C E ALS U N E Q U A L C IR C UM S TA N CE S 5
Average improvements in material hardship conceal wide disparities in well-being in 2020. Compared with
adults whose family employment was unaffected by the pandemic, adults whose families lost jobs during the
pandemic were twice as likely to report food insecurity, nearly three times as likely to report problems paying
utility bills, and nearly four times as likely to report problems paying the rent or mortgage.
The decline in the average share of adults reporting material hardship over the study period conceals
stark disparities between adults whose families have lost jobs and income and adults whose family
employment was not affected by the recession. In December 2020, nearly one in six adults (16.0
percent) reported they or their spouse or partner lost or was laid off from a job because of the
pandemic; about half of these adults (8.2 percent overall) reported the person laid off was neither
rehired at their old job nor hired at a new job (data not shown). Another one in four adults (23.3
percent) reported they or their spouse or partner did not lose a job but someone in their family was
furloughed, had work hours reduced, or lost income (data not shown).10
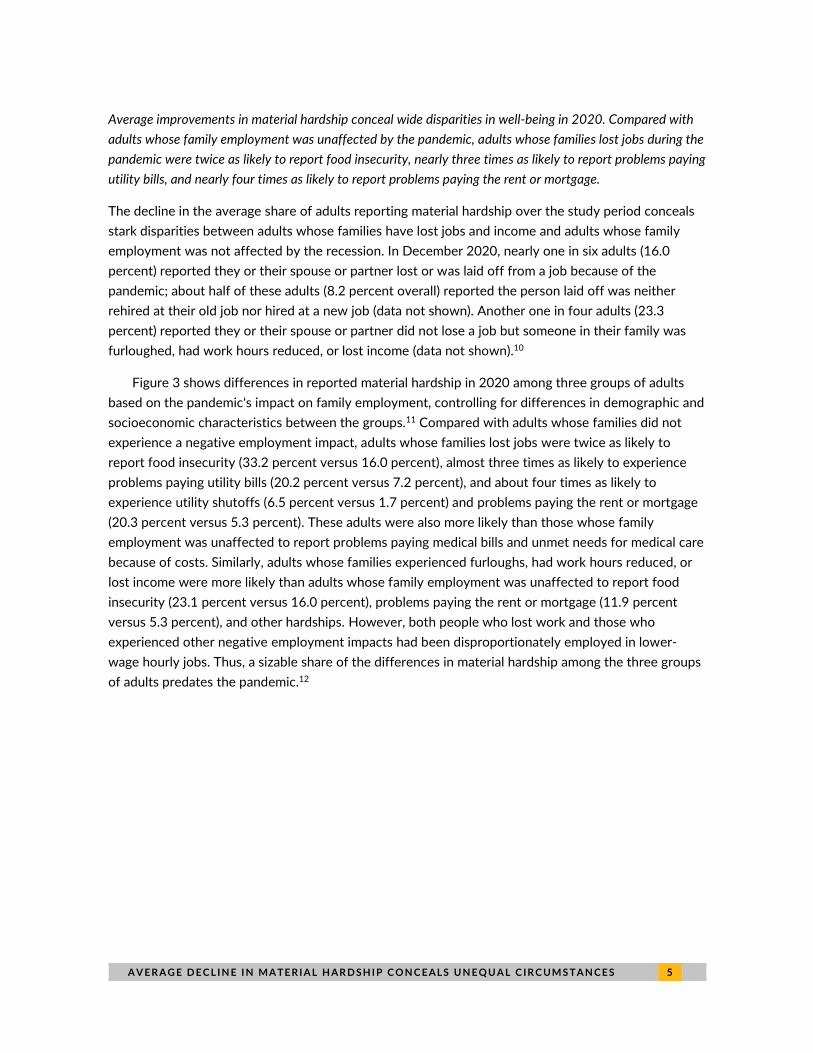
Figure 3 shows differences in reported material hardship in 2020 among three groups of adults
based on the pandemic's impact on family employment, controlling for differences in demographic and
socioeconomic characteristics between the groups.11 Compared with adults whose families did not
experience a negative employment impact, adults whose families lost jobs were twice as likely to
report food insecurity (33.2 percent versus 16.0 percent), almost three times as likely to experience
problems paying utility bills (20.2 percent versus 7.2 percent), and about four times as likely to
experience utility shutoffs (6.5 percent versus 1.7 percent) and problems paying the rent or mortgage
(20.3 percent versus 5.3 percent). These adults were also more likely than those whose family
employment was unaffected to report problems paying medical bills and unmet needs for medical care
because of costs. Similarly, adults whose families experienced furloughs, had work hours reduced, or
lost income were more likely than adults whose family employment was unaffected to report food
insecurity (23.1 percent versus 16.0 percent), problems paying the rent or mortgage (11.9 percent
versus 5.3 percent), and other hardships. However, both people who lost work and those who
experienced other negative employment impacts had been disproportionately employed in lower-
wage hourly jobs. Thus, a sizable share of the differences in material hardship among the three groups
of adults predates the pandemic.12

6 A V E R A G E D E C L I N E I N MA TE R I A L H AR D SH I P C O N C E ALS U N E Q U A L C IR C UM S TA N CE S
FIGURE 3
Material Hardships Experienced in the Past 12 Months among Adults Ages 18 to 64, by the
Pandemic’s Impact on Family Employment, December 2020
URBAN INSTITUTE
Source: Well-Being and Basic Needs Survey, December 2020.
Notes: Estimates are regression adjusted to control for differences in respondent characteristics across the three groups. Unmet
need for medical care is for the respondent. Adults whose families lost jobs are those who reported they or their spouse or
partner lost or was laid off from a job. Adults reporting a furlough, reduced hours, or lost income exclude adults who also
reported they or their spouse or partner lost or was laid off from a job but include adults who reported a child under age 19 lost
or was laid off from a job.
*/**/*** Estimate differs significantly from that for adults whose families faced no negative employment impact at the
0.10/0.05/0.01 level, using two-tailed tests.
Many families have turned to safety net programs and other relief measures to help replace lost income and
cover their basic needs. Three-quarters of adults whose families lost jobs during the pandemic and about half
of adults whose families experienced furloughs or other negative employment impacts reported their families
received support from unemployment insurance, Medicaid/CHIP, SNAP, rental assistance, or charitable food
programs in 2020.
In 2020, adults whose families lost jobs or experienced other negative employment impacts during the
pandemic participated in several major safety net programs that may have helped them replace lost
incomes and pay for food, housing, and health care costs. More than half of adults whose families lost
jobs (51.9 percent) and one-quarter of adults whose families did not lose jobs but experienced other
negative employment impacts (25.4 percent) reported their families received unemployment insurance
benefits in the past 12 months (figure 4).13 Adults whose families lost jobs were also more likely than
other adults to report family participation in Medicaid or CHIP (28.5 percent), SNAP (20.8 percent),
rental assistance (6.3 percent), and charitable food programs (i.e., groceries and/or meals; 31.9
percent). Three-quarters of adults whose families lost jobs (75.5 percent) and about half of adults
whose families experienced other negative employment impacts (49.5 percent) reported participating
in at least one of the programs in figure 4 in the past 12 months.
16.0%
7.2%
1.7%
5.3%
10.9% 12.3%
23.1%***
13.7%***
2.5%*
11.9%***
18.7%*** 17.4%***
33.2%***
20.2%***
6.5%***
20.3%***
24.6%***27.5%***
Food insecurity Problems payingutility bills
Utility shutoff Problems payingrent or mortgage
Problems payingfamily medical bills
Unmet need formedical care
because of costs
Had no negative employment impact Furloughed, had hours reduced, or lost income
Lost or laid off from a job

A V E R A G E D E C L I N E I N MA TE R I A L H AR D SH I P C O N C E ALS U N E Q U A L C IR C UM S TA N CE S 7
Participation in Medicaid/CHIP, SNAP, and rental assistance is likely underreported for two
reasons: (1) the survey only asked adults with family incomes below 400 percent of the federal
poverty level whether their family members participated in these programs, and (2) several studies
have found adults underreport public benefits in both federal and nonfederal surveys (Meyer, Mok,
and Sullivan 2009; Pascale, Roemer, and Resnick 2009; Wheaton 2008). In addition, adults received
other assistance excluded from figure 4. For instance, most adults received economic impact payments
authorized by the Coronavirus Aid, Relief, and Economic Security (CARES) Act by mid-to-late May
2020 (Holtzblatt and Karpman 2020).
FIGURE 4
Participation in Public and Private Safety Net Programs in the Past 12 Months among Adults Ages 18
to 64, by the Pandemic’s Impact on Family Employment, December 2020
URBAN INSTITUTE
Source: Well-Being and Basic Needs Survey, December 2020.
Notes: SNAP is the Supplemental Nutrition Assistance Program. CHIP is the Children’s Health Insurance Program. Questions on
family receipt of SNAP, Medicaid/CHIP, and rental assistance in the past 12 months were only asked of adults with family
incomes below 400 percent of the federal poverty level. Adults whose families lost jobs are those who reported they or their
spouse or partner lost or was laid off from a job. Adults reporting a furlough, reduced hours, or lost income exclude adults who
also reported they or their spouse or partner lost or was laid off from a job but include adults who reported a child under age 19
lost or was laid off from a job.
*/**/*** Estimate differs significantly from that for adults whose families had no negative employment impact at the
0.10/0.05/0.01 level, using two-tailed tests.
Discussion
Though 9.3 million fewer adults were working in December 2020 than in December 2019, the share
of adults reporting food insecurity and utility and medical hardships in the past 12 months declined
during this period. The seemingly contradictory changes in employment and material hardship likely
reflect both the pandemic’s exceptionally unequal impacts and the strong federal response. The
pandemic’s economic fallout has been concentrated among lower-wage hourly workers in service
15.3%
6.0%10.5%
17.1%
3.7%
30.3%
22.6%*** 25.4%***
9.7%
17.9%
1.9%***
49.5%***
31.9%***
51.9%***
20.8%***
28.5%***
6.3%***
75.5%***
Charitable food Unemploymentinsurance
SNAP Medicaid/CHIP Rental assistance At least oneprogram
Had no negative employment impact Furloughed, had hours reduced, or lost income
Lost or laid off from a job

8 A V E R A G E D E C L I N E I N MA TE R I A L H AR D SH I P C O N C E ALS U N E Q U A L C IR C UM S TA N CE S
industries involving in-person contact,14 and adults whose families experienced a job or income loss
have had much more difficulty than other adults paying for housing, utilities, food, and health care,
which they often struggled to afford before the recession.15 Public safety net programs, economic
impact payments, and other private supports likely mitigated the recession’s harmful effects and
improved financial security for many families, contributing to the average decline in reported hardship,
as we discuss further below.
Consistencies and Contrasts with Other Data Sources
These survey findings are consistent with other data showing increased aggregate personal income,
higher savings rates, reduced loan delinquencies, and improved credit scores since the pandemic
began, as well as a temporary decline in poverty between 2019 and mid-2020 (Giannarelli, Wheaton,
and Acs 2020; Han, Meyer, and Sullivan 2020; Parolin et al. 2020).16 They also echo findings from the
Federal Reserve System’s Survey of Household Economics and Decisionmaking, which draws samples
from the same probability-based internet panel as the WBNS and found an increased share of adults
who could pay a small emergency expense with cash or its equivalent between October 2019 and July
2020 (Federal Reserve System 2020).
However, comparisons of the WBNS with other data on material hardship should be interpreted
with caution. The WBNS and other self-administered internet-based surveys find higher reporting of
food insecurity than surveys conducted by an interviewer in person or by phone (Karpman,
Zuckerman, and Gonzalez 2018; Keeter 2015). In addition, the 12-month look-back period captures
neither month-to-month changes in hardship that occur within the year nor whether adults
experienced hardship before or after receiving income supports and benefits. Other surveys
conducted by the US Census Bureau, University of Southern California, and the Urban Institute have
found significant fluctuations in hardship during 2020 that were associated with the expansion of
unemployment benefits and implementation of other relief measures (Berkowitz and Basu 2021;
Cooney and Shaefer 2021; Karpman and Acs 2020; Raifman, Bor, and Venkataramani 2021; Waxman,
Gupta, and Gonzalez 2020). Finally, respondents may interpret survey questions differently in the
context of the pandemic than they would otherwise. For instance, if a respondent’s landlord or lender
allowed the household to defer rent or mortgage payments, the respondent may not have reported
being late with a payment despite struggling to afford housing costs, though some data sources
suggest late rent and mortgage payments increased between 2019 and 2020.17
The Safety Net’s Role in Protecting Families from Hardship
The average changes in material hardship observed in the WBNS likely reflect both economic factors
and policy responses. Precautions taken to prevent transmission of the coronavirus caused a sharp
drop in spending on services, and people who could work remotely spent less on commuting costs,
helping reduce their debt and increase savings.18 Though millions of workers have lost earnings, some
sectors have grown during the recession,19 and a minority of adults have found new work or increased
their work hours and income (Karpman et al. 2020). But relief measures in the Families First

A V E R A G E D E C L I N E I N MA TE R I A L H AR D SH I P C O N C E ALS U N E Q U A L C IR C UM S TA N CE S 9
Coronavirus Response Act, CARES Act, and other legislation and emergency actions have also helped
mitigate hardship (An, Gabriel, and Tzur-Ilan 2021; Berkowitz and Basu 2021; Raifman, Bor, and
Venkataramani 2021).
Through the CARES Act, most US households received economic impact payments of up to
$1,200 per adult and up to $500 per dependent child under age 17. Three programs significantly
expanded eligibility, duration, and generosity of unemployment insurance benefits, including a $600
weekly benefit supplement through the end of July 2020, which was followed by a Lost Wages
Assistance Program providing a $300 supplement for six additional weeks. The Paycheck Protection
Program and other loan programs aided businesses in maintaining payrolls. States also froze
disenrollment from Medicaid and CHIP in exchange for a higher federal matching rate for Medicaid
costs, and the Families First Coronavirus Response Act suspended SNAP work requirements for adults
under age 50 not living with children, facilitating enrollment in these programs (Corallo and Rudowitz
2021).20 All states took advantage of an option under the Families First Coronavirus Response Act to
use emergency supplemental SNAP benefits to provide all recipients with the maximum benefit
amount. Further, new programs, such as Pandemic Electronic Benefits Transfer, or P-EBT, and more
flexible rules for existing programs provided meal replacements to families whose children would have
received free or reduced-price meals at school (CBPP 2020). In addition, federal, state, and local
governments issued moratoria on evictions, foreclosures, and utility shutoffs of varying scopes and
durations (Jowers et al. 2021). One recent study suggests rental eviction moratoria helped families
meet immediate food needs (An, Gabriel, and Tzur-Ilan 2021).
This robust policy response complemented private charities’ efforts to keep families fed, housed,
and treated for health issues during the pandemic. For instance, a previous analysis of WBNS data
found the share of adults reporting their households received assistance from charitable food
programs in the past 12 months increased from 13.2 percent in December 2019 to 19.7 percent in
December 2020, or by 13.1 million people (Waxman, Gupta, and Gonzalez 2021). As noted, we also
find more than three-quarters of adults whose families lost jobs and half of adults whose families
experienced furloughs, reduced work hours, or lost income during the pandemic reported their
families received support from charitable food programs, unemployment insurance, Medicaid/CHIP,
SNAP, or rental assistance in 2020.
The American Rescue Plan’s Implications for the Safety Net
The pandemic has underscored the role of safety net programs in helping families meet basic needs
during a recession, including both those who lose jobs and those who continue working but struggle to
pay for essential expenses. The American Rescue Plan extends several provisions of earlier pandemic
relief packages and provides most households with additional recovery rebate payments of up to
$1,400 per adult and qualifying dependent, including dependent adults excluded from previous
payments.21 It also sustains expanded unemployment benefits through early September 2021 and
exempts up to $10,200 of these benefits from taxation. Further, the law extends a 15 percent increase
1 0 A V E R A G E D E C L I N E I N MA TE R I A L H AR D SH I P C O N C E ALS U N E Q U A L C IR C UM S TA N CE S
in the maximum monthly SNAP benefit authorized in December 2020 relief legislation and provides
additional funding for rental and homeowner assistance.
In addition to building on previous relief efforts, the American Rescue Plan further enhances the
safety net in ways that could substantially increase resources for families with low and moderate
incomes. Key provisions include
◼ an increase in the child tax credit to $3,600 per child under 6 and $3,000 per child ages 6 to
17 that phases out after the first $75,000 of income and was made fully refundable;
◼ an increase in the maximum child and dependent care tax credit, which was made fully
refundable;
◼ expansion of eligibility for the earned income tax credit to all adults ages 19 and older and a
threefold increase in the credit for adults not living with dependent children to about $1,500;
◼ and an increase in eligibility for and the generosity of premium tax credits for health plans
purchased through the health insurance Marketplaces, fully funded COBRA premiums for laid-
off workers, and incentives for Medicaid expansion in the 12 states that have not expanded
the program under the Affordable Care Act.22
Two analyses have projected the unemployment insurance, recovery rebate, SNAP, and selected
tax credit provisions would reduce poverty by about one-third and cut child poverty in half in 2021
(Parolin et al. 2021; Wheaton et al. 2021).23 However, because most of these provisions expire at
different times in 2021 or 2022, their long-term impacts will depend on whether Congress makes
them permanent. The WBNS will continue monitoring material hardship as American Rescue Plan
provisions take effect, providing policymakers with timely data on how well the US safety net is
serving vulnerable families.
Data and Methods
This brief draws on data from nationally representative samples of adults ages 18 to 64 who
participated in the Urban Institute’s Well-Being and Basic Needs Survey, including 7,694 adults who
participated in the December 2019 survey round and 7,737 who participated in the December 2020
survey round. The WBNS is an internet-based survey designed to monitor changes in individual and
family well-being as policymakers consider changes to federal safety net programs. For each round of
the WBNS, we draw a stratified random sample (including a large oversample of adults in low-income
households) from the KnowledgePanel, a probability-based internet panel maintained by Ipsos that
includes households with and without internet access. Survey weights adjust for unequal selection
probabilities and are poststratified to the characteristics of nonelderly adults based on benchmarks
from the 2020 Current Population Survey Annual Social and Economic Supplement and 2019
American Community Survey. Participants can complete the survey in English or Spanish. For further
information about the survey design and content, see Karpman, Zuckerman, and Gonzalez (2018).24
A V E R A G E D E C L I N E I N MA TE R I A L H AR D SH I P C O N C E ALS U N E Q U A L C IR C UM S TA N CE S 1 1
Estimated changes in employment and material hardship between 2019 and 2020 are regression
adjusted to control for any changes in the demographic and socioeconomic characteristics of the
adults participating in each survey round not fully captured in the survey weights. We control for a
respondent’s gender, age, race and ethnicity, primary language, educational attainment, family size,
chronic health conditions, residence in an urban or rural area, internet access, homeownership status,
family composition, and census region; the presence of children under age 19 in the respondent’s
household; whether the respondent participated in both the 2019 and 2020 survey rounds; and how
long the respondent has been a member of the KnowledgePanel.
All surveys are subject to various sources of error, including noncoverage and nonresponse error,
sampling error, and measurement error. The survey weights and regression adjustment mitigate, but
do not eliminate, potential nonresponse bias. Recent studies have found the pandemic has significantly
affected data collection for federal surveys, with increased nonresponse among people with lower
educational attainment and incomes (Dahlhamer et al. 2021).25 Probability-based internet panels could
potentially have more stable nonresponse patterns because panel members have previously agreed to
participate in surveys. However, research on this has been limited during the pandemic. We conducted
extensive analyses to determine whether the estimated changes observed in this study were driven by
changes in the sample composition that owe to differential panel attrition, panel recruitment, or
survey completion rates. The partial overlap in the samples for the WBNS and previous Urban
Institute surveys fielded during the pandemic aided these analyses. Though nonresponse in the WBNS
was slightly higher among adults who reported in previous surveys that their families had lost work or
experienced other negative employment impacts because of the pandemic, these differences appear
to have limited impacts on our estimates of changes in material hardship between 2019 and 2020 (i.e.,
not more than a few tenths of a percentage point). Comparing participants’ responses in the 2020
WBNS with their responses in previous surveys also provided evidence of recall error in reported
material hardship, but we expect such errors to be similar across the 2019 and 2020 survey rounds
and to have limited effects on the estimated changes we observe.
Notes 1 “The Employment Situation – February 2021,” US Bureau of Labor Statistics, March 5, 2021,
https://www.bls.gov/news.release/archives/empsit_03052021.pdf.
2 “Credit Health during the COVID-19 Pandemic,” Urban Institute, February 25, 2021, https://apps.urban.org/features/credit-health-during-pandemic/; Neil Irwin and Weiyi Cai, “Why Markets Boomed in a Year of Human Misery,” New York Times, January 1, 2021, https://www.nytimes.com/2021/01/01/upshot/why-markets-boomed-2020.html.
3 We multiplied the estimated 4.6 percentage-point change in employment between December 2019 and December 2020 by the projected number of adults ages 18 to 64 in 2020. We used national population predictions from the US Census Bureau stratified by race, ethnicity, and sex for people of all ages from 2016 to 2060, based on estimated birth, death, and net migration rates over the period. Using the “main series” file, we summed the 2020 population projections for all adults ages 18 to 64 to arrive at 202,620,917 nonelderly adults that year. See “2017 National Population Projections Datasets,” US Census Bureau, February 20, 2020, https://www.census.gov/data/datasets/2017/demo/popproj/2017-popproj.html. The 95 percent confidence
1 2 A V E R A G E D E C L I N E I N MA TE R I A L H AR D SH I P C O N C E ALS U N E Q U A L C IR C UM S TA N CE S
interval for the estimated decline in the number of adults employed at the time of the survey (9.3 million) between December 2019 and December 2020 is 5.3 million to 13.3 million.
4 “The Employment Situation – December 2020,” US Bureau of Labor Statistics, January 8, 2021, https://www.bls.gov/news.release/archives/empsit_01082021.pdf.
5 We use “Hispanic/Latinx” in this brief to reflect the different ways people self-identify. The Bureau of Labor Statistics uses the term “Hispanic or Latino.” The terms “white” and “Black” in this report refer to adults who do not identify as Hispanic/Latinx.
6 Household food insecurity estimates are based on responses to the six-item short form of the US Department of Agriculture’s Household Food Security Survey Module (USDA 2012). Affirmative responses include reporting that it was often or sometimes true that the food the household bought just didn’t last, and the household didn’t have money to get more; it was often or sometimes true that the household could not afford to eat balanced meals; adults in the household ever cut the size of meals or skipped meals because there was not enough money for food; meals were cut or skipped almost every month, or some months but not every month; the respondent ate less than they felt they should because there wasn’t enough money for food; and the respondent was ever hungry but didn’t eat because there wasn’t enough money for food. Respondents with two to four affirmative responses are defined as having low household food security, and respondents with five to six affirmative responses are defined as having very low household food security. These groups are jointly defined as being food insecure.
7 Estimates for problems paying utility bills are based on respondents reporting the household was unable to pay the full amount of the gas, oil, or electricity bills. Estimates for utility shutoffs are based on respondents reporting the gas or electric company turned off service or the oil company would not deliver oil.
8 Estimates for problems paying the rent or mortgage are based on respondents reporting the household did not pay the full amount of the rent or mortgage or was late with a payment because it could not afford to pay.
9 Estimates for unmet need for medical care are based on respondents reporting they did not get needed medical care because they could not afford it. Medical care is defined broadly to include general doctor and specialist care, dental care, tests, treatment or follow-up care, prescription drugs, mental health care or counseling, and substance use treatment.
10 Estimates of those reporting a furlough, reduced hours, or lost income exclude adults who also reported they or their spouse or partner lost or was laid off from a job but include adults who reported a child under 19 lost or was laid off from a job.
11 We control for differences in the following characteristics of the three groups of adults in figure 3: gender, age, race and ethnicity, primary language, educational attainment, family size, chronic health conditions, residence in an urban or rural area, internet access, homeownership status, family composition, census region, presence of children in the household, 2019 family income as a percentage of FPL, and household income. The regression-adjusted estimates of material hardship are similar to the unadjusted estimates.
12 Because the sample from each round of the WBNS is drawn from the same internet panel, some respondents participate in multiple survey rounds. About 29 percent of participants in the 2020 survey also participated in the 2019 survey. Though we do not report estimates for this overlap sample because it is not nationally representative, analyzing this group sheds light on how material hardship changed over time. Compared with the adults who did not report their family employment was affected by the pandemic in the 2020 survey, adults who reported experiencing such effects in 2020 reported much higher rates of hardship in the 2019 survey, before the pandemic, even after controlling for differences in demographic and socioeconomic characteristics between the two groups.
13 Figure 4 shows 6 percent of adults whose family employment was unaffected by the pandemic reported their families received unemployment insurance benefits in the past 12 months. Some of these families may have received unemployment benefits in January or February, before the pandemic caused a recession. However, employment losses during the pandemic are reported with some error. Some adults who participated in the December 2020 WBNS and did not report the pandemic affecting their family employment reported experiencing such impacts in previous tracking surveys fielded in March/April, May, and September 2020. This
A V E R A G E D E C L I N E I N MA TE R I A L H AR D SH I P C O N C E ALS U N E Q U A L C IR C UM S TA N CE S 1 3
error may owe to recall error or the December survey respondents not reporting limited or temporary employment impacts.
14 The US Bureau of Labor Statistics’ Current Employment Statistics data show employment in accommodation and food services fell 20.3 percent between December 2019 and December 2020 (seasonally adjusted), representing 30.8 percent of nonfarm jobs lost during this period. The only industry with a larger percent decline in employment was arts, entertainment, and recreation (31.1 percent), which accounted for 8.2 percent of nonfarm jobs lost. Authors’ calculations are based on “Establishment Data Table B-1. Employees on Nonfarm Payrolls by Industry Sector and Selected Industry Detail [in Thousands],” US Bureau of Labor Statistics, accessed March 15, 2021, https://www.bls.gov/webapps/legacy/cesbtab1.htm.
15 Michael Karpman, Stephen Zuckerman, and Dulce Gonzalez, “Even Before the Coronavirus Outbreak, Hourly and Self-Employed Workers Were Struggling to Meet Basic Needs,” Urban Wire (blog), Urban Institute, March 20, 2020, https://www.urban.org/urban-wire/even-coronavirus-outbreak-hourly-and-self-employed-workers-were-struggling-meet-basic-needs.
16 “Credit Health during the COVID-19 Pandemic,” Urban Institute; Irwin and Cai, “Why Markets Boomed in a Year of Human Misery,” New York Times; “Near Real Time COVID-19 Income and Poverty Dashboard,” Wilson Sheehan Lab for Economic Opportunities at Notre Dame and the University of Chicago Harris School of Public Policy, accessed March 15, 2021, http://povertymeasurement.org/covid-19-poverty-dashboard/.
17 The National Multifamily Housing Council’s Rent Payment Tracker, though not based on a representative sample of rental units, indicates renting households were more likely to be late with payments in 2020 than in 2019. In addition, a report by the Consumer Financial Protection Bureau found an increase in year-end mortgage delinquencies between December 2019 and December 2020, though many people behind on their mortgages were in forbearance. See “NMHC Rent Payment Tracker,” National Multifamily Housing Council, accessed March 29, 2021, https://www.nmhc.org/research-insight/nmhc-rent-payment-tracker/; and Consumer Financial Protection Bureau, “Housing Insecurity and the COVID-19 Pandemic,” accessed April 1, 2021, https://files.consumerfinance.gov/f/documents/cfpb_Housing_insecurity_and_the_COVID-19_pandemic.pdf.
18 Diego Mendez-Carbajo, “Consumer Spending and the COVID-19 Pandemic,” Federal Reserve Bank of St. Louis, January 4, 2021, https://research.stlouisfed.org/publications/page1-econ/2021/01/04/consumer-spending-and-the-covid-19-pandemic; and Thomas Mitterling, Nirai Tomass, and Kelsey Wu, “The Decline and Recovery of Consumer Spending in the US,” Future Development (blog), Brookings Institution, December 14, 2020, https://www.brookings.edu/blog/future-development/2020/12/14/the-decline-and-recovery-of-consumer-spending-in-the-us/.
19 Patrick Thomas, Chip Cutter, and Te-Ping Chen, “Millions of Jobs Have Been Lost, but Hiring Is Booming at These Companies,” Wall Street Journal, October 15, 2020, https://www.wsj.com/articles/millions-of-jobs-have-been-lost-but-hiring-is-booming-at-these-companies-11602768600.
20 “SNAP Data Tables,” US Department of Agriculture, accessed March 29, 2021, https://www.fns.usda.gov/pd/supplemental-nutrition-assistance-program-snap.
21 “American Rescue Plan Act of 2021,” National Conference of State Legislatures, accessed March 29, 2021, https://www.ncsl.org/ncsl-in-dc/publications-and-resources/american-rescue-plan-act-of-2021.aspx.
22 Katie Keith, “Final Coverage Provisions in the American Rescue Plan and What Comes Next,” Health Affairs Blog, March 11, 2021, https://www.healthaffairs.org/do/10.1377/hblog20210311.725837/full/.
23 The Urban Institute poverty projections are based on analysis of the impact of the American Rescue Plan’s unemployment insurance, recovery rebate, SNAP, and child tax credit provisions. The Columbia University researchers’ poverty projections are based on analysis of these provisions plus the changes to the earned income tax credit and the child and dependent care tax credit.
24 The 2019 and 2020 WBNS survey instruments are available at https://www.urban.org/policy-centers/health-policy-center/projects/well-being-and-basic-needs-survey.
25 Jonathan Rothbaum, “How Does the Pandemic Affect Survey Response: Using Administrative Data to Evaluate Nonresponse in the Current Population Survey Annual Social and Economic Supplement,” Research Matters (blog), US Census Bureau, September 15, 2020, https://www.census.gov/newsroom/blogs/research-matters/2020/09/pandemic-affect-survey-response.html.

1 4 A V E R A G E D E C L I N E I N MA TE R I A L H AR D SH I P C O N C E ALS U N E Q U A L C IR C UM S TA N CE S
References An, Xudong, Stuart A. Gabriel, and Nitzan Tzur-Ilan. 2021. “COVID-19 Rental Eviction Moratoria and Household
Well-Being.” New York: Social Science Research Network.
Bartik, Alexander W., Marianne Bertrand, Feng Lin, Jesse Rothstein, and Matt Unruh. 2020. Measuring the Labor Market at the Onset of the COVID-19 Crisis. Working Paper 27613. Cambridge, MA: National Bureau of Economic Research.
Berkowitz, Seth A., and Sanjay Basu. 2021. “Unmet Social Needs and Worse Mental Health after Expiration of COVID-19 Federal Pandemic Unemployment Compensation.” Health Affairs 40 (3): 426–34. https://doi.org/10.1377/hlthaff.2020.01990.
CBPP (Center on Budget and Policy Priorities). 2020. “States Are Using Much-Needed Temporary Flexibility in SNAP to Respond to COVID-19 Challenges.” Washington, DC: Center on Budget and Policy Priorities.
Cooney, Patrick, and H. Luke Shaefer. 2021. Trends in Hardship and Mental Health in the United States at the End of 2020. Ann Arbor, MI: University of Michigan.
Corallo, Bradley, and Robin Rudowitz. 2021. “Analysis of Recent National Trends in Medicaid and CHIP Enrollment.” San Francisco: Henry J. Kaiser Family Foundation.
Dahlhamer, James M., Matthew D. Bramlett, Aaron Maitland, and Stephen J. Blumberg. 2021. “Preliminary Evaluation of Nonresponse Bias Due to the COVID-19 Pandemic on National Health Interview Survey Estimates, April–June 2020.” Hyattsville, MD: Centers for Disease Control and Prevention, National Center for Health Statistics.
Federal Reserve System (Board of Governors of the Federal Reserve System). 2020. Update on the Economic Well-Being of US Households: July 2020 Results. Washington, DC: Board of Governors of the Federal Reserve System.
Ganong, Peter, Pascal Noel, and Joseph Vavra. 2020. “US Unemployment Insurance Replacement Rates during the Pandemic.” Working Paper 2020-62. Chicago: University of Chicago, Becker Friedman Institute for Economics.
Giannarelli, Linda, Laura Wheaton, and Gregory Acs. 2020. “2020 Poverty Projections.” Washington, DC: Urban Institute.
Gonzalez, Dulce, Michael Karpman, Genevieve M. Kenney, and Stephen Zuckerman. 2021. “Delayed and Forgone Health Care for Nonelderly Adults during the COVID-19 Pandemic.” Washington, DC: Urban Institute.
Han, Jeehoon, Bruce D. Meyer, and James X. Sullivan. 2020. “Income and Poverty in the COVID-19 Pandemic.” Working Paper 27729. Cambridge, MA: National Bureau of Economic Research.
Holtzblatt, Janet, and Michael Karpman. 2020. “Who Did Not Get the Economic Impact Payments by Mid-to-Late May, and Why?” Washington, DC: Urban Institute.
Jowers, Kay, Christopher Timmins, Nrupen Bhavsar, Qihui Hu, and Julia Marshall. 2021. “Housing Precarity and the COVID-19 Pandemic: Impacts of Utility Disconnection and Eviction Moratoria on Infections and Deaths across US Counties.” Working Paper 28394. Cambridge, MA: National Bureau of Economic Research.
Karpman, Michael, and Gregory Acs. 2020. “Unemployment Insurance and Economic Impact Payments Associated with Reduced Hardship Following CARES Act.” Washington, DC: Urban Institute.
Karpman, Michael, Stephen Zuckerman, and Dulce Gonzalez. 2018. “The Well-Being and Basic Needs Survey.” Washington, DC: Urban Institute.
Karpman, Michael, Stephen Zuckerman, Dulce Gonzalez, and Genevieve M. Kenney. 2020. “The COVID-19 Pandemic Is Straining Families’ Abilities to Afford Basic Needs.” Washington, DC: Urban Institute.
Keeter, Scott. 2015. “From Telephone to the Web: The Challenge of Mode of Interview Effects in Public Opinion Polls.” Washington, DC: Pew Research Center.

A V E R A G E D E C L I N E I N MA TE R I A L H AR D SH I P C O N C E ALS U N E Q U A L C IR C UM S TA N CE S 1 5
Meyer, Bruce D., Wallace K. C. Mok, and James X. Sullivan. 2009. “The Underreporting of Transfers in Household Surveys: Its Nature and Consequences.” Working Paper 15181. Cambridge, MA: National Bureau of Economic Research.
Parolin, Zachary, Sophie Collyer, Megan A. Curran, and Christopher Wimer. 2021. “The Potential Poverty Reduction Effect of the American Rescue Plan.” New York: Columbia University.
Parolin, Zachary, Megan Curran, Jordan Matsudaira, Jane Waldfogel, and Christopher Wimer. 2020. “Monthly Poverty Rates during the COVID-19 Pandemic.” New York: Columbia University.
Pascale, Joanne, Marc I. Roemer, and Dean Michael Resnick. 2009. “Medicaid Underreporting in the CPS: Results from a Record Check Study.” Public Opinion Quarterly 73 (3): 497–520. https://doi.org/10.1093/poq/nfp028.
Raifman, Julia, Jacob Bor, and Atheender Venkataramani. 2021. “Association between Receipt of Unemployment Insurance and Food Insecurity among People Who Lost Employment during the COVID-19 Pandemic in the United States.” JAMA Network Open 4 (1): e2035884. https://doi.org/10.1001/jamanetworkopen.2020.35884.
USDA (US Department of Agriculture). 2012. “US Household Food Security Survey Module: Six-Item Short Form.” Washington, DC: US Department of Agriculture, Economic Research Service.
Waxman, Elaine, Poonam Gupta, and Dulce Gonzalez. 2020. “Food Insecurity Edged Back up after COVID-19 Relief Expired.” Washington, DC: Urban Institute.
———. 2021. “Charitable Food Use Increased Nearly 50 Percent from 2019 to 2020.” Washington, DC: Urban Institute.
Wheaton, Laura. 2008. Underreporting of Means-Tested Transfer Programs in the CPS and SIPP. Washington, DC: Urban Institute.
Wheaton, Laura, Sarah Minton, Linda Giannarelli, and Kelly Dwyer. 2021. “2021 Poverty Projections: Assessing Four American Rescue Plan Policies.” Washington, DC: Urban Institute.
About the Authors
Michael Karpman is a senior research associate in the Health Policy Center at the Urban Institute. His
work focuses primarily on the implications of the Affordable Care Act, including quantitative analysis
related to health insurance coverage, access to and affordability of health care, use of health care
services, and health status. His work includes overseeing and analyzing data from the Urban Institute’s
Health Reform Monitoring Survey and Well-Being and Basic Needs Survey. Before joining Urban in
2013, Karpman was a senior associate at the National League of Cities Institute for Youth, Education,
and Families. He received his MPP from Georgetown University.
Stephen Zuckerman is a senior fellow and vice president for health policy at the Urban Institute. He
has studied health economics and health policy for 30 years and is a national expert on Medicare and
Medicaid physician payment, including how payments affect enrollee access to care and the volume of
services they receive. He is currently examining how payment and delivery system reforms can affect
the availability of primary care services and studying the implementation and impact of the Affordable
Care Act. Before joining Urban, Zuckerman worked at the American Medical Association’s Center for
Health Policy Research. He received his PhD in economics from Columbia University.
1 6 A V E R A G E D E C L I N E I N MA TE R I A L H AR D SH I P C O N C E ALS U N E Q U A L C IR C UM S TA N CE S
Acknowledgments
This brief was funded by the Robert Wood Johnson Foundation. The views expressed here do not
necessarily reflect the views of the Foundation.
The views expressed are those of the authors and should not be attributed to the Urban Institute,
its trustees, or its funders. Funders do not determine research findings or the insights and
recommendations of Urban experts. Further information on the Urban Institute’s funding principles is
available at urban.org/fundingprinciples.
The authors gratefully acknowledge helpful comments on earlier drafts from Gregory Acs,
Timothy Triplett, Elaine Waxman, and Douglas Wissoker, assistance from Timothy Triplett and
Douglas Wissoker with development of the survey weights and assessment of survey nonresponse,
and careful editing by Rachel Kenney.
ABOUT THE URBAN INSTITUTE The nonprofit Urban Institute is a leading research organization dedicated to developing evidence-based insights that improve people’s lives and strengthen communities. For 50 years, Urban has been the trusted source for rigorous analysis of complex social and economic issues; strategic advice to policymakers, philanthropists, and practitioners; and new, promising ideas that expand opportunities for all. Our work inspires effective decisions that advance fairness and enhance the well-being of people and places.
Copyright © April 2021. Urban Institute. Permission is granted for reproduction of this file, with attribution to the Urban Institute.
500 L’Enfant Plaza SW Washington, DC 20024
www.urban.org