autonomous car a new driver for resilient computing and design
TRANSCRIPT

Nirmal SaxenaNirmal SaxenaNirmal SaxenaNirmal Saxena
NVIDIANVIDIANVIDIANVIDIA
NNNNEPP ProgramEPP ProgramEPP ProgramEPP Program
ETW 2016ETW 2016ETW 2016ETW 2016
June 15June 15June 15June 15
N. Saxena1
Autonomous Car
A New Driver
for
Resilient Computing
and
Design-for-Test

My Perspective and Not My Employer’s
Attributions– Best Effort from Memory
N. Saxena2
DisclaimersDisclaimersDisclaimersDisclaimers

Auto Safety Standard• Driverless Car Model
• Resiliency & DFT Requirements
Machine Learning• A Short Tutorial
• Accuracy, Performance and Resiliency
Road to Resiliency• Reliability Models
• Ordering Statistics
• Important Focus Areas
N. Saxena3
Keynote Flow

N. Saxena4
ISO26262
Auto Safety Standard
Review
N. Saxena 5
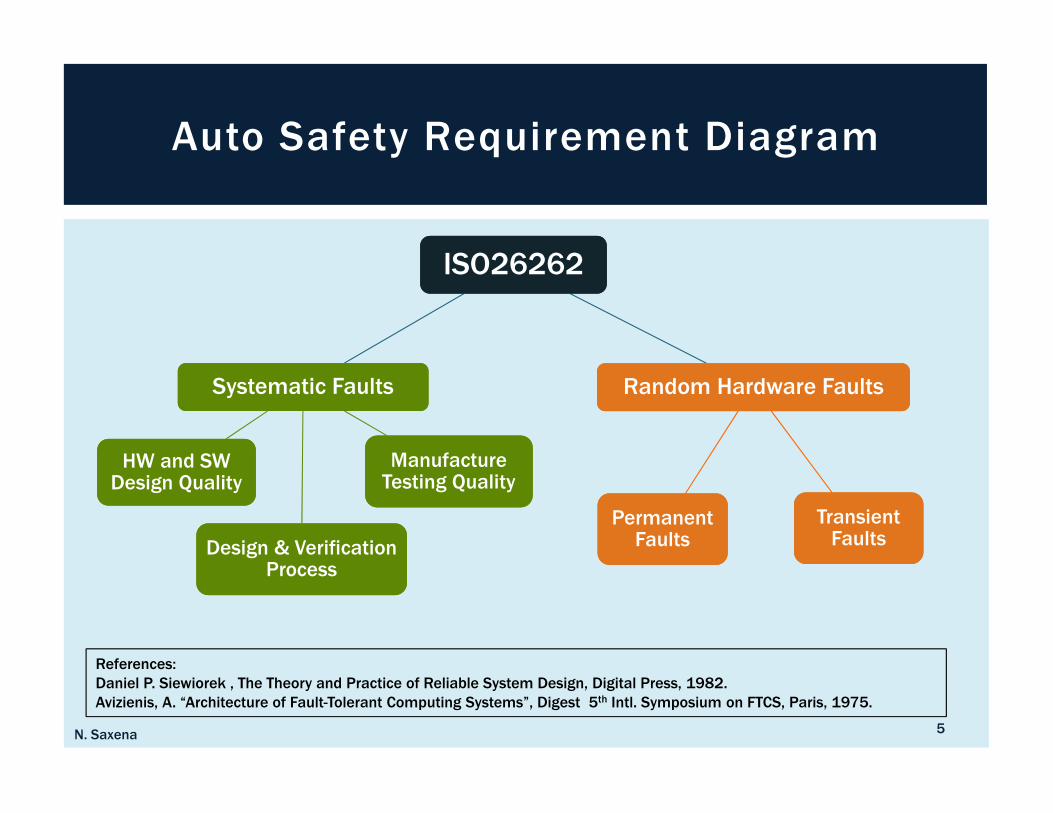
Auto Safety Requirement Diagram
ISO26262ISO26262
Systematic FaultsSystematic Faults
HW and SW Design QualityHW and SW Design Quality
Design & Verification Process
Design & Verification Process
Manufacture Testing QualityManufacture Testing Quality
Random Hardware FaultsRandom Hardware Faults
Transient Faults
Transient Faults
Permanent Faults
Permanent Faults
References:
Daniel P. Siewiorek , The Theory and Practice of Reliable System Design, Digital Press, 1982.
Avizienis, A. “Architecture of Fault-Tolerant Computing Systems”, Digest 5th Intl. Symposium on FTCS, Paris, 1975.

N. Saxena6
Random Hardware Faults Requirements
Hardware Random Fault Metrics ASIL B ASIL C ASIL D
Permanent Fault Coverage (SPFM) 90% 97% 99%
Transient Fault Coverage (SPFM) 90% 97% 99%
Latent Fault Coverage (LFM) 60% 80% 90%
Hardware Failure Probability (PMHF) 100FIT 100FIT 10FIT
ASIL Automotive Safety Integrity Level
SPFM Single Point Fault Metric
LFM Latent Fault Metric
PMHF Probabilistic Metric for Hardware Failures
FIT = Failures in Time, Time = 109 Hours. 1 FIT = 10-9 failures/hr
≤ 10��/��

N. Saxena 7
2013 Accident Statistics– USReference: National Highway Traffic Safety Administration (NHTSA): www.nhtsa.gov
DescriptionDescriptionDescriptionDescription StatisticsStatisticsStatisticsStatistics
Fatal Crashes 30,057
Driver Related Fatal Crashes 10,076
Non-Fatal Crashes 5,657,000
Number of Registered Vehicles 269,294,000
Licensed Drivers 212,160,000
Vehicle Miles Travelled 2,988,000,000,000
Driver Related Fatal Crashes per 100Million VMT 0.34
Fatal Crash FIT Rate (Assuming Average Speed 25-50 MPH) 84 to 168
Non-Fatal Crash FIT Rate 28582
ASIL-D 10FIT Target 9x to 17x Reduction in Fatal Crash FIT Rate
3000x Reduction in Non-Fatal Crash FIT Rate
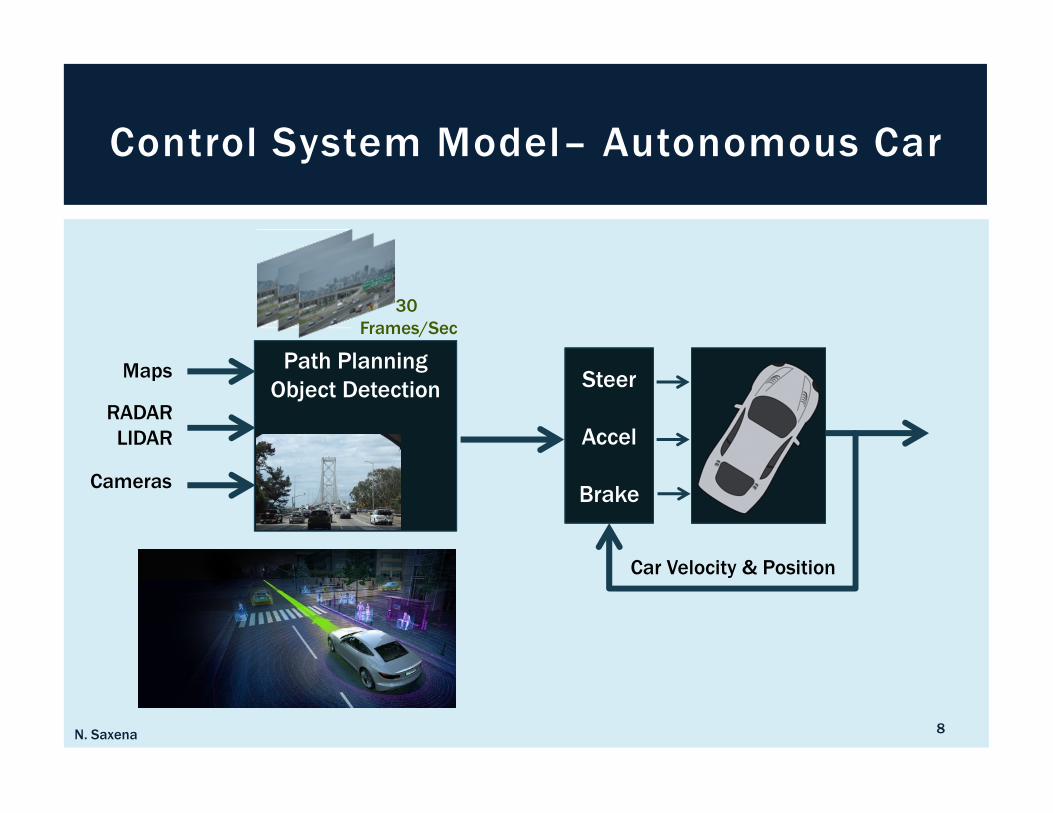
Path Planning
Object Detection
N. Saxena 8
Control System Model– Autonomous Car
Steer
Accel
BrakeCameras
RADAR
LIDAR
Maps
Car Velocity & Position
30
Frames/Sec

N. Saxena 9
Object Detection & Path Planning

N. Saxena 10
Fault Tolerant Time Interval (FTTI)I SO26262 does no t Quan t i f y F T T I
Fault Occurs Action Taken
FTTI
Highway Driving 75 MPH
Urban Driving 25 MPH
11 Feet
100ms
3 Feet

N. Saxena 11
Key-On, Drive-Time, Key-Off
Key-On Key-Offframe1 frame2 framen
200ms 33ms
Average Drive Time = 2 Hours
~ 200K Frames
Key-On Key-Offframe2
200ms 32ms
Need Periodic Permanent Fault Coverage Testing
frame1 framen

VLS I Tes t P r inc ip les and A rch i tec tu res , 2006 , Ed i ted by : L -T Wang et . a l .
Chap te r 6 [X . L i , K - J Lee , Nu r Touba ]
[Reddy e t . a l . 2002] [Wûr tenberge r 2004] [ [ Jas 2003] [Reda 2002] [Han 2005b]
[Chand ra 2001] [K r i shna 2003] [Ra jsk i 2004] [Hamzaog lu and Pa te l 1999] [L i 2004]
[Wang 2004] [Woh l 2001] [Das 2003] [M i t ra 2004]
N. Saxena12
Leveraging Test Compression
Low Cost
ATE
D
e
c
o
m
p
r
e
s
s
Scan-Based SoCm n
C
o
m
p
a
c
t
o
rMBIST

N. Saxena 13
Permanent Fault Coverage– Power Law
Test Patterns

N. Saxena14
Permanent Fault Coverage Tests
Key-On Key-Off
How Many Test Patterns Are Useless?
IEEE VLSI Test Symposium [Ferhani, Saxena, McCluskey, Nigh 2008]
frame1 frame2 framen
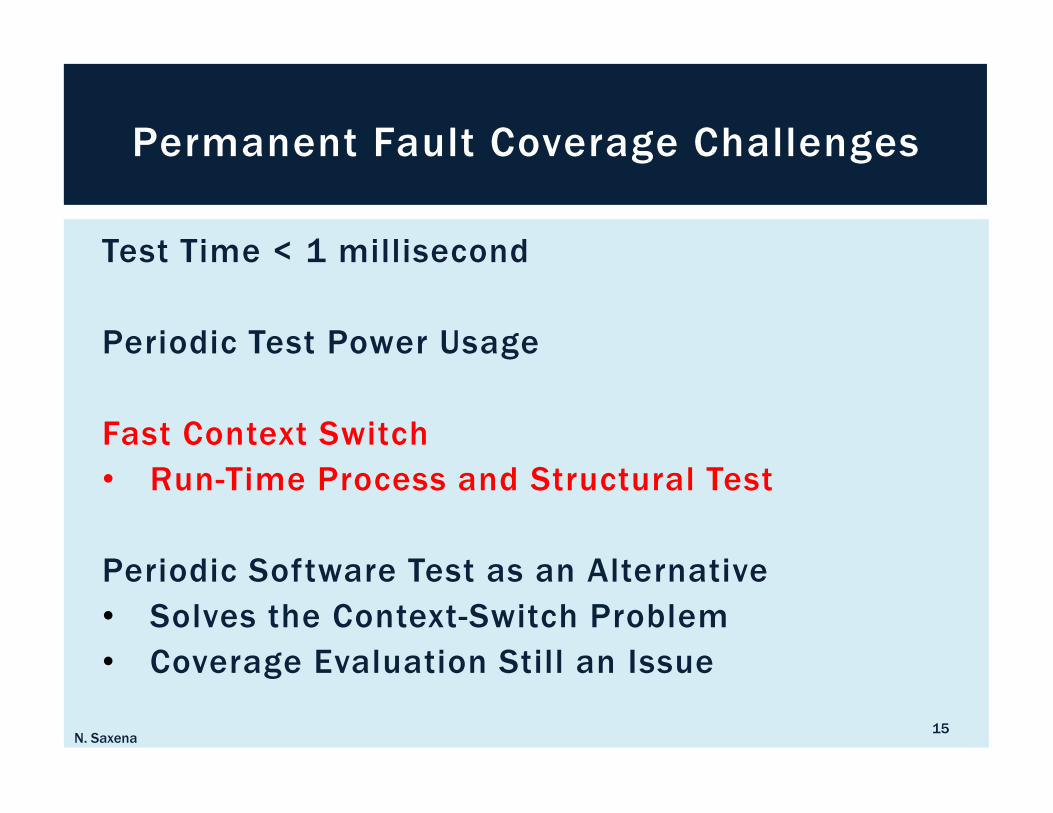
Test Time < 1 millisecond
Periodic Test Power Usage
Fast Context Switch
• Run-Time Process and Structural Test
Periodic Software Test as an Alternative
• Solves the Context-Switch Problem
• Coverage Evaluation Still an Issue
N. Saxena15
Permanent Fault Coverage Challenges

Percentage of FaultFaultFaultFault ----SecureSecureSecureSecure Permanent Faults in the Checker
How to Detect Latent Fault?
• Use Permanent Fault Tests– Works On l y Du r i ng Pe r i od i c Te s t s
• Self -Checking Checker– Works Du r i ng Run - T ime
• I f Checker is Sof tware use Algorithm Based Fault Tolerance (ABFT)
Total ly Se l f -Checking C i rcu i ts [Andersen & Metze 1973]
[Ash jaee & Reddy 1976] and ABFT [Huang & Abraham 1984]
N. Saxena16
Latent Fault Coverage
Memory State
x
Checker
x
Permanent FaultTransient Fault

N. Saxena17
Machine Learning (ML)

5000 Training Examples
Each Digit 20 x 20 Pixels
• Flattened to 400 Elements
Each Pixel Greyscale Shading
• Floating Point Number
Supervised Learning
N. Saxena 18
Handwritten Digit Recognition Dataset
Credits: Coursera Machine Learning Class, Prof. Andrew Ng, Stanford University

N. Saxena 19
Handwritten Digit Recognition
Neural Network
�� ��� � � � � �1
1 � ���
+1
��
��
����
....
....
....
....
....
....
+1
��
��
���
....
....
....
....
....
....
��
��
....
....
....� !
Input Layer Hidden Layer
Output Layer
Θ � Θ �
#$�% � !
�$�% � Θ$�%#$�%
#$�% � �$�$�%%
�$&% � Θ$�%#$�%
#$&% � � �$&% � � $!%

N. Saxena 20
Gradient Descent Algorithm
Cost Function
50 Iterations, 20mins > 95% Accuracy
400 Iterations, 3hrs > 99% Accuracy

N. Saxena 21
Test Examples– Resilient Learning
Classified as 2 but Detected as 1
Classified as 9 but Detected as 0

N. Saxena 22
Machine Learning– North American Bird-ID
After 7 Seconds…
N. Saxena 23
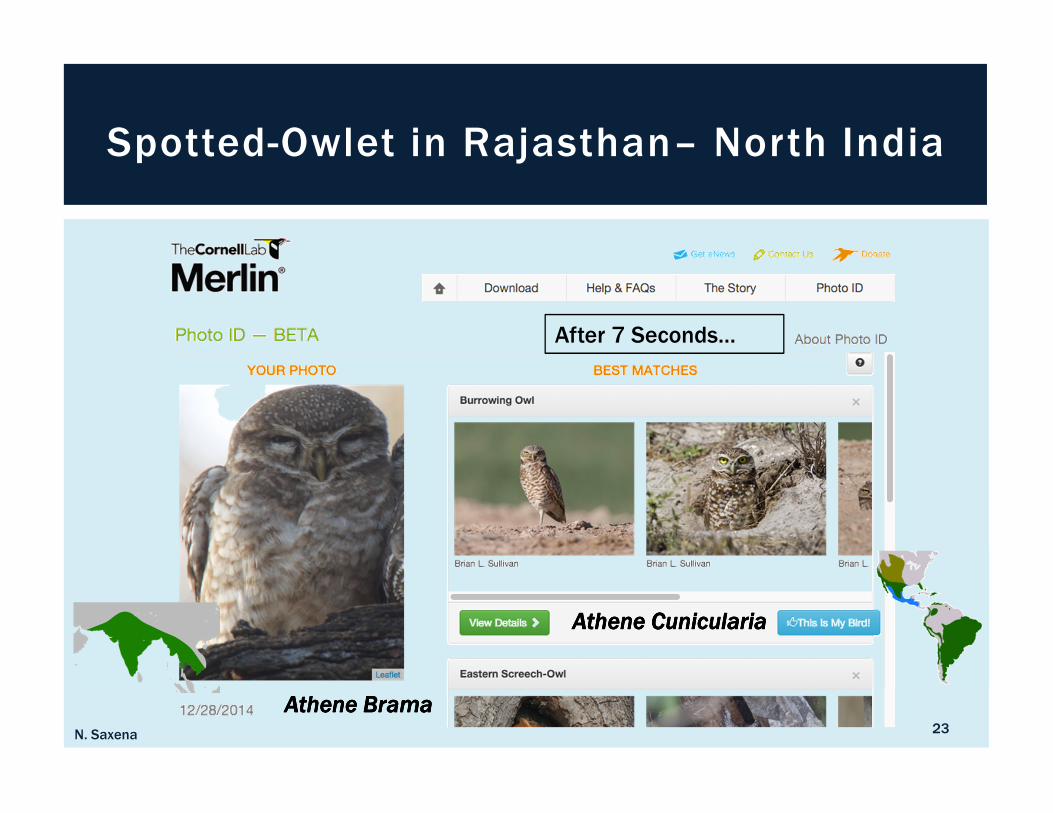
Spotted-Owlet in Rajasthan– North India
Athene BramaAthene BramaAthene BramaAthene Brama
Athene Athene Athene Athene CuniculariaCuniculariaCuniculariaCunicularia
After 7 Seconds…

Discounting Network Time
• Image Classification Takes 6 Secs
Merlin Bird-ID Hosted on AWS
• Possibly uses Single Xeon Server
To Classify Image in 33ms
• Need 6000ms/33ms = 180 Xeons…
N. Saxena24
What Processing Power Per Frame is
Needed?

N. Saxena 25
Supercomputer in a Car

N. Saxena26
Road to Resiliency
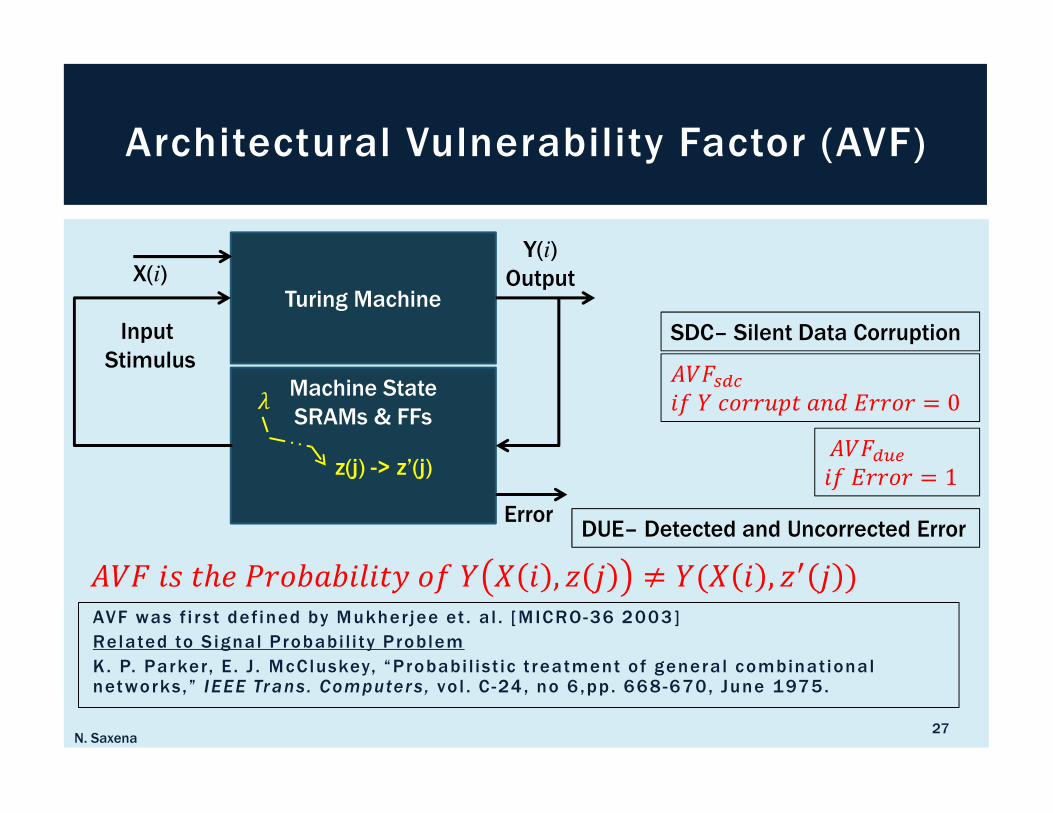
AVF was f i r s t def ined by Mukher jee et . a l . [MICRO-36 2003]
Related to S ignal Probabi l i ty Problem
K. P. Parker, E . J . McCluskey, “Probabi l ist ic t reatment of general combinat ional networks, ” IEEE Trans. Computers , vo l . C -24, no 6 ,pp . 668-670, June 1975.
N. Saxena27
Architectural Vulnerability Factor (AVF)
Turing Machine
Machine State
SRAMs & FFs
z(j) -> z’(j)
X(i)
Input
Stimulus
Y(i)
Output
Error
'()*+,�-/0���123#4�5���� � 0
'()+67�-5���� � 1
'()�3��8��9#9�:�3;�-/ � � , � = ≠ /$� � , �? = %
SDC– Silent Data Corruption
DUE– Detected and Uncorrected Error

N. Saxena28
AVF for Feature �� Error– Very Low
@A
@BC�����4����9������0:�1�

3/15/2016, N. Saxena 29
Higher ML Performance through Reduced
Precision
. . .. . .. . .. . .
. . .. . .. . .. . .
. . .. . .. . .. . .
�� �� �D. . .. . .. . .. . . . . .. . .. . .. . .
/� /� /E
32 − I�3�� )�#31��, ΘJ����3#4�/�K13213
. . .. . .. . .. . .
. . .. . .. . .. . .
. . .. . .. . .. . .
�� �� �D. . .. . .. . .. . . . . .. . .. . .. . .
/� /� /E
16 − I�3�� )�#31��, ΘJ����3#4�/�K13213
2X
Performance
Improvement!!

N. Saxena30
What about ML Resilience when Features
and Weights are Scaled?
��
�� C�����4����9������0:�1�
01|[29:23] [22:0]
��
��� C < 0.01
32 − 9�38��0���4#4��� > 2&�
01|[13:7] [6:0]
16 − 9�38��0���4#4��� > 2��
PrecisionPrecisionPrecisionPrecision VulnerableVulnerableVulnerableVulnerable BBBBitsitsitsits
(Average)(Average)(Average)(Average)
Vulnerable Fraction Vulnerable Fraction Vulnerable Fraction Vulnerable Fraction
(Average)(Average)(Average)(Average)
RawRawRawRaw FITs/WordFITs/WordFITs/WordFITs/Word
(Relative)(Relative)(Relative)(Relative)
Effective FITs/Word Effective FITs/Word Effective FITs/Word Effective FITs/Word
(Relative)(Relative)(Relative)(Relative)
int32 22 68.75% 2 1.375
int16 14 87.50% 1 0.875
fp32 21 65.63% 2 1.313
fp16 12 75.00% 1 0.750
Resiliency Gets Better with Scaled Features & Weights

Neural Networks Implemented as Program Code
Errors in Control-Flow
• Program Counter, Instruction Bits
SDC-AVF in the Range 20% to 40%
Requires Parity Protection & Self-Checking Code
Recovery Strategy– Detect and Retry
• Works for Transient Errors
N. Saxena31
ML Resilience for Control-Flow Faults?

Error Signals Still Needed
• Single-Point Fault Tolerance
Similar to Erasure Codes
• Mirrored RAID
• Identify Correct Copy
Execution Instances
• On Non-Overlapping Hardware
N. Saxena 32
Redundant Execution Needed
(Internal Redundancy)
Execution A
Execution B
Detect & Retry Does Not Work for Permanent Faults
/Q
ErrorU
/V
ErrorW

N. Saxena33
Markov Chain Analysis
(Need External Redundancy)
Path Planning
Object DetectionSteer
Accel
BrakeCameras
RADAR
LIDAR
Maps
Car Velocity & Position
30
Frames/Sec
Drive Repair
Failed
X
'()+67
'()*+,
ISO26262 Does Not Have Any Requirements on Availability
For Driverless Car
Loss of Frames => Loss of Life
For 3 Frame-Tolerance, Need1
X< 100
Prof. K. S. Trivedi

N. Saxena 34
Dual Redundant System
Steer
Accel
Brake
Car Velocity & Position
System A
System B
Shared
Control
A,B
Repair
A
Repair
B
Failed
'()+67Y'()+67Z
XZ XY
ZY
Relaxed Constraints on Repair Rate
1
XZ<1
Y
1
XY<1
Z
�
[\��
�
[]in the order 1000’s of hours
Repair can wait till the next Key-Off Event

Systematic FaultsSystematic FaultsSystematic FaultsSystematic Faults ObservedObservedObservedObserved Bug RateBug RateBug RateBug Rate FIT RateFIT RateFIT RateFIT Rate
Hardware Design Faults 3 Bugs in 48 Years 7000
Software Design Faults 1 Bug Every Year 100000
N. Saxena35
What is the Current FIT Rate for
Systematic Faults?
Mitigating Factors
Automotive Environment is More Constrained
• Hardware Design Quality– Need Three Orders of Improvement
• Software Design Quality– Need Four Orders of Improvement

Coping with Systematic Hardware and Software Design Errors
[S iew io rek et . a l . 1978] (by te reve r sa l cop ies C .mmp processo r )
[Sedmak and L iebergot 1980] ( comp lementar y f unc t ion d i ve r s i t y i n VLS I )
[Chen and Av i z ien i s 1978] (N - ve r s ion p rog ramming , S I FT so f tware imp lemented f au l t - to le rance )
[Ho rn ing e t . a l 1974] (Recove r y B locks ) [Pa te l ] RESO Techn ique
[Amman and Kn igh t 1987] (Da ta D i ve r s i t y )
[McC luskey, Saxena , M i t ra 1998] D i ve r s i t y fo r Recon f igurab le Log ic & Quant i f y ing D i ve r s i t y
N. Saxena36
Design Diversity
Steer
Accel
Brake
Car Velocity & Position
System A
System B
Shared
Control

N. Saxena 37
My Perspective on ISO26262
ISO26262ISO26262
Systematic FaultsSystematic Faults
HW and SW Design QualityHW and SW Design Quality
Design & Verification Process
Design & Verification Process
Manufacture Testing QualityManufacture Testing Quality
Random Hardware FaultsRandom Hardware Faults
Transient Errors
Transient Errors
Permanent Faults
Permanent Faults
1. Fault-Avoidance
2. Fault-Tolerance
1. Fault-Tolerance
2. Fault-Avoidance
Design DiversityHardened Filip-Flops

Road to Resiliency ⇒Dual Redundancy
• Mitigates Permanent Fault Testing
• Relaxes Repair Time Requirements
Systematic Faults
• Rigorous Testing and Validation
• Need 3-to-4 Orders of Improvement
• Design Diversity
N. Saxena38
Conclusions