automation of area measurement of sunspots
TRANSCRIPT

AUTOMATI ON OF AREA MEASUREMENT OF SUNSPOTS
LAJOSGYORIHeliophysical Observatory of theHungarian Academyof Sciences,
Gyula Observing Station,5701Gyula, P.O. Box 93,Hungary
(Received 21 January1997;accepted 11 December1997)
Abstract. When drawing up a databasefor sunspots from a large collection of white-light films,a needfor the automation of the processarises.The concepts usedat the automation of the areameasurements of sunspots are described.As an example, sunspotgroupsNOAA 5521 and 5528are processed and the areas obtained are compared to the measurements published in the literature.Similar valuesare obtained,exceptumbral areaspublished by Steineggeret al. (1996) which aresignificantly larger than ours. We find that the differencesmay be attributed to the fact that thedefinition proposedby Steineggeret al. (1996)for thepenumbra–umbra borderof a sunspotis notequivalent to thoseusedfor themeasurements of others of theumbral area.
1. Int roduction
Wehaveabout100000white-lightphotoheliogramsat DebrecenObservatory andat its Gyula Observing Station. To processthis large numberof heliograms,forexampletocompileaheliographiccoordinateandareadatabaseforsunspotgroups,it isexpedient tominimizethehumaninvolvement in theprocess.Theminimizationof thehumaninteraction in theprocessof thecompilation of thedatabaseprovidesthreeadvantages:thefirst oneis theeconomic benefitof reducing cost, thesecondonearisesfrom thefactthatthehomogeneity of thedatabaseismorerelevantusinginstrumental decisioninsteadof humanjudgment, andthethird oneisthespeedingup theprocessing time.
In orderto achieveasignificantautomation,aprogrampackagewasdeveloped.This software, using scannedor CCD imageof a sunspotgroupdeterminesauto-matically the contours characterizing the umbra-penumbra and the photosphere-penumbraboundariesandfrom this theumbral andpenumbral areasandthehelio-graphic positionsof the spotsare determined.
The matter was divided into three parts. This paperis the first part whichprovidesthe concepts usedin the determination of the areaof the sunspots. Thesecondpaperwill includethe determination of the heliographical coordinates ofthesunspots, thecorrectionsused at the reduction and theautomatic identificationof the spots of two heliograms takennearly at the same time. Generally, we takethree heliograms nearly at the same times (within ten minutes). The automaticidentification provides the possibility of making averages over these heliograms,resulting in better accuracy. In the third paper, the observational material, theinstrumentationandtheassessmentof theaccuracy will beaddressed.Additionally,theeffectof differentfactorson accuracy, aswasrevealedin thetesting runsof theprograms,will bediscussed.
Solar Physics 180: 109–130,1998.c 1998Kluwer AcademicPublishers. Printed in Belgium.

110 LAJOSGYORI
Todigitizeaphotographusually twodevicesareused:animagescannerwhichissuitablefordigitizinglargeimagesbut usually distortstheimagein anunpredictableway (depending on thequality of its step motor) or aCCDcamera.
We usean 8-bit CCD camera (the image size is 768� 576 pixels) to digitizea sunspotgroupon ourphotoheliogram.Thediameterof the full-discsolar imageonourphotoheliogramis about100mm.Thescaleof thedigitizedimageis about0.2500 pixel�1.
If wehadasuitablescannerthenwholephotographic image(notonly asunspotgroup)of theSunshouldbedigitizedand,in thiscase,thedigitizedimagewouldbesuitable for obtaining the globalheliographic coordinates of thesunspots withoutusing any other instrument. But if we have only thedigitizedimageof a sunspotgroup(asin thecaseof aCCDcamera)then,for positioningthis imageon theSun,it isnecessary to determinethecenter andtheradiusof thephotoheliogramandtheposition of somespots (at least three) with acoordinatemeasuring instrument.
If we want to determine the areaof a sunspotthen first we mustanswerthequestion:whatis a sunspot?Here,we are not interestedin the physicalpropertiesof asunspotbut ratherin thepropertiesof its image.If wehavea lookatanimagecontainingasunspotgroupthenwecanobservetwo essential featuresof thespots:they aredarker thenthesurroundingphotosphereandthey haveborders(thatis thechangeof the intensity from its photospheric value to the spot value takesplacewithin a relatively short distance).
On the basis of the above-mentionedproperties of thesunspot, themethodforareadetermination of the sunspots canbe dividedinto two main categories: themethodusing only the lower intensity of the sunspots (in this paperthis methodwill beaddressedasa threshold method)andthemethodmakinguseboth of theirlower intensity andthegradient of the intensity of thesunspotimage(thisonewillbereferred to asa bordermethod).
Threshold methods:thesemethodsusea prescribed threshold intensity value(cutoff value)to decidewhetheran imagepoint belongsto aspotor not(in facttwothreshold valuesare prescribed,onefor thepenumbraand onefor theumbra). Onthebasisof how thecutoff valuesaredetermined,thesemethodscanbedividedintotwo groups.Thefirst groupusescutoff valuesinferred from statistical studiesofthespot-to-photosphere intensity ratios (ChapmanandGroisman,1984;Chapmanetal., 1989;Brandtetal., 1990). ChapmanandGroisman(1984)adjustedacutoffvaluefor intensity of penumbrasothatageneral agreement betweenareaspublishedin SGDandtheir own areameasurementsshould hold.Chapmanetal. (1989)triedto put the threshold methodon a firm basis, incorporating the essence(the largeintensity gradient) of thebordermethodinto it. They foundthat the intensity of thesteepestdescentat theouteredgeof thepenumbraisat 8.5%below thephotosphericvalue.But this goalcanbeachieved only on a statistical basis becauseaccordingto our experience (see Section 5 of this paper) the intensities of the borders ofdifferentspots (especially in caseof theumbrae)are different.

AUTOMATION OF AREA MEASUREMENT OF SUNSPOTS 111
Thesecondgroupof thethresholdmethodtriestodeterminethecutoff valuesforpenumbraandumbra,utiliz ingsomepropertiesof thehistogramandthecumulativefrequency diagramof the imageof the sunspotgroupSteineggeretal. (1996). Weshall return to this methodin Section 5 of thispaper.
Border methods:here, at first the borders of the spots are determined,makinguseof thesensitivity of the eye to the abrupt changesin theintensity in animage.Thefollowingmethodscanbeputhere. In DebrecenObservatory thevideoimageof asunspotgroupisusedtomeasureitsarea.An isodensity lineisfitted to theedgeof the spot. This is achieved by changing the intensity of the isodensity line untilthebestfit (according to thejudgmentof themeasurer) isobtained(Dezso,Gerlei,andKovacs,1987). Thespotareasin the Greenwich PhotoheliographResults (DeLa Rue,1869)were measuredusing a glassplate with accurately ruled squares incontactwith photographic film. Thenumbersof thesquarescontainedin asunspotwere counted and transformed into area on the solar disc. The methodsusingsunspotdrawingscanalsobeplacedamongthe bordermethods.
Thebordermethodspresented abovefor areadetermination of thesunspotsaretimeconsuming,tiresomeanddemandalot of attention.Thesemaybethereasonswhy theobservationalmaterials for sunspotspiled up in observatoriesall over theworld are, for the mostpart, unprocessed.Thereasonswhich have givenimpetusto the measurements of the heliographic coordinate andarea of the sunspots atthe beginning of these measurementsare still valid. In fact, the comparison of thesunspotareaswith the high accuracy measurements of the solar constant mightyield new results in the field of solar-terrestrial relations.
In the light of the above-mentionedfacts it would be useful to work out amethod which, making useof the imageprocessing techniques,automates thebordermethodof thearealmeasurementof thesunspots.
2. Basic Concepts
Thefirst ideathatcomesto mind whensolving thetask of looking for boundariesin animageis theuseof thegradient image.High valuesfor thegradient indicatethe presenceof a border, anabruptchangein the gray-level value.But the troublewith the gradient imagein our caseis that the gradients along the boundaries(photosphere–penumbra,umbra–penumbra)donotrepresentacontiguous,clearlycutclosedlinemainly duetofilamentary structurebeingpresentinasunspotgroup.Somemanipulation of the gradient image,suchasglobal and local thresholding(seeSection 4.4 for thedefinition of these terms), may help but doesnot solve theproblem.This situation canbeeasily seenin Figures1–3. Although,it cannotbedirectly interpreted as photosphere–penumbraand umbra–penumbraboundaries,the gradient imagecontains a lot of information about theseboundaries,as canbe seenby comparing the gradient image(Figures1–3) with the original image(Figures5 and 6). This information canbe exploited as follows: let us assign a

112 LAJOSGYORI
Figure1. Gradientimageof sunspotgroupin NOAA region5528(15 June1989,07:43:03 UT).
gradient value to every intensity contourof the imageby summingupthegradientvaluesalongthe points of thecontour (theterm contourmeanshere an isodensityline)anddividingthesumby thenumbersof thecontourpoints.Let AGAC(averagegradient alongcontour) denote this value.
It is reasonable to choosethe contour having maximum AGAC among thecontours of a spotasthe umbra–penumbraboundary of the spot. This will betheguide line for finding the umbra–penumbra boundary, although,in somecasesitmustbemodified.Similarly thecontour having the first localmaximum(countedfrom thephotosphere) in AGAC amongthe contours of a spotcanbetaken as thephotosphere–penumbraboundaryof thespot,although,thisdefinitionmust alsobemodified in somecases.Asan exampleFigure4 plots theAGAC valuesalongtheintensity contoursof spotSof sunspotgroupin NOAA region5528(seeFigures5and6 for spotS).
3. Overviewof theAlgorithm
Theoutlineof the processing schemeis as follows:– CheckingtheCCDimage.By takingtoolargeatransillumination, it ispossible
to burn in (to overilluminate)theumbraandso to distort thespotboundaries. Here,

AUTOMATION OF AREA MEASUREMENT OF SUNSPOTS 113
Figure 2. Same as Figure 1, but with global thresholding. The threshold value is the averagephotospheric gradientof theimage.
using thehistogramof theimage, thisoverillumination ischecked. Additionally, asweshall seelater, if thespot isnear thesolar limb, theCCDimagemust beproperlyoriented relativeto thelimb to makeallowancefor limb darkening correction. Thisproperorientation ischeckedaswell.
– Filteringout cross-threads.For orientationpurpose, twospider linesareplacedin the primary focusof theheliograph.It must be checkedthat theselinesare inthe imageandif so, they mustbefil tered out.
– Background correction. This is usedto correct for the unevennessof thetransillumination used in taking the CCD image of a sunspot group and for thesensitivity distribution of theCCD array.
– Limb-darkening correction.Thelimb darkeningof the solardiscdistorts thecontoursbelongingto a givenintensity (gray level), soit mustbecorrectedfor.
– Fourier filteringtheimage.To increasethesharpness(especially inbadseeingconditions)of theboundariesof the spots it is useful to do somespatial frequencymanipulation of theimage.
– DeterminingtheBeginningIntensityLevel. OurCCDimageshave256intens-ity levels. To determinetheintensity contoursof theimageit isreasonableto beginwith the level close to the level of the penumbra–photosphere boundaries butslightly below it. This is theBeginning Intensity Levelof the processing.

114 LAJOSGYORI
Figure3. Sameas Figure2, but applying a localthresholding with a3� 3 environment.
– Determining thegradientimage.– Determiningeachcontourof every intensity level below theBeginningIntens-
ity Level. Here, the AGAC valuebelonging to the contour isalsodetermined.– DeterminingthecontoursbelongingtoaLocal MinimumoraLocalMaximum.
Every Local Minimum and Local Maximum is determined, and a subsetof thecontoursetdeterminedaboveisassignedto aLocalMaximumor aLocal Minimumof the image.Two subsetsbelongingto two Local Minima, of course,maycontaincommoncontours if the two Local Minima have merged at the intensity level ofthesecontours.
– Filtering out Dark Penumbral Filaments, Granular LocalMinima andBrightRegions. Not every local minimum in the imageof a sunspotgroup is a spot. Itcanbe a Dark Penumbral Filament – an unusually dark region betweenbrightpenumbral filaments – or a Granular Local Minimum, i.e.,a realdark granule oronecausedby theseeing.BrightRegionsin asunspotpenumbrashow up asLocalMaxima. They must be handled separately and their areas (if their intensities arenearto thatof the photosphere) mustbesubtractedfrom thepenumbral area.
– Determining thepenumbral boundariesof thespots.– Determining theumbral boundariesof the spots.

AUTOMATION OF AREA MEASUREMENT OF SUNSPOTS 115
Figure4. AGAC (averagegradientalongcontour) versusintensity of thecontour for spotSshown inFigures5 and 6. The intensity contour corresponding to the first localmaximumis thephotosphere-penumbraboundary, andtheintensity contourcorresponding to theglobalmaximumisthepenumbra–umbra boundary of spot S. The other local maxima in the figure reflect inner structures in thepenumbra and umbra.Note: As theinverse imageis usedto determine theboundary contours of thespots,thus,thephotosphereis at thelower intensitiesand theumbrais at thehigherones.
– Merging Local Minima having the sameUmbra–Penumbra Boundaryintooneumbra.
– Up to now, weconsideredtheboundariesof thespotsasiso-density lines,butsometimesdifferentpartsof aboundary could belongto differentiso-density lines.To take into accountthis fact, acorrection is applied to theboundariesof the spot.
– Determining the umbral and penumbral areasandcenters of gravity of thespots. This is doneby determining the pixels inside the boundary contour. Here,the area of the Bright Regionshaving the intensity of the photosphere inside apenumbraaresubtractedfrom thetotal areaof thespot.
In the next sections a little more detailed description of some steps of thealgorithm areaddressed.

116 LAJOSGYORI
Figure5. NOAA region 5528(15 June1989,07:43:03 UT).
4. Discussion of the Stepsof theAlgorithm
4.1. CORRECTION FOR LIMB DARKENING
Tocorrectasunspotgroupfor limb darkening,two methodsareused.If thesunspotgroupis fartherthan100arc secfrom thelimb, thenthelimb darkeningover aspotgroup canbe approximated by a plane.From the CCD imageof the spotgroupthe position of this planecan be determined, and after that the correction for limbdarkening canbedone.
When thesunspot group is near the limb (within 100 arc sec) theCCDimageistaken in suchaway thatthecolumnsof theimageareparallel to thetangentof thesolar limb at thespotgroup(an accuracy of aboutfive degrees,of theparallelismis enough). Having madecorrectionsfor faculae,the averageof the profile of thefirstandthelast rowsof the image(of coursecare is takennot to havespotson theedges of the image) represents fairly the limb darkening along the other rows ofthe imageaswell, thus theycan beused to correct it.

AUTOMATION OF AREA MEASUREMENT OF SUNSPOTS 117
Figure 6. Sameas Figure 5, but under-exposed,whentaking thephotographic copy of theoriginalphotoheliogram,to make theumbra structuremorevisible.
4.2. FOURIER FILTERING
Thepurposeof theFourier filtering is to enhancetheborders (photosphere–pen-umbra,penumbra–umbra)of thesunspots.Thevery short spatial wavelengthsareattenuated to decreasenoise in the image.It is known (Frieden,1979) that thesimpleexpedientof decreasingafinitebandof theimagespectral valueatfrequen-ciescentered about the origin will result in anenhancedoutput. For this reason,longwavelengthsandthezero spatial frequency arealsoattenuated.Attenuation ofthe long wavelengths has also the effect of decreasing the unevennessof the illu -mination remaining after backgroundandlimb darkening corrections.The shortwavelengthsareamplifiedto emphasizeboundaries.
Figure 7 shows the multiplication factor, g(�), as a function of the spatialwavelength, �, with which the corresponding Fourier componentof the imageismultiplied. This function isobtainedby prescribingthevaluesof thefunctionat fivewavelengths andconnecting themwith straight lines.The five prescribedpoints(bestsuited to our observations)are: (0.25,0); (1,1); (2,1.8); (3,1); (194,0.8). Thefirst numberin the data pairs is the spatial wavelength given in arcsecsandthesecond one is the multiplication factor for this wavelength. We have chosen themaximumvaluefor thegain factor at wave length 200 becausethe diffraction limit

118 LAJOSGYORI
Figure7. Thefactor g(�) with thatthecorrespondingFouriercomponentof theimageis multipliedversusthespatial wavelength, �.
for our photoheliographis about 100. The zero spatial frequency of the imageisattenuated by thefactor 0.5.
4.3. BEGINNING INTENSITY LEVEL
Using theedgecolumnsandrowsof theimage,theintensity level andthestandarddeviation of thephotosphereisdetermined(providedthatthereareno spotson theedgesof theimage). Subtractingtwicethestandarddeviationfromthephotosphericlevel, a preliminary beginning level of intensity for processing is obtained. Ifthe numbers of the contours belonging to this intensity (i.e., the numbers of thepreliminary penumbrae) are larger than a prescribed value then the beginningintensity value is decreaseduntil the numberof thecontours obtainedare smallerthan the prescribedvalue.So, we achieve the result that the beginning intensitylevel of theprocessingisnearenoughto theintensity of thepenumbra–photosphereboundary.

AUTOMATION OF AREA MEASUREMENT OF SUNSPOTS 119
Figure8. Comparisonof themeasurements for spotareaAs (penumbra+ umbra)measuredin unitsof 10�6 solar hemispheres of thesunspotgroupin NOAA region5521from different observatories.
4.4. GRADIENT IMAGE
To determine the AGAC value belonging to an intensity contour, we needthegradient image.To approximate the gradient in the caseof a discrete function,we usedthe method suggested by Sobel(Tennenbaumet al., 1969). But beforeusing thegradient imagewe try to remove the gradientvaluesthatdo not belongto a sunspotborder. To getrid of the photospheric noise,a global thresholding isapplied using the averagegradient value of thephotosphere asa threshold value,i.e., if thegradient value in an imagepoint is lower thanthethreshold value,thenthegradientof thispoint issetto zero.Comparing Figure1 with Figure2 it canbeseenthatapart of thesurplusgradients(notrepresentingaspotborder) isremoved.If we apply a local thresholding (i.e., retaining thegradient value of a pixel onlyif it is a localmaximuminside a prescribedenvironmentof thepixel in question)then further successcanbe achieved in removing the surplus gradients from thegradient imageascanbeseenby comparing Figure 2 with Figure3.

120 LAJOSGYORI
Figure 9. Comparison of the measurements for umbral areaAu measured in units of 10�6 solarhemispheres of sunspotgroupin NOAA region5521from different observatories.
Notonly themagnitudeof thegradientisdeterminedbutalsoitsorientation.Forthe determination of theaveragegradientalonganintensity contour, thegradientis weighted by a factor determined from the angle betweenthe direction of thegradient andthetangentto the intensity contour.
4.5. FILTERING OUT Dark Penumbral Filaments,Granular LocalMinima, ANDBrightRegions
Somedark lanesbetweenthepenumbral filaments in asunspotgroupwith awell-developedumbra canbesodark andso wide that it is picked up by theprogramasa Local Minimum. Sincethis lane is not asdark asanumbra and its boundaryis not assharp as theboundary of anumbra, using theseproperties, they maybefiltered out. Note, that using only thecriteria for the intensity of theumbra to filterout Dark Penumbral Filaments, thepenumbral spots (spots above the intensity oftheumbra) would also befiltered out.
The level of the intensity where the processing begins is somewhere betweenthe intensity of the photosphere and the intensity of the penumbra-photosphere
AUTOMATION OF AREA MEASUREMENT OF SUNSPOTS 121
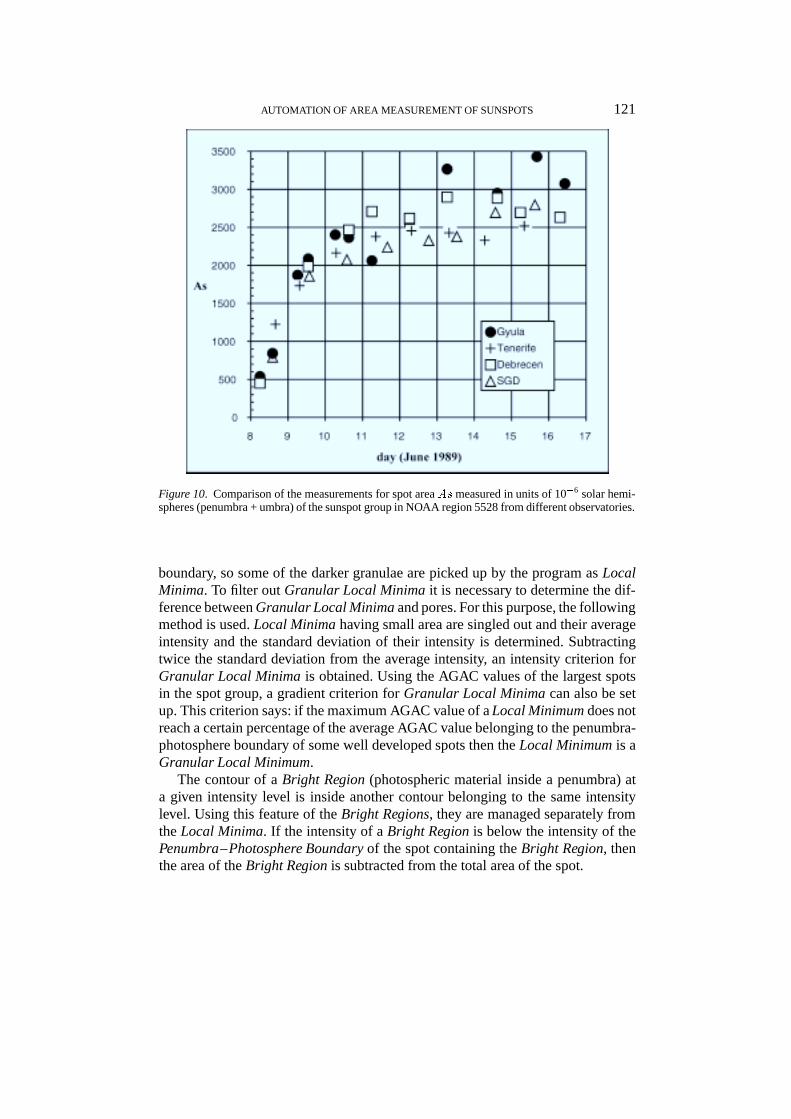
Figure10. Comparisonof themeasurements for spotareaAs measuredin unitsof 10�6 solar hemi-spheres(penumbra+ umbra)of thesunspotgroupinNOAA region5528from differentobservatories.
boundary, so someof thedarker granulaeare picked up by theprogramasLocalMinima. To filter out Granular Local Minima it is necessary to determine the dif-ferencebetweenGranular LocalMinima andpores.For thispurpose,thefollowingmethodis used.Local Minima havingsmall areaare singledoutandtheir averageintensity and the standard deviation of their intensity is determined. Subtractingtwice the standard deviation from the averageintensity, an intensity criterion forGranular Local Minima is obtained.Using theAGAC valuesof the largestspotsin the spot group,a gradientcriterion for Granular Local Minima canalsobesetup.Thiscriterionsays:if themaximumAGAC valueof aLocal Minimumdoesnotreachacertain percentageof theaverageAGAC valuebelongingto thepenumbra-photosphereboundary of somewell developedspots thentheLocal Minimum is aGranular LocalMinimum.
The contour of a Bright Region (photospheric material inside a penumbra) ata given intensity level is inside another contour belonging to the sameintensitylevel. Using this feature of the Bright Regions, they are managedseparately fromthe Local Minima. If the intensity of a Bright Region is below the intensity of thePenumbra–PhotosphereBoundaryof the spot containing the Bright Region, thenthe area of the BrightRegion is subtractedfrom thetotal areaof thespot.

122 LAJOSGYORI
Figure 11. Comparison of the measurements for umbral areaAu measured in units of 10�6 solarhemispheres of sunspotgroupin NOAA region5528from different observatories.
It maysometimeshappenthataGranular LocalMinimumor aDarkPenumbralFilament is not fil tered out (we are not too severe in specifying the parametersdirecting thefil tering processesto avoid fil tering out poresaswell). But this is noproblembecausewe havethree heliograms takennearly at the sametimes(withinten minutes) and only thosespots are retained which are contained in all threeheliograms.
4.6. DETERMINATION OF THE Penumbra–PhotosphereBoundaryOF THE SPOTS
Thedetermination of thePenumbra–PhotosphereBoundaryof the Local Minimacomprisesthefollowing steps:
– ThoseLocal Minima having the samelastcontour (numbering of the con-tours of an Local Minimum beginsfrom theumbra) are united into a preliminarypenumbra.
– Inside apreliminary penumbra,theLocal Minimumwith minimum intensity(MinimumIntensity Spot) is ascertained.

AUTOMATION OF AREA MEASUREMENT OF SUNSPOTS 123
Figure12. Cumulativefrequency diagramfor thesunspotgroupinNOAA region5528(15June1989,07:43:03 UT). Straight lineswerefitted to thepenumbral andumbral parts of thediagram,and fromtheir intersection a cutoff value for umbral intensity was derived. Note: to determine the cumulativefrequency diagramwe usedtheinverseimage,so,thephotosphereis at thelower intensitiesand theumbra is at higherones.
– Thecontour representing thePenumbra–PhotosphereBoundaryof the Min-imumIntensity Spotis determined, using the conceptsmentioned before.
– If, in addition to the MinimumIntensity Spot, there is a Local Minimum (orthere are Local Minima) in a preliminary penumbra, then, at the determination ofthe Penumbra–PhotosphereBoundaryof this Local Minimum, two casesarecon-sidered. If the contour representing thePenumbra–PhotosphereBoundaryof theMinimumIntensity Spotis amongthecontoursof theLocal Minimum in question,then this contour will also be the Penumbra–PhotosphereBoundaryof the LocalMinimum, otherwisethe relative separation contour with respectto the MinimumIntensity Spot, of the Local Minimum will be the Penumbra–PhotosphereBound-ary of the Local Minimum. In thelatter case,of course,thepreliminary penumbrais separated into two penumbrae.The explanation of the secondcaseis that thePenumbra–Photosphere Boundaryof a small spotvery nearto a large spotcanhavehigherintensity thanthePenumbra–PhotosphereBoundaryof the largeone.
As definedbefore, thePenumbra–PhotosphereBoundaryof aMinimumIntens-ity Spotisthecontourwith thefirst localmaximum(countedfromthephotosphere)in AGAC amongthecontoursof thespot. But sometimes(especially in badseeing

124 LAJOSGYORI
Figure13. Contours corresponding to intensity level 107aresuperimposedon the imageof sunspotgroup(NOAA 5528,15 June1989,07:43:03 UT).
conditions), there is no localmaximumof theAGAC on the contours of thepen-umbra.In thiscase,thecontourhaving the largestrateof thechangeof theAGACfrom onecontour to the next is chosenasthe Penumbra–PhotosphereBoundaryof theMinimumIntensity Spot.
4.7. DETERMINATION OF THE Umbra–Penumbra BoundaryOF THE SPOTS
The Umbra–Penumbra Boundaryof a Local Minimum was definedas the con-tour with maximumAGAC amongthe contours of the Local Minimum. But thisdefinition can only be taken as a preliminary definition of the Umbra–PenumbraBoundaryandneedssomerefinement. If theUmbra–PenumbraBoundaryof aLoc-al Minimum(denotedby A) containsthe Umbra–Penumbra Boundaryof anotherLocal Minimum (denotedby B) thenthis meansthat (at the level of the intensityof the Umbra–Penumbra Boundaryof Local Minimum A) Local Minimum B andLocal Minimum A were thesamespot, but after theseparation Local Minimum Bhadsharper border thanLocal Minimum A. In this case the preliminary Umbra–Penumbra Boundaryis taken asUmbra–Penumbra Boundaryfor Local MinimumB andtheseparation contourof Local MinimumA with respect to Local MinimumB istakenastheUmbra–PenumbraBoundaryfor Local MinimumA. If theprelim-
AUTOMATION OF AREA MEASUREMENT OF SUNSPOTS 125
inary Umbra–Penumbra Boundaryof Local Minimum A contains the preliminaryUmbra–Penumbra Boundaryof several Local Minima thenthe innermostrelativeseparation contour of Local Minimum A is takenasUmbra–Penumbra Boundaryfor Local MinimumA.
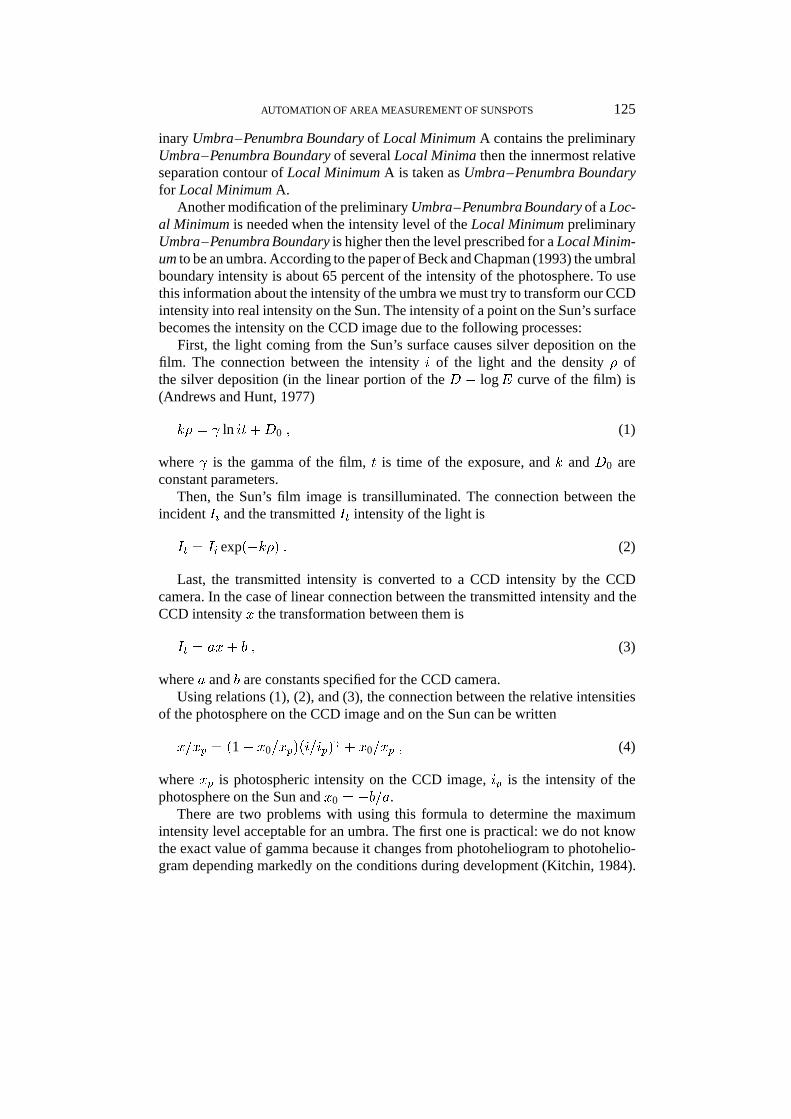
Anothermodificationof thepreliminary Umbra–PenumbraBoundaryof aLoc-al Minimumis neededwhenthe intensity level of theLocal Minimum preliminaryUmbra–PenumbraBoundaryishigherthenthelevel prescribedfor aLocal Minim-umtobeanumbra.Accordingto thepaperof BeckandChapman(1993)theumbralboundary intensity is about65 percentof theintensity of the photosphere. To usethisinformation abouttheintensity of theumbrawemusttry to transformourCCDintensity into real intensity on theSun. Theintensity of apoint on theSun’ssurfacebecomesthe intensity on the CCDimagedue to the following processes:
First, the light coming from the Sun’s surface causes silver deposition on thefilm. The connection betweenthe intensity i of the light and the density � ofthe silver deposition (in the linear portion of theD � logE curve of the film) is(AndrewsandHunt, 1977)
k� = ln it+D0 ; (1)
where is the gammaof the film, t is time of the exposure, andk andD0 areconstant parameters.
Then, the Sun’s film imageis transilluminated.The connectionbetweentheincidentIi and the transmitted It intensity of the light is
It = Ii exp(�k�) : (2)
Last, the transmitted intensity is converted to a CCD intensity by the CCDcamera. In the caseof linear connection between the transmitted intensity and theCCDintensity x the transformation between them is
It = ax+ b ; (3)
wherea andb are constantsspecifiedfor the CCDcamera.Using relations (1), (2), and (3), theconnection between the relative intensities
of thephotosphereon theCCD imageandon theSuncanbewritten
x=xp = (1� x0=xp)(i=ip) + x0=xp ; (4)
wherexp is photospheric intensity on the CCD image,ip is the intensity of thephotosphereon the Sunandx0 = �b=a.
There are two problems with using this formula to determine the maximumintensity level acceptable for anumbra.Thefirst oneis practical: we do not knowthe exactvalueof gamma becauseit changesfrom photoheliogramto photohelio-gramdepending markedly on the conditionsduring development(Ki tchin, 1984).

126 LAJOSGYORI
The secondone is conceptual: according to our practice the Umbra–PenumbraBoundaries of the pixels in a sunspotgroup canhave different intensity levels.But, fortunately, weonly need themaximum intensity level for an umbrato decidewhetheraspotcanbeanumbra(theboundary of theumbraisnotbasedon intens-itiesbut on gradients). Thus, wedetermineapreliminary maximum intensity levelfor umbrae using anaveragegammaandtherelative intensity (65%of the photo-spheric intensity) of theumbra boundary on the Sun,andafterwards this valueisincreasedby anamountobtainedfrom experienceto getthemaximum acceptableumbral intensity level. Using this method of prescribing the maximum umbrallevel, sometimes,it canoccurthata penumbral spotis regardedasanumbra.
If the intensity of the preliminary Umbra–Penumbra Boundaryof a LocalMinimum is higher than the maximum prescribed umbral intensity level, thenwe go backon the contours of theLocal Minimum until the prescribed maximumintensity level for theumbraisreachedandthecontourobtainedthiswaywill betheUmbra–Penumbra Boundaryof the Local Minimum. If theprescribedmaximumintensity level for the umbra cannot bereached,theLocal Minimum is taken as apenumbral spotwith zero umbral area.
4.8. MERGING Local Minima HAVING THE SAME Umbra–Penumbra BoundaryINTO ONE UMBRA
During the life of a sunspotgroup an umbra canbreakup into several umbraeor sometimesnearby umbraecanmerge into oneumbra. How doesthe programmanagethis process?In our approachesthe umbra–penumbra boundary is a linewith maximumgradientvalue.So, if two (or more) Local Minima have the samecontour as an Umbra–Penumbra Boundary this means that they have alreadymerged or they have not yet separated. Following this line of argument, LocalMinima having the samecontour asthe umbra–penumbra boundary are mergedinto oneumbra.But themerging isonly donefrom thearealviewpoint (themergedLocal Minimahaveacommonumbral areadeterminedby thecommonboundary).Fromtheviewpointof theheliographiccoordinate, theLocal Minimacomprisinganumbraarehandledseparately; their centersof gravity, fromwhichtheir heliographiccoordinatesareascertained,are determinedby using their separation contours.
In our interpretation, theterm spot meansalocal minimum (apixel representingthecenter of gravity of asunspot) retainedafterdifferentfilteringmechanismsin asunspotgroup.A spotcanbea penumbral oneif its intensity is not low enoughorcanbeanumbral oneif it is insideanumbra.A spot is specifiedby threedata: itsposition,theumbrathatcontainsit andthepenumbrathatcontainsit. Thehierarchyof notationsspot, umbraandpenumbraisasfollows:apenumbracontainsumbraeandan umbracontainsspots.

AUTOMATION OF AREA MEASUREMENT OF SUNSPOTS 127
Table IArea differencesbetween other and Gyulameasurements in percentage of the Gyulameasurementand in units of 10�6 solar hemi-sphere (m.h.) for sunspot groups in NOAAregions5521and5528
Observatory Mean Stand.dev.
% m.h. % m.h.
Spotarea(penumbra+umbra
Tenerife 6 �93 27 358Debrecen 6 26 13 274SGD 4 �119 40 278
Umbralarea
Tenerife 101 141 68 70Debrecen �11 �27 28 43
4.9. IMPROVEMENT OF THE BOUNDARY OF THE UMBRA AND THE PENUMBRA
According to thedefinitionsgivenearlier, theboundaries(Penumbra–PhotosphereBoundaryandUmbra–Penumbra Boundary) are iso-density lines.Thereare largesunspotgroupswith very complicatedinnerstructure. It canoccurwith this kindof sunspotthat different parts of the penumbral borderof the spothave differentintensities. Theseeingcanalso giveriseto changesin theintensity of theboundaryof a spot. To make allowancesfor these,the boundary obtainedabove is dividedinto intervals and the averagegradient along an interval is compared to the valuesof theaveragegradientalongsimilar intervalsof theneighboring intensity contoursof theboundary andtheinterval of the boundary is replacedby theonehaving themaximumaveragegradient value.
5. Results
Toassessthereliability of themethodproposedhere,areasfor thesunspotgroupsinNOAA region5521and5528weredeterminedandcomparedwith theresultsfromTenerife (Steinegger et al., 1996), from Debrecen(KalmanandGerlei, 1994)andfrom Solar Geophysical Data Bulletin (SGD). Following Steineggeret al. (1996)we usedthe largestSGDvalue from different observatoriesper day andsunspotgroups.Thedetailsof thiscomparisoncanbeseeninFigures8–11.Asthescatter intheareameasurementsfor sunspotsdependsontheareaitself, it isexpedientto usethepercentagedifferencein theareameasurementsfor statisticalpurposes(i.e.theareadifferencesbetweenGyulaandothermeasurementsinpercentageof theGyula

128 LAJOSGYORI
Figure14. Bordercontours (umbral andpenumbral) obtainedby themethodsuggestedin thispaperaresuperimposedon the imageof sunspotgroup(NOAA 5528,15June1989,07:43:03 UT).
measurement are usedhere). Table I provides the summarizing statistics whichexpressthemain aspectof thecomparisonof thedifferentspotareameasurements.No definitedifferenceswerefoundin themeanof thepercentagedifferencesof thespotareasbut thescatter issignificantespecially in thecaseof theSGD.
The umbral areasobtainedby Steineggeret al. (1996)are about100%largerthan thosemeasured by us. In order to clarify this discrepancy we followed themethod describedin their paper. For this purposewe usedthe sunspotgroup inNOAA region5528(15 June1989). Firstwedeterminedthecumulativefrequencydiagram for the sunspotgroup(seeFigure 12). The linesfitted to theumbral andthe penumbral parts of the diagram intersectat intensity level 107. In Figure 13thecontourscorrespondingto intensity level 107aresuperimposedon thesunspotgroup.Figure 14 shows the bordercontours (umbral andpenumbral) obtainedbythe methodproposedby us.Figures13 and14 are printed versionsof the imageson the computer screen and after printing the quality of the image has changedfor the worse. For this reasonandto it make easier to judgethe goodnessof thefit of the contours to the borders of the spots, two photographic copies (one ofthem is underexposedto make the umbra structure more visible) of the originalphotoheliogramsareprovided(Figures5 and6). ComparingFigures13and14 wecanseethattheumbralcontoursobtainedusingthemethodsuggestedbySteinegger

AUTOMATION OF AREA MEASUREMENT OF SUNSPOTS 129
et al. (1996)embracea significantly larger areathanthe contours obtainedby themethod proposedin this paper. The umbral area determinedby the contours ofFigure 13 is 48%larger thenthe oneobtainedby thecontours of Figure 14.Thisvalueisvery nearto the51%which isthepercentagedifferencebetweentheGyulaandTenerife measurements for the umbral area for this day (seeFigure 11). Asimilar result wasobtainedfor sunspotgroupNOAA region5528on13June1989.Using the methodsuggestedby Steineggeret al. (1996)we obtained62%largerareathanwith themethodproposedby ushere. ThedifferencebetweenGyulaandTenerifemeasurementsfor umbral area for this dayis 67%(seeFigure 11).
Using the umbral contours in Figure 14, the following statistics canbe estab-lishedfor their intensities: Their averageintensity is 120, the standarddeviationis 19 and their intensities changebetween101 and 160. These statistics ques-tion whether a uniquecutoff value canbeadoptedfor every umbra. In their paperSteineggeretal. (1996)concluded:‘Obviously, at someof theobservatoriescertainpartsof theumbraare identifiedaspenumbra.’ In thelightof theabove-mentionedfacts, we think that theopposite statementis valid, that is, in their measurementsfor umbral area,certain partsof thepenumbraare identifiedasumbra.
6. Discussion
Using the concepts presented above, computer programs were written to singleout spots inside a sunspotgroupandto determine their positionsandareas.TheprogramscanuseCCDorscannedimagesof sunspotgroups.Theproposedmethodhastheadvantageover other methods(Dezso etal., 1987;De La Rue,1869)usedfor thispurposethatit gets rid of thehumaninvolvementin themeasuring processso it may result in better homogeneity and accuracy of the databasecompiledusing this method. It is another advantage,especially nearthe limb, that beforedetermining spot areas a limb correction is applied. It can also be mentioned as abenefitthattakinginto accountthebrightregionsof thepenumbra,amoreaccuratespotareacanbedetermined.
Acknowledgements
This work was supported by the Hungarian Foundation for Scientific Researchundergrant No. OTKA 007422,andby the Hungarian–AmericanJoint Fund forScienceandTechnologyundercontractNo. 95a-524.
References
Andrews, H. C. andHunt, B. R.: 1977,Digital Image Restoration, Prentice-Hall, Inc., EnglewoodCliffs, New Jersey.

130 LAJOSGYORI
Beck,J. G. andChapman,G. A.: 1993,Solar Phys.146, 49.Brandt, P. N., Schmidt, W., and Steinegger, M.: 1990,Solar Phys.129,191.Chapman,G. A. andGroisman,G.: 1984,Solar Phys.91, 45.Chapman,G. A., Herzog,A. D., Laico,D. E., Lawrence,J.K., andTempler, M. S.: 1989,Astrophys.
J. 343, 547.DeLaRue,W.: 1869,Phil. Trans.Roy. Soc., 159.Dezso L., GerleiO.,and KovacsA.: 1987,DebrecenPhotoheliographic Results for theYear1977.Frieden,B. R.: 1979,in T. S. Huang(ed.), PictureProcessing and Digital Filtering, Springer-Verlag,
Berlin.Kalman,B. and Gerlei, O.: 1994,privatecommunication.Ki tchin, C. R.: 1984,Astrophysical Techniques, Adam Hilger Ltd, Bristol.Steinegger, M., Vazquez,M., Bonet, J.A., andBrandt, P. N.: 1996,Astrophys.J. 461, 478.Tennenbaum,J. M., Kay, A. C., Binford, T., Falk, Feldman,J., GrapeG., andSobel, I.: 1969,in D.
A. Walker and L. M. Norton (eds.),‘TheStanford Hand-Eye Project’, Proc. IJCAI, p. 521.