automating analysis and visualizing machine learning
TRANSCRIPT

1
AUTOMATING ANALYSIS
CYPHER 2017

2
2012, A COLLEAGUE ASKED…
WHAT EXPLAINS CRICKETERS’ STRIKE
RATES?
3
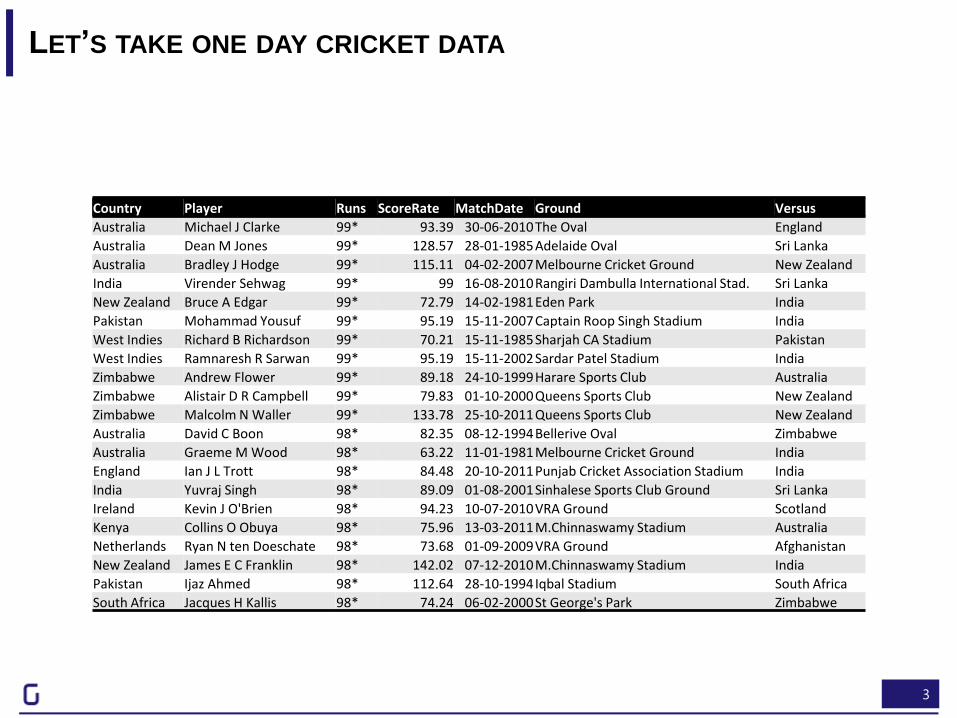
LET’S TAKE ONE DAY CRICKET DATA
Country Player Runs ScoreRate MatchDate Ground Versus
Australia Michael J Clarke 99* 93.39 30-06-2010The Oval England
Australia Dean M Jones 99* 128.57 28-01-1985Adelaide Oval Sri Lanka
Australia Bradley J Hodge 99* 115.11 04-02-2007Melbourne Cricket Ground New Zealand
India Virender Sehwag 99* 99 16-08-2010Rangiri Dambulla International Stad. Sri Lanka
New Zealand Bruce A Edgar 99* 72.79 14-02-1981Eden Park India
Pakistan Mohammad Yousuf 99* 95.19 15-11-2007Captain Roop Singh Stadium India
West Indies Richard B Richardson 99* 70.21 15-11-1985Sharjah CA Stadium Pakistan
West Indies Ramnaresh R Sarwan 99* 95.19 15-11-2002Sardar Patel Stadium India
Zimbabwe Andrew Flower 99* 89.18 24-10-1999Harare Sports Club Australia
Zimbabwe Alistair D R Campbell 99* 79.83 01-10-2000Queens Sports Club New Zealand
Zimbabwe Malcolm N Waller 99* 133.78 25-10-2011Queens Sports Club New Zealand
Australia David C Boon 98* 82.35 08-12-1994Bellerive Oval Zimbabwe
Australia Graeme M Wood 98* 63.22 11-01-1981Melbourne Cricket Ground India
England Ian J L Trott 98* 84.48 20-10-2011Punjab Cricket Association Stadium India
India Yuvraj Singh 98* 89.09 01-08-2001Sinhalese Sports Club Ground Sri Lanka
Ireland Kevin J O'Brien 98* 94.23 10-07-2010VRA Ground Scotland
Kenya Collins O Obuya 98* 75.96 13-03-2011M.Chinnaswamy Stadium Australia
Netherlands Ryan N ten Doeschate 98* 73.68 01-09-2009VRA Ground Afghanistan
New Zealand James E C Franklin 98* 142.02 07-12-2010M.Chinnaswamy Stadium India
Pakistan Ijaz Ahmed 98* 112.64 28-10-1994Iqbal Stadium South Africa
South Africa Jacques H Kallis 98* 74.24 06-02-2000St George's Park Zimbabwe

4
Against which countries are
higher averages scored?
Which countries’ players
score more per match?

5
Which player scores the
most per ball?
The player with the highest strike
rate is an obscure South African
whose name most of us have never
heard of.
In fact, this list is filled with players
we have never heard of.

6
RELATIVE IMPACT CAN BE QUANTIFIED SYSTEMATICALLY
Country Player Runs ScoreRate MatchDate Ground Versus
Australia Michael J Clarke 99* 93.39 30-06-2010The Oval England
Australia Dean M Jones 99* 128.57 28-01-1985Adelaide Oval Sri Lanka
Australia Bradley J Hodge 99* 115.11 04-02-2007Melbourne Cricket Ground New Zealand
India Virender Sehwag 99* 99 16-08-2010Rangiri Dambulla International Stad. Sri Lanka
New Zealand Bruce A Edgar 99* 72.79 14-02-1981Eden Park India
Pakistan Mohammad Yousuf 99* 95.19 15-11-2007Captain Roop Singh Stadium India
West Indies Richard B Richardson 99* 70.21 15-11-1985Sharjah CA Stadium Pakistan
West Indies Ramnaresh R Sarwan 99* 95.19 15-11-2002Sardar Patel Stadium India
Zimbabwe Andrew Flower 99* 89.18 24-10-1999Harare Sports Club Australia
Zimbabwe Alistair D R Campbell 99* 79.83 01-10-2000Queens Sports Club New Zealand
Zimbabwe Malcolm N Waller 99* 133.78 25-10-2011Queens Sports Club New Zealand
Australia David C Boon 98* 82.35 08-12-1994Bellerive Oval Zimbabwe
Australia Graeme M Wood 98* 63.22 11-01-1981Melbourne Cricket Ground India
England Ian J L Trott 98* 84.48 20-10-2011Punjab Cricket Association Stadium India
India Yuvraj Singh 98* 89.09 01-08-2001Sinhalese Sports Club Ground Sri Lanka
Ireland Kevin J O'Brien 98* 94.23 10-07-2010VRA Ground Scotland
Kenya Collins O Obuya 98* 75.96 13-03-2011M.Chinnaswamy Stadium Australia
Netherlands Ryan N ten Doeschate 98* 73.68 01-09-2009VRA Ground Afghanistan
New Zealand James E C Franklin 98* 142.02 07-12-2010M.Chinnaswamy Stadium India
Pakistan Ijaz Ahmed 98* 112.64 28-10-1994Iqbal Stadium South Africa
South Africa Jacques H Kallis 98* 74.24 06-02-2000St George's Park Zimbabwe
Take every column in the data
Find the impact of that column
Versus has an impact of 16%. Play against Namibia
Ground has an impact of 12%. MAC, not Eden Park
Country has an impact of 8%. South Africa, not USA
Weekday has an impact of 3%. Tuesday, not Wednesday
Player has no significant impact
MatchDate has no significant impact

“WHAT EXPLAINS X”IS A COMMON QUESTION
8
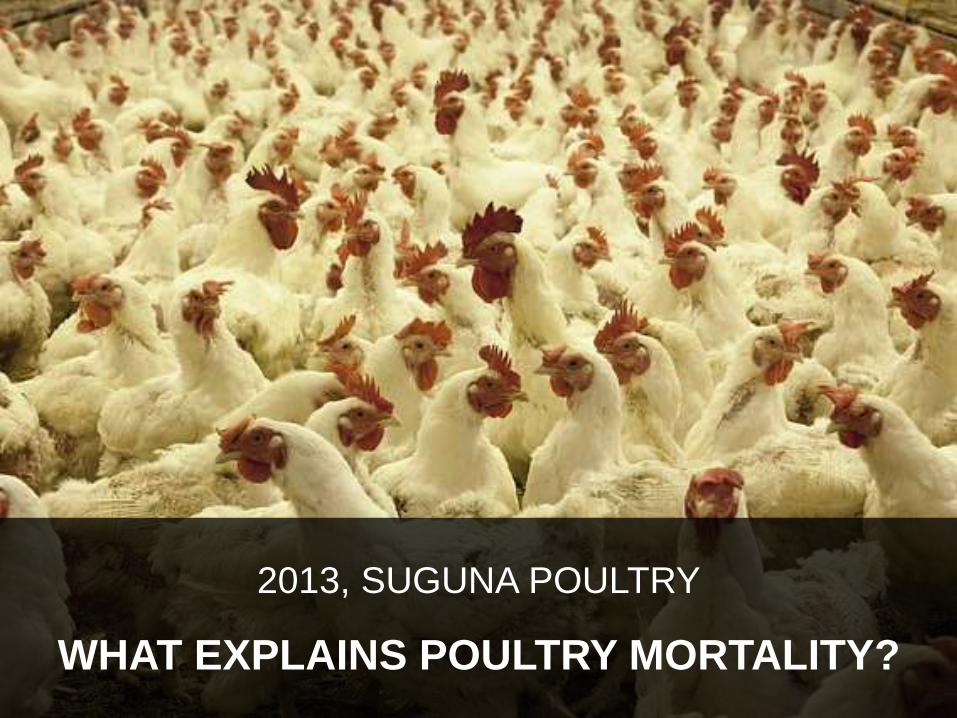
2013, SUGUNA POULTRY
WHAT EXPLAINS POULTRY MORTALITY?

9
2014, A GLOBAL PHARMA COMPANY
WHY ARE OUR SERVICE REQUESTS
DELAYED?

10
2015, NCERT
WHAT EXPLAINS STUDENTS’ MARKS?

11
2016, STAR TV
WHAT DRIVES OUR TV RATINGS?

12
2017, A PRIVATE BANK
WHAT EXPLAINS OUR ATTRITION LEVELS?

LET’S TALK IS ABOUT HOW TO
AUTOMATE ANSWERS TO SUCH QUESTIONS

14
BUT BEFORE I PROCEED, LET ME CLARIFY TWO THINGS
I refuse to entertain – because
people mistake entertainment for
education.
-- Bret Victor
THIS IS A SIMPLE TUTORIAL.
NO ML, ANN, DNN, ETC.
There are dramatic exceptions to
my argument that the
generalization of software
packages has changed little over
the years: electronic spreadsheets
and simple database systems.
-- Fred Brooks (No Silver Bullet)
WE’LL USE
SPREADSHEETS

15
OVER 100 QUESTIONS EACH, ADMINISTERED TO
STUDENTS, TEACHERS AND SCHOOLS
… AS WELL AS ASSESSMENT OF MARKETS IN
MATHS, READING, SCIENCE & SOCIAL SCIENCE

16
THIS IS WHAT THE DATA LOOKED LIKE
http://s-anand.net/test/nas.csv - grab a copy while it lasts
THE STRIKING THING IS THAT
THERE ARE NO NUMBERS – JUST
CATEGORIES

17
LET’S DO AN EXERCISE
DO CALCULATORS HELP
SCORE IN MATHS?
DO COMPUTERS HELP
SCORE IN MATHS?
WHICH ONE HELPS MORE?
ARE THESE MEANINGFUL?
OR JUST RANDOM?
Correlation is not causation but it
sure is a hint.
-- Edward Tufte

18
WHAT EXPLAINS IPL WIN RATES?WHEN A TEAM WINS BY WICKETS (BOWLS FIRST)

19
WHAT EXPLAINS IPL WIN RATES?WHEN A TEAM WINS BY RUNS (BATS FIRST)

THIS SAME TECHNIQUE WORKS ACROSS
ALL OTHER PROBLEM AREAS WE SAW

21
FACTORS IMPACTING POULTRY PRODUCTIVITY
We group by every
input factor
… and calculate the
impact on every metric.
By moving from average to the best
group, what’s the improvement?
The actual performance
by each group is shown
0-3m 3-6m 6m-1yr 1-2 yrs > 2 yrs
11 12.3 12.7 15.3 16.1
Our product can create visualisations from data automatically, without any supervision.
Above is an example. Irrespective of the dataset, this visual shows which input parameters
have a significant impact on the output.
Only significant results shown
WHAT EXPLAINS POULTRY MORTALITY?

22
2014, A GLOBAL PHARMA COMPANY
WHY ARE OUR SERVICE REQUESTS DELAYED?

23
SERVICE REQUEST WORKFLOW
Navigation filters
Process flow diagram
indicating bottlenecks
& volume of requests
Automated analysis to
identify areas which
need work and which
can create maximum
impact
LINK

24
ANY COSTUME EXCEPT
JEANS IS OK FOR SANJANA
NIGHT SONG SEQUENCES
ARE BEST FOR TV RATINGS

PATTERNS OF AUTOMATION APPLY
ACROSS MANY TYPES OF ANALYSES
26
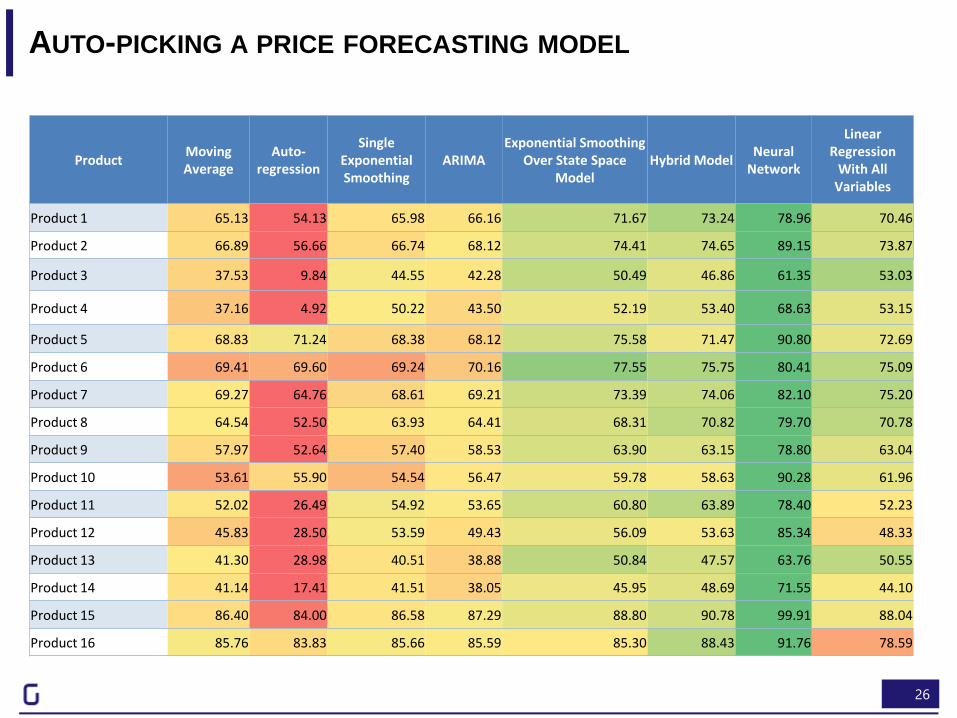
AUTO-PICKING A PRICE FORECASTING MODEL
ProductMoving Average
Auto-regression
SingleExponential Smoothing
ARIMAExponential Smoothing
Over State Space Model
Hybrid ModelNeural
Network
Linear Regression
With All Variables
Product 1 65.13 54.13 65.98 66.16 71.67 73.24 78.96 70.46
Product 2 66.89 56.66 66.74 68.12 74.41 74.65 89.15 73.87
Product 3 37.53 9.84 44.55 42.28 50.49 46.86 61.35 53.03
Product 4 37.16 4.92 50.22 43.50 52.19 53.40 68.63 53.15
Product 5 68.83 71.24 68.38 68.12 75.58 71.47 90.80 72.69
Product 6 69.41 69.60 69.24 70.16 77.55 75.75 80.41 75.09
Product 7 69.27 64.76 68.61 69.21 73.39 74.06 82.10 75.20
Product 8 64.54 52.50 63.93 64.41 68.31 70.82 79.70 70.78
Product 9 57.97 52.64 57.40 58.53 63.90 63.15 78.80 63.04
Product 10 53.61 55.90 54.54 56.47 59.78 58.63 90.28 61.96
Product 11 52.02 26.49 54.92 53.65 60.80 63.89 78.40 52.23
Product 12 45.83 28.50 53.59 49.43 56.09 53.63 85.34 48.33
Product 13 41.30 28.98 40.51 38.88 50.84 47.57 63.76 50.55
Product 14 41.14 17.41 41.51 38.05 45.95 48.69 71.55 44.10
Product 15 86.40 84.00 86.58 87.29 88.80 90.78 99.91 88.04
Product 16 85.76 83.83 85.66 85.59 85.30 88.43 91.76 78.59
27
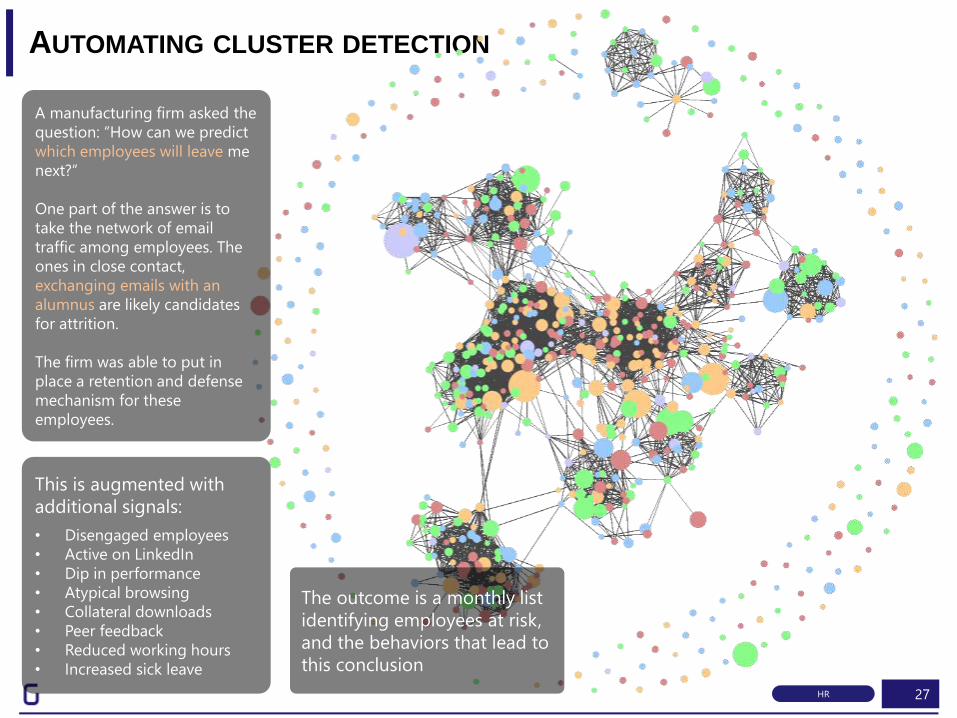
AUTOMATING CLUSTER DETECTION
A manufacturing firm asked the
question: “How can we predict
which employees will leave me
next?”
One part of the answer is to
take the network of email
traffic among employees. The
ones in close contact,
exchanging emails with an
alumnus are likely candidates
for attrition.
The firm was able to put in
place a retention and defense
mechanism for these
employees.
This is augmented with
additional signals:
• Disengaged employees
• Active on LinkedIn
• Dip in performance
• Atypical browsing
• Collateral downloads
• Peer feedback
• Reduced working hours
• Increased sick leave
The outcome is a monthly list
identifying employees at risk,
and the behaviors that lead to
this conclusion
HR

ANALYST’S ROLES NOW CHANGE:
FROM AN EXECUTOR TO AN INTERPRETER

BUT NOW WE HAVE A GROWING PROBLEM:
GROWTH OF BLACK BOX MODELS

30
TELECOM CHURN
“Churn of customers is a
particularly severe problem in
the telecom industry.
The challenge is to identify
the propensity of churn up to
a month in advance, even
before a customer moves out,
so that proactive
interventions can begin”

31
OK
WASTED
Marketing cost
Rs 40
MISSED
Acquisition cost
Rs 80OK
No churn Churn
No
ch
urn
Ch
urn
Prediction
Act
ual
8.3% 0.0%
MISSED WASTED
6.61
COST PER CUST.
0.0%
IMPROVEMENT
Base
MODELS
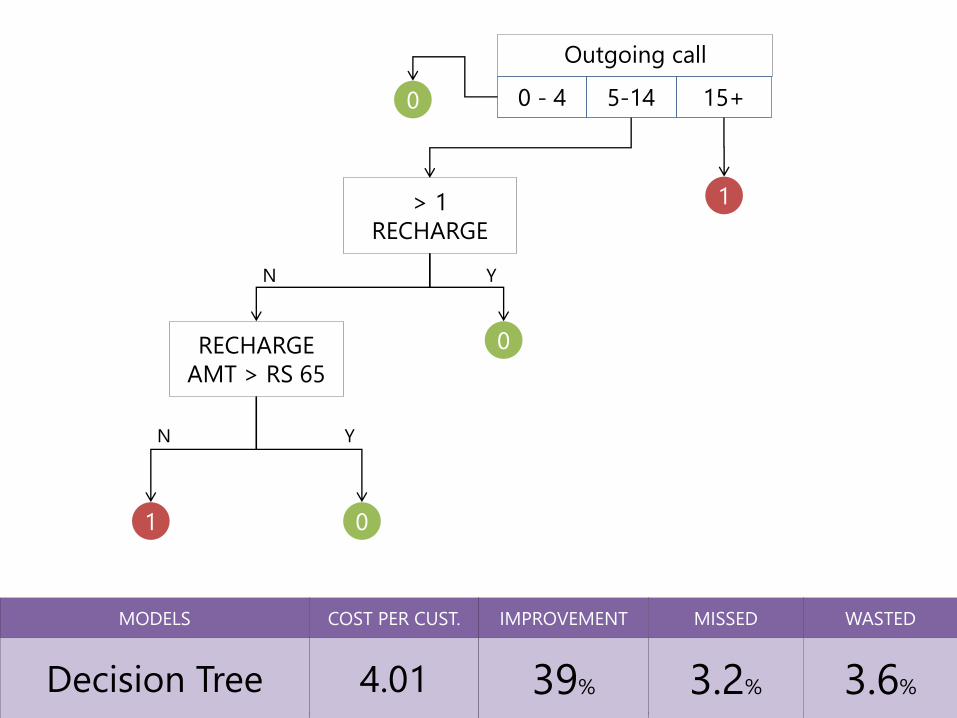
32
Outgoing call
0 0 - 4 15+5-14
1
RECHARGE
AMT > RS 65
01
YN
> 1
RECHARGE
0
N Y
3.2% 3.6%
MISSED WASTED
4.01
COST PER CUST.
39%
IMPROVEMENT
Decision Tree
MODELS

330.6% 2.5%
MISSED WASTED
2.21
COST PER CUST.
66%
IMPROVEMENT
SVM
MODELS
OK
WASTED
Marketing
cost
$1.8
MISSED
Acquisition
cost
$4.1
OK
No churn ChurnN
o c
hu
rnC
hu
rnPrediction
Act
ual

WE NEED A WAY OF
INTERPRETING THE OUTPUT OF THESE MODELS

36
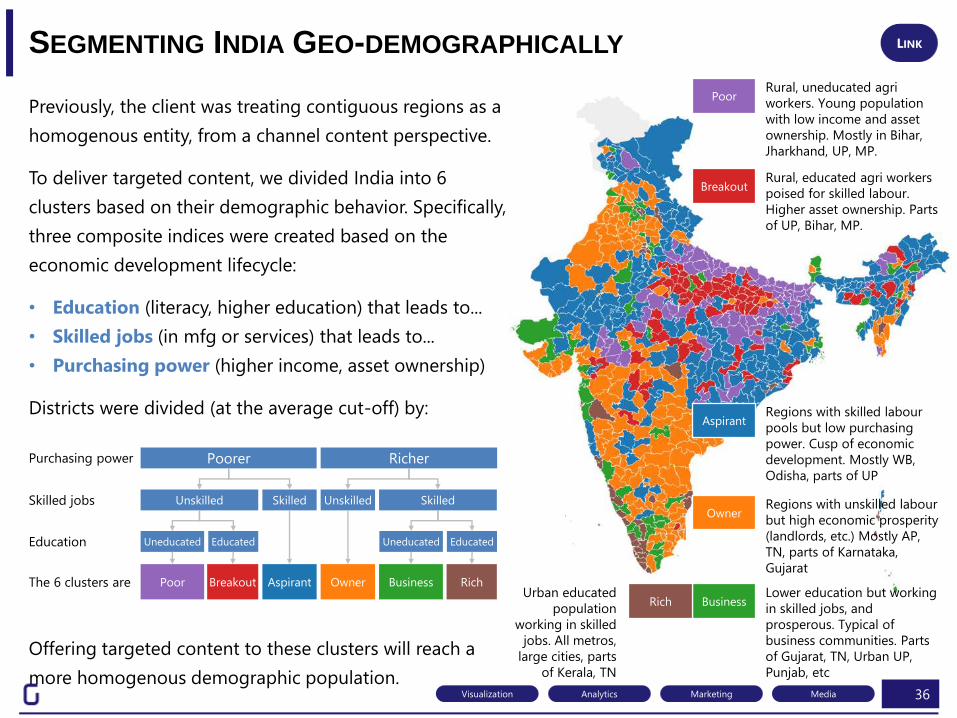
SEGMENTING INDIA GEO-DEMOGRAPHICALLY
Previously, the client was treating contiguous regions as a
homogenous entity, from a channel content perspective.
To deliver targeted content, we divided India into 6
clusters based on their demographic behavior. Specifically,
three composite indices were created based on the
economic development lifecycle:
• Education (literacy, higher education) that leads to...
• Skilled jobs (in mfg or services) that leads to...
• Purchasing power (higher income, asset ownership)
Districts were divided (at the average cut-off) by:
Offering targeted content to these clusters will reach a
more homogenous demographic population.
Skilled
Poorer Richer
Unskilled Skilled
Uneducated Educated Uneducated Educated
Unskilled
Purchasing power
Skilled jobs
Education
Poor Breakout Aspirant Owner Business Rich
PoorRural, uneducated agri
workers. Young population
with low income and asset
ownership. Mostly in Bihar,
Jharkhand, UP, MP.
BreakoutRural, educated agri workers
poised for skilled labour.
Higher asset ownership. Parts
of UP, Bihar, MP.
AspirantRegions with skilled labour
pools but low purchasing
power. Cusp of economic
development. Mostly WB,
Odisha, parts of UP
OwnerRegions with unskilled labour
but high economic prosperity
(landlords, etc.) Mostly AP,
TN, parts of Karnataka,
Gujarat
BusinessLower education but working
in skilled jobs, and
prosperous. Typical of
business communities. Parts
of Gujarat, TN, Urban UP,
Punjab, etc
RichUrban educated
population
working in skilled
jobs. All metros,
large cities, parts
of Kerala, TN
The 6 clusters are
LINK
MediaMarketingAnalyticsVisualization

37
WORLD BANK: INNOVATION, TECHNOLOGY & ENTREPRENEURSHIP
Does access to new Technology facilitate Innovation? Does it
facilitate Entrepreneurship? The Global Information Technology
Report findings tell us that "innovation is increasingly based on
digital technologies and business models, which can drive economic
and social gains from ICTs...".
We were curious about whether the data on TCData360 could tell a
story about influential factors on innovation and entrepreneurship.
With over 1800 indicators, we focused on the Networked Readiness
Index, as it has indicators on entrepreneurship, technology, and
innovation.
LINK
Society

WHAT YOU SHOULD TAKE AWAY
PATTERNS OF ANALYSIS ARE
RECURRENT ACROSS DOMAINS
THESE PATTERNS OF ANALYSIS
CAN BE AUTOMATED
BLACK-BOX MODELS NEED
INTERPRETATION (EVEN MORE)
VISUAL INTERACTION HELP
AUGMENT OUR UNDERSTANDING

We offer products & services in visual analytics
INTRODUCTION