automatic test system for type tests of the ...lib.tkk.fi/dipl/2012/urn100590.pdf · automatic test...
TRANSCRIPT

Esa Nummijoki
Automatic Test System for Type Testsof the Uninterruptible Power Supply
School of Electrical Engineering
Thesis submitted for examination for the degree of Master ofScience in Technology.
Espoo 27.3.2012
Thesis supervisor:
Prof. Seppo J. Ovaska
Thesis instructor:
M.Sc. (Tech.) Risto Karola
A! Aalto UniversitySchool of ElectricalEngineering

aalto-yliopistosahkotekniikan korkeakoulu
diplomityontiivistelma
Tekija: Esa Nummijoki
Tyon nimi: Automaattinen testausjarjestelma UPS-laitteiden tyyppitesteille
Paivamaara: 27.3.2012 Kieli: Englanti Sivumaara:10+59
Sahkotekniikan laitos
Professuuri: Teollisuuselektroniikka Koodi: S-81
Valvoja: Prof. Seppo J. Ovaska
Ohjaaja: DI Risto Karola
Tuotekehityksen oleellinen osa on laitteiden testaaminen. UPS-tuotekehityksessaerilaisia testeja tehdaan joka paiva. Testaaminen vaatii monenlaisia mittaus-valineita seka muita laitteita, kuten laajan kuormajarjestelman seka erilaisiatestikokoonpanoja. Merkittava maara testeista perustuu UPS:n tyyppitesteihin,jotka ovat maaritelty IEC-62040 standardissa.
Testaaminen kuluttaa paljon aikaa ja resursseja. Ongelman ratkaisuksion tyyppitestien suorittamiseen mietitty automaattista testausjarjestelmaa.Taman diplomityon tavoitteena oli selventaa tarvetta talle automaattiselletestausjarjestelmalle seka selventaa vaatimuksia sen toteuttamiseen.
Tyossa syvennyttiin tyyppitesteihin ja automaattisen testausjarjestelman eri osa-alueisiin. Naiden lisaksi tehtiin kokeiluja, joiden tuloksena syntyi prototyyppi,jolla voidaan suorittaa automaattisesti suuntaa-antava hyotysuhdetesti UPS:lle.Hyotysuhdetestin lisaksi tutkittiin mahdollisuuksia automatisoida dynaamisensuorituskyvyn testi, joka on tyyppitesteista vaativin. Tuloksena syntyi testi-prosessin kuvaus seka LabVIEW-ohjelmia helpottamaan testin suorittamista.Lopulta paadyttiin kuitenkin siihen, ettei testin automatisointi ole jarkevaa,koska sita ei toisteta kovinkaan usein ja automatisointi vaatii paljon aikaa.
Tutkimus ja kokeilut osoittivat, etta automaattisen testausjarjestelman toteut-taminen kaikille tyyppitesteille vaatii paljon aikaa ja resursseja. Tasta johtuen au-tomaattinen testausjarjestelma tyyppitestien suorittamiseen ei ole paras ratkaisuvahentaa testaamiseen kuluvaa aikaa ja resursseja.
Avainsanat: Automaattinen testausjarjestelma, Katkeamaton teholahde, Tuote-kehitys, LabVIEW, TestStand, Prototyyppi
aalto universityschool of electrical engineering
abstract of themaster’s thesis
Author: Esa Nummijoki
Title: Automatic Test System for Type Testsof the Uninterruptible Power Supply
Date: 27.3.2012 Language: English Number of pages:10+59
Department of Electrical Engineering
Professorship: Industrial Electronics Code: S-81
Supervisor: Prof. Seppo J. Ovaska
Instructor: M.Sc. (Tech.) Risto Karola
Testing is an essential part of product development. In UPS product development,different tests are made every day. Testing requires large variety of measurementinstruments and other equipment such as large load systems and different kind oftest configurations. Significant number of performed tests are based on the UPStype tests defined in the IEC-62040 standard.
Testing consumes a lot of time and that way also resources. To solve this problem,an automatic test system for type tests is considered. The aim of this thesis wasto clarify the need for the automatic test system, and clarify requirements neededto realize it.
The work was done by reviewing the type tests and different parts of an automatictest system. In addition, an experimentation was made, resulting a prototype.The prototype is able to automatically perform an indicative efficiency test forthe UPS. Furthermore, a possibility to automate the most complex type test, adynamic output performance test, was examined. This examination resulted adescription of the test process and LabVIEW programs, supporting the executionof the test. However, the conclusion was that it is not sensible to automatethe test, due to the fact that it is not often performed and automating the testrequires a lot of time and resources.
The review and the experimentation proved that realization of an automatic testsystem, able to perform all the type tests, requires large amount of time andresources. Due to this, the automatic test system for type tests is not the bestsolution to reduce the time and resources consumed by testing.
Keywords: Automatic Test System, Uninterruptible Power Supply, Product De-velopment, LabVIEW, TestStand, Prototype
iv
Preface
This thesis was done between a time line from June 2011 to March 2012 in EatonPower Quality Oy, New Product Introduction department.
I would like to thank my supervisor professor Seppo J. Ovaska for support andconstructive comments and feedback. Thanks for Risto Karola and Otto Asunmaafor the subject of the thesis and giving the time to finish it. Risto Karola was alsomy instructor and thus I want to thank him also for encouraging comments andconstructive feedback.
Big thanks to Seppo Rask for introducing the initial plan for the ATS and in-structing and helping in each phase of the project. Thanks to Juhani Sievi formaking things happen, and Jari Uusitalo for introducing the dynamic output per-formance test. Big thanks also to other colleagues in the Eaton Power Quality Oyfor all kinds of favours.
I would also like to thank Tuomas Sahramaa for proofreading the thesis. How-ever, if a reader finds mistakes from the text it is not to blame Tuomas but thesigner. Thanks also to my wife Sari Nummijoki who helped with structuring thethesis and gave a lot of support during the whole period of making the thesis.
Helsinki, 18.3.2012
Esa J. Nummijoki

v
Contents
Abstract (in Finnish) ii
Abstract iii
Preface iv
Contents v
Symbols and abbreviations vii
List of Figures ix
List of Tables x
1 Introduction 1
2 Background 32.1 Automatic Test System . . . . . . . . . . . . . . . . . . . . . . . . . . 3
2.1.1 Control Subsystem . . . . . . . . . . . . . . . . . . . . . . . . 62.1.2 Measurement Subsystem . . . . . . . . . . . . . . . . . . . . . 82.1.3 Communication Interfaces . . . . . . . . . . . . . . . . . . . . 102.1.4 Input and Output Devices . . . . . . . . . . . . . . . . . . . . 122.1.5 Switching Subsystem . . . . . . . . . . . . . . . . . . . . . . . 132.1.6 Stimulus Subsystem . . . . . . . . . . . . . . . . . . . . . . . 13
2.2 Preliminary Requirements . . . . . . . . . . . . . . . . . . . . . . . . 152.3 Life Cycle of the ATS . . . . . . . . . . . . . . . . . . . . . . . . . . . 182.4 Uninterruptible Power Supply . . . . . . . . . . . . . . . . . . . . . . 212.5 International Electrotechnical Commission Standards for UPS . . . . 24
2.5.1 IEC-62040 Standards . . . . . . . . . . . . . . . . . . . . . . . 242.5.2 Efficiency and Dynamic Output Performance Tests . . . . . . 25
2.6 Eaton . . . . . . . . . . . . . . . . . . . . . . . . . . . . . . . . . . . 27
3 Experimentation 283.1 Prototype Development Process . . . . . . . . . . . . . . . . . . . . . 283.2 Efficiency Test . . . . . . . . . . . . . . . . . . . . . . . . . . . . . . . 313.3 Description of the Developed Prototype . . . . . . . . . . . . . . . . . 33
3.3.1 The Prototype Cart . . . . . . . . . . . . . . . . . . . . . . . . 343.3.2 Load and Supply Control System . . . . . . . . . . . . . . . . 373.3.3 Operator Interface . . . . . . . . . . . . . . . . . . . . . . . . 373.3.4 Operation of the Prototype . . . . . . . . . . . . . . . . . . . 383.3.5 LabVIEW Virtual Instruments . . . . . . . . . . . . . . . . . 42
3.4 Dynamic Output Performance Test . . . . . . . . . . . . . . . . . . . 453.4.1 Test Process . . . . . . . . . . . . . . . . . . . . . . . . . . . . 453.4.2 LabVIEW Virtual Instruments . . . . . . . . . . . . . . . . . 46
3.5 Results . . . . . . . . . . . . . . . . . . . . . . . . . . . . . . . . . . . 48

vi
4 Conclusions and Future Work 49
References 52
Appendices 56
A Efficiency Test Wiring Diagram 56
B Report of the Efficiency Test 57
C Virtual Instruments 58

vii
Symbols and abbreviations
Symbols
η Efficiency symbol
Abbreviations
AC Alternating CurrentATE Automatic Test EquipmentATLM Automated Test Life-Cycle MethodologyATS Automatic Test SystemCBEMA Computer & Business Equipment Manufacturer’s AssociationCOTS Commercial off-the-shelfCSV Comma-Separated Values -file formatCT Current TransformerDC Direct CurrentDMM Digital MultiMeterDOP Dynamic Output Performance type testDUT Device Under TestDVT Design Validation TestELLI Electronic Load system in UPS factory of Eaton Power Quality OyEMEA Europe, Middle East and AfricaFAT Field Acceptance TestFTP File Transfer ProtocolGPIB General Purpose Instrument BusGUI Graphical User InterfaceID Interface DeviceIEEE Institute of Electrical and Electronics EngineersIEC International Electrotechnical CommissionIT Information TechnologyITI Information Technology Industry Council formerly known as CBEMAIV&V Independent Verification and Validation processHMI Human Machine InterfaceLabVIEW Laboratory Virtual Instrumentation Engineering WorkbenchLCC Life Cycle CostMS Microsoft CorporationNI National Instruments companyNPI New Product Introduction department of Eaton Power Quality OyOPC Open Process Control serverPC Personal ComputerPDF Portable Document FormatPDU Power Distribution UnitPLC Programmable Logic ControllerSC Subcomittee of TC of the IEC
viii
RS-232 Recommended Standard 232TC Technical Committee of the IECTCP/IP Transmission Control Protocol / Internet ProtocolTHD Total Harmonic DistortionTPS Test Program SetUSB Universal Serial BusUPS Uninterruptible Power Supply (or System)UUT Unit Under TestVI LabVIEW Virtual InstrumentWLAN Wireless Local Area NetworkXCP X-format Communication Protocol

ix
List of Figures
1 Block diagram of a typical ATS [5]. . . . . . . . . . . . . . . . . . . 42 An ATS described in a data flow scheme [7]. . . . . . . . . . . . . . 53 The program creation processes. a. Traditional programming. b.
Graphical programming [11] . . . . . . . . . . . . . . . . . . . . . . . 74 XCP communication protocol [23]. . . . . . . . . . . . . . . . . . . . 125 The MX device. . . . . . . . . . . . . . . . . . . . . . . . . . . . . . 146 A block diagram of the electronic load system [26]. . . . . . . . . . . 147 A block diagram of the desired ATS [27]. . . . . . . . . . . . . . . . 158 Circuit diagram of the desired ATS [27]. . . . . . . . . . . . . . . . . 169 A flow chart of ATLM process [30]. . . . . . . . . . . . . . . . . . . 2010 A block diagram of basic on-line UPS [32]. . . . . . . . . . . . . . . 2211 A block diagram of basic off-line UPS [32]. . . . . . . . . . . . . . . 2212 A block diagram of basic line-interactive UPS [32]. . . . . . . . . . . 2213 Main elements of the Eaton 9395 and 9155 UPS systems [35]. . . . . 2314 UPS output voltage limit curve [39]. . . . . . . . . . . . . . . . . . . 2615 A flow chart of the prototype development process. . . . . . . . . . . 2916 Efficiency test installation for the Eaton 9395 UPS. . . . . . . . . . . 3217 A block diagram of the prototype. . . . . . . . . . . . . . . . . . . . 3318 The first cart model. . . . . . . . . . . . . . . . . . . . . . . . . . . . 3519 A 3D-model of the final cart. . . . . . . . . . . . . . . . . . . . . . . 3520 The final prototype cart. . . . . . . . . . . . . . . . . . . . . . . . . 3621 Load and supply control system. . . . . . . . . . . . . . . . . . . . . 3722 A user interface. . . . . . . . . . . . . . . . . . . . . . . . . . . . . . 3823 Efficiency test installation for Eaton 9155 UPS. . . . . . . . . . . . . 3924 A wiring circuit of the efficiency test. . . . . . . . . . . . . . . . . . 3925 A TestStand sequence of the efficiency test. . . . . . . . . . . . . . . 4026 VI hierarchy of ”InitializeWT1600.vi”. . . . . . . . . . . . . . . . . . 4227 Process of the DOP test. . . . . . . . . . . . . . . . . . . . . . . . . 46A1 Efficiency test wiring diagram. . . . . . . . . . . . . . . . . . . . . . 56B1 Efficiency test report. . . . . . . . . . . . . . . . . . . . . . . . . . . 57C1 ATS virtual instruments. . . . . . . . . . . . . . . . . . . . . . . . . 58C2 ATS virtual instruments continue. . . . . . . . . . . . . . . . . . . . 59
x
List of Tables
1 Functional requirements . . . . . . . . . . . . . . . . . . . . . . . . . 16

1 Introduction
An Uninterruptible Power Supply (UPS) is a device, whose presence people usuallydo not notice until something goes wrong. Distribution of the electricity is nottrouble-free and often leads to failures when it is disordered. For example, a powerfailure usually causes unpleasant events, such as data losses and work interruptions.Moreover, in critical applications such as medical devices, a power failure can causesevere problems. During a failure of the electricity distribution, the UPS becomesactive. The UPS prevents the most common power failures, including power cut,power surge, frequency variation, power sag, undervoltage, overvoltage, line noise,switching transient and harmonic distortion [1].
Developing a new UPS device is a massive process, although the basic function ofthe UPS is quite simple. The process may take several years to complete and requiresthe effort of many workers. Eaton Power Quality Oy is a UPS manufacturer locatedin Espoo, Finland. The company manufactures UPS systems for non-consumer useand sells them in Europe, the Middle East and the African (EMEA) sales area.The company also has a product development department which cooperates withproduct development departments in USA and China.
The product development department uses a process management tool calledPROlaunch for the new product development process. This tool is based on a stage-gate model which divides the project into five stages [2]:
1. Scoping2. Build business case3. Development4. Testing and validation5. Launch
Electrical tests are performed throughout the entire life-cycle of the UPS. Actualsystematic testing begins at stage four of the product development process. Tests atthis stage are divided into two groups: design verification tests followed by designvalidation tests (DVT) that contain type tests. Design verification tests are mostlycomplex, which make them difficult to automate. However, type tests are differentas these tests follow strict requirements described in the international standardpublished by the International Electrotechnical Commission (IEC) [3]. The standardcontains 35 different electrical tests, which must be performed and documented inorder to ensure that the performance of the UPS is at the level specified by themanufacturer.
Finishing all type tests for a new product can require several months. Type testsare also made after the new product is launched in the market, when a componentof the product is reworked, or a customer requires additional field acceptance tests(FAT) before the UPS is delivered to the customer. In these cases, not all type testsare performed, only the relevant ones. Performing the test contains many repeatableactions, including measuring electrical quantities, data acquisition, changing thestate of the UPS, changing the output load of the UPS, changing the input voltageand its frequency, and reporting any received results. These aforementioned facts

2
lead to the need of performing the actions automatically, leading to an idea of anautomatic test system (ATS) for type tests. An automatic test system for typetests was previously developed in 1997 for Fiskars Power Systems Oy, which was theearlier owner of the UPS factory [4]. However, after being unused for many yearsthe ATS was discontinued in the spring of 2011.
The aim of this thesis is to clarify the current need for the automatic test system,and clarify requirements needed to realize it. This was done by reviewing type testsand different parts of an automatic test system. Two electrical type tests, theefficiency test and the dynamic output performance (DOP) test, were chosen forcloser study. The efficiency test was chosen due to the fact that it is the mostcommon type test in the New Product Introduction department in Eaton PowerQuality Oy’s UPS factory. Whereas the DOP test is the most complex type test, andthus chosen for closer examination. The experimentation was made by developinga prototype able to automatically perform an indicative efficiency test for the UPS.
This thesis is structured as follows: Chapter 2 presents the background of theproject consisting of sections introducing an automatic test system based on earlierpublications and explaining basic elements of the ATS, and then comparing them tothe developed prototype. The next section introduces preliminary requirements forthe desired ATS. This is followed by a section discussing different factors concerningthe life cycle of an ATS and introducing methods to extend it. After this, a shortdescription of a UPS is presented, followed by a presentation of IEC standardsand the efficiency test and the DOP test as described in the standard. A shortpresentation of the Eaton Corporation is included at the end of the chapter.
Chapter 3 describes the made experimentation. The first section contains a de-scription of the development process of the prototype. This is followed by descriptionof how the efficiency test was automated. The next section contains a descriptionof the developed prototype, consisting of the prototype cart description, load andsupply control system description, description of the operator interface, operationdescription and description of developed LabVIEW virtual instruments (VI). Thisis followed by a section describing how the automation possibilities of the DOP testare examined. Results of the entire experimentation are discussed at the end of thechapter.
Chapter 4 presents conclusions of the work including a summary, an evaluationof the work and future development of the work.
3
2 Background
2.1 Automatic Test System
An automatic test system generally means a system which performs any kind oftests such as electrical measurements, mechanical actions or software related tests,automatically for a device under test (DUT). In this chapter, basic elements of theATS is discussed according to various sources.
Greenspan [5] describes automatic testing by comparing it to manual testing.Every time when a test is made manually, a test technician needs to collect relevantequipment such as measurement devices, power supplies and cables, and make aproper test installation for unit under test. Moreover, usually tests require config-urations and connections to be changed multiple times, especially when numeroustests are involved. Normally, a technician uses a manual or test instructions toperform the tests. However, if these instructions are unclear or leave room for in-terpretation, it will generate uncertainty to the test process. Bakshi [6] adds moredrawbacks of the manual testing, such as decreased accuracy due to the operator’sskill level. Meaning that slight difference occurs in the results when different personsperform the test. Furthermore, performing all of the actions manually, required byan individual test, is time consuming and thus costly.
These multiple problems in manual testing generated a need to automate thetesting process. Greenspan has listed advantages of automatic test system including:
• faster completion of tests;• less skills required to perform testing;• test results does not depend operator skills;• test sequence and measurement tolerance becomes more; consistent increasing
confidence in test results.
Greenspan divides automatic test systems to integrated test systems and ded-icated test systems. Integrated test systems consists of independent instrumentsoperating together via data bus and controlled using a computer. A dedicated testsystem is specifically designed for a certain task or series of tasks. In the con-text of this thesis, the desired ATS falls in the category of integrated test systems.Greenspan presents a block diagram of a typical automatic test system showed inFigure 1. Bakshi [6] describes a typical automatic test system similarly. A typicalATS has following eight elements:
1. Computer controlling the testing process and interpreting and evaluating thetest results
2. Stimulus devices to provide inputs required by tests3. Measurement devices4. Switching device linking the DUT and appropriate stimulus and measurement
devices5. Man-machine interface devices6. Repository for test reports and other information

4
7. Computer program to direct the testing actions8. Accessories required for specific tests
A control subsystem contains a computer sending instructions to the switchingsubsystem, and then retrieving data from it. Collected data can include measure-ment results from measurement subsystem or response data from DUT. The controlsubsystem also controls a power supply subsystem, which provide power to all othersubsystems. The control subsystem receives a test program and user inputs from in-put devices such as disc drive and keyboard and sends tests result to output devicessuch as display. A switching subsystem controls the stimulus subsystem accordingto instruction gave by control subsystem, and retrieves stimulus which is passedto DUT. The switching subsystem also controls the measurement subsystem andpasses response of DUT to measurement subsystem. A measurement subsystemsends measurement data to switching subsystem, passing the data to the controlsubsystem and finally to the user through the output device.
Figure 1: Block diagram of a typical ATS [5].
Although this description of the ATS is from the early days of automation in1971, it is still valid at the present time. Bakshi’s description is quite similar al-though it has been presented in 2009.
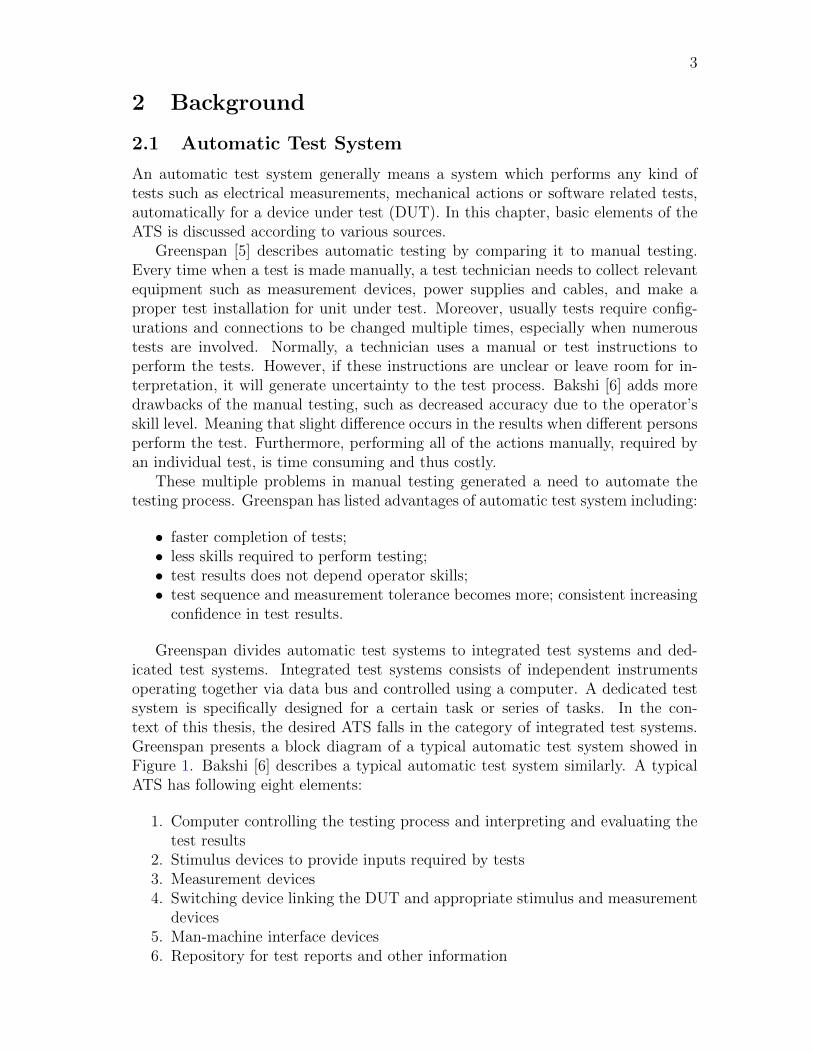
A different approach of describing an automatic test system is presented byMendes [7]. Mendes describes an ATS from a data flow point of view to help pro-pose a general ATS functional structure. The data flow scheme is showed in Figure2. In the figure, a top layer of the ATS is a physical system, containing hard-ware, sensors, transducers and actuators forming a test system interface to DUT.Hardware consists of electrical and mechanical devices supporting execution of thetest, such as operation peripherals for sending user commands to test software; vi-sualization peripherals for displaying data; signal conditioning / digitalization fortranslating signals between the real world signals for test algorithm; and output sig-nals generation for translating test algorithm signals for actuators. The system coreis in the software layer containing elements, such as initialization, a test conduction
5
algorithm, test results data and an user interface control. Initialization containsconfiguration data for test conduction and user interface control. The test conduct-ing algorithm receives information from sensors and transducers, and commandsfrom user interface control. With this information, the test conduction algorithmperforms a certain test sequence, controlling actuators and sending feedback to theuser. Finally, it sends the test results to the data block, which is finally shown tothe user.
Figure 2: An ATS described in a data flow scheme [7].
Third approach is presented by Flynn [8]. Flynn divides an ATS to three elementsincluding:
1. Automatic test equipment (ATE)2. Test program set (TPS)3. Test environment
ATE refers to an independent computer test station containing stimulus, mea-surement, and switching components under computer control. A TPS is comprisedof the ATE interface hardware known as an Interface Device (ID), test programsoftware, documentation, and other assisting equipment connecting the ATE to theDUT. The test environment includes a description of the ATS structure, program-ming and test specification languages, compiler, development tools, and necessaryinformation about DUT design requirements and test strategy for generation andmaintenance of TPS software.
These three different perspectives of ATS proposes that variation of differentkinds of automatic test systems is comprehensive, making a concept of an ATS am-biguous. Maybe the most suitable definition of the ATS is used by Greenspan and

6
thus used as a basis of explaining the ATS in the context of this thesis. However,Greenspan’s description does not cover communication interfaces between subsys-tems. Still, the following sections of this chapter includes a more specific review ofthe different elements of the typical ATS, presented by Greenspan, and their possibleapplications when used in the developed prototype.
2.1.1 Control Subsystem
A control subsystem contains a computer and test program software. The softwarerunning test sequences is probably the most critical part of the ATS requiring alot of development. Badly designed software and software development project willlead to increased life cycle costs. Software runs the test sequences and controls everyother element of the ATS. National Instruments (NI) offers two widely used toolsfor making the software for ATS.
Laboratory Virtual Instrumentation Engineering Workbench (LabVIEW) is agraphical control, test and measurement environment development package, devel-oped by NI and launched to the markets in 1986. LabVIEW was made to helpautomate the world of measurement [9]. LabVIEW programs, also known as vir-tual instruments, are made using graphical, general-purpose programming languageknown as G-language [10]. Compared to traditional programming, G-language hasadvantages, such as the code is easier to decode and support, program creation issimpler, fewer opportunities for human error exist, and problems are easier to locatefrom the code [11]. In Figure 3, program creation processes are shown with tradi-tional programming language and graphical programming language. As shown inthe figure, the traditional programming process contains more steps than the graph-ical programming process. In the graphical programming process, the source codeis not separately compiled and linked like in the traditional programming process.This removes two steps from the process, making the graphical programming morestraightforward than the traditional programming. Furthermore, the code is easierto manage due to its graphical interface from where it is possible to see more thingswith one look, compared to reading through text lines.

7
Figure 3: The program creation processes. a. Traditional programming. b. Graph-ical programming [11] .
LabVIEW was chosen for the software development environment of the prototypemainly because a lot of ready made VIs already exist, due to the use of LabVIEWalso in UPS’ production test system. Furthermore, LabVIEW is a faster develop-ment environment for this purpose than traditional programming language such asthe C. Another option for graphical programming would have been the Agilent VEEalso known as HP VEE [12], [13].
NI TestStand is a piece of test management software designed for the fasterdevelopment of automated tests and validation systems. With TestStand’s SequenceEditor, it is possible to create test sequences that automate the execution of code

8
modules. Code modules can be written in various programming languages, such asC/C++ and LabVIEW. Code modules contain functions to perform certain testsor actions. In the test sequence, code modules are invoked using built-in stepswhich also contain other common testing operations, such as message pop-ups andbasic program flow controls. Test sequences also specify reporting, database logging,and connectivity to other enterprise systems. The TestStand also provides exampleinterface and source code for making customized user interfaces.
For successful, fast and low cost development of test systems, modularity andcode reuse become crucial features. Building unique test applications from scratchfor each new test system is slow and costly. Test management software, such asTestStand, promotes test code modularity and code reuse. Furthermore, TestStand’sarchitecture is reusable, supportable and maintainable with little effort, because ofseparated software modules controlling the instrumentation and tests [14].
Benefits of the TestStand includes the following features [15]:
• Flexible, open test architecture• Eliminate programming of common test executive tasks• Reuse existing test code• Simplify updates and long-term maintenance• Accelerate test system development• High test system performance.
Because of these benefits which enables faster development of the ATS, TestStandwas chosen as the test software execution platform for the developed prototype.Moreover, the corporation already had the license for TestStand, thus saving the timeand money needed to purchase one. However, one of the drawbacks of LabVIEWand TestStand is a costly license which is also complex to manage. Problems appearespecially when trying to change the license to a different person or change thelicense type from name-based to computer-based. In contrast, C-language or anyother traditional programming languages do not necessarily require any license orother costs.
2.1.2 Measurement Subsystem
A measurement subsystem consists of measuring instruments. The minimum re-quirements for a measurement instrument is to have a communication interface forreceiving commands and sending measurement data to a computer. Measurementinstruments can be dedicated or commercial off-the-self (COTS) equipments. Ded-icated instruments are typically made for a single measurement, and COTS arefor multiple measurments. This section introduces COTS instruments used in thisthesis project, including the following instruments:
• Yokogawa WT230 digital power meter• Yokogawa WT1600 digital power meter• Yokogawa DL750 scopecorder• Yokogawa DL850 scopecorder

9
The WT230 digital power meter is capable of measuring three different AC or DCvoltages and currents. The measurement of harmonics of the AC voltage, currentand active power, and calculation of total harmonic distortion (THD) is also possible[16]. The WT230 suits the prototype well due to its low cost. The meter has asimple 7-segment display which makes manual data acquisition difficult. The metercan be controlled with a computer using a General Purpose Instrument Bus (GPIB)interface, and retrieve measured and computed output, error code output and statusbyte output from it. In the context of this thesis, the WT230 was selected to measurethe DC voltage and current of the UPS’ battery.
The WT230 is capable of covering most of the measurements required by typetests, though some tests for example efficiency test requires two WT230 power me-ters. Due to this, the more sensible way to conduct measurements is to use a powermeter that has enough channels to measure all input voltages and output voltages ofa three-phase UPS. A capable power meter for this task is the Yokogawa WT1600.The WT1600 can be equipped with six measurement elements, allowing it to mea-sure all input and output voltages and currents of a three-phase UPS. Due to this,the WT1600 can directly calculate efficiency of the UPS. The WT1600 can also mea-sure harmonics of the AC voltage, current or active power, and calculate a THD. Tomeasure both efficiency and harmonics at the same time, two synchronized WT1600meters are needed [17].
Power meters cannot cover all measurements of the type tests. Some tests requirethe observation of waveforms with an oscilloscope. A suitable oscilloscope for thetype tests is the Yokogawa DL750. The DL750 is a digital oscilloscope, which canacquire 16 signals with a resolution of 12-bits and a sample rate of 10 mega samplesper second, plus 16 digital signals with a resolution of 8-bits [18]. This is particularlyuseful in situations requiring the observation of all input and output voltages andcurrents of a three-phase UPS. Logic probes, for example, can be used for observingdigital gate drive signals of the UPS rectifier. The Yokogawa DL850 is basicallysimilar than the DL750 but it is newer and has more advanced features, such assample rate of 100 mega samples per second, and larger internal memory.
There are several reasons why these instruments were chosen for the ATS. Thefirst reason was that the company already had these instruments, and this savedtime and money from purchasing new instruments. The second and probably mostimportant reason is that many engineers in the company already knew how to use theinstruments. Purchasing new instruments would require a lot of time to learn howto use them. The third reason was that all of these instruments can be controlledvia GPIB bus and NI provides LabVIEW drivers for each of them. Company alsohas components that enable GPIB communication, such as GPIB-cables and GPIB-to-USB-adapters. However, a drawback of selecting the WT1600 is that Yokogawahas discontinued production of the WT1600. Due to this, if the WT1600 breaks itmust be replaced with the Yokogawa WT1800 power meter.

10
2.1.3 Communication Interfaces
A lot of different communication protocols exist, which can be used for communi-cation between different subsystems in the ATS. In the context of this thesis, thefollowing communication interfaces were applied:
• GPIB• Ethernet• XCP via RS-232
The General Purpose Instrument Bus (GPIB) was the first standard communica-tion protocol between instruments and computers. It was invented by the Hewlett-Packard Corporation in 1974. The bus made interconnection between test instru-ments and computers simpler. In 1978, the GPIB was adopted as the Instituteof Electrical and Electronics Engineers (IEEE) standard 488 (IEEE-STD 488). In1987, the standard was updated to IEEE-488.2, which is still in use today. The up-date unified the control of instruments of the hundreds of different manufacturers.The bus is an 8-bit bus with a transfer rate of 1 mega bytes per second (MB/s). Itallows 14 instrument connections and allows a maximum cable length of 20 meters[19], [20].
The GPIB is an old communication protocol and faster protocols have beendeveloped, such as VXI which has data transfer rate of 100-MB/s [19]. Despitethis, the GPIB was used in this project because the chosen instruments utilized itand the company had a lot of GPIB cables and USB-to-GPIB-converters in storage.Furthermore, the transfer rate of the GPIB is fast enough for use of the prototype.NI provides GPIB drives for each of the instruments. These drives consist of VIsenabling the control of the instruments and the retrieval of measurement data fromthem with a Personal Computer (PC).
Ethernet means a physical connection to connect two or more devices and toexchange blocks of data. A block of data, also known as a frame, consists of aheader, data payload, and an error check. Ethernet systems consist of four elements[21]:
1. The frame2. The media access control protocol, consisting of a set of rules embedded in each
Ethernet interface, allowing multiple computers to access the shared Ethernetchannel in the proper way
3. The signal components, consisting of standardized electronic devices, sendingand receiving signals via an Ethernet channel
4. The physical medium, consisting of the cables and other hardware, such asEthernet hubs, used to transfer the digital Ethernet signal between the com-puters attached to the network.
Besides of these four basic elements, to establish communications between appli-cations running on computers attached to the network, a high-level network proto-col is required. In most cases, a Transmission Control Protocol / Internet Protocol

11
(TCP/IP) suite is used [21]. In the context of this thesis, Ethernet with TCP/IPnetwork protocol is used to receive measurement data from the DL750 and theDL850 oscilloscopes. The oscilloscopes use a File Transfer Protocol (FTP), whichis one of the many application layers of TCP/IP.
X-format Communication Protocol (XCP) is a standard UPS communicationprotocol developed by Powerware Corporation which is now owned by Eaton Corpo-ration. In 1997, Powerware had a need to offer UPS, adapter, and software productsinteroperating properly with each other. At that time, Powerware employed fourdifferent protocols, which made interconnections between products difficult. Due tothis, XCP was developed [22]. The XCP standard specifies following matters [23]:
• The format of serial and network-based messages to monitor and control UPSdevices
• The basic rules for command and response behaviour• The contents of data for configuration and dynamic readings from the UPS
devices• Meaning of the contents of data• The control commands for the UPS devices• The inter-related behaviours of UPS devices as response to the command• A separate ”private” commands for the UPS devices for service and factory
use• Requirements for implementing XCP in the firmware• Requirements and suggestions for developers of connectivity devices, and mon-
itoring software.
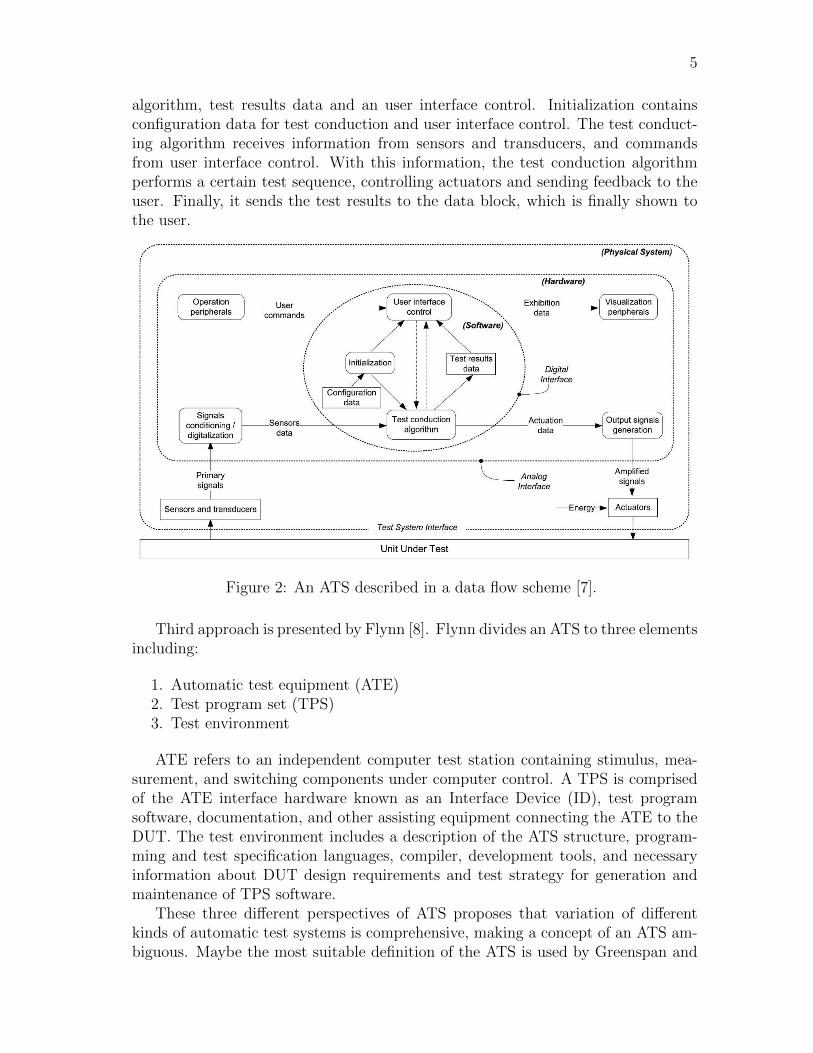
A demonstration of XCP communication is shown in Figure 4. The workstation,usually a PC, works as the XCP client, whereas the UPS works as the XCP server.The XCP software sends a request to the UPS in the form of an XCP command, andreceives an XCP Response. Format of the XCP command is shown in the uppertable of Figure 4. The header field consists of two bytes Start Frame Delimiter(SFD) and size byte LEN, indicating number of bytes (nnn) in the Data field. Thedata field consists of a CMD byte which is a control code, telling which commandis being requested, and an optional PARAM field, containing additional bytes ofinformation for the command. The checksum field consists of a CSUM byte whichis the two’s complement checksum of preceding bytes, including SFD, LEN, CMDand PARAM.
The format of the XCP response is shown in the lower table of Figure 4. Theheader field consists of an SFD, a BLOCK # which is a byte indicating which datablock is being sent, an LEN indicating number of bytes (nnn) in the Data field,and SEQ(uence) which is a byte value giving the sequence number of this packet inrelation to transmission of the entire response block. These packets are numbered inascending order with the first being (0x01). If a packet is the last one in a sequence,then the high order bit of this field (0x80) will be set in addition to the final sequencenumber. The data field consists of DATA bytes and CSUM is the same as in theXCP command [22].
12
Figure 4: XCP communication protocol [23].
XCP exploits Recommended Standard 232 (RS-232) to accomplish the intercon-nection between the computer and UPS. Currently, RS-232 is widely replaced byUniversal Serial Bus standard (USB) in PC hardware, and new PCs do not usuallyhave the RS-232 port anymore. However, a USB-to-RS-232 -converter can be usedin case the PC does not have an RS-232 port.
2.1.4 Input and Output Devices
Input devices mean human machine interface (HMI) devices such as a keyboard andmouse. These devices are used to give user input to the test software, executing thetest sequence. Output devices means devices, such as a printer used to print testreports or display showing the reports, or other feedback from different elements ofthe ATS. In the context of this thesis, keyboard and mouse are utilized but printer isreplaced by a database for storing the test reports. In this case, the database is thecompany’s internal network drive and reports are made with Microsoft (MS) Excelspreadsheet software. The Excel was chosen because LabVIEW provides toolkitfor generating Excel sheets and storing data retrieved from the measurement de-vices. Because LabVIEW was chosen for ATS software development environment,the easiest way to make reports was to use Excel.
Automatic report generation is one of the biggest advantages of the ATS. Com-pared to manually writing test results and measurements, it is much more fasterand more accurate, leaving no room for human error.

13
2.1.5 Switching Subsystem
A switching subsystem consists of switches controlled by the control subsystem.These switches switch different stimuli to the DUT. In the context of this thesis,switching subsystem switches different supply voltage and output loads into theDUT. Programmable logic controllers (PLC) are used for this task, more specifi-cally the Eaton XC210 modular PLC. These PLCs can be controlled with a PCrunning Open Process Control (OPC) server, communicating via Ethernet cableusing TCP/IP. The PLCs are programmed using CoDeSys PLC programming soft-ware.
The switching subsystem can also be used for changing measurement points ormeasurement devices. For example, in the case that instruments used in efficiencytest are not accurate enough to fulfil requirements for measurement uncertaintydefined by the IEC-62040-3 standard [3], a power meter measuring input power anda power meter measuring output power must be interchanged, and measurementsrepeated. In this case, the final value of UPS efficiency is the arithmetic mean of allefficiency measurements.
2.1.6 Stimulus Subsystem
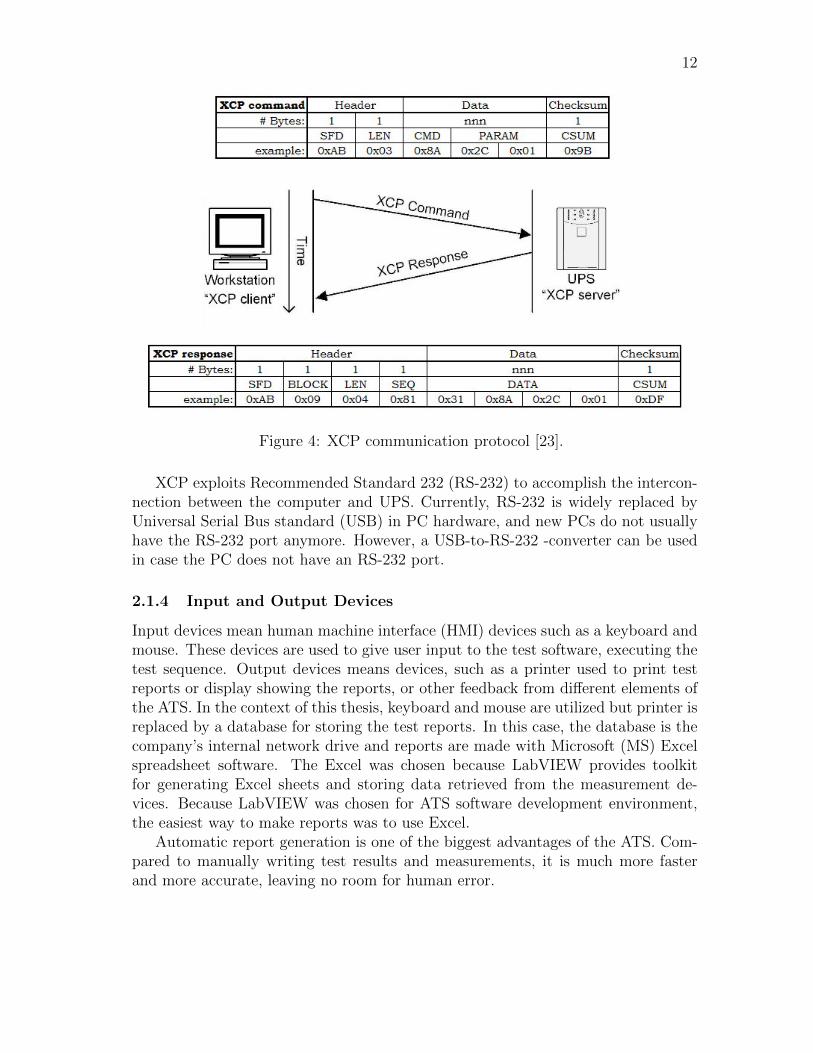
A stimulus subsystem consist of devices providing excitations for the DUT. In thecontext of this thesis, these excitations are simulated electric grid failures and differ-ent load systems. The factory has several test bays containing manually adjustablepower supplies, and manually adjustable linear and non-linear loads. Electrical gridfailures can be also simulated using a modified Eaton 9395 UPS called MX device,allowing variation of output voltage and its frequency. The MX device is shown inFigure 5. The MX device’s output voltage is controlled using a PC running MXGUI -software or Sequencer -software made with LabVIEW [24]. As the Sequencer-software is made with LabVIEW it is possible to implement it as a part of the Test-Stand test sequence without huge effort. Communication between the MX deviceand a PC is established using the RS-232. As the maximum length of the RS-232cable is 15 meters, the cable is extended using RS-232-to-Ethernet converters alsoknown as NPorts. With NPorts, Ethernet cables can be used in communicationextending the control range.
14
Figure 5: The MX device.
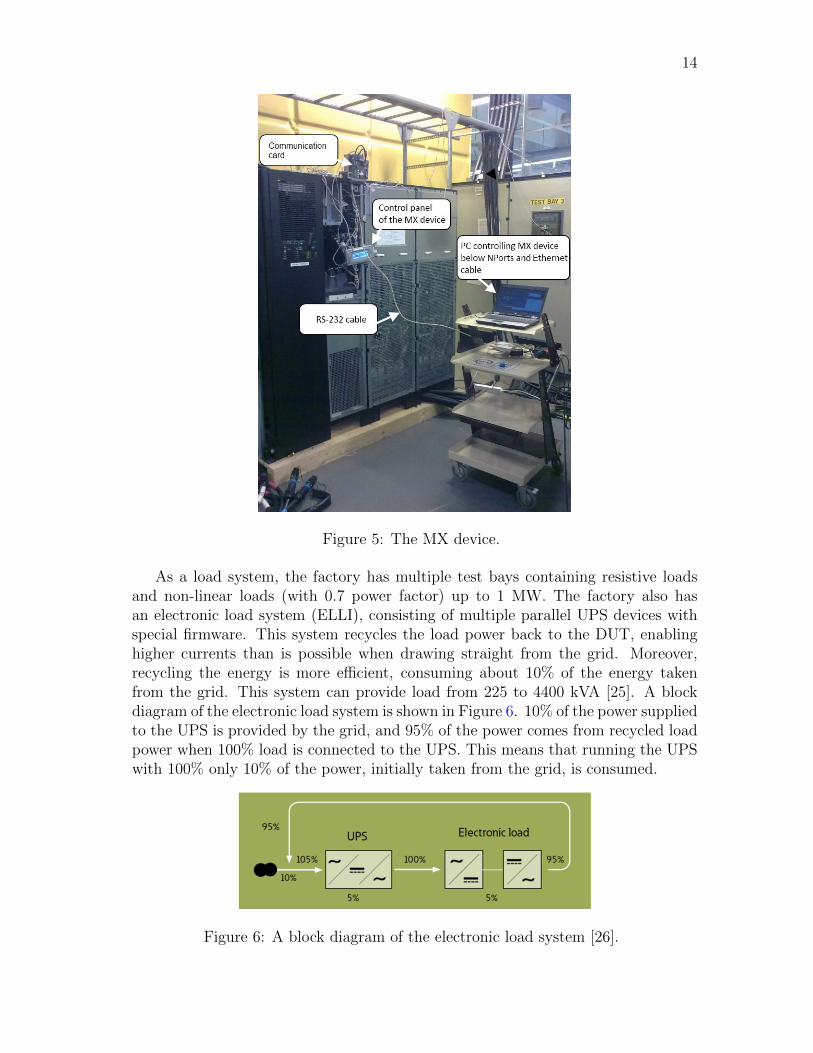
As a load system, the factory has multiple test bays containing resistive loadsand non-linear loads (with 0.7 power factor) up to 1 MW. The factory also hasan electronic load system (ELLI), consisting of multiple parallel UPS devices withspecial firmware. This system recycles the load power back to the DUT, enablinghigher currents than is possible when drawing straight from the grid. Moreover,recycling the energy is more efficient, consuming about 10% of the energy takenfrom the grid. This system can provide load from 225 to 4400 kVA [25]. A blockdiagram of the electronic load system is shown in Figure 6. 10% of the power suppliedto the UPS is provided by the grid, and 95% of the power comes from recycled loadpower when 100% load is connected to the UPS. This means that running the UPSwith 100% only 10% of the power, initially taken from the grid, is consumed.
Figure 6: A block diagram of the electronic load system [26].

15
2.2 Preliminary Requirements
Before starting this thesis project, the preliminary requirements for the ATS warealready defined. These requirements are described in the reference [27] and shortlypresented in this section. Among the document, more requirements were defined inthe beginning meeting of the project.
In Figure 7, a top-level block diagram of the desired ATS is shown. The PC worksas a control subsystem and contains a test program. The test program developmentwas suggested to perform using LabVIEW programming language and NI TestStandprogram. With the UPS acting as a DUT, the PC will give commands to theUPS and receive a response. The response consists of state information, alarminformation or data from the UPS’ internal measurements. The meters works asa measurement subsystem controlled with the PC, and provides measurement datato the PC. In this context, input/output devices are, the PC display and externalnetwork drive that works as a database. The stimulus subsystem contains the MXdevice, which provides different kinds of input voltage to the DUT, and the ELLIfor providing different loads to the DUT.
Figure 7: A block diagram of the desired ATS [27].
The equipment shown in Figure 7 are connected to the PC in a number of ways.The meters are connected via a GPIB bus using a GPIB-to-USB adapter. TheELLI and the MX device are connected via an RS-232 interface. Also the UPS isconnected via the RS-232. The ELLI can be also connected via Ethernet, which isalso used between the PC and the database.
In Figure 8, a circuit diagram of the planned ATS is shown. The test towerconsists of a computer and measurement devices. The computer communicateswith a load control panel, which adjusts an output load to the DUT. Measurementdevices are switched at different test points of the DUT using an I/F board. Thecomputer also controls Known-Good Big Blue (Eaton 9395 UPS) via XCP, providinginput voltage to the DUT. The input voltage to the DUT can be chosen straightfrom the grid or from Known-Good Big Blue using the switch matrix.

16
Figure 8: Circuit diagram of the desired ATS [27].
Besides the basic functionality of the ATS, Table 1 lists other relevant require-ments for the ATS, according to reference [27]. The requirements presented in thissection acted as the foundation on which the prototype was built.
Table 1: Functional requirements.
Requirement Metric RationaleThe ATS should be flexi-ble and modular
The ATS could be used inmultiple tests and couldbe extended to cover test-ing of future UPSs
This extends the life cycleof the ATS and makes itmore cost effective
The ATS should storemeasurement data to lo-cal or remote databases
Measurement data fromeach performed test isstored to the database
The data is used to gener-ate reports and view spe-cific UPS operations af-terwards. Furthermore,the stored data is alsoused as a history of passedtests that could be refer-enced when similar testsare repeated
The ATS should have agraphical user interface(GUI)
An operator can configureand control tests via GUI
The GUI simplifies theuse of the ATS, decreas-ing requirements for oper-ator’s skill level and userinstructions

17
The GUI should displaytime, date and operatorinformation, DUT infor-mation and status, verifi-cation testing status andtotal runtime/run countstatistics
Mentioned features areimplemented
Displayed informationhelps performing thetest and helps comparingdifferent tests
Meters should be syn-chronized
Different measurementsmust be from the samemoment in time
This is required by theUPS standard [3]
The test software is in theform of an executable fileor the like
The test software can beexecuted without a devel-opment environment
This simplifies installa-tion of the software tomultiple test towers
Test software should al-low the user to step backand forth inside a stepprocedure
User must be able to con-trol the flow of the test se-quence
Some test steps needs tobe repeated
Application architectureshall be implemented inmodular base
Different software mod-ules can be modified andevery piece of source codecan be modified
Makes possible for Eatonengineers to modify exist-ing code or add own code
The whole PC shouldwork as a measurementinstrument rather than anormal PC
The PC should be iso-lated from the corporatenetwork as well as exter-nal networks. The onlyinterface to external net-work should be a connec-tion to the database
Keeping the PC in thecorporate network re-quires constant updatingwhich hinders the testperformance
The test software shouldwrite a record of eachtest’s steps into the logfile
All events shall be writtento the log including everytest step change and re-sult
This helps comparing dif-ferent test and evaluatingmeasurement uncertainty
The ATS should allow thediagnosis of each mea-surement devices
Any user can query allmeasurement devices
Allows any user to seewhat configurations areused for certain measure-ment devices
The ATS should allow selfdiagnostic
User is allowed to testcommunication to mea-surement devices, thedatabase and the DUT,and check operation ofrelays and contactors
Self diagnostic is for en-suring the right operationof the ATS

18
2.3 Life Cycle of the ATS
One important aspect of developing an ATS is its life cycle. The former ATS in theNew Product Inroduction (NPI) deparment was successfully used for type testingof UPS devices for many years. However, after being unused for several years it wasscrapped in the spring 2010. The reason for the ATS being left unused was that thepeople who designed the system and knew how to use it had left their jobs withoutleaving enough knowledge about the ATS behind, resulting in no one knowing howto use the ATS. However, the need for a new automatic test system rose again. Dueto obsolescence, any components of the earlier ATS could not be exploited in thenew ATS prototype. For example, test software was programmed with LabVIEW5.0 and was not updated for newer versions of the LabVIEW. This led to the problemthat these LabVIEW programs could not be opened with LabVIEW 2010. Anotherexample was automatic control of loads, which needed to be reconstructed.
To learn from earlier mistakes, this time the life cycle of the new ATS will beconsidered in the beginning of the design process. Furthermore, the desired ATS isconsidered to last multiple UPS development projects and a minimum of 10 years,which increases the importance of life cycle management of the system.
Several methods to manage products life cycle, which can be applied also to theATS life cycle, are presented shortly in this section. According to various sources,life cycle of the product must be considered thoroughly in the beginning of the designproject. In his paper, Liosis [28] presents a method for defining a successful LifeCycle Cost (LCC) roadmap. The roadmap will help design, deliver and sustain aviable product. For an effective LCC system the following areas must be considered[28]:
• Integration of information based systems, such as databases, software toolsand documentation
• Well established obsolescence plan and tracking system• Implemented problem reporting and maintenance data collection systems• Incorporation of a spares plan and tracking/status system• Design for expandability
These listed areas of consideration can be integrated into the developed proto-type. A network drive works as a database. The database contains test softwarecomponents and documents such as user manuals, system descriptions, test instruc-tions and test reports. A network drive is a suitable database when the amount ofdata is small. However, when a database contains large amount of documents, suchas test reports, it is more sensible to divide the data into multiple databases. In thecase of the developed prototype, the integration of the information based system isconsidered and there are no visible problems in sight.
Software tools might become obsolete in situations such as installing a new op-erating system to the computer or a new version of particular software is released.For example, VIs developed with certain versions of LabVIEW must be updatedwith new versions of LabVIEW to avoid obsolescence.
19
Documentation is done using MS Excel and Word. The threat in using thesesoftware is that Microsoft is constantly changing the document standard, makingold Excel and Word files unusable. However, this problem does not appear after fewyears, thought 20-years-old Excel or Word files cannot be opened with the recentversions of Excel or Word. Due to this, it is more sensible to convert Word andExcel files to Portable Document Format (PDF) which is a more durable documentstandard.
Problem reporting and maintenance data collection can be done, for example,using a proprietary issue tracking software such as Atlassian JIRA. Obsolescenceplan and tracking system means that possible threats of certain parts of the proto-type becoming obsolete must be identified and a tracking system indicating whencertain part needs to be updated or maintained.
Expandability is accomplished in the developed prototype by making it movable.This allows the prototype cart introduced in section 3.3.1 to be mobile within dif-ferent test bays inside the factory. The load and supply control system introducedin section 3.3.2 can also be integrated into other test bays in the factory.
Independent Verification and Validation (IV&V), represented by Calhoun [29], isa systems engineering process verifying if the ATE meets its specifications, and val-idates that the ATE performs as customers expect. Part of the IV&V si to organizean independent IV&V organization, employing different methodologies to evaluatethe correctness and quality of the ATE product throughout its life cycle. IV&Vcan be used to reduce costs, duration, and performance risk on the developmentproject of complex ATEs. Furthermore it can be used to manage ATE developmentrisks. IV&V is a guideline to analyse, evaluate, review, inspect, assess, and test ATEhardware and software to meet system requirements. These activities can be donein each phase of the life cycle of the ATE. IV&V makes the ATE development pro-cess more transparent. However, IV&V also consumes a lot of resources and time.According to Calhoun, IV&V can offer the following benefits to the developmentand maintenance of the ATE:
• Identify non-essential requirements• Identify the lack of critical functional definition required for the execution of
the command and control software of the ATE• Fewer latent defects• Detect ambiguous or unclear specifications• Reduce the effort fixing individual faults• Provide greater reliability of the ATE• Identify reusable components (requirements document, architecture, code, test-
ing components) that may be used in future developments• Reduce maintenance costs• Reduce overall life cycle costs of the ATE
Although the benefits of the IV&V are sensible, it seems to require a lot of re-sources to implement in the development of the ATS for the NPI. However, IV&Vcan be exploited for larger automatic test systems such as UPS production’s test

20
system which is developed and maintained by the factory’s test engineering depart-ment. Furthermore, most of the benefits of the IV&V can be covered by consideringthe areas listed in the LCC roadmap above.
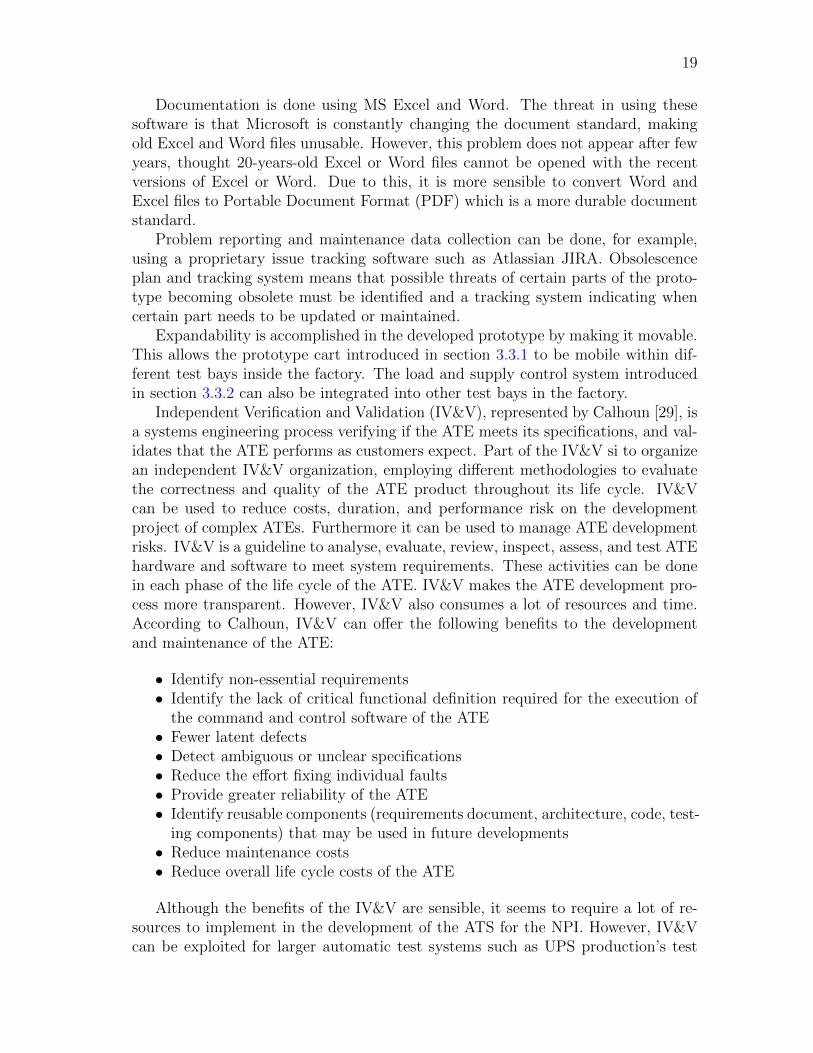
The third method, called Automated Test Life-Cycle Methodology (ATLM) andrepresented by Dustin [30], is a structured methodology made suitable for implemen-tation of automated testing of software. As software plays a large role in the ATS,ATLM can also be applied in the context of the desired ATS. An ATLM processconsist of the steps shown in Figure 9.
Figure 9: A flow chart of ATLM process [30].
An ATLM process begins by defining expectations for an automated test. Ben-efits of automating a test should be listed and it is good to acquire managementsupport. In case of the desired ATS for the NPI, management support can beacquired from the factory’s test engineering department, for example.
The next step is to acquire test tools required to perform a certain test. Theprocess advises to review the system engineering environment, meaning reviewingthe possibility of using tools already available in the factory. Tools available on themarkets should be also reviewed. Different tools should be evaluated and finallypurchased if necessary. In the context of this thesis, there was no need to purchaseany tools. However, the used tools were not perfectly evaluated which means thatthere is a probability that more suitable tools could have been used. Nevertheless,the review is made as a part of this thesis.
The third step is the introduction process of automated testing consisting ofanalysis of test process and consideration of test tools. This step suggests thatwhen automating a certain test, a test process should be determined and test toolsshould be considered according to the determined test process. This means that a
21
step-wise process description should be made for each test.The fourth step consists of test plan, design and development. This step suggests
that the plan is documented, test requirements are analysed, and that the test isdesigned and finally developed.
The fifth step consists of the execution and management of the automated test.The automated test should be executed, defects should be tracked, and test metricsshould be established.
The final step consists of the evaluation of the process and reflections of improve-ments. In the context of the thesis project, a thesis document works as this finalstep of the ATLM process.
The bottom line of these methods is, that in order to extend the life cycle ofthe ATS, it must be maintained and improved all the time to avoid obsolescence.Moreover, all methods suggest that the life cycle of the ATS must be consideredin the beginning of the designing process. The LCC roadmap introduced by Liosis[28] in his paper, suits well for considering factors affecting a length of the ATS lifecycle. IV&V was found to be useful but hard to implement due to resource demand.An ATLM would suit well for a guidance for future development of the prototype.Furthermore, the ATS must be fully documented and documents, including systemdescriptions, user manuals, other instruction documents, must be kept up to date.These documents are useful to operators, developers and maintenance persons ofthe ATS. The ATLM gives guidance also for this tasks.
2.4 Uninterruptible Power Supply
An UPS is a device which prevents electric power grid failures to damage electronicdevices. There are three types of UPS: static, rotary, and hybrid static/rotary.However, only static UPS is presented here. A basic concept of UPS consists offour elements: a rectifier, for converting power from alternating current (AC) todirect current (DC); a battery, providing power to the inverter when supply power isinterrupted; an inverter, converting DC power back to AC power to supply electronicdevice; a by-pass circuit, supplying AC power to the electronic device in case theinverter fails or is overloaded [31].
Basic operation of the UPS depends on the type of the UPS. For example, whenit is connected between a wall outlet and a computer, the UPS provides continuouspower to the computer, filtering some or all defects which might occur in an electricgrid. If supply of the UPS breaks, power is taken from batteries. When the voltageof the batteries is low, UPS commands the computer to shut down. Basic batteriescan provide power at about 10-15 minutes but the time can be extended by addingmore batteries.
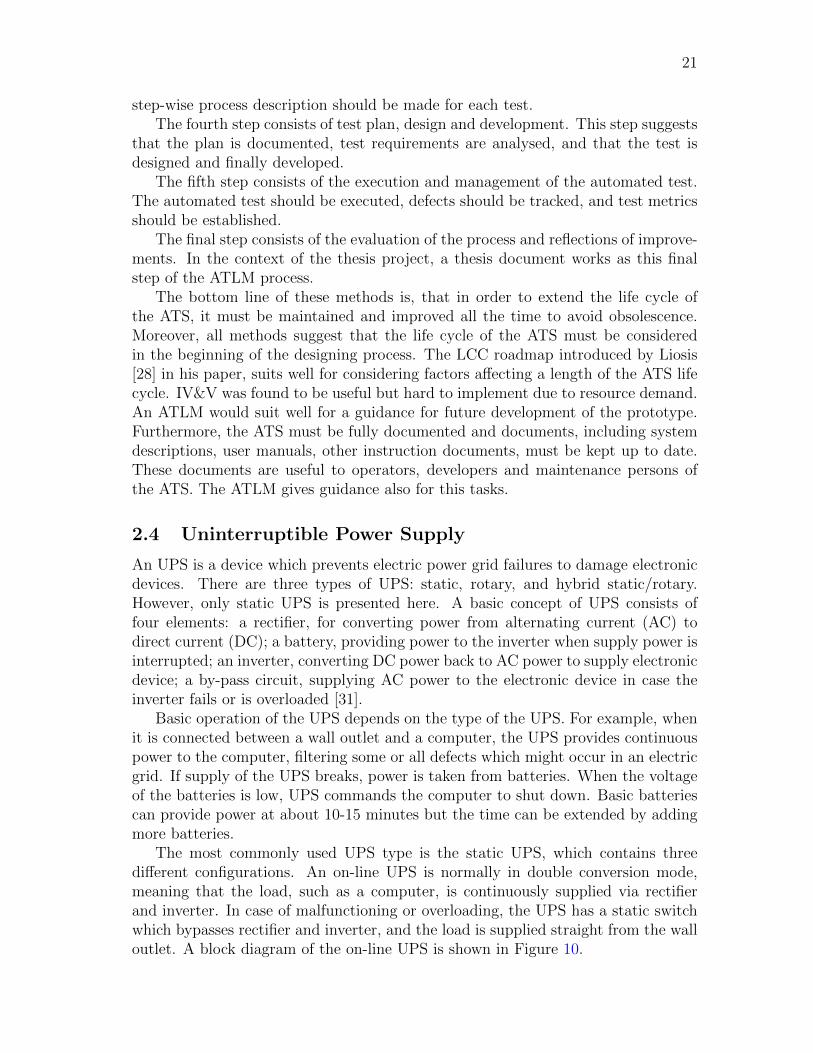
The most commonly used UPS type is the static UPS, which contains threedifferent configurations. An on-line UPS is normally in double conversion mode,meaning that the load, such as a computer, is continuously supplied via rectifierand inverter. In case of malfunctioning or overloading, the UPS has a static switchwhich bypasses rectifier and inverter, and the load is supplied straight from the walloutlet. A block diagram of the on-line UPS is shown in Figure 10.
22
Figure 10: A block diagram of basic on-line UPS [32].
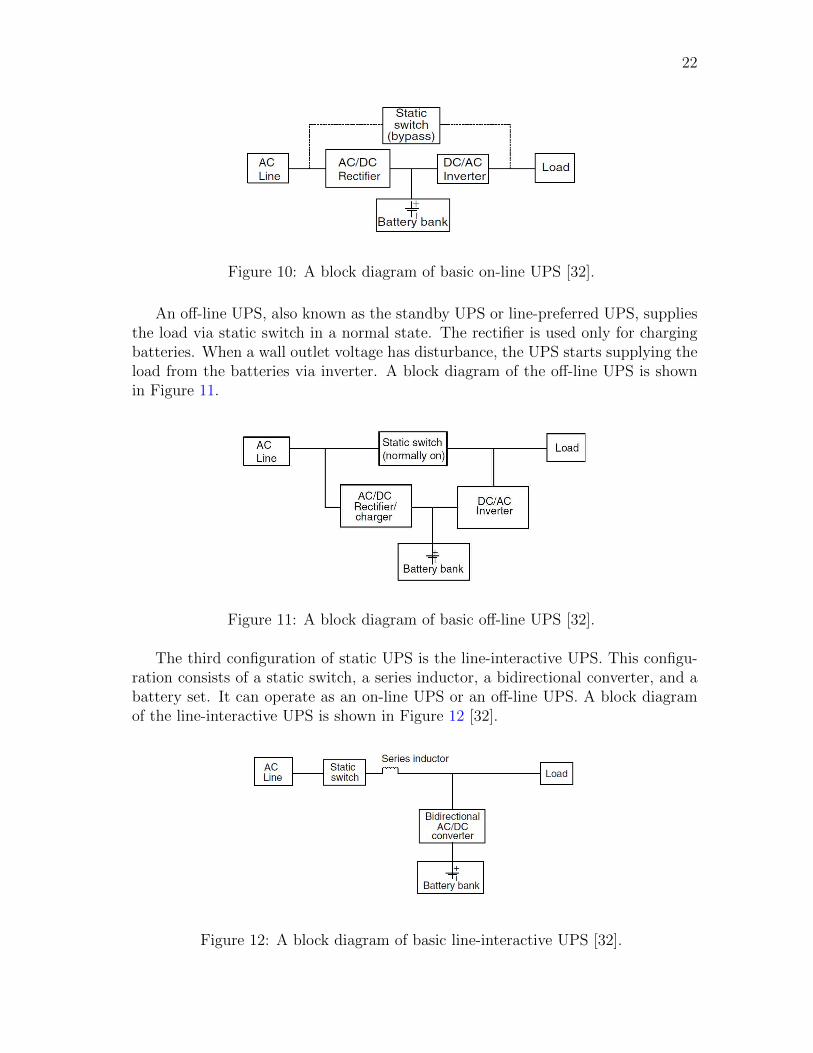
An off-line UPS, also known as the standby UPS or line-preferred UPS, suppliesthe load via static switch in a normal state. The rectifier is used only for chargingbatteries. When a wall outlet voltage has disturbance, the UPS starts supplying theload from the batteries via inverter. A block diagram of the off-line UPS is shownin Figure 11.
Figure 11: A block diagram of basic off-line UPS [32].
The third configuration of static UPS is the line-interactive UPS. This configu-ration consists of a static switch, a series inductor, a bidirectional converter, and abattery set. It can operate as an on-line UPS or an off-line UPS. A block diagramof the line-interactive UPS is shown in Figure 12 [32].
Figure 12: A block diagram of basic line-interactive UPS [32].

23
This thesis focuses on an on-line double conversion UPS produced by EatonPower Quality Oy. Figure 13 presents the Eaton 9395 UPS. As the 9395 can providepower from 225 kVA to 1100 kVA, it is commonly used in the large data centers andserver farms, financial services or in hospitals. In other words, this UPS model isused to ensure stable power supply to the large systems. Another UPS model usedin this thesis project is the Eaton 9155 UPS which can provide power from 8 to 40kVA, and is mainly targeted to information technology (IT) systems in server rooms,building facilities and production’s automation applications. There are also smallermodels for consumer markets providing continuous power for personal computers,televisions or other digital devices [33], [34]. However, the smaller devices are notdeveloped in Finland and thus not covered in this thesis.
Figure 13: Main elements of the Eaton 9395 and 9155 UPS systems [35].
The larger UPS systems, such as the Eaton 9395, isolates the load equipmentfrom all power problems, including nine problems: power failures, brownouts, sags,surges, overvoltage, switching transients, line noise, frequency variation and har-monic distortion [1]. Whereas the smaller UPS models may protect only from someof these problems, such as power cuts, power sag and power surge.

24
2.5 International Electrotechnical Commission Standards forUPS
According to International Electrotechnical Commission Standards (IEC) [36], in-dustrial standard is a generally accepted requirement followed by the members of anindustry. Standards are needed to ensure the safe and correct functionality of theelectrical device. Turning on an electronic device will start a set of invisible events,which make the device work. These events are governed by rules and specificationsthat help manufacturers design safe and properly working devices.
The rules and specifications are developed with the help of thousands of expertsfrom many organizations all around the world. Experts are working together toaccomplish and agree on all the details helping to make products safer and moreefficient. An international standard contains these rules for other engineers andfuture generations to use. Due to standards, future generations do not have toreinvent the wheel.
Standards are needed to ensure that products work together safely and as in-tended. In test labs, the safety of products are checked according to the industrystandard. Governments rely on standards to prevent unsafe products from enteringthe market.
Many companies try to gain access to enter the global markets. For that, compa-nies need information about differences of individual countries, such as basic voltageof an electric grid and its frequency. This information can be found from the inter-national standards.
However, besides these positive qualifications of the standards, large companiescan also use standards as instruments of gaining power. The experts, who wereinvolved in the creation of the standards, can establish costly and complicated rulesand specifications that might hinder smaller companies from becoming compliant.This way large companies can rule the markets. These kind of events do not servethe development of technology and are ethically questionable.
The following section describes three standards concerning UPS. These stan-dards have been prepared by the IEC Technical Committee 22 (TC 22): Powerelectronic systems and equipment, subcommittee 22H (SC 22H): Uninterruptiblepower systems.
2.5.1 IEC-62040 Standards
The IEC-62040-3 standard [3] contains a method of specifying the performance andtest requirements of a complete UPS, not of individual UPS functional units such asinverter or rectifier. The standard applies to movable, stationary and fixed electronicUPS systems delivering under 1000 V AC single or three phase fixed frequencyoutput voltage, and integrating an energy storage system, generally connected intoa DC link. The primary function of the UPS, covered by this standard, is to ensurecontinuity of an AC power source. The UPS may also keep the power source withinspecified characteristics and hence improves quality of power.
The standard contains requirements for UPS test venue, test instrumentation,

25
test load, and for different tests, including routine test, site test, witness test andtype test. Moreover, requirements for environmental and electrical conditions whereUPS should remain functional are described. Environmental conditions includeelements, such as ambient temperature, humidity and altitude. Electrical conditionsinclude elements, such as voltage variation and frequency variation.
As described in the standard [3], type tests are a series of tests intended to ensurethat identical products become compatible with their specification. The standarddescribes functional requirements which any UPS should meet. The objective oftesting is to determine this with a UPS, which is then representative of all otheridentical UPS devices.
Type test procedure contains 55 tests related to performance of the UPS. Typetests also include tests related to safety and electromagnetic compatibility describedin IEC-62040-1 and IEC-62040-2 standards.
The IEC-62040-1 standard [37] contains general requirements and safety guide-lines which any UPS must meet. The IEC-62040-2 standard [38] contains electro-magnetic compatibility requirements which any UPS must meet.
The electrical type tests contains measurements of several electrical quantitiessuch as AC/DC voltages and currents, active power, apparent power, power factorand frequency of AC voltage. In adding to these measurements, some tests requireobservation of voltage waveform and measuring harmonics and THD of input andoutput voltage and current.
The vision for the desired ATS is that it would execute all of the electrical typetests. However, only the efficiency test and the dynamic output performance testwas in the scope of this thesis.
2.5.2 Efficiency and Dynamic Output Performance Tests
In the efficiency test, the UPS’ efficiency is calculated from active input and outputpower, using Equation 1 where Pout and Pin are sums of all input/output phases’active powers.
η =Pout
Pin
, (1)
In addition, operational and environmental conditions and measurement instru-ments must fulfil requirements assigned by the UPS standards. The standards alsoset limit for minimum efficiency depending on UPS power ratings, voltage ratings,load, and efficiency classification. If the UPS has features such as output isolationtransformer or input harmonic current filtering, measured efficiency must be de-creased by 0.4 to 6.1%, depending on the application, to meet the requirement setby the IEC-62040-3 standard.
In the dynamic output performance (DOP) test, the UPS’ output voltage vari-ation is observed with an oscilloscope in different transition situations, such as thechanging of the UPS devices state from normal mode to bypass mode, or the chang-ing of UPS’ load from 100% to 20%. Output voltage variation is compared limits

26
set by the UPS standards. In Figure 14 is showed a UPS output voltage curve,containing voltage variation of each phases (thinner lines) and different voltage vari-ation limits (thicker lines). The oscilloscope is set to record the transition eventfor 1 second and recording is started 30 millisecond earlier than the dynamic event.Oscilloscope sample rate should be 10µs. The curve is generated using special MSExcel tool from comma-separated values (CSV) file, containing values recorded bythe oscilloscope [39]. The test process of DOP test is described more specifically insection 3.4.
Figure 14: UPS output voltage limit curve [39].
The limit depends on what kind of load is supplied with a UPS. The IEC-62040-3 standard describes three classifications. A classification 1 (green line) is requiredfor sensitive critical loads. A classification 2 (red line) is accepted by most typesof critical loads. A classification 3 (blue line) is accepted by general purpose ITloads, such as switched-mode power supplies. Also Information Technology IndustryCouncil (ITI) has specified an AC input voltage envelope, which typical can betolerated by most IT equipment [40]. This specification is known as ITI (CBEMA)Curve (yellow line).
27
2.6 Eaton
Eaton Corporation is a international power management company with a missionto provide safe, reliable, efficient and sustainable power management solutions, anda vision to be most admired company in its market. The company was founded 100years ago in 1911 in New Jersey, United States of America. Today, the company hasapproximately 73000 employees and customers in more than 150 countries. Eaton’soperations are divided into five business units [41]:
• The Automotive unit (the company’s first)• The Hydraulics unit• The Aerospace unit• The Truck unit• The Electrical unit
The largest unit is the Electrical unit covering half of the company’s trade. Theunit provides a comprehensive portfolio of electrical solutions including equipmentused in quality control, distribution and the generation of electrical power, and awide range of engineering and support services. Furthermore, as a part of the Elec-trical unit, Eaton’s power quality business offers products for monitoring, analyzing,measuring and controlling electrical power with devices such as UPS systems [26].
Eaton is the second largest UPS manufacturer in the world with more than 45years of experience. This experience is gained from earlier UPS brands such asFiskars, Exide Electronics, Powerware, Best Power, MGE Protection Systems andSantak. UPS systems are divided into 3-phase systems and 1-phase systems. 3-phase systems are designed and manufactured in three locations, including China,USA and Finland [26].
The UPS factory in Finland is located in Espoo and has operated since 1962.A long history of the factory covers almost all the UPS brands mentioned earlier.Today, the factory’s operations includes production and testing of 3-phase UPSsystems with power range from 225 to 1100 kVA, and final configuration of UPSsystems with power range from 8 to 160 kVA. In addition, the factory can providecustomised UPS solutions for specific applications, such as marine and offshore.Furthermore, other parts of the factory’s operations include project managementand services, providing complete power quality solutions for large data centres [26].
The factory’s operations also include the research and development of UPS sys-tems. The primary task of the NPI is to design new products involved with thedesigning of mechanics, electronics and firmware. NPI researches and develops newtechnologies that result in new patents. Besides of developing new devices and tech-nologies. Moreover, NPI supports other departments, makes changes and improve-ments to older devices, gives technical support to marketing, sales and maintenancedepartments, and production. Another part of the work is also to investigate andsolve issues noticed by customer or maintenance workers [42]. During the writing ofthe thesis, NPI’s organization was slightly changed. This change affected also thename, which is now EMEA 3 Phase Engineering.

28
3 Experimentation
The purpose of the experimentation was to examine automation possibilities of typetests, and clarify the resources, time and effort needed to realize the desired ATS,and also clarify the need for it.
The experimentation was made by developing a functional prototype of the ATS,and demonstrating the main functions required for the ATS. An efficiency test waschosen as a demonstration test for the prototype, since it is the most common typetest performed in the NPI department, and a UPS’ efficiency is often the mostimportant single technical information for the customer.
This chapter contains a description of the development process of the prototype.Following this, a more specific description of automating the efficiency test is given.This is followed by a section, describing the final prototype specifically.
Another part of the experimentation was to examine the possibility to automatethe most complex type test, which is a dynamic output performance test. Theresults of the experimentation are presented at the end of the Chapter.
3.1 Prototype Development Process
This section introduces a development process of the prototype. A flow chart of thedevelopment process is shown in Figure 15.

29
Figure 15: A flow chart of the prototype development process.
The development of the ATS prototype started by defining its initial needs andrequirements. The initial requirements are described in section 2.2. The second stepwas to share responsibilities. Developing test sequences, communication interfacesand a cart was in the scope of this thesis. The supply and load control system wasdeveloped in parallel. However, the supply and load control system was developed
30
by another engineer and it is not in the scope of this thesis, except for the use ofthe system as a part of the prototype.
After sharing responsibilities, it was decided that developing the test sequenceswill be started by automating an efficiency test, first for the Eaton 9395 UPS. First,this required learning to use LabVIEW development environment and TestStandsoftware, and second, trying all required instruments and interfaces. When thecommunication between LabVIEW and the measurement instruments were success-fully experimented, the development of a test sequence for an efficiency test wasbegun.
The test sequence was made with TestStand, invoking programs made with Lab-VIEW. The next section contains a more specific description of automating an effi-ciency test. After a test sequence for efficiency test was constructed, it was decidedto read through the UPS standard [3] to specify all the instruments required to per-form all type tests. The ATS prototype cart was then developed according to thisspecification. The result of the development process is the prototype of the ATSand final prototype in the context of the thesis project. Finally, a plan for futuredevelopment will be made. This includes a review of the development process, whichis made as a form of this thesis.

31
3.2 Efficiency Test
An efficiency test was chosen as the first test to be automated. The efficiency testrequired the building of an interface between a PC and a digital power meter and aUPS. Furthermore, the UPS standard [3] sets requirement, concerning the efficiencytest.
An interface between the WT230 power meter and LabVIEW was tested first. NIprovides a ready-made LabVIEW driver, consisting of multiple VIs combined into aVI library file, to configure the power meter and to acquire measurement data fromit. These VIs were modified and integrated as a part of the test sequence. However,the WT230 was not a suitable power meter for measuring efficiency of a 3-phase UPSas it required two meters to measure both input and output power. The WT1600power meter was the better option because it had six measurement elements. NI alsoprovided a LabVIEW driver for the WT1600, which was also modified and integratedas a part of test sequence. A GPIB bus was used to communicate between a PCand the WT1600.
Communication between a PC and a UPS was experimented next. One taskwas to control a UPS using LabVIEW and receive status and alarm informationfrom it, and also the UPS’ internal measurement data. An XCP communicationprotocol enabled all of these actions. As the test system in UPS production containedprograms made with LabVIEW, it also contained LabVIEW programs to establishcommunication with an XCP.
The UPS production’s test system also exploits TestStand to execute test se-quences. A TestStand test sequence for the Eaton 9395 UPS was used as a templateto develop the efficiency test sequence.
The test sequence was developed through a method of trying different featuresof the TestStand and developing the test sequence piece by piece. Different versionsof the test sequence were saved as individual test sequence files. All the sequencefiles and LabVIEW files were stored to a local network drive.
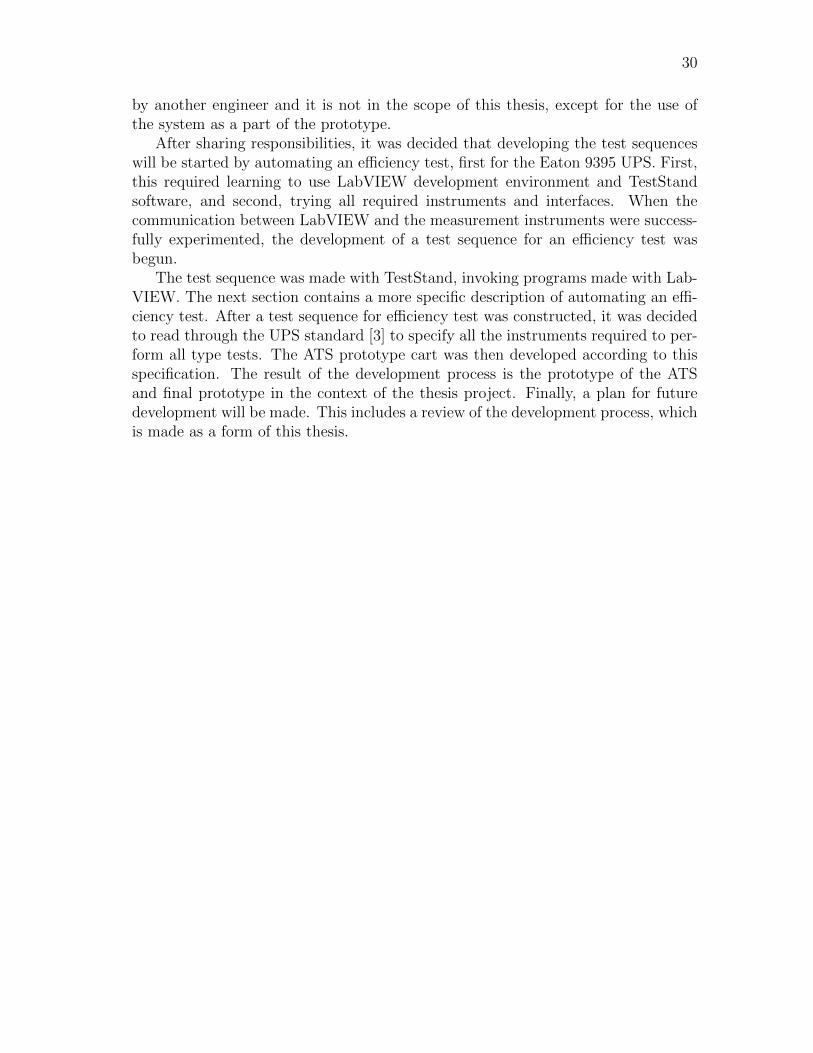
After all the interfaces between different equipment were successfully experi-mented and implemented in the test sequence, a test installation was made and theprototype was demonstrated making the efficiency test for the Eaton 9395 UPS. Thetest installation is shown in Figure 16.
32
Figure 16: Efficiency test installation for the Eaton 9395 UPS.
A PC laptop was used to execute the test sequence. An output load of theUPS was changed manually from the load and supply control box, controlling theload and supply system of the factory’s test bay 6. The system contains a controlbox switching relays in the relay cabinet, which switches contactors in the load andsupply center, located behind the Eaton 9395 UPS. The center provides a supplyvoltage and an output load for the UPS. The ATS cart holds the WT1600 powermeter supplied through an isolation transformer. The test wiring was made as shownin Appendix A.
The first demonstration of the efficiency test was not completely automatic sincethe load was changed manually. The demonstration also lacked measurements of aninput voltage’s harmonics and calculation of its THD. The load and supply controlwas added later to the final prototype, presented in the next section.
33
3.3 Description of the Developed Prototype
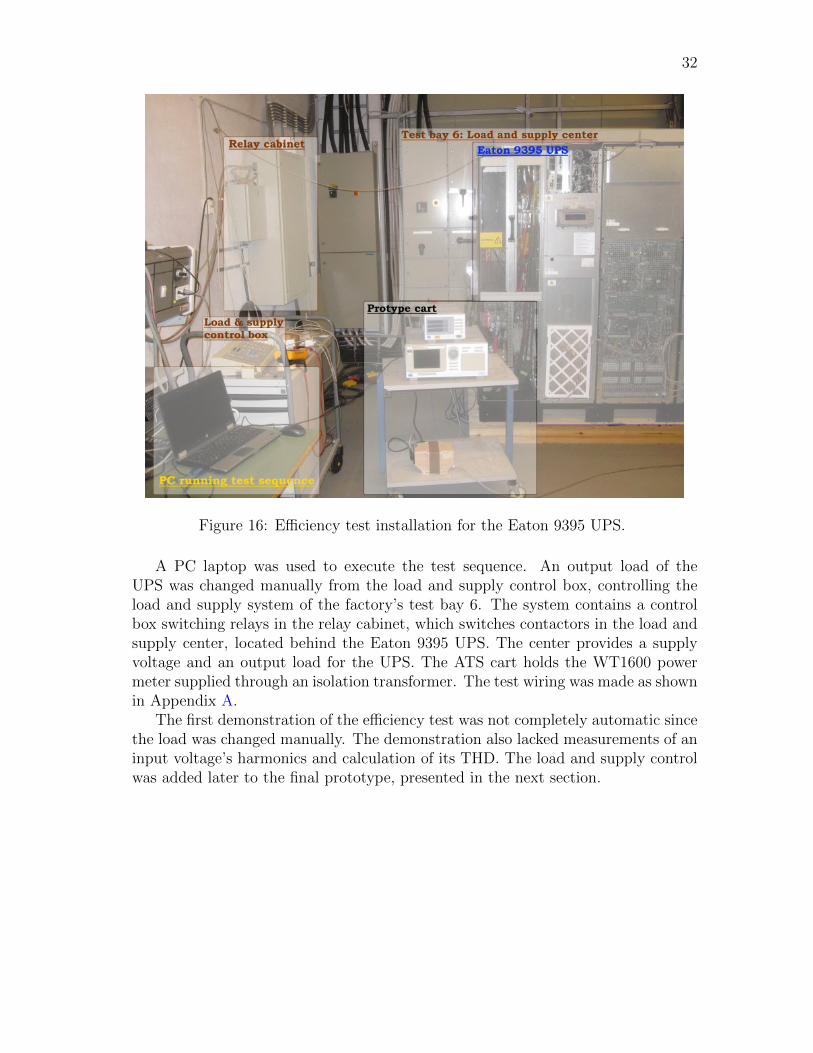
In Figure 17, a block diagram is shown containing all elements of the developedprototype. The software block consists of a PC running TestStand. TestStandexecutes a test sequence, invoking VIs developed with LabVIEW. The VIs includefunctions such as: retrieving data from and sending commands to instruments anda UPS; handling of measurement data; and writing measurement data to MS Excelspreadsheet.
Figure 17: A block diagram of the prototype.
The connectivity block includes communication protocols used in the prototype.Ethernet is exploited to send commands to the load and supply control system, andto receive feedback from it. Ethernet is also exploited to transfer measurement datafiles from the DL750 and the DL850 oscilloscopes utilizing FTP. The PC commu-nicates with measurement instruments via GPIB bus. Because the PC does nothave a GPIB-card, a USB-to-GPIB converter is used to attach the GPIB bus to thePC. XCP communication protocol, utilizing RS-232 interface, is used between thePC and the UPS for sending commands to the UPS and reading alarms, state andinternal measurements. The final connection interface in the block is a wireless local
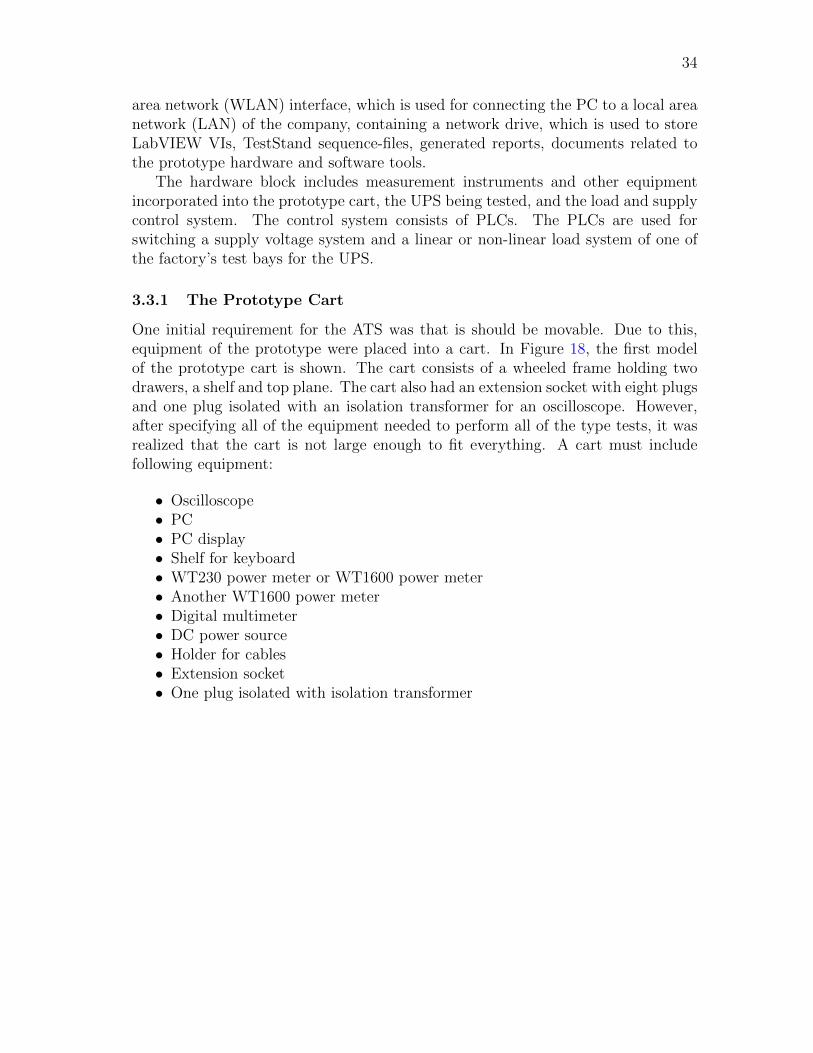
34
area network (WLAN) interface, which is used for connecting the PC to a local areanetwork (LAN) of the company, containing a network drive, which is used to storeLabVIEW VIs, TestStand sequence-files, generated reports, documents related tothe prototype hardware and software tools.
The hardware block includes measurement instruments and other equipmentincorporated into the prototype cart, the UPS being tested, and the load and supplycontrol system. The control system consists of PLCs. The PLCs are used forswitching a supply voltage system and a linear or non-linear load system of one ofthe factory’s test bays for the UPS.
3.3.1 The Prototype Cart
One initial requirement for the ATS was that is should be movable. Due to this,equipment of the prototype were placed into a cart. In Figure 18, the first modelof the prototype cart is shown. The cart consists of a wheeled frame holding twodrawers, a shelf and top plane. The cart also had an extension socket with eight plugsand one plug isolated with an isolation transformer for an oscilloscope. However,after specifying all of the equipment needed to perform all of the type tests, it wasrealized that the cart is not large enough to fit everything. A cart must includefollowing equipment:
• Oscilloscope• PC• PC display• Shelf for keyboard• WT230 power meter or WT1600 power meter• Another WT1600 power meter• Digital multimeter• DC power source• Holder for cables• Extension socket• One plug isolated with isolation transformer
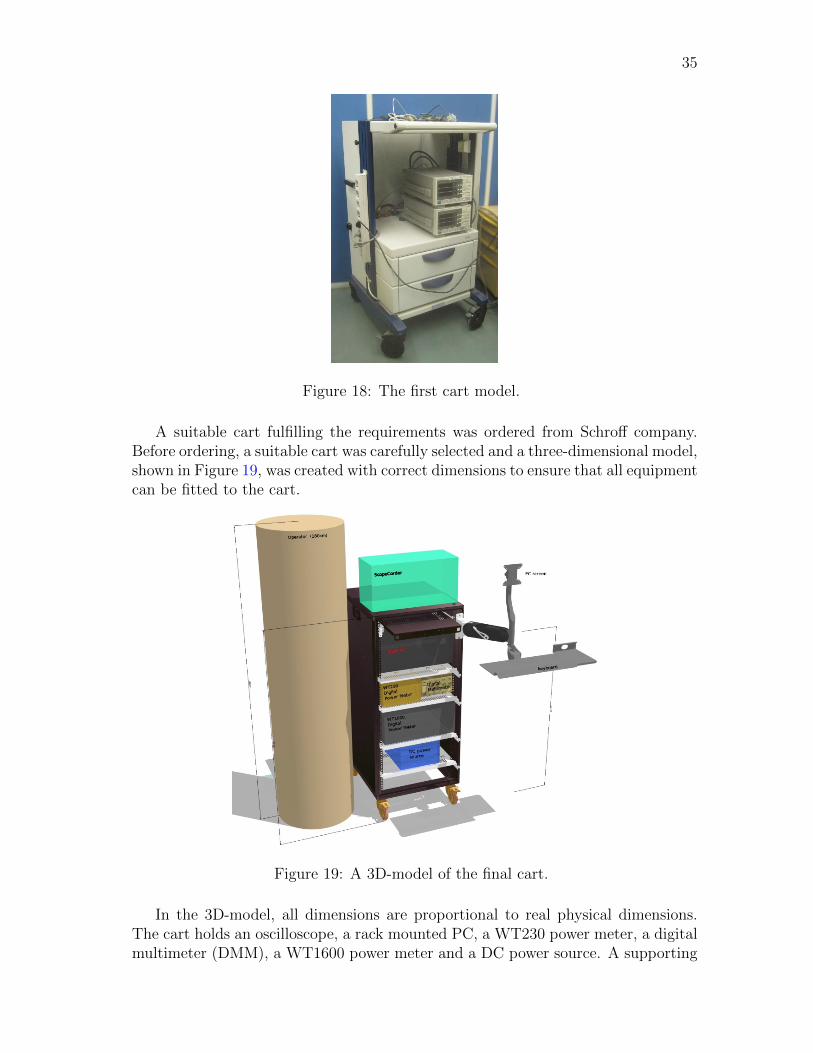
35
Figure 18: The first cart model.
A suitable cart fulfilling the requirements was ordered from Schroff company.Before ordering, a suitable cart was carefully selected and a three-dimensional model,shown in Figure 19, was created with correct dimensions to ensure that all equipmentcan be fitted to the cart.
Figure 19: A 3D-model of the final cart.
In the 3D-model, all dimensions are proportional to real physical dimensions.The cart holds an oscilloscope, a rack mounted PC, a WT230 power meter, a digitalmultimeter (DMM), a WT1600 power meter and a DC power source. A supporting
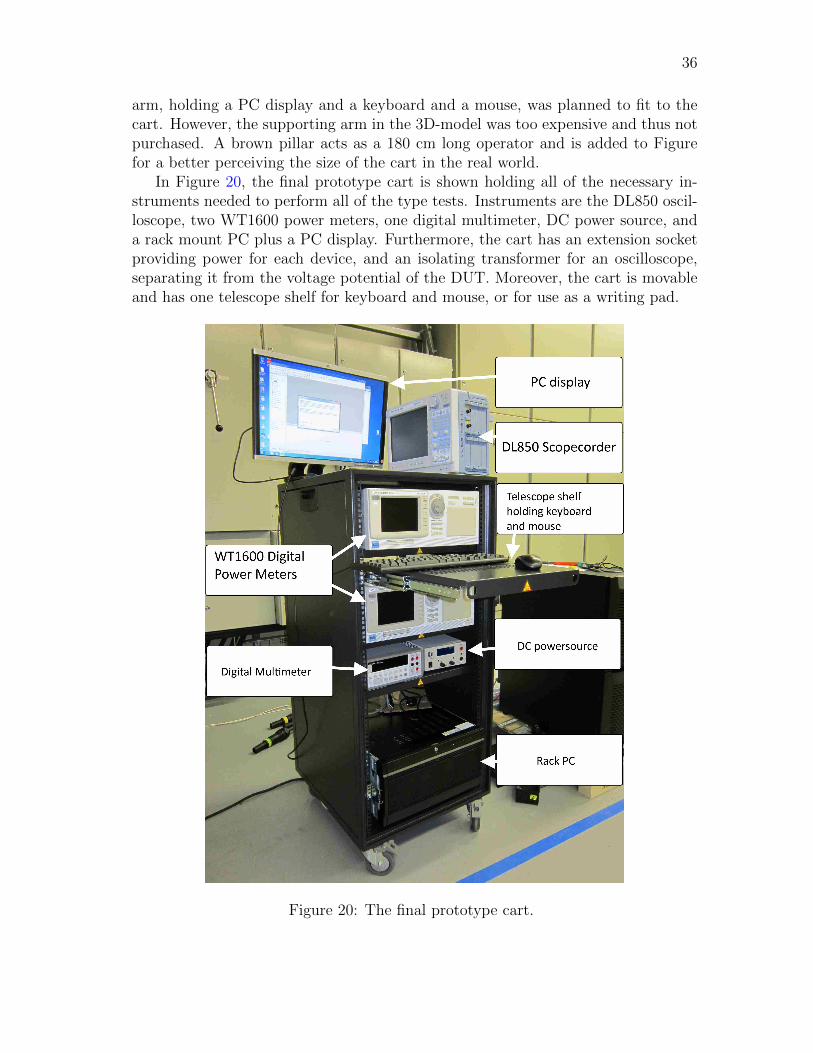
36
arm, holding a PC display and a keyboard and a mouse, was planned to fit to thecart. However, the supporting arm in the 3D-model was too expensive and thus notpurchased. A brown pillar acts as a 180 cm long operator and is added to Figurefor a better perceiving the size of the cart in the real world.
In Figure 20, the final prototype cart is shown holding all of the necessary in-struments needed to perform all of the type tests. Instruments are the DL850 oscil-loscope, two WT1600 power meters, one digital multimeter, DC power source, anda rack mount PC plus a PC display. Furthermore, the cart has an extension socketproviding power for each device, and an isolating transformer for an oscilloscope,separating it from the voltage potential of the DUT. Moreover, the cart is movableand has one telescope shelf for keyboard and mouse, or for use as a writing pad.
Figure 20: The final prototype cart.

37
3.3.2 Load and Supply Control System
The load and supply control system controls the load and supply center, whichworks as a stimulus subsystem for the prototype. A stimulus subsystem, introducedin section 2.1.6, was automated using PLCs shown in Figure 21. PLCs can becontrolled via Ethernet using a PC.
Figure 21: Load and supply control system.
3.3.3 Operator Interface
NI TestStand provides a ready-made user interface (UI) for executing test sequences.The UIs made with different programming languages, including C#, C++, Lab-VIEW, LabWindows CVI and Visual Basic .NET, are provided. In Figure 22, auser interface made with LabVIEW is shown.
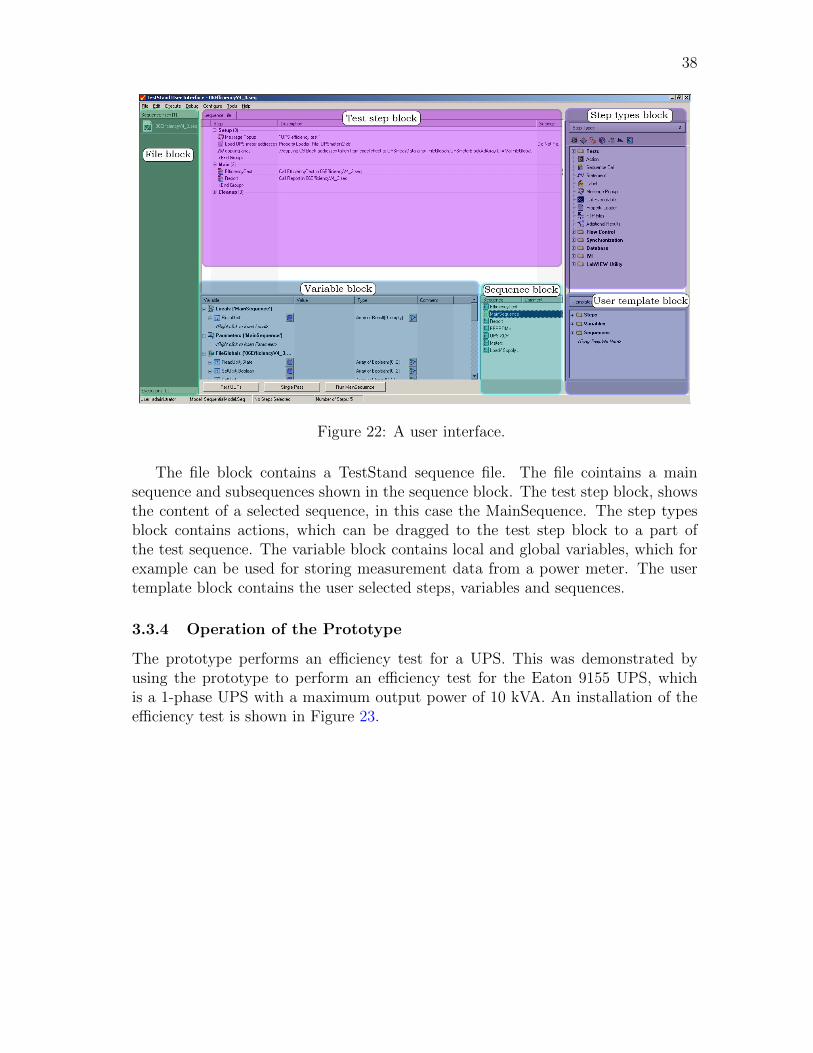
38
Figure 22: A user interface.
The file block contains a TestStand sequence file. The file cointains a mainsequence and subsequences shown in the sequence block. The test step block, showsthe content of a selected sequence, in this case the MainSequence. The step typesblock contains actions, which can be dragged to the test step block to a part ofthe test sequence. The variable block contains local and global variables, which forexample can be used for storing measurement data from a power meter. The usertemplate block contains the user selected steps, variables and sequences.
3.3.4 Operation of the Prototype
The prototype performs an efficiency test for a UPS. This was demonstrated byusing the prototype to perform an efficiency test for the Eaton 9155 UPS, whichis a 1-phase UPS with a maximum output power of 10 kVA. An installation of theefficiency test is shown in Figure 23.

39
Figure 23: Efficiency test installation for Eaton 9155 UPS.
In Figure 24, a wiring circuit of the efficiency test installation is shown.
Figure 24: A wiring circuit of the efficiency test.
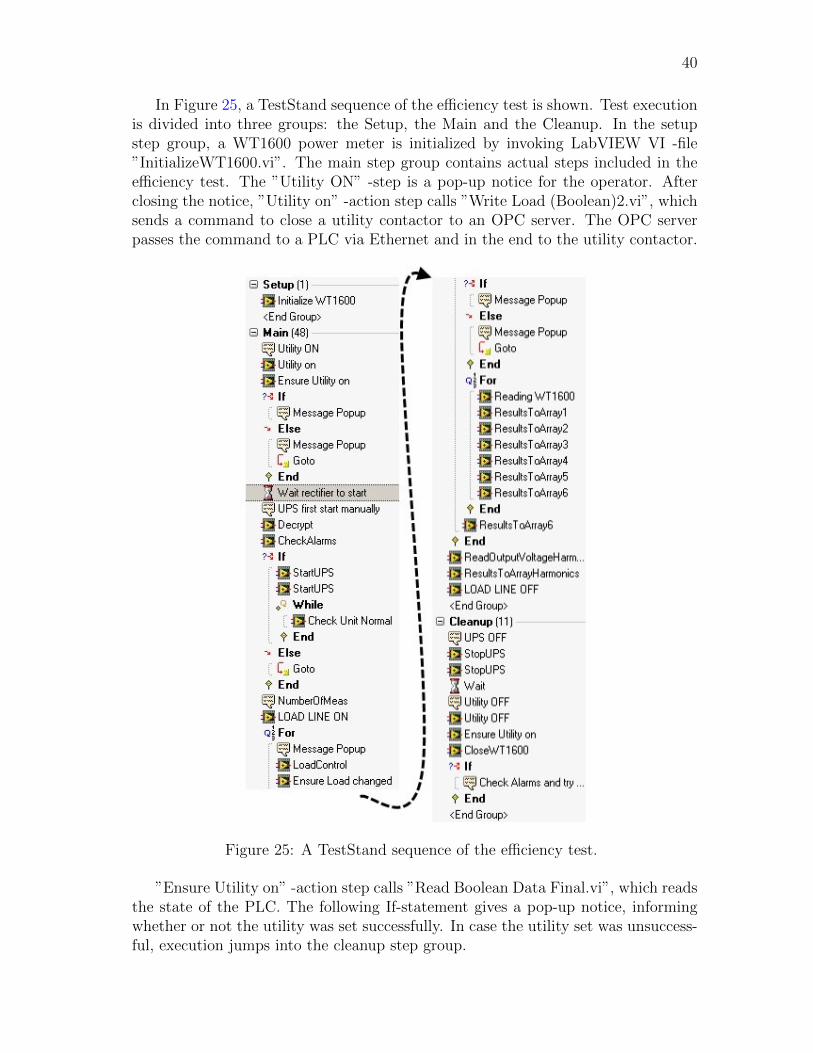
40
In Figure 25, a TestStand sequence of the efficiency test is shown. Test executionis divided into three groups: the Setup, the Main and the Cleanup. In the setupstep group, a WT1600 power meter is initialized by invoking LabVIEW VI -file”InitializeWT1600.vi”. The main step group contains actual steps included in theefficiency test. The ”Utility ON” -step is a pop-up notice for the operator. Afterclosing the notice, ”Utility on” -action step calls ”Write Load (Boolean)2.vi”, whichsends a command to close a utility contactor to an OPC server. The OPC serverpasses the command to a PLC via Ethernet and in the end to the utility contactor.
Figure 25: A TestStand sequence of the efficiency test.
”Ensure Utility on” -action step calls ”Read Boolean Data Final.vi”, which readsthe state of the PLC. The following If-statement gives a pop-up notice, informingwhether or not the utility was set successfully. In case the utility set was unsuccess-ful, execution jumps into the cleanup step group.

41
The ”Waiting rectifier to start” -step stops the execution for 70 seconds whichis the usual time required to start a rectifier of the Eaton 9155 UPS. The UPS mustbe first started manually from the device’s user panel before it accepts any XCPcommands.
A ”UPS first start manually” -pop-up notice informs this. After starting theUPS, meaning that the UPS goes to the on-line state, ”Decrypt” -action step calls”TS Encryption.vi” which enables the XCP communication between the PC and theUPS. The ”CheckAlarms” -action step asks whether or not the UPS has any alarms.If alarms are not detected, ”StartUPS” -action step sends ”to on-line” -commandto the UPS twice for successful transmission.
The ”Check Unit Normal” -action step calls ”TS Status.vi” which checks whetherthe UPS is on the on-line state or not. The status check is inside a while-loop which,is stopped when the UPS state is on-line. If alarms are detected, the execution movesto the cleanup step group. Following a pop-up notice ”NumberOfMeas” requeststhe number of measurement samples taken with each load. The ”LOAD LINE ON”-action step calls again the ”Write Load (Boolean)2.vi”, which this time closes theload contactors.
The following for-loop is executed 10 times and the load is changed in each cycle,starting from 100% resistive load (value of the power factor is near 1) and endingto 0% resistive load. An operator is notified with a pop-up notice and when theoperator closes the pop-up ”LoadControl” -action step is executed. The action stepcalls the ”WriteLoadValue.vi” which changes the load value by sending commandto the OCP server which passes it to the PLC via Ethernet.
The PLC switches the contactor which connects 100% load to the UPS’ output,which is in the case of 10 kVA UPS about 5.4 Ω when Uoutput = 225.6V AC andIoutput = 41.83A. The load change is ensured by calling the ”ReadLoadValue.vi”.Once again, if the load is not changed correctly, execution moves to the close stepgroup.
Next the for-loop will be executed until variable ”FileGlobals.i” reaches thevalue defined by the operator in the step ”NumberofMeas”. Inside the for-loop,the WT1600 power meter’s measurements from the UPS’ input and output are readby calling the ”ReadWT1600 v7 only2elem.vi”. The measurements contains valueof six quantities, including AC voltage and current, active power, apparent power,power factor and AC voltage’s frequency.
The measurement values are stored into the ”FileGlobals.Results 2.Element1All” and ”FileGlobals.Results 2.Element2 All” variables. The following ”Result-
sToArray” -action steps calls the ”ColumnsToArray v2.vi”, combining the resultsof each element into a two dimensional array. Results from all six elements arecombined although only two elements are used here. This is done because most ofthe UPSs tested in the NPI are 3-phase devices.
After the for-loop, combined results of each element are combined into a twodimensional array, now containing all of the measurements from all of the elements.After all 10 load steps are executed, the ”ReadOutputVoltageHarmonics” -actionstep calls ”WT1600Harmonics.vi” which measures harmonics of the output voltageand calculates a THD. However, this step is not working properly and was left
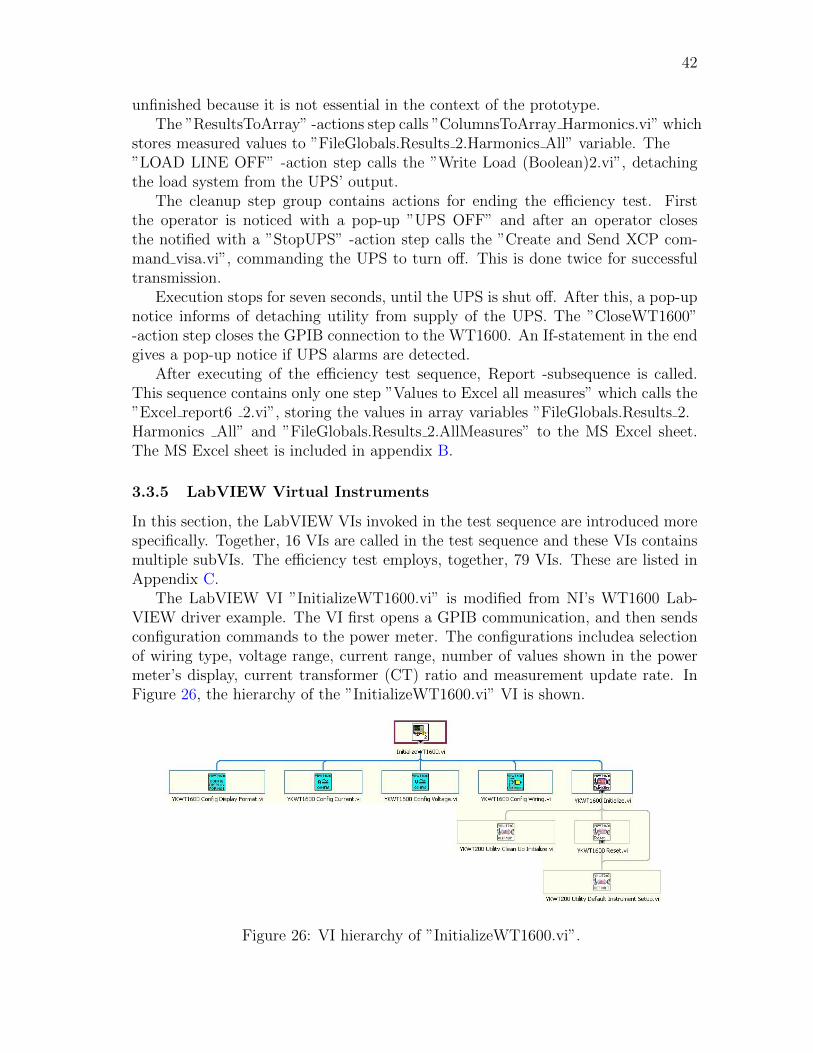
42
unfinished because it is not essential in the context of the prototype.The ”ResultsToArray” -actions step calls ”ColumnsToArray Harmonics.vi” which
stores measured values to ”FileGlobals.Results 2.Harmonics All” variable. The”LOAD LINE OFF” -action step calls the ”Write Load (Boolean)2.vi”, detachingthe load system from the UPS’ output.
The cleanup step group contains actions for ending the efficiency test. Firstthe operator is noticed with a pop-up ”UPS OFF” and after an operator closesthe notified with a ”StopUPS” -action step calls the ”Create and Send XCP com-mand visa.vi”, commanding the UPS to turn off. This is done twice for successfultransmission.
Execution stops for seven seconds, until the UPS is shut off. After this, a pop-upnotice informs of detaching utility from supply of the UPS. The ”CloseWT1600”-action step closes the GPIB connection to the WT1600. An If-statement in the endgives a pop-up notice if UPS alarms are detected.
After executing of the efficiency test sequence, Report -subsequence is called.This sequence contains only one step ”Values to Excel all measures” which calls the”Excel report6 2.vi”, storing the values in array variables ”FileGlobals.Results 2.Harmonics All” and ”FileGlobals.Results 2.AllMeasures” to the MS Excel sheet.The MS Excel sheet is included in appendix B.
3.3.5 LabVIEW Virtual Instruments
In this section, the LabVIEW VIs invoked in the test sequence are introduced morespecifically. Together, 16 VIs are called in the test sequence and these VIs containsmultiple subVIs. The efficiency test employs, together, 79 VIs. These are listed inAppendix C.
The LabVIEW VI ”InitializeWT1600.vi” is modified from NI’s WT1600 Lab-VIEW driver example. The VI first opens a GPIB communication, and then sendsconfiguration commands to the power meter. The configurations includea selectionof wiring type, voltage range, current range, number of values shown in the powermeter’s display, current transformer (CT) ratio and measurement update rate. InFigure 26, the hierarchy of the ”InitializeWT1600.vi” VI is shown.
Figure 26: VI hierarchy of ”InitializeWT1600.vi”.

43
• Write Load (Boolean)2.vi. This VI commands the PLCs controlling supply,linear load and non-linear load contactors. Commands are sent by writingspecific CoDeSyS OPC server item either one or zero. The OPC server passesthe information to the PLCs via Ethernet.
• TS Encryption.vi. This VI calculates and saves an authorization code forenabling the XCP communication between the PC and the UPS.
• CheckAlarms.vi. This VI checks active alarms of the UPS and returns astring containing the number of each active alarm, and an alarm detected bit.
• Create and Send XCP command visa.vi. This VI creates an XCP com-mand, described earlier in Figure 4, and sends it to the UPS. The commandcan be selected from ”Command” -menu or write in ”Command 0x” -stringcontrol. If the command requires an authorization code, for example if theUPS start command requires it, the ”Send authorization code” -button mustbe selected. The COM port where RS-232 is connected can be chosen from”Visa” -menu. The ”Concatenated String” -string shows the whole XCP com-mand. ”Command out” -string shows a command part of the whole XCPcommand. ”Start time of send” -number shows a elapsed time before thecommand is sent to the UPS. ”PASS” -variable is true if the XCP commandwas successfully sent.
• TS Status.vi. This VI requests the status of the UPS via XCP. VI returns”Responce” -string containing a number of status and a ”Report Text” -stringcontaining status description.
• WriteLoadValue.vi. This VI changes an output load of the UPS by sendingcommand to the OPC server. The OPC item responsible for changing the loadis written in ”Item” -string and the desired load value in kilowatts is writteninto the ”Load Value” -variable. It is possible to change the load either in oneoutput phase or each output phases of the UPS.
• ReadLoadValue.vi. This VI reads the current output load value of the UPSfrom the OPC server. The OPC item responsible for changing the load iswritten into the ”Item to read” -string and the VI returns the ”Kw arvot”-variable containing a present load value in kilowatts. It is possible to checkthe connected load either in one output phase or each output phases of theUPS.
• ReadWT1600 v7 only2elem.vi. This VI reads measurement data fromthe WT1600 power meter via GPIB. The VI returns measurements from eachelements of the WT1600, including RMS value of AC voltage, RMS value of ACcurrent, reactive power, apparent power, power factor and voltage frequency.The VI returns an array from each element’s measurements. Additionally, incase of three-phase UPS, the ”SigmaA” -array contains an average RMS valueof input voltages and currents, and a sum of input active powers and apparentpowers. ”SigmaB” -array contains same values but from output of the UPS.
• ColumnToArray v2.vi. This VI combines measurement values from indi-vidual measurement events. It is used separately for the each WT1600 element.
• ColumnToArray v3.vi. This VI combines all measurement values to thefinal form given to the ”Excel report6 2.vi”, generating a test report.

44
• WT1600Harmonics.vi. This VI reads voltage harmonics from one inputphase of the UPS. It first configures the WT1600 to harmonics measurementmode. However, this VI does not read harmonics correctly. The VI was leftunfinished because it was not thought essential in the context of the prototype.
• ColumnsToArray Harmonics.vi. This VI combines measurement valuesfrom the individual harmonics measurement events.
• Read Boolean Data Final.vi. This VI reads state of the utility contactorfrom the OPC server. OPC items responsible for controlling utility contactorsare given to ”Luettavat Itemit” -string array. ”Boolean data out” -array con-tains state of the contactors which is either false, meaning that the contactoris open, or true, meaning that the contactor is closed.
• CloseWT1600.vi. This VI closes the GPIB connection between the PC andthe WT1600 and performs an error query to the meter. Possible errors arestored in ”Error” -and ”Error Message” -variables.
• Excel report6 2.vi. This VI generates an Excel spreadsheet and stores val-ues from given input arrays ”array 1”, ”array 2”, ”array 7” and ”array 8” tothe spreadsheet. An Excel spreadsheet is generated according to Excel tem-plate ”template4 2.xltx” containing named cells. Arrays are copied into thespreadsheet according to these named cells.

45
3.4 Dynamic Output Performance Test
Observing voltage waveforms with an oscilloscope is a pertinent part of the DOPtest. For automating the test, the oscilloscope needs to be configured automaticallyand recorded waveform data needs to be transferred to the PC.
The test contains actions including changing the state of the UPS, and changingoutput load of the UPS. These actions must be done at exactly right moment,complicating test performance and automating the test.
3.4.1 Test Process
Test installation requires a DL750 or DL850 oscilloscope to observe voltage wave-forms. The oscilloscope’s voltage probes are connected to each input/output phaseof the UPS. A current probe is connected to one output phase. The oscilloscopeis initialized to trigger to this current. Moreover, the oscilloscope’s sample rate isset to 100 kilo samples per second, and the start point of the recording is set to30 milliseconds before the triggering point. The DOP test includes five dynamicevents:
1. From normal mode to battery mode with a full load2. From battery mode to normal mode with a full load3. From normal mode to bypass mode when overload is applied4. Load step in normal mode5. Load step in battery mode
Changing the UPS state from normal mode to battery mode must be timedexactly when the input voltage waveform passes through zero and again when in-put voltage waveform is at its peak. In this case, the input supply of the UPS isinterrupted for a minimum of one second, causing a shift from normal state to bat-tery state. However, due to delays caused by different interfaces, the correct timingfor sending the command must be explored and ensured manually. After this thewaveform can be saved and transferred to the PC, using the developed LabVIEWVIs.
In the case of changing UPS state from battery to normal mode, in other wordsreturning the input supply, the input voltage waveform can be at any angular posi-tion. The same rule holds true also in the case of changing UPS state from normalto bypass by applying an overload to the UPS.
In the case of load step, the UPS must be in normal state with a full load andload is reduced to 20% at the same time when the output voltage is at its peakvalue. This is repeated with UPS on battery mode.
Three major challenges make automating the DOP test difficult and time con-suming. The first challenge is the changing state of the UPS and making the loadstep at the right angle of input voltage. The second challenge is that the success-ful load step requires two parallel load systems. Only one load system was madecontrollable with LabVIEW during the thesis project. The third challenge is to au-tomatically compare the voltage variation caused by dynamic event, to limits defined

46
by the UPS standard. Due to these challenges, automating the DOP test requiresmore time and resources than would be saved through automation, and thus it isnot valuable to automate the DOP test.
In Figure 27, a process of the DOP test is shown.
Figure 27: Process of the DOP test.
3.4.2 LabVIEW Virtual Instruments
Experimenting the DOP test resulted a communication interface between a Lab-VIEW VI and a Yokogawa DL750 and a DL850 oscilloscopes. The commands andresponses are transferred via GPIB bus and larger measurement data files are trans-ferred via Ethernet. The following six VIs were made for transfering data betweena PC and the oscilloscopes:

47
• InitDL750.vi. This VI initializes the DL750 or DL850 oscilloscope. It opensa GPIB communication to the PC, sets timebase and configures display of theoscilloscope.
• Aquisition.vi. This VI sends a GPIB command to the DL750/DL850 to startacquisition. With input parameters, it is possible to choose which channelsare used, and trigger mode and its source signal.
• DL750image v2.vi. This VI retrieves a display image of the DL750/DL850via GPIB. The location of the retrieved image is defined as the input param-eter.
• CloseDL750.vi”. This VI closes the GPIB communication and performs anerror query to the DL750 or the DL850.
• SaveWVF.vi. This VI sends a GPIB command to the DL750/DL850 to saverecorded waveforms into a CSV-file and store it into the hard drive. The nameof the CSV-file is defined as the input parameter.
• DL750FTP v3.vi. This VI retrieves a CSV-file from the hard drive of theDL750/DL850 via Ethernet using FTP. The path of the CSV-file and IP ad-dress of the DL750/DL850 is defined as the input parameters.
48
3.5 Results
The experimentation resulted a functional prototype executing the efficiency testautomatically. The prototype can be used only for indicative measurement of UPS’efficiency because it does not fulfil the requirements set by the UPS standard. Atleast the measurement of input voltage harmonics and THD, and assessment ofmeasurement uncertainty is needed to fulfil the requirements.
Via making the prototype and examining the DOP test, interfaces between thefollowing equipment were experimented:
• PC - WT1600• PC - WT230• PC - DL750• PC - DL850• PC - UPS• PC - Load and supply control system
These experimented interfaces will be useful in the future testing. However, somework is still required to integrate these interfaces as a part of another test.
The examination of the DOP test resulted a test process description. However,automating the DOP test was found to consume more time and efforts than wouldbe saved through automation and thus it is not valuable.
The experimentation proved that automating even one type test requires a lotof time and resources. Due to this, an ATS for type test is not the best solution forreducing time and resources consumed by testing.
49
4 Conclusions and Future Work
The aim of this thesis was to clarify the need for the automatic test system for typetests of the UPS, and clarify the requirements needed to realize it. The ATS wasconsidered as a solution to reduce time and resources consumed by testing processesmade in Eaton Power Quality Oy’s product development department.
In Chapter 2, an automatic test system was reviewed based on the descriptionsof earlier publications. A basic element of an ATS was introduced and comparedagainst to the developed prototype.
Preliminary requirements for the ATS, as specified before starting the thesisproject, were also reviewed. The prototype was then based on these requirements.However, the requirements were treated more as a guide than being strictly followed.
The life cycle of the ATS was reviewed, along with three methods helping toextend this life cycle. The motivation behind this was that the previous ATS wasobsolete and discarded as it was unused by employees, and also neither documentsnor instructions existed on how to use it. The earlier ATS lacked a life cycle manage-ment plan and when the engineer who developed the system left from the companythe system was not maintained any more.
UPS and IEC standards, concerning the UPS, were introduced. The chosen typetests, the efficiency test and the dynamic output performance test, were reviewed. Atthe end of the Chapter, Eaton Corporation and its product development departmentin Finland was introduced.
The experimentation made for clarifying the need for the ATS and the require-ments necessary to realize it were presented in Chapter 3. This was done throughthe prototype described in the Chapter, and also the development process of theprototype was described.
Additionally, a closer examination of the dynamic output performance test wasmade. Furthermore, the experiment conducted to automate the test resulted ina conclusion that it is not sensible to automate the test. However, as a result ofthe experiment an interface between a PC and the DL750 (and the DL850) wasattempted and LabVIEW programs were made for transferring and receiving databetween them.
Completed reviews and the experimentation conducted lead to a conclusion thatthe realization of an automatic test system that is able to perform all the type tests,requires a large amount of time and resources. Due to this, the automatic test systemfor type tests is not considered as the best solution to reduce the time and resourcesconsumed by testing. However, this does not mean that the work completed was invain. Performing an efficiency test with the prototype is now faster than executingit manually. Although the prototype cannot be used to perform an official efficiencytest for the UPS, it is still valuable in indicative tests. The prototype cart works asa definitive place for equipment and tools used in different tests. The rack PC in thecart can be used for developing LabVIEW programs and TestStand test sequences,and executing other utility software that help in UPS testing processes. Documentsrelated to testing, such as test results and test instructions, can be stored on thePC.

50
The thesis meets the initial aim well. However, the aim has changed during theproject significantly. At the beginning of the project, the aim of the thesis was tomake a TestStand test sequence for each of the electrical type tests. However, thiswas soon found to be too large of a task for the thesis and the work was then limitedto two type tests. The new aim was to make an ATS able to perform the efficiencytest and the DOP test. However, as mentioned before automating the DOP test isnot sensible. Due to this, the whole ATS for the type tests beginning to appear astoo large of a project to be beneficial realized at all. This resulted in changing theaim of the thesis to what is seen in its final form. The unsuccessful specification ofthe aim in the beginning of the thesis project resulted in extended writing processfor the thesis.
Questioning the need of the ATS resulted in the examination of other solutionsto the initial problem. In the following section, suggestions for future developmentand scenarios are discussed.
Future Development
The conclusion that it is not beneficial to realize the ATS for type tests led toother suggestions to solve the initial problem. Besides the type tests it would be morebeneficial to automate a regression DVT test for the new UPS under development.The test consists of basic actions such as commanding the UPS on and off, andswitching utility on and off. These actions can be automated with little effort. Theregression DVT test is performed each time than a new firmware version is releasedto the UPS to check that the UPS’ basic functionality has remained intact.
It would also be beneficial to consider the possibility to automate or assist per-formance of forthcoming design verification and design validation tests for the newUPS. The tests include most typical tests for the UPS and thus would save time ifautomated. Each test should be documented, and if possible make a step-by-stepinstruction of how the test is performed.
For better exploitation of the prototype, the storing of measurement data to anExcel spreadsheet should be improved. Currently, the data is stored to an Excelspreadsheet in the end of the efficiency test sequence. The data is lost if the executionof the test sequence is stopped for some reason. A better solution is to write thedata to the Excel spreadsheet right after it is received from a measurement device.The action of receiving data from a measurement device and storing it to an Excelspreadsheet is one of the most common actions and thus it must be improved sucha level that anyone involved in the product’s development can do it.
Through the making of LabVIEW VIs for the prototype, it was found thatLabVIEW is a handy tool for making small utilities aiding in different test processes.For better management of the utility software development, a software versioningand a revision control system should be used and its structure should be determined.Also, a common programming style should be agreed upon before developing a newLabVIEW programs. NI provides best practises for TestStand [43], [44] and Labview[45], [46] programming.
51
A life cycle management process should be considered in case of each equipmentuse in test processes including the prototype, measurement devices, assistance tools,and utility software. The methods described in Section 2.3 can help in this task. Onepractise for managing life cycles is to organize a team responsible for developing andmanaging the equipment. The team should use an issue tracking system for bettermanagement of issues in the testing processes. The Atlassian JIRA [47], which isalready used in other projects in the product development department, could beused also for this purpose.
These aforementioned concrete suggestions should be taken into considerationwhen deciding upon a next objective for resolving the initial problem by improvingthe testing processes.

52
References
[1] Eaton Corporation. ”The Nine Power Problems”, Internet:www.switchon.eaton.com/resources/power-101/nine-power-problems.aspx,2011 [Nov. 12, 2011].
[2] Cooper, R.G. Winning at New Products: Creating Value Through Innovation.4th ed., Basic Books, 2011, ISBN: 0465025781.
[3] International Electrotechnical Commission. ”IEC 62040-3 Uninterruptiblepower systems (UPS) - Part 3: Method of Specifying the Performance andTest Requirements.” IEC Standard 62040-3/Ed.2, Mar. 14, 2011.
[4] Kokkonen, P. ”UPSin tyyppitestauksen automatisointi.” B.Sc. thesis, Espoo -Vantaa University of Applied Sciences, Espoo, Finland, 1997.
[5] Greenspan, A.M. ”Automatic Test Systems Dedicated or Integrated.” IEEETransactions on Instrumentation and Measurement, vol. IM-20, no. 4, pp. 191-198, Nov. 1971.
[6] Bakshi, U.A., Bakshi, A.V. Electronic Instrumentation. Technical Publications,2009, 492p, ISBN: 8184314469
[7] Mendes L.A., Back N. and Oliveira G.H.C. Designing Automated Test Sys-tems: An Adapted Methodology Inspired on Pahl and Beitz’s Systematic Ap-proach. Mechatronics Engineering Department, Pontifical Catholic Universityof Parana, Curitiba, PR 81611-970, Brazil, DOI: 10.1016/j.rcim.2009.04.006,2009.
[8] Flynn, M.J. ”Regression Analysis of Automatic Measurement Systems.” D.S.dissertation, George Washington University, USA, 2009.
[9] Josifovska, S. ”The Father of LabView.” IEE Review, Vol. 49, no. 9, pp. 30-33,Sept. 2003.
[10] National Instruments Corporation. ”The Benefits of Programming Graph-ically in NI LabVIEW.” Internet: www.ni.com/labview/whatis/graphical-programming/, 2012 [Jan. 30, 2012].
[11] Mackin, S. ”A test Engineer’s Evaluation of Graphical Programming”.Internet: http://www.home.agilent.com/agilent/editorial.jspx?cc=IN&lc=eng&ckey=1000001168:epsg:tcn&nid=-536900139.0.00&id=1000001168:epsg:tcn,[Jan. 30, 2012]
[12] Agilent Technologies. ”Agilent VEE 9.3 Brochure.” Internet:http://cp.literature.agilent.com/litweb/pdf/5989-9833EN.pdf, Oct. 27, 2011[Mar. 12, 2012].
53
[13] Agilent Technologies. ”HP VEE 5.0 Brochure.” Internet:http://www.home.agilent.com/upload/cmc upload/All/EPSG086072.pdf?&cc=NL&lc=dut, Apr. 1998 [Mar. 12, 2012].
[14] National Instruments Corporation. ”NI TestStand: TestStand 2010 EvaluationGuide.” Internet: www.ni.com/pdf/manuals/350863g.pdf, Oct. 2010 [Jan. 31,2012].
[15] National Instruments Corporation. ”TestStand Benefits.” Internet:zone.ni.com/devzone/cda/tut/p/id/4914, May 24, 2010 [Jan. 31, 2012].
[16] Yokogawa Electric Corporation. ”WT210/WT230 Digital Power Meter User’sManual.” 2009.
[17] Yokogawa Electric Corporation. ”WT1600 Digital Power Meter User’s Manual.”2009.
[18] Yokogawa Electric Corporation. ”DL750 Digital Power Meter User’s Manual.”2009.
[19] ICS Electronics. ”GPIB 101 - A Tutorial About the GPIB Bus.” Internet:http://www.icselect.com/pdfs/ab48 11.pdf, Oct. 12, 2009 [Feb. 26, 2012].
[20] Sethunadh, R. ”Using New Instrument Interface Standards to Increase Auto-matic Test System Performance.” Autotestcon, IEEE, pp. 677-682, 26-29 Sept.2005. doi: 10.1109/AUTEST.2005.1609216.
[21] Spurgeon, C.E. Ethernet: the definitive guide, O’Reilly Media Inc., 498 pages,2000, ISBN: 1565926609.
[22] Eaton Corporation. ”X-format Communications Protocol (XCP) Specifica-tion.” Internal document of Eaton Corporation, Rev. C, 2001.
[23] Eaton Corporation. XCP Protocol Development Suite. Internal document ofEaton Corporation, Rev. D0, 2005.
[24] Eaton Corporation. ”MX: Insturctions for Modifying a 9395 so that It Maybe Used as an Adjustable Power Supply.” Internal document of Eaton PowerQuality Oy. Document name: MX v3.pdf, 2008.
[25] Eaton Corporation. ”Factory Acceptance Testing, Future Facilitates and GreenLoad Concept.” Internal document of Eaton Power Quality Oy. Documentname: HPO Test Floor - Green (Electronic) Load -Rev B.ppt. 15 Oct. 2008.
[26] Eaton Power Quality Oy. ”Presentation: UPS Factory in Finland.” Internaldocument of Eaton Power Quality Oy, Company’s Intranet: /Yritysesityk-set/EatonHPOfinal10112011.ppt, Nov. 10, 2011 [Jan. 13, 2012].
54
[27] Rask, S. ”System Requirement Specification (SRS): Data Acquisition and Au-tomated Test Systems: NPI/LSG.” Internal document of Eaton Power QualityOy, 2010.
[28] Liosis, A.C. ”A Prime Contractor’s Perspective on Total ATS Developmentand Life Cycle Cost (LCC) Support Responsibility.” Autotestcon Proceedings,IEEE Systems Readiness Technology Conference, pp.313-318, 2001.
[29] Calhoun, C.C. ”Applying Independent Verification and Validation to the Au-tomatic Test Equipment Life Cycle.” Aerospace and Electronic Systems Mag-azine, IEEE, vol. 13, no. 7, pp.37-42, Jul., 1998.
[30] Dustin, E., Rashka, J., Paul, J. Automated Software Testing: Introduction,Management, and Performance. Addison-Wesley Professional, pp. 7-14, 1999,ISBN: 9780201432879.
[31] Kusko, A., Thompson, M.T. Power Quality on Electrical Systems, McGraw-HillProfessional Publishing, Blacklick, OH, USA, 05/2007, ISBN: 9780071470759.
[32] Emadi, A., Nasiri, A., Bekiarov, S.B. Uninterruptible Power Supplies and ActiveFilters. CRC Press, 2005, ISBN: 9780849330353.
[33] Eaton Corporation. ”Eaton 9395 225-110 kVA Brochure.” Inter-net: http://powerquality.eaton.com/Products-services/Backup-Power-UPS/9395.aspx?cx=79, 2011 [Sept. 27, 2011].
[34] Eaton Corporation. ”Eaton Protection Station Datasheet.” Inter-net: http://powerquality.eaton.com/Products-services/Backup-Power-UPS/Protection-Station.aspx?cx=79, 2011 [Sept. 27, 2011]
[35] Eaton Corporation. ”Eaton 9395 UPS, 225-275 kVA / 300kVAPF0.8: User’sand Installation Guide.” Internet: http://powerquality.eaton.com/Products-services/Backup-Power-UPS/9395.aspx?cx=79, 2011 [Feb. 21, 2012].
[36] International Electrotechnical Commission. ”Information About Standars forGeneral Public.” Internet: http://www.iec.ch/perspectives/general public/,2012 [Jan. 7, 2012].
[37] International Electrotechnical Commission. ”IEC 62040-1: UninterruptiblePower Systems (UPS) - Part 1: General and Safety Requirements for UPS.”IEC Standard 62040-1/Ed.1, June 11, 2008.
[38] International Electrotechnical Commission. ”IEC 62040-2: UninterruptiblePower Systems (UPS) - Part 2: Electromagnetic Compatibility (EMC) Re-quirements.” IEC Standard 62040-2/Ed.2, Oct. 19, 2005.
[39] Uusitalo, J. ”UPS Output Dynamic Performance Evaluation Tool, Ver 1.04.”Internal document of Eaton Power Quality Oy. Document name: UPS OutputDynamic Performance Evaluation Tool.pdf. Apr. 27, 2011.

55
[40] Information Technology Industry Council. ”ITI (CBEMA) Curve ApplicationNote.” Internet: http://www.itic.org/clientuploads/Oct2000Curve.pdf, 2005[Mar. 15, 2012].
[41] Eaton Corporation. ”Our Company.”Internet: www.eaton.com/Eaton/OurCompany/index.htm, 2012 [Feb. 6, 2012].
[42] Karola R. ”Presentation: NPI Engineering”. Internal document of Eaton PowerQuality Oy, Company’s Intranet: /Perehdytys/NPI.ppt, Feb. 5, 2008 [Jan. 13,2012].
[43] National Instruments Corporation. ”About the TestStand Process Models.”Internet: http://zone.ni.com/devzone/cda/tut/p/id/2694, Sept. 6, 2006 [Feb.26, 2012].
[44] National Instruments Corporation. ”Best Practices for NI Test-Stand Process Model Development and Customization.” Internet:http://zone.ni.com/devzone/cda/tut/p/id/7958, Sept. 26, 2008 [Feb. 26,2012].
[45] National Instruments Corporation. ”Software Engineering with LabVIEW.” In-ternet: http://zone.ni.com/devzone/cda/tut/p/id/7117, May 2, 2011 [Feb. 26,2012].
[46] National Instruments Corporation. ”Best Practices for ManagingNI LabVIEW Applications Using the Project Explorer.” Internet:http://zone.ni.com/devzone/cda/tut/p/id/7197, Dec. 6, 2011 [Feb. 26,2012].
[47] Atlassian Corporation. ”JIRA Project Tracking Tool Overview.” Internet:http://www.atlassian.com/software/jira/overview, 2012 [Feb. 26, 2012].

56
Appendices
A Efficiency Test Wiring Diagram
Figure A1: Efficiency test wiring diagram.
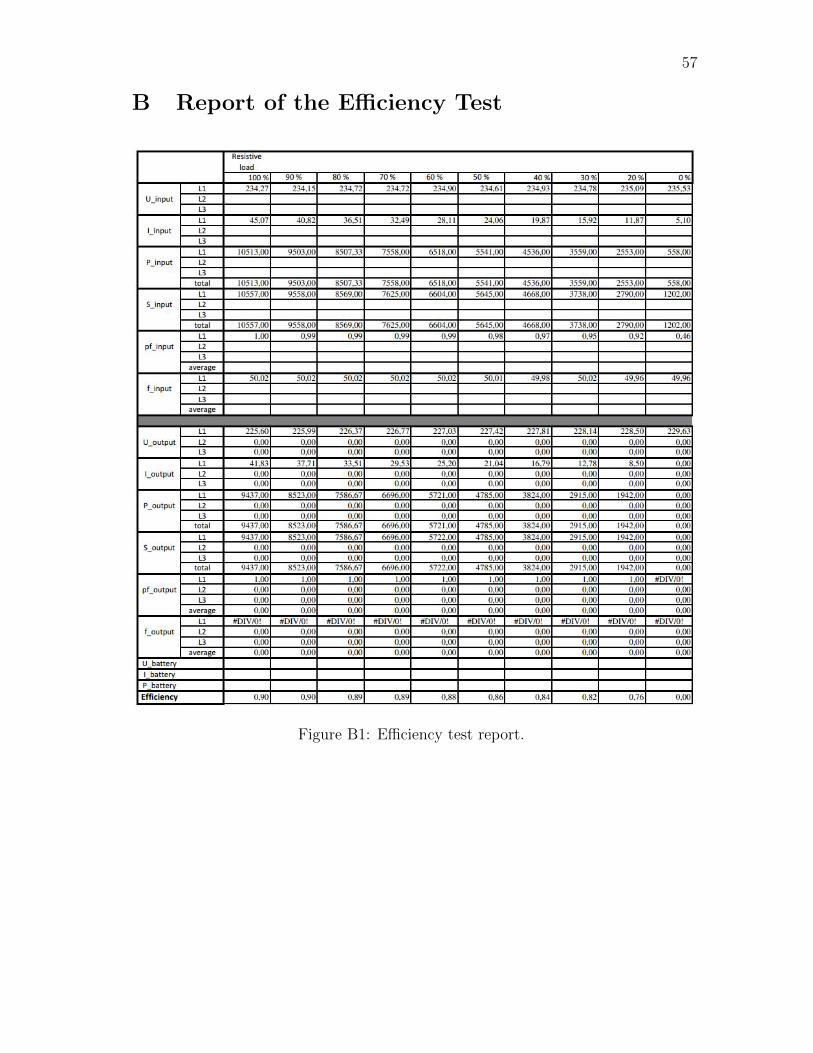
57
B Report of the Efficiency Test
Figure B1: Efficiency test report.

58
C Virtual Instruments
Figure C1: ATS virtual instruments.
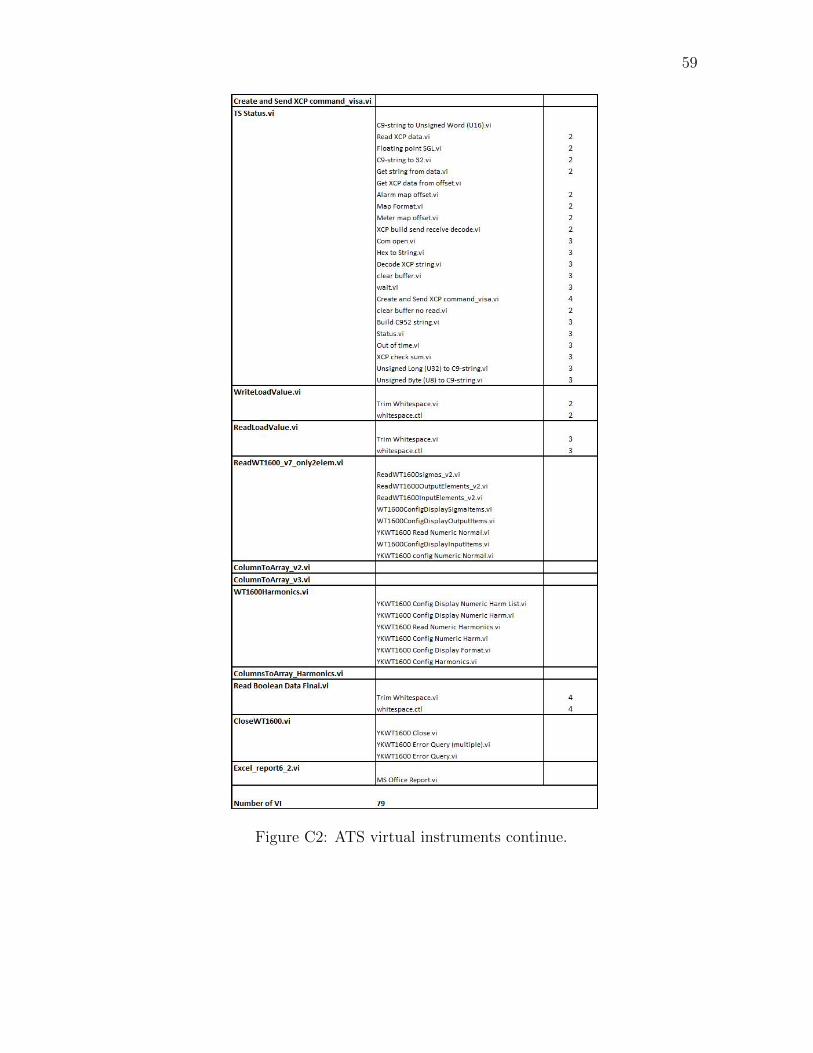
59
Figure C2: ATS virtual instruments continue.