automatic indoor 3d surface reconstruction with … · automatic indoor 3d surface reconstruction...
TRANSCRIPT

Automatic Indoor 3D Surface Reconstruction with Segmented Building andObject Elements
Eric Turner and Avideh ZakhorUniversity of California Berkeley
Berkeley, CA 94720{elturner,avz}@eecs.berkeley.edu
Abstract
Automatic generation of 3D indoor building models isimportant for applications in augmented and virtual reality,indoor navigation, and building simulation software. Thispaper presents a method to generate high-detail watertightmodels from laser range data taken by an ambulatory scan-ning device. Our approach can be used to segment the per-manent structure of the building from the objects within thebuilding. We use distinct techniques to mesh the buildingstructure and the objects to efficiently represent large pla-nar surfaces, such as walls and floors, while still preserv-ing the fine detail of segmented objects, such as furnitureor light fixtures. Our approach is scalable enough to beapplied on large models composed of several dozen rooms,spanning over 14,000 square feet. We experimentally verifythis method on several datasets from diverse building envi-ronments.
1. Introduction
The ability to automatically and rapidly generate a meshof building surfaces is important to many fields, such asaugmented and virtual reality, gaming, simulation, archi-tecture, engineering, construction, and emergency responseservices. In this paper, our goal is to generate information-rich virtual models of indoor building environments. Thesemodels contain 3D geometry for the interior surfaces ofbuildings, including both large-scale building surfaces andsmall-scale features such as furniture.
We aim to improve on existing methods by combin-ing two fundamentally different surface reconstruction tech-niques for building environments. We first generate a fullydetailed volumetric model of the environment. We thencombine this model with a highly simplified representationof the same building, which only contains geometry for thefloors, walls, and ceilings of the model. This combinationallows us to segment volumetric representations of the in-
terior objects in the environment, such as furniture or lightfixtures, from the permanent surfaces of the building. Wegenerate accurate, watertight models of objects in the build-ing distinct from the building model itself, as demonstratedin Figure 1. Figure 1a shows a photograph of the scannedenvironment. Figure 1b shows an octree representation ofthe complex environment geometry. We use this representa-tion to produce a rich model of the environment, as shown inFigure 1c. The objects of the environment, shown in white,are separated from the building structure, as shown in Fig-ure 1d. We use different meshing techniques for the objectsand the building itself to ensure the best representation ofeach type of surface. The result is a rich model of the en-vironment that represents a whole building based on level,room, or individual objects.
The input scans for our modeling approach come froman ambulatory indoor scanning system [4]. By walkingthrough the indoor environment at normal speeds, we canaccurately estimate the trajectory of the system over timeand localize the system [5]. Subsequently, we automaticallygenerate a 3D model of the environment with the methoddescribed in this paper. This procedure allows us to rapidlymove through a large environment, spending only a few sec-onds in each room yet capturing full geometry information.Since our system is mobile and ambulatory, the resultingpoint clouds have higher noise than traditional static scan-ners due to natural variability in human gait. As such, ourapproach needs to be robust to motion induced scan-levelnoise and its associated artifacts. We use these scans to forma watertight model of the indoor building environment andthe contained objects.
The ability to identify and separate the objects withina model from the rest of the building geometry enables aricher representation of the architecture. Floors, walls, andceilings tend to be large, planar, and can be meshed effi-ciently with few triangles. Furniture and other objects inthe building tend to have high detail and are often more or-ganic in shape. Thus, it is desirable to mesh these objectswith a surface reconstruction scheme that preserves this de-
1

(a) (b) (c) (d)
Figure 1: An area modeled by our technique: (a) a photo of the room; (b) the volumetric boundary of room; (c) final meshwith room and objects modeled; (d) final mesh of room only, colored by planar region.
tail. Not only do we use separate meshing techniques foreach part of the model, but also we represent the geometryof objects in the environment at a finer resolution than thebuilding surfaces, saving on processing and memory.
This paper is organized as follows: Section 2 providesbackground information on existing approaches to buildingmodeling. Section 3 discusses the details of each step of ourapproach. Section 4 shows results of our method applied toa variety of building environments, and Section 5 concludesby highlighting the important aspects of our algorithm.
2. Related Work
Many existing building meshing approaches simplify theoutput model by representing only the primary building sur-faces, such as floors, walls, and ceilings [6, 24]. Severaltechniques first generate 2D floor plans that can be extrudedinto simple 3D models [1, 16, 22]. These approaches allowfor accurate wall geometry and reduce the complexity of theoutput model. Extruded floor plans also allow for models toexplicitly define floors, walls, and ceiling surfaces.
There are several alternate approaches that attempt tocapture full geometry detail of the area scanned [3, 8, 14,21]. These methods include detail of all objects from thescene, not just the primary building elements. Kinect Fu-sion is an especially popular method [18, 23, 25]. Thismethod represents a model with voxel data using a Trun-cated Signed Distance Function (TSDF) to generate a meshusing Marching Cubes [13]. In this paper we use a proba-bilistic field function on octrees, similar to [7, 9], to repre-sent our volumetric model. Our hardware system uses 2Dtime-of-flight (TOF) lasers to produce much sparser pointclouds than Kinect-based scanning, so it is not feasible toemploy the same averaging techniques that allow for high-quality Kinect scans. The advantage of these 2D TOF sen-sors is that they are less noisy, have a longer range, and awider field of view. The result is that much larger environ-ments can be covered in significantly less time when usingthese sensors in a sweeping motion [20]. For instance, abackpack-mounted ambulatory system allows an unskilledoperator to rapidly walk through an environment to acquire
data, spending only a few seconds in each room, whereasKinect-based approaches require several minutes per room.
Another important meshing technique is to detect andclassify objects in laser scans [2]. Understanding the se-mantics of a scene enables more sophisticated modeling ofdetected objects. Many existing techniques segment ob-jects in the environment by explicitly detecting furnituregeometry in the scanned data, matching that geometry toa database of known shapes, and retrieving template geom-etry for the detected item [11, 17]. This approach produceshigh-quality meshes, since each exported object is repre-sented by a hand-modeled template, but can yield incor-rect representations of unknown or unusual objects, whichcan occur when scanning especially complex scenes or ifan object is in an unexpected orientation. In Section 4, weshow scans of medical equipment in Figure 8 that wouldnot likely pre-exist in shape databases. Recently, objectdetection methods from indoor scans have been proposedwithout the use of training data [15]. Even though this ap-proach can be applied to large datasets it assumes very basicbuilding geometry to segment objects, can only detects ob-jects of certain complexity, is unable to detect very smallobjects, and requires objects to be repeated often in the en-vironment. We expand on this work by segmenting objectsvolumetrically, rather than in the point cloud domain.
3. Approach
Our proposed method takes scan data from a set of lasersensors as input. We model the uncertainty of the posi-tions of these input scans from a variety of possible noisesources to identify the observed volume likely to be part ofthe model. We use a volumetric approach to preserve modeldetail in the presence of noise, where each point in spacehas some probability of being interior or exterior. We de-fine interior space to be empty or open area that range scanscan pass through. We define exterior space to be solid ma-terial in the environment, including furniture and buildingstructure. We store this volumetric labeling in an octree.
The primary goal of our approach is to use this volumet-ric information to form two watertight meshes of the envi-

\ +
Octree
2.5D Model Building Volume
Object Volume
Mesh
Figure 2: The scanned volume is meshed using two ap-proaches that are combined to separate room geometry andobject geometry. The complex geometry from the octree(upper left, in red) and the simple geometry from the 2.5Dmodel (lower left, in blue) are combined to extract the ob-ject volume (upper center, in green) and the building volume(lower center, in grey). These volumes are meshed sepa-rately and exported (right, in black).
ronment. The first mesh only represents the building geom-etry, including floors, walls, ceilings, windows, and doors.The second mesh represents the objects in the environmentsuch as furniture, light fixtures, or other items. The blockdiagram of our segmentation method is shown in Figure 2.We first generate two representations of the same environ-ment. The populated octree represents a complex model ofthe volume, as shown by the red graphic in the upper-left ofFigure 2. We then generate a simplified 2.5D model of thesame volume, as shown by the blue graphic in the lower-leftof Figure 2. This simplified model is obtained by first gen-erating a 2D floor plan of the scanned area, then extrudingthe floor plan to form a 2.5D volumetric model that does notrepresent any interior objects.
We perform a volumetric set difference between thesetwo models, keeping the volume that is labeled exterior bythe octree and interior by the extruded floor plan. This vol-ume represents the objects in the environment and is shownas the green graphic in the upper-center of Figure 2. Simi-larly, we can denote the union of the interior space of bothmodels to be the building geometry, as shown in the lower-center of Figure 2. The object geometry is refined andmeshed uniformly to preserve its fine structure. The build-ing geometry is split into planar surfaces and each surfaceis triangulated efficiently, preserving the sharp corners be-tween floors, walls, and ceilings. These two meshes formthe whole environment, shown by the graphic at the right-side of Figure 2. This approach has the added benefit ofmodeling hidden surfaces, such as the backs of furniture orareas of walls occluded by objects.
In Section 3.1, we discuss how we probabilisticallymodel the input scans. In Section 3.2, we describe howthese scans are efficiently combined to generate a unifiedoccupancy estimate for the entire scan volume. In Sec-tion 3.3, we detail how the octree is used to produce a sim-plified building model by first generating a 2D floor planand then extruding the floor plan into a 2.5D mesh. In Sec-
(a)
(b)
Figure 3: Example carve mapping: (a) the spatial distri-bution of sensor location and scan-point positions; (b) thecomputed carve mapping, indicating the areas estimated tobe interior and exterior based on this scan.
tion 3.4, we discuss how the complex model and the simpli-fied 2.5D extruded floor plan model are merged to segmentthe volume delineating objects such as furniture in the en-vironment. Lastly, in Section 3.5, we document how wegenerate two types of watertight surfaces, one for the ob-jects in the environment and the other for the building con-structs. Each of these surface reconstruction techniques aregeared to efficiently characterized their respective parts ofthe building.
3.1. Scan Preprocessing
In this section, our goal is to convert the input set oflaser scan points into a labeling of space where each lo-cation ~x ∈ R3 is assigned a likelihood of being interioror exterior. First, we form a probabilistic model of eachscan point’s position, coupled with the position of the orig-inating sensor. Second, we use this probability model toestimate the scan point’s vote for the interior likelihood ofeach location in space intersected by its scan ray. Once weobtain these estimates for each scan point, we generate anoccupancy model of the entire scanned environment, as dis-cussed in Section 3.2.
First, we compute an estimate of the 3D positions foreach scan point and the point’s originating sensor. Thesevalues are represented as two 3D Gaussian distributions.For each input scan, the sensor position is represented byGaussian N(µs, Cs) and the scan point position is repre-sented by N(µp, Cp). For tractability, assume scan frame’sdistribution is independent from the position of other scanframes. An example of this sensor/scan-point configuration
is given in Figure 3a.The uncertainty in the position values of each scan point
originate from three independent sources of error: the lo-calization estimate, the timestamp synchronization, and in-trinsic sensor noise. Localization noise arises from errors inthe estimate of the system trajectory, as detailed in [5], andis by far the largest source of error, with typical standarddeviations on the order of 20 cm.
Timestamp synchronization errors are due to our sys-tem combining measurements from several sensors, whosetimestamps need to be transformed to a common clock.Mis-synchronization of timestamps can contribute spatialerrors of scan points, especially when the system is movingor rotating rapidly while scanning distant objects. In thesecases, an estimate of the scan point’s position changes de-pending on our estimate of when a scan is taken. However,since our sensors are synchronized to an accuracy of ap-proximately 1 ms, synchronization error is usually the low-est source of noise in the scan points, contributing uncer-tainty to scan point positions of under 1 cm.
The third source of noise depends on the sensor hard-ware. Our system uses Hokuyo UTM-30LX sensors, whoseintrinsic noise characterization is given in [19]. Typicallythis noise contributes on the order of 1 to 2 cm to the stan-dard deviation of the positional estimate of scan points. Thisuncertainty value increases as the range of the point in-creases, with accurate measurements stopping at a range of30 m.
The covariance matrices associated with each of thesethree sources of noise can be added to determine the netuncertainty for the positions of each sensor/scan-point pair.The uncertainties for the positions of each sensor and scan-point are represented with covariances Cs and Cp respec-tively. Next, we use this estimate for each scan point to forma “carve mapping” p(~x) : R3 7→ [0, 1], which describes thelikelihood of any location ~x ∈ R3 of being interior or exte-rior based on the position estimates from a scan point. Wedefine p(~x) as
p(~x) = Fs(x‖) f⊥(x⊥) (1− Fp(x‖)) + 0.5(1− f⊥(x⊥)) (1)
where Fs(.), Fp(.), and f⊥(.) represent one-dimensionalmarginal distributions derived from the scan ray model, asdescribed below. We split a location ~x = ~x‖+~x⊥, as shownFigure 3b, where ‖~x‖‖ is the distance along the length ofthe scan ray, and ‖~x⊥‖ is the distance orthogonal to thescan ray. This decomposition allows us to weigh the in-fluence of the scan ray on our estimate p(~x) so representa fall-off as ‖~x⊥‖ increases. Fs(x‖) is the marginal one-dimensional (1D) Cumulative Distribution Function (CDF)of the sensor position’s distribution along the length of thescan ray, derived from the Gaussian distribution of the sen-sor position. Similarly, Fp(x‖) is the marginal CDF of thescan-point position’s distribution along the length of the ray.
Lastly, f⊥(x⊥) is the 1D Probability Mass Function (PMF)of the lateral position of the scan ray.
The combination of these values in Equation 1 yields themapping shown in Figure 3b. Values in blue are less than0.5, indicating a likelihood of a location being exterior. Asshown, these values occur just past the scan position. Val-ues in red are greater than 0.5, indicating a likelihood ofa location being interior. As the query location ~x movesaway from the scan ray and ‖~x⊥‖ increases, then p(~x) ap-proaches 0.5, indicating unknown state. In the next section,we discuss how the estimates from all input scans are usedto generate a model of the entire environment.
3.2. Carving
Given a carve mapping function for each scan pointtaken during the data acquisition process, we merge all thescans spatially to obtain a fused probabilistic estimate pf (~x)for any point ~x ∈ R3. The value pf (~x) is computed as themaximum-likelihood estimate based on all nearby scans,where any scan whose mean scan-line position is more than3 standard deviations away from ~x does not contribute tothe estimated value at pf (~x). The final result for the spatiallabeling of R3 is stored in an octree. The advantage of theoctree is that every point in space can be represented, butcertain areas can have finer detail than others.
The leaf nodes of the octree contain the compiled prob-abilistic model of the degree to which that node is labeledas interior or exterior. Each leaf node L contains the fusedvalue of pf (~x) for all ~x ∈ L, variance of the samples ofp(~x) from each intersecting scan ray, and the of number ofscans that intersect L. All these statistics are used later inthe pipeline for analyzing the properties of L. As an exam-ple, if pf (~x) is 0.5 or less, then the node is considered exte-rior. Nodes that are never intersected by scans are assumedto be exterior and are assigned a value of pf (~x) = 0.5. Ifthe value of pf (~x) is strictly greater than 0.5, then the nodeis considered interior. The faces between interior nodesand exterior nodes are considered boundary faces of the oc-tree, and are useful for determining the position of gener-ated meshes. As we discuss in Section 3.5, the position ofthe mesh between two such nodes is placed to sub-voxelaccuracy using our estimates of pf (~x) for each node.
We typically use a leaf resolution of 5–10 cm, but thefinal tree is only stored at full depth in the locations that re-quire it, which are boundaries between interior and exteriorspaces. As we discuss in Section 3.4, areas of the environ-ment that are segmented as objects in each room will bere-carved to an even finer resolution, typically 1 cm or less,since these locations are likely to contain high detail.
3.3. Simplified Model Generation
In this section, we describe how we use the populatedoctree from Section 3.2 to generate a simplified model that
(a) (b)
(c) (d)
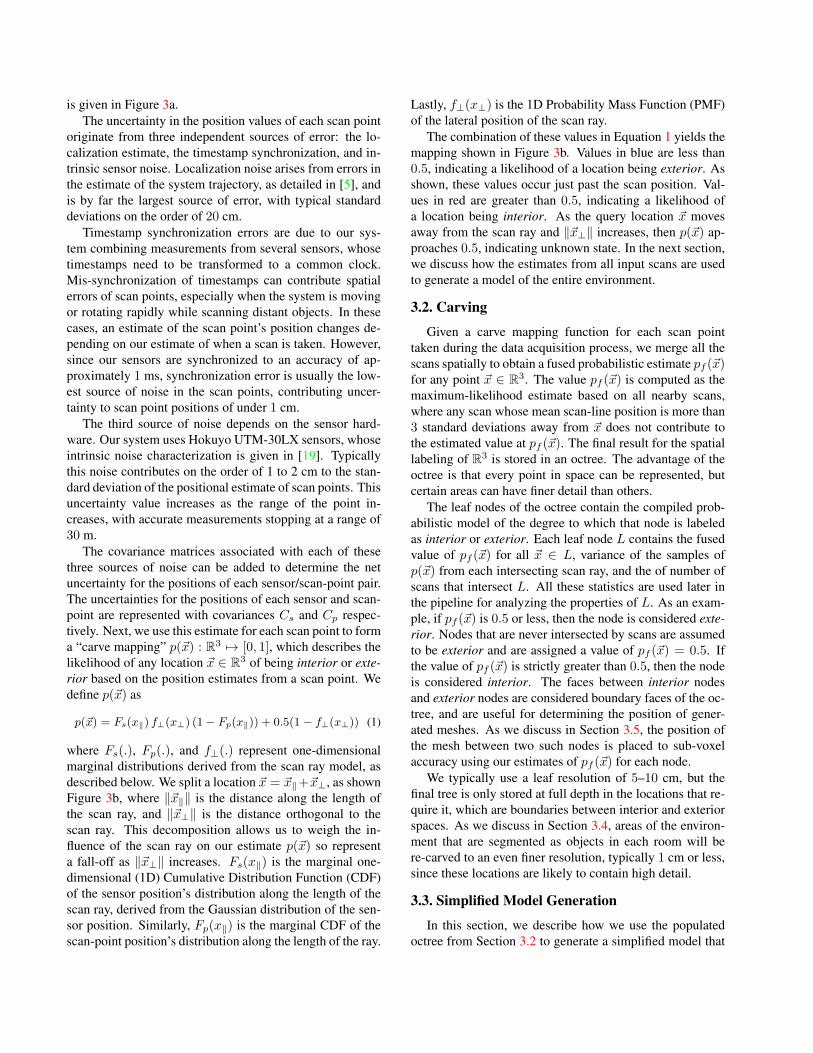
Figure 4: Generating wall samples from an octree: (a) ini-tialize regions on the octnodes’ boundary faces; (b) performregion growing to form large planar regions; (c) filter outwall regions; (d) generate points along planar regions tomake wall samples.
only represents the primary building structure. We use anexisting technique that produces a 2D floor plan of the envi-ronment and extrudes a 2.5D model using the height infor-mation of each room [22]. We first need to generate a set ofwall samples in the environment, which are a set of pointsin 2D space that are locations with high likelihood of beingwall positions. This set of points is used by the 2D floorplan generation procedure as input data [22]. In prior work,these wall samples are generated by sampling a 3D pointcloud of the environment. In this paper, we use the volu-metric octree model to generate wall samples. We show thatthis approach not only produces a floor plan better alignedwith the complex geometry of the octree, but also one thatis less affected by clutter, such as furniture, than when usingthe point cloud directly to generate the floor plan.
The first step of generating wall samples from the octreeis to identify large planar surfaces. We cluster the bound-ary faces of the octree into planar regions that represent allsurfaces in the model as flat, planar structures. Figure 4ashows the initial boundary regions of a model, with eachinitial region depicted as a separate color. These regionsare formed bottom-up by iteratively consolidating bound-ary node faces into regions via Principal Component Anal-ysis (PCA) of boundary face positions, using the processdescribed by [21]. This step produces a single planar regionfor each dominant surface of the model, as shown in Fig-ure 4b. We then filter the regions based, keeping only thesurfaces that are within 5◦ of vertical and at least 1 m tall,as shown in Figure 4c. The output regions have gaps corre-sponding to the portion of the walls hidden behind any fur-niture in the model. To counteract these occlusions, we ex-
(a) (b)
(c) (d)
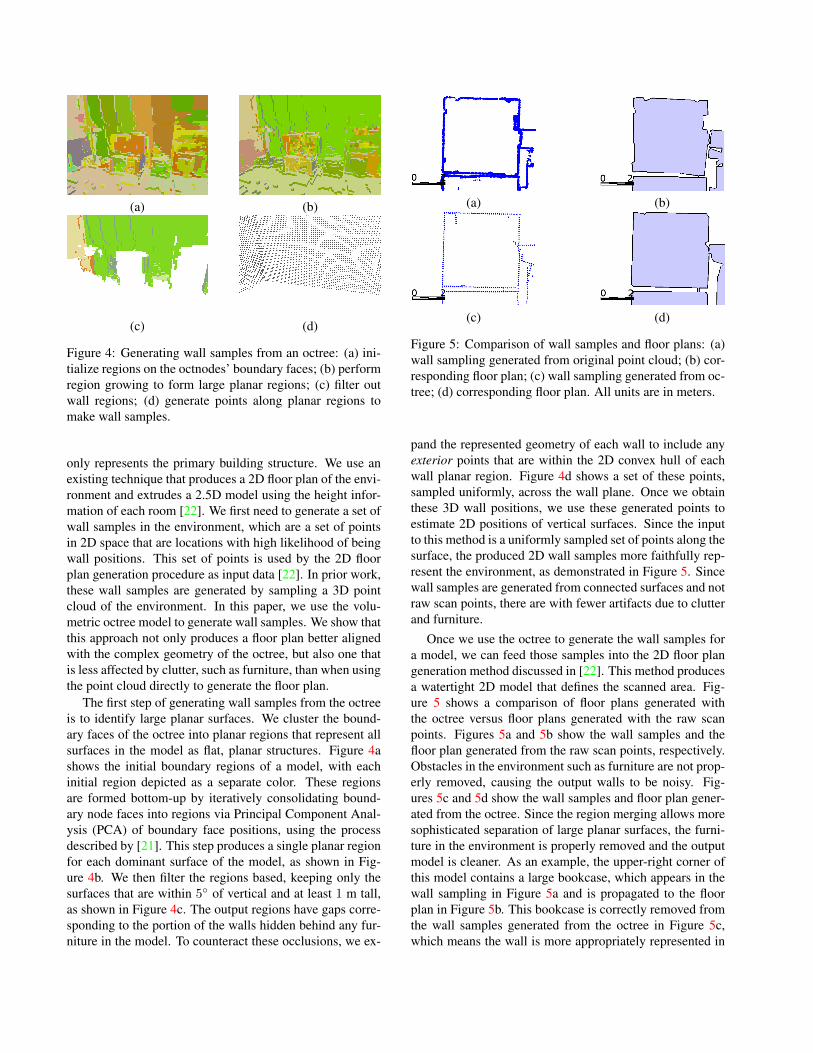
Figure 5: Comparison of wall samples and floor plans: (a)wall sampling generated from original point cloud; (b) cor-responding floor plan; (c) wall sampling generated from oc-tree; (d) corresponding floor plan. All units are in meters.
pand the represented geometry of each wall to include anyexterior points that are within the 2D convex hull of eachwall planar region. Figure 4d shows a set of these points,sampled uniformly, across the wall plane. Once we obtainthese 3D wall positions, we use these generated points toestimate 2D positions of vertical surfaces. Since the inputto this method is a uniformly sampled set of points along thesurface, the produced 2D wall samples more faithfully rep-resent the environment, as demonstrated in Figure 5. Sincewall samples are generated from connected surfaces and notraw scan points, there are with fewer artifacts due to clutterand furniture.
Once we use the octree to generate the wall samples fora model, we can feed those samples into the 2D floor plangeneration method discussed in [22]. This method producesa watertight 2D model that defines the scanned area. Fig-ure 5 shows a comparison of floor plans generated withthe octree versus floor plans generated with the raw scanpoints. Figures 5a and 5b show the wall samples and thefloor plan generated from the raw scan points, respectively.Obstacles in the environment such as furniture are not prop-erly removed, causing the output walls to be noisy. Fig-ures 5c and 5d show the wall samples and floor plan gener-ated from the octree. Since the region merging allows moresophisticated separation of large planar surfaces, the furni-ture in the environment is properly removed and the outputmodel is cleaner. As an example, the upper-right corner ofthis model contains a large bookcase, which appears in thewall sampling in Figure 5a and is propagated to the floorplan in Figure 5b. This bookcase is correctly removed fromthe wall samples generated from the octree in Figure 5c,which means the wall is more appropriately represented in

the floor plan shown in Figure 5d.Height information is stored in this floor plan, so a 2.5D
model can be extruded, resulting in a simplified represen-tation of the floors, walls, and ceilings in the environment.Since both the 2.5D floor plan and the 3D octree are volu-metric representations of the environment, we can segmentthe objects in the environment by searching for locationsthat are interior in the floor plan, but exterior in the octree.These locations coincide with furniture and other objectsthat are removed by the 2.5D floor plan construction.
This wall sampling approach is less direct than using theoriginal scans, but it has a number of advantages. If a wallis partially occluded by a large object, such as a tall book-shelf, then we can use the portions of the wall on either sideof the object to confirm that the entirety of the wall is rep-resented. Using only the raw scans, the portion of the wallbehind the bookshelf would be under-represented in the fi-nal output, causing errors in the floor plan. By generatingthese wall samples using the octree as input, we can ensurethat the final floor plan is well-aligned with the octree geom-etry. This alignment is important for the steps described inSection 3.4, where we combine the simplified model backinto the octree geometry. The effect of misalignment canbe seen by comparing Figures 6b and 6c. In Figure 6b, theoctree was segmented using a floor plan generated directlyfrom the point cloud and not the octree. As such, parts ofthe back wall and window are mislabeled as objects andkept in the output. However, in Figure 6c, the octree wassegmented using a floor plan generated via the techniquedescribed in this section. The back wall is no longer mis-labeled and only the actual furniture in the environment aresegmented as objects.
3.4. Merging Models
Both the extruded floor plan and the original octree arevolumetric models of the environment, so we can classifythe overlapping volumes into three categories. First, loca-tions that are exterior in the octree yet interior in the ex-truded floor plan are objects or furniture in the environment.Locations labeled exterior by both models are consideredpart of the building structure. Lastly, all locations labeledinterior by the octree are considered open space interior tothe building, regardless of the extruded floor plan’s label-ing. Volume intersected by the boundary of the 2.5D floorplan is considered exterior, since these represent the pri-mary building surfaces and not objects within the building.Using this segmentation, we can now consider the objects inthe building separately from the 2.5D building structure. InFigure 6a, we see the original octree leaf nodes of a scannedenvironment. By performing a set difference of the octreevolume from the volume of the 2.5D model of the environ-ment, we can extract the furniture and other objects. Fig-ure 6b shows the segmentation using an unaligned floor plan
(a) (b)
(c) (d)
Figure 6: Example of aligning floor plan to segment objects:(a) original octree nodes, at a leaf resolution of 6.25 cm;(b) segmented objects using unaligned floor plan; (c) seg-mented objects using aligned floor plan; (d) the segmentedobjects are re-carved to a leaf resolution of 0.8 cm.
and Figure 6c shows the result with a fully aligned floorplan. The unaligned floor plan was generated directly fromthe raw point cloud of the scans [22], whereas the alignedfloor plan was generated with our method described in Sec-tion 3.3. With a properly segmented representation of theroom’s objects, we can re-carve the nodes of the octree con-taining object geometry, since these locations tend to havefiner detail than the rest of the model. Figure 6d shows anexample of this re-carving, which has been refined from theoriginal resolution of 6.25 centimeters to a new resolutionof less than a centimeter.
Once we have fully merged these models, each node ofthe octree is labeled as either object geometry or room ge-ometry. Since the object geometry is represented volumet-rically, we can easily represent watertight models of eachindividual object based on connected components. In addi-tion to refining the resolution of object nodes for more ac-curate representation, we can use this labeling to adjust howwe generate a mesh for each portion of the environment.
3.5. Meshing
After segmenting the octree geometry into objects androoms, we can mesh each separately. Objects such as fur-niture and light fixtures tend to have higher detail than theroom-level geometry. The room-level geometry tends to becomposed of large, planar surfaces. We use a dense mesh-ing technique to represent the object geometry, which pre-serves detail and curves in the geometry. For the room-levelgeometry, we identify planar regions and mesh each planeefficiently with large triangles. Figure 7 shows an example
(a) (b) (c)
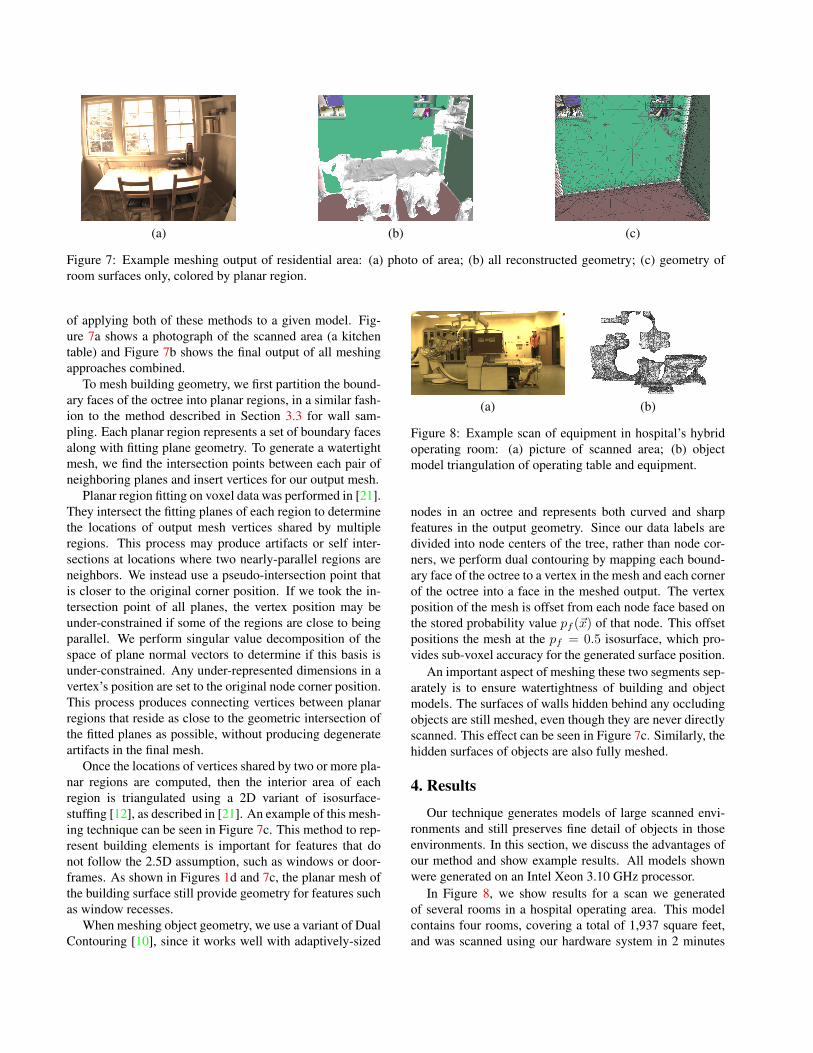
Figure 7: Example meshing output of residential area: (a) photo of area; (b) all reconstructed geometry; (c) geometry ofroom surfaces only, colored by planar region.
of applying both of these methods to a given model. Fig-ure 7a shows a photograph of the scanned area (a kitchentable) and Figure 7b shows the final output of all meshingapproaches combined.
To mesh building geometry, we first partition the bound-ary faces of the octree into planar regions, in a similar fash-ion to the method described in Section 3.3 for wall sam-pling. Each planar region represents a set of boundary facesalong with fitting plane geometry. To generate a watertightmesh, we find the intersection points between each pair ofneighboring planes and insert vertices for our output mesh.
Planar region fitting on voxel data was performed in [21].They intersect the fitting planes of each region to determinethe locations of output mesh vertices shared by multipleregions. This process may produce artifacts or self inter-sections at locations where two nearly-parallel regions areneighbors. We instead use a pseudo-intersection point thatis closer to the original corner position. If we took the in-tersection point of all planes, the vertex position may beunder-constrained if some of the regions are close to beingparallel. We perform singular value decomposition of thespace of plane normal vectors to determine if this basis isunder-constrained. Any under-represented dimensions in avertex’s position are set to the original node corner position.This process produces connecting vertices between planarregions that reside as close to the geometric intersection ofthe fitted planes as possible, without producing degenerateartifacts in the final mesh.
Once the locations of vertices shared by two or more pla-nar regions are computed, then the interior area of eachregion is triangulated using a 2D variant of isosurface-stuffing [12], as described in [21]. An example of this mesh-ing technique can be seen in Figure 7c. This method to rep-resent building elements is important for features that donot follow the 2.5D assumption, such as windows or door-frames. As shown in Figures 1d and 7c, the planar mesh ofthe building surface still provide geometry for features suchas window recesses.
When meshing object geometry, we use a variant of DualContouring [10], since it works well with adaptively-sized
(a) (b)
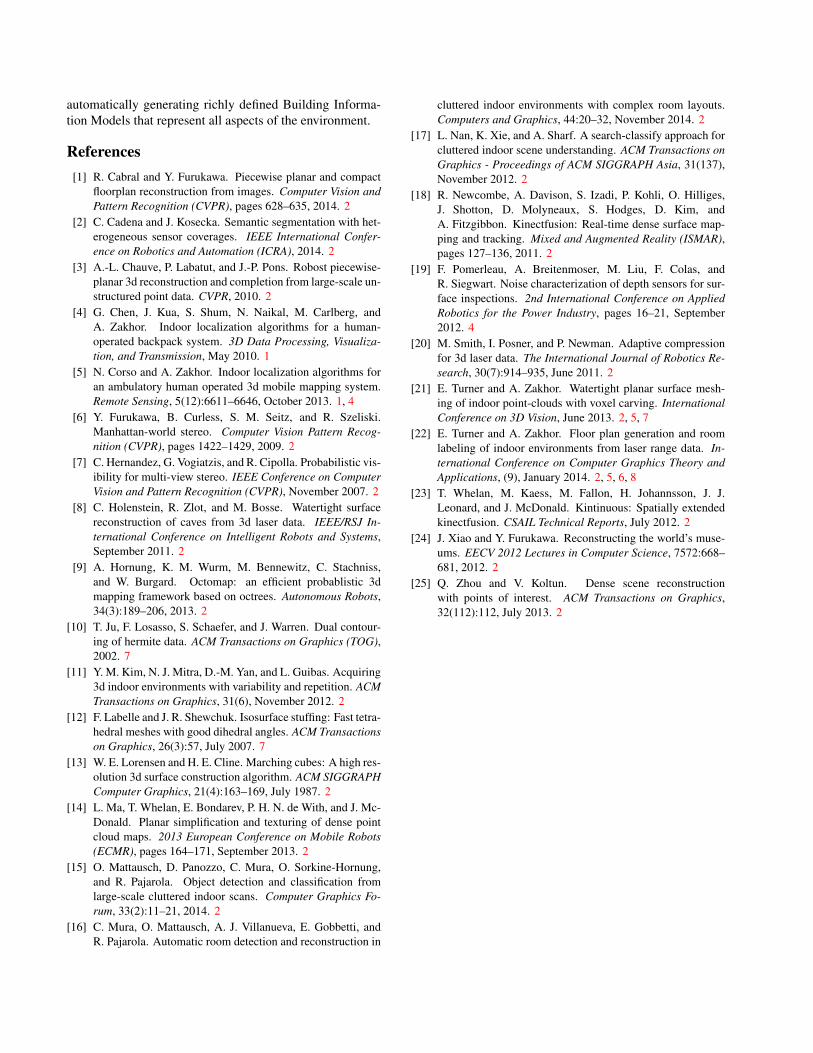
Figure 8: Example scan of equipment in hospital’s hybridoperating room: (a) picture of scanned area; (b) objectmodel triangulation of operating table and equipment.
nodes in an octree and represents both curved and sharpfeatures in the output geometry. Since our data labels aredivided into node centers of the tree, rather than node cor-ners, we perform dual contouring by mapping each bound-ary face of the octree to a vertex in the mesh and each cornerof the octree into a face in the meshed output. The vertexposition of the mesh is offset from each node face based onthe stored probability value pf (~x) of that node. This offsetpositions the mesh at the pf = 0.5 isosurface, which pro-vides sub-voxel accuracy for the generated surface position.
An important aspect of meshing these two segments sep-arately is to ensure watertightness of building and objectmodels. The surfaces of walls hidden behind any occludingobjects are still meshed, even though they are never directlyscanned. This effect can be seen in Figure 7c. Similarly, thehidden surfaces of objects are also fully meshed.
4. Results
Our technique generates models of large scanned envi-ronments and still preserves fine detail of objects in thoseenvironments. In this section, we discuss the advantages ofour method and show example results. All models shownwere generated on an Intel Xeon 3.10 GHz processor.
In Figure 8, we show results for a scan we generatedof several rooms in a hospital operating area. This modelcontains four rooms, covering a total of 1,937 square feet,and was scanned using our hardware system in 2 minutes

(a)
(b)
Figure 9: Comparison of floor plans of large office environ-ment: (a) floor plan generated from raw point cloud scansusing [22]; (b) floor plan generated from octree proposedhere. The octree floor plan has much fewer artifacts due toclutter or furniture, as shown in areas “1” through “4”.
47 seconds. Processing this model took a total of 6 hoursand 8 minutes. The room shown in Figure 8a is an op-erating room, which contains several medical scanners af-fixed to the ceiling. Our approach automatically segmentsthe geometry of the scanners from the rest of the buildingand generates a mesh for the entire environment. Figure 8bshows the segmented geometry of the operating table andmedical equipment. This object would be difficult to modelwith techniques that semantically classify geometry to forma mesh, since it is unlikely that shape libraries would havemany examples of such an usual device. Since our tech-nique does not need to classify the shape, we can still gen-erate an accurate representation of its geometry.
As shown in Section 3.3, one of the by-products of ourapproach is a 2D floor plan of the scanned environment.When compared to floor plans generated from raw pointcloud scans [22], our proposed approach yields not only bet-ter alignment to the complex geometry, but also a cleanerfloor plan. We demonstrate this contrast with Figure 9,which represents a scan of a 14,079 square foot office areawith over 50 rooms. This data acquisition took 25 min-utes and processing took 12 processor hours. An examplefloor plan from the previous method is shown in Figure 9a.This floor plan has several artifacts caused by clutter andfurniture in the environment. Locations “1” and “3” show
(a) (a)
Figure 10: Example mesh of bookcase and boxes: (a) pho-tograph of scanned area; (b) generated mesh, showing bothbuilding and object geometry.
rooms filled with large amounts of objects, causing holes inthe floor plan. Locations “2” and “4” show rooms with asingle large object that occluded part of a wall, causing aincorrect notch in the floor plan. The floor plan of the sameenvironment generated by our proposed technique is shownin Figure 9b. This floor plan correctly separates the roomsof the environment and does not have the same artifacts asin the previous method. Additionally, long hallways in thebuilding are correctly represented as one room, rather thanbeing split into several small segments.
Our approach has some limitations. Since we performvolumetric intersections with an extruded 2.5D model basedon a floor plan, our output relies on assumptions this modelmakes about the scanned environment: that each room hasfixed floor and ceiling heights. If a room’s ceiling is nothorizontal, then it is approximated with a horizontal sur-face. Figure 10 shows a set of boxes on top of a raised plat-form next to a bookcase. The raised platform is identifiedas a separate object, since it is at a different elevation thanthe rest of the floor in this room. This figure also shows afloor-to-ceiling bookcase. Since the position of fitted wallsis found by looking for vertical surfaces, it is difficult toaccurately gauge the depth of the shelves, especially whenthey are filled, so only part of the bookcase is segmentedas an object. Other parts of the model are still meshed cor-rectly in the presence of these issues.
5. Conclusion
We present a robust method of surface reconstruction de-signed for indoor building environments. Our method takesinput laser scans with high noise and forms detailed modelsof the objects in the scanned area, as well as models of thebuilding structure itself. Our technique can handle diversebuilding environments including residential apartments, of-fice areas, and hospitals. Our approach allows partitioningof building geometry into levels, rooms, and individual ob-jects. This degree of segmentation is an important step to
automatically generating richly defined Building Informa-tion Models that represent all aspects of the environment.
References[1] R. Cabral and Y. Furukawa. Piecewise planar and compact
floorplan reconstruction from images. Computer Vision andPattern Recognition (CVPR), pages 628–635, 2014. 2
[2] C. Cadena and J. Kosecka. Semantic segmentation with het-erogeneous sensor coverages. IEEE International Confer-ence on Robotics and Automation (ICRA), 2014. 2
[3] A.-L. Chauve, P. Labatut, and J.-P. Pons. Robost piecewise-planar 3d reconstruction and completion from large-scale un-structured point data. CVPR, 2010. 2
[4] G. Chen, J. Kua, S. Shum, N. Naikal, M. Carlberg, andA. Zakhor. Indoor localization algorithms for a human-operated backpack system. 3D Data Processing, Visualiza-tion, and Transmission, May 2010. 1
[5] N. Corso and A. Zakhor. Indoor localization algorithms foran ambulatory human operated 3d mobile mapping system.Remote Sensing, 5(12):6611–6646, October 2013. 1, 4
[6] Y. Furukawa, B. Curless, S. M. Seitz, and R. Szeliski.Manhattan-world stereo. Computer Vision Pattern Recog-nition (CVPR), pages 1422–1429, 2009. 2
[7] C. Hernandez, G. Vogiatzis, and R. Cipolla. Probabilistic vis-ibility for multi-view stereo. IEEE Conference on ComputerVision and Pattern Recognition (CVPR), November 2007. 2
[8] C. Holenstein, R. Zlot, and M. Bosse. Watertight surfacereconstruction of caves from 3d laser data. IEEE/RSJ In-ternational Conference on Intelligent Robots and Systems,September 2011. 2
[9] A. Hornung, K. M. Wurm, M. Bennewitz, C. Stachniss,and W. Burgard. Octomap: an efficient probablistic 3dmapping framework based on octrees. Autonomous Robots,34(3):189–206, 2013. 2
[10] T. Ju, F. Losasso, S. Schaefer, and J. Warren. Dual contour-ing of hermite data. ACM Transactions on Graphics (TOG),2002. 7
[11] Y. M. Kim, N. J. Mitra, D.-M. Yan, and L. Guibas. Acquiring3d indoor environments with variability and repetition. ACMTransactions on Graphics, 31(6), November 2012. 2
[12] F. Labelle and J. R. Shewchuk. Isosurface stuffing: Fast tetra-hedral meshes with good dihedral angles. ACM Transactionson Graphics, 26(3):57, July 2007. 7
[13] W. E. Lorensen and H. E. Cline. Marching cubes: A high res-olution 3d surface construction algorithm. ACM SIGGRAPHComputer Graphics, 21(4):163–169, July 1987. 2
[14] L. Ma, T. Whelan, E. Bondarev, P. H. N. de With, and J. Mc-Donald. Planar simplification and texturing of dense pointcloud maps. 2013 European Conference on Mobile Robots(ECMR), pages 164–171, September 2013. 2
[15] O. Mattausch, D. Panozzo, C. Mura, O. Sorkine-Hornung,and R. Pajarola. Object detection and classification fromlarge-scale cluttered indoor scans. Computer Graphics Fo-rum, 33(2):11–21, 2014. 2
[16] C. Mura, O. Mattausch, A. J. Villanueva, E. Gobbetti, andR. Pajarola. Automatic room detection and reconstruction in
cluttered indoor environments with complex room layouts.Computers and Graphics, 44:20–32, November 2014. 2
[17] L. Nan, K. Xie, and A. Sharf. A search-classify approach forcluttered indoor scene understanding. ACM Transactions onGraphics - Proceedings of ACM SIGGRAPH Asia, 31(137),November 2012. 2
[18] R. Newcombe, A. Davison, S. Izadi, P. Kohli, O. Hilliges,J. Shotton, D. Molyneaux, S. Hodges, D. Kim, andA. Fitzgibbon. Kinectfusion: Real-time dense surface map-ping and tracking. Mixed and Augmented Reality (ISMAR),pages 127–136, 2011. 2
[19] F. Pomerleau, A. Breitenmoser, M. Liu, F. Colas, andR. Siegwart. Noise characterization of depth sensors for sur-face inspections. 2nd International Conference on AppliedRobotics for the Power Industry, pages 16–21, September2012. 4
[20] M. Smith, I. Posner, and P. Newman. Adaptive compressionfor 3d laser data. The International Journal of Robotics Re-search, 30(7):914–935, June 2011. 2
[21] E. Turner and A. Zakhor. Watertight planar surface mesh-ing of indoor point-clouds with voxel carving. InternationalConference on 3D Vision, June 2013. 2, 5, 7
[22] E. Turner and A. Zakhor. Floor plan generation and roomlabeling of indoor environments from laser range data. In-ternational Conference on Computer Graphics Theory andApplications, (9), January 2014. 2, 5, 6, 8
[23] T. Whelan, M. Kaess, M. Fallon, H. Johannsson, J. J.Leonard, and J. McDonald. Kintinuous: Spatially extendedkinectfusion. CSAIL Technical Reports, July 2012. 2
[24] J. Xiao and Y. Furukawa. Reconstructing the world’s muse-ums. EECV 2012 Lectures in Computer Science, 7572:668–681, 2012. 2
[25] Q. Zhou and V. Koltun. Dense scene reconstructionwith points of interest. ACM Transactions on Graphics,32(112):112, July 2013. 2