automatic identification of raman spectra - core.ac.uk · chapter 1 introduction 1.1 resumen la...
TRANSCRIPT

UNIVERSIDAD DE VALLADOLID
ESCUELA TECNICA SUPERIOR
INGENIEROS DE TELECOMUNICACION
TRABAJO FIN DE MASTER
MASTER UNIVERSITARIO EN INVESTIGACION
EN TECNOLOGIAS DE LA INFORMACION Y LAS COMUNICACIONES
Automatic Identification of Raman Spectra
Autor:
Isaac Hermosilla Rodrıguez
Tutor:
Diego R. Llanos Ferraris, Fernando Rull Perez
Valladolid, 10 de Septiembre de 2012

TTULO: Automatic Identification of Raman Spec-tra
AUTOR: Isaac Hermosilla RodrıguezTUTOR: Diego R. Llanos Ferraris, Fernando Rull
PerezDEPARTAMENTO:
TribunalPRESIDENTE: Dr. D.VOCAL: Dr. D.SECRETARIO: Dr. D.FECHA: 10 de Septiembre de 2012CALIFICACION:
Resumen del TFMEste trabajo consiste en un estado del arte sobre la identificacion de compuestos a
traves de espectroscopıa Raman. La espectroscopıa Raman estudia la luz reflejada porun sistema cuando se incide sobre ella una haz de luz monocromatico, de esta manerase conocen caracterısticas quımicas y estructurales del sistema. Tambien contiene unapropuesta de un algoritmo para identificar minerales a traves de su espectro de Ramancon una base de datos y una comparacion con otro algoritmo recientemente publicado.
Palabras claveEspectroscopıa Raman, identificacion de minerales.
AbstractThis work consist on a state of the art about compounds identification through raman
spectroscopy. Raman spectroscopy studies the light reflected by a system when it is irradi-ated by a beam of monochromatic light, thus chemical and physical characteristics of thesystem are obtained. Also it has a proposal of an algorithm to identify minerals throughits raman spectrum with a database and a comparison with another algorithm recentlypublished.
KeywordsRaman spectroscopy, mineral identification

Agradecimientos
Quiero agradecer la ayuda y el tiempo prestado a mis tutores, Diego y Fernando, y algrupo de la Unidad Asociada UVA - CSIC a traves del Centro de Astrobiologıa.
iii

iv

Contents
1 Introduction 11.1 Resumen . . . . . . . . . . . . . . . . . . . . . . . . . . . . . . . . . . 11.2 Importance of problem . . . . . . . . . . . . . . . . . . . . . . . . . . . 11.3 Brief description of Raman Spectroscopy . . . . . . . . . . . . . . . . . 11.4 Aims . . . . . . . . . . . . . . . . . . . . . . . . . . . . . . . . . . . . . 2
2 Raman Spectroscopy 32.1 Resumen . . . . . . . . . . . . . . . . . . . . . . . . . . . . . . . . . . 32.2 Historical Background of Raman Spectroscopy . . . . . . . . . . . . . . 32.3 Theory of Raman Scattering . . . . . . . . . . . . . . . . . . . . . . . . 4
2.3.1 Raman sample preparation and handling . . . . . . . . . . . . . . 62.4 Identification through Raman Spectroscopy . . . . . . . . . . . . . . . . 72.5 Baseline removal . . . . . . . . . . . . . . . . . . . . . . . . . . . . . . 82.6 Fluorescence removal . . . . . . . . . . . . . . . . . . . . . . . . . . . . 92.7 Some issues about material identification . . . . . . . . . . . . . . . . . . 9
2.7.1 An illustrative example of processing Raman spectra . . . . . . . 10
3 Raman Spectra Classification 113.1 Resumen . . . . . . . . . . . . . . . . . . . . . . . . . . . . . . . . . . 113.2 Introduction . . . . . . . . . . . . . . . . . . . . . . . . . . . . . . . . . 113.3 Artificial Intelligence . . . . . . . . . . . . . . . . . . . . . . . . . . . . 13
3.3.1 Fuzzy Logic . . . . . . . . . . . . . . . . . . . . . . . . . . . . 133.3.2 Neural networks and others . . . . . . . . . . . . . . . . . . . . 16
3.4 PCA: Principal Component Analysis . . . . . . . . . . . . . . . . . . . . 173.5 Other algorithms . . . . . . . . . . . . . . . . . . . . . . . . . . . . . . 18
4 Solution Definition 214.1 Resumen . . . . . . . . . . . . . . . . . . . . . . . . . . . . . . . . . . 214.2 Initial search . . . . . . . . . . . . . . . . . . . . . . . . . . . . . . . . . 214.3 Recursive search . . . . . . . . . . . . . . . . . . . . . . . . . . . . . . 22
5 Experimental Results 255.1 Resumen . . . . . . . . . . . . . . . . . . . . . . . . . . . . . . . . . . 255.2 Experimental Design . . . . . . . . . . . . . . . . . . . . . . . . . . . . 25
5.2.1 Testing algorithm with the corpus . . . . . . . . . . . . . . . . . 265.2.2 Comparison between propolsals . . . . . . . . . . . . . . . . . . 26
v

vi CONTENTS
5.2.3 Identification of mixtures of compounds . . . . . . . . . . . . . . 28
6 Conclusions and future work 296.1 Resumen . . . . . . . . . . . . . . . . . . . . . . . . . . . . . . . . . . 296.2 Conclusions . . . . . . . . . . . . . . . . . . . . . . . . . . . . . . . . . 296.3 Future work . . . . . . . . . . . . . . . . . . . . . . . . . . . . . . . . . 30

List of Figures
2.1 Stokes and anti-Stokes scattering for cyclohexane. To show the weak anti-Stokes spectrum, the y-axis has been extended in the inset. . . . . . . . . 6
2.2 Calcite raman spectrum. . . . . . . . . . . . . . . . . . . . . . . . . . . 82.3 Baseline removal of magnetite spectrum. . . . . . . . . . . . . . . . . . . 8
3.1 Summary of the main methods. . . . . . . . . . . . . . . . . . . . . . . . 13
4.1 Initial search. . . . . . . . . . . . . . . . . . . . . . . . . . . . . . . . . 224.2 Recursive search. . . . . . . . . . . . . . . . . . . . . . . . . . . . . . . 23
5.1 Example identification of a jarosite spectrum through the developed system. 275.2 Comparison between searching raman bands with and without intensity . 285.3 Mixture of calcite and gypsum. . . . . . . . . . . . . . . . . . . . . . . . 28
vii

viii LIST OF FIGURES
Chapter 1
Introduction
1.1 ResumenLa espectroscopia Raman es una tecnica fotonica que permite conocer informacion qumicay estructural de casi cualquier material organico o inorganico. El objetivo es analizar laluz dispersada por un material cuando es iluminado con un haz de luz monocromatico. Lamayor parte de la luz que incide sobre el material se dispersa en la misma frecuencia quela luz irradiada, y no da ninguna informacion acerca del material, pero el resto se dispersaen una frecuencia diferente de la luz irradiada y proporciona informacion sobre la com-posicion molecular de la muestra. El principal objetivo es identificar automaticamenteminerales a traves de su espectro Raman. Este objetivo es aun mas complicado cuandose trata de reconocer mezclas de distintos materiales en diferentes proporciones. En estetrabajo se hara una descripcion del estado del arte sobre la identificacin de distintos com-puestos y se hara una propuesta de algoritmo para identificar minerales.
1.2 Importance of problemThe main problem is identify samples of minerals through its raman spectra. It is not aneasy task due to the variability between two spectra of the same sample taken in differentconditions, with different equipment... The problem is even harder when the spectrumcorresponds to a mixture of more than one mineral.
The search of coincidences between spectra may be a tedious task especially when it isnecessary make the comparison with a large database. This is a common task in the workof a specialist. So, the possibility of developing a reliable tool that makes easier this taskis an important challenge. Besides, a tool of this kind, not only is useful for specialists,also it can be used by non experts and can be included inside a portable spectrometer.
1.3 Brief description of Raman SpectroscopyRaman spectroscopy is a spectroscopic technique used to study vibrational, rotational,and other low-frequency modes in a system. It is widely used to provide informationon chemical structures and physical forms, to identify substances from the characteristic
1

2 CHAPTER 1. INTRODUCTION
spectral patterns (fingerprinting), and to determine quantitatively or semi-quantitativelythe amount of a substance in a sample. So, thinking in raman spectra like a fingerprint itis possible identify materials through the study of their raman spectra.
1.4 AimsThe main aims of this work are:
• Make a state of the art about recognition of different compounds through ramanspectroscopy.
• Make an initial purpose to recognition of minerals.
• Develop an initial tool that gives clues and makes easier the decision-making pro-cess.
• Make initial tests with a large corpus.
• Make a comparison between our purpose and a method for identification that hasbeen published.
• Lay the basis for a more accurate algorithm and for an algorithm for portable de-vices.

Chapter 2
Raman Spectroscopy
2.1 ResumenLa fascinacion por el azul del mar Mediterraneo llevo a C.V. Raman a investigar la dis-persion de la luz por los lıquidos y ası descubrir experimentalmente la dispersion de luzcon cambio de frecuencia.
La espectroscopıa Raman es una tecnica fotonica que permite conocer informacionquımica y estructural de casi cualquier material organico o inorganico.
El objetivo es analizar la luz dispersada por un material cuando es iluminado conun haz de luz monocromatico. La mayor parte de la luz que incide sobre el material sedispersa en la misma frecuencia que la luz irradiada, y no da ninguna informacion acercadel material, pero el resto se dispersa en una frecuencia diferente de la luz irradiada yproporciona informacion sobre la composicion molecular de la muestra.
La espectroscopıa Raman tiene como ventaja la mınima manipulacion y preparacionde la muestra que se requiere.
2.2 Historical Background of Raman SpectroscopyCuriosity about the explanation of the blue colour of the sky led Lord Rayleigh to formu-late a classical theory of light scattering without change of frequency (Rayleigh, 1871)[15]. Fascination with the marvellous blue of the Mediterranean sea caused C. V. Ramanto investigate the scattering of light by liquids and so to discover experimentally the scat-tering of light with change of frequency (Raman and Krishnan, 1928). An independentprediction of this phenomenon had been made a few years earlier (Smekal, 1923) usingclassical quantum theory.
Shortly after Raman and Krishnans publication a report of light scattering with changeof frequency in quartz was reported by two Russian scientists, Landsberg and Mandelstam(1928), and in France, Raman and Krishnans observations were soon confirmed by Ca-bannes (1928) and Rocard (1928). The potential of the Raman effect in chemistry andphysics was realized very rapidly. By the end of 1928 some 70 papers on the Ramaneffect had been published.
In 1928, when Sir Chandrasekhra Venkata Raman discovered the phenomenon thatbears his name, only crude instrumentation was available. Sir Raman used sunlight as
3

4 CHAPTER 2. RAMAN SPECTROSCOPY
the source and a telescope as the collector, the detector was his eyes. That such a feeblephenomenon as the Raman scattering was detected was indeed remarkable. [11]
Gradually, improvements in the various components of Raman instrumentation tookplace. Early research was concentrated on the development of better excitation sources.Various lamps of elements were developed as helium, bismuth, lead, zinc, but these provedto be unsatisfactory because of low light intensities.
In 1962 laser sources were developed for use with Raman spectroscopy . Eventually,the Argon and the Krypton lasers became available, and more recently the Nd- YAG laserhas been used for Raman spectroscopy.
Progress occurred in the detection systems for Raman measurements. Whereas orig-inal measurements were made using photographic plates with the cumbersome develop-ment of photographic plates, photoelectric Raman instrumentation was developed afterWorld War II.
These developments in Raman instrumentation brought commercial Raman instru-ments to the present state of the art of Raman measurements. Now, Raman spectra canalso be obtained by Fourier transform (FT) spectroscopy. FT-Raman instruments are be-ing sold by all Fourier transform infrared (FT-IR) instrument makers, either as interfacedunits to the FT-IR spectrometer or as dedicated FT-Raman instruments.
2.3 Theory of Raman ScatteringThe main spectroscopies employed to detect vibrations in molecules are based on theprocesses of infrared absorption and Raman scattering. They are widely used to provideinformation on chemical structures and physical forms, to identify substances from thecharacteristic spectral patterns (fingerprinting), and to determine quantitatively or semi-quantitatively the amount of a substance in a sample. Samples can be examined in a wholerange of physical states; for example, as solids, liquids or vapours, in hot or cold states, inbulk, as microscopic particles, or as surface layers. The techniques are very wide rangingand provide solutions to a host of interesting and challenging analytical problems. Ra-man scattering is less widely used than infrared absorption, largely due to problems withsample degradation and fluorescence. However, recent advances in instrument technologyhave simplified the equipment and reduced the problems substantially. These advances,together with the ability of Raman spectroscopy to examine aqueous solutions, samplesinside glass containers and samples without any preparation, have led to a rapid growth inthe application of the technique. [25]
Raman spectroscopy is a spectroscopic technique used to study vibrational, rotational,and other low-frequency modes in a system [8]. It relies on inelastic scattering, or Ramanscattering, of monochromatic light, usually from a laser in the visible, near infrared, ornear ultraviolet range. The laser light interacts with molecular vibrations, phonons orother excitations in the system, resulting in the energy of the laser photons being shiftedup or down. The shift in energy gives information about the vibrational modes in thesystem.
When light interacts with matter, the photons which make up the light may be ab-sorbed or scattered, or may not interact with the material and may pass straight throughit. If the energy of an incident photon corresponds to the energy gap between the ground

2.3. THEORY OF RAMAN SCATTERING 5
state of a molecule and an excited state, the photon may be absorbed and the moleculepromoted to the higher energy excited state. It is this change which is measured in ab-sorption spectroscopy by the detection of the loss of that energy of radiation from thelight. However, it is also possible for the photon to interact with the molecule and scatterfrom it. In this case there is no need for the photon to have an energy which matchesthe difference between two energy levels of the molecule. The scattered photons can beobserved by collecting light at an angle to the incident light beam, and provided there isno absorption from any electronic transitions which have similar energies to that of theincident light, the efficiency increases as the fourth power of the frequency of the incidentlight.
Scattering is a commonly used technique. For example, it is widely used for mea-suring particle size and size distribution down to sizes less than 1 µ m. One everydayillustration of this is that the sky is blue because the higher energy blue light is scatteredfrom molecules and particles in the atmosphere more efficiently than the lower energy redlight. However, the main scattering technique used for molecular identification is Ramanscattering.
Raman spectroscopy uses a single frequency of radiation to irradiate the sample and itis the radiation scattered from the molecule, one vibrational unit of energy different fromthe incident beam, which is detected. Thus, Raman scattering does not require matchingof the incident radiation to the energy difference between the ground and excited states. InRaman scattering, the light interacts with the molecule and distorts (polarizes) the cloudof electrons round the nuclei to form a short-lived state called a virtual state., This state isnot stable and the photon is quickly re-radiated.
The energy changes we detect in vibrational spectroscopy are those required to causenuclear motion. If only electron cloud distortion is involved in scattering, the photonswill be scattered with very small frequency changes, as the electrons are comparativelylight. This scattering process is regarded as elastic scattering and is the dominant process.For molecules it is called Rayleigh scattering. However, if nuclear motion is inducedduring the scattering process, energy will be transferred either from the incident photonto the molecule or from the molecule to the scattered photon. In these cases the processis inelastic and the energy of the scattered photon is different from that of the incidentphoton by one vibrational unit. This is Raman scattering. It is inherently a weak processin that only one in every 106 - 108 photons which scatter is Raman scattered. In itself thisdoes not make the process insensitive since with modern lasers and microscopes, veryhigh power densities can be delivered to very small samples but it is does follow thatother processes such as sample degradation and fluorescence can readily occur.
Since the virtual states are not real states of the molecule but are created when thelaser interacts with the electrons and causes polarization, the energy of these states is de-termined by the frequency of the light source used. The Rayleigh process will be themost intense process since most photons scatter this way. It does not involve any energychange and consequently the light returns to the same energy state. The Raman scatteringprocess from the ground vibrational state m leads to absorption of energy by the moleculeand its promotion to a higher energy excited vibrational state (n). This is called Stokesscattering. Scattering from these states to the ground state m is called anti-Stokes scatter-ing and involves transfer of energy to the scattered photon. The relative intensities of the

6 CHAPTER 2. RAMAN SPECTROSCOPY
Figure 2.1: Stokes and anti-Stokes scattering for cyclohexane. To show the weak anti-Stokes spectrum, the y-axis has been extended in the inset.
two processes depend on the population of the various states of the molecule. Thus, com-pared to Stokes scattering, anti-Stokes scattering will be weak and will become weakeras the frequency of the vibration increases, due to decreased population of the excited vi-brational states. Further, anti-Stokes scattering will increase relative to Stokes scatteringas the temperature rises. Figure 2.1 shows a typical spectrum of Stokes and anti-Stokesscattering from cyclohexane separated by the intense Rayleigh scattering which should beoffscale close to the point where there is no energy shift. However there is practically nosignal close to the frequency of the exciting line along the x-axis. This is because filtersin front of the spectrometer remove almost all light within about 200 cm1 of the excitingline. Some breakthrough of the laser light can be seen where there is no energy shift atall.
The scattering is measured as light detected by the spectrometer and the maximumamount of light detected is the highest point on the trace.
Strictly speaking, Raman scattering should be expressed as a shift in energy from thatof the exciting radiation and should be referred to as ∆cm−1 but it is often expressedsimply as cm−1.
In the spectrum of the scattered radiation, the new frequencies are termed Ramanlines, or bands, and collectively are said to constitute a Raman spectrum. Raman bands atfrequencies less than the incident frequency are referred to as Stokes bands, and those atfrequencies greater than the incident frequency as anti-Stokes bands.
2.3.1 Raman sample preparation and handlingRaman spectroscopy, as a scattering technique, is well known for the minimum of samplehandling and preparation that is required. Typical Raman accessories are powder sampleholders, cuvette holders, small liquid sample holders and clamps for irregularly shapedobjects.
Many organic, and inorganic, materials are suitable for Raman spectroscopic analysis.

2.4. IDENTIFICATION THROUGH RAMAN SPECTROSCOPY 7
These can be solids, liquids, polymers or vapours. The majority of bulk, industrial labora-tory samples are powders or liquids and can be examined directly by Raman spectroscopyat room temperature. Accessories for examination of materials by Raman spectroscopyare available across a wide range of temperature and physical forms. Sample presentationis rarely an issue in Raman spectroscopy of bulk samples.
In practice, modern Raman spectroscopy is simple. Variable instrument parametersare few, spectral manipulation is minimal and a simple interpretation of the data may besufficient.
2.4 Identification through Raman Spectroscopy
Raman spectroscopy is a photonic technique that allows to know chemical and structuralinformation of almost any organic or inorganic material.
The aim is analyze the scattered light by a material when it is illuminated with a beamof monocromatic light. The major part of the light that impacts on the material is scatteredin the same frecuency as the irradiated light, and doesn’t give any information about thematerial but the rest is scattered in a different frecuency than the irradiated light andgives information about the molecular composition of the sample. This kind of scatteredlight is produced when the molecule absorbs energy and the final state is more energeticthan the initial state, then the emitted photon of a higher wavelength generates a Stokesline. In the other hand, when the molecule loses energy generates an anti-Stokes linebut this information isn’t taken into account to analyse the spectrum. The raman spectracollects this phenomenon and represents the scattered intesity in a wavelenght which it isproduced.
Each material has one or more points of high intensity in a determinated wavelength.The spectrum intensity also may be represented in Raman shift making a wave lengthtransformation. So, each material can be represented by a spectrum which has at least onehigh intensity peak in a determinated wavelength or Raman shift. These high intensitypeaks are also known as Raman Bands. In the figure 2.2 is shown the calcite ramanspectrum and there is a table that contains the information about the intensity and theraman shift of each representative peak. Through the raman characteristics peaks wecan identify materials using a database that contains information about the peaks of eachmaterial. This information can be defined as the raman signature of the material.
Some of the great advantages of Raman spectroscopy are that is not destructive withthe material irradiated, doesn’t need contact with the studied material and doesn’t needthat the sample has been preparated, is a rapid method because a spectrum can be takenin a few seconds. But also has an important disadvantage, with biological samples mayappear fluorescence that makes harder the analysis.
Before starting with the sample recognition through its raman spectrum probably itwould be necesary a previous processing. The common practices are the background andfluorescence removal.

8 CHAPTER 2. RAMAN SPECTROSCOPY
Figure 2.2: Calcite raman spectrum.
Figure 2.3: Baseline removal of magnetite spectrum.
2.5 Baseline removalBefore further spectrum analysis once acquired it is necessary the background removalbecause it can hinder the presentation, visualization and processing of relevant data ( Fig.2.3). This removal can be done manually or automatic, in the case of automatic removalit will be harder when appears random and systematic variations.
One important ratio to know how good a spectrum is can be the Signal-to-noise ratio(SNR 2.1), as higher this ratio will be easier remove the background from the spectrum.
SNR =MaximunIntensity
σ(2.1)
To acquire spectra with better SNR it can be useful acquire it with more integrationtime or increase accumulation number. Integration time is the time during the sample isirradiated by the laser. Accumulation number is the number of spectra that have beenmade consecutively.

2.6. FLUORESCENCE REMOVAL 9
2.6 Fluorescence removal
As the background, the fluorescence must be removed. The presence of fluorescencemakes that the spectrum has a characteristic curvature. When it appears the spectral anal-ysis of the sample can be severely compromised.
The fluorescence may be because of the presence of organic materials but also canbe observed in inorganic materials. In this cases can be attributed to the presence ofimpurities or external pollutants, and even environmental factors like relative humidity,temperature and sunlight.
In any case, the fluorescence must be removed during the preprocessing step beforestart with searching of similar spectra in our database.
2.7 Some issues about material identification
Once we have a spectrum with the baseline and fluorescence correction, we are able tostart with the recognition of the sample.
All the materials have a unique spectrum which have one or more peaks with a knownraman shift and intensity. So we can say that the spectrum signature is a set of pairscomposed by raman shift and intensity for each characteristic peak.
The next step will be identify all the peaks in the spectrum. So, when we have a cleanspectrum and the peaks identificated it may seem easy to find a similiar spectrum in adatabase, because we only have to search for spectrum with similar peaks. But isn’t aseasy as it may seem at the first sight.
Here there are some issues to take into account that makes hard the automatic recog-nition:
• There are many aspects that may affect to the raman shift and intensity in a spectrumlike the integration time, the accumulation number, laser wavelength, irradiance,temperature, preasure, status of the material...
• With a mixture of materials, exists the possibility that more than one raman signalscoincide, making hard the identification. Because a raman band can hide anotherthrough a combination of both.
• Develop a generic method to identify spectrums is complicated because there is adependency in the characteristics of the equipment used to take the spectrum. Twospectra taken with different spectrometers may have differences.
• Peaks automatic detection depends on the previous steps, baseline and fluorescenceremoval. When more clean the spectrum be the more reliable the recognition be. So,it is necessary to have a reliable spectrum processing made by hand or automatic.
• Depending on the characteristics of the material, probably it would be necesaryhave several signatures under different conditions for the same material.

10 CHAPTER 2. RAMAN SPECTROSCOPY
2.7.1 An illustrative example of processing Raman spectraIn [26] is described the whole process of raman spectra analyzing under the Exomarsmission that ESA will launch in 2018 [10]. Most of all recently planned astrobiologymissions to Mars are focused on the exploration of the surface and near subsurface in thesearch for biomarkers as indicators of exobiology. The search for signs of past and presentlife on Mars is one of the main goals of the ESA ExoMars Rover Mission. The Ramanlaser spectrometer (RLS), which will travel on the rover, has been ranked as Fundamentalnondestructive analytical instrumentation for the mission.
In this article is presented a Raman signal processing package to perform in-depthprocessing of the spectra that aims to eliminate, insofar as possible, the noise and removethe baseline from the spectra. The process described needs filtering of raw data, baselineremoval, peak finding and finally database search for sample identification.

Chapter 3
Raman Spectra Classification
3.1 ResumenHay muchos trabajos relacionados con la identificacion de compuestos. Es posible clasi-ficarlos teniendo en cuenta los diferentes metodos utilizados para reconocer un espectroproblema. Los principales metodos estan relacionados con inteligencia artificial, analisisde componentes principales y algoritmos basados en diversos coeficientes de correlacion.
Hay un grupo de artıculos publicados por un grupo de investigadores en el que hantrabajado en la identificacion de pigmentos por espectroscopıa Raman. Todos los artıculostienen en comun el uso de logica difusa para identificar un espectro problema en unacoleccion de espectros de referencia de pigmentos
3.2 IntroductionThere are many works related with the identification of different compounds and materi-als. It is possible classify them taking into account the different methods used to recognizea problem spectrum. So, the main methods are related with artificial intelligence, principalcomponent analysis, and various algorithms based on correlation coefficients.
In the next sections, some articles are commented grouped by the main techniqueused, so the next subsections are the followings: Fuzzy Logic 3.3.1, Artificial Intelligence3.3.2, Principal component Analysis 3.4, Other Algorithms 3.5 and a brief introducction3.2.
The article [32] talks about many scientific and industrial disciplines where Ramanspectroscopy, and therefore recognition, find application. Some of these disciplines are:
• Chemistry: providing a chemical fingerprint for identification of a molecule, sincevibrational information is specific to the chemical bonds and symmetry of molecules.
• Forensic sciences and Criminology: is used for identification of trace amounts ofsubstances in evidential materials, etc. In-situ measurements can be realized, mean-ing no contamination of evidences during taking samples. Also can be used in iden-tification of unknown or hazardous substances, by instance detection of explosivesor drugs.
11

12 CHAPTER 3. RAMAN SPECTRA CLASSIFICATION
• Medicine: prognosis and diagnosis of carcinomas and other diseases.
• Geology and Mineralogy: serves for identification of the principal mineral phasesor classification.
• Art and paints: examination of artworks and artefacts reveal worthy information forconservators or those of general historical interest.
• Robotic exploration of Mars: as a part of the scientific laboratory, a raman spec-trometer will be included in the Exomars mission of ESA. [17]
In [31] are presented some issues resolved at the present time using Raman recogni-tion. These examples are detection of small hexavalent chromium concentrations, mon-itoring of the curing process of epoxy resins, clasification of inks within the scope ofrevealing ink document falsifications...
As stated in section 2.3, each material can be represented by a spectrum and thereforeeach raman spectrum is like a fingerprint through a material can be identified. So, tofacilitate the material recognition it is neccesary have a spectral database or a model tomake possible the comparision between spectra.
In the past, databases were unreliable [20] owing to the variability in spectra obtained(ratio signal - noise, background...) by the earlier low throughput multi-grating systems.The first reliable Raman spectral databases have been produced for the new generation ofspectrometers.
An example of Raman database is in [6], where Raman spectra of 43 excipients com-monly used in pharmaceutical formulations are presented and their Raman bands are iden-tified.
There is an important project, called RRUFF [5], that is creating a large database ofRaman spectra from well characterized minerals. This is an open project and shares all thespectra in the web. Because is an open project, anybody can contribute with their spectra.One of their aims is allow users of Raman instruments compare their Raman patternsto those from RRUFF with confidence. But through the online database is not possibleto make an spectra identification. On the other hand there is a free standalone program(Crystal Sleuth) developed by RRUFF that has a functionality that permits compare aproblem spectrum with a large group of spectra obtained from the online database. In thesection 3.5 the identification method of Cristal Sleuth will be discussed. An example ofthe use of RRUFF is in [16], where various raman spectra were acquired from 96 semiprecious gemstones with the aim of classify them with reference spectra from the RRUFFdatabase.
But for the material identification is not enough searching similarities between theproblem spectrum and a set of reference spectra. In many cases the problem spectrummay belong to a mixture of more than one material and in this cases identify the materialsthat have a contribution in the raman spectra is a harder task. In a first view, seems reason-able that the contribution of each material is a lineal contribution taking into account theproportion of each material in the mixture. But is not true in all the cases. The article [1]talks about Principle of superposition in the Raman effect with mixtures. This concept canbe interpreted into two ways, first way qualitatively refers to the fact that the bands of eachindividual material appear in the spectrum of the mixture, or second way, quantitatively

3.3. ARTIFICIAL INTELLIGENCE 13
Figure 3.1: Summary of the main methods.
that is, the mixture spectrum is the pondered sum of the individual spectra according tothe proportions in which they appear in the mixture. But, in some cases, the Principle ofsuperposition is not quantitatively verified and qualitatively. Specific properties of the ma-terials, like reflectance, absorption, transmission and grain size and others are responsiblefor the non-linear effect that does not agree with the principle of superposition.
For the identification of spectra, it is possible divide the methods into two main groups.The first group is searching for similarities between whole spectrum and the referencespectra and second group searching similarities between the main bands or peaks of theproblem spectrum and main bands of the reference spectra. In the next sections somemethods will be discussed always bearing in mind the difference between this kind ofmethods.
In figure 3.1 it is shown a summary of the main methods found in the articles.
3.3 Artificial Intelligence
3.3.1 Fuzzy LogicThere are a group of articles published by a group of researchers in which they haveworked in the identification of pigments by raman spectroscopy. All the articles have incommon the use of fuzzy logic to identify a problem spectrum in a reference library spec-

14 CHAPTER 3. RAMAN SPECTRA CLASSIFICATION
tra of pigments. They have experimented with the fuzzy logic in main methods to identifyraman spectra, taking into account the whole spectrum and only the main spectrum bands.Besides they have supplemented the fuzzy logic with other interesting methods like Prin-cipal Component Analysis (PCA).
The article [19] talks about a fuzzy logic system for band detection of Raman spectra.The reasoning used looks for the peaks in the spectrum in a conventional visual way. Thisis an important step when is intended to compare spectra by raman bands or peaks. Theymake a formulation of input membership functions that transform the system inputs intofuzzy variables. The input fuzzy variable is then mapped into a fuzzy output variable bymeans of rules, which describe the relation between these variables. Both membershipfunctions and rules are problem dependent. In this article the location of Raman bands isbased on the quadratic coefficients of the parabolic approximation of the spectrum in con-secutive segments. The quadratic coefficient is negative when the shape of the spectrum inthe segment is convex. Bearing in mind that the shape of a Raman band is always convex,in a segment with a negative quadratic coefficient a Raman band can exist. In particular,the general statement for detecting bands is: IF three consecutive quadratic coefficientsare negative and similar THEN there is a Raman band. The inference engine providesthe way in which rules are combined and evaluated in order to obtain the output fuzzysets and finally, the crisp output value is obtained using a centroid technique from outputfuzzy sets. The method is practically independent of the spectrum baseline and thereforeis not necessary to eliminate it previously.
The article [3] talks about identification of artistic pigments using fuzzy Logic andprincipal component analysis (PCA) . They reduce each dimension spectra by means ofa data reduction tool called the principal component analysis (PCA). The most importantuse of this chemometric technique is to represent the N-dimensional data in a smallernumber of dimensions, usually two or three, without loss of information. A correlationcoefficient is used to estimate the degree of similarity between problem spectra and refer-ence spectra. The fuzzifier assigns to every numerical input value a degree of membershipto each input Fuzzy sets through the membership functions associated to them. The in-ference engine provides the way in which rules are combined and by means of differentlogical operators modifies the defined output fuzzy sets. Finally, the defuzzifier maps out-put fuzzy sets into crisp numbers applying mathematicalmechanisms in order to obtainthe final result. If there is more than one candidate, a new library is made by mixing them.This system can only identify binary mixtures that are the most common mixtures madeby artists in the pigments field.
The article [18] again uses fuzzy logic to identify spectra but now comparing onlyraman bands. First, by means of a fuzzy system based on If Then rules, the systemselects as candidates all the pigments in a considered database that have bands in thesame positions as the unknown spectrum. Second step is calculate the similarity degree,it numerically determines the coincidence in the wavenumber position of the bands inthe compared spectra. That is, the greater the coincidence between bands, the closer thesimilarity degree value is to 1. And finally, the output variable called the matched bandsnumber provides the ratio of the number of matched bands between the unknown spectrumand the candidate to the total number of candidate bands, expressed as a percentage. Allof these variables are input variables in the following stage (identification fuzzy system),

3.3. ARTIFICIAL INTELLIGENCE 15
which makes the decisions to the identity of the analyzed pigment by selecting it fromamong the candidates and provides the identification reliability. Thus, the output of thewhole system is the pigment (or pigments) identified as the unknown pigment with acertain confidence, which is expressed as a number from 0 to 10.
In the article [22] an algorithm was tested with a database of 32 pigments. The algo-rithm was tested both pure pigments and mixtures. The system is designed as a softwarecomplement in a portable micro-Raman instrument for studying pigments. The Ramanbands that will be used in the fuzzy system to perform the automatic identification. Be-fore the fuzzy procedure is applied, a previous denoising process is necessary along witha baseline correction to remove background signals usually caused by fluorescence. Peakpicking is performed manually. The user selects the Raman bands that are considered tobe characteristic of the compound. The algorithm first calculates the intersection betweenthe fuzzy set of the unknown spectrum with each of the crisp sets stored in the referencelibrary. As a result, a score is obtained for each band in the computed intersection. Thesescores are then weighted using a factor that represents the probability of occurrence of theRaman band. Finally, final result is weighted with a factor that is the number of referencebands encountered in the unknown pigment spectra divided by the total number of bandsin the reference pigment spectrum. The value final is between [0, 1] and is classified usingthree categories, present, possibly present, or not present.
The article [27] makes a comparison between two strategies based on fuzzy logicto identify unknown Raman spectra. First one is compare the whole spectrum of theanalyzed sample with the spectra of standard materials or, once the wavenumber positionsof the raman bands of the unknown spectrum are localized, to compare them with those ofthe reference spectra. The identification system comparing the whole spectrum is made byestimating the degree of similarity between two spectra, that is the correlation coefficient.To make the correlation independent of the Raman intensities each spectrum is normalizedbetween 0 and 1. The crisp inputs of the system are the correlation coefficients betweenthe unknown spectrum and each of those of the chosen library. The system has fourrules to make a decision. Then, for an obtained correlation coefficient, each of these fourrules is interpreted by implication, using the product operator. For each implication, afuzzy set is obtained and all of them are aggregated, by means of the sum, into a singleoutput fuzzy set. Finally, the output crisp value, the degree of similarity between problemspectrum and reference spectrum, is calculated using the centroid method. In the otherhand, identification system locating the Raman bands needs only the wavenumber positionof the Raman bands. So the system only looks for the coincidence in the position ofall the bands of the two compared spectra. The input variables of the system are thewavenumbers, on which the Raman bands of the spectrum under analysis are centred.The fuzzy system for bands detection used in this article has been described in this section[19] . The output variables are the pigments among those catalogued in the library withwhich the unknown spectrum shares some bands. The higher the number of commonbands, the more similar are the compared spectra. The membership functions assignthe greatest degree of membership (value 1) to the exact position of the band, a smallerdegree of membership to the values of adjacent wavenumber positions in a spectral rangeand a degree of membership zero for the wavenumber positions out of that range. Theoutput variables are, on one hand, the names of each pigment with which the system finds

16 CHAPTER 3. RAMAN SPECTRA CLASSIFICATION
coincidences, and on the other hand, for each of those pigments, a degree of securityin their identification. One important result is that in cases of the mixture, the systemlocating the bands identifies the presence of two or more pigments, whereas the other oneonly recognizes one of them , the one in which the similarity degree is higher.
In [2] is presented a three-phase methodology that automates the spectral comparisonbased on one of the most powerful paradigms in machine learning, the case-based reason-ing (CBR). The spectra are processed in order to minimize the noise effects and eliminatethe fluorescence baseline before being used by the system. The first step is normalization,interpolation and reduction of the number of data points of the spectra without loss infor-mation with PCA. Once the spectra have been processed, the system has to capture amongall the spectral patterns those that are the most similar to the analyzed spectrum and it re-turns an identification degree that may help the user to identify the unknown pigment. Foreach unknown spectrum is proposed a solution taking into account previous knowledge.The methodology works as a case-based reasoning system finding out the best solutionfor in each case by following an inference strategy. Is composed of the following phases
• Retrieves the most similar cases from the case memory.
• Adapts them to propose a new solution.
• The user checks if this solution is valid.
In this article it is not the objective to work with large spectral libraries, actually, they usesome characteristics that can be used to exclude a large number of pigments. This systemmake use of the complete spectra and not only their band positions, but to avoid handlinga large number of points for each spectrum they make use of principal component analysis(PCA). The most similar pigments are retrieved using Pearson coefficients. Candidate bycandidate, the inference process deals independently with four rules and leads, for eachof them, to a fuzzy set output. Finally the user takes his final decision by evaluating thesolutions proposed by the system.
3.3.2 Neural networks and othersThe article [7] describes application of artificial neural networks and statistical methodsto analyse a Raman spectra database and to use the results of the analysis in structureelucidation process. A statistical algorithm is used to search a database of spectra forreliable regularities required for determining the presence of spectrasubstructure correla-tions. The database contains 156 Raman spectra of organic compounds. The spectra weretransformed into vectors encoded in the binary system and divided in intervals. Each in-terval is assigned a 0 value or a 1 value. If the spectrum of a compound has at least onesignificant peak in an interval, the interval code is 1. If no peak appeared in an interval,the 0 value is given as the code. A set of vectors representing Raman spectra and codedinformation about the presence or absence of a selected substructure was divided into atraining set and a testing set. With these sets, a correlation vector is created by rejectingthe components whose values are below a given threshold value. Then the generation of arule knowledge base consistent with the regularities represented by the correlation vectoris created. The fixed spectrumsubstructure correlations were automatically transformed
3.4. PCA: PRINCIPAL COMPONENT ANALYSIS 17
into rules if - then. The user inputs into the computer the spectral parameters (band lo-cations and intensities) of the Raman spectrum obtained for the investigated compound.The inference engine utilizing the knowledgebase produces the list of substructures thatprobably form a part of the molecule of the examinated substance. In the other hand,in the neural network approach, designing and training of artificial neural networks wascarried out with the use of a commercial program Stastica Neural Networks. As a result,the neural network method achieved more reliable results for almost all substructures.
In [23] an integrated software system for processing, analyzing, and classifying Ra-man spectra is presented. The system is open source and extensible, allowing the commu-nity of Raman researchers to make continual improvements to the software It has featuresto subtract background and fluorescence. Implements several analysis and classificationtechniques, such as principal component analysis and support vector machines (SVM).For each of these techniques, a model is created by training the algorithm with selectedgroups of spectra. The system currently supports three different algorithms for spec-tral classification, one based on linear discriminant analysis (LDA), another implementedan artificial neural network (ANN) and the last one employs support vector machines(SVMs).
The article [24] says that identification of an unknown species based on spectroscopicdata is a common statistical problem. Most of these statistical methods can be separatedin two main groups, unsupervised or exploratory and supervised methods. Unsupervisedmethods are used for studying experimental spectral data without a prior knowledge ofthe object. Hierarchical cluster analysis (HCA), Density Based Spatial Clustering of Ap-plications with Noise or PCA based methods of the dimensionality reduction are morecommonly used approaches. Supervised methods utilize a prior knowledge about the sys-tem by developing classification models based on known spectra . These methods includeLinear DA (LDA), Direct LDA (DLDA), Kernel-based LDA , Multivariate Analysis ofVariance ... Each of these algorithms is most efficient for a certain type of data. In caseswhen the data set characteristics are not known, selection of the algorithm is usually doneusing trial and error.
An example of the use of support vector machines is in [21]. This method uti-lizes the entire spectrum and determining the state of the cells based upon the similar-ities/differences of the examined spectra versus an established database. The SVM tech-nique is used to classify. The classification intends to identify the cell mortality type, bydistinguishing among apoptotic versus healthy cells and necrotic versus healthy cells.
In this experiment, the data is used in its raw form without any further processing be-cause the baseline, fluorescence, and intensity range of the spectra are characteristics ofthe cellular state. Therefore removing them will reduce the convoluted spectral informa-tion.
3.4 PCA: Principal Component AnalysisPrincipal component analysis is a mathematical procedure that uses an orthogonal trans-formation to convert a set of observations of possibly correlated variables into a set ofvalues of linearly uncorrelated variables called principal components. Normally is relatedwith identification made through the whole spectrum. Below are some works related to

18 CHAPTER 3. RAMAN SPECTRA CLASSIFICATION
this technique.In [30] is made an evaluation of a searching algorithm based on principal component
analysis for identification of organic pigments. Before processing the principal compo-nents calculations a baseline-correction is performed to avoid background and fluores-cence. The spectra are normalized. The training set of reference spectra is used for theprincipal components analysis. 28 PCs are extracted from each spectrum. For the prob-lem spectrum is made a similar pretreatment. Comparison between the unknown and thereferences is made using the Euclidean distance between two data points as a measure oftheir similarity. They obtained bad results when the spectra have low signal to noise ratio.
In [4] uses PCA and cluster analysis to classify glasses and glazes. With cluster analy-sis creates a hierarchical tree diagram that assembles samples as a function of the shortestdistance. Clusters presented are built using a Euclidean distance.
In [12] is made an experiment to identify phylogenetically homogeneous Bacillussubtilis-group. First normalize spectra and the first derivatives were calculated to min-imize the influence of background signal caused by slight sample fluorescence. Then datareduction is performed using principal component analysis. During internal evaluationthe complete dataset (219 experiments) was randomly splitted in a training set (3/4) and atest set (1/4). To search similarities is used the euclidean distance. The identification wasregarded as reliable at the species level when at least three out of five matches pointed tothe same species. They say that this method should not be considered as a stand-alonetechnique for taxonomic purposes.
In [13] spectra were reduced using principal component analysis and six linear dis-criminant analysis models (LDA) were calculated to construct an identification scheme.Taking conventional microbiological identification as the reference method, the accuracyof this identification scheme was 90%.
3.5 Other algorithmsIn [29] is presented an evaluation of a spectral searching algorithm for the comparison ofRaman band positions. The algorithm evaluates all reference spectra one after the other,searching for coincidences in bands positions. Only reference products with at least onecorresponding band are included in the list of results. In order to be able to investigatemixtures of compounds, combinations of the products with at least one identified Ramanband can be made and are treated like the reference spectra. Finally, the selected (combi-nations of) reference products are evaluated and sorted, by using an appropriate measureof similarity. Different measures of similarity or dissimilarity can be used, as the num-ber of bands of the unknown that can be explained by the reference product, number ofbands of the unknown spectrum that are not present in the corresponding reference spec-trum, bands that are present in the reference spectrum, but that cannot be observed in thespectrum of the unknown, deviation between an identified Raman band position of theunknown and the reference product and the root-mean-squared (RMS) deviation betweenthe Raman band position of the reference product and the band position of the unknown.If not all Raman bands of the unknown product can be assigned to a single referenceproduct (i.e. the number of unidentified bands greater than 0), an iterative approach canbe used. In that case, combinations of reference products with at least one identified band

3.5. OTHER ALGORITHMS 19
are made (the lists of reference band positions are merged), and this combination is eval-uated. The algorithm was thoroughly evaluated with different test samples, recorded ona different spectrometer than the reference spectra. In general, the algorithm is able toidentify the pigments in the sample, even in a mixture. But when some reference productshave a very high number of Raman bands, accidentally they can quite easily give rise to acertain number of identified bands, masking the presence of a compound with only a lim-ited number of Raman bands. Also, in mixtures weak bands are not always detected andthe most intense features of a certain reference product may in a mixture only be presentas a band of minor intensity.
In [14] it is talked about the design of a portable spectrometer. For this, use a treatmentof three main stages. Initially, the background has to be removed from the spectrum. Thebackground of the spectrum is approximated by a first-degree polynomial and then thebackground is subtracted from the measured spectrum. The second step of pre-processingis spectrum smoothing and is performed to reduce its random component and acciden-tal spikes. A Savitzky and Golay smoothing filter is chosen. Third, the pre-processedspectrum is parameterized to establish a set of parameters (positions of the spectra peaks,their relative amplitudes and their widths). To find positions of the spectral lines a deriva-tive of the spectrum is examined. Chemicals are detected by comparing the registeredspectrum with the reference spectra available in the database. The spectra are comparedby summing up, according to different norms like absolute difference value search, firstderivative absolute value search or least squares search. For a portable device the dataprocessing time of each algorithm is a very important parameter so they conclude that thealgorithms based on the first derivative of Raman spectra are most efficient for chemicalsdetection.

20 CHAPTER 3. RAMAN SPECTRA CLASSIFICATION

Chapter 4
Solution Definition
4.1 Resumen
El algoritmo de nuestra propuesta se basa en la comparacion de bandas raman. Estealgoritmo tiene dos fases principales, una busqueda inicial y una busqueda recursiva.
En la fase inicial se recuperan de las base de datos todos los espectros que tienen unaintensidad relativa igual a 1 con el mismo desplazamiento raman que la banda de mayorintensidad del espectro problema. A continuacion se buscara enlazar el resto de picos delespectro problema con los del espectro referencia. Una vez se han encontrado todas lascoincidencias posibles entre los espectros, si aun quedan bandas por identificar se pasa ala fase recursiva.
La fase recursiva renormaliza el espectro en intensidad y busca enlazar con otros es-pectros referencia los que no se han podido identificar en las fases anteriores. Esto serepetira hasta que no queden bandas del espectro problema por identificar o hasta que nohaya candidatos.
4.2 Initial search
The algorithm of our proposal is based on bands comparisons. This algorithm has twomain phases, an initial search and a recursive search. In the two next sections both phaseswill be explained.
The algorithm starts retrieving the spectra that have a band that matches with the bandwith the maximum intensity in the problem spectrum. If, besides of the band with themaximum intensity, all the bands of the problem spectrum have matched, the referencespectrum contains all the bands of the problem spectrum and therefore the problem spec-trum is a pure material. In the other hand, if after matching all the rest of bands of thereference spectrum still there is one or more bands of the spectrum problem that havenot been matched, the problem spectrum probably belongs to a mixture of two or morematerials.
From the set of possible candidates, there will be discarded those whose characteristicsbands don’t match with the problem spectrum bands. We define characteristics bands asthe eighty per cent of the number of bands of the reference spectrum that has a normalized
21
22 CHAPTER 4. SOLUTION DEFINITION
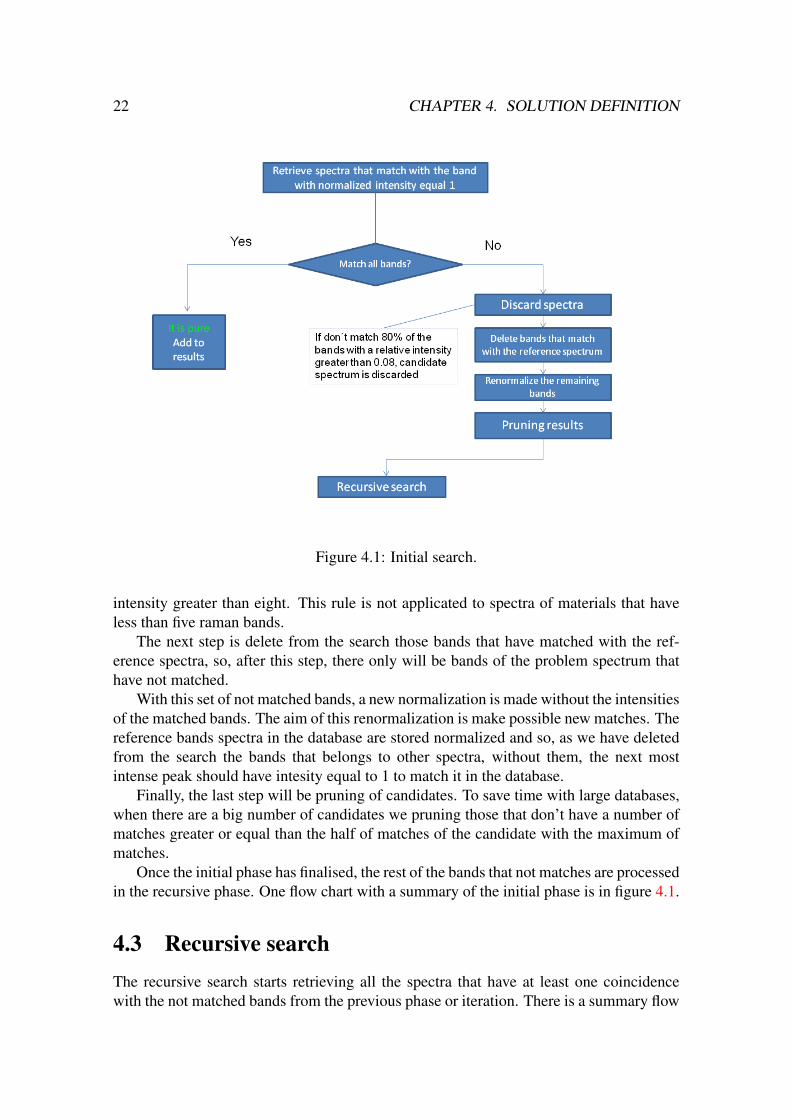
Figure 4.1: Initial search.
intensity greater than eight. This rule is not applicated to spectra of materials that haveless than five raman bands.
The next step is delete from the search those bands that have matched with the ref-erence spectra, so, after this step, there only will be bands of the problem spectrum thathave not matched.
With this set of not matched bands, a new normalization is made without the intensitiesof the matched bands. The aim of this renormalization is make possible new matches. Thereference bands spectra in the database are stored normalized and so, as we have deletedfrom the search the bands that belongs to other spectra, without them, the next mostintense peak should have intesity equal to 1 to match it in the database.
Finally, the last step will be pruning of candidates. To save time with large databases,when there are a big number of candidates we pruning those that don’t have a number ofmatches greater or equal than the half of matches of the candidate with the maximum ofmatches.
Once the initial phase has finalised, the rest of the bands that not matches are processedin the recursive phase. One flow chart with a summary of the initial phase is in figure 4.1.
4.3 Recursive searchThe recursive search starts retrieving all the spectra that have at least one coincidencewith the not matched bands from the previous phase or iteration. There is a summary flow

4.3. RECURSIVE SEARCH 23
Figure 4.2: Recursive search.
chart in figure 4.2.When the rest of the not matched bands are matched, the reference spectrum is in-
cluded in the solution as a part of a mixture. But when still there are not matched bands,a new recursive search is made. Before recursive search, a process similar to the initialsearch is done with the remaining bands. First, the candidate spectra may be discardedif don’t match with the characteristic bands ( the eighty per cent of the bands that hasintensity greater than 0.08). With this rule we avoid non representative matches.
After it, the matched bands are deleted from the next recursive search and like theprevious search, the rest of the spectrum is now renormalized with the same aim. Againa pruning of results is made to avoid non representative mixtures composed by a highnumber of materials. The pruning made is the same than in the initial search.
The recursive search will finish in one of two cases. When all the problem spectrumbands are identified or when there is not more candidates for the not matched bands.
As a result of this recursive algorithm a tree is created with the reference spectra thatcover all the bands of the problem spectrum. Each tree level may have a set of referencespectra that match with a diferents sets of bands.
With this algorithm a detailed information is given to the user. For each band of theproblem spectrum, a list of reference spectra is shown to help the user to identify thematerial.

24 CHAPTER 4. SOLUTION DEFINITION

Chapter 5
Experimental Results
5.1 Resumen
Se ha desarrollado una infraestructura tecnologica basada en una base de datos MySQL yPHP para implementar la propuesta de algoritmo.
Se ha contado con un corpus de unos 2346 espectros raman para probar el algoritmo.Este corpus se ha obtenido del proyecto RRUFF.
En primer lugar se ha probado el algoritmo de identificacion con los espectros delpropio corpus. En todos los casos los espectros han sido identificados, sin embargo en el21 por ciento de los casos, el numero de resultados obtenido ha sido demasiado numeroso.
En segundo lugar se ha comparado el algoritmo propuesto con uno publicado reciente-mente que tambien se basa en comparacion de bandas raman. Sin embargo este algoritmono utiliza la intensidad de las bandas raman. Probando este algoritmo con el mismo cor-pus, se ha observado que el numero de resultados muy numerosos se ha incrementadohasta el 45 por ciento.
5.2 Experimental Design
For testing the recognition algorithm, has been created an technological infrastructurebased on a web interface. The spectrum database has been mainly developed with MySQLand the algorithm has been implemented with object-oriented PHP and Java.
With PHP has been implemented the algorithm and all the necessities of managementand treatment of the spectra, like normalization, baseline removal, automatic detection oframan bands...
With Java has been developed the graphical interface to easily interact with the spectra.Some examples of this functionalities are visualize Raman bands, plot baselines, makezoom on the spectra, visualize results...
We have made tests in two different corpus. On the one hand we have a databasecreated at Unidad Asociada UVa-CSIC a traves del Centro de Astrobiologia [28] thatcontains 224 raman spectra of 117 samples, on the other hand, we have used the set ofspectra that the program Crystal Sleuth, developed by the RRUFF project [5], contains tomake identifications.
25

26 CHAPTER 5. EXPERIMENTAL RESULTS
But the set of spectra that Crystal Sleuth contains does not have information about ra-man bands, it only has raw spectra. So, to make possible the utilization of this corpus withour algorithm, it was necesary process this set of spectra. Therefore we have developedan automatic process that extracts the information about raman bands in the set of spectraof Crystal Sleuth.
As this set of spectra has been obtained from the RRUFF database, it has a heteroge-neous spectra set, so there are spectra with a good ratio signal-noise where it is easy toautomatize the automatic recognition of peaks but also there are a group of noisy spectrawhere our automatic process does not work as wanted.
Taking this into mind, from the original set of 2643 spectra have been filtered 297spectra that have not a good signal-noise ratio. So our corpus has 2346 spectra from 1571samples.
5.2.1 Testing algorithm with the corpusFor testing our proposed algorithm we have randomly selected 100 spectra from the set ofCrystal Sleuth program which are part of the whole corpus.
For the automated identification process we have used a margin of error of 5 cm−1 forraman shift and a margin of error of 0.05 over 1 for intensity. With the automatic processwe have evaluated the identifying this set of 100 spectra, getting the following results:
• All of them have been correctly identified. All results lists have the original spec-trum as a suggestion that matches with the raman bands of the spectrum problem.
• In 55 of the 100 spectra there is only one suggestion to identify the problem spec-trum . So, in these cases the problem spectrum is identified unequivocally.
• In 21 cases the number of results is too large taking values from 28 to 628 sugges-tions, so for this cases the result may be unacceptable.
In 5.1 it is shown an example recognition of jarosita in the system with 5 cm−1 ofmargin of error for raman shift, 5 percent of error for intensity and 3 times the varianze tosearch peaks in the problem spectrum.
In conclusion, this algorithm is able to identify the spectra from the corpus but it seemsreasonable find a way to make more accurate the threshold that decides when a problemspectrum matches with a reference spectrum.
5.2.2 Comparison between propolsalsAs discussed in section 3.5 in [29] is presented an algorithm for the comparison of Ramanband positions. As the algorithm presented in this work, this solution is based in compar-isons between raman bands , an iterative comparison and a measure to know the similaritybetween two spectrums. But between these two proposals there are two main differences:
• Algorithm in [29] evaluates all reference spectra one after the other while the al-gorithm presented here only evaluates those which have matched with the highestintensity band and with the derivates that still have matched with the remaining

5.2. EXPERIMENTAL DESIGN 27
Figure 5.1: Example identification of a jarosite spectrum through the developed system.
bands that have not matched with the first reference spectrum. This way of evaluatethe reference spectra searching for matches saves time and is an important issuewhen there are more than 2000 spectra, like in the used corpus.
• As the article itself mentions, the main disadvantage of this approach is that theintensity of the bands is not taken into account. The reason of not using intensitiesfor looking for matches is that the intensity of a spectrum may change dependingon the spectrometer used. But in the other hand, the intensity is a very powerfulthreshold to reduce the number of candidates for a spectrum problem, even morewhen there is a big database of reference spectra. To prove it , the same experiment(5.2.1) than in the previous section has been performed but for this time the ramanbands matches have been searched only taking into account raman shift. The re-sults are the followings, in figure 5.2 there is a summary with the results of bothexperiments:
– Like in the previous experiment, all of them have been correctly identified.All results lists have the original spectrum as a suggestion that matches withthe raman bands of the spectrum problem.
– None of them has only one suggestion to identify the problem spectrum. Theminimum of suggestions is three.
– In 45 cases the number of results is too large taking values from 26 to 153suggestions, so for this cases the result may be unacceptable.

28 CHAPTER 5. EXPERIMENTAL RESULTS
With Intensity Without IntensityIdentified 100% 100%Only one suggestion 55% 0%Too large results 21 % 45 %
Figure 5.2: Comparison between searching raman bands with and without intensity
Figure 5.3: Mixture of calcite and gypsum.
With this results, make the searches of raman bands with coincidence in intensityseems necessary when there is a large amount of spectra to compare at least in the firstiteration of the search. The problem of having spectra from different spectrometers andtherefore probably with different intensities of the raman bands can be avoided in partthrough normalizing the spectra and with definition of tolerance margins.
5.2.3 Identification of mixtures of compoundsThe algorithm proposed here has been developed bearing in mind the possibility of iden-tify samples compounded of more than one mineral. These mixtures can be compoundedof minerals in different proportion that can modify the absolute intesity of a raman band.So to achieve identify more than a compound in one spectrum the recursive search wasdevelopped as is described in section 4.3.
In the case of tests made with different real samples of calcite and gypsum with differ-ent proportions, the algorithm is able to identify both minerals but also gives as a solutionaround other sixty spectra. The result of recognition the mixture can be seen in figure 5.3.
Also, with mixtures can occur that with a low proportion of a compound not all ramanbands appear in the spectrum and so the rule used in the algorithm of having at least 80per cent of number of raman bands can leave out from suggestion the real compound.

Chapter 6
Conclusions and future work
6.1 Resumen
Este trabajo hace un estado del arte de los principales artıculos sobre identificacion deminerales a traves de espectros raman.
Se ha hecho una propuesta de algoritmo de identificacion capaz de identificar min-erales a traves de su espectro raman pero que necesita de alguna mejora para reducir elnumero de resultados para un espectro problema en un 21 por ciento de los casos. No ob-stante, lo desarrollado puede ser una potente herramienta para espectroscopistas expertos.
Este trabajo sera presentado en el congreso European Planetary Science Congress2012 en Septiembre de 2012.
Como trabajo futuro se buscara mejorar el algoritmo e incluir en el procesado de losespectros la eliminacion automatica de la linea de base de los espectros y la deteccionautomatica de bandas raman.
6.2 Conclusions
This work makes a compilation of some articles related with the identification of differentmaterials or compounds through its raman spectrum. Also, taking into account the ideasfound in the articles an algorithm has been developped to identify single minerals andmixtures. Beside the algorithm, an technological infrastructure has been created to testthe algorithm and to help user to processing raman spectra. This algorithm always takesas a precondition that the baseline has been correctly removed from the problem spectrumand its raman bands has been correctly plotted.
As the results showed, this algorithm is able to identify minerals through its ramanspectrum but seems necessary make a improvement that makes a more strict thresholdthat decreased the number of suggestions in some cases.
Although the algorithm with the technological infrastructure developed can be a pow-erful tool with a combination of it and some ideas from the articles presented here canmake more reliable and a better usability.
This work will be presented at European Planetary Science Congress 2012 [9] as Ra-man spectra processing algorithms and database for RLS-ExoMars. The poster also will
29

30 CHAPTER 6. CONCLUSIONS AND FUTURE WORK
include a study and an proposal of an algorithm to automatic baseline removal and auto-matic peak detection. It will be presented during the session Planetary in situ measure-ments
6.3 Future work• Develop an algorithm to automatic background removal. To do it, the starting point
will be [33].
• Improve algorithm automatic raman bands detection.
• Develop an algorithm and a database for a portable device.
• Develop an online database with mineral identification capabilities.

Bibliography
[1] Monica Breitman, Sergio Ruiz-Moreno, and Alejandro Lopez Gil. Experimentalproblems in raman spectroscopy applied to pigment identification in mixtures. Spec-trochimica Acta Part A 68, 2007.
[2] M. Castanys, R. Perez-Pueyo, M. J. Soneira, E. Golobardes, and A. Fornells. Iden-tification of raman spectra through a case-based reasoning system: application toartistic pigments. Journal of Raman Spectroscopy, 2011.
[3] M. Castanys, M. J. Soneira, and R. Perez-Pueyo. Automatic identification of artisticpigments by raman spectroscopy using fuzzy logic and principal component analy-sis. Laser Chemistry, 2006.
[4] Philippe Colomban, Aurelie Tournie, and Ludovic Bellot-Gurlet. Raman identifica-tion of glassy silicates used in ceramics, glass and jewellery: a tentative differentia-tion guide. Journal of Raman Spectroscopy, 2006.
[5] Database of Raman spectra, X-ray diffraction and chemistry data for miner-als Last Access 27 February 2012. http://rruff.info/about/about_software.php.
[6] Marleen de Veij, Peter Vandenabeele, Thomas De Beer, Jean Paul Remonc, and LucMoensa. Reference database of raman spectra of pharmaceutical excipients. Journalof Raman Spectroscopy, 2008.
[7] B. Debska and B. Guzowska-Swider. Searching for regularities in a raman spectraldatabase. Journal of Molecular structure, 2005.
[8] Howell G. M. Edwards. Handbook of Raman Spectroscopy, volume 1. MarcelDekker, Inc, 1th edition, 2001.
[9] European Planetary Science Congress 2012 Last Access 15 July 2012. http://www.epsc2012.eu/home.html.
[10] European Space Agency Web Last Access 12 January 2012. http://sci.esa.int/science-e/www/object/index.cfm?fobjectid=45103&fbodylongid=2130.
[11] John R. Ferraro, Kazuo Nakamoto, and Chris W. Brown. Introductory Raman Spec-troscopy, volume 1. Elsevier, 3th edition, 2003.
31

32 BIBLIOGRAPHY
[12] Didier Hutsebaut, Joachim Vandroemme, Jeroen Heyrman, Peter Dawyndt, PeterVandenabeele, Luc Moens, and Paul de vos. Raman microspectroscopy as an identi-fication tool within the phylogenetically homogeneous bacillus subtilis-group. Sys-tematic and Applied Microbiology, 2006.
[13] M. S. Ibelings, K. Maquelin, H. Ph. Endtz, H. A. Bruining, and G. J. Puppels. Rapididentification of candida spp. in peritonitis patients by raman spectroscopy. Euro-pean Society of Clinical Microbiology and Infectious Diseases, 2005.
[14] Andrzej Kwiatkowski, Marcin Gnyba, Janusz Smulko, and Pawe Wierzba. Algo-rithms of chemicals detection using raman spectra. METROLOGY AND MEASURE-MENT SYSTEMS, 2010.
[15] Derek A. Long. The Raman Effect: A Unified Treatment of the Theory of RamanScattering by Molecules, volume 1. John Wiley Sons Ltd, 1th edition, 2002.
[16] Steve Lowry, Dick Wieboldt, Dave Dalrymple, Renata Jasinevicius, and Robert T.Downs. The use of a raman spectral database of minerals for the rapid verificationof semiprecious gemstones. Spectroscopy, 2009.
[17] Fernando Rull Perez and Jesus Martinez-Frias. Raman spectroscopy goes to mars.Spectroscopy Europe.
[18] R. Perez-Pueyo, M. J. Soneira, M. Castanys, and S. Ruiz-Moreno. Fuzzy approachfor identifying artistic pigments with raman spectroscopy. Applied Spectroscopy,2009.
[19] R. Perez-Pueyo, M. J. Soneira, and S. Ruiz-Moreno. A fuzzy logic system for banddetection in raman spectroscopy. Journal of Raman Spectroscopy, 2004.
[20] G.D. Pitt, D.N. Batchelder, R. Bennett, R.W. Bormett, I.P. Hayward, B.J.E. Smith,K.P.J. Williams, Y.Y. Yang, K.J. Baldwin, and S. Webster. Engineering aspects andapplications of the new raman instrumentation. IEE Proceedings, 2005.
[21] Georgios Pyrgiotakis, O. Erhun Kundakcioglu, PanosM. Pardalosc, and BrijM.Moudgil. Raman spectroscopy and support vector machines for quick toxicologi-cal evaluation of titania nanoparticles. Journal of Raman Spectroscopy, 2007.
[22] Pablo Manuel Ramos, Joan Ferre, Itziar Ruisnchez, and Konstantinos S. An-drikopoulos. Fuzzy logic for identifying pigments studied by raman spectroscopy.Applied Spectroscopy, 2004.
[23] Luke A. Reisner, Alex Cao, and Abhilash K. Pandya. An integrated software sys-tem for processing, analyzing, and classifying raman spectra. Chemometrics andIntelligent Laboratory Systems, 2010.
[24] Vitali Sikirzhytski, Kelly Virkler, and Igor K. Lednev. Discriminant analysis oframan spectra for body fluid identification for forensic purposes. Sensors, 2010.

BIBLIOGRAPHY 33
[25] Ewen Smiths and Geoffrey Dent. Modern Raman Spectroscopy A Practical Ap-proach, volume 1. John Wiley Sons Ltd, 1th edition, 2005.
[26] Pablon Sobron, Francisco Sobon, Aurelio Sanz, and Fernando Rull. Raman signalprocessing software for automated identification of mineral phases and biosignatureson mars. Applied Spectroscopy, 2008.
[27] M. Castanys Tutzo, R. Perez-Pueyo, M. J. Soneira, and S. Ruiz Moreno. Fuzzylogic: a technique to raman spectra recognition. Journal of Raman Spectroscopy,2005.
[28] Unidad Asociada UVa-CSIC a traves del Centro de Astrobiologia: EspectroscopiaAvanzada en Ciencias de la Tierra y Planetarias Last Access 3 May 2012. http://tierra.rediris.es/erica.
[29] Peter Vandenabeele. Evaluation of a spectral searching algorithm for the comparisonof raman band positions. Spectrochimica Acta Part A 80, 2011.
[30] Peter Vandenabeele, An Hardy, Howell G. M. Edwards, and Luc Moens. Evalua-tion of a principal components-based searching algorithm for raman spectroscopicidentification of organic pigments in 20th century artwork. Applied Spectroscopy,2001.
[31] Hana Vaskova. A powerful tool for material identification: Raman spectroscopy. In-ternational journal of mathematical models and methods in applied sciences, 2004.
[32] Hana Vaskova. Raman spectroscopy as an innovative method for material identifi-cation. Recent Researches in Automatic Control, 2004.
[33] Andrew T. Weakley, Peter R. Griffiths, and D. Eric Aston. Automatic baseline sub-traction of vibrational spectra using minima identification and discrimination viaadaptive, least- squares thresholding. Applied Spectroscopy, 2012.