automated vector network analysis at millimeter-w ave frequencies
TRANSCRIPT
AUTOMATED VECTORNETWORK ANALYSIS
ATMILLIMETER-WAVE
FREQUENCIES
JEFF CAUFFIELD
Network Measurements Division1400 Fountain Grove Parkway
Santa Rosa, Ca. 95401
1
RF ~ MicrowaveMeasurementSymposiumandExhibition
rlin- HEWLETT-.:~ PACKARD
www.HPARCHIVE.com
AUTOMATED VECTOR NETWORK ANALYSISAT MILLIMETER-WAVE FREQUENCIES
This paper describes both the hardware andsoftware techniques used to extend themeasurement capabilities of the HP 8510network analyzer to cover the 26.5 to 60 GHzwaveguide bands using available hardware.System operation, methods of calibration,calibration standards, and other factorsaffecting system performance will bediscussed. Measurement results, includinggroup delay and time domain, will be shown fora variety of devices.
V/"
Author: Jeff Cauffield, R&D Engineer, HPNetwork Measurements Division, Santa Rosa, CA.BS Engineering Physics (1977) and Master ofEngineering (1978), Cornell University. withHP since 1978, contributed to the design ofthe HP 8510A Network Analyzer. Currentlyinvolved with the extension of the HP 8510 tomillimeter-wave frequencies.
2
www.HPARCHIVE.com

3651
3652
3653
AUTOMATED VECTORNETWORK ANALYSIS
ATMILLIMETER-WAVE
FREQUENCIES
OUTLINE OF TOPICS
I. DESCRIPTION OF SYSTEM
II. CALIBRATION
III. SYSTEM PERFORMANCE
IV. TYPICAL MEASUREMENTS
I. DESCRIPTION OF SYSTEM
3
Hardware and software techniques used toextend the measurement capabilities ofthe HP 85l0A Network Analyzer to coverthe 26.5 to 60 GHz waveguide bands usingavailable hardware will be described.Calibration standards and techniqueswill be discussed and resultsdemonstrated. Factors affecting systemperformance are explained. Finally,measurement results on typical deviceswill be shown, including group delay andtime domain.
www.HPARCHIVE.com
Some key features of the system include:a dynamic range of 80 to 100 dBdepending on averaging, data acquisitionrate, and accuracy similar to amicrowave HP 8510 operated in stepped CWmode, stimulus control via an externalcalculator, bypassing the HP 8510samplers for less conversion loss, and areflection/transmission test set withflexible heads. These features offerimpressive new measurement capabilities.
FEATURES
- Dynamic r~lnge of 80 to 100 dB dependingon averaging.
- Accuracy and speed similar to microwaveHP 8510 stepped CW operation.
- Series 200 controller replaces HP 8510stimulus block. Sources are controlledby calculator, not HP 8510.
- No HP 8510 series test set required.No sampler conversion loss.
- Reflection/Transmission test set withflexible heads.
3657
Millimeter-waveSignal Source
FrequencyMultiplier
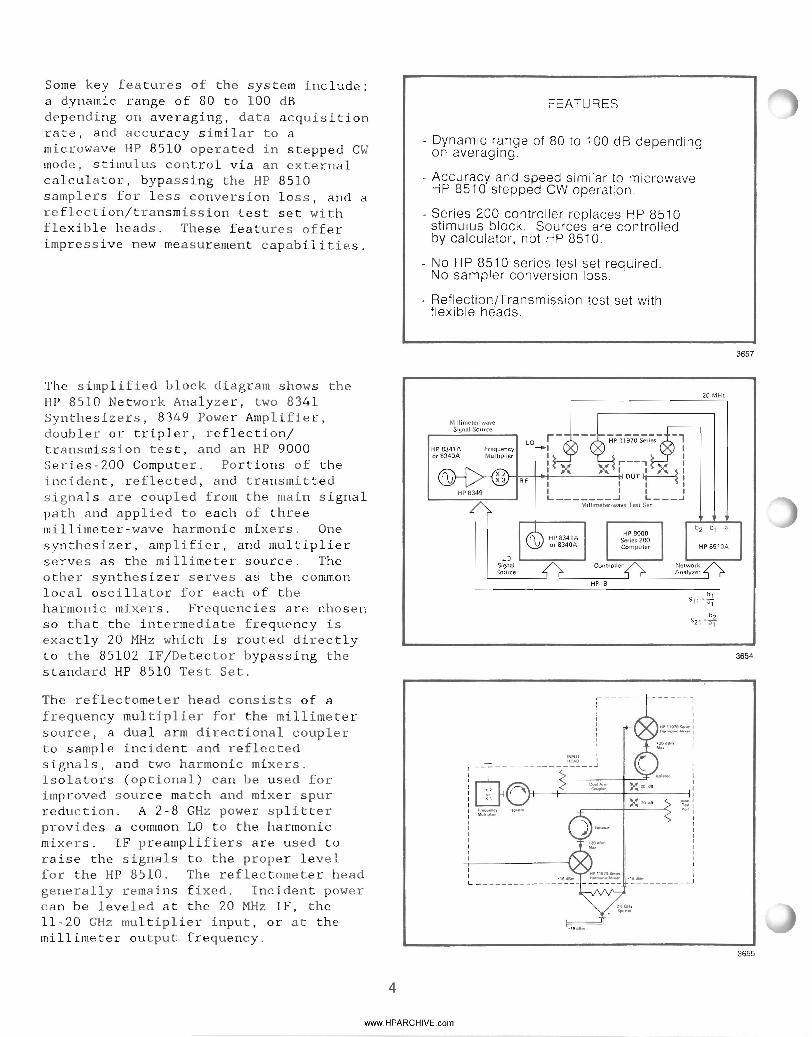
The simplified block diagram shows theHP 8510 Network Analyzer, two 8341Synthesizers, 8349 Power Amplifier,doubler or tripIer, reflection/transmission test, and an HP 9000Series-200 Computer. Portions of theincident, reflected, and transmittedsignals are coupled from the main signalpath and applied to each of threemillimeter-wave harmonic mixers. Onesynthesizer, amplifier, and multiplierserves as the millimeter source. Theother synthesizer serves as the commonlocal oscillator for each of theharmonic mixers. Frequencies are chosenso that the intermediate frequency isexactly 20 MHz which is routed directlyto the 85102 IF/Detector bypassing thestandard HP 8510 Test Set.
HP 8341Aor 8340A
LO r- --- H";;9705;,;'- -,I II II ,...--, I
)-f,;-;,--t+1It---==X-"---_.::.cX"-----il1 ~ IOUT~I
I I I II I I I~-------~ ~---~Millimeter-wave Test Set
20 MHz
3654
------,III
::==::'
ttIIIII
.~~Ilm J
,-------,,II,,,tI,,
HEAO I_______________ .J
'--
The reflectometer head consists of afrequency multiplier for the millimetersource, a dual arm directional couplerto sample incident and reflectedsignals, and two harmonic mixers.Isolators (optional) can be used forimproved source match and mixer spurreduction. A 2-8 GHz power splitterprovides a common LO to the harmonicmixers. IF preamplifiers are used toraise the signals to the proper levelfor the HP 8510. The reflectometer headgenerally remains fixed. Incident powercan be leveled at the 20 MHz IF, the11-20 GHz multiplier input, or at themillimeter output frequency.
3655
4
www.HPARCHIVE.com

Tenn'~11Oft
3656
3658
3659
OUTPUTHEAD
,--------------------------------,IIII O""C:I!ONI
I ~~ ~I 1-1--------------lr----<:~tilt X lOdBP~.
HP 11970 SenesH••monI(;M,.er
BLOCK DIAGRAM NOTES
- System departs from the traditional mix-up. mix-down and sample block diagram.
- Multiply up, mix down directly to 20 MHz I.F.
- 3 Bands (R,O,U) 26.5 GHz to 60 GHz.
- Easy to change bands.
- System is easily duplicated
• Reference: HP Product Note 8510-1A
OPERATING CONSIDERATIONS
- HP 8510 feature set is preserved, includingtime domain
- No phaselock. 20 MHz I.F. is guaranteedby synthesis.
- HP 8510 requires 20 MHz I.F. exactly forproper averaging.
- Controller computes millimeter test frequenciesfor exact 20 MHz I.F.
- Incident power leveled.
5
The transmission head consists of asingle directional coupler, termination,low-pass filter and isolator, andharmonic mixer. The low-pass filter andisolator are recommended for bestdynamic range as they reduce mixerspurs. The transmission head LO uses along, .14l-inch, semi-rigid cable forflexibility. The head can be moved toallow insertion of the device under testeliminating the need for a customwaveguide return path. Electricallengths are not balanced due to the mixof dispersive waveguide andnon-dispersive coaxial cable. At theleast, a simple frequency responsecalibration balances the lengths.Frequency drift is not a problem sincethe millimeter source is synthesized.
The multiply-up, mix-down-directlytechnique offers improved dynamic range.Commercially available hardware existsto assemble millimeter systems in theWR-28, WR-22, and WR-l9 waveguide bands.Because of the modular nature of thereflection and transmission heads, onemillimeter system can cover threewaveguide bands. The heads are easy tochange in a matter of minutes. Becauseof the use of off-the-shelf hardware,the system is easily assembled andduplicated.
The use of the external controller forstimulus control only preserves theentire feature set of the HP 8510including calibration, time domain,display formats, plotting, etc. Thereis no phase lock, the proper IF beingguaranteed by frequency synthesis from acommon time base. The IF must beexactly 20 MHz for the averagingalgorithm to work correctly. This taskis taken care of by the externalcontroller. Incident power can beleveled at the IF of 20 MHz, themultiplier input of 11-20 GHz, ordirectly at millimeter frequencies.Most of the data taken here used IFleveling.
www.HPARCHIVE.com

The external controller softwareperforms two principal functions:stimulus control and calibration kitdefinition. The controller replaces theSTIMULUS menu (frequency domain only) onthe HP 8510 front panel and issues allcommands to the millimeter source andlocal oscillator. After programinitialization, a band selection menuappears. The band is specified and theappropriate calibration kit is loadedinto the HP 8510. Next, the STIMULUSmenu appears allowing choice of numberof points, start and stop frequency, andsource power. Default values can beused if desired. Then the measurementloop is entered until interrupted by akey hit from the HP 85l0A, resulting inreturn to local control.
The user need only follow these steps:
1. RUN2. Select waveguide band3. Select stimulus values4. Perform calibration5. Save instrument state6. Measure device under test
The stimulus settings on the HP 8510must match those in the controller. Inrecalling instrument state, thecontroller has no way of knowing ifcalibration set stimulus matches itsstimulus settings. The responsibilityrests with the user.
This polar plot shows the short-termphase stability of aI, the incidentpower signal. This was done at a CWfrequency. If the IF (intermediatefrequency) were not exactly 20 MHz, thenal would rotate around the chart at arate corresponding to the differencefrom 20 MHz. For the averagingalgorithm to work properly, al must bephase stable. The short-term deviationof about 10 degrees results from themultiplied phase noise of both the RFand LO. The absolute phase of al iscommon with bl and b2, hence, is ratioedout in the computation of S-parameters.
6
www.HPARCHIVE.com
Program Flow
RrSet Up Constants
And .,aults
Waveguide Band ......-- Waveguide BandSelection Menu Data
. + .De'IO" Cal KIt
+Stimulus Menu ....-- Stimulus Values
... +100tlalize Instruments
[
Retart
Wait unt Settled 7,nterrupt _Key+ Service Hit
Triggerrp 8510 LJal
Next Frequency
Sequence of Operations
Run
JSelect Waveguide
Band
J- Calibration
Kit Definition
Select StimulusValues
MeasurementCalibration
~Save Instrument
State
~Measure OUT
U•• ,.l ZREF 110.0 mUnlh
20.0 mUnit./
"'1 SHORT TERM sTAB,,-,,,.....--r-___
CENTER 39.999999960 GHzSPAN ".00000000" CJH:r
3670
3671
3672

3673
3674
3675
OTHER TECHNIQUES
POWER METERS / SIX PORT-cost effective magnitude or vector measurements-slow speed or CW measurements only-limited dynamic range
SCALAR NETWORK ANALYZERS-cost effective magnitude measurements-limited dynamic range
UP-CONVERT, DOWN-CONVERT, AND SAMPLE-uses existing miC?row.av~ analyzer-multiple conversion limits dynamic range
1.1. CALI BRATION
TYPES OF CALIBRATION
FREQUENCY RESPONSE: short or thru standards-corrects magnitude and phase tracking
ONE-PORT: short. offset short. sliding load-vector correction of directivity, source match,tracking
ONE-PATH TWO-PORT: one-port plus thru and isolation-measures 4 s-parameters with R/T test set-device must be reversed
Other techniques for millimeter-wavemeasurements have made use of powermeters, scalar network analyzers, andexisting microwave network analyzers.Dynamic range was limited by detectorlinearity, sensitivity, or multiplefrequency conversions. This system,however, combines high dynamic range,vector accuracy enhancement, andrelatively fast data acquisition. Inaddition, the feature set of the HP 8510is retained. Multiple data formats,time domain, and other system functionswere not re-invented in the controller.
Various methods of calibration existwhich require a differing number ofstandards, complexity, time required toperform, and results. The simplest andfastest is a frequency responsecalibration with a short for reflectionor a thru for transmission. Onlymagnitude and phase frequency trackingerrors are corrected. The one-portcalibration requires three standards andseveral measurements but provides vectorcorrection of directivity, source match,and tracking. A one-path, two-portcalibration is used with a reflectionand transmission test set and providesvector correction of four S-parameters.The device under test must be manuallyreversed, however.
7
www.HPARCHIVE.com

A flush short which can be used incombination with a quarter-wave shim isshown. The screw holes are such thatthe same captive screw can be used tohold the shim in place as well as theflush short by itself. The thickness ofthe.shim must be measured exactly andentered into the calibration kit. Thesestandards are commercially available aspart of the HP l1644A calibration kit.They are manufactured to bettertolerances than the standard flange butare still compatible. In addition,alignment pins can be used to improveperformance.
alignmenthole 4 pIs
.250 nom--.j
3676
3677
Uncorrected source match and directivitycause ripples in the measurement of anoffset short. In this case, the shortis at the end of 3 inches of WR-19. Thereturn loss is measured with twodifferent calibrations. The large (1.5dB) ripples result from a simplefrequency response calibration with 24dB source match and 32 dB directivity.Source match is the primary contributor.The smaller (.2 dB) ripples result froma one-port calibration with 38 dB sourcematch and 40 dB directivity. The vectoraccuracy enhancement results in asuperior measurement. The round-triploss to the short is seen to be about.3 dB.
8
www.HPARCHIVE.com
CA
511 & M log MAGREF 0.0 dB
0.5 dBI
IOF FT ~ IAT
~ r A A{IJ\L j, IA ~f'. 1Il,A /lJ,Y 4A In• I"" II'\- I V'f'
\ \ V V 1 '1
~
START 39.999999960 GHzSTCP 59.999997960 GHz
3678

The return loss of a fixed loadspecified at 32 dB was measured usingtwo different calibrations. The uppertrace used a simple frequency responsecalibration with a flush short. Theload appears out of specification.However, this is due to the uncorrecteddirectivity of about 30 dB. The lowertrace used a one-port calibration with aflush short, offset short, and a slidingload. In addition, time domain gatingwas used around the test port flange andload. This further reduces directivityand source match errors. The fixed loadis now seen to be within specificationat 35 dB worst case.
START 39.999999960 GHzSTCP 59.999997960 GHz
511 &. M log MAGREF 0.0 dB
10.0 dB/
P "i' LOA
1-"",, r.-1 , '- '\. _\ 1\If\. I
'I \i I-'---'~ \r
1'-../~
G
c:A
3679
III. SYSTEM PERFORMANCE
3680
3681
BAND MIXER(GHz) HARMONIC
NUMBER
265-40
33-50 10
40-60 10
TEST SIGNALRESOLUTION
(HP 834X band no xfreq multiplier, Hz)
3x2
33-405 GHz 2 x 3405-50 GHz 3 x 3
40-405 GHz 2 x 340 5-60 GHz 3 x 3
LEAST RESOLUTIONCOMMON FREOUENCYMULTIPLE (Hz)
(Hz)
24 24
3{) 9090
30 9090
Because the HP 8510 IF must be exactly20 MHz, certain constraints are placedupon the millimeter source and localoscillator. The LO can move in 1 Hzsteps and is multiplied by 8 or 10 timesin the harmonic mixers. The microwaveinput to the doubler or tripler can movein 2 or 3 Hz steps. The millimeter testfrequency must be an integer multiple ofthe least common multiple of all themultiplication factors. The software inthe external controller calculates startand stop frequencies based on theseconstraints. The worst case deviationfrom the desired frequencies is equal tothe number of points times half theresolution frequency (18 kHz worstcase) .
9
www.HPARCHIVE.com

Measurement speed is proportional to thenumber of points and also a function ofhow many averages are taken at eachpoint. Stepping between points andwaiting for the synthesizers to settlerequires about 70 ms. The number ofpoints can be 51, 101, 201, or 401.Averaging number can be 1 to 4096 inpowers of 2. The system defaults to 201points and 64 averages which take littletime. This results in a sweep time of28 seconds.
Measurement speed
NO. OF AVG SWEEP TIME TIME/PT
POINTS FACTOR (sec) (msec)
51 64 7 140
51 1024 18 340
401 64 56 140
401 1024 140 340
3682
Effective measurement accuracy dependshighly upon the calibration devicesused. Using a commercial waveguidesliding load and calibration devicessuch as a flush and quarter-wave offsetshort, typical measurement portcharacteristics after calibration can beas shown. The flange repeatability,sliding load uniformity, accuracy ofoffset short lengths, and cable phasestability add up to performancespecifications dependent upon the user'sdevices and measurement technique. Forreflection measurements, these factorsare several orders of magnitude worsethan the contributions of the HP 85102IF/Detector.
Effective directivity after one-portcalibration was measured with a slidingload. Multiple settings are used to dothe signal separation between residualdirectivity and the load element. Thesliding load itself was only specifiedas 32 dB return loss. The peaks andnulls are due to the vector addition ofresidual directivity and the loadelement. A null means that thedirectivity and the load element wereapproximately the same magnitude butadding out of phase. The peak occurswhen they add in phase. Effectivedirectivity is 6 dB from the top of anull. Where the load element is muchsmaller than the directivity, theeffective directivity is about theaverage of the traces. This is seen tobe better than 40 dB over most of theband.
TYPICAL PERFORMANCE
BAND (GHz)
26.5-40 33-50 40-60
Effective directivity 45 dB 40 dB 38 dB
Effective port match 40 dB 38 dB 35 dB
Effective frequency response +/- 0.1 dB
511 109 MAGREF 0.0 dB
10.0 dBI
hp
cl----f---f--+--l--4--l---+-----+---l----A
CENTER 49.999998960 GHzSPAN 19.999998000 GHz
10
www.HPARCHIVE.com
3683
3684

G
CENTER 49.999998960 GHz:SPAN 19. 99999B000 GHz:
511 log MAGREF 0.0 dB
V_3~04:8d:~
Effective source match after one-portcalibration was measured with the aid oftime domain bandpass mode. An offsetshort was used to examine the quality ofthe calibration. The response of anoffset short has three contributors whenviewed in the time domain in this order:directivity leakage, the impulseresponse of the short, and lastly, thesource match reflection. Gating in thetime domain around the source matchreflection and transforming to thefrequency domain produces this result.The effective source match is 38 dB,consistent with the ripples in thefrequency domain. The turn-up at theband edges is an artifact of the gatingprocess.
1"'- to, ~"C ~E so:~E ~ATO
MAR ER 199 !9.9 896 GHz
t--- -
.r----.- ----
CA
3685
A precision rotary-vane attenuator wasused to produce this plot. First, theattenuator was set at 0 dB insertionloss and a simple frequency responsecalibration was performed. The toptrace shows the result of thecalibration. Residual tracking errorand trace noise total about .01 dB.Next, attenuation was increased in .1 dBsteps. The bottom line is -1.0 dB. Theresulting data are well within theattenuator's specified accuracy of .1 dBor 2% of reading, whichever is greater.This demonstrates the performance inmeasuring small insertion loss.
hp He ['A' -rANE I DB S;EPS
·
·
·
·I·
521 log MAGREF 0.0 dB
0.1 dBI
START 39.999999960 GHzSTOP 59.999997960 GHz
11A
3686
521 log MAGREF 0.0 dB
10.0 dBI
;r--+-+----1--+-1--+-+-~-+______J
'.'1==+=+--1-+-+--+-+--+_+-1"I==F=+---!--+-1--+-+-~-+_-
1.1==+=+---1-+-+--+-+--+-+-1.1==+_+--+-+-+--+-+--+-+-1.i==t-+---!-+--1--+-+--+--F=11.1--+-+-~--+--I--+-oI===t==t==I
,.'t==t'~+-+-+-+--+-+--+~=t===I
START 39.999999960 GHzSTOP 59.999997960 GHz
The same attenuator and two 20 dBcouplers were used to produce thisexample of dynamic range. The samefrequency response calibration was used.The first trace is the 20 dB couplingfactor. Next, the attenuator wasincremented in 10 dB steps down to atotal of -70 dB. Then, another 20 dBcoupler was inserted for the bottom twotraces at -80 and -90 dB. The averagingnumber was 64 down to -50 dB and 1024down to -90 dB. At the center of theband, where the coupling factor isexactly 20 dB, the accuracy of the 10 dBsteps is seen to be better than 1 dB at-70 dB and 2 dB at -90 dB.
3687
11
www.HPARCHIVE.com

START 39.999999960 GHzSTCP 59.999997960 GHz
-o.U" "'U LI'~I
/
/1/
~ I( 1'--../ Y
V1/
-,.rf'v
521 & M log MAGREF 0.0 dB
9 6;°9:2 d:~
CA
5
For the ultimate dynamic range inmeasuring a filter, different techniquesmust be used. Harmonic mixers aretransmitters of odd LO harmonics intothe mainline. These out-of-band signalsmay go through the passband of a filterwhile we are measuring the stopband. Amechanism exists to create an unwanted20 MHz IF because of this. These spurscan be eliminated by either measuring b2only and turning off the LO to thereflectometer or inserting isolators andlow-pass filters in the harmonic mixersto make them receivers only. A 30 dBspur reduction is possible as shown inthis measurement of a 50 GHz high passfilter.
3688
Flange and cable repeatabilities are themajor contributors to error aftercalibration. The local oscillator cableto the transmission head is the mostsensitive since it must be flexible.The center trace is the error left aftera simple frequency response calibrationwith a thru. Next, the transmissionhead was removed and moved about as if adevice under test were to be inserted.This was repeated several times.Together, the flange and cable magnituderepeatability is about .02 dB in WR-19.Semi-rigid, .141 inch cable was used.
521 & M log MAGREF 0.0 dB
0.01 dBI
.".-p" AN CA" .E HE rEA~ A~~"~
CA5
-r--..." ~r-1- "~ -=-- ---.:::::
STAAT 39.999999960 GHzSTCP 59.999997960 Giz
3689
Cable phase stability is sensitive tomovement and temperature. Cable phasealso "creeps" for hours after majordeformations. If the elastic limit isnot exceeded, performance is muchbetter. The same calibration was usedbut now to measure insertion phase.Again the transmission head was removedand the cable flexed to simulate theinsertion of a device under test. Theresult is about +/-1 degree. Thiscorresponds to .1 degree phase stabilityat 4-6 GHz, the local oscillatorfrequency. If the cable were to undergoa severe deformation, the repeatabilitywould be 3-5 degrees.
521REF 0.0 0
1.0 0/
-C~ i"" ~" r~ ~SE
cA5
!"'
1
STAAT 39.999999950 GH::rSTCP 59.999997960 CiHz:
3690
12
www.HPARCHIVE.com

It is quite easy to improperly connectwaveguide flanges. If the screws on oneside of the flange are tightened beforethe flange is properly positioned, asmall gap may remain which can radiateenergy. Two such gaps can easily affecta measurement of high insertion loss andalso the accuracy of a low-insertionloss measurement. The upper trace isthe crosstalk between two small gaps inflanges placed three inches apart. Thelower trace is the isolation and noisefloor. Such gaps are most easilydetected with a white piece of paperplaced behind the flange.
-HU- H\.. F"'"' "ED cL" '5
-
- -- -- - ---
~/,/
--- -- -~ ~ ----. -
521. M log MAGREF 0.0 dB
V 7;0i~7d~~
5TART 39.999999960 GHzSTeP 59.999997960 GHz
CA5
3691
Certain load elements radiate a smallamount of energy. They can also act assmall antennas. This plot shows anisolation measurement under twoconditions. The bottom trace is theisolation and noise floor with 1024averages. This is about 92 dB forWR-19. The upper trace shows whathappens when a termination is placed inproximity to a directional coupler loadelement. If physical layout is ignored,such crosstalk can limit a high dynamicrange measurement. When measuringisolation, terminate all ports and keepthe reflection and transmission headswell apart from each other.
TO I CC1F .EF L pAC "055' 'LM
----1------~--- -----. -
521 St Jot log MAGREF 0.0 dB
10.0 dBI
START 39.999999960 GHzSTeP S9. 999997960 GHz
CA5
3692
IV. TYPICAL MEASUREMENTS
3693
13
www.HPARCHIVE.com
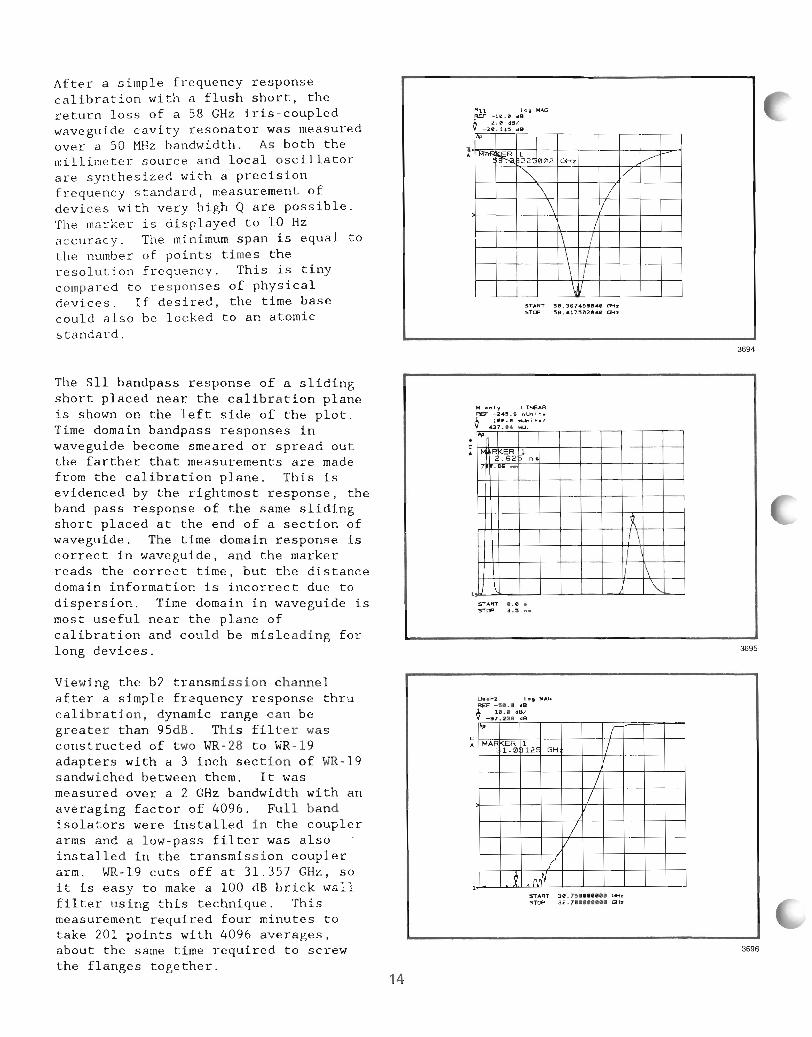
After a simple frequency responsecalibration with a flush short, thereturn loss of a 58 GHz iris-coupledwaveguide cavity resonator was measuredover a 50 MHz bandwidth. As both themillimeter source and local oscillatorare synthesized with a precisionfrequency standard, measurement ofdevices with very high Q are possible.The marker is displayed to 10 Hzaccuracy. The minimum span is equal tothe number of points times theresolution frequency. This is tinycompared to responses of physicaldevices. If desired, the time basecould also be locked to an atomicstandard.
511 10' Il4AOREF -11.1 tfS
Q _2:'il:B~8p
'I~~ ~2~ 002 13Hz ..--
'" V\ /\ II
/1\ I\ /\ /\"
START 51.36749".1 GHtSTl:P 5'.417512148 DHz
3694
The Sll bandpass response of a slidingshort placed near the calibration planeis shown on the left side of the plot.Time domain bandpass responses inwaveguide become smeared or spread outthe farther that measurements are madefrom the calibration plane. This isevidenced by the rightmost response, theband pass response of the same slidingshort placed at the end of a section ofwaveguide. The time domain response iscorrect in waveguide, and the markerreads the correct time, but the distancedomain information is incorrect due todispersion. Time domain in waveguide ismost useful near the plane ofcalibration and could be misleading forlong devices.
•c•
lot On Iy Llft£AAREF -245.8 nUn it.1 ue.1 l'IIIII..JnihlV 437 I. roU
I'"
~ 'Fl~~ 1n... -
~
1\IIII 1\
'"START ••••STCF :I.S no
3695
START 11.75""'" IJHzSTCF 32.7•••••••• CiHz
3696
-I'" r
MAR 'f:R0 1 /12 13H
//
//
I1 fl/"
U.....2 10. MAGREF -S1.1 4S
o 9~·i:.·~
c•
14
www.HPARCHIVE.com
Viewing the b2 transmission channelafter a simple frequency response thrucalibration, dynamic range can begreater than 95dB. This filter wasconstructed of two WR-28 to WR-19adapters with a 3 inch section of WR-19sandwiched between them. It wasmeasured over a 2 GHz bandwidth with anaveraging factor of 4096. Full bandisolators were installed in the couplerarms and a low-pass filter was alsoinstalled in the transmission couplerarm. WR-19 cuts off at 31.357 GHz, soit is easy to make a 100 dB brick wallfilter using this technique. Thismeasurement required four minutes totake 201 points with 4096 averages,about the same time required to screwthe flanges together.

cA
521 1_. MADfIEF -e.1 .
.1 1.15 ......V -e 1343 de..
MAR~Rl \99 944 GHz
l I. 1.1 I. JIvvvlY ""'. , I ,
STAAT :U.S!I!I'9S9•• CJH_5TCP' :I!II.""'79.' CJH2
The insertion loss of 3 inches WR-.19 wasmeasured using a frequency responsecalibration. This is a demonstration ofthe capability of measuring smallinsertion losses. The insertion loss isabout .12 dB and slightly higher at thelow end of the band which is closer tocutoff. The "noise" is due to loadmatch and source match and is quiterepeatable from trace to trace. Theactual trace noise is less than .01 dB.This type of measurement has been usedto evaluate the loss of severaldifferent platings in waveguide.
3697
Group delay of 3 inches WR-19 wasmeasured using a frequency responsecalibration. Group delay is defined tobe proportional to the negativederivative of phase with frequency. Atthe low end of the band, the group delayincreases as the guide wavelengthincreases. At the high end of the band,the group delay is nearly constant.Group delay measurements are importantto communications systems sincefrequency dependent group delay cancause distortion on modulated signals.The group delay aperture can be variedwith the smoothing function.
254." .r-MARt?1 \99 944 GHz
f-J..~hl
ST...,.. :J' .•,,'S!I'.' DHzSTtP ,s. ~""'7'.' aHa
321 -At/6.REF 1".1 ,._o 51.1 ,../
cA
3698
The return loss of a high pass filter isdisplayed using a full one-portcalibration. The filter reflects energyin the stopband and looks like a goodmatch in the passband. The filter wasterminated with a fixed load specifiedat 32 dB return loss. This sets theuncorrected load match at 32 dB. Thepassband match can be measured to nobetter than the load match pluseffective directivity. The marker canread out exact frequency, return loss,or standing wave ratio, if that formathad been chosen.
-I'·.... H"" -A> '"L ,~"
MAF ER 19997.2 823 GHz
'\\
'\\
~
1"'- f\ il /"
\
511 log Jl4AGREF l!l.lll dB
o 2~':9:8~8
c•
START 39.999999960 GHzSTCP S9. 999997960 GHz
3699
15
www.HPARCHIVE.com

~ ~S=C~Al-E~l---+--+--I--+--I--+--+---j
00. 0 div
START 39.999999960 GHzSTeP 59.999997960 GHz
P 5. UHZ ~IUH FASS F'L;
\\1\
1\
1\\
\ \1\ 1\
\1\
\11I~
521REF 1lI.0 •
100.0 0/
The insertion phase of the same filterwas measured using a simple frequencyresponse calibration. Note that thephase measurement is stable even at highinsertion losses. At the high end ofthe band, the phase is almost linear.As this filter approaches cutofffrequency, the effects of waveguidedispersion can be seen as the guidewavelength approaches infinity.Electrical length can be added toflatten somewhat the high end of theband; however, electrical length addslinear phase with frequency which is notcorrect due to dispersion. Group delayand time domain are correct, however.
3700
The impedance of a magnetically tunableferrite resonator is displayed in Smithchart format. The center of the Smithchart has been normalized to 1 ohm.Several modes are present, but thedominant mode is easily discernable onthe Smith chart. In a log magnitudedisplay, the several modes would bedifficult to separate. The marker readsout impedance but just as easily couldread out real and imaginary, linearmagnitude and phase, or log magnitudeand phase. A simple frequency responsecalibration with a short was used. The201 point trace did not miss anyresponses that might have slippedthrough with less points.
CA
START 48.000004020 GHzSTOP 52.000000020 GHz
3701
A high performance automatedmillimeter-wave network analyzer hasbeen described. Several methods ofcalibration, and calibration standardswere discussed. Typical systemperformance was measured under variousconditions and contributing factors weredemonstrated. Finally, severalmeasurements were made on actual devicesto provide examples of measurementcapability.
SUMMARY
SYSTEM DESCRIPTION
CALIBRATION METHODS
TYPICAL SYSTEM PERFORMANCE
ACTUAL DEVICE MEASUREMENTS
3702
16
www.HPARCHIVE.com

ACKNOWLEDGMENTS
The following individuals at Hewlett-Packard NetworkMeasurements Division have made technical contributionsto these millimeter-wave measurement techniques:
Doug Rytting
Bruce Donecker
Bob Dildine
John Barr
I would also like to thank Dr. Roger Pollard of theUniversity of Leeds for his assistance in calibrationtechniques and software.
REFERENCES
[lJ Hewlett-Packard Co., Product Note 8510-1A
[2J Fitzpatrick, J., "Survey of Millimeter-wave NetworkAnalyzers", 2Jrd ARFTG Conference Digest (Spring 1984)
[3] Rytting, D., "An Andlysis of Vector MeasurementAccuracy Enhancement Techniques", Hewlett-PackardRF&MW Symposium (1980)
[4J Rytting, D., "Let Time Domain Response ProvideAdditional Insight into Network Behavior", HewlettPackard RF&MW Symposium (1984)
17
www.HPARCHIVE.com

5954-1528
Flin- HEWLETT~~ PACKARD
August 1985
www.HPARCHIVE.com
Printed in U.S.A.