automated decision support system to identify and … · iv. base map: base map depicts visible...
TRANSCRIPT

AUTOMATED DECISION SUPPORT SYSTEM TO IDENTIFY
AND APPLY GROUND WATER RECHARGE SOLUTIONS
Anuj Tiwari 1, Akshit Mahajan 2 1. M.Tech Spatial Information Technology, School of Electronics, DAVV University,
Indore (M.P.). 2. B.E. Computer Science and Engineering, Chitkara University, Baddi (H.P.).
[email protected], [email protected]
ABSTRACT
India is a developing country, but development in some areas is leading to chaos in others. The most witnessed example is the growth of infrastructure in India. Day by day huge buildings, offices, and localities are being constructed to meet the growing human requirements. Trees are being cut frequently giving rise to global warming and many other natural problems. The most threatening problem is the scarcity of water.
“Water has become a highly precious resource. There are some places where a barrel of water costs more than a barrel of oil.”
Water resources of Earth can be classified as surface water and ground water in which groundwater is the main source for the domestic purpose and agriculture. We are utilizing the water inefficiently without providing sufficient ways to recharge it. In-fact the concrete structures like roads, buildings constraints the water to seep into ground properly. Whatever water is collected by rain is being drained off in rivers and water bodies outside the region. As a result there is shortage in drinking water. To save the world from this critical problem, we have to understand and find a solution to regain the ground water level.
Our paper defines an Automated Decision Support System and algorithm to identify and apply Ground Water Recharge Solutions using Geographical Information Science (GIS). This system identifies the error prone areas where water level is below threshold value or where it has reached a critical point. On these suspected points/areas, by applying the core rules for the installation of Recharge Structures, our system computes and suggests the optimal ARTIFICIAL RECHARGE TECHNIQUES. We have taken Ancillary Data, Satellite Data and other Decision Support data for suspecting the error prone areas. We are using SVM (Support Vector Machine) for supervised classification of the Satellite data.
Keywords: ground water, artificial recharge, GIS, SVM, integrated database values (IDV), ancillary data, satellite data
INTRODUCTION
In India, the dependence on ground water as a reliable source for meeting the requirements for irrigation, drinking and industrial uses has been rising rapidly during the last few decades. Ground water development has occupied an important place in Indian economy because of its role in stabilizing agriculture and as a means for drought management. Over the years, particularly since the launching of Five Year Plans, there have been continued efforts in India for development of ground water resources to meet the increasing demands of water supply for various sectors. In many parts of the country, ground water development has already reached a critical stage, resulting in acute scarcity of the resources.
Artificial Groundwater recharge is an efficient method of modifying the hydrological cycle and thereby providing abundant groundwater for usage. A unified approach of Satellite remote sensing and Geographical Information System (GIS) has opened new vistas for groundwater studies. This is due to the fact that earth observing devices; provide most up-to-date, accurate, unbiased and detailed spectral, spatial and temporal information on different conditions of natural resources. This paper addresses the strategies for an integrated approach of remote sensing and GIS used to provide a decision support system that ensures optimum and judicious use of groundwater by identifying and suggesting appropriate artificial recharge technique for the critical areas.
SYSTEM FLOW & METHODOLOGY
The system flow and methodology followed in our paper is based on input data which facilitates geo engine processing, and provides optimal recharge solution as output. The various types of input data required for processing are: user defined, Ancillary, Satellite & Decision support. Thematic Map is generated by applying sound decision rules and principles on Ancillary data and Satellite data. Other field observation data like ground water potential (Sub-Surface water potential) collected from specific departments combined with Thematic Maps results in the design IDV (INTEGRATED DATABASE VALUES) which is the standard for processing and analyzing ground water solutions based on various decision making factors.
Ancillary data
Ancillary data is used for the study of slopes, aspects, drainage network and other parameters that describes hydrogeology. Ancillary data is the integration of different types of maps required for computation and analysis.
These maps are briefly explained below:
I. Topographic map: Topographic map also known as contour maps, is 2-D representation of the earth’s surface, showing shape, size and relative position of natural and manmade features at a very reduced scale.
II. Soil map: Soil map shows distribution of soil types and/or soil properties (soil pH, textures, organic matter, depths of horizons etc.) in the area of analysis.

III. Geologic map: Geologic map shows the distribution of geologic features, including different kinds of
rocks and faults. A geologic map is usually printed on top of a regular map (called a base map) to help you locate yourself on the map.
IV. Base Map: Base map depicts visible surface features and boundary information about the Earth's surface, essential for locating additional layers or types of georeferenced objects. Base map may include features such as roads, rivers, major structures (buildings), contours, etc. In our paper, Base map provides the background on which thematic data is overlayed and analyzed.
V. Drainage Map: Drainage map allow determination of drainage density, intensity, origin and degree of connectivity along with the extent of drainage networks associated with a region. The data from the map can be used, together with hydrological modelling, to predict a range of outcomes and to develop strategies for studying the drainage behaviour.
VI. Watershed map: The watershed is a basic spatial reference unit in hydrology which helps to find out an area that topographically appears to contribute all the water that passes through a given cross section of a stream.
VII. Slope Map: Slope is the rise or fall of the land surface and slope map gives information about degree (steepness) of slope for a particular terrain (or other continuous surface).
VIII. Aspect Map: An aspect map shows to which side a slope is directed. Here it is used for estimation of rain (or, in some cases, chemical spills or leaks) run-off and direction.
IX. Physiographic Map: This map characterizes diversity of different Earth's landforms i.e. terrain texture, rock type, geologic structure and history of that geographical region. It describes the detailed mapping and description of particular localities, cities, and towns.
X. Geomorphologic Map: Geomorphology is the scientific study of landforms and the processes that shape them. The objectives of geomorphologic map in our project is to understand the shape and structure of landscapes.
XI. Thematic map: Thematic map focuses on a specific theme or subject area. Thematic maps use the base data and spatial variation of a number of geographical distributions. In this paper these distributions consist of slope, aspect, drainage, soil and rainfall which have been studied and used to generate Thematic Ground Water Map.
XII. Satellite Data There are many connections between land surface characteristic and water cycle. These land surface characteristics are constituted using Land cover and Land use data. Remote Sensing Satellite captures and provides high resolution images (Pan Sharpened Imagery, Stereo Pan Imagery) i.e. used successfully to classify the different land use/land covers.
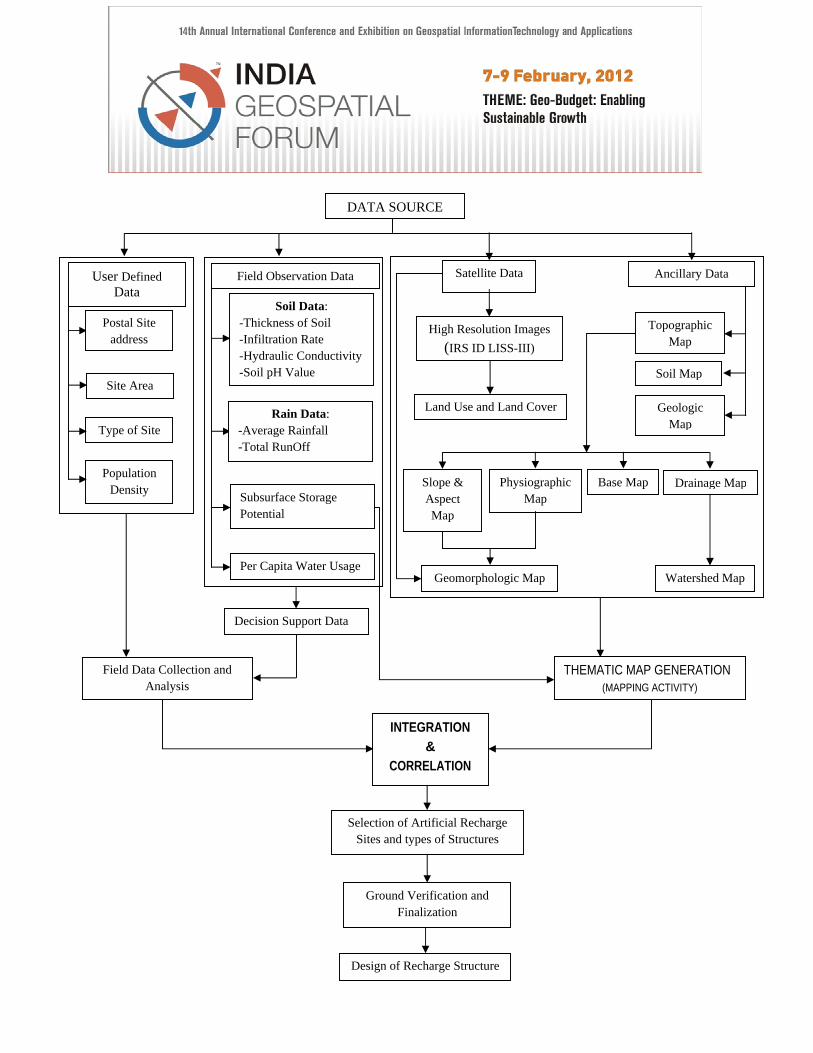
DATA SOURCE
Satellite Data
Topographic
Map
Soil Map
Geologic Map
Base Map Drainage Map
Slope & Aspect Map
Watershed Map Geomorphologic Map
High Resolution Images
(IRS ID LISS-III)
THEMATIC MAP GENERATION (MAPPING ACTIVITY)
INTEGRATION
& CORRELATION
User Defined Data
Field Observation Data Ancillary Data
Postal Site address
Site Area
Type of Site
Land Use and Land Cover
Population Density
Soil Data: -Thickness of Soil -Infiltration Rate -Hydraulic Conductivity -Soil pH Value
Rain Data: -Average Rainfall -Total RunOff
Subsurface Storage Potential
Per Capita Water Usage
Decision Support Data
Physiographic Map
Selection of Artificial Recharge Sites and types of Structures
Design of Recharge Structure
Ground Verification and Finalization
Field Data Collection and Analysis
Fig. 1: Input data & System Flow Diagram
GEO ENGINE DECISION MAKING CRITERIA
Decision making criteria: -
Source water and availability
Available water storage capacity
Clogging potential
Rainfall pattern
Land use and vegetation
Cost
Based on these other important decision making criteria following is the table of artificial ground water recharge techniques:
Method Name Type of Method
Slope Soil and Rock Types Topology
Flooding Surface Spreading
Moderate to Gentle, Gentle
Clays, silts, sands and Gravels.
Land adjoining river/ irrigational canals.
Ditch and Furrows
Surface Spreading
Moderate , Moderate to Gentle
Clays, silts, sands and Gravels.
Irregular topography adjoining streams/canals.
Recharge Basins Surface Spreading
Moderate , Moderate to Gentle, Gentle
Sandstones, Shales Clays, silts, sands andgravels.
parallel to ephemeral, intermittent stream-channels
Bench Terracing Surface Spreading
Steep, Moderate Granites, Limestones, Quartzites, Marbles, Basalts, Sandstones, Shales
Cultivated Land.
Contour Bunds and Contour Trenches
Surface Spreading
Steep, Moderate , Moderate to Gentle
Granites, Limestones, Quartzites, Marbles, Basalts, Sandstones, Shales
sloping gricultural lands with long slope lengths
Gully Plugs Surface Spreading
Steep Granites, Limestones, Quartzites, Marbles, Basalts, Sandstones, Shales
Small gullies, 1st
order streams.
Nalah Bunds, Check Dams
Surface Spreading
Moderate , Moderate to Gentle
Granites, Limestones, Quartzites, Marbles, Basalts, Sandstones, Shales
1st-2nd
order streams.
Percolation Ponds
Surface Spreading
Moderate , Moderate to Gentle
Granites, Limestones, Quartzites, Marbles, Basalts, Sandstones, Shales
Large reservoir areas and 2nd - 3rd order stream.
Injection Wells (Recharge Wells)
Sub-surface Moderate, Moderate to Gentle,
Gentle
Clays, silts, sands and gravels.
Areas where source of water is available either for some time or perennially e.g. base flow, springs.
Recharge Pits and Shafts
Sub-surface Moderate to Gentle, Gentle
Granites, Limestones, Quartzites, Marbles, Basalts, Sandstones, Shales, Clays, silts, sands and
gravels.
poorly permeable strata overlie water table aquifer located deep below land surface
Gravity Head Recharge Wells
Sub-surface Moderate, Moderate to Gentle,
Granites, Limestones, Quartzites, Marbles, Basalts,
over-developed area have over-exploitation of

Gentle Sandstones, Shales ground water
Induced Recharge
Indirect Methods
Moderate to Gentle, Gentle
Granites, Limestones, Quartzites, Marbles, Basalts, Sandstones, Shales, Clays, silts, sands and gravels.
Aquifer hydraulically connected with surface-water source.
Bore Blasting Indirect Methods
Moderate Granites, Limestones, Quartzites, Marbles, Basalts
hard crystalline and consolidated strata
Table 1: Recharge Techniques and factors
ALGORITHM
Our automated decision support algorithm starts with computing spatial reference of user location Latitude (Lat), Longitude (Long) by a well known Geocoding process. Now user site is extracted from satellite imagery by Support Vector Machine (SVM) that serves as key parameter for GETSCALE( ). This all important information is passed in DECISIONSUPPORTDATA( ) function discussed later to calculate all decision affecting parameters. Main class of algorithm is as follows: -
begin
(Lat, Long) = Geocoding (Postal Address);
(TypeofLand, LandStructure) = GETLANDUSE ( (Lat,Long), LandUse, LandCover);
Scale = GETSCALE (TypeofLand);
ToposheetNumber = GETTOPOSHEETNUMBER ((Lat, Long), Scale);
DECISIONSUPPORTDATA ((Lat, Long), TypeofLand, LandStructure, ToposheetNumber);
ThematicGroundWaterMap = THEMATICMAPPINGFUN (Ancillary Data, Satellite Data, SubsurfaceStoragePotential);
IntegratedDatabaseValue = ThematicGroundWaterMap + Decision Support Data;
factorList = FETCHFACTOR (IntegratedDatabaseValues);
optimalSolution = COMPARISIONFUN (factorList, StandardFactorList);
artificialRechargeTechDeployedonMap = MAPPINGFUN(BaseMap,ThematicMap, optimalSolution);
end
The following order of sequence was adopted to derive the final integrated thematic ground water map.
Geology (I1) + Geomorphology (I2) + Soil (I3) = O1 O1 + Landuse/Landcover (I4) = O2 O2 + Drainage of 50 m buffer (I5) = O3
Geology (I1), Geomorphology (I2) and Soil (I3) layers were integrated by the union operation. Adding these three layers derives the weight of each polygon in the integrated layer (O1). In the next step, the (O1) layer is intersected with the land use layer (I3). In this step, the integrated layer (O2) was generated by adding lithology, geomorphology, soil and landuse layers. The (O2) layer is integrated with polygons made around the drainage (buffer zone) by the union operation. The polygons in the integrated layer (O3) when combined with the Subsurface Storage Potential of corresponding zone results a composite detailed thematic ground water Map.
Now thematic Ground water map and computed decision support data is integrated to generate IDV which in turn is queried according to factors affecting recharge structure and system generates best optimal recharge structure.
Site Selection from Satellite Imagery
To detect the candidate site patches, first, Digital Terrain Model (DTM) is generated from existing vector data. Then, Digital Surface Model (DSM) is generated from the high resolution stereo panchromatic image pairs. After generating DTM and DSM, a normalized Digital Surface Model (nDSM) is calculated by subtracting DTM from DSM and then 3D objects are separated by applying 3m threshold to nDSM. Next, an orthoimage is generated from high resolution satellite images using DSM. The orthorectification of the image is necessary to accurately overlay image with reference site database. Next, a Normalized Difference Vegetation Index (NDVI) is calculated. To detect the candidate site patches, orthorectified high resolution image with additional bands nDSM and NDVI is classified using SVM classifier.
Here SVM classification is performed. The Radial Basis Function (RBF), which can handle linearly non-separable problems; is selected as kernel method. The is determined as inverse of number of bands in the input image and 1000 is taken as value of C. The candidate site class is class of interest, while all other classes are composed as non-candidate site class.

After performing binary SVM classification, those areas classified as site represent the candidate site patches and all others are excluded. To obtain the site boundaries, the detected site patches in raster form are converted into vector form. To do that, initially the edges are detected using an edge detection algorithm. The resulting edge image is a binary image that shows the edges of the candidate site patches. These edges are then converted into vector form using a Hough transform, which is a widely used method for extracting the lines and/or curves forming the objects. After detecting the lines and/or curves in vector form, they are grouped perceptually to obtain the candidate -site boundaries.
Fig. 2: Site Detection and Delineation Technique
Decision Support Algorithm
Thematic layers generated using remote sensing data like geology, geomorphology, land use/land cover, drainage etc. can be integrated in a Geographic Information System (GIS) framework and analyzed using a DECISIONSUPPORTDATA ((Lat,Long),TypeofLand, LandStructure, ToposheetNumber) function.

DECISIONSUPPORTDATA ((Lat,Long),TypeofLand, LandStracture, ToposheetNumber) {
AvgRainFall = GETAVGRAINFALLDATA (ToposheetNumber);
RunOffCofficient = GETRUNOFFCOFFICIENT (LandStracture);
TotalRunOff = RunOffCofficiet * AvgRainFall ;
Acz = AREACALCULATION (ContourMap(avgWaterLevel), thresholdWaterLevel);
Sm = AQUIFERMATERIALYIELD (SoilMap, physiographic map);
TotalSubsurfaceStoragePotential = (Acz *Sm);
SoilPermeability = GETPERMEABILITY ((Lat,Long), SoilMap, BaseMap );
PerCapitaWaterUse = SuppliedWater/PopulationDensity;
/* Other Important Empirical Decision support data: -
Source of Water except Rainfall
Thickness of Soil
Infiltration Rate
Soil pH Value */ } Where Acz = area of critical zone & Sm = aquifer material yield
Rainfall and Runoff
Availability of source water is one of the basic prerequisites for taking up any artificial recharge scheme. Rainfall and runoff available constitute the major sources of water for artificial recharge of ground water.
Length of rainfall data records to be considered is an important factor in the analysis of rainfall. In India Meteorological Department established many rain gauge stations across the country to measure average annual rainfall records. As per the defined algorithm we first collect these average rain fall records from rain gauge station in specified zone defined by following function.

GETAVGRAINFALLDATA (ToposheetNumber) { RainGaugeStationsList = GETRAINGAUGESATIONLIST (ToposheetNumber); Sum = 0;
for Loop i = 1 to RainGaugeStationLsit.Size Start Loop
RainFallData = getRainFallData (RainGaugeStatioList[i]); Sum = Sum + RainFallData ;
End Loop AvgRainFall = Sum/ RainGaugeStationList.Size; return (AvgRainFall); }
Runoff is defined as the portion of the precipitation that makes its way towards rivers or oceans as surface or subsurface flow. Precise estimation of runoff is the basic and foremost input requirement for the design of recharge structures of optimum capacity. Our algorithm using Coefficients method to estimate runoff where we first select runoff coefficient by GETRUNOFFCOFFICIENT (LandStructure), function for specified Land Structure then by simple multiplying runoff coefficient and average rain fall data we get Total Run off.
GETRUNOFFCOFFICIENT (LandStructure) { switch (LandStructure)
{ Case Urban Residential: RunOff = 0.3 - 0.5; Break; Case Forests: RunOff = 0.05 - 0.2; Break; Case Commercial & Industrial: RunOff = 0.9; Break; Case Parks, farms, Pastures: RunOff = 0.05 - 0.3; Break; Case Asphalt or concrete pavement: RunOff = 0.85; Break;
} return (RunOff); }
The scope for artificial recharge in an area is basically governed by Sub-surface Storage Capacity of that Aquifer. Depth to water level, therefore, provides the reference level to calculate the volume of unsaturated material available for recharge. The average water levels for a period of at least 5 years is to be used in order to nullify the effects of variation in rainfall. AREACALCULATION function is used to identify the critical area (Acz). Function uses Contour maps prepared from the average post-monsoon water level data with suitable contour intervals used for assessment of available storage space. The intercontour areas
between successive contours are determined and the total area in which the water levels are below a certain cut-off level (3.00 m.bgl in phreatic aquifers), multiplied by the specific yield of the aquifer material (Sm) gives the volume of subsurface storage space available for recharge.
Acz = AREACALCULATION (ContourMap(avgWaterLevel), thresholdWaterLevel); Sm = AQUIFERMATERIALYIELD (SoilMap, physiographic map); TotalSubsurfaceStoragePotential = (Acz *Sm);
CONCLUSIONS
This technology can be used by Municipal Corporation for Advance Town Planning in which it will suggest which areas are suitable for new constructions or what optimal technique should be implemented on the existing infrastructure for groundwater recharge. It can also be used for providing Agro-based solutions.
It may not always be possible to implement artificial recharge projects in all conditions, due to various constraints such as lack of source water, shortage of funds for implementation of the projects etc. In such cases, it may be necessary to identify areas that require recharge augmentation most and to implement recharge projects accordingly.
References
[1]. “Manual on Artificial Recharge of Groundwater”, Govt of INDIA, Ministry of Water Resources, September 2007.
[2]. “Guide on Artificial Recharge to Ground Water”, Central Ground Water Board, Ministry of Water Resources, New Delhi, May, 2000.
[3]. Anand Kumar, “Application of Remote Sensing and GIS in Groundwater Prospects Mapping & Siting Recharge Structures”.
[4]. N C Gautam, S D Tripathi, C Bhanu Prakash, NVN Suresh, Dinesh Kar, “Rainwater Harvesting and Artificial Research of Groundwater in Watersheds of Chhattisgarh State INDIA– A CASE STUDY”.
[5]. Noha Donia, “Application of Remotely Sensed Imagery to Watershed Analysis- A CASE STUDY OF LAKE KAROUN CATCHMENT, EGYPT”, Thirteenth International Water Technology Conference, IWTC 13 2009, Hurghada, Egypm, pp. 1035-1049.
[6]. Balachandar.D, Alaguraja.P, Sundaraj.P, Rutharvelmurthy.K, Kumaraswamy.k, “Application of Remote Sensing and GIS for Artificial Recharge Zone in Sivaganga

District, Tamilnadu, India”, International Journal Of Geomantic and Geosciences, Volume 1, No 1, 2010.
[8]. Bhagyashri C. Maggirwara and Bhavana N. Umrikarb, “Possibility of artificial recharge in overdeveloped miniwatersheds: A RS-GIS approach”, e-Journal Earth Science India Vol.2 (II), April, 2009, pp. 101 – 110.
[9]. WILLIAM C. WALTON, “Report of Investigation-48”, State of Illinois, Department of registration and Education Ground Water Recharge and Runoff in Illinois, URBANA 1965.
[10]. D. Koc San, and M. Turker, “Building Extraction from High Resolution Satellite Image using Hough Transform”, International Archives of the Photogrammetry, Remote Sensing and Spatial Information Science, Volume XXXVIII, Part 8, Kyoto Japan 2010.

Paper Reference No.: PN-23
Title of the paper: Automated Decision Support System To Identify and Apply Ground Water Recharge Solutions.
Name of the Presenter: Akshit Mahajan, Anuj Tiwari.
Author(s) Affilation:
Mailing Address: G-173, Regal Homes, Khajurikalan road, Piplani, Bhopal-462021 M.P.
Email Address: [email protected], [email protected]
Telephone numbers: +91 8123704684, +91 7829861481
Fax Number:
I am Anuj Tiwari presently pursuing M.Tech in Spatial Information Technology from DAVV, Indore. I am hired as an intern for one year at Centre for Artificial Intelligence and Robotics, DRDO Bangalore under the same programme. Here I am currently working on Web based GIS Technology apart from this my technical interests are in the area of Computer Networking, Distributed and parallel Computing. And one of my papers is accepted in International Conference on Computer and Communication (ICCC) which will be held in January 2012.I got my graduation degree from Rajiv Gandhi Proudyogiki Vishwavidyalaya with an aggregate of 76.7 % . Here I got an opportunity to do my major project on embedded systems technology. Apart from this I also implemented the solution to Tower of Hanoi problem and presented it as a GUI as a part of my minor project.
I am Akshit Mahajan, presently pursuing BE in Computer Science and Engineering from Chitkara University Baddi, Himchal Pradesh. I recently finished my 6-months project training at Centre for Artificial Intelligence and Robotics, DRDO Bangalore in the Geographic Information System group where I worked on Bathymetric Surface generation and analysis. My areas of technical interest are image processing and visualization.