automated conflict resolution – a simulation-based
TRANSCRIPT
26TH INTERNATIONAL CONGRESS OF THE AERONAUTICAL SCIENCES
AUTOMATED CONFLICT RESOLUTION – A SIMULATION-BASED SENSITIVITY STUDY OF
AIRSPACE AND DEMAND
Michael Kupfer*, Todd Farley**, Yung-Cheng Chu***, Heinz Erzberger* *University of California, Santa Cruz, **NASA Ames Research Center,
***AerospaceComputing, Inc.
Keywords: Air traffic management, separation assurance, conflict resolution
Abstract
The performance of an automated conflict resolution algorithm was investigated in terms of its sensitivity to specific airspace regions and increased traffic demand. The algorithm is envisioned as part of an automated separation assurance function in a future air traffic control system. It was tested in a non-real-time simulation of current-day and heavily increased demand scenarios, based on 24-hour data recordings from the Cleveland, Fort Worth and New York Air Route Traffic Control Centers. This traffic included the complete spectrum of aircraft types, flight phases and conflict geometries. The algorithm computes a four-dimensional conflict-resolution trajectory between two and twenty minutes prior to the projected loss of separation. The resolution trajectory begins at an aircraft’s current position and ends at a downstream point along its original flight path, while maneuvering clear of the detected conflict and causing no new conflicts. The results support two findings: (1) for traffic demand levels up to three times that of 2007, the algorithm was able to resolve all of the detected conflicts in all of the selected airspace regions; (2) the characteristics of the airspace and the traffic demand significantly influenced the operational efficiency of the resolution trajectories.
1 Introduction Human workload associated with
providing basic separation services (i.e., conflict detection and resolution) is a major limiting factor on airspace capacity. Projections of the Federal Aviation Administration suggest in 2007 that operations at large hub airports will increase at an annual rate of 2.2 percent from 2006 to 2025 [1]. If capacity is not increased commensurate with demand, flight inefficiencies will be introduced and air traffic delays will be generated. As a result, operational costs and passenger fares are expected to increase dramatically, representing billions of dollars annually [2], [3].
To expand airspace capacity according to forecasted demand, the human workload associated with separation assurance must be drastically reduced. In [4], Erzberger proposes a concept where human workload is reduced by delegating the responsibility for conflict detection and conflict resolution to automation. The underlying conflict resolution algorithm [5] has been evaluated in simulations of Cleveland Center airspace at up to twice the traffic demand of today including traffic of all fight phases [6].
While the results indicated that the automated conflict resolution algorithm is capable of resolving conflicts safely and efficiently, the question of possible performance degradation at higher traffic densities remains. Past studies also do not validate the safety and efficiency performance metrics in other Air Route Traffic Control Centers that may have demand and capacity characteristics
1

MICHAEL KUPFER, TODD FARLEY, YUNG-CHENG CHU, HEINZ ERZBERGER
significantly different than those of Cleveland Center [6].
The current work seeks to validate the performance of the conflict resolution algorithm for a broad sample of airspace regions and at demand levels up to three times that of 2007. The airspace regions selected for simulations provided separation-assurance problems different from those observed in the prior work in Cleveland Center. The objective was to determine whether or not the conflict-resolution algorithm is sensitive to the airspace to which it was assigned. Furthermore, simulating three times the current-day traffic demand probed algorithm performance at the upper boundary of envisioned future traffic densities.
Results from nine simulations are presented to assess the performance of the conflict-resolution algorithm: Cleveland, Fort Worth and New York Centers at current-day baseline traffic volume, as well as demand sets two and three times as high. The complete spectrum of recorded traffic was used in the simulations: departing, cruise, and arriving traffic. The results are presented in terms of safety and efficiency metrics, where safety is indicated by the number of unresolved conflicts, and efficiency is a function of the delay incurred when complying with a conflict-resolution trajectory.
2 Background
The conflict resolution algorithm resolves conflicts between two aircraft by computing a resolution trajectory in several steps. Adopting the Kuchar & Yang taxonomy [7], the algorithm may be categorized as a “pair-wise,” “optimized” approach, with resolution trajectories comprised of turn maneuvers, vertical maneuvers, and/or speed changes.
The algorithm used in this study employs the Multiple Resolver. The Multiple Resolver attempts to calculate three applicable candidate resolution trajectories for each of the two aircraft involved in a conflict, whereas a resolution is considered applicable when three constraints were fulfilled. These are: 1) the conflict detected needs to be cleared; 2) no new conflicts can be introduced; and 3) the resolution trajectory needs to remain conflict
free for a specified amount of time (typically 12 min.).
The conflict resolution algorithm does not compute compound maneuvers in which more than one resolution method such as vertical, horizontal or speed maneuvers are combined and executed in succession or combination. Also, no cooperative maneuvers are computed by the algorithm (these are maneuvers that require the action of both conflict aircraft simultaneously).
According to user preference, priority in the sequence hierarchy of calculating the trial resolution trajectories can be given to either horizontal or to vertical maneuvers. In this study, vertical maneuvers, which were found to be more efficient, were preferred. Each type of conflict was analyzed and a resolution was attempted according to the dynamics and physical characteristics of the conflict. For each of the two aircraft involved in a conflict, according to preference, vertical, then horizontal and, lastly, speed candidate resolution maneuvers are computed until one per category is found that fulfills all of the three constraints. However, the algorithm is not able to compute all six trial resolution trajectories for all conflicts. In this case, the algorithm will try to compute again the trajectories after two minutes. It attempts to find the maximum number of resolutions within its available search space.
As the algorithm tries to minimize delay exclusively, out of those six trial resolution maneuvers, the resolution trajectory is selected for execution that introduces the least delay.
The logic of the algorithm was designed to account for the case that no resolution can be found. To still find an acceptable resolution, in a fault recovery mode the time constraint on the conflict free horizon is relaxed. The automated conflict resolution algorithm is the first part of a three layer safety system within separation assurance. If no resolution can be found, and time until loss of separation is two minutes (predefined parameter), it is intended that the next safety layer, the Tactical Separation Assisted Flight Environment (TSAFE) tries to compute a resolution maneuver. TSAFE is a conflict avoidance system envisioned to operate
2

AUTOMATED CONFLICT RESOLUTION – A SIMULATION-BASED SENSITIVITY STUDY OF AIRSPACE AND DEMAND
in a time horizon between zero to four minutes prior to the projected loss of separation [8]. However, this system was not part of this study. The Traffic Collision Avoidance System (TCAS) is the third safety level.
3 Approach and Procedure The objective of this study was to
investigate in simulations the performance of the conflict resolution algorithm in different airspace regions, airspace characteristics and conflict types, at current and significantly increased demand levels.
The simulated traffic environment was based on recorded operations of a recent traffic day of the U.S. airspace. As a simulation test bed, the Airspace Concepts Evaluation System (ACES) [9], a medium-fidelity, non-real-time air traffic and airspace simulation was selected. It was specifically designed to assess the impact of new tools and concepts for a future air traffic control system.
At first, April 19th 2007 was selected to represent the 1x baseline demand scenario. This day was chosen because it had a high number of NAS operations and had a low impact of convective weather. Furthermore, this day was endorsed by the Federal Aviation Administration (FAA) for internal analyses. The scenario contained most types of traffic: commercial traffic, general and business aviation, arriving and departing traffic, as well as over-flights. Based on this 24-hour recorded traffic sample, demand-sets with twice and three-fold demand were generated using the demand generation software AvDemand [10]. These levels were selected in order to investigate the limitations of the algorithm in regards to traffic volume and to design scenarios that can be compared to the ones of the previous study. As the automated conflict resolution algorithm had only a limited ability to sequence and de-conflict arrival traffic, this traffic was constrained at hub-airports to a 50% increase in the 2x and 3x demand scenarios. The traffic recordings from the 1x reference day and the generated 2x and 3x demand-sets were used as input for the ACES simulation.
For this study, three different Air Route Traffic Control Centers (ARTCCs) were
specifically selected because of their unique airspace and traffic characteristics. First, Cleveland Center (ZOB) was selected to be consistent with previous studies and enabling the comparison of results. It is a relatively large airspace covering an area of approximately 72,000 NM2. Additionally, Cleveland Center airspace is one of the busiest centers in the National Airspace System (NAS), with three primary (Detroit, Cleveland, Pittsburgh) Terminal Radar Approach Control areas (TRACON). It is characterized by many over- flights between the east- and the west coast. Second, Fort Worth Center (ZFW) was selected. This center offers a very large airspace covering an area of about 121,000 NM2. It has a single symmetric, four-corner-post primary TRACON airspace serving a single major hub, Dallas/Fort Worth International Airport as well as small airports. Lastly, New York Center (ZNY) was selected. In comparison to Cleveland Center, airspace is limited. The area covered is approximately 24,000 NM2. This center carries many arrival and departure flights into the busy hubs La Guardia, John F. Kennedy and Newark. Fig. 1 shows a plot of aircraft count vs. time for the three centers.
Fig. 1. Traffic load in ZOB, ZFW and ZNY for April 19th 2007
A test-matrix of nine separate simulations was defined. For each airspace, all three demand levels were applied. The algorithm, which is based on a hierarchy of rules to select the maneuvering aircraft and the type of resolution, was implemented in ACES. In every simulation, a trajectory engine detected conflicts, and a single instantiation of the automated conflict resolution algorithm was responsible for resolving them. A trajectory synthesizer then
3
MICHAEL KUPFER, TODD FARLEY, YUNG-CHENG CHU, HEINZ ERZBERGER
used high-fidelity 4D-trajectory modeling to compute resolution trajectories that begin at an aircraft’s current position and end at a point along its original flight path, while maneuvering clear of the detected conflict and causing no new conflicts.
The independent variables were the airspace and the demand level selected. The dependent variables included safety metrics (e.g., number of conflicts resolved), operational efficiency metrics (e.g., average delay per resolution, distribution of delay), computational efficiency metrics (number of resolution attempts per detected conflict) and strategic metrics (type of resolution). Besides independent variables and dependent variables, intermediate variables were also measured. Intermediate variables characterized the difficulty of the problem for the algorithm with metrics such as number of conflicts detected and number of conflicts per flight hour.
The simulation environment was deterministic, in that there was no trajectory error (e.g., wind effects, flight technical error, etc.). All trajectories were known and all aircraft adhered to their trajectories perfectly. Simplifications were made such that there was no delay introduced for trajectory negotiation, data link or pilot reaction. As in previous studies, some uncertainty was accounted for by applying an additional separation buffer of two NM to the five NM horizontal separation minimum when resolving conflicts. For conflict detection however, the separation minimum remained five NM. The increased horizontal minimum separation made it more difficult for the algorithm to find an acceptable resolution. The resolution initiation horizon was eight minutes prior to projected loss of separation for en-route conflicts and 20 minutes for arrival conflicts. For arrivals, this extra resolution time can significantly improve the likelihood of finding an efficient resolution trajectory. Once a resolution was found, it was handed over to ACES which implemented the trajectory. The simulated airspace was not subdivided into sectors and human support was absent.
For each simulation run, detailed information about the selected algorithm properties, internal algorithmic parameters, and
specifications of the resolution trajectories for each detected conflict and each trial-plan resolution trajectory considered (e.g. rejected or selected) by the algorithm was recorded and stored in a database. These data were used for simulation post-processing and analysis.
4 Results The results of the nine simulations showed
the performance of the algorithm within a complex traffic environment, based on actual NAS traffic, in various airspace regions and at different demand levels. All of the centers had different characteristics. It is important to keep those in mind when interpreting the simulation results. Moreover, it is important to note that records for conflicts that resulted in unusually large positive or negative delay were removed from the generated data when such instances were identified as simulation artifacts and considered not significant to the results.
Dependent on the selected traffic demand level, the simulations required execution times of eight to sixty hours for each 24-hour scenario. This included pre-processing, the simulation of all traffic in the respective center and post-processing. The conflict detection and resolution process itself needed less than a second to test all the given aircraft for conflicts and to compute the resolutions. This makes the automated conflict resolution algorithm suitable for an application in a real-time simulation environment.
Table 1 summarizes the number of flights and conflicts in each of the airspace regions at each demand level. For all three centers the number of flights in the different demand sets increased linearly. However, the number of detected conflicts developed geometrically with a decreasing slope due to the limited arrival traffic. This number was influenced by the airspace size and layout, the traffic volume and the traffic composition. It can be used as an indicator for algorithm workload. In higher traffic densities, for example, the algorithm often dealt not only with more primary conflicts but also with more secondary conflicts. More resolution attempts were required. The overall number of conflicts is broken down into two conflict categories: en-route conflicts and
4

5
AUTOMATED CONFLICT RESOLUTION – A SIMULATION-BASED SENSITIVITY STUDY OF AIRSPACE AND DEMAND
merging arrival conflicts. En-route conflicts were considered to be any conflict that was not an arrival conflict. Conflicts between two cruising aircraft, between a departing and an arrival aircraft and conflicts between two arrival aircraft flying to a different meter fix all fell into the “en-route” category. Arrival conflicts however, involved two aircraft on arrival to the same meter fix. In order to be classified in this category they both had to be within 20 minutes flying time of the fix at the time of detection. This kind of conflict was more difficult for the algorithm to resolve. The performance of arrival aircraft was limited such that not all resolution types were selected, and furthermore, both aircraft needed to be delivered to the same fix while maintaining a first-come-first-served sequence.
The findings can be described in safety- and efficiency-related terms. The most important criterion of a conflict resolution system is its ability to successfully resolve conflicts. However, the detection of the conflicts was not relevant to this study, because of the deterministic nature of the aircraft trajectories. All conflicts were detected and none were missed. The algorithm’s ability to resolve conflicts was measured in terms of the ratio of the number of resolved conflicts to the number of conflicts detected. The multiple resolver successfully resolved all detected conflicts in all nine simulations. There was no conflict for which the tactical conflict resolution
system, TSAFE, was needed to attempt a resolution computation. Another safety related measure was the number of conflicts per flight hour. Table 1 shows this value for the three demand levels and for the three centers.
The second metric is efficiency. The histograms in Fig. 2 through Fig. 4 show the number of conflicts for the three centers at the three demand levels. All conflicts were broken down into either merging arrival conflicts or en-route conflicts. The average delay of resolutions was mapped to the secondary y-axis by the black rectangular data points, and the white triangle data points show the values of the median. The denoted times correspond to the average delay. Also, standard deviation error bars were added to the charts. Negative times refer to the time savings of a resolution trajectory in comparison to the original trajectory. Some of the conflict resolutions were so-called “bonus resolutions,” which occurred when conflicts were interrelated with another conflict. When the initial conflict was cleared, due to the change of trajectory of the maneuver aircraft, no further resolution attempts for the other conflicts were required. Bonus resolutions are a function of traffic density and can be understood as an indicator for traffic complexity. When average delay was calculated, bonus resolutions were not taken into consideration; otherwise, the delay of the maneuver aircraft of the previously resolved conflict would be counted several times.
Table 1. Conflict detection results and conflict resolution success rate results
ZOB ZFW ZNY 1x 2x 3x 1x 2x 3x 1x 2x 3x
Total flights 7888 14157 20130 5230 10601 15228 8258 15007 20643TTL flight hours [h] 3225 6307 9276 2373 5047 7352 2641 5071 7192 Total conflicts 1028 2688 3886 824 4238 5386 1326 3721 4531
En-route conflicts 641 2210 3404 426 1876 2488 951 2602 3336 Merging arrival conflicts 387 478 482 398 2362 2898 375 1119 1195
Conflicts per flight hour 0.32 0.43 0.42 0.35 0.84 0.73 0.50 0.73 0.63
TTL resolved conflicts 100% 100% 100% 100% 100% 100% 100% 100% 100%

MICHAEL KUPFER, TODD FARLEY, YUNG-CHENG CHU, HEINZ ERZBERGER
In the case of Fort Worth Center, about one third in the 2x demand level to one half in the 3x demand level of all arrival conflicts were bonus resolutions. In Figs. 2 - 4 the amount is depicted by the darker shaded areas in the bars.
Every chart illustrates that, overall, the number of conflicts increased in the 2x and 3x runs. In Fig. 2, for Cleveland Center, which is characterized by mainly overflight traffic, the number of arrival conflicts increased less than the number of en-route conflicts. The high average delay of arrival conflicts compared to en-route conflicts indicated that it was more difficult for the algorithm to resolve this type of conflict. The above-described situation in Fort Worth Center is reflected in Fig. 3. Almost all of the arrival traffic was flying over the four corner posts of the DFW TRACON, creating a situation that was more an arrival-sequencing problem than a conflict resolution issue.
The number of arrival conflicts in Fort Worth Center was significantly increased. As mentioned above, many arrival conflict resolutions were bonus resolutions. The delay distributions of the 2x and 3x simulations runs were statistically significantly different from the
1x delay distribution, based on a significance level of 0.05. The average delay was high (74 seconds). The algorithm needed to apply large modifications to the original flight plan when resolving all of the interconnected arrival conflicts.
In New York Center, ACES was modeled in a more detailed fashion. In contrast to Fort Worth Center, arriving traffic was distributed over several arrival fixes to three major airports. The large amount of arrival aircraft and the limited airspace in New York Center resulted in an increased amount of arrival conflicts in the 2x and 3x runs. However, the average delay values of these conflicts in the 1x and 3x runs were similar, and moreover, were also similar to the average delay values of the en-route conflicts.
The number of resolution attempts required by the algorithm to find an acceptable resolution trajectory is a computational efficiency factor, and enables performance comparisons to other conflict resolution algorithms. It was desirable to find an acceptable resolution trajectory with as few attempts as possible.
ZOBNumber of conflicts and average delay per resolution
00:18
00:4500:25
00:1600:20
00:18 00:30 00:4200:15
0
1000
2000
3000
4000
5000
6000
All En-route Merging Arr
Num
ber o
f Con
flict
s
-01:10
-00:30
00:10
00:50
01:30
02:10
02:50
Avg
. and
med
ian
dela
y [m
m:s
s]1x 2x 3x +/- 1σ bonus resolutions
Fig. 2. Algorithm efficiency performance for Cleveland Center airspace.
6

AUTOMATED CONFLICT RESOLUTION – A SIMULATION-BASED SENSITIVITY STUDY OF AIRSPACE AND DEMAND
ZFWNumber of conflicts and average delay per resolution
00:2300:35
00:5000:50
01:14
00:30
01:14
00:2700:46
0
1000
2000
3000
4000
5000
6000
All En-route Merging Arr
Num
ber o
f Con
flict
s
-01:10
-00:30
00:10
00:50
01:30
02:10
02:50
Avg
. and
med
ian
dela
y [m
m:s
s]
1x 2x 3x +/- 1σ bonus resolutions
Fig. 3. Algorithm efficiency performance for Fort Worth Center airspace.
ZNYNumber of conflicts and average delay per resolution
00:3200:33 00:3400:3900:4100:46
00:39 00:3800:39
0
1000
2000
3000
4000
5000
6000
All En-route Merging Arr
Num
ber o
f Con
flict
s
-01:10
-00:30
00:10
00:50
01:30
02:10
02:50
Avg
. and
med
ian
dela
y [m
m:s
s]
1x 2x 3x +/- 1σ bonus resolutions
Fig. 4. Algorithm efficiency performance for New York Center airspace.
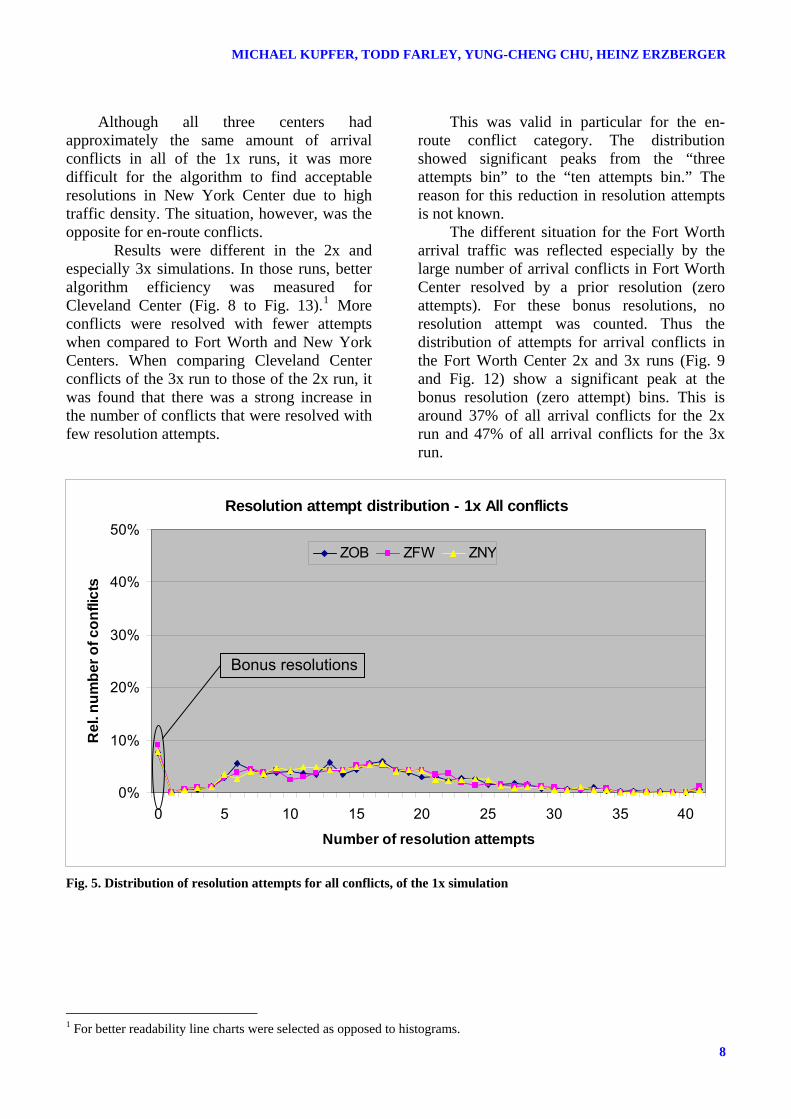
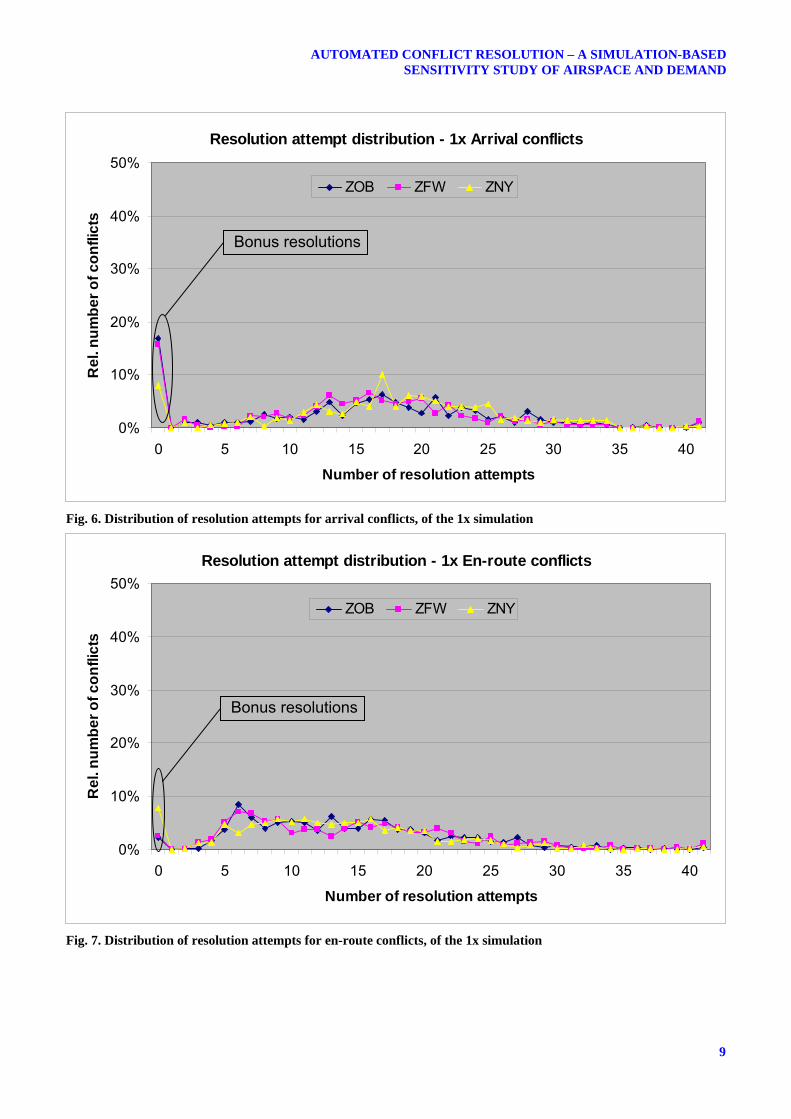
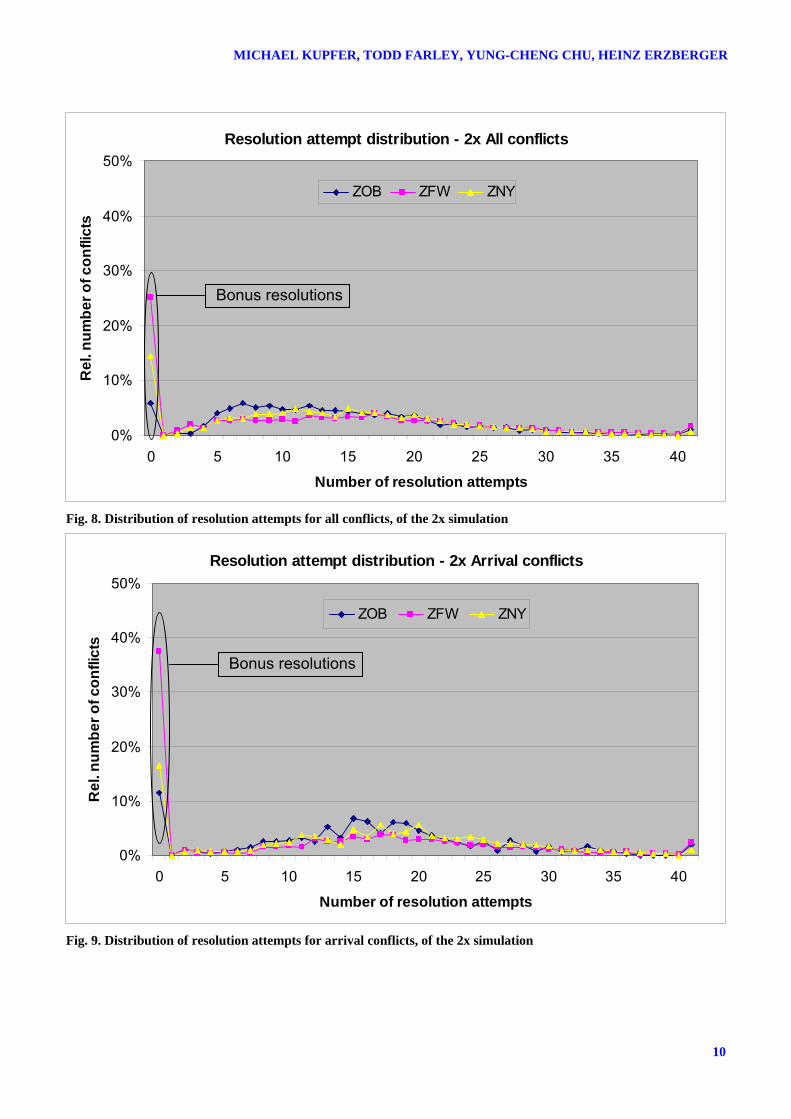
The resolution attempt distributions of all nine runs are presented in Figs. 5 - 13. These plots again show the differences in the performance metrics in each center. For all three centers, the 1x baseline simulations show similar resolution attempt distributions (Figs. 5 – 7). Clear differences exist for the arrival and
en-route conflicts resolved by bonus resolutions (zero resolution attempts) (Fig. 6 and Fig. 7).
Considering baseline traffic demand, relatively more arrival conflicts were cleared by bonus resolutions in Cleveland and Fort Worth Center than in New York Center.
7
MICHAEL KUPFER, TODD FARLEY, YUNG-CHENG CHU, HEINZ ERZBERGER
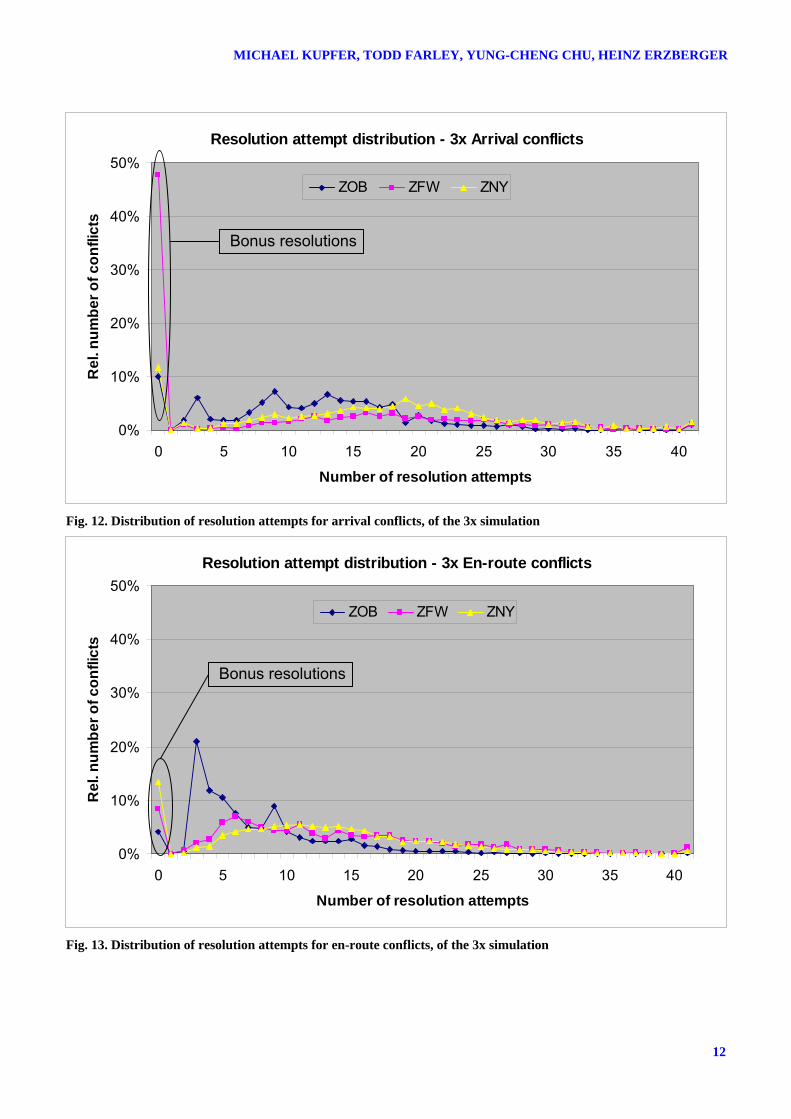
Although all three centers had approximately the same amount of arrival conflicts in all of the 1x runs, it was more difficult for the algorithm to find acceptable resolutions in New York Center due to high traffic density. The situation, however, was the opposite for en-route conflicts. Results were different in the 2x and especially 3x simulations. In those runs, better algorithm efficiency was measured for Cleveland Center (Fig. 8 to Fig. 13).1 More conflicts were resolved with fewer attempts when compared to Fort Worth and New York Centers. When comparing Cleveland Center conflicts of the 3x run to those of the 2x run, it was found that there was a strong increase in the number of conflicts that were resolved with few resolution attempts.
This was valid in particular for the en-route conflict category. The distribution showed significant peaks from the “three attempts bin” to the “ten attempts bin.” The reason for this reduction in resolution attempts is not known.
The different situation for the Fort Worth arrival traffic was reflected especially by the large number of arrival conflicts in Fort Worth Center resolved by a prior resolution (zero attempts). For these bonus resolutions, no resolution attempt was counted. Thus the distribution of attempts for arrival conflicts in the Fort Worth Center 2x and 3x runs (Fig. 9 and Fig. 12) show a significant peak at the bonus resolution (zero attempt) bins. This is around 37% of all arrival conflicts for the 2x run and 47% of all arrival conflicts for the 3x run.
1 For better readability line charts were selected as opposed to histograms.
Resolution attempt distribution - 1x All conflicts
0%
10%
20%
30%
40%
50%
0 5 10 15 20 25 30 35 40
Number of resolution attempts
Rel
. num
ber o
f con
flict
s
ZOB ZFW ZNY
Bonus resolutions
Fig. 5. Distribution of resolution attempts for all conflicts, of the 1x simulation
8
AUTOMATED CONFLICT RESOLUTION – A SIMULATION-BASED SENSITIVITY STUDY OF AIRSPACE AND DEMAND
Resolution attempt distribution - 1x Arrival conflicts
0%
10%
20%
30%
40%
50%
0 5 10 15 20 25 30 35 40
Number of resolution attempts
Rel
. num
ber o
f con
flict
s
ZOB ZFW ZNY
Bonus resolutions
Fig. 6. Distribution of resolution attempts for arrival conflicts, of the 1x simulation
Resolution attempt distribution - 1x En-route conflicts
0%
10%
20%
30%
40%
50%
0 5 10 15 20 25 30 35 40
Number of resolution attempts
Rel
. num
ber o
f con
flict
s
ZOB ZFW ZNY
Bonus resolutions
Fig. 7. Distribution of resolution attempts for en-route conflicts, of the 1x simulation
9
MICHAEL KUPFER, TODD FARLEY, YUNG-CHENG CHU, HEINZ ERZBERGER
Resolution attempt distribution - 2x All conflicts
0%
10%
20%
30%
40%
50%
0 5 10 15 20 25 30 35 40
Number of resolution attempts
Rel
. num
ber o
f con
flict
s
ZOB ZFW ZNY
Bonus resolutions
Fig. 8. Distribution of resolution attempts for all conflicts, of the 2x simulation
Resolution attempt distribution - 2x Arrival conflicts
0%
10%
20%
30%
40%
50%
0 5 10 15 20 25 30 35 40
Number of resolution attempts
Rel
. num
ber o
f con
flict
s
ZOB ZFW ZNY
Bonus resolutions
Fig. 9. Distribution of resolution attempts for arrival conflicts, of the 2x simulation
10

AUTOMATED CONFLICT RESOLUTION – A SIMULATION-BASED SENSITIVITY STUDY OF AIRSPACE AND DEMAND
Resolution attempt distribution - 2x En-route conflicts
0%
10%
20%
30%
40%
50%
0 5 10 15 20 25 30 35 40
Number of resolution attempts
Rel
. num
ber o
f con
flict
s
ZOB ZFW ZNY
Bonus resolutions
Fig. 10. Distribution of resolution attempts for en-route conflicts, of the 2x simulation
Resolution attempt distribution - 3x All conflicts
0%
10%
20%
30%
40%
50%
0 5 10 15 20 25 30 35 40
Number of resolution attempts
Rel
. num
ber o
f con
flict
s
ZOB ZFW ZNY
Bonus resolutions
Fig. 11. Distribution of resolution attempts for all conflicts, of the 3x simulation
11
MICHAEL KUPFER, TODD FARLEY, YUNG-CHENG CHU, HEINZ ERZBERGER
12
Resolution attempt distribution - 3x Arrival conflicts
0%
10%
20%
30%
40%
50%
0 5 10 15 20 25 30 35 40
Number of resolution attempts
Rel
. num
ber o
f con
flict
s
ZOB ZFW ZNY
Bonus resolutions
Fig. 12. Distribution of resolution attempts for arrival conflicts, of the 3x simulation
Resolution attempt distribution - 3x En-route conflicts
0%
10%
20%
30%
40%
50%
0 5 10 15 20 25 30 35 40
Number of resolution attempts
Rel
. num
ber o
f con
flict
s
ZOB ZFW ZNY
Bonus resolutions
Fig. 13. Distribution of resolution attempts for en-route conflicts, of the 3x simulation

AUTOMATED CONFLICT RESOLUTION – A SIMULATION-BASED SENSITIVITY STUDY OF AIRSPACE AND DEMAND
The algorithm chooses between various resolution types based on the nature of the conflict. For simplicity, the resolution types are organized into five different groups:
• Horizontal resolutions (path stretch to auxiliary waypoint)
• Speed resolutions (speed change with fixed increment/decrement, cruise/ descent speed profile change)
• Horizontal and speed resolutions (path stretch plus slow down, minimum delay turn to auxiliary waypoint for specified separation)
• Vertical resolutions (temporary altitude in climb, step climb from cruise, step descent from cruise, temporary altitude [descent from cruise, hold, descent], extended temporary altitude) and
• Bonus resolutions (conflict cleared in prior resolution)
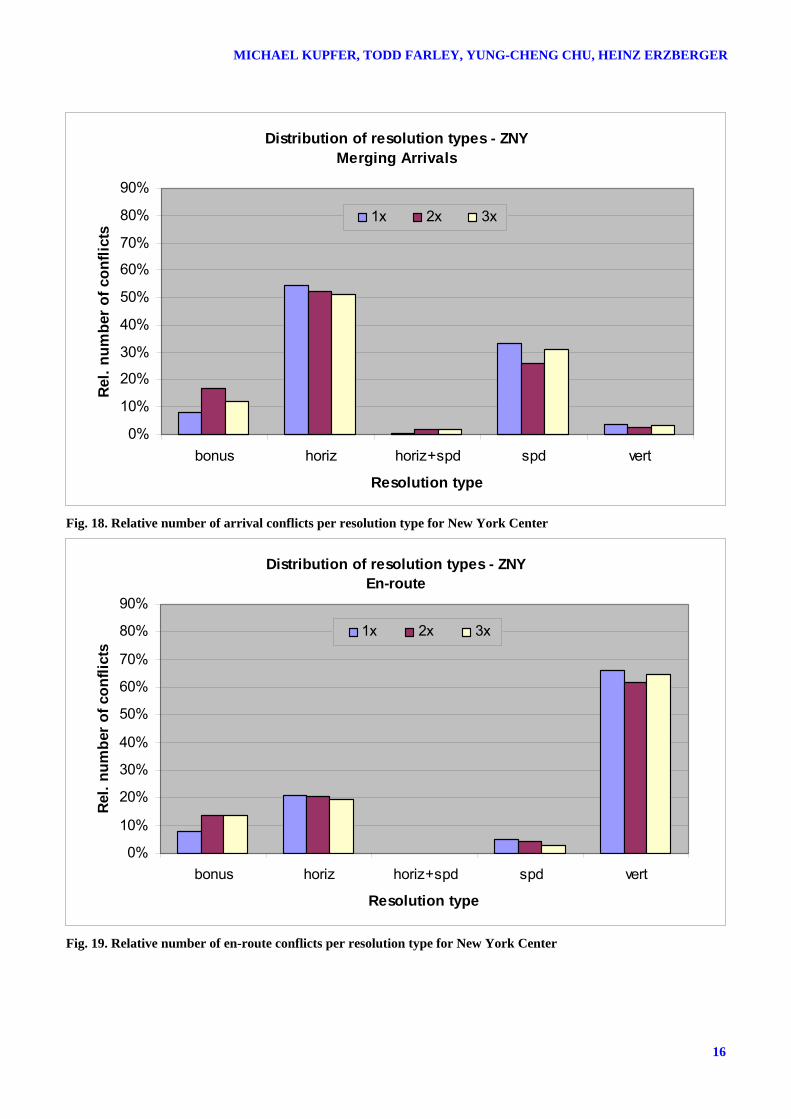
In Erzberger [5], the various conflict types and preferred resolution maneuvers are summarized. For clearing arrival conflicts, mostly horizontal and speed resolutions are used; vertical maneuvers and combined horizontal/speed maneuvers, however, are rarely considered. Resolution maneuvers for this specific type of conflict were chosen based on actual planned trajectories for arriving traffic merging at a common arrival meter fix.
To resolve, the algorithm determines whether one or both of the conflicting aircraft were cruising or descending. If the aircraft are descending, the preferred option is a horizontal maneuver, since it is in general not desirable for
an arrival aircraft to apply large speed changes or to apply changes in the descent profile.
However, in all three centers several of the arrival conflicts consisted of aircraft with at least one not yet descending. Here, the algorithm applied speed resolution maneuvers. The small number of vertical maneuvers was applied mainly when both aircraft were still in cruise. Fig. 14 through Fig. 19 show the relative number of resolved arrival and en-route conflicts per resolution type for Cleveland, Fort Worth and New York Centers.
The majority of the en-route conflicts in all of the three centers in all three demand levels were resolved using vertical maneuvers. In the previous and in the current study as well, these were more efficient, and thus, the algorithm logic was set accordingly. Horizontal maneuvers were used much less. Speed maneuvers were used rarely. The charts for the resolution types of en-route conflicts also show that bonus resolutions were not as frequent as they were for arrival conflicts. This indicates the arrival conflicts were more often interrelated.
The histogram for Cleveland Center in Fig. 15 shows the performance of the algorithm was very consistent for en-route conflicts in all of the three demand sets. In Fig. 16, it is noticeable that in Fort Worth Center the number of arrival conflicts cleared by horizontal and speed maneuvers decreased with increasing demand. At the same time, many more conflicts in the 2x and 3x runs were resolved by a prior resolution (bonus resolutions).
13

MICHAEL KUPFER, TODD FARLEY, YUNG-CHENG CHU, HEINZ ERZBERGER
Distribution of resolution types - ZOB Merging arrivals
0%
10%
20%
30%
40%
50%
60%
70%
80%
90%
bonus horiz horiz+spd spd vert
Resolution type
Rel
. num
ber o
f con
flict
s
1x 2x 3x
Fig. 14. Relative number of arrival conflicts per resolution type for Cleveland Center
Distribution of resolution types - ZOB En-route
0%
10%
20%
30%
40%
50%
60%
70%
80%
90%
bonus horiz horiz+spd spd vert
Resolution type
Rel
. num
ber
of c
onfli
cts
1x 2x 3x
Fig. 15. Relative number of en-route conflicts per resolution type for Cleveland Center
14

AUTOMATED CONFLICT RESOLUTION – A SIMULATION-BASED SENSITIVITY STUDY OF AIRSPACE AND DEMAND
Distribution of resolution types - ZFWMerging Arrivals
0%
10%
20%
30%
40%
50%
60%
70%
80%
90%
bonus horiz horiz+spd spd vert
Resolution type
Rel
. num
ber o
f con
flict
s
1x 2x 3x
Fig. 16. Relative number of arrival conflicts per resolution type for Fort Worth Center
Distribution of resolution types - ZFWEn-route
0%
10%
20%
30%
40%
50%
60%
70%
80%
90%
bonus horiz horiz+spd spd vert
Resolution type
Rel.
num
ber
of c
onfli
cts 1x 2x 3x
Fig. 17. Relative number of en-route conflicts per resolution type for Fort Worth Center
15
MICHAEL KUPFER, TODD FARLEY, YUNG-CHENG CHU, HEINZ ERZBERGER
16
Distribution of resolution types - ZNYMerging Arrivals
0%
10%
20%
30%
40%
50%
60%
70%
80%
90%
bonus horiz horiz+spd spd vert
Resolution type
Rel
. num
ber
of c
onfli
cts
1x 2x 3x
Fig. 18. Relative number of arrival conflicts per resolution type for New York Center
Distribution of resolution types - ZNYEn-route
0%
10%
20%
30%
40%
50%
60%
70%
80%
90%
bonus horiz horiz+spd spd vert
Resolution type
Rel.
num
ber
of c
onfli
cts
1x 2x 3x
Fig. 19. Relative number of en-route conflicts per resolution type for New York Center

AUTOMATED CONFLICT RESOLUTION – A SIMULATION-BASED SENSITIVITY STUDY OF AIRSPACE AND DEMAND
Some aircraft were involved in several conflicts during their flight through their respective Center. Furthermore, some aircraft were being selected multiple times as maneuver aircraft and were not only leaving the original flight plan several times but also accumulating delay in the run of the multiple resolutions.
The algorithm logic, however, contains several rules to minimize repeated selection of maneuver aircraft, which minimizes accumulated delay. For example, if an aircraft that was never selected as maneuver aircraft was in conflict with an aircraft that was already maneuvered previously, then the first aircraft was selected as maneuver aircraft. Furthermore if both of the conflicting aircraft were maneuvered more than once, the accumulated delay was compared and the aircraft with the least total delay was selected. More rules for selecting the resolution aircraft were implemented. Even though the issue of multiple maneuvers was addressed to some extent, the algorithm logic can be refined to minimize the total delay per aircraft and the number of selections for conflict resolution.
Fig. 20 shows for the three centers, for the three demand levels and for all conflicts, how often aircraft got maneuvered on their flight through the respective center. It is shown, that for all centers most of the aircraft executed only one resolution maneuver. Much less aircraft were maneuvered twice. A minority of the flights, mostly being in an arrival conflict, were maneuvered three to eight times. Very rare instances occurred where aircraft, involved in arrival conflicts only, were maneuvered more than that.
Because of the special airspace and route characteristics of Fort Worth Center, aircraft in arrival conflicts in the 2x and 3x simulations (four instances) were maneuvered fifteen,
seventeen and nineteen times. Instances where aircraft in an en-route conflict were maneuvered more than 4 times were the result of situations where an en-route stream was crossing an arrival stream or two arrival streams were crossing each other, feeding two airports in close proximity. This traffic situation was an artifact of the modeling in ACES. In real world operations, these situations would be avoided. However, as Table 2 shows, aircraft from all conflict categories in this center accumulated on average more than 3 minutes of delay. For each center, Table 3 shows the proportion of the number of maneuver aircraft to the total number of flights (cp. Table 1).
Table 2. Number of aircraft (all conflicts) maneuvered more than once to resolve a conflict and average accumulated delay [mm:ss]
No. of maneuver aircraft
Average accumulated delay [m:ss]
ZOB 1x 10⁵ 1:192x 346 1:023x 436 0:52 ZFW 1x 99 1:392x 612 3:013x 600 3:09 ZNY 1x 144 1:232x 533 1:473x 619 1:36
Table 3. Proportion of maneuver aircraft (all conflicts) to the total number of flights
ZOB ZFW ZNY 1x 11.1% 12.4% 14.2%2x 16.3% 20.2% 19.7%3x 17.1% 18.3% 17.6%
17

MICHAEL KUPFER, TODD FARLEY, YUNG-CHENG CHU, HEINZ ERZBERGER
1 3 5
1 3 5 7 911 13 15 17 19 1 3 5 7 1x
2x3x
0%
10%
20%
30%
40%
50%
60%
70%
80%
90%
Perc
ent o
f airc
raft
Maneuvers per aircraft
Demand
Count of maneuver aircraft(all conflicts)
1x2x3x
ZOBZFW
ZNY
Fig. 20. Relative number of aircraft being selected as maneuver aircraft more than once
5 Discussion It was expected in this study that neither
the varying airspace nor the increases in air traffic demand will significantly affect the safety and efficiency performance of the conflict resolution algorithm. The results of the nine simulations do not support this prospect with one exception.
The algorithm performed differently in various airspace regions. As mentioned earlier, the automated conflict resolution algorithm was designed and tested particularly in Cleveland Center with its specific conflict scenarios. Relative to its design, the performance of the algorithm differed greatly when introduced to new conflict scenarios found in other airspace centers.
This effect was shown clearly by the results for Fort Worth Center. Fig. 21, the conflict location plot of the 2x simulation run of Fort Worth Center, represents the situation’s archetype. The arriving traffic was flying over the arrival fixes at the four corner posts of the TRACON, in particular over the northeast and northwest fixes. The algorithm now was confronted with a situation that was more an
arrival sequencing and scheduling issue rather than a conflict resolution problem. The large number of arrival conflicts was difficult to resolve. As the aircraft of the conflict crossed the same point at the same altitude, it was more challenging for the algorithm to compute an acceptable resolution trajectory. The resolutions often resulted in a larger delay to the flight plan than resolutions for other types of conflicts.
30
31
32
33
34
35
36
-104 -102 -100 -98 -96 -94 -92 -90Longitude
Latit
ude
Fig. 21. Conflict location plot for Fort Worth Center at the 2x demand level
Repeatedly, one aircraft was in conflict with several other aircraft all traveling on a different flight path towards the same arrival meter fix. In case that aircraft was maneuvered, the other conflicts were resolved at the same
18

AUTOMATED CONFLICT RESOLUTION – A SIMULATION-BASED SENSITIVITY STUDY OF AIRSPACE AND DEMAND
time (i.e., bonus resolutions). Fig. 22 describes this situation. Aircraft 1 is in conflict with aircraft 2, 3 and 4. If aircraft 1 executes a resolution, all three conflicts are cleared.
Fig. 22. Conflict situation between four arriving aircraft merging at the same arrival meter fix
Another important aspect that influenced the performance of the algorithm is how terminal airspace was modeled within the simulation software ACES. The Dallas/Fort Worth terminal airspace was modeled using the default radial model where four arrival and four departure fix nodes were an equal distance from the airport node. Furthermore, several smaller airports such as Dallas Love Field and Addison Airport are near to Dallas/Fort Worth. The modeled arrival fixes of those airports in ACES are very close to each other. This condition did create complex traffic situations such as crossing arrival streams that would not exist in real world operations. As a result, the conflicts which occurred need to be considered as simulation artifact and thus, should not be cases for the conflict resolution algorithm. Furthermore, it needs to be reiterated that in the conflict situation depicted above, where arrival aircraft were not flying to the same arrival fix, is counted in the en-route conflict category.
In New York Center, a more sophisticated model was used. Arriving traffic was distributed over twelve arrival fixes into the New York TRACON (the three major airports: Newark, JFK and LaGuardia). In this center, many conflicts occurred along the main inbound arrival routes coming from the west, from Cleveland Center. Cleveland Center, however, had a large amount of over-flight traffic. Many
conflicts occurred on route crossings. Fig. 23 and Fig. 24 show the conflict location plots of Cleveland and New York Centers.
39
40
41
42
43
44
-86 -85 -84 -83 -82 -81 -80 -79 -78 -77 -76
Longitude
Latit
ude
Fig. 23. Conflict location plot for Cleveland Center at the 2x demand level
39
40
41
42
43
-79 -78 -77 -76 -75 -74 -73 -72Longitude
Latit
ude
Fig. 24. Conflict location plot for New York Center at the 2x demand level
Improvements in the performance of the algorithm when applied to various airspace regions could be made with airspace specific amendments. Nonetheless, it is an open research issue what effect the preciseness of the terminal model has on the performance of the algorithm.
Despite the fact that the algorithm was designed and tested in Cleveland Center, all of the detected conflicts in the three airspace regions and at all three demand levels were resolved. These results confirm the expected algorithm resolution performance. Neither varying airspace nor varying demand affected the safety performance of the algorithm.
Each successful resolution can also be considered as an individual test of the algorithm. This means that the algorithm not only demonstrated complete success in nine simulations, but in doing so, it resolved more than 27,000 conflicts. However, the
19

MICHAEL KUPFER, TODD FARLEY, YUNG-CHENG CHU, HEINZ ERZBERGER
aforementioned limitations and assumptions applied, such as the near-deterministic character of the simulations.
The automated conflict resolution algorithm is also sensitive to demand. However, differences in the algorithm performance at the different demand levels were most often directly linked to airspace design, such as route structure and number and location of meter fixes, and arrival management logic not designed to cope with saturated arrival meter fixes. This was particularly the case for the arrival conflicts in Fort Worth Center. With the strong increase of the number of conflicts in the 2x and 3x runs, the average delay also increased. The delay distributions of the 2x and 3x runs were significantly statistically different (significance level of 0.05) compared to the delay distribution of the 1x run.
Another example of airspace layout and traffic characteristics having an impact on the delay performance was the high average delay values of the en-route conflicts in New York Center. Here, limited airspace teamed with conflicts that were more difficult to resolve (such as en-route vs. arrival) resulted in resolutions with a higher delay compared to Cleveland Center.
Most of the maneuver aircraft were selected only once to clear a conflict. Rare instances occurred where aircraft executed resolutions many times. This was the case for aircraft in arrival conflicts, in the 2x and 3x runs of Fort Worth Center. This finding further points out the influence of airspace design, such as the number of arrival fixes. To avoid an increased number of arrival conflicts generating large amounts of delay while the same aircraft were being selected several times as resolution aircraft, an arrival management tool such as the Traffic Management Advisor (TMA) needs to be integrated with the resolution process. This integration of conflict resolution and arrival sequencing and metering would ensure that arrival traffic does not exceed the capacity of the meter fixes.
By tallying the aggregate delay experienced by each aircraft, researchers may begin to discern the “congestion frontier” at which conflict detection and resolution should
be supplemented with traffic management initiatives - or conversely, the frontier below which traffic management initiatives may prudently be removed.
Again, the conflict resolution algorithm, even though it was designed and tested in Cleveland Center only, resolved all of the detected conflicts in each of the tested airspace regions. Keeping the deterministic simulation environment in mind, the strength of the algorithm to compute resolutions for all the conflicts of an extensive set of conflict types was shown in this study. Future studies need to address in more detail the implementation of arrival management logic and the influence of uncertainties, for example in the trajectory calculation and execution.
When comparing the current 1x and 2x Cleveland Center simulation results to the previous study (Table 4), cautionary statements must be made. First, the conflict resolution algorithm underwent some changes in the logic, primarily changes in the maneuver aircraft selection and speed calculation, and second, for the current study another traffic day was selected. Table 4. Comparison of resolution success and average delay per resolution between the previous study by Farley [6] and the current study (ZOB only)
1x 2x Previous study
Current study
Previous study
Current study
Resolved conflicts 100 % 100 % 99.3 % 100 %
Average resolution delay en-route conflicts
18.6 s 15.6 s 16.6 s 17.9 s
Average resolution delay arrival conflicts
49.4 s 44.9 s 56.4 s 30.1 s
The resolution performance increased in
the 2x demand scenario. In the previous study [6] for 18 arrival conflicts, resolutions were computed by TSAFE. The average delay value for en-route conflicts improved slightly for the 1x run and stayed roughly in the same range for the 2x run. The average delay values for arrival
20

AUTOMATED CONFLICT RESOLUTION – A SIMULATION-BASED SENSITIVITY STUDY OF AIRSPACE AND DEMAND
conflicts in the 1x and 2x run, however, improved at both demand levels, especially in the 2x run.
It is difficult to say whether the differences in the results were caused by selecting a new traffic day and were coincidental, or were caused by the modification of the algorithm. A simulation re-run using the new traffic day, but using the old algorithm version would help to answer this question.
6 Summary Conflict detection and resolution is
designed as a layered safety system that may require as many as three layers. The automated conflict resolution algorithm applied in this study is the strategic layer, and therefore, the highest safety layer in separation assurance. Traffic volumes of up to three times the current demand are envisioned in the future air traffic control system. Safe and efficient conflict detection and resolution is a key enabler for this envisioned system.
Previous studies have only investigated this conflict resolution algorithm in Cleveland Center for traffic volumes increased by 50% (1.5x) and 100% (2x). In this study, the automated conflict resolution algorithm was applied to three different airspace regions: Cleveland Center, Fort Worth Center and New York Center. For these three centers, traffic demands were simulated at a 1x current day baseline, 2x and now a 3x traffic demand scenario. Design limitations in the current terminal airspace required the arrival traffic demand be held to only 1.5x in both the 2x and 3x runs.
The results showed 100% resolution success in all nine simulations. It should be reiterated that no uncertainties were accounted for in the trajectory modeling.
The results for en-route and for arrival conflicts differed substantially. The results in this study suggest that the automated conflict resolution algorithm is sensitive to airspace. One reason for the different performance in other centers is the design and testing of the algorithm specifically in Cleveland Center airspace and its traffic situation. The size of the
airspace, as well as the number of airports and modeled arrival fixes, played an important role in 2x and 3x runs and particularly in Fort Worth Center where many arrival conflicts occurred. Here, arrival scheduling and sequencing was the challenge, rather than conflict resolution. The majority of the arriving traffic flies into a single TRACON airspace over only four arrival meter fixes. Future research will show if this problem will be alleviated by integrating the conflict resolution algorithm with an arrival management tool.
Delay performance also was dependent on the airspace. The average delay for all conflict types for the Cleveland 2x simulation was 20 seconds. In contrast, in Fort Worth Center, the overall average delay at the 2x run was 50 sec., significantly higher due to the arrival sequencing issue mentioned above. Limited airspace and numerous arrival/departure aircraft contributed to a relatively high overall average 41-second delay in New York Center.
The results of this study suggest furthermore that the performance of the algorithm is also sensitive to demand. For example, differences between the runs for one center were found for the resolution attempt distributions. However, different results due to varying demand can most often be attributed to airspace characteristics. In high demand scenarios, a small number of aircraft involved in arrival conflicts were selected as maneuver aircraft up to seven times as the maneuver aircraft (Cleveland and New York Centers) – however, under the special arrival conditions at Fort Worth, few aircraft executed up to nineteen resolutions. Clearly, when excluding arrival conflicts, the maneuvers per aircraft were less: around 5 resolutions per aircraft in the higher demand scenarios of Cleveland and New York Centers and 7 to 8 maneuvers for rare instances in Fort Worth Center. This finding justifies the need for implementing an arrival management system. These findings also support the need for future research in how to reduce the number of maneuvers during the flight of an aircraft and thus, further discussion the enhancement of the automated conflict resolution algorithm.
For all simulations, the differences in algorithm performance were primarily for
21

MICHAEL KUPFER, TODD FARLEY, YUNG-CHENG CHU, HEINZ ERZBERGER
arrival conflicts because an arrival sequencing and metering logic was not implemented. In addition, performance differences also occurred for situations where arrival traffic was in conflict with en-route traffic. In scenarios where only en-route traffic was involved, the algorithm performance was reasonably similar for all centers, particularly in the 1x simulations.
7 Future Work The results indicate a need to combine
automated conflict resolution with arrival air traffic management logic. This need is currently being addressed. The added arrival management logic will deliver aircraft to the meter fixes, while maintaining trajectories that are conflict free. With this work it will be possible to conduct investigations with arrival traffic volumes increased the same amount as en-route traffic. Additional analysis is required to determine when it is beneficial to resolve the conflict in such a way that the amount of aircraft maneuvers are minimized as opposed to resolving conflicts creating the least amount of delay.
To conduct more realistic simulations, it will be necessary to remove the assumptions made during this study. Firstly, it is suggested not to hold the arrival traffic in the 2x and 3x simulation runs to only a 50% increase above the baseline. However, redesign of the terminal airspace is required to avoid abnormal traffic patterns. To cope with increased arrival traffic volumes a possible design fix may be the modeling of additional arrival meter fixes. The application of more powerful computers should relax computational limitations.
Secondly, this and previous studies conclude that the automated conflict resolution algorithm demands further research within the context of uncertainty. Research is already in progress, focusing particularly on uncertainties impacting guidance, navigation and control systems. In this new study uncertainty is accounted for by a) introducing and varying delay until a resolution is executed and b) by adjusting the radius of required separation around the aircraft.
Furthermore, research is currently ongoing to investigate service-provider-based automated separation assurance. In human-in-the-loop (HITL) simulations, the acceptance of fully automated and semi-automated conflict resolution at varying demand levels is being investigated.
The results of the current study suggest that if Air Route Traffic Control Centers other than Cleveland Center are investigated, adaptations to the algorithm first must be made. Comparisons between other conflict resolution algorithms to the one investigated in this study are desired. This would help to identify the strengths and weaknesses of different approaches to separation assurance. Moreover, a future research question is comparing algorithm performance between structured airspace (e.g., with defined routes) and unstructured airspace (e.g., when applying the free flight concept).
It is hoped that fellow researchers in the community contribute by adding other performance standards as well as measuring performance using the benchmarks used in this study.
References [1] Federal Aviation Administration. Terminal Area
Forecast Summary. FAA-APO-07-1, US Department of Transportation, Washington, DC, USA, 2007.
[2] Armey D. Fixing the Air Traffic Mess. Wall Street Journal, Chicopee, Massachusetts, USA, 2007.
[3] NASA. NASA & The Next Generation Air Transportation System, NASA whitepaper, Washington DC, USA, 2007.
[4] Erzberger H. The Automated Airspace Concept. Proc 4th USA/Europe Air Traffic Management R&D Seminar, Santa Fe, New Mexico, USA, paper 160, 2001.
[5] Erzberger H. Automated Conflict Resolution for Air Traffic Control. Proc 25th International Congress of the Aeronautical Sciences (ICAS), Germany, 2006.
[6] Farley T, Kupfer M and Erzberger H. Fast-Time Simulation of a Conflict Resolution Algorithm for En-Route and Arrival Operations Under High Air Traffic Demand, 7th AIAA Aviation Technology; Integration and Operations (ATIO) Conference, Belfast, Northern Ireland, 2007.
[7] Kuchar J K. A Review of Conflict Detection and Resolution Modeling Methods. IEEE Transactions on Intelligent Transportation Systems. Vol. 1, No. 4, pp 179-189, 2000.
22

23
AUTOMATED CONFLICT RESOLUTION – A SIMULATION-BASED SENSITIVITY STUDY OF AIRSPACE AND DEMAND
[8] Erzberger H. Transforming the NAS: The Next Generation Air Traffic Control System. NASA/TP-2004-212828, NASA Ames Research Center, Moffett Field, USA, 2004.
[9] Sweet D N, Manikonda V, Aronson J S, Roth K and Blake M. Fast-Time Simulation System for Analysis of Advanced Air Transportation Concepts, AIAA-2002-4593, American Institute of Aeronautics & Astronautics, Reston, Virginia, USA, 2002.
[10] Sensis Corp. AvDemand User Guide, Campbell, California, 2007.
Copyright Statement The authors confirm that they, and/or their company or institution, hold copyright on all of the original material included in their paper. They also confirm they have obtained permission, from the copyright holder of any third party material included in their paper, to publish it as part of their paper. The authors grant full permission for the publication and distribution of their paper as part of the ICAS2008 proceedings or as individual off-prints from the proceedings.