automated collection of road condition data … · automated collection of road condition data with...
TRANSCRIPT

1 Roadroid WRC 201511 Seul 0.6.doc 1
AUTOMATED COLLECTION OF ROAD CONDITION DATA WITH SMARTPHONES
L. FORSLOF FOUNDER/CEO, Sweden [email protected]
ABSTRACT This paper focus on three questions: 1) How accurate is it, 2) how to collect data and 3) what’s the benefits? The abstract focus on maintenance needs – as its where most money directly can be saved. The accuracy was traced in a correlation study where data from Laser IRI surveys and Roadroid was compared. It shows a possibility to reach R2>0.85, but also that the correlation is depending on speed and road types. It is fully possible to reach correlations over R2 0.75 in production. IRI is currently often collected through yearly surveys. With a standard car and a smartphone the data collect options broadens. The best options is considered as: a) the operational maintenance vehicles and b) rural post- and newspaper delivery vehicles. Crowdsourcing is not considered as a good option. For low volume roads (including unpaved roads) Roadroid means a simple, robust and objective monitoring. Smartphones can make a great change here to develop the maintenance methods. For high-end roads smartphones benefits in Performance Based Maintenance (PBM) with new Key Performance Indicators (KPI) as you can get daily IRI data. And you can update pavement plans after a winter and spring thaw – or to guide upcoming Laser surveys.


1 Assessment of data quality: Through a collaboration with the Automobile Association in Sweden (Motormannen, M), twelve of their Volvo V40 inspection cars surveyed 92.000 road km May-September 2014. One target of the study was to assess the accuracy of the Roadroid data, first towards IRI values from a IQL1/laser survey and then through a qualitative study of how car drivers experience the road quality/comfort.
1.1 Introduction
The most widely used road condition standard globally is the International Roughness Index (IRI - http://en.Wikipedia.org/wiki/international_roughness_index). But there is not a guarantee that a user will experience a road in the same way as IRI. Here the difference between texture and roughness – and the survey speed plays a role for what Roadroid measures. If the road surface texture is very rough, the road is experienced as very uncomfortable by the users. In such a situation the IRI value still could be fair.
Bad RoughnessBad Texture
Good RoughnessBad Texture
Bad RoughnessGood Texture
Good RoughnessGood Texture
1)
2)
3)
4)
Figure 0 - Roughness and texture of a road. In the example above a road can be rated as good according to IRI, while a road user experience can be very bad (case 2). Conversely a road can be rated as reasonably good in low speed but still have a poor IRI (case 4). More about these conditions is mentioned here: https://www.linkedin.com/pulse/20141130211746-97325448-roughness-and-texture Roadroid gather two different IRI values one estimated and one calculated [7]. One that’s more sensitive to texture (eIRI) and one that use the original quarter car formula and use a smothering filter for texture influence (cIRI).

1.2 Roadroid correlation to IQL1 data
The IQL1/Laser surveys in Sweden are nationally procured with very high demands and on 3-4 years contract. Sweden have in recent years been using both Destia o Ramböll as supplier of the surveys. The surveys are carried out in June-September and after that its some months of data processing before its imported to the pavement management system (PMSv3). The budget for the surveys is about mSEK 20, and the post process costs an additional mSEK 5-10. The survey vehicles measure a range of parameters such as rut depth, cracking, texture, etc. in addition to IRI. The measurement of IRI is done with laser and it has a very precise length and distance measurement. To make the correlation studies we limited the large about of data to the state roads for the two counties of Gävleborg and Jämtland (see figure 3 of Gavleborg print with coloured eIRI levels). We then assigned IRI data from both IQL1/Laser data and Roadroid to the same spatial road links, and then could see data from both syste have the both data in different columns for the same sections:
IRI
0-20 m 20-40 m 40-60 m 60-80 m Osv… Vägens längds-riktning
IRI
Data varje sekund med ko-ordinat – matchning till länk Vägens längds-riktning
Ett unikt objekt-ID (OID)length; irihv; avgspeed; nopoints; eiri; ciri
Medel för IRI höger o vänster (irihv)
Medel för hastighet, antal punkter för länken, eIRI ocIRI
IRI från Vägytemätning IRI från Roadroid
Figure 1 – Data from IQL1/Laser and Roadroid transferred to the same spatial road link.
Figure 2 – Making it possible to filter data and search for correlations.

Figure 3 – Map image of all data from M-cars, Gavleborg county. The colour levels represent eIRI levels Green <2,2, Yellow 2,2-3,8, Red 3,8-5,4 and Black >5,4).

Below is the comprehensive finding of the study. Detailed description of the comparisons is available in a separate paper for those who are interested.
Generally:
The study provides a basis for interesting findings and indications. We confess that
the time spent on analysis and our knowledge is too limited to make a scientific
claim on the result, but it gives clear indications of the accuracy.
There is a huge data set to analyze, and a suggestion to Trafikverket was to rig a
research assignment or thesis to study more details of the result.
In addition to studying the correlation against IRI should such a study include
correlation with the mega textur.
Furthermore, it should be done further studies where Roadroids cIRI-settings is
tuned and calibrated both in sensitivity and segmentation lengths.
More concrete: - One finding consistent with studies autumn of 2012 is that Roadroid achieves a
satisfactory accuracy under certain conditions. Satisfactory accuracy refers to a
correlation coefficient (R2) to IQL1/Laser of over 0.6. The correlation is often even
more accurate.
- It is possible to analyze data down to 20-metre sections. This was not the idea from
the beginning, but the analysis shows that it is possible within certain speed ranges.
- For 100-meter sections at speeds above 80 km/h it is possible for eIRI to reach R2
of 0.72, and the cIRI 0.77. The latter without being tuned to perfection.
- In an analysis of more than 500 whole road links (OID), with lengths of between 0.2
to 30 kilometers, and the speed range 50-100 km/h the correlation is 0.56.
- With a restriction to a specific road type the correlation factor incline to 0.88. Higher
than that is it not reasonable to reach due to the link matching problems.
- The correlation factor seems better on poor roads (with higher and more variable
IRI), and lower on better roads with minor variations. Low values and smaller
variation band makes it harder to correlate well.
- IQL1/Laser data seems to have a larger dynamic range, with higher values on Poor
roads and lower values on good roads. This can provide input to the development
of the Roadroid algorithms.

1.3 Qualitative comparison to experience of drivers/operators
These approximately 25 people divided into 12 cars/teams have been driving between 5,000-15,000 kilometres per car. Most have followed with interest how the system works/register during the process, and how the measurement data are then displayed on the internet. We asked them two questions of what they think of the result.
Figure 4 – The Volvo V40 cars used
Figure 5 - Introduction to the 25 operators
Question 1: - If you look at the maps (Annex 2 and 3) with data you have collected, how do you
think the result correspond to your own opinion? (1 = not at all 10 = completely true) Answer 1:
- Average 8.4 (some complained that the municipal roads was filtered out) Question 2:
- How do you like the app performed during survey? Did it register damages/bumps in the road surface? (1 = not at all, 10 = very well)
Answer 2: - Average 9.0
Text comments:
- After learnt to protect the unit from the Sun with a "screen" and replaced one device
it was easy to use! However, the unit sometimes completely locked without reason!
Forced shutdown was only able to start all over again!
- The unit did not register long deep depressions in the road surface.
- If it was too hot weather we could not use the charger, we had to take it home and
charge it overnight.
- To take photos with the placement in the middle of the car was not so good, the unit
came out of position when pressing the photo button.
- The sensor could have been a little more sensitive.
- Roadroid is a very good feature. We miss not having the whole year to measure -
even in winter and spring.
- It gave great results. And it was nice to view the Police and tell what the roads
reality looks like. The police and others was very impressed when I showed up the
features and results.

- The unit did not collect rutting
- The mobile was heat sensitive.
The summary from the qualitative evaluation is that Roadroids correlates very well with how M:s drivers and operators experience the road quality. Practically the project worked very good, well above expectations. The operators only got a 2 hour introduction, it was some phone support and troubleshooting. - But 92.000 km of road data have been collected, and that is impressive! In parallel with this report the Automobile Association's have made their own report published 24 february 2015, and it gained lots of medial interest and is considered as a major benefit for their over 110,000 members in Sweden.
2 How can data be collected? Below is a description of how data can be collected with Roadroid, looking at following possible parties:
Transport administrations project managers (client of contracts)
Contractor's “road guards” and their sling runs
Consultant´s third party control
The Mail/Newspaper rural distributor services
The motorist clubs inspectors (12 each summer)
The motorist clubs members (building a voluntary community)
Public crowdsourcing (with an app available on Google Play)
2.1 Trafikverkets project managers
Sweden is divided into some 110 geographic areas called “base maintenance areas”. Each area consists of 70 to 160 km roads. Maintenance of the respective area is procured in four years with the possibility of accommodation. The contract comprises mainly short-term measures which aims to keep the road open to traffic, such as: - Winter Road maintenance, snow-plowing and de-icing. - Maintenance of dirt roads, paved roads and rest areas. - Fix small coating defects and potholes - replacing damaged road signs, - simple surfacing works More long-term measures of the road construction is being procured separately. The dominant action here is maintenance of road pavements, bridges and tunnels. Trafikverket has a project manager responsible for ordering of maintenance for one or more domains. They are often on the road to assess the quality of the roads and of performed maintenance work. One advantage using them as probes is that they are directly responsible for the maintenance contracts. And It is also beneficial that they themselves gathered data — so that they can have a confidence for the result. One disadvantage with them is that they have to cover relatively large areas (2-3 maintenance districts) and have a lot of other things to be responsible for. Thus data collection may not happen often, especially on smaller roads. They pass the major roads only some few times a month.

2.2 The contractors supervisors, and “road guards” at sling runs
The running maintenance is organized in the ~110 districts, by different companies who manage the contracts. The districts vary in size and geographical challenges. There is a manager who leads the work and he usually called supervisor or production manager. This person is also out relatively often on supervision along the roads. There is also a routine assigned to the contractor, to regularly do so called sling runs. The frequency are different depending on road class. Major European roads will be revised up to 2 times per week, while County roads down to 2 times/month. This is done by staff with some tools so they can fix such as fallen down signs directly on site. They make notes with pen and paper along the way on the other things that need to be addressed.
One advantage of using the sling runs is that they are made quite frequently, and that they represent a fixed routine of work. The data collection also easily show when they were was at a specific location. The data quality is relatively easily assured. A disadvantage is that they have no mission to do this at present. The contractor lack incentives to do the extra work needed and they can´t pay for the survey technology. This can obviously be changed over time if the client decides…
Figure 6 –NCC Supervisor, Hudiksvall distict
2.3 Post/News paper distributors
The Posten logistik shares the daily mail and empties mailboxes, 5 days a week. They have all similar vehicles (approximately 5000 cars in Sweden) and run mostly the same routes. The newspaper service (TAB) is handing out the morning newspaper on the same routes 6 days a week, sometimes with an extended tour on Saturdays. They covers most of the Swedish roads every day. Every morning, they use some 2700 cars to distribute about 600,000 newspapers and also undertake to distribute some goods along with some magazines. In urban areas they are affected both by traffic and of start/stops for mailboxes. But this is mostly on local streets, and they're less interesting from a State road perspective. And - It is a great advantage with them driving in the early morning!
Figure 7 – A rural mail distributor
This means less influence by traffic, and in a traffic information perspective you will be able to present a good view of the coming situation before the dense traffic flows will begin. Roadroid interacted 2013 with TAB and made daily measurements over the period of the frost thaw – and this will be done again spring 2015.

2.4 Third part consultants
The third part consultants was not included in the study, but they make inspection rounds for about 10 regions in Sweden (quite much larger areas than the maintenance districts). They are supposed to be an independent body between the contractor and the client, and also travels the roads frequently. It could be a good option to use them as they spend quite some time on the roads. But we need a developed discussion with their client to find out more about their mission.
2.5 The Motorist club (M) inspectors
In Sweden M makes a yearly inspection of about 300 road stops, and they are supposed to inspect them twice during the summer season. Their 12 cars for the purpose travels about 5.000-15.000 km each adding up some 100.000 km of surveys each year. They could possibly be used for other purposes, as inspecting road works during summer.
Figure 8 – Some of the 25 drivers of the 12 M inspection cars
Their focused driving can possibly supplement IQL1 surveys with IRI data to the PMSv3. Pros: a simple and convenient way to collect large amounts of data with same vehicles and focused drivers. Cons: Is still only a yearly data collection, and the units are a bit difficult to control. Large areas can be missed.
2.6 M members
This is an interesting step to begin talking "crowd solutions", i.e., that “anyone” should be able to download an app and make data gathering. We consider it important that those who collect data have adequate incentives to use sensible cars and phones, run in a sensible way, etc. Therefore, we believe that members of a motorist organization may be interested to make this work better than any casual driver. It gives them also an "exclusive" feeling to their club/community to make this mission. And if you can attract 1% of their 110,000 members it means over 1000 probes in Sweden! Pros: Interest and incentives, pride and a “club feeling” to make the surveys properly. Cons: Difficult to control, risk for collection only in certain geographical areas (cities).

2.7 Public crowd sourcing
It's easy once you understand that you can make surveys with a cell phone, to quickly have the idea that the public should download an app and collect data. But there are major challenges in this. First, it requires a particular arrangement and commitment. You need a car cradle and cannot talk or surf with your phone during surveying. There are a plethora of phone models with very different sensors - and extreme car models. The prompt response from IT people is "Big data solves all this”. But we believe they underestimated the trouble with poor data quality. In addition most of the probes will revolve in large cities
Figure 9 – Crowd sourcing, easier said than done.
Roadroid have made some tests of a crowd-app, in both Sweden and in a taxi in Bangkok. But we have a long way left to set up a fundamental quality management and also to find a business model that works. In any case we believe to start in a community and make the app exclusive for members in a motor clubs for instace.
Figure 10 – Some premature test of a crowd version of Roadroid Advantages/disadvantages: Great in theory, but very difficult and demanding in practice. It requires a large development effort on side areas of the core of having a survey tool for road engineers. Roadroids core is a professional system to deliver IQL3 for assets management, and we do not want to blur that idea to fast. And as long as the issue is road roughness and other relatively static road phenomenas - a daily update by newspaper services using same phones and cars is much better. The Roadroid crowd-app will be – but not before we have a better eye on the situation! When it comes to friction/slip, it is something else. This changes very quickly, thus demanding many probes and high frequency data. This is an area where the automotive industry makes efforts too, and automatically can survey while driving/braking.

3 How can the data be used? As an overview on what type of decision that can be made, you need to divide them into:
1) who collects data (how often), and
2) area of application: Maintenance and Traffic information/Control:
Probes Frequency Maintenance Benefits TI/TC Benefits
Transport Administration's project managers
1-3 per quarter
Frost thaw, Weight Restrictions. "Tactical" control.
Comfort
Consultants third party controls (not covered in the study)
1-3 per quarter
Objective dialogue, compare different districts/contracts
Comfort
Contractors road guards and sling runs
2-8 per month
Operative control. Frost signs, Actions. Gravel roads!
Comfort
Post/News paper distributors
5-6 per week
Tactical and operative decision support. Winter roads! Guide IQL1 surveys.
Winter road condition, slippery roads, slush and bump warnings
Motorist road inspectors
All roads once/year
Cam complete IQL1 detailed surveys with coverage
Comfort
Motorist club members (Community)
Daily but variying
Evaluate how crowd can work, more interest in cities/municipalities
Winter road condition, slippery roads, slush, bump warnings
Public crowd sourcing
Daily but variying
Perhaps more interest in cities/municipalities
Winter road condition, slippery roads, slush, bump warnings
Table 1 – A table overview of data collection options The possibility of decisions is dependent on how often the data can be collected, and of who's doing it. The color above indicate what we believe is good (green) – or not (red) For all except the Community/Crowd we can affect the measurement settings o driving. We can also control what phones and partly what cars is used, or at least know what is used. When you no longer can do that the quality of data will drop and thus affect the type of decisions that may be taken. Maintenance has the most decision-making types and they also have more direct benefits attached than traffic information. The report does not go in depth for maintenance benefits, but it is large sums involved in the management the road assets network. By doing maintenance tasks at the right time can save a lot of money. The Swedish Transport Administration use a pavement management system called PMSv3 to handle this kind of data and decisions, and we believe smart phone data will make game change for the possibilities off feeding such systems. With covering up to date data and with data for roads that are low volume trafficked and unpaved.
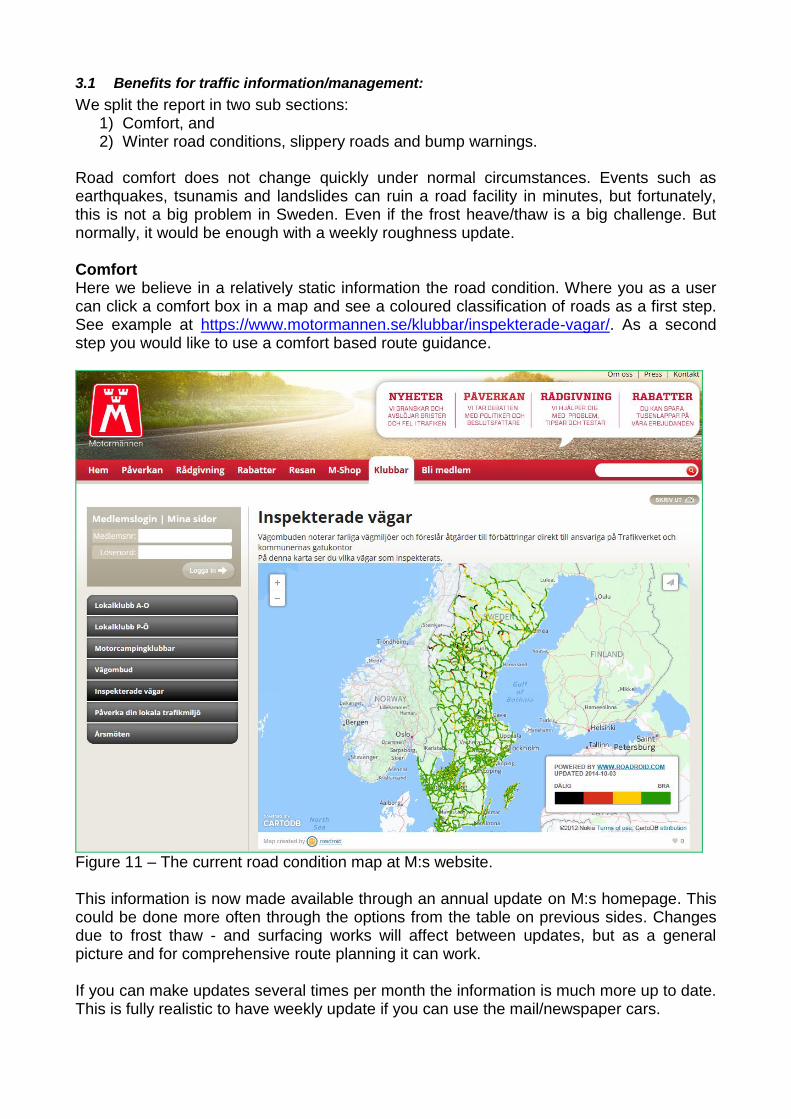
3.1 Benefits for traffic information/management:
We split the report in two sub sections: 1) Comfort, and 2) Winter road conditions, slippery roads and bump warnings.
Road comfort does not change quickly under normal circumstances. Events such as earthquakes, tsunamis and landslides can ruin a road facility in minutes, but fortunately, this is not a big problem in Sweden. Even if the frost heave/thaw is a big challenge. But normally, it would be enough with a weekly roughness update. Comfort Here we believe in a relatively static information the road condition. Where you as a user can click a comfort box in a map and see a coloured classification of roads as a first step. See example at https://www.motormannen.se/klubbar/inspekterade-vagar/. As a second step you would like to use a comfort based route guidance.
Figure 11 – The current road condition map at M:s website. This information is now made available through an annual update on M:s homepage. This could be done more often through the options from the table on previous sides. Changes due to frost thaw - and surfacing works will affect between updates, but as a general picture and for comprehensive route planning it can work. If you can make updates several times per month the information is much more up to date. This is fully realistic to have weekly update if you can use the mail/newspaper cars.

It is also possible to send data to a standardized interface/format as DatexII and further to the services connected to it – as radio warnings about terrible roads, distribute digital "bumps sign" to car navigators and other real-time information tools or all kind of Intelligent Transportation Systems. Winter road condition, slippery roads For this purpose it’s a greater demand on dynamics. It must be up to date information and it must quickly dispatch from the sensor to the road users (as a vehicle-to-vehicle system). If a car indicates slipping it could alert others nearby. But the data can also be used in forecasts, which have a longer lasting valuse. A road user can plan their trip and the maintenance personell can plan their actions. Below an example from Trafikverkets road condition forecast based on weather data:
Figure 12 – Current road condition forecast on Trafikverkets homepage. Imagine using the newspaper service thousands of cars across the entire road network, delivering a daily roughness and winter road condition report! If they partly could measure and to some extent make visual report of conditions during their journey, it would be a very valuable information to local/regional radio traffic announcements and snow/ice removal operations. It would also be an excellent source for an update of the situation on the roads to the dynamic layers in DatexII. They drive the roads between 03.00 to 08.00 in the morning, and would provide a very interesting input before the morning rush hour
To mention, Roadroid will - in addition to analyse vibrations to get the road roughness/IRI - have a feature for friction measurement – where you easily and quickly can break/decelerate and get a measure with a coordinate of the skidding resistance.

3.2 Maintenance
The maintenance operations has more direct benefits than traffic information, but the requirements and benefits differ also in maintenance. The needs within maintenance is here in this report roughly divided on pavement planning and running operations. Pavement planning (and some contradictions of IQL1/Laser practical accuracy) As mentioned, the assets management of a road can be optimized with the right decision. And its huge money to be saved! The right decisions can be taken with access to up-to-date data of good quality. And here we want to address a question of how “exact” today's IQL1 surface laser surveys actually are.
1) Firstly, the data is collecting during the summer (on the northern hemisphere). 2) The data collection is followed by a data processing of all the large amounts of
complex data gathered. 3) Import of data to the assets management system is made in late fall. 4) Then it is winter, and after the winter its spring with frost thaw. 5) After spring comes the summer when you can pave (with input from last year).
In terms of accuracy, how accurate is this now one year old data? Even if there are sophisticated models to predict the outcome, the winter and spring thaw influence the situation allot. Some important factors that are not in the models are:
- Moisture: how much water was in the road construction the body on the autumn
- Temperature: Minimum temperatures and fluctuations around zero, did
thawing/frost occurred many times?
- Winter Road maintenance and traffic loads: Ice removal/grading, plowing, sanding,
salting. Abrasion by studded tires. All depending of how the winter weather was.
- Extreme loads: As from extreme amounts of timber after a winter storm more often
happening. Often the hauling is made during thaw.
All this factors is affecting the whole road construction and coating. So the pavement might not develop as predicted. Add to this that many roads are only surveyed in one lane every second year (or third) year… Possible benefits of Roadroid data in the tactical pavement planning support:
- Make an updated run in your pavement/assets management data system with fresh
IRI values right after the spring thaw, indicate re-assessment of current planning.
- Guide the upcoming detailed laser surveys. Roadroid-data can indicate that some
sections has changed a lot since last year, and that some road sections need to be
checked again already this year (and not next).

Frost thaw monitoring Today, frost damage inspection is mostly done manually and subjective. The input is used both to set eventual load restrictions during the spring thaw, but also for planning pavement/pothole fixing after the spring. The subjective procedure gives problems of making good judgements, the work is time consuming and the only possibility to inform road users is through road side bump warning signs. Smartphone technology is relatively cheap, highly scalable and can also take GPS-tagged photos or video of the roadway. In spring 2013 Roadroid made surveys in a rural newspaper distributor car – driving the same 150 km loop 5-6 times per week. The roughness data collected were divided into 4 levels: -green for good, yellow for OK, red for unsatisfactory and black for poor [7]. The results were compiled monthly/weekly for the frost thaw period (below). There is a certain interest from forest companies both in Sweden and Canada. We look into use the timber hauling trucks as probes, as they reach further out in the forest. These data can also be used directly for planning and follow up actions on the gravel road network. As a coordinate and roughness level is saved every second you can use spatial database queries to automatically tell the 4 classes mentioned for a given period. This logic is designed for a continuous data collection and automated change reports over time.
4234 30 35
4157 57 58
45 41
0%
10%
20%
30%
40%
50%
60%
70%
80%
90%
100%
W9 W10 W11 W12 W13 W14 W15 W16 W17 W18
Dålig
Ej OK
OK
Bra
Figure 13 – Ramsjö - Bäckan (gravel)
83 84 84 84 7174 70 73
86 91
13 11 11 10 1216
19 18
106
3 4 3 4 4 7 7 53 31 2 2 3 2 3 4 3 2 1
0%
10%
20%
30%
40%
50%
60%
70%
80%
90%
100%
W9 W10 W11 W12 W13 W14 W15 W16 W17 W18
Dålig
Ej OK
OK
Bra
Figure – Letsbo-Bäckan (asphalt)
The examples above shows roughness changes over time for a two road types. The frost thaw effect is seen with an increasing amount of "bad" points during some weeks. Below also examples of how the phone's camera can be used to capture a snapshot of the roadway. This information can be used both to road users and maintenance planning..
Figure 14 – GPS Photo from gravel road.
Figure 15 - Polygon tool survey, % of 4 classes
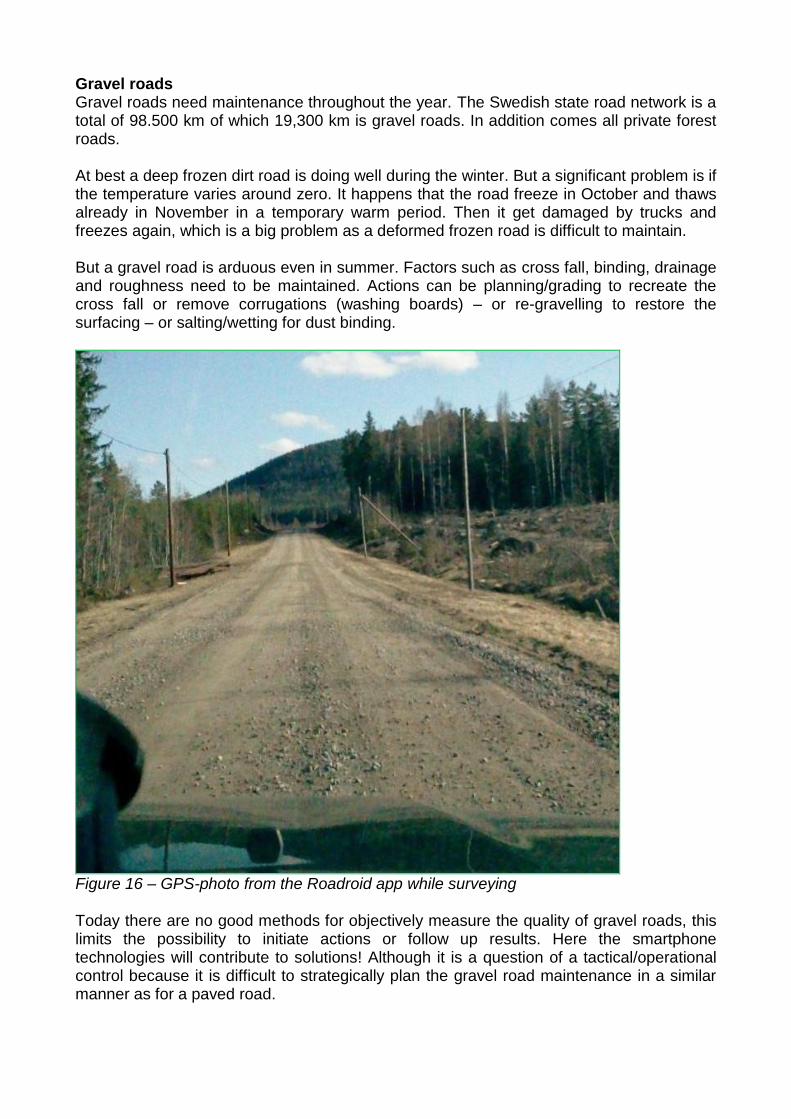
Gravel roads Gravel roads need maintenance throughout the year. The Swedish state road network is a total of 98.500 km of which 19,300 km is gravel roads. In addition comes all private forest roads. At best a deep frozen dirt road is doing well during the winter. But a significant problem is if the temperature varies around zero. It happens that the road freeze in October and thaws already in November in a temporary warm period. Then it get damaged by trucks and freezes again, which is a big problem as a deformed frozen road is difficult to maintain. But a gravel road is arduous even in summer. Factors such as cross fall, binding, drainage and roughness need to be maintained. Actions can be planning/grading to recreate the cross fall or remove corrugations (washing boards) – or re-gravelling to restore the surfacing – or salting/wetting for dust binding.
Figure 16 – GPS-photo from the Roadroid app while surveying Today there are no good methods for objectively measure the quality of gravel roads, this limits the possibility to initiate actions or follow up results. Here the smartphone technologies will contribute to solutions! Although it is a question of a tactical/operational control because it is difficult to strategically plan the gravel road maintenance in a similar manner as for a paved road.

Winter roads The surface of a winter road is changed very dynamically, sometimes in a matter of seconds. Winter roads are managed with measures such as snow removal, de-icing, grading, sanding and salting. Based on the weather reports and forecasts, one can prepare for what is to come.
Figure 17 - Photo taken by Roadroid while surveying An objective input would be appreciated when a need of ice grading emerges. Such an effort is preceded by certain agony. Road users begin to call and complain, and the contractor need to check if there is a need for an action (with subjective assessments). The operation is expensive, so it is not want to be done without a clear need. It is also a matter of follow ups, as if a grading is not properly done the result will suffer. So a benefit is both to tell if an action is needed – and to check the quality on the completed work. Roadroid I also about to introduce a feature to make a friction measurement where the driver makes a sharp break and a coordinate set friction value is automatically sent to a parent system, useful for both sanding/salting and road users.

Contract counting and take overs, and an objective dialogue client-contractor It is not uncommon with different opinion between the client and a contractor. One solution attempt it the third party controls by consultants. He is supposed to be impartial - but is often still at mercy of a subjective assessment. With smart phone data you can more objectively demonstrate how the situation is. It is also possible that more objectively compare how situation is between different maintenance contracts. Some roads may be more demanding than others, the spring thaw may be extra tough a certain year and you can achieve a better dialogue if the parties do not have to make only subjective points. Other areas with an interest from contractors is at a review before a tender — and in connection with take-over audits. – What is the road state the contractor should take responsibility for? And in what condition does he return it? Again, with more objective data – the process becomes simpler, clearer, less costly and possible to implement with a higher quality. Performance Based Contracts A global contemporary trend is "Performance Based Maintenance and Contracts. The idea is to move the focus from a "precise" specification on what should be done in a maintenance contract towards what the result is: moving from: Input->Output->Outcome. This means a development from detailed orders, through payment for work performed towards payment for what the outcome is. The idea is to stimulate innovations and the development of new and sustainable solutions over time. In this work it is important to have Key Performance Indexes (KPI:s) to evaluate the result of a specific design or maintenance. In addition to detailed yearly road surveys (IQL1/laser), most of the weekly/monthly follow ups are done visually using pen and paper. These inspections conclude a number of parameters along the roadway, plan actions and follow up of results. In the development of PBC:s Roadroid can play an important role, giving new possible KPI:s by allowing a continuous roughness data collection – and to view changes over time.
Figure 18 – An example of an semi-automated roughness change report.

To meet these needs, both collection and processing of data need to be as automated as possible:
- Results must be presented with current situation and development trend is visible.
- Reports can´t show too much details. You need a quickly get a comprehensive view
of change - like a road condition dashboard.
If a road damage can be fixed quickly the cost for fixing decrease. The risk when a road damage is not addressed quickly is that the area around the damage breaks down and also that there may be traffic accidents. In Sweden Roadroid runs a pilot with Trafikverket and Skanska on a PBC at the E22. In this project, it will be a weekly roughness data collection and the reporting will be developed with monthly automated reports.
4 References [1] Michael W. Sayers, Thomas D. Gillespie, and Cesar A. V. Queiroz, “The International Road Roughness Experiment: Establishing Correlation and a Calibration Standard for measurements,” World Bank Technical paper number 45, Washington DC, 1986. [2] K.E.Tarr, “Evaluation of Response Type Application for Measuring Road Roughness”, University of Pretoria, South Africa, 2013 [3] Myles Johnston. “Using cell-phones to monitor road roughness”, University of Auckland, Auckland, New Zealand, 2013 [4] Tasnimul Islam. “Using cell-phones to monitor road roughness” , University of Auckland, Auckland, New Zealand, 2013 [5] C. Bennet. 2013_wb_trends_road_asset_management, The world bank [6] M R Schlotjes, A Visser, C Bennet. Evaluation of a smart phone roughness meter, University of Pretoria [7] Forslöf, Jones. 2014 “Continuous Road Condition Monitoring with Smartphones”, Roadroid AB.