automaker rankings 2014 automaker rankings iii figures, tables, and boxes acknowledgments executive...
TRANSCRIPT

Automaker Rankings 2014The Environmental Performance of Car Companies


Automaker Rankings 2014The Environmental Performance of Car Companies
Dave Cooke
May 2014

ii union of concerned scientists
© 2014 Union of Concerned ScientistsAll rights reserved
Dave Cooke is an analyst in the Union of Concerned Scientists Clean Vehicles Program, specializing in both light- and heavy-duty vehicle fuel economy. He conducts research on fuel efficiency technologies and the implications for oil consumption and global warming emissions across the transportation sector.
The Union of Concerned Scientists (UCS) puts rigorous, independent science to work to solve our planet’s most pressing problems. Joining with citizens across the country, we combine technical analysis and effective advocacy to create innovative, practical solutions for a healthy, safe, and sustainable future.
More information about UCS and the Clean Vehicles Program is available on the UCS website: www.ucsusa.org.
This report is available online (in PDF format) at www.ucsusa.org/publications.
Layout: Rob Catalano, Catalano Design
Cover photo: © shutterstock/ Alfredo Maiquez
Printed on recycled paper

iii2014 Automaker Rankings
Figures, Tables, and Boxes
Acknowledgments
executive summary
Chapter 1
Introduction
How We Developed the Automaker Rankings
Chapter 2
Results
Ranking the Top Eight Automakers
Historical Trends
Analyzing Automakers by Vehicle Class
Technology Trends to Watch
Chapter 3
Conclusions
Future Prospects for Each Automaker
Key Takeaways for the Industry
References
Appendix A: Methodology for Automaker Rankings 2014
Appendix B: Adjustments to Fuel Economy Labels for MY2013
[ contents ]
iv
vi
1
5
6
8
8
10
11
12
17
17
18
19
21
27

iv union of concerned scientists
figuresFigure ES-1. Average Emissions from Light-Duty Vehicles Sold by the Top Eight Automakers, 1998–2013
Figure ES-2. Environmental Impact of the Top Eight Automakers Compared with the Industry Average
Figure ES-3. Market Share for Technologies to Reduce Global Warming Emissions, by Manufacturer
Figure 1. Average Test Fuel Economy for the U.S. Fleet of Passenger Vehicles, Compared with Federal Standards for Cars and Trucks
Figure 2. Scores on Global Warming and Smog-forming Emissions—and Overall Environmental Performance—for the Fleets of the Eight Best-Selling Automakers
Figure 3. Average Emissions from Light-Duty Vehicles Sold by the Top Eight Automakers, 1998–2013
Figure 4. Market Share of Turbocharged Gasoline Engines, by Automaker
Figure 5. Market Share of Diesel Vehicles, by Automaker
Figure 6. Market Share of Hybrid-Electric Vehicles, by Automaker
Figure 7. Emissions Scores for Plug-in Electric Vehicles Compared with Other Cars
Figure 8. Market Share of Plug-in Electric Vehicles, by Automaker
Figure B-1. Sensitivity Analyses of the Hyundai-Kia Scores
tablesTable ES-1. Global Warming and Smog-forming Emissions and Scores for Vehicles Sold in MY2013
Table 1. Global Warming and Smog-forming Emissions and Scores for Vehicles Sold in MY2013
Table 2. Improvement in Average Global Warming Emissions since the Last Automaker Rankings
Table 3. Improvement in Average Global Warming Emissions since 1998, and over the Past Decade
Table 4. Environmental Performance in Each Vehicle Class, by Automaker
[ figures, tables, and boxes ]
1
3
3
5
9
10
13
13
14
15
16
28
4
8
9
10
11

v2014 Automaker Rankings
Table A-1. Regional and National Sources of Electricity for Electric Vehicles
Table A-2. Prevalence of Various Configurations of the Nissan Frontier, MY2008
Table A-3. Automakers’ Scores for the MY2008 Fleet from Automaker Rankings 2010
Table A-4. Difference in Automakers’ Scores from Automaker Rankings 2010, Based on Our 2014 Methodology
boxesBox 1. Ensuring Consumer Access to the Best Information on Fuel Economy
Box 2. Plug-in Electric Vehicles
22
23
25
26
7
15

vi union of concerned scientists
This work was made possible by support from The Energy Foundation, Foundation M, The Bernard F. and Alva B. Gimbel Foundation, The William and Flora Hewlett Foundation, NoraLee and Jon Sedmak, and UCS members.
The author would like to thank Don Anair and Michelle Robinson for their always insightful comments, and for the perceptive feedback provided by Rachel Cohen, Meghan Higgins, Eric Bontrager, and Lucy Litvak. Many thanks also go to Sandra Hackman for editing, Rob Catalano for layout and design, and Bryan Wadsworth for production oversight.
We would like to thank all our peer reviewers, in particular Tom Cackette and Luke Tonachel, for their input on this report. Although the reviewers provided many constructive comments and suggestions, they were not asked to endorse our conclusions.
The opinions expressed herein do not necessarily reflect those of the organizations that funded the work or the individuals who reviewed it. The Union of Concerned Scientists bears sole responsibility for the report’s content.
[ acknowledgments ]


viii union of concerned scientists

12014 Automaker Rankings
We compare each manufacturer to an industry average for all U.S. vehicles sold that year. The best overall scores go to companies that show strong performance across their entire product lines. We also examine each automaker’s performance in segments of the light-duty vehicle market, and suggest where each could focus its efforts to improve its ranking.
Our Automaker Rankings 2014 measures the environmental performance of 2013 model year (MY2013) light-duty vehicles sold in the United States by the top eight automakers. This analysis—the sixth since 2000—ranks these automakers based on both smog-forming and global warming emissions.
[ executive summary ]
© shutterstock/gashgeron
Key Findings
The industry turns a corner on global warming emissions. For the first time, all eight best-selling automakers have reduced their average global warming emissions compared with their 1998 fleet average. In the 2000s, fuel economy
Automakers have reduced average global warming and smog-forming emissions from their vehicles by more than 15 and 61 percent, re-spectively, since our first Automaker Rankings. (Smog data for 1998 are not shown because they were based on 50,000-mile testing, rather than the lifetime testing now used. Dotted lines for Hyundai-Kia and Volkswagen indicate that we did not include them in our analysis from MY1998 to MY2005.)SOURCES: UCS 2010, 2007, 2004, 2002, AND 2000.
FIGURE ES-1. Average Emissions from Light-Duty Vehicles Sold by the Top Eight Automakers, 1998–2013
650
500
3501998 2003 2008 2013
1.6
Chrysler
GM
Ford
Volkswagen
Nissan
Toyota
Honda
Hyundai-Kia
1.0
0.41998 2003 2008 2013
Global Warming Emissions (g/mile) Smog-forming Emissions (g/mile)

Introducing a hybrid version of one of its top-selling vehicles, the Sonata (shown), was one of the many reasons why Hyundai-Kia was crowned the Greenest Automaker.
Hyundai-Kia unseats Honda as the Greenest Automaker. Hyundai-Kia has made a concerted effort to improve the fuel efficiency of its fleet—and therefore reduce its global warming emissions—by turbocharging and downsizing engines utilized in a number of models. The company has also reduced its global warming emissions by introducing hybrid-electric versions of two of its top-selling vehicles, the Hyundai Sonata and Kia Optima. Honda continues to lead the way in many classes of vehicles, but it now lags the industry average in its midsize fleet—which includes its best-selling Accord, and accounts for a quarter of the company’s sales. As Hyundai-Kia works to further improve fuel economy and electrify its fleet, Honda will need to step up its innovation if it wants to take back the crown.
Some American automakers are making greater strides than others. While Ford is reducing global warming emissions of its vehicles by turbocharging and downsizing its engines, and producing hybrid-electric models in its light-duty fleet, General Motors and Chrysler continue to find themselves at the back of the pack. Chrysler—which improved the least among the top eight automakers over the past decade—once again earns the “dirtiest tailpipe” distinction. General Motors, too, lags the rest of the industry, on average.
2 union of concerned scientists
worsened amid an era of cheap gas, the growing popularity of truck-based sport utility vehicles, stagnating fuel economy standards, and a lack of investment by automakers in improving the fuel economy of their vehicles. However, rising gas prices and stronger federal standards requiring companies to nearly double the fuel economy of the average light-duty vehicle by 2025 1 have spurred every automaker to improve the fuel economy and reduce the global warming emissions of its fleet.
Global warming and smog-forming emissions standards are working. The phase-in of more stringent standards has spurred an 87 percent drop in smog-forming tailpipe emissions from the U.S. fleet since 1998—with more reductions to come because of even tighter caps on those emissions known as Tier 3. As fuel economy and greenhouse gas standards have begun to take hold and manufacturers and consumers alike are making more fuel-conscious choices, global warming emissions from the average vehicle have also dropped by nearly 20 percent. However, on both the smog-forming and global warming emissions fronts, we have a long way to go to ensure clean air and a safe climate—and the recently finalized Tier 3 emissions standards and global warming emissions standards are essential to keeping us on that path.
1 The Energy Independence and Security Act of 2007 mandates a corporate average fuel economy (CAFE) standard of 35 mpg by 2020. The Environmental Protec-tion Agency’s light-duty vehicle greenhouse gas emissions standards—plus the CAFE standards for model years 2012–2016 and 2017–2025—will yield an average fleetwide CAFE of 48 mpg to 49 mpg by 2025, or 38 mpg to 40 mpg under real-world conditions (EPA and NHTSA 2010, 2012).
Courtesy of IFC
AR (W
ikimedia C
omm
ons)

32014 Automaker Rankings
However, the company is improving its standing by producing efficient small cars, and a continued focus on downsizing its engines and hybridizing its fleet could enable GM to at least keep pace with the industry.
The future promises to bring further improvement. As more stringent emissions standards continue to take effect, we expect even further drops in both global warming and smog-forming emissions from the U.S. fleet. Nissan, Toyota, and Volkswagen, for example, perform well ahead of the industry average, but they are doing so with different technologies (Figure ES-3). Diverse strategies to improve fuel economy and global warming emissions—from improvements in conventional engines to plug-in electric and hybrid- electric vehicles—attest to opportunities for automakers to do much more.
All automakers will need to continue to invest in technologies that reduce fuel consumption to meet new fuel economy and greenhouse gas standards. While a variety of technologies are making their way into the marketplace, automakers are using many of them in just a fraction of the vehicles they sell (Figure ES-3). Expanding the use of these technologies will be helpful in achieving the global warming emissions reductions envisioned by the standards in 2025. More electrification of the U.S. fleet will also further curb smog-forming emissions from light-duty vehicles.
FIGURE ES-2. Environmental Impact of the Top Eight Automakers Compared with the Industry Average
Industry Average
Hyundai-Kia 86.4
Honda 90.2
Toyota 92.2
Nissan 92.6
Volkswagen 92.6
Ford 104.5
GM 109.9
Chrysler 114.9
Each automaker’s score reflects the overall performance of its fleet of new vehicles on both global warming and smog-forming emissions. Industry average = 100. Lower scores indicate less pollution.
FIGURE ES-3. Market Share for Technologies to Reduce Global Warming Emissions, by Manufacturer
Chrysler GMFord
VolkswagenNissan Toyota
Honda Other Manufacturers
Hyundai-Kia
% of A
ll New
Vehicles Sold
Plug-in Hybrid and Battery-Electric Vehicles 0.6%
0.9%Diesel Engines
3.5%Hybrid-Electric Vehicles
13.5%Turbocharged Gasoline
Engines
Automakers are employing a number of different technologies to reduce global warming emissions from their vehicles. Percentages indicate the fraction of MY2013 vehicles sold with the given technology. The gray segments represent models sold by smaller automakers, which we do not rank in this report.

4 union of concerned scientists
Consumers must have the most accurate information on fuel economy under real-world conditions. Although the Environmental Protection Agency (EPA) has developed new procedures for testing fuel economy that better reflect real-world driving conditions, the maxim “your mileage may vary” still holds true. The agency also recently overhauled vehicles’ fuel economy label, to give consumers a more accurate picture of their fuel economy as well as their fuel costs and global warming and smog-forming emissions. However, the EPA has required some manufacturers to
adjust these labels because they misrepresented vehicle performance: Hyundai-Kia had to change overstated fuel-economy values for nearly half its 2013 fleet. Such incidents undermine public trust just as the nation is beginning to make tremendous strides in reducing the environmental footprint of the light-duty fleet. The EPA must continue to hold manufacturers accountable to ensure that labels reflect vehicles’ true environmental performance, helping consumers to choose the best vehicle for their needs and the environment.
Rank Automaker2
Average Emissions (grams per mile) Emissions Scores
Global Warming (CO2-equivalent)
Smog-forming(NOX + NMOG)
Global Warming Smog-forming Combined
1 Hyundai-Kia 395 0.461 85.7 87.1 86.4
2 Honda 414 0.480 89.7 90.8 90.2
3 Toyota 427 0.485 92.7 91.7 92.2
3 Nissan 417 0.501 90.4 94.7 92.6
3 Volkswagen 431 0.486 93.6 91.7 92.6
Industry Average 461 0.529 100.0 100.0 100.0
6 Ford 483 0.552 104.7 104.3 104.5
7 GM 506 0.582 109.8 110.0 109.9
8 Chrysler 537 0.600 116.4 113.5 114.9
Average global warming and smog-forming emissions and environmental performance scores for the eight best-selling automakers show that Hyundai-Kia has the best overall performance for its average vehicle while the Detroit Three perform worse than the industry average. Emis-sions include those from producing, refining, and distributing fuel used by the fleet in addition to those emitted from the tailpipe. Figures are based on vehicle sales from October 2012 to September 2013. NOX = NITROGEN OXIDES. NMOG = NON-METHANE ORGANIC GASES.
TABLE ES-1. Global Warming and Smog-forming Emissions and Scores for Vehicles Sold in MY2013
2 Each automaker sells vehicles under a variety of different brands: Hyundai-Kia = Hyundai, Kia; Honda = Acura, Honda; Toyota = Lexus, Scion, Toyota; Nissan = Infiniti, Nissan; Volkswagen = Audi, Bentley, Bugatti, Lamborghini, Porsche, Volkswagen; Ford = Ford, Lincoln; General Motors (GM) = Buick, Cadillac, Chevrolet, GMC; and Chrysler = Chrysler, Dodge, Ferrari, Fiat, Jeep, Maserati, Ram.

52014 Automaker Rankings
The automobile is an icon of American culture, a symbol of freedom and independence used to travel from sea to shining sea on the interstates that crisscross this country. As the primary mode of travel for the vast majority of Americans, automobiles embody the transportation choices we make both as individuals and as a country, and the environmental impact of those decisions.
To satisfy our travel demands, the nearly 250 million light-duty vehicles—including cars and light trucks—on our roads today account for more than 40 percent of our nation’s petroleum consumption, and 20 percent of our global warming emissions (ORNL 2013). The effects of climate change are already evident, as communities confront rising seas, heavier precipitation events, and more frequent and severe heat waves, droughts, and wildfires.
Light-duty vehicles also account for nearly 20 percent of U.S. smog-forming emissions: nitrogen oxides (NOx) and volatile organic compounds (VOC). Despite progress in reducing these emissions, more than one-third of the U.S. population lives in areas that exceed federal guidelines for ozone pollution—a major component of smog. Numerous scientific studies have linked exposure to smog to asthma attacks, heart attacks, strokes, and premature death.
For nearly two decades, the fuel economy of vehicles stagnated while the federal government failed to tighten standards and automakers added more and more power to the vehicles we buy, increasing the amount of gas we used to fuel our travel needs (Figure 1).
The good news is that consumers and automakers alike are beginning to shift their behavior. High gasoline prices and concern about global warming have spurred consumers
to find more fuel-efficient modes of transportation. Vehicle weight has stabilized over the past decade, as manufacturers have begun to use advanced steels and aluminum while sustaining performance levels and vehicle safety. Cleaner fuels such as biofuels and electricity are also giving consumers options beyond petroleum for powering their vehicles.
Action by the federal government to clean up America’s automotive future after years of standing still has also
Introduction
FIGURE 1. Average Test Fuel Economy for the U.S. Fleet of Passenger Vehicles, Compared with Federal Standards for Cars and Trucks
10
15
20
25
30
35
1975 1980 1985 1990 1995 2000 2005 2010 2015
CA
FE m
pg
CAFE (car)
CAFE (truck)CAFE (fleet)
Stagnant fuel economy standards, low gasoline prices, the popular-ity of truck-based sport utility vehicles, and a lack of investment by automakers in fuel-efficient technologies led to a nearly two-decade decline in the fuel economy of passenger vehicles.CAFE = corporate average fuel economy.
SOURCE: EPA 2013A.
[ chapter 1 ]

6 union of concerned scientists
affected automotive choices and trends. New fuel economy standards are putting the country on a path to improving the fuel efficiency of the average automobile nearly 50 per-cent by 2025—promising to significantly reduce both oil consumption and global warming emissions. Besides fuel economy standards promulgated by the National Highway Traffic Safety Administration (NHTSA), the Environmental Protection Agency (EPA) is also now regulating global warming emissions directly for the first time.
Meanwhile tighter standards for tailpipe emissions have already led to a significant drop in smog-forming pollution, and Tier 3 standards adopted in March 2014 will curb those
emissions even more. And federal and state research funding and incentives are helping to bring electric vehicles and advanced biofuels to market, shifting our fleet away from fossil fuels.
These regulatory shifts are occurring while oil remains above $100 per barrel, and gasoline prices have more than tripled since our first Automaker Rankings in 2000. All these factors are improving the efficiency of the U.S. fleet and shaping the next generation of vehicles.
How We Developed the Automaker Rankings
To help both drivers and automakers understand the environmental performance of light-duty vehicles—and to identify industry leaders and laggards—the Union of Concerned Scientists (UCS) has published Automaker Rankings every few years since 2000. This report, the sixth in that series, uses the most recent information on both global warming and smog-forming emissions to rank the top eight automakers on their environmental performance. These eight automakers account for nearly 90 percent of all light-duty vehicles sold in the United States—as well as about 90 per-cent of all global warming and smog-forming emissions from those vehicles.
To develop our rankings, we averaged the per-mile emissions for each light-duty vehicle sold by each automaker. That means companies that sell a few “green” models cannot win the title of Greenest Automaker. The best overall scores go to those that show strong environmental performance across their product lines.
To determine global warming emissions, we consider the fuel economy, fuel type, and sales volume of each type of vehicle sold by each automaker in the 2013 model year (MY2013). We consider the upstream global warming emissions from producing and distributing the fuel used by each vehicle, as well as emissions from the vehicles themselves. Together those sources account for 80 percent to 90 percent of the global warming pollution a conventional vehicle produces across its entire life cycle (Hawkins, Gausen, and Strømmen 2012).
We then calculate the sales-weighted average global warming emissions for each automaker—as well as for all
eight automakers together. We assign the industry average a score of 100, and then give each automaker a score indexed to the industry average. A score of 80 for an automaker indicates that its average light-duty vehicle has global warming emissions equal to 80 percent of the industry average—that is, better than average. A score of more than 100 indicates a worse-than-average performance.
To calculate smog-forming emissions for each vehicle, we similarly consider tailpipe emissions of NOx and non-methane organic gases (NMOG, a measure of VOC), as well as those emissions during the production and distribution of the fuel used by the vehicle. We again weight that sum by the number of each type of vehicle sold by each automaker. And we again assign a score of 100 to the industry average, and index each automaker’s results to that average.
Finally, we create an average score for each manufacturer that considers both the global warming and smog-forming emissions from its vehicles. This analysis reveals which automakers offer the cleanest vehicles fleetwide—and it allows us to compare each automaker with its peers. Our analysis shows, of course, that not every manufacturer is making the same effort to reduce the environmental impact of its fleet.
We further investigate which technologies each automaker is using to reduce its environmental impact, and suggest where it might improve. Finally, we draw key lessons for the industry as a whole. (See Box 1 for an account of improvements in fuel economy labels and Appendix A for more information on our methodology.)
Action by the federal government to clean up America’s automotive future after years of standing still has affected automotive choices and trends.

72014 Automaker Rankings
In 2006, the EPA finalized new procedures for testing vehicle fuel economy that better reflect how we drive today, rather than in the 1970s—the previous reference point. While the maxim “your mileage may vary” still holds true, these new tests consider the impact of air conditioning, higher highway speeds, and a “cold start” to reflect the behavior of the vehicle as it warms up. We base our analysis of on-road fuel economy on this new approach.
In 2011, the EPA and NHTSA also revamped the fuel economy label that accompanies every new car or truck sold at a dealership. The label now provides a more accurate picture of fuel economy based on the new tests, as well as information on fuel costs, global warming emissions, and smog-forming emissions.
While manufacturers are responsible for testing their vehicles and providing the resulting information to consumers, the EPA conducts its own tests to verify the accuracy of this information. As a direct result of this verification procedure, the EPA required Ford to adjust information on the label for its 2013 C-MAX and required Hyundai-Kia to adjust the labels for nearly half of its MY2013 vehicles. Although we based our
BOX 1.
Ensuring Consumer Access to the Best Information on Fuel Economy
analysis on the new label values approved by the EPA, we also used a “sensitivity analysis” to ensure an accurate assessment of each automaker’s environmental performance because Hyundai-Kia is still under investigation. (See Appendix B for more information.)
The need for these label adjustments highlights a key concern. Consumers are likely to spend nearly as much money fueling a gasoline-powered vehicle during its lifetime as on the vehicle itself, making information on fuel economy very important (UCS 2013a). Consumers also rely on accurate information on fuel economy to decide which vehicle to buy. Incidents such as those involving Ford and Hyundai-Kia can undermine the public’s trust in this information just as the industry is beginning to make tremendous strides in reducing the environmental footprint of its vehicles.
While our independent analysis can serve as a guide for consumers as to which automakers are making the biggest improvements, on average, the EPA needs to continue to eval-uate information from them to ensure that labels on vehicles reflect their true environmental performance.
The new Fuel Economy and Environment label allows for a more informed purchasing decision by highlighting economic and environmental criteria such as expected annual fuel costs and ratings for a vehicle’s global warming and smog-forming emissions relative to all new vehicles.
© EPA

3 Each automaker sells vehicles under a variety of different brands: Hyundai-Kia = Hyundai, Kia; Honda = Acura, Honda; Toyota = Lexus, Scion, Toyota; Nissan = Infiniti, Nissan; Volkswagen = Audi, Bentley, Bugatti, Lamborghini, Porsche, Volkswagen; Ford = Ford, Lincoln; General Motors (GM) = Buick, Cadillac, Chevrolet, GMC; and Chrysler = Chrysler, Dodge, Ferrari, Fiat, Jeep, Maserati, Ram.
8 union of concerned scientists
Results
Hyundai-Kia has the best overall performance among the top eight automakers, while the Detroit Three perform worse than the industry av-erage. Emissions include those from producing, refining, and distributing fuel used by each automaker’s fleet in addition to those emitted from the tailpipe. Figures are based on vehicle sales from October 2012 to September 2013.NOX = NITROGEN OXIDES. NMOG = NON-METHANE ORGANIC GASES.
TABLE 1. Global Warming and Smog-forming Emissions and Scores for Vehicles Sold in MY2013
Ranking the Top Eight Automakers
For the first time in the history of our rankings, a manufacturer other than Honda has produced the fleet with the best average environmental performance. Hyundai-Kia achieved the top scores in both global warming and
smog-forming emissions, pushing it to the title of Greenest Automaker. Its fleet per-mile average is nearly 15 percent lower for global warming emissions—and 13 percent lower for smog-forming emissions—than the national average. Hyundai-Kia’s total emissions are also nearly 14 percent lower than in MY2008. That gain represents a drop of nearly
[ chapter 2 ]
Rank Automaker3
Average Emissions (grams per mile) Emissions Scores
Global Warming (CO2-equivalent)
Smog-forming (NOX + NMOG)
Global Warming Smog-forming Combined
1 Hyundai-Kia 395 0.461 85.7 87.1 86.4
2 Honda 414 0.480 89.7 90.8 90.2
3 Toyota 427 0.485 92.7 91.7 92.2
3 Nissan 417 0.501 90.4 94.7 92.6
3 Volkswagen 431 0.486 93.6 91.7 92.6
Industry Average 461 0.529 100.0 100.0 100.0
6 Ford 483 0.552 104.7 104.3 104.5
7 GM 506 0.582 109.8 110.0 109.9
8 Chrysler 537 0.600 116.4 113.5 114.9

92014 Automaker Rankings
3 percent annually, and exceeds the average among the eight automakers of 12 percent (Table 2).
Honda now finds itself in second place among these automakers, with average global warming emissions per mile 11 percent lower than the national average, and smog-forming emissions 9 percent lower. This represents a 10 percent improvement from MY2008. Although that progress is significant, it is less than the average gain among the eight automakers.
While Hyundai-Kia and Honda provide a clearly distinguished one-two punch, Toyota, Nissan, and Volkswagen scored close enough together to attain a three-way tie for third place. Toyota leverages its strong average overall emissions from MY2008 to again beat the industry average in MY2013. Nissan had weaker performance in MY2008 but has made tremendous strides since: its fleet improved the most among these automakers in global warming emissions. However, the company fell behind other leading companies in reducing smog-forming emissions. Volkswagen showed strong improvement in both global warming and smog-
forming emissions, exceeding the average improvement, and effectively matching the average emissions from Toyota’s fleet.
While those five automakers do better than the national average, the Detroit Three remain at the back of the pack—as in all our Automaker Rankings. However, Ford is beginning to distance itself from its truck-heavy domestic counterparts, posting the largest percentage drop in smog-forming emissions since MY2008 and above-average reductions in global warming emissions. General Motors and Chrysler
TABLE 2. Improvement in Average Global Warming Emissions since the Last Automaker Rankings
Automaker
Reduction in Global Warming Emissions 2008–2013
Hyundai-Kia 13.9%
Honda 9.5%
Toyota 9.9%
Nissan 16.4%
Volkswagen 13.7%
Ford 13.8%
GM 9.0%
Chrysler 5.8%
Fleet Average 11.7%
Nissan’s strong improvement over the past five years led the in-dustry, which reduced global warming emissions from the average vehicle by nearly 12 percent. Chrysler improved by less than half as much, significantly lagging all other manufacturers.
FIGURE 2. Scores on Global Warming and Smog-forming Emissions—and Overall Environmental Performance—for the Fleets of the Eight Best-Selling Automakers
Hyundai-Kia
Honda
Toyota
Nissan
Volkswagen
Ford
GM
Chrysler
Global Warming Emissions Scores
Industry Average
80 100 120
Smog Emissions Scores
Industry Average
80 100 120
Overall Scores
Industry Average
80 100 120
Scores indicate each automaker’s performance compared with the national fleet average (100). Overall scores reflect each automaker’s perfor-mance in both global warming and smog-forming emissions.
Hyundai-Kia achieved the top scores in both global warming and smog-forming emissions, pushing it to the title of Greenest Automaker.

10 union of concerned scientists
Chrysler—which has the most room for improvement—continues to lag the industry, posting the smallest improvement in average global warming emissions over the past decade. The company will need to make a concerted effort to meet standards set by the EPA and NHTSA for light-duty vehicles, which will ratchet down through 2025.
While automakers have all made improvements in global warming emissions, standards for smog-forming emissions
both continue to lag the rest of the industry, with Chrysler again earning the “dirtiest tailpipe” distinction. Chrysler’s fleet posted just a 5 percent drop in global warming emissions since MY2008—less than half the national average improvement, and far behind all other automakers.
Historical Trends
For the first time since our first report, all eight automakers have reduced the average global warming emissions of their fleet, compared with their 1998 averages (Figure 3). In the early 2000s, fuel economy worsened amid an era of cheap gas, growing popularity of truck-based sport utility vehicles (SUVs), and a lack of automaker investment in better technology. However, rising gas prices and standards in place to nearly double the fuel economy of the nation’s light-duty vehicles by 2025 have spurred every automaker to boost the average fuel economy of its vehicles.
Ford, Nissan, and Hyundai-Kia have shown especially strong improvement over the past decade (2003–2013), reducing the average global warming emissions of their vehicles by more than 20 percent (Table 3). Chrysler and Honda are on the opposite end of the spectrum, posting improvements well below the industry average over the past 10 and 15 years, respectively.
While Honda has been at the forefront in overall performance, it seems to have rested on its laurels: it posted just a 3 percent improvement in global warming emissions from 1998 to 2013—the smallest drop among the eight.
TABLE 3. Improvement in Average Global Warming Emissions since 1998, and over the Past Decade
Automaker
Reduction in Global Warming Emissions
1998–2013 2003–2013Hyundai-Kia 11.4% 20.3%
Honda 2.9% 11.7%
Toyota 11.6% 14.7%
Nissan 15.3% 22.1%
Volkswagen 7.2% 11.0%
Ford 16.9% 20.6%
GM 6.7% 14.8%
Chrysler 9.6% 9.6%
Fleet Average 15.1% 18.1%
Nissan and Ford have made strong improvements since our first rankings. While the industry has reduced emissions from the average vehicle by more than 15 percent, Honda has reduced its average emis-sions by less than 3 percent.
Automakers have reduced average global warming and smog-forming emissions from their vehicles by more than 15 and 61 percent, re-spectively, since our first Automaker Rankings. (Smog data for 1998 are not shown because they were based on 50,000-mile testing, rather than the lifetime testing now used. Dotted lines for Hyundai-Kia and Volkswagen indicate that we did not include them in our analysis from MY1998 to MY2005.)SOURCES: UCS 2010, 2007, 2004, 2002, AND 2000.
FIGURE 3. Average Emissions from Light-Duty Vehicles Sold by the Top Eight Automakers, 1998–2013
650
500
3501998 2003 2008 2013
1.6
Chrysler
GM
Ford
Volkswagen
Nissan
Toyota
Honda
Hyundai-Kia
1.0
0.41998 2003 2008 2013
Global Warming Emissions (g/mile) Smog-forming Emissions (g/mile)

112014 Automaker Rankings
vehicle classes. However, individual automakers are using very different tactics to move the industry average forward.
Hyundai-Kia’s success in the overall rankings shows how important it is for a manufacturer to be green across its entire fleet. Although this company is not at the top of any single class, it outpaces the industry average in most categories. Hyundai-Kia’s small cars rank below average, but the rest of its fleet—particularly its eight midsize and SUV models, which account for more than 60 percent of vehicle sales—raise this automaker’s overall average.
Honda continues to lead the way in all classes except its midsize vehicles. The midsize class includes its top-selling car, the Honda Accord, so falling behind the industry average in that category drags down the company’s overall performance enough to take it out of first place. Market success for the technically advanced next-generation Accord Hybrid could significantly improve Honda’s standing in that
have led to even larger reductions in these pollutants. Tier 2 regulations, phased in since 2004, have caused a sharp reduction in these emissions across the industry— as well as a drastic narrowing in performance among the eight companies. However, while this progress is notable, much work remains to reduce this harmful pollution. New Tier 3 standards, which will phase in from 2017 to 2025, require automakers to further reduce smog-forming NMOG and NOx tailpipe emissions by 80 percent—a critical step in curbing the health impacts of air pollution across the country.
In the 15 model years since our first ranking, automakers have, on average, reduced global warming emissions and smog-forming emissions by more than 15 and 61 percent, respectively. Compared with today’s industry average, the average MY1998 vehicle would have an overall score today of 176.2. That means automakers have improved the environmental performance of their vehicles by 43 percent since our first rankings.
Analyzing Automakers by Vehicle Class
Examining the performance of automakers by vehicle class provides more insights on which are setting the pace for the industry, and on where each can focus efforts to improve. An automaker may post class-leading performance in the small-car segment, for example, but fail to keep pace in SUVs or pickups (Table 4).4
As they do in curbing fleetwide emissions, international automakers top the rankings in limiting emissions in many
TABLE 4. Environmental Performance in Each Vehicle Class, by Automaker
Small Cars
Midsize Cars
Large Cars
Sports Cars
SUVs Mini-vans
Pickup Trucks
Hyundai-Kia
Honda
Toyota
Nissan
Volkswagen
Ford
GM
Chrysler
Performance in each class shows where automakers are leading or lagging. Black indicates a vehicle class that the manufacturer does not sell.
Best in Class
Class Average
Worst in Class
4 We have made two changes in the vehicle classes for this report. Because so few station wagons are available, we have eliminated that category from this year’s rankings, lumping station wagons with large cars. This change is consistent with the EPA’s use of interior volume as the basis for its vehicle classifications. We have also broken out sports cars, whose average emissions are higher than those of every class except pickups, and tend to skew a manufacturer’s small-car class.
Automakers have improved the environmental performance of their vehicles by 43 percent since our first rankings.
12 union of concerned scientists
bright spot is that its small-car class ranks better than the fleet average, buoyed by growing sales of the Chevy Volt—the leading plug-in hybrid-electric vehicle—and strong sales of the Chevy Sonic, an efficient compact. Continued strong sales of the company’s small cars, and continued electrification of its fleet through vehicles such as the Volt and the Spark EV, should help the automaker keep pace with the industry. However, GM needs to improve the efficiency of its light-duty truck fleet to gain ground on its competitors. GM took an early industry lead by offering hybrid systems in some of its pickups and SUVs (also known as passenger trucks), but it has eliminated these offerings, setting back its leadership in this segment.
Chrysler sits far at the back of the pack, and simply does not appear to be focusing on its environmental footprint. In every category of vehicle—from the smallest cars to the biggest passenger trucks—it lags the industry average. Even if Chrysler doubled the sales of its small cars, its most efficient class of vehicle, its average score would improve by less than one point. That is because those vehicles would still represent a small fraction of its overall sales, and because those vehicles have significantly higher emissions than the industry average in that class.
Technology Trends to Watch
Manufacturers have introduced a number of new technologies into their fleet in response to more stringent fuel economy and global warming emissions standards for light-duty vehicles. Below are key technologies that manufacturers are using to reduce the global warming emissions from their fleets.
TURBOCHARGED, DOWNSIZED ENGINES
While automakers have included turbochargers in their fleets for decades, until recently they used them mainly to boost power to the engine in high-performance packages. However, automakers have recently recognized that because a turbocharged, direct-injection gasoline engine can provide
category—as could improving the fuel efficiency of its more powerful V6 midsize vehicles.
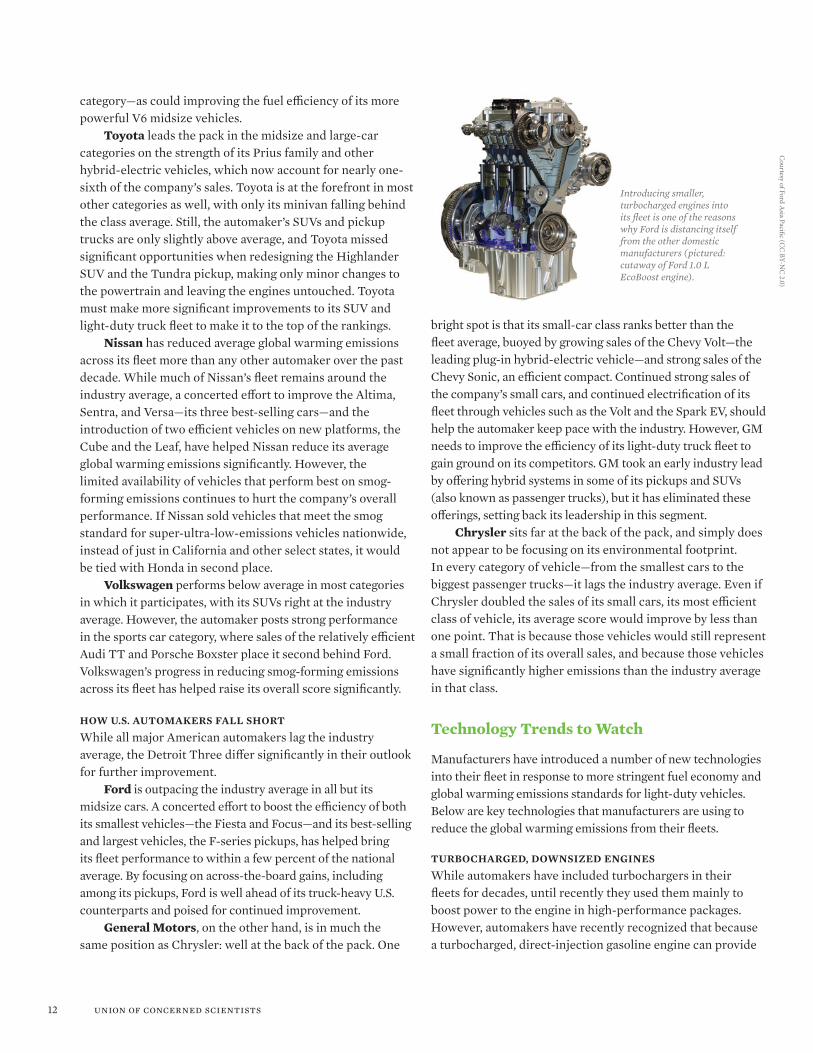
Toyota leads the pack in the midsize and large-car categories on the strength of its Prius family and other hybrid-electric vehicles, which now account for nearly one-sixth of the company’s sales. Toyota is at the forefront in most other categories as well, with only its minivan falling behind the class average. Still, the automaker’s SUVs and pickup trucks are only slightly above average, and Toyota missed significant opportunities when redesigning the Highlander SUV and the Tundra pickup, making only minor changes to the powertrain and leaving the engines untouched. Toyota must make more significant improvements to its SUV and light-duty truck fleet to make it to the top of the rankings.
Nissan has reduced average global warming emissions across its fleet more than any other automaker over the past decade. While much of Nissan’s fleet remains around the industry average, a concerted effort to improve the Altima, Sentra, and Versa—its three best-selling cars—and the introduction of two efficient vehicles on new platforms, the Cube and the Leaf, have helped Nissan reduce its average global warming emissions significantly. However, the limited availability of vehicles that perform best on smog-forming emissions continues to hurt the company’s overall performance. If Nissan sold vehicles that meet the smog standard for super-ultra-low-emissions vehicles nationwide, instead of just in California and other select states, it would be tied with Honda in second place.
Volkswagen performs below average in most categories in which it participates, with its SUVs right at the industry average. However, the automaker posts strong performance in the sports car category, where sales of the relatively efficient Audi TT and Porsche Boxster place it second behind Ford. Volkswagen’s progress in reducing smog-forming emissions across its fleet has helped raise its overall score significantly.
HOW U.S. AUTOMAKERS FALL SHORT
While all major American automakers lag the industry average, the Detroit Three differ significantly in their outlook for further improvement.
Ford is outpacing the industry average in all but its midsize cars. A concerted effort to boost the efficiency of both its smallest vehicles—the Fiesta and Focus—and its best-selling and largest vehicles, the F-series pickups, has helped bring its fleet performance to within a few percent of the national average. By focusing on across-the-board gains, including among its pickups, Ford is well ahead of its truck-heavy U.S. counterparts and poised for continued improvement.
General Motors, on the other hand, is in much the same position as Chrysler: well at the back of the pack. One
Introducing smaller, turbocharged engines into its fleet is one of the reasons why Ford is distancing itself from the other domestic manufacturers (pictured: cutaway of Ford 1.0 L EcoBoost engine).
Courtesy of Ford A
sia Pacific (CC
BY-NC
2.0)

132014 Automaker Rankings
pressure—and thus temperature—causing the fuel to spontaneously ignite. All modern diesel engines use a turbocharger to boost pressure and help provide power at low engine speeds, and to increase power and torque at high speeds.
Diesel fuel is much more energy-dense than gasoline—which means it has more carbon per gallon. And that, in turn, means that when it combusts, it produces more carbon dioxide emissions than an equivalent amount of gasoline. Producing each gallon of diesel also requires more energy upstream than producing gasoline. Upstream emissions significantly reduce the global warming benefit of replacing gasoline engines with diesel engines, despite their better fuel economy. For example, the 2.0-liter turbodiesel Volkswagen Jetta, rated at 36 miles per gallon (mpg), consumes 26 percent less fuel than the 2.0-liter naturally aspirated gasoline Volkswagen Jetta, rated at 26 mpg. However, the per-mile global warming emissions of the former are just 13 percent lower than those of the latter—less than half the improvement one might expect from comparisons in fuel economy.
For many people, diesel engines conjure up images of black clouds of smoke from tailpipes. However, diesel vehicles have come a long way, especially in the past five years as emissions controls have advanced. Many manufactures are using filters to reduce particulate emissions to very low levels. And while not reaching the lowest smog-certification levels achieved by gasoline vehicles, diesels do comply with the same federal and California emissions standards as gasoline vehicles. After Volkswagen nearly eliminated diesels from its fleet in MY2008, the company’s diesel vehicles now account for about one in six vehicles it sells. Volkswagen is proving that diesel technology can help companies reduce global warming and smog-forming emissions—although it might not be the environmental game-changer that the 20 percent boost in fuel economy would suggest.
more power than an equivalent-sized non-turbocharged engine, the volume, or displacement, of the engine can be reduced. Smaller engines lose less energy to friction, which means better fuel economy even after accounting for friction losses from the turbocharger at peak power.
Ford’s turbocharged Ecoboost package on the F-150 is one of the most notable examples of this design. The success of this package—more than half of all F-150s are now produced with turbocharged V6 engines—encouraged the automaker to offer this technology throughout its fleet. Nearly 40 percent of all MY2013 Ford vehicles sold featured a turbocharged engine. With a 1.0-liter Ecoboost set to debut in the Fiesta, and an even smaller V6 planned for the newer, lighter F-150, Ford clearly believes this component is key to meeting future fuel economy targets. The package is a major reason for the company’s success in reducing global warming emissions from its fleet.
Other manufacturers are also making turbocharged gasoline engines a priority, with nearly 14 percent of all new vehicles sold in MY2013 using such an engine. Some of these vehicles have a turbocharger purely to provide high-torque performance. For example, while one-third of Volkswagen’s new vehicles have a turbocharged gasoline engine, most of these engines are sold as part of a “sports” package. However, the recent growth in the use of turbocharged engines shows that companies realize that turbocharged, downsized engines can help them meet more stringent regulations on fuel economy and global warming emissions.
DIESEL VEHICLES
Another longstanding technology that is beginning to see resurgence is diesel engines. Unlike a gasoline engine, a diesel engine has no spark plugs to ignite the fuel. The air- fuel mixture inside the engine instead attains very high
FIGURE 4. Market Share of Turbocharged Gasoline Engines, by Automaker
Ford leads the way in using turbocharged gasoline engines. Nearly 14 percent of new vehicles sold in MY2013 had such engines, which can improve a vehicle’s fuel economy.
Chrysler GMFord
VolkswagenNissan Toyota
Honda
Hyundai-Kia
Plug-in Hybridand Battery-
Electric Vehicles
Other Manufacturers
Chrysler GMFord
VolkswagenNissan Toyota
Honda
Hyundai-Kia
Other Manufacturers
Chrysler GMFord
VolkswagenNissan Toyota
Honda
Hyundai-Kia
Other Manufacturers
Chrysler GMFord
VolkswagenNissan Toyota
Honda
Hyundai-Kia
Other Manufacturers
13.5% of All New Vehicles Sold
0.9% of All New Vehicles Sold
3.5% of All New Vehicles Sold
0.6% of All New Vehicles Sold
Diesel Engines
Turbocharged GasolineEngines
Hybrid-ElectricVehicles
FIGURE 5. Market Share of Diesel Vehicles, by Automaker
Volkswagen is the only one of the eight best-selling automakers that uses diesel vehicles in its passenger fleet. Diesels accounted for less than 1 percent of new passenger vehicles sold in MY2013.
Chrysler GMFord
VolkswagenNissan Toyota
Honda
Hyundai-Kia
Plug-in Hybridand Battery-
Electric Vehicles
Other Manufacturers
Chrysler GMFord
VolkswagenNissan Toyota
Honda
Hyundai-Kia
Other Manufacturers
Chrysler GMFord
VolkswagenNissan Toyota
Honda
Hyundai-Kia
Other Manufacturers
Chrysler GMFord
VolkswagenNissan Toyota
Honda
Hyundai-Kia
Other Manufacturers
13.5% of All New Vehicles Sold
0.9% of All New Vehicles Sold
3.5% of All New Vehicles Sold
0.6% of All New Vehicles Sold
Diesel Engines
Turbocharged GasolineEngines
Hybrid-ElectricVehicles

14 union of concerned scientists
While Toyota leads the way in this arena, other automakers are making more hybrids as well. Ford, in particular, has ramped up production, with nearly 1 in 10 of its new cars featuring a hybrid-electric powertrain. While Hyundai-Kia has not yet reached Ford’s levels of hybrid sales, 1 in 10 of the popular Hyundai Sonata and Kia Optima sedans sold are hybrid versions. The growth in hybrid sales of both companies is a key reason for their vastly improved performance in MY2013 compared with MY2008.
NEW TECHNOLOGIES ON THE HORIZON
Despite the promise of electric vehicles, improvements to gasoline- and diesel-powered cars and trucks are likely to be the predominant path to reducing the environmental impact of vehicles in coming years. Automakers can tap a host of opportunities beyond the technologies noted above to improve conventional powertrains. One option is transmissions with less friction loss and more gears, allowing for more efficient powertrains. Other advances include wider use of variable valve timing and direct injection, to make more power available during combustion, and start-stop technology, to reduce fuel use during idling. Lightweight materials, aerodynamic improvements, and tires with lower rolling resistance can also make vehicles more efficient by reducing the amount of energy required to move the vehicle.
Many technologies developed in labs around the world have yet to find their way into vehicles on the road. However, after years of engineering refinement and on-road tests, hydrogen fuel-cell vehicles are finally due on sale in 2014 in larger volumes from numerous manufacturers. These vehicles have an electric powertrain—but it runs on electricity produced by a fuel cell rather than on power stored in a battery. The fuel cell combines hydrogen stored in a pressurized tank with oxygen in the air to produce electricity, as well as water as a byproduct. A number of manufacturers expect to produce fuel-cell vehicles, though they will be available only in California at first because of the limited hydrogen fueling infrastructure (Pyper 2014).
A technology still further down the road is homogeneous charge compression ignition (HCCI), used for internal combustion engines. HCCI engines essentially combine diesel and conventional gasoline approaches. As with diesel, the air-fuel mixture spontaneously ignites under pressure. However, as with gasoline, this occurs at low temperatures, and the fuel is entirely combusted, reducing both fuel use and emissions. Although a number of automakers and suppliers have invested in HCCI projects, only Mazda has publicly stated its intentions to use the technology, which could be available soon in its SkyActiv2 engines (Sedgwick 2012).
HYBRID-ELECTRIC VEHICLES
Though automakers have not sold hybrid-electric vehicles for as long as diesel vehicles, hybrid-electrics already have a much larger market share. They can also provide greater reductions in emissions than diesels. The most common hybrid designs use an electric motor to supplement the engine, often enabling the motor to drive the vehicle entirely at low speeds. The motor can provide extra power during acceleration, while the gasoline-powered engine usually propels the vehicle entirely at steady highway cruising speeds. By complementing the gasoline engine in this way, the electric motor can help ensure that the engine is running at its most efficient point, and the supplemental power provides some opportunity for downsizing the engine as well.
The electric motor—or motors, as automakers have developed a number of hybrid powertrain configurations, some of which are more complex than others—draws its power from a small battery. The battery can then be recharged during driving through regenerative braking: a motor draws energy from the engine, slowing down the vehicle and charging the battery at the same time.
Since Toyota sold the first Prius in the United States in 2000, the company has diversified its hybrid portfolio significantly. The automaker now offers the Prius family, which features three sizes of hybrid cars as well as a plug-in hybrid-electric version (see Box 2). Toyota also sells hybrid versions of the Camry, its best-selling car. Today more than one in six of all vehicles it sells are hybrids, and the automaker continues to lead this market. How important are hybrids to Toyota’s ranking? Without its sales of hybrid vehicles, the automaker’s profile would match the industry average in both smog-forming and global warming emissions. Instead, it beats the average by about 8 percent.
FIGURE 6. Market Share of Hybrid-Electric Vehicles, by Automaker
Toyota leads the way in producing hybrid-electric vehicles, though both Ford and Hyundai-Kia have added hybrid options to some of their best-selling vehicles. Sales of hybrids have risen slightly recently, to 3.5 percent of vehicles sold in MY2013.
Chrysler GMFord
VolkswagenNissan Toyota
Honda
Hyundai-Kia
Plug-in Hybridand Battery-
Electric Vehicles
Other Manufacturers
Chrysler GMFord
VolkswagenNissan Toyota
Honda
Hyundai-Kia
Other Manufacturers
Chrysler GMFord
VolkswagenNissan Toyota
Honda
Hyundai-Kia
Other Manufacturers
Chrysler GMFord
VolkswagenNissan Toyota
Honda
Hyundai-Kia
Other Manufacturers
13.5% of All New Vehicles Sold
0.9% of All New Vehicles Sold
3.5% of All New Vehicles Sold
0.6% of All New Vehicles Sold
Diesel Engines
Turbocharged GasolineEngines
Hybrid-ElectricVehicles

152014 Automaker Rankings
The development and sale of plug-in electric vehicles by a number of manufacturers is one of the most important advances in vehicle technology since our last Automaker Rankings. These vehicles draw some or all of the energy needed to “fuel” their travel from the electricity grid. They come in two major forms: battery-electric vehicles (BEVs) and plug-in hybrid-electric vehicles (PHEVs).
BEVs are powered entirely by stored electricity, drawn from the electric grid when the vehicle is plugged in. An electric motor uses this energy, stored in a large lithium-ion battery, to propel the vehicle, rather than relying on a conven-tional combustion engine. PHEVs also store energy in a battery; however, they have both an electric motor and a gasoline-powered engine—hence the name “hybrid-electric.” The many designs of PHEVs range from the Toyota Plug-in Prius, which can run only short distances on electricity alone because the electric motor and battery are small, to the Chevrolet Volt, which has a much larger battery and whose electric motor is capable of providing power over nearly the entire range of operation. The Volt’s gasoline engine serves primarily as a generator to recharge the battery once the energy stored from the electric grid is depleted.
By drawing energy from the electricity grid, all these vehicles can reduce not just oil consumption but also global warming and smog-forming emissions. However, although these vehicles do not emit pollutants directly while running
BOX 2.
Plug-in Electric Vehicles
on electricity, the stored energy does entail some emissions. In an earlier report, we showed that all-electric vehicles emit fewer global warming emissions per mile than the average new vehicle in every U.S. region, based on emissions from the electricity grid in that region. In many parts of the country, battery-electric vehicles significantly outperform even the most efficient hybrid vehicles (UCS 2012). We built our analysis in this report on a similar approach, using the latest infor-mation on the electricity grid and concentrations of plug-in vehicles in each region.
ELECTRICITY VERSUS FOSSIL FUELSJust how much better are plug-in electric vehicles for the envi-ronment compared with their gasoline counterparts? In our analysis, the average BEV scored a 38.0 for its global warming emissions and a 44.0 for its smog-forming emissions, yielding an overall average of 41.0. A PHEV scored 48.5 and 56.7, respec-tively, for an average of 52.6. The rest of the small, midsize, and large vehicle fleet scores 83.3 and 84.7, for an average of 84.0. Clearly, plug-in electric vehicles can significantly reduce the environmental impact of the light-duty fleet.
To put this in perspective, if we converted the small, midsize, and large segments of the new vehicle fleet to today’s plug-in electric vehicles, global warming emissions from all new vehicles would drop by 19 percent, on average, and smog-forming emissions by 16 percent. Nissan is leading the way: its Leaf BEV now accounts for almost 2 percent of the company’s sales, giving it a much higher fraction of electric vehicle sales than any other major automaker, and a one-point improvement on its Automaker Rankings scorecard.
MOVING FORWARDIf plug-in electric vehicles can markedly reduce global warming and smog-forming emissions from the U.S. fleet, how can we get there? In 2013, these vehicles represented just 0.6 percent of all vehicles sold. However, our research shows that 42 percent of U.S. households with cars could rely on today’s plug-in electric vehicles, given their passenger and cargo needs and access to a place to plug in the vehicle at home (UCS 2013b). And today’s BEVs can already fulfill the weekday range needs of nearly 70 percent of U.S. drivers, even if we do not consider the availability of public charging stations. This segment of the market thus has plenty of room to grow even without breakthroughs in the storage capacity and cost of batteries. Advances in battery chemistry and production will continue to improve the range and reduce the cost of these vehicles, making them more attractive to consumers.
FIGURE 7. Emissions Scores for Plug-in Electric Vehicles Compared with Other Cars
PHEVs and BEVs emit about half the emissions of other cars on the road.
Small + Midsize+ Large Cars
BEVs
CO2
Smog
Total
38.0
44.0
41.0
48.5
56.7
52.6
83.3
84.7
84.0
PHEVs

16 union of concerned scientists
California’s Zero Emission Vehicle (ZEV) Program is encou-raging more automakers to enter this market, which should help diversify it and boost buyer interest. Hyundai-Kia—which stands atop this year’s Automaker Rankings—is introducing a BEV
version of its popular Soul hatchback in MY2015 in a number of markets beyond California (Capparella 2014). Volkswagen is also getting into the game, introducing a battery-electric version of its compact Golf in MY2015. While the automaker has no plans yet to release the Golf GTE—a PHEV—in the United States, the company could easily electrify its vehicles further. Even smaller manufacturers are developing new models for the U.S. market, with BMW slated to release its i3 hatchback BEV and i8 sports car PHEV. Mitsubishi’s Outlander PHEV and Tesla’s Model X SUV will continue to broaden the market.
However, not all manufacturers are pushing strongly ahead with plug-in electric vehicles. Honda is offering only very limited numbers of its Fit BEV and Accord PHEV in California and New York markets. Chrysler, too, has signaled only limited production and availability of the Fiat 500e, despite critical praise for it and the obvious need to reduce its emissions footprint.5 On the other hand, Nissan and GM are selling the Leaf and Volt nationally—each already have annual sales of more than 20,000.
Given the strong potential of plug-in electric vehicles to reduce emissions, manufacturers’ decisions in this market will strongly affect the next Automaker Rankings and the overall environmental impact of the U.S. vehicle fleet.
FIGURE 8. Market Share of Plug-in Electric Vehicles, by Automaker
The Nissan Leaf and Chevy Volt remain the best-selling plug-in electric vehicles on the market. However, other automakers including Ford and Toyota are helping to expand the sales of such vehicles, which now account for just 0.6 percent of new vehicles sold.
Chrysler GMFord
VolkswagenNissan Toyota
Honda
Hyundai-Kia
Plug-in Hybridand Battery-
Electric Vehicles
Other Manufacturers
Chrysler GMFord
VolkswagenNissan Toyota
Honda
Hyundai-Kia
Other Manufacturers
Chrysler GMFord
VolkswagenNissan Toyota
Honda
Hyundai-Kia
Other Manufacturers
Chrysler GMFord
VolkswagenNissan Toyota
Honda
Hyundai-Kia
Other Manufacturers
13.5% of All New Vehicles Sold
0.9% of All New Vehicles Sold
3.5% of All New Vehicles Sold
0.6% of All New Vehicles Sold
Diesel Engines
Turbocharged GasolineEngines
Hybrid-ElectricVehicles
Fueled in part by electricity, the Toyota Plug-in Prius is part of a new class of vehicles reducing emissions and oil consumption from our transportation fleet.
Courtesy of Toyota U
K (C
C BY-N
C-N
D 2.0)
5 Ward’s Auto named the Fiat 500e’s electric motor to its 2014 10 Best Engines list (Murphy 2013), while Road and Track named it the best electric car in 2013 (Road and Track staff 2013).
172014 Automaker Rankings
Conclusions
Future Prospects for Each Automaker
For the first time since UCS began examining the environ-mental performance of the U.S. light-duty fleet, every major automaker has reduced both the average smog-forming emissions and the average global warming emissions of its vehicles. Our analysis clearly shows the impact of stronger fuel economy and tailpipe emissions standards. As these standards continue to phase in through 2025, we can expect continued improvements across the U.S. fleet. However, some automakers are better positioned than others to boost the environmental performance of their vehicles.
Hyundai-Kia is the Greenest Automaker not because it sells the greenest individual vehicle, but because it has made an across-the-board effort to improve the efficiency of its fleet. A continued focus on electrifying its fleet by selling hybrid-electric, battery-electric, and hydrogen fuel-cell vehicles will go a long way toward ensuring that Hyundai-Kia keeps its place at the top. Upcoming releases of the Kia Soul EV and Hyundai Tucson fuel-cell vehicle in 2014 will give the two brands green flagship vehicles. However, improving the performance of the automaker’s smallest vehicles—to keep pace with other automakers in this class—could help Hyundai-Kia sew up the title for years to come.
Honda is no longer the industry leader overall, but it continues to lead the way in many vehicle classes. Still, its midsize fleet—which accounts for a quarter of the company’s sales—now lags the industry average. If Honda improves the performance of its midsize cars, and the efficiency of its Acura luxury fleet, it could once again top the rankings. To which technologies Honda will turn to outpace the rest of the industry is not yet clear, though recent announcements
point to turbocharged gasoline engines, fuel-cell vehicles, and hybridization (Honda UK 2013, Honda USA 2013). Honda’s entry into the plug-in electric vehicle market has recently been very limited, but the latest Honda Accord hybrid is a fresh start for the company that brought the first hybrid to the United States in 1999. Success with its new hybrid system could help propel Honda back to the top of the rankings.
Toyota continues to outperform the industry in the midsize- and large-car markets based on the strength of its Prius family. However, the rest of the automaker’s fleet tends toward the industry average. While the introduction of its hydrogen fuel-cell vehicle in 2015 may help create a new market niche, Toyota needs to improve the performance of
[ chapter 3 ]
Our analysis clearly shows the impact of stronger fuel economy and tailpipe emissions standards. As these standards continue to phase in through 2025, we can expect continued improvements across the U.S. fleet.

18 union of concerned scientists
Chrysler continues to find itself at the bottom of the rankings, and falling ever further behind the rest of the industry. Recent collaboration with Fiat on the Fiat 500 and the redesigned Chrysler 200 will bolster the performance of the automaker’s overall fleet. However, Chrysler needs to improve the fuel efficiency of its vehicles across the board to keep pace with the industry and tighter fuel economy standards.
Key Takeaways for the Industry
Standards work. The industry has made tremendous progress in reducing its environmental impact. The phase-in of Tier 2 standards has spurred an 87 percent reduction in tailpipe smog-forming emissions from the U.S. fleet—or a 61 percent drop if we account for emissions during the refining and distribution of the fuel used by the fleet. And as stricter fuel economy standards and limits on global warming emissions have begun to take hold, spurring automakers and consumers alike to make more fuel-conscious choices, those emissions from the average vehicle have declined by nearly 20 percent.
The industry is primed to make further improvements. As Tier 3 standards begin to take effect in 2017, we can expect more declines in smog-forming emissions from the U.S. fleet. However, despite progress in reducing global warming emissions, all automakers will need to continue to invest in technologies that curb fuel consumption to meet more stringent standards on fuel economy and those emissions.
Numerous technologies can contribute to the needed progress. While automakers have widely used a few key technologies to reduce the global warming impact of their fleets, other technologies on the horizon are also important—from smaller turbocharged engines in conventional vehicles to hydrogen fuel cells, which offer a new approach to powering light-duty vehicles. Our next Automaker Rankings will examine these and other technologies that automakers are using to reduce global warming and smog-forming emissions from the U.S. fleet.
its conventional vehicles to continue to reduce its overall environmental impact.
Nissan has made the most progress of any automaker over the past decade, primarily by improving the efficiency of its best-selling cars, and by making a concerted investment in battery-electric vehicles. Nissan has the technology to reduce smog-forming emissions from all its vehicles, but it needs to sell vehicles with that technology across the country—not just in select states. Along with continued growth in electric vehicle sales, that strategy could make Nissan an industry leader.
Volkswagen continues to struggle to find a balance between high performance and high efficiency, mostly relying on turbochargers for the former. The automaker therefore finds itself on the wrong side of the industry average in nearly every class. By curbing the smog-forming emissions of its diesel vehicles, Volkswagen has improved the overall performance of its fleet significantly since the last Automaker Rankings. Unfortunately, the company’s diesel offerings offer only a small improvement over gasoline versions in global warming emissions. The company could do much more to reduce emissions from its overall fleet by promoting cleaner vehicles such as the Jetta Hybrid and new plug-in electric models such as the e-Golf.
Ford has made the biggest strides of any automaker over the history of the Automaker Rankings, and now finds itself pulling away from its Detroit counterparts. Ford’s emphasis on its EcoBoost turbocharged engines should continue to reduce the environmental impact of its traditional fleet, especially the F-150 pickup—the top-selling vehicle in the country. Ford’s focus on a hybrid rivalry with Toyota could help the company pull ahead of the industry average.
General Motors is at a tipping point. While it is well behind the industry average in overall emissions, the company is improving its standing with efficient small cars such as the Volt and Sonic, and lags the industry average in overall improvement only slightly. A focus on downsizing its engines and hybridizing its fleet could help GM at least keep pace with the rest of the industry.

192014 Automaker Rankings
Argonne National Laboratory (ANL). 2013. The greenhouse gases, regulated emissions, and energy use in transportation (GREET) model: GREET1_2013. Lemont, IL.
Burnham, A., M.Q. Wang, and Y. Wu. 2006. Development and applications of GREET 2.7: The transportation vehicle-cycle model. ANL-ESD-06-5. Lemont, IL: Argonne National Laboratory.
Capparella, J. 2014. 2015 Kia Soul EV revealed at 2014 Chicago auto show. Automobile, February. Online at http://www.automobilemag.com/auto_shows/chicago/2014/1402-2015-kia-soul-ev-chicago/.
Edmunds.com. No date. 2013 model year changes. Online at http:// www.edmunds.com/model-year-changes/2013/.
Environmental Protection Agency (EPA). 2014. Inventory of U.S. greenhouse gas emissions and sinks, 1990–2012. Washington, DC. Online at http://www.epa.gov/climatechange/ghgemissions/usinventoryreport.html.
Environmental Protection Agency (EPA). 2013a. Light-duty automotive technology, carbon dioxide emissions, and fuel economy trends, 1975 through 2013. EPA-420-4-13-011. Washington, DC.
Environmental Protection Agency (EPA). 2013b. Test car list data, 2013 model year. Washington, DC. Online at http://www.epa.gov/otaq/tcldata.htm.
Environmental Protection Agency (EPA). 2013c. Fuel economy data, 2013 model year. Washington, DC. Online at http:// www.fueleconomy.gov/feg/download.shtml.
Environmental Protection Agency (EPA). 2013d. Draft guidance letter: E85 flexible fuel vehicle weighting factor for model year 2016–2019 vehicles. EPA-HQ-OAR-2013-0120-0002. Washington, DC.
Environmental Protection Agency (EPA). 2013e. 2011 national emissions inventory. Washington, DC. Online at http://www.epa.gov/ttnchie1/net/2011inventory.html.
Environmental Protection Agency (EPA). 2006. Final technical support document: Fuel economy labeling of motor vehicle revisions to improve calculation of fuel economy estimates. EPA420-R-06-017. Washington, DC. Online at http://www.epa.gov/carlabel/documents/420r06017.pdf.
Environmental Protection Agency (EPA) and National Highway Traffic Safety Administration (NHTSA). 2012. 2017 and later model year light-duty vehicle greenhouse gas emissions and corporate average fuel economy standards: Final rule. Federal Register 77(199):62623–63200. Online at http://www.gpo.gov/fdsys/pkg/FR-2012-10-15/pdf/2012-21972.pdf.
[ references ]
Environmental Protection Agency (EPA) and National Highway Traffic Safety Administration (NHTSA). 2010. Light-duty vehicle greenhouse gas emission standards and corporate average fuel economy standards: Final fule. Federal Register 75 (88):25323–25728. Online at http://www.gpo.gov/fdsys/pkg/ FR-2010-05-07/pdf/2010-8159.pdf.
Hawkins, T.R., O.M. Gausen, and A.H. Strømmen. 2012. Environmental impacts of hybrid and electric vehicles: A review. International Journal of Life Cycle Assessment 17:997–1014.
Honda UK. 2013. Honda announces all-new VTEC TURBO engine series. PRNewswire. Online at http://www.prnewswire.com/news-releases/honda-announces-all-new-vtec-turbo-engine-series-232480201.html.
Honda USA. 2013. Honda FCEV concept makes world debut at Los Angeles International Auto Show. Online at http://world.honda.com/news/2013/4131120FCEV-Concept-Los-Angeles-Auto-Show/index.html.
LaVrinc, D. 2013. 5 cities buy more than half of all electric vehicles in U.S. Wired, August 19. Online at http://www.wired.com/ 2013/08/five-cities-ev/.
Murphy, T. 2013. Diesels, turbos dominate 2014 Ward’s 10 best engines. Ward’sAuto. Online at http://wardsauto.com/ ward039s-10-best-engines/diesels-turbos-dominate-2014- ward-s-10-best-engines.
National Automobile Dealers Association (NADA). 2013. NADA data: State-of-the-industry report 2013. Online at http://www.nada.org/Publications/NADADATA/2013/.
Oak Ridge National Laboratory (ORNL). 2013. Transportation energy data book, edition 32. ORNL-6989. Oak Ridge, TN.
Pyper, J. 2014. Is 2014 the year of the fuel cell car? Scientific American, January 23. Online at http://www.scientificamerican.com/article/is-2014-the-year-of-the-fuel-cell-car/.
Road and Track staff. 2013. Best electric car of 2013. Road and Track, November 14. Online at http://www.roadandtrack.com/bestof2013/best-cars-of-2013-4.
Sedgwick, D. 2012. Bosch, partners research HCCI engine. Automotive News, January 16. Online at http://www. autonews.com/article/20120116/OEM01/301169994/ bosch-partners-research-hcci-engine.
Singh, M. 1998. Total energy cycle assessment of electric and conventional vehicles: An energy and environmental analysis. ANL-ES-RP 96387. Lemont, IL: Argonne National Laboratory, National Renewable Energy Laboratory, and Pacific Northwest National Laboratory.

20 union of concerned scientists
Union of Concerned Scientists (UCS). 2007. Automaker rankings 2007: The environmental performance of car companies. Cambridge, MA. Online at http://www.ucsusa.org/clean_vehicles/what_you_can_do/automaker-rankings-2007.html.
Union of Concerned Scientists (UCS). 2004. Automaker rankings 2004: The environmental performance of car companies. Cambridge, MA. Online at http://www.ucsusa.org/clean_vehicles/vehicles_health/automaker-rankings-2004.html.
Union of Concerned Scientists (UCS). 2002. Automaker rankings: The environmental performance of car companies. Cambridge, MA. Online at http://www.ucsusa.org/assets/documents/ clean_vehicles/autorank2002.pdf
Union of Concerned Scientists (UCS). 2000. Pollution lineup: An environmental ranking of automakers. Cambridge, MA. Online at http://www.ucsusa.org/assets/documents/clean_vehicles/lineup_bro.pdf.
University of Michigan Transportation Research Institute (UMTRI). 2013. Eco-driving index: How is the EDI calculated? Ann Arbor, MI. Online at http://www.umich.edu/~umtriswt/ EDI_calculation.html.
Society of Automotive Engineers (SAE). 2010. Utility factor definitions for plug-in hybrid electric vehicles using travel survey data: Standard J2841. Washington, DC. Online at http://standards.sae.org/j2841_201009.
Union of Concerned Scientists (UCS). 2013a. Where your gas money goes. Cambridge, MA. Online at http://www.ucsusa.org/assets/documents/clean_vehicles/Where-Your-Gas-Money-Goes.pdf.
Union of Concerned Scientists (UCS). 2013b. Infographic: Millions of Americans could use an electric vehicle. Cambridge, MA. Online at http://www.ucsusa.org/clean_vehicles/ smart-transportation-solutions/advanced-vehicle-technologies/electric-cars/bev-phev-range-electric-car.html.
Union of Concerned Scientists (UCS). 2012. State of charge: Electric vehicles’ global warming emissions and fuel-cost savings across the United States. Cambridge, MA. Online at http://www.ucsusa.org/assets/documents/clean_vehicles/ electric-car-global-warming-emissions-report.pdf.
Union of Concerned Scientists (UCS). 2010. Automaker rankings 2010: The environmental performance of car companies. Cambridge, MA. Online at http://www.ucsusa.org/assets/documents/clean_vehicles/2010-automaker-report.pdf.

212014 Automaker Rankings
[ appendix a ]
An engine’s combustion process produces numerous pollutants, including particulates (soot), carbon monoxide, and carcinogens. However, smog-forming and global warming emissions are arguably the most significant challenges facing the automotive industry today, so we based our Automaker Rankings on those.
Smog-Forming Emissions
Light-duty vehicles in the United States today produce considerably less of the smog-forming pollution that contributes to local air quality problems than they have historically. The latest federal standards for vehicle emissions, finalized in March 2014, do not take effect at the national level until 2017. However, they build on a history of strong federal tailpipe standards and California’s Low-Emission Vehicle (LEV) Program, which have lowered smog-forming and particulate emissions and their adverse health effects, including asthma, respiratory ailments, and premature death.
Despite these successes, light-duty vehicles continue to be a major contributor to air quality problems, accounting for about 15 percent of all U.S. smog-forming emissions (EPA 2013e). The primary pollutants responsible for smog formation—nitrogen oxides (NOx) and non-methane organic gases (NMOG)—react in the presence of sunlight to form ground-level ozone, a major constituent of smog. Emissions of NOx and NMOG are regulated by the EPA under the Clean Air Act, and are measured under federal test procedures for all non-emergency vehicles.
Global Warming Emissions
Light-duty vehicles emit 21 percent of all U.S. heat-trapping emissions, with 95 percent of all those emissions resulting from the combustion of fossil fuels (EPA 2014). Despite a rising figure for vehicle-miles traveled in the United States over the past decade, global warming emissions from the light-duty fleet have been dropping because of better fuel efficiency. However, continued improvements to reduce the amount of fuel these vehicles use will be needed to sustain this trend.
Methodology for Automaker Rankings 2014
Light-duty vehicles also emit global warming pollution in the form of hydrofluorocarbons (HFCs), methane (CH4), nitrous oxide (N2O), and particulates, also known as black carbon. The standard refrigerant for vehicles, HFC-134a, is a particularly potent though short-lived greenhouse gas, which is why the EPA gives credit to automakers for switching to alternative refrigerants, and for reducing leakage from vehicle air conditioning systems. Our calculations of global warming emissions from vehicles do not account directly for these other pollutants, which amount to 5 percent of a vehicle’s in-use emissions.
A comprehensive evaluation of global warming emissions would include all those released by the vehicle in use, as well as those from producing and distributing the fuel it uses, and from manufacturing and disposing of the vehicle. Unfortunately, the data needed to evaluate all those contributions on a model-by-model basis are not available. However, data are available that allow us to estimate carbon dioxide (CO2) emissions from the vehicle’s tailpipe, as well as upstream emissions of CO2 and other heat-trapping gases, such as methane and nitrous oxide released during fuel production and distribution. Vehicle use and fuel production and distribution typically account for 80 percent to 90 percent of global warming emissions attributable to a conventional vehicle over its lifetime, according to studies by more than 50 respected authorities (Hawkins, Gausen, and Strømmen 2012).
Emissions from the production of electric vehicles are higher than those from the production of a comparable conventional vehicle, on average, primarily because of emissions related to production of the battery (Burnham, Wang, and Wu 2006; Singh 1998). However, global warming emissions do vary somewhat from model to model among conventional vehicles. And emissions from producing a plug-in electric vehicle, including its battery, fall within the range of emissions from producing a conventional vehicle (Hawkins, Gausen, and Strømmen 2012). What’s more, electric vehicles represent just 0.6 percent of the overall light-duty market, so even if we were to take such differences into account, they would not alter our rankings. As the market share of electric vehicles continues to

22 union of concerned scientists
The mix of electricity sources powering today’s electric vehicles replaces a significant portion of coal-powered electricity (which emits a national average of 1,052 g CO2/kWh, including upstream emissions) with natural gas (473 g CO2/kWh) and hydropower (6 g CO2/kWh). Emissions from power generation come directly from the EPA’s 2012 eGRID database for the corresponding eGRID sub-region, after taking into account regionally defined transmission losses. To obtain the full emissions profile for this adjusted electricity mix, we used the latest version of Argonne National Laboratory’s GREET model (ANL 2013). We also used the corresponding regional power plant technology shares and efficiencies to incorporate the emissions upstream from electricity production, similar to our analysis of petroleum-based fuel use. This calculation yields total emissions from the grid of both global warming and smog-forming emissions for electricity used by electric vehicles.
Classifying Light-Duty Vehicles
We based our rankings on sales of light-duty cars and trucks with a gross vehicle weight rating (GVWR) of 8,500 pounds or less, as well as medium-duty sport utility vehicles and vans with a GVWR from 8,500 to 10,000 pounds. These vehicles are regulated under the EPA’s light-duty vehicle greenhouse gas emissions standards and the agency’s corporate average fuel economy standards, and include most cars, utilities, vans,
grow and better data become available, we will consider incorporating emissions from the production of all vehicles into our analysis.
Accounting for Emissions from the Power Used by Electric Vehicles
While the emissions from most vehicles stem directly from the tailpipe, vehicles that store energy from the electricity grid in batteries—both plug-in hybrid and battery-electric vehicles—have zero tailpipe emissions when driven on electricity. However, those vehicles are responsible for emissions from the production of the electricity used to charge the vehicles.
Most electric vehicles have been sold in just a few markets with state and local support in the form of rebates or other incentives, such as access to public charging and HOV lanes. In fact, a recent study indicated that more than half of all sales of electric vehicles occur in just five cities: San Francisco (19.5 percent), Los Angeles (15.4 percent), Seattle (8.0 percent), New York (4.6 percent), and Atlanta (4.4 percent) (LaVrinc 2013). Because the mix of sources providing the electricity in those cities differs from the national average, we have used information on those sources to weigh emissions powering the electric vehicles in those cities, and used the national average mix of sources for the remainder.
Region FractioneGrid Subgrid Coal
Natural Gas Hydro Nuclear
Non-Hydro Renewables Other
San Francisco, CA 19.5% CAMX 7.1% 50.4% 15.2% 15.2% 10.4% 1.7%
Los Angeles, CA 15.4% CAMX 7.1% 50.4% 15.2% 15.2% 10.4% 1.7%
Seattle, WA 8.0% NWPP 31.3% 14.3% 43.6% 3.4% 6.8% 0.6%
New York City, NY 4.6% NYCW 0.0% 57.4% 0.0% 39.9% 1.0% 1.8%
Atlanta, GA 4.4% SRSO 52.4% 24.6% 2.7% 17.2% 2.7% 0.4%
National Average 48.1% — 44.8% 24.0% 6.2% 19.6% 4.0% 1.5%
Overall Mix 100.0% 28.8% 34.0% 11.9% 17.6% 6.3% 1.4%
The electricity used by most electric vehicles on the road has lower emissions than the U.S. average, largely because the power supply in regions where most EVs are sold relies more heavily on natural gas and renewable sources than on coal.
TABLE A-1. Regional and National Sources of Electricity for Electric Vehicles

232014 Automaker Rankings
Data Sources
To create a comprehensive database of information on vehicles sold by each manufacturer, we gathered data from a variety of publicly available sources.
EPA DATA
Data on each model’s smog-forming emissions came from the EPA’s Test Car List (EPA 2013b). We cross-referenced these values to the EPA’s Tier 2 and California’s LEV II standards for tailpipe emissions, to determine a vehicle’s emissions during its full useful life (120,000 miles). Data on each model’s fuel economy and global warming emissions came from the EPA’s Fuel Economy Guide (EPA 2013c).
WARDSAUTO
We obtained data on the sales of each vehicle model from October 2012 to September 2013 from WardsAuto, to correspond to the EPA model year 2013 (MY2013).7 Furthermore, automakers redesign only 15 percent to 20 percent of vehicles in any given year—and a redesign typically changes a vehicle’s fuel economy by less than 5 percent to 10 percent—so small discrepancies in sales because of a slight misalignment between some vehicles’ actual and assumed model years should not significantly affect an automaker’s score.
and pickups sold by the top eight automakers. GM, Ford, and Chrysler-Fiat also sell some pickups with GVWRs in excess of 8,500 pounds, but these vehicles are considered light heavy-duty vehicles, so we excluded them from our analysis.
To classify the vehicles, we used the EPA’s size designations, which are based on interior volume. However, we also used data from WardsAuto to break out the sports cars, denoted by the international “S” classification.6 We also lumped together the non-S two-seaters, minicompacts, subcompacts, and compact vehicles into a single small-car class, because most automakers do not have vehicles that compete significantly in both the compact and subcompact classes. The EPA also assigns many vehicles that compete against each other to different classes. For example, the Mini Cooper, Fiat 500, and Chevrolet Spark are identified as belonging to the two-seater, minicompact, and subcompact classes, respectively.
Midsize cars remain the most popular class in the car market, and we left them as a single classification. We classified large cars and station wagons together as a single large-car segment, because their interior volumes are much bigger than those of midsize vehicles. Because the EPA’s 2013 Fuel Economy Trends Report noted that vehicle classes are becoming “compressed,” we have similarly combined the small pickup/standard pickup class into “pickups.” We combined all S-designated vehicles into a separate sports car class.
TABLE A-2. Prevalence of Various Configurations of the Nissan Frontier, MY2008
OEM Model Cyl Vol TransmissionDrive Type
Model Sales Eng %
Drive %
Trans %
Body %
Vehicle Sales
Nissan Frontier 2WD 4 2.5 automatic 5-spd RWD 58710 13% 100% 57% 100% 4,227
Nissan Frontier 2WD 4 2.5 manual 5-spd RWD 58710 13% 100% 43% 100% 3,229
Nissan Frontier 2WD 6 4 automatic 5-spd RWD 58710 87% 41% 91% 100% 19,276
Nissan Frontier 2WD 6 4 manual 6-spd RWD 58710 87% 41% 9% 100% 1,918
Nissan Frontier 4WD 6 4 automatic 5-spd 4WD 58710 87% 59% 91% 100% 27,339
Nissan Frontier 4WD 6 4 manual 6-spd 4WD 58710 87% 59% 9% 100% 2,720
Sales of the Frontier pickup are broken down by type of engine, driveline, and transmission, as an example of how we used data from Wards-Auto to derive our Automaker Rankings.
6 This classification is based on European market segmentation outlined by the Commission of the European Communities (EEC) in Regulation No. 4064/89 (1999). It corresponds to distinct product markets rather than specific vehicle characteristics such as weight, size, and power.
7 This reflects the time frame when automakers typically release new vehicles, and the University of Michigan Transportation Research Institute uses it to calculate its monthly Eco-Driving Index (UMTRI 2013). While automakers have recently released some vehicles as early as January, the vast majority of vehicles appear dur-ing the October-to-September time frame (Edmunds.com n.d.).

24 union of concerned scientists
data for October 2012 to September 2013 to estimate the fraction of SULEV vehicle sales compared with the 49-state version. Most vehicles are “50-state” vehicles, which meet both federal and California criteria-pollutant regulations. We chose the lowest certified value for smog-forming emissions from those vehicles.
Calculating Automakers’ Scores
We based each automaker’s score on average emissions of global warming and smog-forming pollutants measured in grams per mile, and defined the average across all eight companies as 100. A score of 120 corresponds to an emissions level that is 120 percent of the industry average. That is, if the industry average for smog-forming emissions is 90 grams of NMOG and NOx per mile, a score of 120 represents emissions of 108 grams per mile.
SCORING GLOBAL WARMING EMISSIONS
Data on upstream emissions from the production of each vehicle model—and from the use of components such as air conditioning and leakage—are not available. However, we can use the fuel economy and fuel type of each vehicle to estimate its tailpipe and upstream global warming emissions. To determine a vehicle’s global warming emissions per mile, we divided the global warming emissions per gallon of gasoline-equivalent for the vehicle’s fuel by the vehicle’s fuel economy (also expressed in miles per gallon of gasoline-equivalent).
Flexible-fuel vehicles (FFVs) can run on gasoline, E85 (85 percent denatured ethanol and 15 percent gasoline), or any mixture in between. Ford, GM, and Chrysler have been producing FFVs to gain credit toward meeting their CAFE obligations. Under CAFE standards, an FFV has a petroleum-based fuel economy of about 1.7 times its observed fuel economy. This allows an automaker to produce a fleet of vehicles with an average fuel economy below the CAFE standard without penalty.
The 1.7 multiplier is based on an assumption that FFVs use gasoline half the time and E85 50 percent of the time, and that only the 15 percent gasoline contributes to fuel economy when the vehicle runs on E85. However, the most recent analysis from the EPA and the Energy Information Administration indicates that FFVs actually use E85 less than 2 percent of the time, on average (EPA 2013d). We therefore assumed that FFVs use E85 2 percent of the time, and weighted their global warming emissions accordingly. For plug-in hybrid-electric vehicles, we used the utility factor approach from the Society of Automotive Engineers to determine the fraction of miles the vehicle travels on electricity and gasoline (SAE 2010).
We used 2013 production data from WardsAuto to take into account the various body types, engines, transmissions, and drivetrains available for each vehicle. We combined this information with sales figures for each vehicle to approximate the number of vehicles with a particular configuration. For the Nissan Frontier, for example (Table A-2), we multiplied the fractions times the total model sales to yield the final sales tally of each configuration (Vehicle Sales[#] = Model Sales[#] × Eng[%] × Drive[%] × Trans[%]× Body[%]).
Some 13 percent of these vehicles had a 2.5-liter I4 engine, while the remaining 87 percent had a four-liter V6. About 51 percent of Frontiers were sold with four-wheel drive (4WD), but all 4WD vehicles have V6 engines, so 51%/87% = 59%. The driveline is the share of two-wheel-drive (2WD) versus four-wheel-drive vehicles sold. All I4 vehicles have the same driveline (2WD), so the driveline for the 2WD vehicles is 100 percent. Some 5.5 percent of Frontiers had a five-speed manual transmission, but only one of the six configurations had that transmission, yielding 5.5%/[13% × 100%] = 43%.
We used the body column when vehicles with different characteristics had different emissions (e.g., a sedan and a station wagon have different aerodynamic characteristics, which effects fuel economy). While the Frontier comes in several body variants (two-door standard, two-door extended cab, and four-door crew cab), they are not explicitly defined in the EPA database, so no further submodel breakdown was necessary.
A further split may exist for models with the same powertrain but different smog certification levels. California created its LEV Program because the Clean Air Act allows the state to develop its own automobile regulations, which some other states have also adopted under Section 177 of the Clean Air Act. Some automakers have designed particular vehicles to meet these super-ultra-low-emission vehicle (SULEV) standards in California and the Section 177 states, while selling another version (typically called a 49-state vehicle) with weaker smog controls that still meet federal standards in other regions.
Because federal Tier 2 tailpipe standards are now fully phased in and were designed to harmonize with California’s LEV II standards, we assume that automakers’ SULEV models are sold primarily in Section 177 states that have also adopted California’s Zero-Emission Vehicle (ZEV) Program. In these so-called ZEV states, SULEV vehicles would generate credits as a partial zero-emission vehicle (PZEV), which provides an additional incentive to the automakers to provide these low-emission vehicles. The eight ZEV states plus California accounted for 27.6 percent of all U.S. light-duty vehicle sales in 2012, with 10.7 percent of that share occurring in California, yielding a ratio of 27.6%/10.7% = 2.58 (NADA 2013). We used that multiplier and California sales

252014 Automaker Rankings
NMOG (a measure of VOC) during a vehicle’s full useful life (120,000 miles), expressed as grams per mile, and averaged them across vehicle models, classes, and automakers. Although smog-forming emissions during actual use are likely to differ significantly from those during tests, we assumed that the latter are a reasonable measure of the relative performance of different vehicles. Automakers are also legally bound to ensure that their vehicles produce no more than these levels under test conditions.
We then combined those amounts with emissions from production of the fuel used by each vehicle—whether electricity or petroleum-based—and assigned a sales-weighted average smog score to each automaker.
How Our Approach Differs from Previous Automaker Rankings
This methodology is a significant change from previous Automaker Rankings. In the past, we relied on data on vehicle sales from the EPA and the National Highway Traffic and Safety Administration. Because that information was available only after a significant delay, our information lagged the publication date for our rankings by at least two years. For example, we based our 2010 rankings on MY2008 vehicles, many of which were sold in 2007.
Because new federal standards are now driving rapid advances in fuel efficiency, and automakers are deploying more advanced technologies throughout the U.S. fleet, we sought other sources of data that would allow more timely analysis of automakers’ environmental performance. For
We based these global warming emissions on test results for each vehicle submitted by automakers to the EPA. We used “adjusted” city and highway fuel economies, determined either directly through a five-cycle test procedure or a “derived five-cycle” method, which approximates a five-cycle test result by using data obtained via the EPA Federal Test Procedure.
We harmonically averaged the adjusted city and highway values in a 43 percent/57 percent ratio. That differs from the 55 percent city/45 percent highway ratio used in the EPA-approved vehicle labels, the agency’s corporate average fuel economy and greenhouse gas compliance programs, and previous Automaker Rankings. However, the EPA found that the 43/57 ratio was more representative of real-world driving (EPA 2013a; EPA 2006). While fuel economy may vary among individual vehicles and owners, we believe this ratio provides the best estimate of real-world emissions from all automakers.
SCORING SMOG-FORMING EMISSIONS
Cars and light trucks are responsible for significant emissions of NOx and volatile organic compounds (VOCs) throughout all stages of their life cycle, including vehicle manufacture, fuel production, vehicle operation, and disposal (Burnham, Wang, and Wu 2006). Emissions while vehicles are operating are especially problematic, as they are released from millions of point sources—often in densely populated areas where the health effects are pronounced.
To calculate smog-forming scores for each automaker, we included both in-use emissions and emissions from the fuel used to run that vehicle. We combined emissions of NOx and
TABLE A-3. Automakers’ Scores for the MY2008 Fleet from Automaker Rankings 2010
Smog Score[g/mi] [#]
CO2 Score[g/mi] [#]
Combined Score[#] Rank
Overall 0.146995 100 429 100 100 —
Honda 0.124834 85 377 88 86 1
Toyota 0.122281 83 390 91 87 2
Hyundai-Kia 0.126624 86 377 88 87 2
Volkswagen 0.122617 83 411 96 90 4
Nissan 0.132429 90 410 96 93 5
Ford 0.158874 108 460 107 108 6
GM 0.164690 112 457 107 109 7
Chrysler 0.172669 120 468 109 113 8

26 union of concerned scientists
less than 3 percent overall, from the original 2010 scores. Hyundai-Kia’s smog score did increase, breaking the automaker’s overall tie with Toyota, while Volkswagen’s scores on both smog-forming and global warming emissions fell modestly, which allowed it to score on par with Hyundai-Kia overall. All other rankings remain unchanged.
In Automaker Rankings 2010, we treated scores that rounded to the nearest whole number as equivalent, representing an effective uncertainty of +0.4% to +0.6%. Using the updated methodology, we increased our uncertainty to +1.4% for smog scores, +0.8% for CO2 scores, and +1.0% for the combined scores.
To determine an automaker’s ranking, we assumed that this uncertainty reflected the standard deviation of a normal distribution around an automaker’s actual score. We then tested the hypothesis that one automaker’s score was higher than another’s. If this probability exceeded 75 percent, we ranked the first automaker above the second. If this probability was less than 75 percent, we considered the automakers tied. This approach is roughly equivalent to our previous methodology. However, we converted the implicit assumption of rounding to the nearest whole number to a one-sided t-test, which enabled us to incorporate uncertainty more explicitly.
these rankings, we therefore used information on vehicle sales and production in MY2013 from monthly industry publications, along with EPA data from emissions tests for the same model year.
We also changed the way we calculated emissions from these vehicles to reflect the most current data. For example, we shifted to a 43/57 city/highway ratio, and five-cycle test data, to better reflect real-world conditions. We also used the latest model of GREET to estimate global warming emissions, including those upstream, for each vehicle (ANL 2013). Lastly, because electric vehicles are new to the marketplace since our last rankings, non-tailpipe emissions are critical to evaluating each automaker’s environmental impact. That prompted us to include smog-forming emissions from the production of all transportation fuels, including the generation of electricity and the refining of oil into gasoline and diesel fuel.
VALIDATING OUR APPROACH
Because we made significant changes in our approach, we wanted to ensure that our rankings remain as robust as in previous years. To validate our new approach based on public sales data, we used it to reanalyze our Automaker Rankings from 2010, based as noted on the MY2008 fleet. To obtain an apples-to-apples comparison, we retained the same calculations of environmental impact as in the 2010 rankings.
We found that the overall rankings remained largely unchanged (Tables A-3 and A-4). The scores of individual automakers deviated by about 1 percent, on average, and by
TABLE A-4. Difference in Automakers’ Scores from Automaker Rankings 2010, Based on Our 2014 Methodology
Smog Score[g/mi] [#]
Diff[%]
CO2 Score[g/mi] [#]
Diff[%]
Combined Score[#] Rank
Diff[%]
Overall 0.142114 100 -3.3% 427 100 -0.5% 100 — —
Honda 0.118944 84 -1.4% 376 88 -0.2% 86 1 -0.6%
Toyota 0.116548 82 -1.4% 391 92 0.5% 87 2 -0.2%
Hyundai-Kia 0.124422 88 1.6% 378 89 0.1% 88 3 1.1%
Volkswagen 0.116199 82 -2.0% 404 95 -1.8% 88 3 -1.6%
Nissan 0.126957 89 -0.8% 398 93 -3.0% 91 5 -1.7%
Ford 0.154814 109 0.8% 458 107 -0.5% 108 6 0.4%
GM 0.160243 113 0.6% 457 107 -0.1% 110 7 0.5%
Chrysler 0.170779 120 2.3% 470 110 0.4% 115 8 1.6%
AVERAGE Δ = ± 1.4% AVERAGE Δ = ± 0.8% AVERAGE Δ = ± 1.0%
272014 Automaker Rankings
[ appendix b ]
As noted in Box 1, the EPA required two manufacturers to modify their fuel economy labels for some MY2013 vehicles. Here we explain how we accounted for these adjustments in our analysis.
To better reflect real-world conditions, the EPA finalized new fuel economy test procedures in 2006. Besides city and highway test cycles—the Federal Test Procedure (FTP) and Highway Fuel Economy Test (HFET), respectively—the procedures now include three new tests: 1) the US06 cycle, designed to represent modern driving conditions, with a higher maximum speed of 80 miles per hour and maximum acceleration more than 2.5 times that in the original FTP and HFET; 2) the SC03 cycle, in which vehicles operate at high ambient air temperatures with the air conditioning running at maximum capacity; and 3) a “cold start” FTP cycle, run while the engine is cold, which mimics real-world city driving behavior when the vehicle is first turned on. Results from all these test cycles are combined to yield a vehicle’s city and highway fuel economy ratings, which appear on the label that accompanies every new car or truck sold along with consumer information on typical fuel consumption and tailpipe emissions.
Automakers conduct fuel economy tests for every model they sell. The EPA conducts its own tests as well, auditing about 15 percent of vehicles annually. Labels for the latter reflect EPA test results. Labels for other vehicles reflect data submitted by the automaker.
The automaker also runs a coast-down procedure, to determine a vehicle’s aerodynamic and friction loads. The company uses the results of this procedure to determine how much force is required to simulate road behavior for a given test procedure. Two separate incidents involving the coast-down procedure—one involving the Ford C-MAX, and the other several Hyundai-Kia models—required adjustments in fuel economy on labels in MY2013.
Because the Ford C-MAX Hybrid and Ford Fusion Hybrid share a powertrain and are in the same weight class, EPA protocols allow the automaker to test a single vehicle. Ford used results from tests of the Fusion Hybrid for all configurations of both vehicles. However, the Ford C-MAX has a substantially less aerodynamic shape than the Fusion. The EPA tested the C-MAX itself, and
Adjustments to Fuel Economy Labels for MY2013
lowered the label values by 2 mpg city and 7 mpg highway. The EPA also tested the C-MAX with and without a software update that Ford had used to raise city fuel economy by 3 mpg. Our analysis includes the results stemming from the retesting and the software adjustment. However, because the C-MAX accounts for just 1.5 percent of Ford’s sales, these adjustments did not have a significant impact on the automaker’s score.
The incident involving Hyundai-Kia was much more widespread across its fleet. Coast-down tests on a few of the automaker’s 2011 models, and the majority of its 2012 and 2013 models, did not follow EPA test protocols. That led to significant errors in the fuel economy labels for a number of Hyundai-Kia vehicles.
The EPA noticed this discrepancy during an audit, and worked with Hyundai-Kia to correct the improper procedure and adjust the labels to provide a more accurate assessment of fuel consumption. An investigation is ongoing to determine the company’s compliance with fuel economy and global warming emissions standards. We used the adjusted results, which decreased fuel economy for the vehicles nearly 7 per- cent, on average.
While the corrected results for the Hyundai-Kia vehicles are the best available and believed to be representative of real-world performance, the widespread nature of the error did prompt us to scrutinize the performance of Hyundai-Kia vehicles more carefully. In particular, we conducted two sensitivity analyses to capture any further deviation that the EPA’s label adjustments may not reflect.
For our first alternative analysis, we adjusted the fuel economy of the entire Hyundai-Kia fleet downward. Because the automaker’s test protocol could have affected all vehicles, but perhaps not all would have required a change to their labels, we adjusted all fuel economies downward to the nearest value that would maintain the same two-digit label value (i.e., 27.4 mpg rounds to 27 mpg, as does 26.5, so for the sensitivity case we used 26.5 mpg). This fleetwide adjustment produced less than a 1 percent change in Hyundai-Kia’s overall score—not nearly enough to knock the automaker out of first place in the 2014 rankings.
For our second analysis, we assumed that the improper protocol affected only the vehicles already identified by the

28 union of concerned scientists
EPA, which is certainly plausible. Automakers can often carry forward test results for multiple model years, so Hyundai-Kia would not have tested all its vehicles in this time period. However, we assumed that the EPA might adjust the fuel economies of these vehicles further once it finalizes the investigation.
To assess a worst-case scenario, we doubled the EPA’s adjustment to the fuel consumption of each vehicle. For example, in the case of the Kia Soul—which the EPA dropped from 26/34/29 mpg city/highway/combined down to 23/28/25 mpg—our approach decreased the fuel economy to 21/24/22 mpg. This extreme case raised the automaker’s global warming emissions score by 3 percent, and its overall score by 2.5 percent.
Even under these extreme scenarios, however, Hyundai-Kia is still the Greenest Automaker (Figure B-1). The data underlying the scores in our main report reflect the best estimates of real-world emissions from the Hyundai-Kia fleet.
FIGURE B-1. Sensitivity Analyses of the Hyundai-Kia Scores
OriginalLabel
EPAAdjusted
Hyundai-Kia
FleetRounding
DoublyAdjusted
Honda
GlobalWarming
Smog
Overall
89.7
90.8
83.2
85.2
84.2
85.7
87.1
86.4
86.5
87.8
87.1
88.2
89.0
88.6 90.2


NATIONAL HEADQUARTERS Two Brattle SquareCambridge, MA 02138-3780Phone: (617) 547-5552Fax: (617) 864-9405
WASHINGTON, DC, OFFICE1825 K St. NW, Suite 800Washington, DC 20006-1232Phone: (202) 223-6133Fax: (202) 223-6162
WEST COAST OFFICE2397 Shattuck Ave., Suite 203Berkeley, CA 94704-1567Phone: (510) 843-1872Fax: (510) 843-3785
MIDWEST OFFICEOne N. LaSalle St., Suite 1904Chicago, IL 60602-4064Phone: (312) 578-1750Fax: (312) 578-1751
The Union of Concerned Scientists puts rigorous, independent science to work to solve our planet’s most pressing problems. Joining with citizens across the country, we combine technical analysis and effective advocacy to create innovative, practical solutions for a healthy, safe, and sustainable future.
web: www.ucsusa.org printed on recycled paper using vegetable-based inks © MAY 2014 union of concerned scientists
find this document online: www.ucsusa.org/autorankings2014
The product planning decisions of a small number of automotive companies have an immense influence on the environmental health of the United States and the world. This report—the sixth in a continuing series the Union of Concerned Scientists launched 14 years ago—analyzes the bottom-line environmental performance of eight companies that together account for 90 percent of the cars and trucks sold in the United States.
Using publicly available data on model year 2013 vehicles, we evaluate each automaker’s average per-mile emissions of smog- forming and global warming pollutants. For the first time since the release of our initial report, all eight best-selling manufacturers have reduced both their average global warming and smog-forming emissions compared with their 1998 fleet average, due in large part to more stringent tailpipe emissions standards. However, some manufacturers are still making greater progress than others.
This report analyzes the bottom-line environmental performance of eight companies that together account for 90 percent of the cars and trucks sold in the United States.
Automaker Rankings 2014The Environmental Performance of Car Companies