autocorrelation, bias, and fat tails— are hedge
TRANSCRIPT

AUTOCORRELATION, BIAS, AND FAT TAILS—
ARE HEDGE FUNDS REALLY ATTRACTIVE INVESTMENTS?
MARTIN ELING
WORKING PAPERS ON RISK MANAGEMENT AND INSURANCE NO. 8
EDITED BY HATO SCHMEISER
CHAIR FOR RISK MANAGEMENT AND INSURANCE
OCTOBER 2005

1
AUTOCORRELATION, BIAS, AND FAT TAILS—
ARE HEDGE FUNDS REALLY ATTRACTIVE INVESTMENTS?
Martin Eling∗ JEL-Classification: G11, G29
ABSTRACT
Hedge funds have become an increasingly popular investment tool in the past dec-ade, due to their general lack of correlation with stocks and bond markets. When evaluating using the Markowitz portfolio selection theory, hedge funds appear to offer a remarkable opportunity. Yet use of the Markowitz theory neglects three im-portant qualities of hedge funds: the existence of significant autocorrelation, bias, and fat tails. Each of these three issues has been studied individually, but no litera-ture exists in which their combined effect is considered. The purpose of the re-search reported here is to evaluate hedge fund performance incorporating these combined effects. The results indicate that hedge funds lose most of their attrac-tiveness when accounting for the existence of autocorrelation, bias, and fat tails in the evaluation.
1. INTRODUCTION Hedge funds have been subject of much research since the middle of the 1990s. In the literature, hedge fund performance is often evaluated by Markowitz’s port-folio selection theory and by classical performance measures such as the Sharpe ratio, under which hedge funds appear to be very attractive investments (See, e.g., Crerend (1998), pp. 18–25, Ackermann/McEnally/Ravenscraft (1999), pp. 852–853, Liang (1999), pp. 79–81, Cottier (2000), pp. 234–242, Gregori-ou/Rouah (2002), pp. 239–240, and Nicholas (2004), pp. 110–118.). However, recent research has pointed out three problems concerning hedge fund returns, thus making their attractiveness less certain (See, e.g., Asness/Krail/Liew (2001), p. 6, Lo (2001), pp. 20–29, Favre/Galéano (2001), pp. 452–453, Anson (2002), pp. 98–100, Fung/Hsieh (2002), pp. 22–34, and Kat (2003), pp. 72–81.). When hedge fund returns are compared to those of traditional investments, they exhibit * Martin Eling is with the University of St. Gallen (Switzerland) phone: +41 71 243 40 93,
fax: +41 71 243 40 40, E-Mail: [email protected].
2
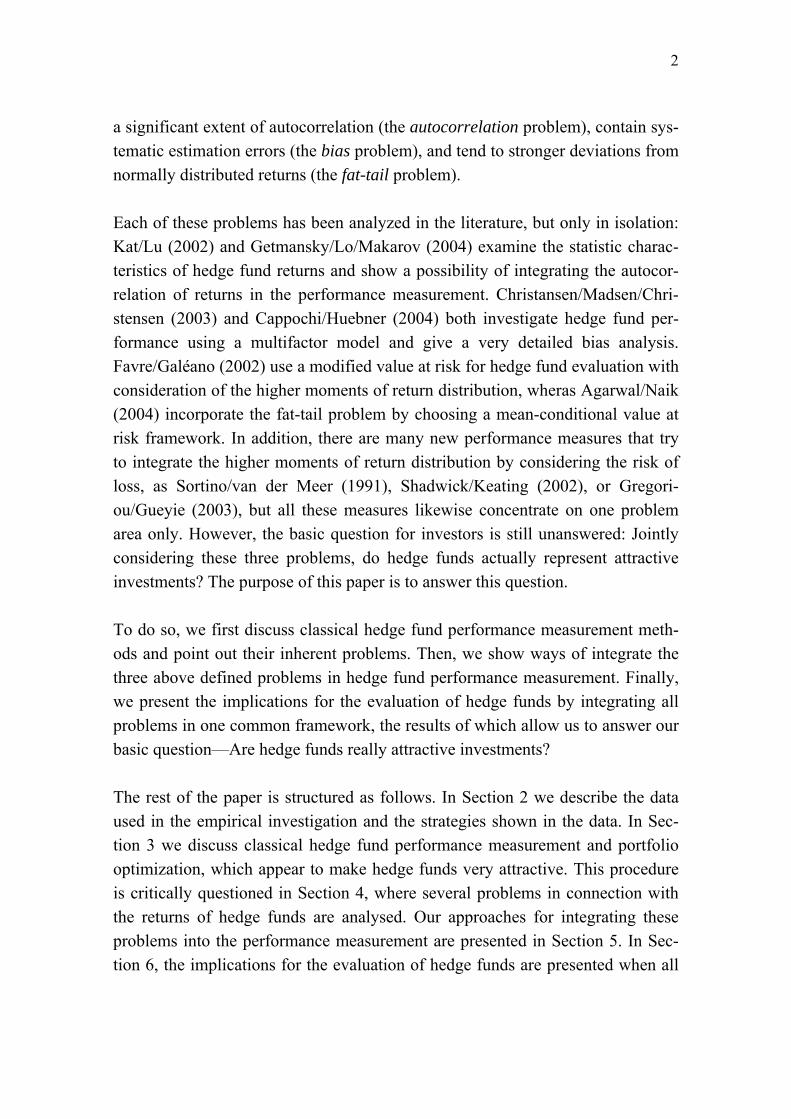
a significant extent of autocorrelation (the autocorrelation problem), contain sys-tematic estimation errors (the bias problem), and tend to stronger deviations from normally distributed returns (the fat-tail problem). Each of these problems has been analyzed in the literature, but only in isolation: Kat/Lu (2002) and Getmansky/Lo/Makarov (2004) examine the statistic charac-teristics of hedge fund returns and show a possibility of integrating the autocor-relation of returns in the performance measurement. Christansen/Madsen/Chri-stensen (2003) and Cappochi/Huebner (2004) both investigate hedge fund per-formance using a multifactor model and give a very detailed bias analysis. Favre/Galéano (2002) use a modified value at risk for hedge fund evaluation with consideration of the higher moments of return distribution, wheras Agarwal/Naik (2004) incorporate the fat-tail problem by choosing a mean-conditional value at risk framework. In addition, there are many new performance measures that try to integrate the higher moments of return distribution by considering the risk of loss, as Sortino/van der Meer (1991), Shadwick/Keating (2002), or Gregori-ou/Gueyie (2003), but all these measures likewise concentrate on one problem area only. However, the basic question for investors is still unanswered: Jointly considering these three problems, do hedge funds actually represent attractive investments? The purpose of this paper is to answer this question. To do so, we first discuss classical hedge fund performance measurement meth-ods and point out their inherent problems. Then, we show ways of integrate the three above defined problems in hedge fund performance measurement. Finally, we present the implications for the evaluation of hedge funds by integrating all problems in one common framework, the results of which allow us to answer our basic question—Are hedge funds really attractive investments? The rest of the paper is structured as follows. In Section 2 we describe the data used in the empirical investigation and the strategies shown in the data. In Sec-tion 3 we discuss classical hedge fund performance measurement and portfolio optimization, which appear to make hedge funds very attractive. This procedure is critically questioned in Section 4, where several problems in connection with the returns of hedge funds are analysed. Our approaches for integrating these problems into the performance measurement are presented in Section 5. In Sec-tion 6, the implications for the evaluation of hedge funds are presented when all

3
three problem areas are analyzed within a common framework. Our conclusions are set out in Section 7. 2. HEDGE FUND DATA AND STRATEGIES In the empirical investigation, we examine monthly returns of the Credit Suisse First Boston/Tremont (CSFB) hedge fund indices over the period from January 1994 to December 2004.1 Various hedge fund strategies are reflected in the hedge fund indices. CSFB places all the hedge funds in three strategy groups de-pending on their risk characteristics. In order of increasing return volatility, these strategies are: market neutral, event driven, and opportunistic. A total of nine individual strategies can be differentiated within the strategy groups. In Table 1, the individual strategies are sorted into the CSFB strategy groups and a brief de-scription of each is provided. TABLE 1: Hedge fund strategies
Strategy Group Strategy Description
Fixed Income Arbi-trage
Identification of mispricings between similar fixed income securities; speculation on price convergence of these securities
Convertible Arbitrage Purchase of undervalued convertible bonds and short selling of the under-lying stocks; speculation on removal of the undervaluation
Market Neu-tral
Equity Market Neutral Exploiting short-term price differences in equity trading; speculation on price convergence for equity portfolios with a similar structure
Distressed Investing in companies that are in financial or operational difficulties; speculation on the continuation of business operations
Event Driven Risk Arbitrage Purchase of takeover candidates’ shares and short selling of the bidding
company shares; speculation on the realization of the takeover
Global Macro Top-down approach; speculation on a fundamental change of the direc-tion in prices of specific asset classes worldwide
Dedicated Short Bias Short selling of overvalued securities; speculation on buying back the securities at a lower price later
Emerging Markets Investing in emerging market countries; speculation on positive economic development in these countries
Opportunistic
Long/Short Equity Bottom-up approach; speculation on increasing prices of undervalued stocks and declining prices of overvalued stocks
In addition to the nine strategies, an aggregated index (CSFB Hedge Fund Index) comprising the performance of all the strategies is considered. This broadly di-versified index is treated as the tenth strategy. The hedge fund indices are com- 1 Since 1999, CSFB has also published investable indices, which cover exclusively open funds. How-
ever, due to the longer time series, we chose the indices that contain both closed and open funds.

4
pared with four market indices; two of them measure equity performance, the other two measure bond performance. Standard & Poor’s (S&P) 500 and Morgan Stanley Capital International (MSCI) World are used as equity indices and J.P. Morgan (JPM) Global Government Bond and Lehman Brothers (LB) Govern-ment/Corporate Bond are the bond indices. Hence we regard two world indices (MSCI World, JPM Global Government Bond) and two indices with a focus on the U.S. capital market (S&P 500, LB Government/Corporate Bond). All indices were calculated on USD basis. Thus the perspective of a U.S. investor is mod-eled. To measure returns from price changes and dividends, we consider per-formance indices. The data was collected from the Datastream database. 3. CLASSIC PERFORMANCE MEASUREMENT AND PORTFOLIO OPTIMIZATION 3.1. HEDGE FUND PERFORMANCE MEASUREMENT Under the concept of risk-adjusted performance measurement, the return is re-lated to a suitable risk measure. In hedge fund performance analysis, the Sharpe ratio is generally chosen as the performance measure and a comparison is made with the Sharpe ratios of other funds or market indices (See, e.g., Acker-mann/McEnally/Ravenscraft (1999), pp. 852–853, Edwards/Liew (1999), pp. 48–49, Liang (1999), pp. 79–81, or Schneeweis/Kazemi/Martin (2002), p. 11.). The Sharpe ratio uses the mean excess return over the risk-free interest rate as a measure of the return and the standard deviation of the returns as a measure of risk. Using historical monthly returns ri1, …, riT for security i, the Sharpe ratio (SR) can be calculated as follows:
i
fdi
i σrrSR −
= . (1)
ri
d = (ri1 + … + riT)/T represents the average monthly return for security i, rf the risk-free monthly interest rate, and σi = (((ri1 – ri
d)2 + … + (riT – rid)2)/(T – 1))0.5
the estimated standard deviation of the monthly return generated by security i. We use the arithmetic mean of discrete returns in order to use these data as input parameters in the following portfolio optimization and value at risk determina-tion. The question of computing arithmetic or geometric averages as well as dis-crete or continuously compounded returns is discussed in the literature with some controversy (see e,g, Ibbotson/Sinquefield (1979), pp. 43–44 for the reasoning behind the choice of the arithmetic mean and see Dorfleitner (2002), pp. 237–238

5
for the reasoning behind the use of discrete returns.). The returns are calculated at the end of each month. A constant risk-free interest rate of 0.35% per month was used. This corresponds to the interest on ten-year U.S. treasury bonds as of 30 Dec. 2003 (4.28% per annum). Alternatively, a rolling interest rate, an average interest rate for the period under consideration, or the interest rate at the begin-ning of the investigation period could be used, which yields almost identical re-sults. The performance measurement results on the basis of the Sharpe ratio are shown in Table 2. TABLE 2: Performance measurement results (Sharpe ratio)
Group Index
Mean Monthly
Return in %
(rid)
Standard Deviation of
Monthly Returns in %
(σi)
Sharpe
Ratio
(SRi)
Aggregated Hedge Fund 0.90 2.35 0.23
Fixed Income Arbitrage 0.56 1.11 0.19
Convertible Arbitrage 0.78 1.35 0.32 Market
Neutral Equity Market Neutral 0.82 0.87 0.54
Distressed 1.09 1.94 0.38 Event
Driven Risk Arbitrage 0.66 1.25 0.25
Global Macro 1.15 3.35 0.24
Dedicated Short Bias -0.18 5.10 –0.10
Emerging Markets 0.73 4.92 0.08
CSFB
Indices
Opportunis-
tic
Long/Short Equity 1.12 5.74 0.13
S&P 500 0.97 4.40 0.14 Stocks
MSCI World 0.75 4.12 0.10
JPM Global Government Bond 0.59 1.84 0.13
Market
Indices Bonds
LB Government/Corporate Bond 0.52 0.99 0.17
On a Sharpe ratio basis, hedge funds yield a better performance than traditional investments; the performance of the aggregated CSFB Hedge Fund Index (0.23) is higher than the maximum performance of the traditional investments (0.17, regarding the LB Government/Corporate Bond Index). 2 Market-neutral and event-driven hedge funds obtain a higher performance than stocks and bonds. 2 We cannot examine the statistic significance in the differences of the Sharpe ratios on the basis of the
widespread Jobson/Korkie (1981) statistic, as this test assumes normally distributed and not autocorre-lated returns. As shown in the following, both conditions usually are not present in the case of hedge funds.

6
The Equity Market Neutral strategy offers by far the best performance. Apart from Global Macro, opportunistic hedge funds show a smaller performance than the other strategy groups—Dedicated Short Bias even has a negative Sharpe ra-tio. Thus, on basis of the Sharpe ratio, it can be concluded that many hedge fund indices exhibit a better performance than traditional investment indices. 3.2. HEDGE FUND PORTFOLIO OPTIMIZATION To examine the portfolio context, we need the correlations of the indices’ returns. Table 3 shows the Bravais/Pearson correlation coefficient of the hedge fund re-turns among themselves as well as compared to stock and bond returns. TABLE 3: Bravais/Pearson correlation coefficient (hedge funds, stocks and bonds)
Index
Hed
ge F
und
Fixe
d In
com
e
Con
verti
ble
Equi
ty M
ar-
Dis
tress
ed
Ris
k
Glo
bal M
acro
Ded
icat
ed
Emer
ging
Long
/Sho
rt
S&P
500
MSC
I Wor
ld
JPM
Glo
bal
LB G
ov./
Hedge Fund
Fixed Income Arbitrage 0.45
Convertible Arbitrage 0.40 0.53
Equity Market Neutral 0.33 0.07 0.32
Distressed 0.57 0.31 0.50 0.33
Risk Arbitrage 0.39 0.13 0.40 0.30 0.56
Global Macro 0.86 0.45 0.29 0.21 0.31 0.13
Dedicated Short Bias -0.48 -0.08 -0.23 -0.33 -0.63 -0.50 -0.13
Emerging Markets 0.65 0.29 0.31 0.22 0.59 0.42 0.41 -0.57
Long/Short Equity 0.38 0.16 0.16 0.27 0.31 0.30 0.15 -0.37 0.33
S&P 500 0.48 0.03 0.13 0.39 0.55 0.45 0.23 -0.76 0.48 0.27
MSCI World 0.47 0.03 0.10 0.35 0.57 0.46 0.18 -0.76 0.53 0.30 0.94
JPM Global Government Bond -0.07 -0.10 -0.10 0.06 -0.06 -0.04 -0.10 0.02 -0.17 -0.01 -0.01 0.07
LB Government/Corporate Bond 0.18 0.12 0.12 0.15 0.03 -0.07 0.26 0.08 -0.06 -0.01 0.00 -0.07 0.60
With the exception of funds using the Dedicated Short Bias strategy, all hedge funds show small positive correlated returns to stocks and bonds (the arithmetic mean in the lower-left quadrant of the correlation matrix is 0.12). With the Dedi-cated Short Bias strategy, the correlation with stock markets is negative. Hedge

7
fund returns also show small positive correlations among themselves (the arith-metic mean in the upper-left quadrant is 0.21). Due to the low correlations, the integration of hedge funds into portfolios of traditional investments seems prom-ising. To see the influence of hedge funds on a portfolio of traditional investments, one can determine portfolio optimization on basis of the standard deviation, which is the classical Markowitz approach (See, e.g., Crerend (1998), pp. 18–25, Cottier (2000), pp. 234–242, and Könberg/Lindberg (2001), pp. 27–28.).3 Figure 1 shows risk, return, and efficient portfolios calculated following the classic Markowitz approach. The right curve is a portfolio of stocks and bonds. The left curve is a portfolio of stocks, bonds, and hedge funds (using, as an example, the CSFB Hedge Fund Index). FIGURE 1: Optimization results (CSFB Hedge Fund Index)
Comparing the right and the left curves, we can see that integrating hedge funds in a portfolio of traditional investments results in a reduction of risk and an im-provement of portfolio performance. Each expected return is achieved with smaller risk. For example, if a return of 0.65% per month is desired, the portfolio risk can be reduced by 23.92% (upper arrow).
3 Formally, the optimization result is as follows. Minimize n n
P i j i j i,ji=1 j=1
σ = x x σ σ k∑∑ , under
nd
P i ii 1
r x r=
= ∑ , ∑=
=n
1ii 1x and 0xi ≥ . Thereby σP denotes the standard deviation of monthly portfolio
returns, Pr the monthly portfolio return, n the number of securities, kij the correlation of security i and j, and xi the fraction of security i in the portfolio. See Markowitz (1952).
0.30%
0.40%
0.50%
0.60%
0.70%
0.80%
0.90%
1.00%
0.00% 1.00% 2.00% 3.00% 4.00% 5.00%Risk (Standard Deviation of Monthly Returns)
Ret
urn
(Mea
n M
onth
ly R
etur
n)
Stocks and Bonds Stocks, Bonds and Hedge Funds
8
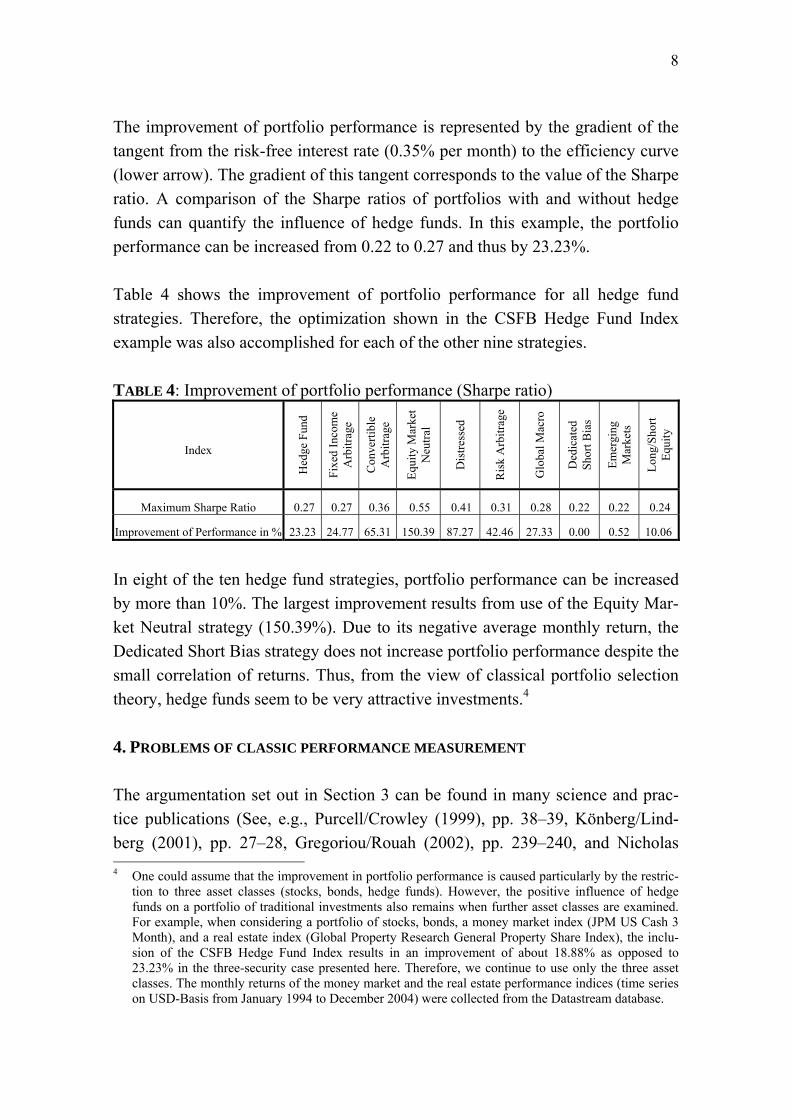
The improvement of portfolio performance is represented by the gradient of the tangent from the risk-free interest rate (0.35% per month) to the efficiency curve (lower arrow). The gradient of this tangent corresponds to the value of the Sharpe ratio. A comparison of the Sharpe ratios of portfolios with and without hedge funds can quantify the influence of hedge funds. In this example, the portfolio performance can be increased from 0.22 to 0.27 and thus by 23.23%. Table 4 shows the improvement of portfolio performance for all hedge fund strategies. Therefore, the optimization shown in the CSFB Hedge Fund Index example was also accomplished for each of the other nine strategies. TABLE 4: Improvement of portfolio performance (Sharpe ratio)
Index
Hed
ge F
und
Fixe
d In
com
e A
rbitr
age
Con
verti
ble
Arb
itrag
e
Equi
ty M
arke
t N
eutra
l
Dis
tress
ed
Ris
k A
rbitr
age
Glo
bal M
acro
Ded
icat
ed
Shor
t Bia
s
Emer
ging
M
arke
ts
Long
/Sho
rt Eq
uity
Maximum Sharpe Ratio 0.27 0.27 0.36 0.55 0.41 0.31 0.28 0.22 0.22 0.24
Improvement of Performance in % 23.23 24.77 65.31 150.39 87.27 42.46 27.33 0.00 0.52 10.06
In eight of the ten hedge fund strategies, portfolio performance can be increased by more than 10%. The largest improvement results from use of the Equity Mar-ket Neutral strategy (150.39%). Due to its negative average monthly return, the Dedicated Short Bias strategy does not increase portfolio performance despite the small correlation of returns. Thus, from the view of classical portfolio selection theory, hedge funds seem to be very attractive investments.4 4. PROBLEMS OF CLASSIC PERFORMANCE MEASUREMENT The argumentation set out in Section 3 can be found in many science and prac-tice publications (See, e.g., Purcell/Crowley (1999), pp. 38–39, Könberg/Lind-berg (2001), pp. 27–28, Gregoriou/Rouah (2002), pp. 239–240, and Nicholas 4 One could assume that the improvement in portfolio performance is caused particularly by the restric-
tion to three asset classes (stocks, bonds, hedge funds). However, the positive influence of hedge funds on a portfolio of traditional investments also remains when further asset classes are examined. For example, when considering a portfolio of stocks, bonds, a money market index (JPM US Cash 3 Month), and a real estate index (Global Property Research General Property Share Index), the inclu-sion of the CSFB Hedge Fund Index results in an improvement of about 18.88% as opposed to 23.23% in the three-security case presented here. Therefore, we continue to use only the three asset classes. The monthly returns of the money market and the real estate performance indices (time series on USD-Basis from January 1994 to December 2004) were collected from the Datastream database.
9
(2004), pp. 110–118.). However, recent literature has pointed out that there are several problems with hedge fund performance measurement: The returns of the hedge funds are autocorrelated, systematically distorted, and deviate from nor-mally distributed returns. In the following, we provide a short overview of each of these problems, beginning with the autocorrelation problem.
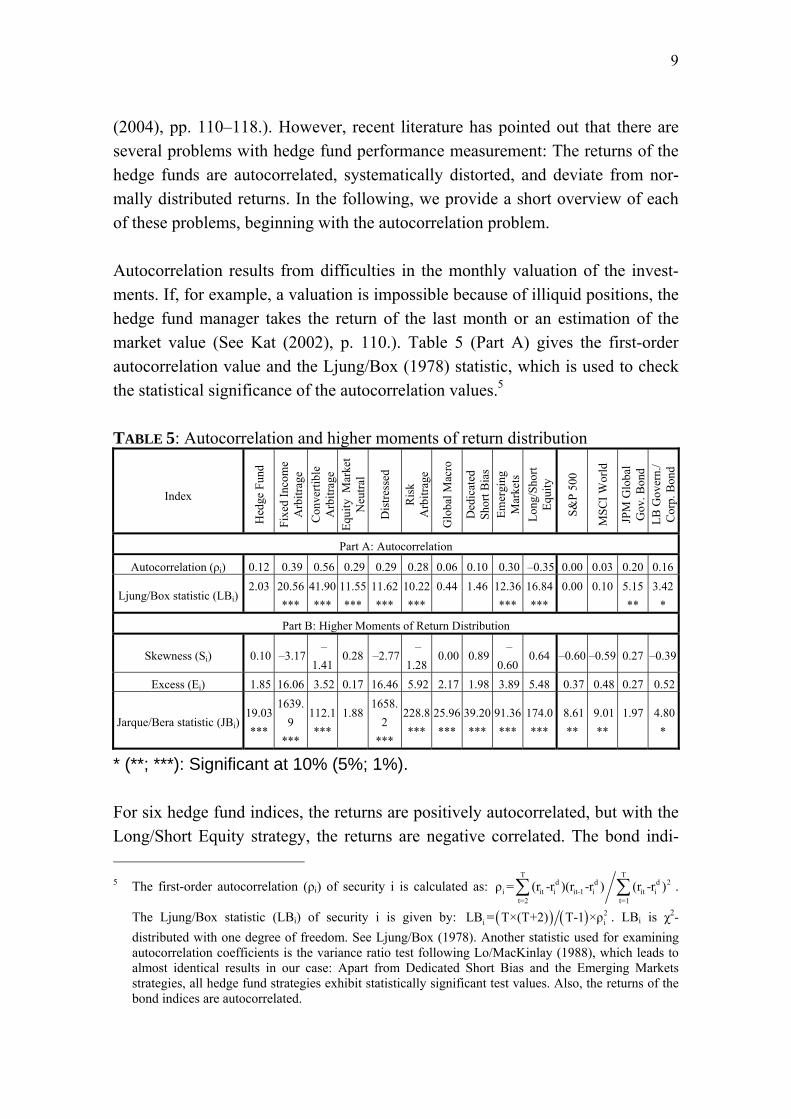
Autocorrelation results from difficulties in the monthly valuation of the invest-ments. If, for example, a valuation is impossible because of illiquid positions, the hedge fund manager takes the return of the last month or an estimation of the market value (See Kat (2002), p. 110.). Table 5 (Part A) gives the first-order autocorrelation value and the Ljung/Box (1978) statistic, which is used to check the statistical significance of the autocorrelation values.5 TABLE 5: Autocorrelation and higher moments of return distribution
Index
Hed
ge F
und
Fixe
d In
com
e A
rbitr
age
Con
verti
ble
Arb
itrag
e Eq
uity
Mar
ket
Neu
tral
Dis
tress
ed
Ris
k A
rbitr
age
Glo
bal M
acro
Ded
icat
ed
Shor
t Bia
s Em
ergi
ng
Mar
kets
Lo
ng/S
hort
Equi
ty
S&P
500
MSC
I Wor
ld
JPM
Glo
bal
Gov
. Bon
d LB
Gov
ern.
/ C
orp.
Bon
d
Part A: Autocorrelation
Autocorrelation (ρi) 0.12 0.39 0.56 0.29 0.29 0.28 0.06 0.10 0.30 –0.35 0.00 0.03 0.20 0.16
Ljung/Box statistic (LBi)2.03
20.56 ***
41.90***
11.55***
11.62***
10.22***
0.44
1.46
12.36***
16.84***
0.00
0.10
5.15 **
3.42*
Part B: Higher Moments of Return Distribution
Skewness (Si) 0.10 –3.17 –
1.410.28 –2.77
–1.28
0.00 0.89 –
0.600.64 –0.60 –0.59 0.27 –0.39
Excess (Ei) 1.85 16.06 3.52 0.17 16.46 5.92 2.17 1.98 3.89 5.48 0.37 0.48 0.27 0.52
Jarque/Bera statistic (JBi)19.03 ***
1639.9
***
112.1***
1.88
1658.2
***
228.8***
25.96***
39.20***
91.36***
174.0***
8.61 **
9.01 **
1.97
4.80*
* (**; ***): Significant at 10% (5%; 1%). For six hedge fund indices, the returns are positively autocorrelated, but with the Long/Short Equity strategy, the returns are negative correlated. The bond indi- 5 The first-order autocorrelation (ρi) of security i is calculated as:
T Td d d 2
i it i it-1 i it it=2 t=1
ρ = (r -r )(r -r ) (r -r )∑ ∑ .
The Ljung/Box statistic (LBi) of security i is given by: ( ) ( ) 2i iLB = T×(T+2) T-1 ×ρ . LBi is χ2-
distributed with one degree of freedom. See Ljung/Box (1978). Another statistic used for examining autocorrelation coefficients is the variance ratio test following Lo/MacKinlay (1988), which leads to almost identical results in our case: Apart from Dedicated Short Bias and the Emerging Markets strategies, all hedge fund strategies exhibit statistically significant test values. Also, the returns of the bond indices are autocorrelated.

10
ces’ returns are also autocorrelated, but to smaller extent than the hedge fund re-turns. What are the consequences of this autocorrelation for performance meas-urement? Autocorrelation leads to an underestimation of the standard deviation of returns (See Asness/Krail/Liew (2001), p. 10.). Thus, the Sharpe ratio is over-estimated (See Lo (2002), p. 37.). The database of the hedge fund indices exhibits systematic distortions (the so-called bias problem), which can affect the measurement result in the sense that index returns are too high (See Ackermann/McEnally/Ravenscraft (1999), pp. 863–865.). Two forms of this distortion can be distinguished: the survivorship bias and the backfilling bias.6 Survivorship bias arises because an index only considers viable funds. Unsuc-cessful funds that have been discontinued, perhaps due to bad performance, and removed from the database are not considered. Thus, the database gives an unre-alistically positive picture. Backfilling bias exists because many hedge fund data providers integrate past returns of new funds in their databases. However, only successful funds have an incentive to report past performance. Thus this backfilling again leads to an unre-alistically positive representation. It should be noted that CSFB does not backfill, so this sort of bias is not a feature of the CSFB indices. The fact that hedge funds use derivative instruments leads to an asymmetric re-turn distribution and fat tails. Thus one cannot assume that hedge fund returns are normally distributed. Returns are not normally distributed if the higher moments (skewness and excess) deviate from zero. For a risk-averse investor, negative skewness and positive excess kurtosis are unattractive because they generally indicate a higher probability of large losses than in the case of normally distrib-uted returns (See Kat (2003), p. 75 and Favre/Signer (2002), p. 35.). Using the Jarque/Bera (1987) statistic, we check whether the observed values of skewness
6 Additionally, there are three further forms of bias (selection, liquidation, and double counting) that are
not considered here because they could not be quantified in a bias investigation yet. See Lhabitant (2002), pp. 133–136.

11
and excess are consistent with the normal distribution assumption. The values of skewness, excess, and the Jarque/Bera statistic are shown in Part B of Table 5.7 The returns of six of the ten hedge fund indices display the unattractive combi-nation of negative skewness and positive excess kurtosis. This combination also occurs for three of the four market indices, but their values for skewness and ex-cess kurtosis are less extreme than those shown for the hedge funds. On the basis of the Jarque/Bera statistic, the assumption of normally distributed hedge fund returns is valid only for the Equity Market Neutral strategy. However, it is not only the hedge fund indices that display these characteristics; the monthly returns of the S&P 500 and MSCI-World also fail to display a normal distribution. The higher moments of the return distribution are not considered in the Sharpe ratio or in the Markowitz approach. Thus, the higher probability of large losses is faded out for some hedge funds and their risk is possibly underestimated. 5. INTEGRATING THE PROBLEMS IN THE PERFORMANCE MEASUREMENT We now present approaches to integrate the above-described performance meas-urement problems. Again, we start with the autocorrelation problem. An easy way of integrating autocorrelation is to calculate the standard deviation not on basis of monthly returns but on the basis of quarterly returns (See As-
7 The skewness (Si) and excess (Ei) of security i are given by 3i
T
1t
3diiti σ)r(r
T1S ⎟
⎟⎠
⎞⎜⎜⎝
⎛−= ∑
=
and
3σ)r(rT1E 4
i
T
1t
4diiti −⎟
⎟⎠
⎞⎜⎜⎝
⎛−= ∑
=
. The Jarque/Bera statistic (JBi) of security i is:
)E41(S
6TJB 2
i2ii += . See Jarque/Bera (1987). JBi ist χ2-distributed with two degrees of freedom.
Again, a second test was consulted—the modified Jarque/Bera statistic following Urzua (1996). After this test, only the returns of Equity Market Neutral and the JPM Global Government Bond index are compatible with a normal distribution assumption.
12
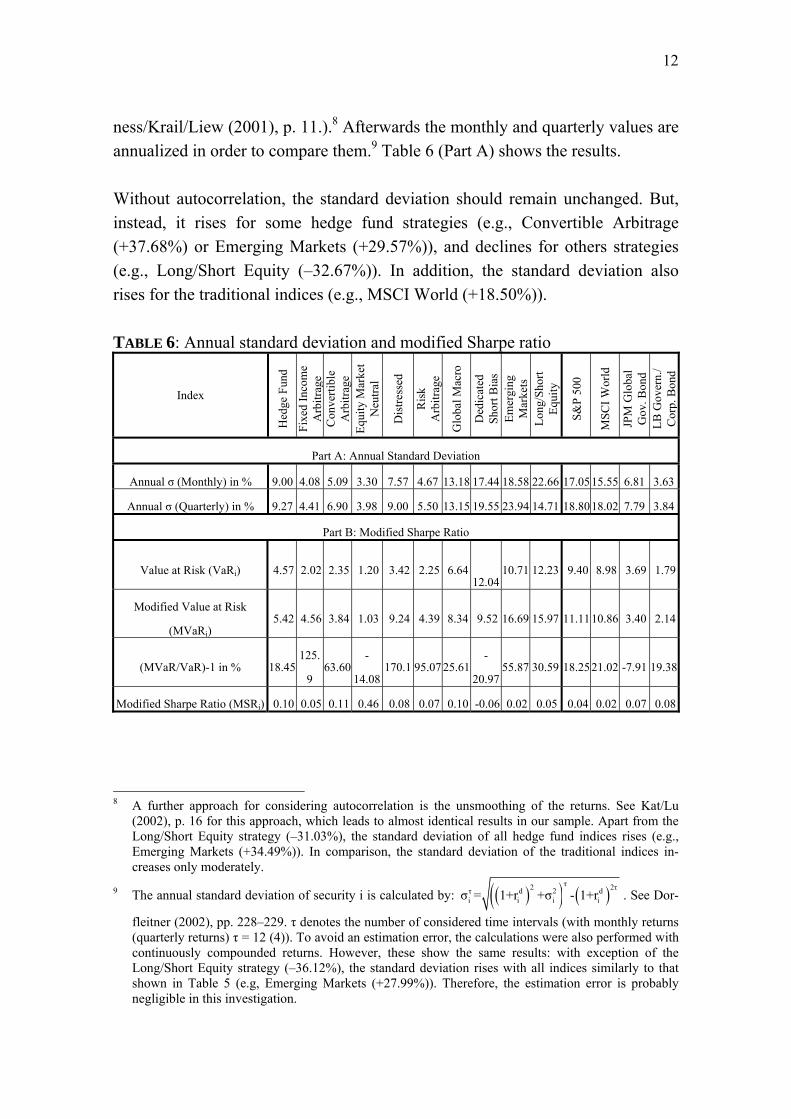
ness/Krail/Liew (2001), p. 11.).8 Afterwards the monthly and quarterly values are annualized in order to compare them.9 Table 6 (Part A) shows the results. Without autocorrelation, the standard deviation should remain unchanged. But, instead, it rises for some hedge fund strategies (e.g., Convertible Arbitrage (+37.68%) or Emerging Markets (+29.57%)), and declines for others strategies (e.g., Long/Short Equity (–32.67%)). In addition, the standard deviation also rises for the traditional indices (e.g., MSCI World (+18.50%)). TABLE 6: Annual standard deviation and modified Sharpe ratio
Index
Hed
ge F
und
Fixe
d In
com
e A
rbitr
age
Con
verti
ble
Arb
itrag
e Eq
uity
Mar
ket
Neu
tral
Dis
tress
ed
Ris
k A
rbitr
age
Glo
bal M
acro
Ded
icat
ed
Shor
t Bia
s Em
ergi
ng
Mar
kets
Lo
ng/S
hort
Equi
ty
S&P
500
MSC
I Wor
ld
JPM
Glo
bal
Gov
. Bon
d LB
Gov
ern.
/ C
orp.
Bon
d
Part A: Annual Standard Deviation
Annual σ (Monthly) in % 9.00 4.08 5.09 3.30 7.57 4.67 13.18 17.44 18.58 22.66 17.05 15.55 6.81 3.63
Annual σ (Quarterly) in % 9.27 4.41 6.90 3.98 9.00 5.50 13.15 19.55 23.94 14.71 18.80 18.02 7.79 3.84
Part B: Modified Sharpe Ratio
Value at Risk (VaRi) 4.57 2.02 2.35 1.20 3.42 2.25 6.64
12.0410.71 12.23 9.40 8.98 3.69 1.79
Modified Value at Risk
(MVaRi) 5.42 4.56 3.84 1.03 9.24 4.39 8.34 9.52 16.69 15.97 11.11 10.86 3.40 2.14
(MVaR/VaR)-1 in % 18.45 125.
9 63.60
-
14.08170.1 95.07 25.61
-
20.9755.87 30.59 18.25 21.02 -7.91 19.38
Modified Sharpe Ratio (MSRi) 0.10 0.05 0.11 0.46 0.08 0.07 0.10 -0.06 0.02 0.05 0.04 0.02 0.07 0.08
8 A further approach for considering autocorrelation is the unsmoothing of the returns. See Kat/Lu
(2002), p. 16 for this approach, which leads to almost identical results in our sample. Apart from the Long/Short Equity strategy (–31.03%), the standard deviation of all hedge fund indices rises (e.g., Emerging Markets (+34.49%)). In comparison, the standard deviation of the traditional indices in-creases only moderately.
9 The annual standard deviation of security i is calculated by: ( )( ) ( )τ2 2ττ d 2 d
i i i iσ = 1+r +σ - 1+r . See Dor-
fleitner (2002), pp. 228–229. τ denotes the number of considered time intervals (with monthly returns (quarterly returns) τ = 12 (4)). To avoid an estimation error, the calculations were also performed with continuously compounded returns. However, these show the same results: with exception of the Long/Short Equity strategy (–36.12%), the standard deviation rises with all indices similarly to that shown in Table 5 (e.g, Emerging Markets (+27.99%)). Therefore, the estimation error is probably negligible in this investigation.
13
The systematic distortion of the database (bias problem) cannot be eliminated retrospectively. To consider it nevertheless, the results from investigation of the bias problem are used to estimate the distortion of the database. Estimations of survivorship bias range from 0.01 to 0.36 percentage points and are on average about 0.18 percentage points per month.10 However, Liang (2000) points out that the estimated bias values differ within different hedge fund databases. The aver-age survivorship bias in six investigations of the CSFB database amounts to 0.21 percentage points per month.11 The estimations of backfilling bias range from 0.00 to 0.12 percentage points and are on average about 0.08 percentage points per month.12 As there is no backfilling bias for CSFB, only the survivorship bias must be considered in our investigation.13/14
To integrate the fat-tail problem in the performance measurement, a risk measure that shows the skewness and excess of the return distribution is needed. Such a measure is the modified value at risk presented by Favre/Galéano (2002). There-
10 This average value results from arithmetic mean of the estimated values from 16 investigations of the
survivorship bias problem. We used Ackermann/McEnally/Ravenscraft (1999), p. 867 (0.01 percent-age points per month), Ammann/Moerth (2005), p. 22 (0.20), Amin/Kat (2003), p. 65 (0.17), Baquero/Ter Horst/Verbeek (2004), p. 14 (0.17), Barès/Gibson/Gyger (2001), p. 16 (0.11), Barry (2003), p. 8 (0.31), Brown/Goetzmann/Ibbotson (1999), p. 103 (0.25), Capocci/Hübner (2004), p. 63 (0.36), Edwards/Caglayan (2001), p. 1007 (0.15), Edwards/Liew (1999), p. 47 (0.16), Fung/Hsieh (2000), p. 297 (0.25), Liang (1999), p. 83 (0.07), Liang (2000), p. 313 (0.05 and 0.18), Liang (2001), p. 14 (0.20), Liang (2003), p. 11 (0.19), and Schneeweis/Kazemi/Martin (2002), p. 14 (0.18). In these investigations, the survivorship bias is partially estimated on the basis of continuously compounded returns instead of discrete returns and partially on yearly basis instead of on monthly basis. However, using logarithm and annualization, all values were transferred into discrete monthly returns.
11 See Ammann/Moerth (2005), p. 22 (0.20 percentage points per month), Amin/Kat (2003), p. 65 (0.17), Baquero/Ter Horst/Verbeek (2004), p. 14 (0.17), Barry (2003), p. 8 (0.31), Fung/Hsieh (2000), p. 297 (0.25), Liang (2000), p. 313 (0.18), and Liang (2001), p. 14 (0.20).
12 This average value results from the arithmetic mean of the estimated values from five investigations of the backfilling bias problem. We used Ackermann/McEnally/Ravenscraft (1999), p. 868 (0.00 per-centage points per month), Barry (2003), p. 7 (0.12), Capocci/Hübner (2004), p. 66 (0.07), Ed-wards/Caglayan (2001), p. 1007 (0.10), and Fung/Hsieh (2000), p. 298 (0.12). Again, all values were transferred into discrete monthly returns by logarithm and annualization.
13 See Christiansen/Madsen/Christensen (2003), which correct the hedge fund returns by about 0.25 percentage points per month. Liang (2000), p. 322–325 and Edwards/Gaglayan (2001), p. 1007 point out that the distortion can differ between different hedge fund strategies. In addition, Ammann/Moerth (2005), pp. 8–9 show that the distortion can differ between small and large funds. However, a docu-mentation of the distortion for different strategies or fund size is not possible here due to missing data.
14 Also, a distortion of the traditional mutual funds might occur, as Brown/Goetzmann (1995), Brown/Goetzmann/Ibbotson/Ross (1992), Fung/Hsieh (1997), and Grinblatt/Titman (1989) determine a survivorship bias of on average 0.06 percentage points per month with traditional mutual funds. However, a distortion of traditional indices should be even smaller, since the annual mortality rate is generally smaller than that of mutual funds, that is, fewer securities are excluded from an index than mutual funds from a database. See Lhabitant (2004), p. 91. Therefore, a distortion of traditional indi-ces is not considered here.

14
fore, in the well-known formula for the standard value at risk (VaR; w denotes the value of the investment), d
i α i iVaR (z σ r ) w= − + , (2) the alpha-quantile of the standard normal distribution zα is replaced by the value of the Cornish-Fisher expansion zCF: d
i CFi i iMVaR (z σ r ) w= − + . (3) The value of the Cornish-Fisher expansion is calculated as the alpha-quantile of the standard normal distribution plus some terms that adjust for skewness and
excess ( 2iα
3αiα
3αi
2ααiCF S)z5-z(2
361-E)z3-(z
241S1)-(z
61zz ++= ). Next,
we follow Gregoriou/Gueyie (2003) and calculate a modified Sharpe ratio (MSR), in which the standard deviation is replaced by the modified value at risk:15
di f
ii
r -rMSR =MVaR
. (4)
The results of the standard value at risk, the modified value at risk, and the modi-fied Sharpe ratio are given in Part B of Table 6, where the value at risk is calcu-lated for a confidence level of 1% (zα = -2,326) and w = 100 USD. We also show the change in risk by comparing the value at risk in the standard and the modified versions. The risk of the hedge funds is much higher with the modified value at risk. For the Fixed Income Arbitrage strategy, the risk increases by 126%; the Distressed strategy incurs a risk increase of 170%. In contrast, risk rises only moderately for the market indices. The modified Sharpe ratio relativizes the outperformance of hedge funds in relation to stocks and bonds. For example, the Distressed strategy is not in second place now, but has dropped to being only the fifth best Sharpe ratio out of the 14 indices. Nevertheless, hedge funds still obtain a higher per-formance than stocks and bonds. The modified Sharpe ratio of the aggregated 15 Since the average monthly return enters the denominator of the modified Sharpe ratio, the modified
Sharpe ratio can lead to another sequence in the evaluation of different investments than the Sharpe ratio (also with normally distributed returns). Hence both numbers are very similar, but not directly transferable.

15
hedge fund index amounts to 0.10, in comparison to 0.08, the maximum for the traditional investments.16 6. IMPLICATIONS FOR THE EVALUATION OF HEDGE FUNDS 6.1. ADJUSTED HEDGE FUND PERFORMANCE MEASUREMENT The three problems—autocorrelation, bias, and fat tails—have to date only been considered in isolation. Thus, it still is not clear whether hedge funds are attrac-tive investments considering all three problems together. To answer this ques-tion, we now examine all three problems in one common framework. To do this, we use a three-step approach. First, the autocorrelation problem is mitigated by using the standard deviation based on quarterly returns instead of monthly returns. The recalculated version of the annual standard deviation of quarterly returns on a monthly basis is called the adjusted standard deviation (σA
i). Therefore, the annual standard deviation (on a quarterly basis) is divided by the root of 12. Second, the bias problem is dealt with by reducing the hedge fund returns using the estimated bias adjustment of 0.21 percentage points per month. The reduced monthly returns are denoted as adjusted monthly returns (rA i
d). As an intermediate step, we can now calculate an adjusted Sharpe ratio, given as ASRi = (rA i
d-rf)/σA i based on the adjusted monthly returns and their standard de-viation, which incorporates autocorrelation and bias in the hedge fund perform-ance measurement. Finally, the fat-tail problem is integrated by calculating the modified Sharpe ratio on the basis of the adjusted monthly returns and their stan-dard deviation. This ratio is called the adjusted modified Sharpe ratio and is cal-culated as AMSRi = (rA i
d-rf)/AMVaRi, with AMVaRi = - (zCF i σA i + rA id) w. The
results of this adjusted performance measurement are shown in Table 7.
16 These results depend on the given confidence level, since the confidence level determines (over the
Cornish-Fisher expansion) the influence of the higher moments on the modified value at risk. If the confidence level is reduced, e.g., from 99% to 97.5% (95%), the difference in the modified Sharpe ra-tio of the CSFB Hedge Fund Index to the LB Government/Corporate Bond Index expands 0.14 to 0.10 (0.19 to 0.14). In the literature, the modified value at risk is evaluated only for a confidence level of 95% or 99%. See Favre/Galéano (2002), Favre/Signer (2002), Gregoriou/Guyie (2003), and Grego-riou (2004). An analysis of lower confidence levels is generally not meaningful, since the higher moments of the return distribution then usually only cause small changes of the value at risk.

16
TABLE 7: Performance measurement results (adjusted modified Sharpe ratio)
Group Index
Adjusted Mean Monthly
Return in % (rA i
d)
Adjusted Stan-dard Deviation
of Monthly Returns in %
(σA i)
Adjusted Sharpe Ratio
(ASRi)
Adjusted Modified
Sharpe Ratio(AMSRi)
Aggregated Hedge Fund 0.69 2.67 0.13 0.05 Fixed Income Arbitrage 0.34 1.27 –0.01 0.00 Convertible Arbitrage 0.57 1.99 0.11 0.03
Market Neutral
Equity Market Neutral 0.61 1.15 0.23 0.14 Distressed 0.87 2.60 0.20 0.04 Event
Driven Risk Arbitrage 0.45 1.59 0.06 0.02 Global Macro 0.93 3.80 0.15 0.06
Dedicated Short Bias –0.39 5.64 –0.13 –0.07
Emerging Markets 0.52 6.91 0.02 0.01
CSFB Indices
Opportunis-tic
Long/Short Equity 0.90 4.25 0.13 0.05
S&P 500 0.97 5.43 0.12 0.05 Stocks
MSCI World 0.75 5.20 0.08 0.03 JPM Global Gov. Bond 0.59 2.25 0.11 0.06
Market Indices
Bonds LB Gov./Corporate Bond 0.52 1.11 0.15 0.07
Table 7 shows that the adjusted Sharpe ratio (i.e. considering the autocorrelation and bias problem) leads to much lower outperformance of hedge funds as com-pared to traditional investments. For example, there are only three strategies that obtain a higher performance than stocks and bonds (Equity Market Neutral, Dis-tressed, Global Macro versus LB Government/Corporate Bond). This effect is heightened when additionally considering the fat-tail problem, thus viewing the adjusted modified Sharpe ratio, as the aggregated CSFB Hedge Fund Index no longer exceeds the maximum of traditional investments (0.07). Furthermore, Eq-uity Market Neutral is the only strategy that obtains a higher performance than traditional investments. Thus, for most strategies, the largest part of the original outperformance disappears when considering autocorrelation, bias, and fat tails.17
17 The results again depend on the given confidence level. If the confidence level is reduced from 99% to
97.5% (95%), the adjusted modified Sharpe ratio of the CSFB Hedge Fund Index and of the LB Gov-ernment/Corporate Bond Index increases to 0.07 (0.09) and 0.09 (0.12). However, in no case can an outperformance of hedge funds against stocks and bonds be observed.
17
6.2. ADJUSTED HEDGE FUND PORTFOLIO OPTIMIZATION To transfer these adjustments to the portfolio framework, we perform a portfolio optimization on basis of an adjusted modified value at risk. The adjusted modi-fied value at risk results from the modified value at risk calculated with the ad-justed returns and the adjusted standard deviations. To compare the new optimi-zation with the results of Section 3, we perform a portfolio optimization on basis of the standard value at risk in the first step. The second step then is an optimiza-tion on the basis of the adjusted modified value at risk. Therefore, the classical Markowitz objective function (minimize the portfolio standard deviation) is re-placed by minimization of the portfolio value at risk (first step) and the portfolio adjusted modified value at risk (second step).18 The results of the first optimiza-tion are almost identical to the results of Section 3.19 In particular, none of the problem areas described in Section 4 are taken into consideration. However, the second optimization (based on the adjusted modified value at risk) integrates autocorrelation, bias, and fat tails.20 This procedure emphasizes two aspects of hedge fund performance. On the one hand, comparison of the efficiency curves, one based on the standard value at risk and the other on the adjusted modified value at risk, shows the change in portfolio risk that is due to the three problems of hedge fund performance meas-urement. On the other hand, comparison of efficiency curves based on the ad-justed modified value at risk with and without hedge funds addresses the ques-tion of whether the performance of a traditional investment portfolio will still be improved by the addition of hedge funds even after taking into account autocor-
18 Contrary to the classical Markowitz optimization, the portfolio value at risk cannot be determined
directly from the value at risk and the correlation of the individual securities. Instead, we first calcu-late portfolio returns depending on the security fractions xi for each point of time (t = 1 ..., T) and then calculate the value at risk of this portfolio return time series, which must be minimized. The minimum adjusted modified value at risk is therefore calculated by: ( )PP CF A P A PAMVaR z σ r w Min!= − + → ,
under n
dA P i A i
i 1r x r
=
= ∑ , ∑=
=n
1ii 1x and 0xi ≥ . Thereby
PCF z denotes the value of the Cornish-Fisher
expansion of the portfolio, A Pσ is the portfolio standard deviation, A Pr the portfolio return, n the number of securities, and xi the portfolio fraction of security i.
19 The first optimization is a transformation of the classical Markowitz optimization into a dimension uniform with the second optimization. This does not offer additional information, but allows us to compare the results of both calculations. The results are almost identical, since with the value at risk the returns of the securities are considered. See Equation (2).
20 See, for this procedure, Signer (2003), pp. 107–114, who only integrates the fat-tail problem into the performance evaluation.

18
relation, bias, and fat tails. Figure 2 shows the efficiency curves of portfolios consisting of stocks and bonds and portfolios consisting of stocks, bonds, and hedge funds (again using as an example the CSFB Hedge Fund Index). FIGURE 2: Optimization results (CSFB Hedge Fund Index)
The efficiency curves that result from portfolio optimization based on the ad-justed modified value at risk run congruently and lie to the right of the efficiency curves based on the standard value at risk. This has two important implications. First, portfolio risk increases when autocorrelation, bias, and fat tails are taken into account. With an expected return of 0.65%, the risk of the stock and bond portfolio increases about 3.38%. In contrast, the risk of the portfolio containing hedge funds rises about 46.74% (see arrow). Second, integrating hedge funds into this portfolio does not result in a reduction of portfolio risk and does not im-prove portfolio performance, as the efficiency curve remains unchanged in the adjusted framework. To quantify the influence of hedge funds on the portfolio, the adjusted modified Sharpe ratio of portfolios with and without hedge funds is compared. This com-parison shows that the performance of the stock and bond portfolio (0.12) cannot be improved by adding hedge funds to it. Thus, the original outperformance of the portfolio with hedge funds as compared to the portfolio without hedge funds disappears when autocorrelation, bias, and fat tails are taken into account.
0.30%
0.40%
0.50%
0.60%
0.70%
0.80%
0.90%
1.00%
0.00 2.00 4.00 6.00 8.00 10.00 12.00 14.00Risk (Value at Risk, Adjusted Modified Value at Risk)
Ret
urn
(Mea
n M
onth
ly R
etur
n)
Stocks and Bonds (Value at Risk)Stocks and Bonds (Adjusted Modified Value at Risk)Stocks, Bonds and Hedge Funds (Value at Risk)Stocks, Bonds and Hedge Funds (Adjusted Modified Value at Risk)

19
Similar to Table 4, Table 8 shows the improvement in portfolio performance on basis of the adjusted modified Sharpe ratio for all ten hedge fund strategies. The last row of the table compares the improvement in portfolio performance to port-folio optimization on basis of the standard deviation. TABLE 8: Improvement of portfolio performance (adjusted modified Sharpe ra-tio)
Inde
x
Hed
ge F
und
Fixe
dInc
ome
Arb
itrag
e
Con
verti
ble
Arb
itrag
e
Equi
ty M
arke
t N
eutra
l
Dis
tress
ed
Ris
k A
rbitr
age
Glo
bal M
acro
Ded
icat
ed
Shor
t Bia
s
Emer
ging
M
arke
ts
Long
/Sho
rt Eq
uity
Maximum AMSRi 0.12 0.12 0.13 0.17 0.14 0.12 0.13 0.12 0.12 0.12
Improvement of Performance in % 0.00 0.00 2.29 35.22 12.65 0.05 3.25 0.00 0.11 0.00 Change from Table 4 in % Points –23.23 –24.77 –63.02 –115.17 –74.62 –42.42 –24.09 0.00 –0.41 –10.06
Using the adjusted modified Sharpe ratio again leads to a relativization of hedge fund outperformance. For nine strategies, the improvement in portfolio perform-ance is reduced. Only two strategies (Equity Market Neutral and Distressed) can improve performance by more than 10%. Five strategies (Hedge Fund, Fixed Income Arbitrage, Risk Arbitrage, Dedicated Short Bias, Emerging Markets) have no considerable effect on the efficiency curve. The Equity Market Neutral strategy is the only exception to these findings: it can increase portfolio perform-ance by about 35.22%. Thus, in general, the positive influence of hedge funds in traditional investment portfolios is narrowed after taking autocorrelation, bias, and fat tails into account. 7. SUMMARY A true evaluation of hedge fund performance requires consideration of autocor-relation, bias, and fat tails. We provide such an evaluation and discover that the majority of hedge funds lose their attractiveness. This is illustrated by comparing the classical Sharpe ratio to an adjusted version of the modified Sharpe ratio pro-posed by Gregoriou/Gueyie (2003). An exeption is the Equity Market Neutral strategy, which exhibits a high performance even after adressing all three of these qualities. Therefore, only few hedge fund strategies appear to be attractive in-vestment options.

20
REFERENCES
Ackermann, C., McEnally, R. and Ravenscraft, D. 1999, The Performance of Hedge Funds: Risk, Return, and Incentives. Journal of Finance, 54(3), 833–874.
Agarwal, V. and Naik, N. Y. 2004, Risk and Portfolio Decisions Involving Hedge Funds. Review of Financial Studies, 17(1), 63–98.
Ammann, M. and Moerth, P. 2005, Impact of Fund Size on Hedge Fund Perform-ance. Working Paper Series in Finance Paper No. 11, University of St. Gallen. Forthcoming in Journal of Asset Management.
Amin, G. S. and Kat, H. M. 2003, Welcome to the Dark Side—Hedge Fund Attri-tion and Survivorship Bias Over the Period 1994–2001. Journal of Alternative Investments, 6(1), 57–73.
Anson, M. J. P. 2002, Handbook of Alternative Assets. New York. Asness, C., Krail, R. and Liew, J. 2001, Do Hedge Funds Hedge? Journal of Port-
folio Management, 28(1), 6–19. Banz, R. W. and de Planta, R. 2002, Hedge Funds: All that Glitters is not Gold—
Seven Questions for Prospective Investors. Financial Markets and Portfolio Management, 16(3), 316–336.
Baquero, G., Ter Horst, J. and Verbeek, M. 2004, Survival, Look-Ahead Bias and the Performance of Hedge Funds. Working Paper, Department of Financial Management and Econometric Institute, Erasmus University Rotterdam.
Barés, P-A., Gibson, R. and Gyger, S. 2003, Performance in the Hedge Funds Industry: An Analysis of Short and Long-Term Performance. Journal of Alter-native Investments, 6(3), 25–41.
Barry, R. 2003, Hedge Funds: A Walk Through the Graveyard. Research Paper No. 25, Applied Finance Centre, Macquarie University, North Ryde Sydney.
Brown, St. J. and Goetzmann, W. N. 1995, Performance Persistence. Journal of Finance, 50(2), 679–698.
Brown, St. J. Goetzmann, W. N. and Ibbotson, R. G. 1999, Offshore Hedge Funds: Survival and Performance 1989–1995. Journal of Business, 72(1), 91–117.
Brown, St. J., Goetzmann, W. N., Ibbotson, R. G. and Ross, St. A. 1992, Survivor-ship Bias in Performance Studies. Review of Financial Studies, 5(4), 553–580.
21
Capocci, D. and Hübner, G. 2004, Analysis of Hedge Fund Performance. Journal of Empirical Finance, 11(1), 55–89.
Center for International Securities and Derivatives Markets 2005, CISDM Bibliog-raphy. URL: http://cisdm.som.umass.edu [Accessed on October 6, 2005].
Christiansen, C. B., Madsen, P. B. and Christensen, M. 2003, Further Evidence on Hedge Fund Performance. Working Paper, Department of Finance, Aarhus School of Business.
Cottier, Ph. 2000 Hedge Funds and Managed Futures, 3rd ed. Bern/Stuttgart/Wien.
Crerend, W. J. 1998, Fundamentals of Hedge Fund Investing. New York et al. Dorfleitner, G. 2002, Stetige versus diskrete Renditen: Überlegungen zur richtigen
Verwendung beider Begriffe in Theorie und Praxis. Kredit und Kapital, 35(2), 216–241.
Edwards, F. R.and Caglayan, M. O. 2001, Hedge Fund Performance and Manager Skill. Journal of Futures Markets, 21(11), 1003–1028.
Edwards, F. R. and Liew, J. 1999, Hedge Funds Versus Managed Futures as Asset Classes. Journal of Derivatives, 6(4), 45–64.
Favre, L. and Galéano, J-A. 2002, Mean-Modified Value-at-Risk Optimization with Hedge Funds. Journal of Alternative Investments, 5(2), 21–25.
Favre, L. and Signer, A. 2002, The Difficulties of Measuring the Benefits of Hedge Funds. Journal of Alternative Investments, 5(1), 31–42.
Fung, W. and Hsieh, D. A. 1997, Survivorship Bias and Investment Style in the Returns of CTAs. Journal of Portfolio Management, 24(1), 30–41.
Fung, W. and Hsieh, D. A. 2000, Performance Characteristics of Hedge Funds and Commodity Funds: Natural vs. Spurious Biases. Journal of Financial and Quantitative Analysis, 35(3), 291–307.
Fung, W. and Hsieh, D. A. 2002, Hedge-Fund Benchmarks: Information Content and Biases. Financial Analysts Journal, 58(1), 22–34.
Getmansky, M., Lo, A. W. and Makarov, I. 2004, An Econometric Model of Serial Correlation and Illiquidity in Hedge Fund Returns. Journal of Financial Eco-nomics, 74(3), 529–609.
Gregoriou, G. N. 2004, Performance of Canadian Hedge Funds Using a Modified Sharpe Ratio. Derivatives Use, Trading & Regulation, 10(2), 149–155.

22
Gregoriou, G. N. and Gueyie, J-P. 2003, Risk-Adjusted Performance of Funds of Hedge Funds Using a Modified Sharpe Ratio. Journal of Alternative Invest-ments, 6(3), 77–83.
Gregoriou, G. N. and Rouah, F. 2002, The Role of Hedge Funds in Pension Fund Portfolios: Buying Protection in Bear Markets. Journal of Pensions Manage-ment, 7(3), 237–245.
Grinblatt, M. Titman, Sh. 1989, Mutual Fund Performance: An Analysis of Quar-terly Portfolio Holdings. Journal of Business, 62(3), 393–416.
Ibbotson, R. G. and Sinquefield, R. A. 1979, Stocks, Bonds, Bills and Inflation: Updates. Financial Analysts Journal, 35(3), 40–44.
Ineichen, A. M. 2003, Absolute Returns. Hoboken. Jarque, C. M. and Bera, A. K. 1987, A Test for Normality of Observations and
Regression Residuals. International Statistical Review, 55(2), 163–172. Jobson, D. and Korkie, B. 1981, Performance Hypothesis Testing with the Sharpe
and Treynor Measures. Journal of Finance, 36(4), 888–908. Kat, H. M. 2002, Some Facts about Hedge Funds. World Economics, 3(2), 93–123. Kat, H. M. 2003 10 Things that Investors Should Know about Hedge Funds. Jour-
nal of Wealth Management, 5(4), 72–81. Kat, H. M. and Lu, S. 2002, An Excursion into the Statistical Properties of Hedge
Fund Returns. Working Paper # 0016, Alternative Investment Research Centre Working Paper Series, Cass Business School, City University London.
Könberg, M. and Lindberg, M. 2001, Hedge Funds: A Review of Historical Per-formance. Journal of Alternative Investments, 4(1), 21–31.
Lhabitant, F-S. 2002, Hedge Funds: Myths and Limits. Chichester. Lhabitant, F-S. 2004, Hedge Funds: Quantitative Insights. Chichester. Liang, B. 1999, On the Performance of Hedge Funds. Financial Analysts Journal,
55(4), 72–85. Liang, B. 2000, Hedge Funds: The Living and the Dead. Journal of Financial and
Quantitative Analysis, 35(3), 309–326. Liang, B. 2001, Hedge Fund Performance: 1990–1999. Financial Analysts Jour-
nal, 57(1), 11–18. Liang, B. 2003, On the Performance of Alternative Investments: CTAs, Hedge
Funds, and Funds of Funds. Working Paper, Isenberg School of Management, University of Massachusetts, Amherst.

23
Ljung, G. M. and Box, G. E. P. 1978, On a Measure of Lack of Fit in Time Series Models. Biometrika, 65(2), 297–303.
Lo, A. W. 2001, Risk Management for Hedge Funds: Introduction and Overview. Financial Analysts Journal, 57(6), 16–33.
Lo, A. W. 2002, The Statistics of Sharpe Ratios. Financial Analysts Journal, 58(4), 36–52.
Lo, A. W. and MacKinlay, A. C. 1988, Stock Market Prices Do Not Follow Ran-dom Walks: Evidence from a Simple Specification Test. Review of Financial Studies, 1(1), 41–66.
Markowitz, H. M. 1952, Portfolio Selection. Journal of Finance, 7(1), 77–91. Nicholas, J. G. 2004, Hedge Fund of Funds Investing. Princeton. Purcell, D. and Crowley, P. 1999, The Reality of Hedge Funds. Journal of Invest-
ing, 8(3), 26–44. Schneeweis, Th., Kazemi, H. and Martin, G. 2002, Understanding Hedge Fund
Performance: Research Issues Revisited—Part I. Journal of Alternative Invest-ments, 5(3), 6–22.
Shadwick, W. F. and Keating, C. 2002, A Universal Performance Measure. Jour-nal of Performance Measurement, 6(3), 59–84.
Signer, A. 2003, Generieren Hedge Funds einen Mehrwert? Bern/Stuttgart/Wien. Sortino, F. A. and van der Meer, R. 1991, Downside Risk. Journal of Portfolio
Management, 17(4), 27–31. Urzua, C. M. 1996, On the Correct Use of Omnibus Tests for Normality. Eco-
nomic Letters, 53(3), 247–251. Van Hedge Fund Advisors 2005, All about Hedge Funds. URL:
http://www.hedgefund. com [Accessed on October 6, 2005].