autocanada investor presentation equity 2014 06 07 · pdf filehyundai 2 2 2 -- -- -- -- --6...
TRANSCRIPT
June 2014
Investor Presentation
1
Forward-Looking Statements
Certain information contained in this presentation looks forward in time and deals with other than historical or current
facts for AutoCanada Inc. (“AutoCanada” or the “Company”). The use of any of the words “could”, “expect”,
“believe”, “will”, “projected”, “estimated” and similar expressions and statements relating to matters that are not
historical facts are intended to identify forward-looking information and are based on the Company’s current belief or
assumptions as to the outcome and timing of such future events. In particular, forward-looking statements in this
presentation include, but are not limited to, references to: the Company’s general strategic plans and growth
strategies; future sales and revenue; future dealership acquisitions and open point dealerships; the Company’s
targets relating to return on investment and financial ratios; dividend payout policies; future intentions relating to
financial leverage; and the retail automotive industry. Although the Company believes that the expectations reflected
by the forward-looking statements presented in this presentation are reasonable, these statements have been based
on assumptions and factors concerning future events that may prove to be inaccurate. Actual future results may
differ materially. The Company’s annual information form for the year ended December 31, 2013 and other
documents filed with securities regulatory authorities (accessible through the SEDAR website www.sedar.com)
describe the risks, material assumptions and other factors that could influence actual results and which are
incorporated herein by reference. The Company disclaims any intention or obligation to update or revise any
forward-looking information, whether as a result of new information, future events or otherwise.
2
Presentation Team
Pat PriestnerChairman and Chief Executive Officer
Tom OrysiukPresident and Chief Financial Officer
3
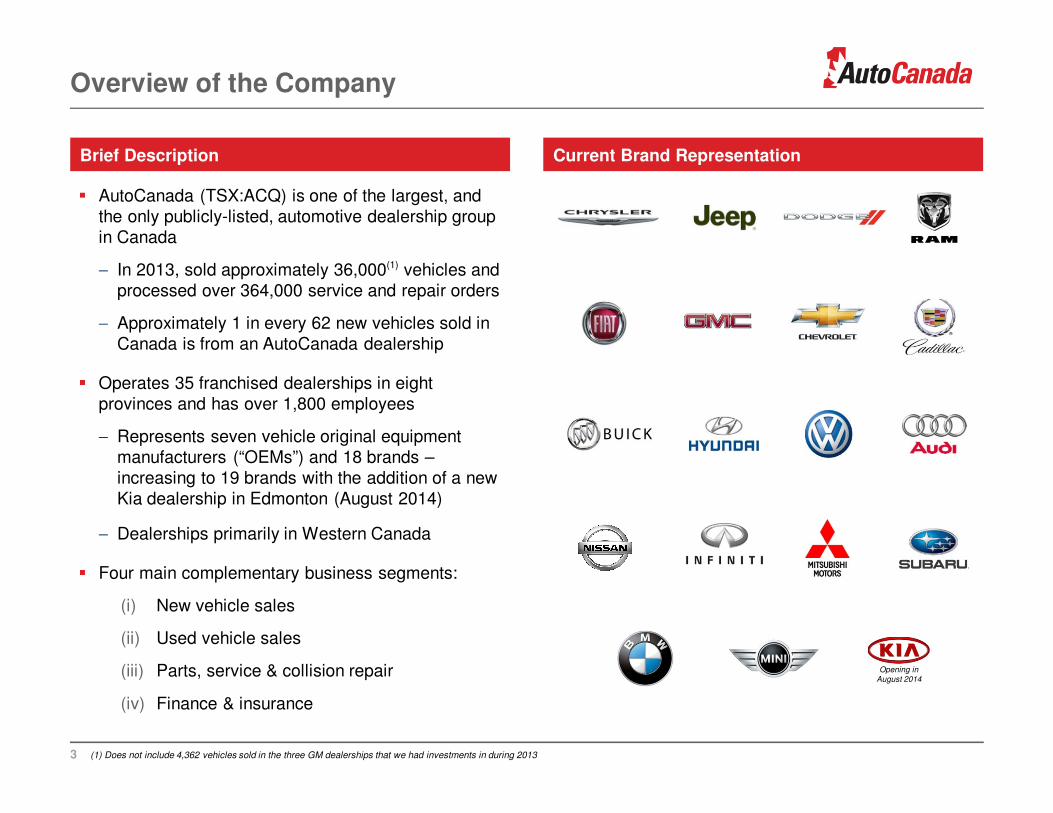
Overview of the Company
Brief Description
� AutoCanada (TSX:ACQ) is one of the largest, and the only publicly-listed, automotive dealership group in Canada
− In 2013, sold approximately 36,000(1) vehicles and processed over 364,000 service and repair orders
− Approximately 1 in every 62 new vehicles sold in Canada is from an AutoCanada dealership
� Operates 35 franchised dealerships in eight provinces and has over 1,800 employees
− Represents seven vehicle original equipment manufacturers (“OEMs”) and 18 brands –increasing to 19 brands with the addition of a new Kia dealership in Edmonton (August 2014)
− Dealerships primarily in Western Canada
� Four main complementary business segments:
(i) New vehicle sales
(ii) Used vehicle sales
(iii) Parts, service & collision repair
(iv) Finance & insurance
Opening in August 2014
Current Brand Representation
(1) Does not include 4,362 vehicles sold in the three GM dealerships that we had investments in during 2013

4
Recent Events
Extension of Chairman and CEO Employment Agreement
� June 5, 2014: Announced extension of Pat Priestner’s employment agreement to May 31, 2019
− Previous agreement expired in 2017
BMW & MINI Acquisition in Montreal
� May 22, 2014: Announced approval from BMW Canada to purchase Automobile Canbec located in Montreal, Quebec
− AutoCanada’s first BMW and MINI dealerships and first dealerships in Quebec
− Combined, the premium franchises retailed 1,652 new and 713 used vehicles in 2013
Bond Financing
� May 14, 2014: Announced offering of $150 million senior unsecured notes due 2021
− Priced at 5.625%, the lowest coupon ever achieved for a single-B rated issue in the Canadian market
− Provided additional financial flexibility to pursue growth objectives
Increased Acquisition Guidance
� June 5, 2014: Announced an upward revision to acquisition guidance to complete an additional 8 to 10 dealership acquisitions over the next 12 months
− This is in addition to the purchase agreements for eight dealerships announced April 28, 2014
Appointment of CFO
� June 5, 2014: Appointment of Christopher Burrows as CFO, effective September 1, 2014
− Previously VP and CFO of K-Bro Linen Systems and VP Finance, Administration & Tax with Stuart Olson
5
Dealership Locations & Brands
Prince George
Victoria / Duncan
Maple Ridge / Abbotsford
Kelowna
Grand Prairie
Edmonton
Ponoka
Toronto (GTA)
Dartmouth
Moncton
WinnipegCalgary
Prince Albert
Saskatoon
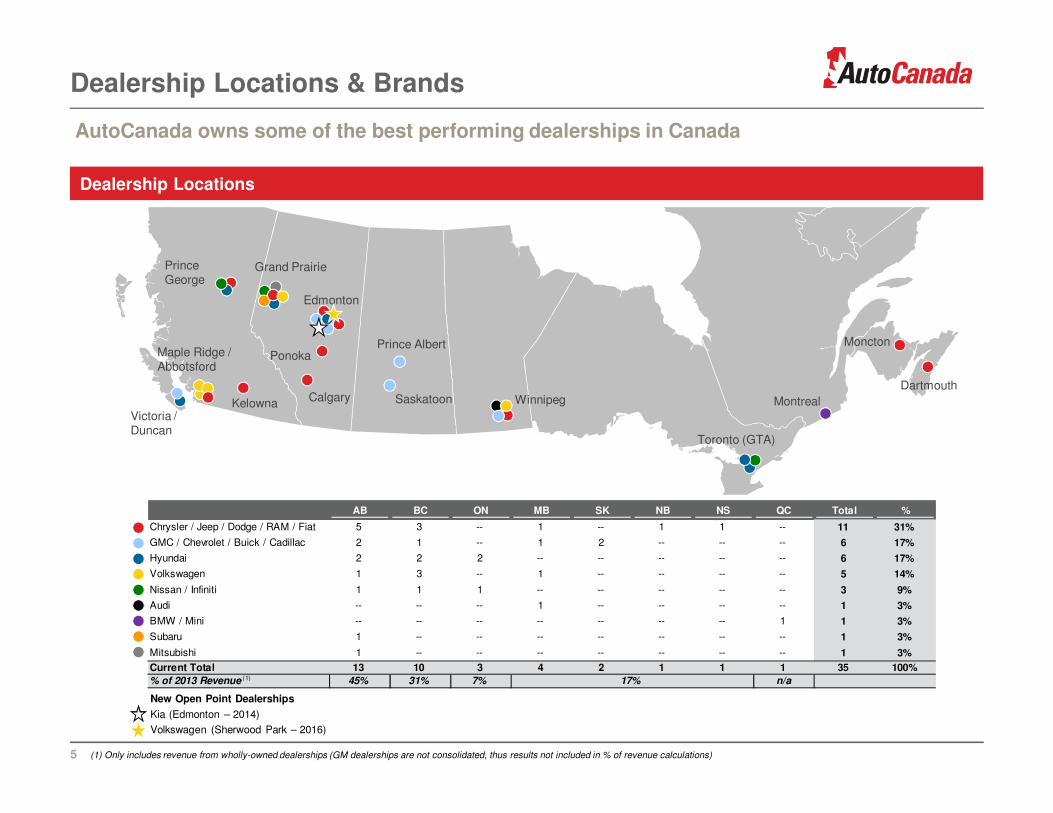
Dealership Locations
AutoCanada owns some of the best performing dealerships in Canada
(1) Only includes revenue from wholly-owned dealerships (GM dealerships are not consolidated, thus results not included in % of revenue calculations)
New Open Point Dealerships
Kia (Edmonton – 2014)
Volkswagen (Sherwood Park – 2016)
Montreal
AB BC ON MB SK NB NS QC Total %
Chrysler / Jeep / Dodge / RAM / Fiat 5 3 -- 1 -- 1 1 -- 11 31%
GMC / Chevrolet / Buick / Cadillac 2 1 -- 1 2 -- -- -- 6 17%
Hyundai 2 2 2 -- -- -- -- -- 6 17%
Volkswagen 1 3 -- 1 -- -- -- -- 5 14%
Nissan / Infiniti 1 1 1 -- -- -- -- -- 3 9%
Audi -- -- -- 1 -- -- -- -- 1 3%
BMW / Mini -- -- -- -- -- -- -- 1 1 3%
Subaru 1 -- -- -- -- -- -- -- 1 3%
Mitsubishi 1 -- -- -- -- -- -- -- 1 3%
Current Total 13 10 3 4 2 1 1 1 35 100%
% of 2013 Revenue (1) 45% 31% 7% 17% n/a
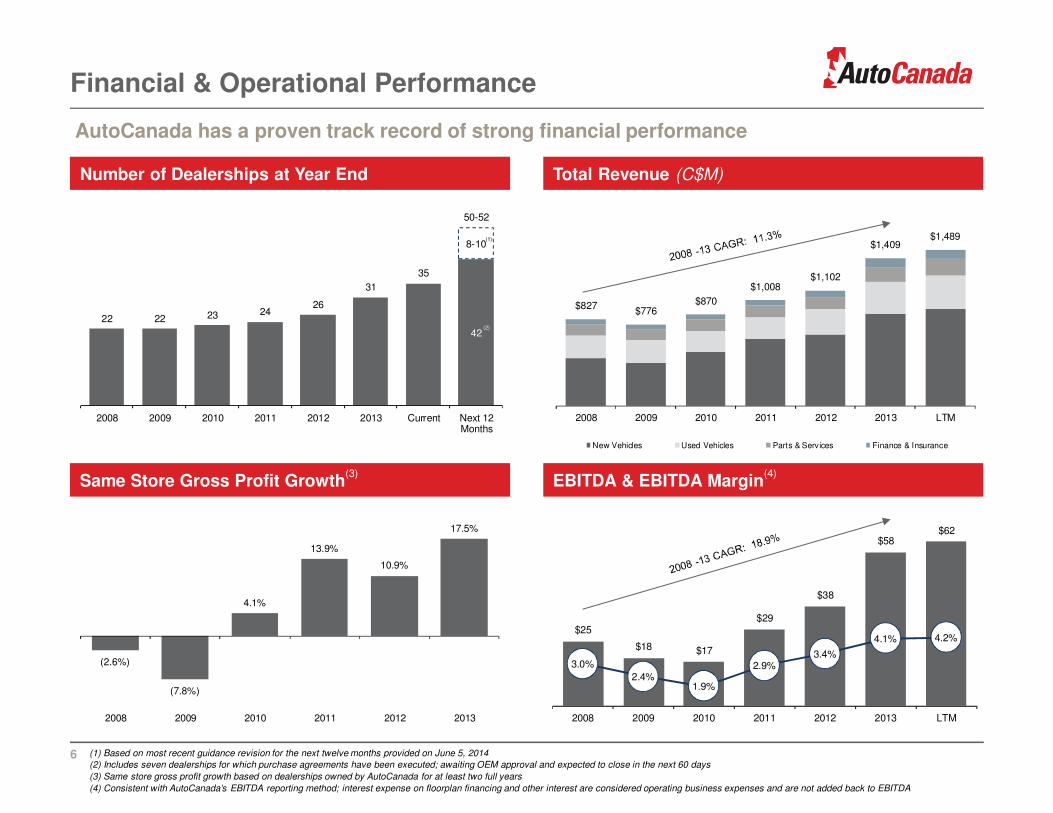
42
8-10
22 22 23 2426
31
35
50-52
2008 2009 2010 2011 2012 2013 Current Next 12Months
$25
$18 $17
$29
$38
$58$62
3.0%
2.4% 1.9%
2.9% 3.4%
4.1% 4.2%
2008 2009 2010 2011 2012 2013 LTM
$827$776
$870
$1,008$1,102
$1,409$1,489
2008 2009 2010 2011 2012 2013 LTM
New Vehicles Used Vehicles Parts & Services Finance & Insurance
6
Financial & Operational Performance
Number of Dealerships at Year End Total Revenue (C$M)
EBITDA & EBITDA Margin(4)
(1) Based on most recent guidance revision for the next twelve months provided on June 5, 2014
(2) Includes seven dealerships for which purchase agreements have been executed; awaiting OEM approval and expected to close in the next 60 days
(3) Same store gross profit growth based on dealerships owned by AutoCanada for at least two full years
(4) Consistent with AutoCanada’s EBITDA reporting method; interest expense on floorplan financing and other interest are considered operating business expenses and are not added back to EBITDA
AutoCanada has a proven track record of strong financial performance
Same Store Gross Profit Growth(3)
(2.6%)
(7.8%)
4.1%
13.9%
10.9%
17.5%
2008 2009 2010 2011 2012 2013
(2)
(1)
7
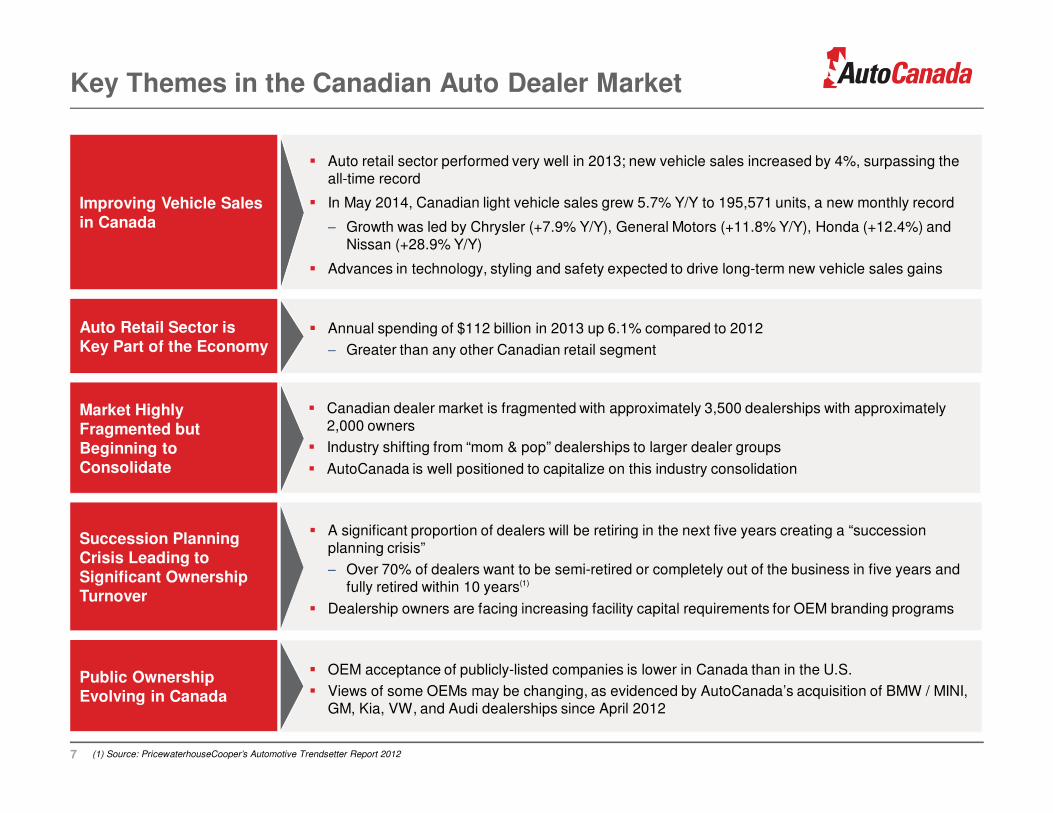
Key Themes in the Canadian Auto Dealer Market
Improving Vehicle Sales in Canada
� Auto retail sector performed very well in 2013; new vehicle sales increased by 4%, surpassing the all-time record
� In May 2014, Canadian light vehicle sales grew 5.7% Y/Y to 195,571 units, a new monthly record
− Growth was led by Chrysler (+7.9% Y/Y), General Motors (+11.8% Y/Y), Honda (+12.4%) and Nissan (+28.9% Y/Y)
� Advances in technology, styling and safety expected to drive long-term new vehicle sales gains
Market Highly Fragmented but Beginning to Consolidate
� Canadian dealer market is fragmented with approximately 3,500 dealerships with approximately 2,000 owners
� Industry shifting from “mom & pop” dealerships to larger dealer groups
� AutoCanada is well positioned to capitalize on this industry consolidation
Succession Planning Crisis Leading to Significant Ownership Turnover
� A significant proportion of dealers will be retiring in the next five years creating a “succession planning crisis”
− Over 70% of dealers want to be semi-retired or completely out of the business in five years and fully retired within 10 years(1)
� Dealership owners are facing increasing facility capital requirements for OEM branding programs
� OEM acceptance of publicly-listed companies is lower in Canada than in the U.S.
� Views of some OEMs may be changing, as evidenced by AutoCanada’s acquisition of BMW / MINI, GM, Kia, VW, and Audi dealerships since April 2012
Public Ownership Evolving in Canada
Auto Retail Sector is Key Part of the Economy
� Annual spending of $112 billion in 2013 up 6.1% compared to 2012
− Greater than any other Canadian retail segment
(1) Source: PricewaterhouseCooper’s Automotive Trendsetter Report 2012
8
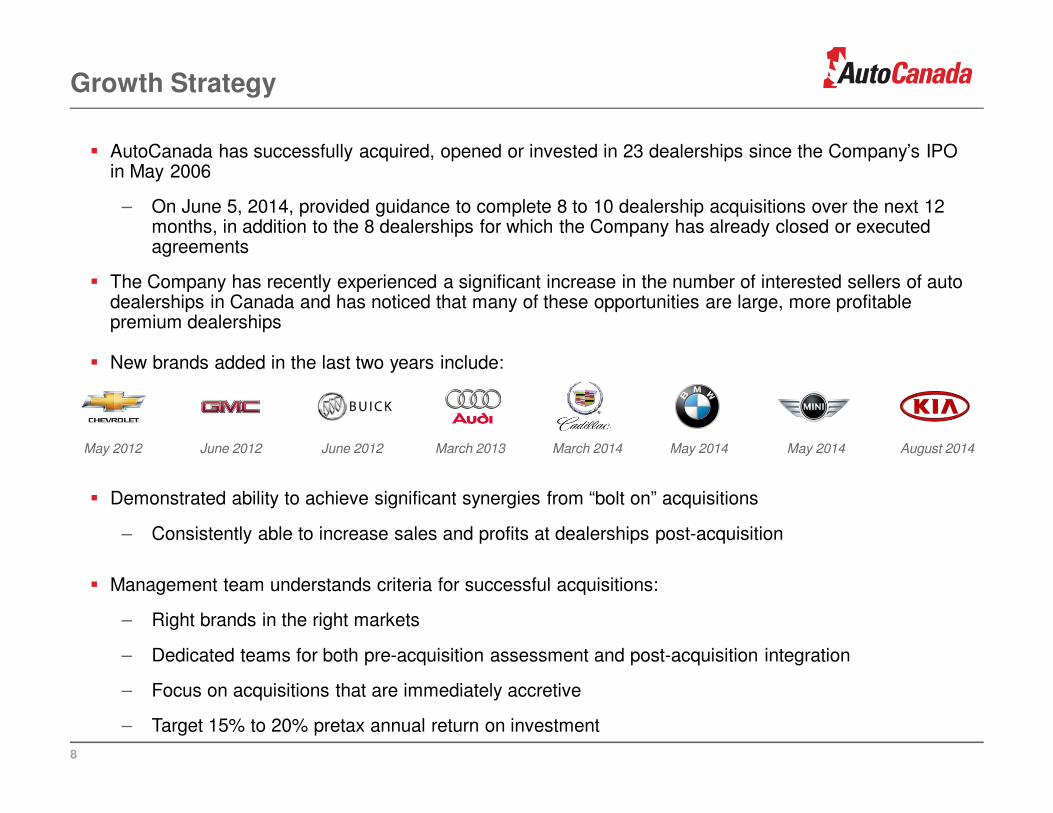
Growth Strategy
� AutoCanada has successfully acquired, opened or invested in 23 dealerships since the Company’s IPO in May 2006
– On June 5, 2014, provided guidance to complete 8 to 10 dealership acquisitions over the next 12 months, in addition to the 8 dealerships for which the Company has already closed or executed agreements
� The Company has recently experienced a significant increase in the number of interested sellers of auto dealerships in Canada and has noticed that many of these opportunities are large, more profitable premium dealerships
� New brands added in the last two years include:
� Demonstrated ability to achieve significant synergies from “bolt on” acquisitions
– Consistently able to increase sales and profits at dealerships post-acquisition
� Management team understands criteria for successful acquisitions:
– Right brands in the right markets
– Dedicated teams for both pre-acquisition assessment and post-acquisition integration
– Focus on acquisitions that are immediately accretive
– Target 15% to 20% pretax annual return on investment
May 2012 June 2012 June 2012 March 2014March 2013 August 2014May 2014 May 2014
9
Investment Highlights
� Diversified Revenue Supports Strong Business Model
� Multi-location Dealership Model Enables Economies of Scale and Facilitates Best Practices
� Centralized Sales & Marketing Strategy with Significant Online Presence
� Portfolio of Brands Suited to Our Markets
� Market Demographics and Industry Presence Support Growth Strategy
� Committed to Dividend Growth
� Experienced and Incentivized Senior Management
1
2
3
4
6
5
7

10
Diversified Revenue Supports Strong Business Model
� The auto dealer business model has historically been strong and profitable throughout the business cycle
� Well-established and accepted dealership model has existed for 50+ years in the Canadian marketplace
– OEMs committed to dealership success and profitability
� Four business segments provide diversified and stable revenue
� Benefits of dealerships franchise agreements:
– Exclusive sales territories
– No cost consumer sales incentives
– Brand marketing
– Warranty repair work
� Dealerships have a variable cost structure, with the parts & service business covering most of the fixed costs of the entire dealership (measured by absorption rate)
– Parts & service business is a counter-cyclical and stable recurring revenue stream
2013 Revenue & Gross Profit Split (C$M)
Absorption Rate(1)
(1) Absorption rate is the extent to which the gross profit of the parts & service segment covers its own operations plus the fixed costs of operating the dealerships (fixed salaries and benefits, administration costs, occupancy costs, insurance expense, utilities expense and non-floorplan interest expense; excludes all costs pertaining to head office)
1
Revenue Gross Profit
62.7%
21.4%
10.1%
5.9%
New Vehicles Used Vehicles Parts & Services Finance & Insurance
30.8%
8.2%
30.0%
31.0%
$1,409 $246
96%
89%86% 88% 86% 87%
2008 2009 2010 2011 2012 2013

11
Multi-location Dealership Model has Key Advantages 2
Uniform Application of Best Practices
� Implement new and innovative ideas across the group
� Enables benchmarking the success of dealership operations against each other
� Ability to invest in analytic capabilities
Economies of Scale
� Size and consolidated purchasing power provide both revenue and cost synergies
− Revenue synergies include being a preferred provider for retail service & warranty contracts, and earning higher commissions
− Cost synergies include achieving lower prices for items such as insurance, advertising, benefit plans, printing and information systems
Decentralized Operations with Centralized Administration and Strategy
� Able to provide niche market responses to sales, service, marketing and inventory requirements while benefiting from the resources provided by an experienced and knowledgeable head office executive team
Inventory Management
� Able to share market information across dealerships selling the same brands and identify any changes in consumer buying patterns

Centralized Sales & Marketing Strategy
12
� Highly developed, centralized sales and marketing strategy across dealer group offers significant competitive advantage
− Significant cost savings on bulk advertising, including digital ads, flyers, radio, point of sale and newspapers
− Implementation of best practices
� The Internet represents a substantial opportunity to build the brand and geographic borders of AutoCanada’s dealerships
− Each dealership has a professional website with a virtual showroom that reinforces the unique branding of the dealership and is frequently updated
− Internet used to communicate with customers prior to vehicle purchase and after purchase to coordinate and market maintenance and repair services
− Manufacturer website links provide dealerships with key sources of referrals
− Ongoing centralized marketing initiatives to increase traffic to websites and improve user friendliness
� Improvements in online private sale technologies have inherently increased the competition in the used vehicle market
− Dealerships maintain a competitive advantage due to:
− Ability to provide multiple sources of financing
− Ability to offer extended warranty
− Direct access to dealer auctions which offer competitive pricing
3

13
Brands Suited to Our Markets
� AutoCanada has the right brands in the right locations
� Majority of AutoCanada’s manufacturers are in the top 10 by unit sales growth
� Geographically concentrated in Alberta and B.C., which have favourable demographics, economics and growth
– 23 of 35 dealerships are in Alberta and B.C.
– Alberta personal disposable income is approximately 25% higher than the national average
– Market in Western Canada is heavily skewed to light trucks, which are more profitable than cars(1)
– Higher repair orders, more accessories, and higher finance & insurance commissions
Top 10 OEMs by Increase in Unit Sales
Provinces by Increase in Unit Sales
Source: DesRosiers Automotive Consultants(1) 70% of sales in Western Canada represent light trucks vs. national average of 57%
Canadian Market Average: 4.0%
Canadian Market Average: 4.0%
4
14
Demographics & Industry Presence Support Growth
� Growth strategy is supported by changing demographics in the auto dealer market presenting AutoCanada with ample room for consolidation
– Market is highly fragmented (approximately 3,500 dealerships in Canada with approximately 2,000 owners)
– Many dealers are nearing retirement and seeking exit strategies
– More than 70% of dealers want to be semi-retired or completely out of the business within five years(1)
� OEM requirements for higher facility capital investment act as a barrier for new entrants and present an opportunity for well-capitalized dealer groups
– Facility upgrades required by OEMs can cost millions of dollars
� AutoCanada’s successful acquisition track record has lead to the Company being the ‘buyer of choice’ for many dealers considering a sale
– Reputation for treating dealers fairly
– Well-capitalized
– Only publicly-traded dealership group in Canada
– Many acquisitions have resulted from referrals from dealers acquired in the past
5
(1) Source: PricewaterhouseCooper’s Automotive Trendsetter Report 2012
15
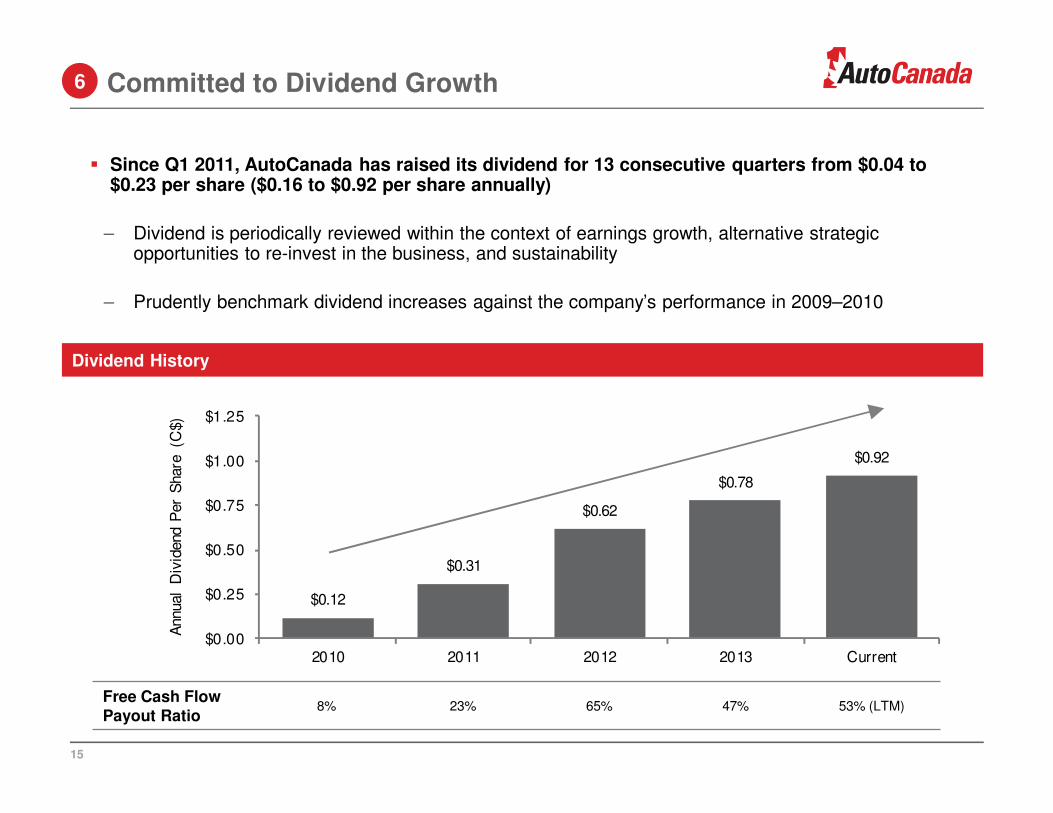
Committed to Dividend Growth6
� Since Q1 2011, AutoCanada has raised its dividend for 13 consecutive quarters from $0.04 to $0.23 per share ($0.16 to $0.92 per share annually)
– Dividend is periodically reviewed within the context of earnings growth, alternative strategic opportunities to re-invest in the business, and sustainability
– Prudently benchmark dividend increases against the company’s performance in 2009–2010
$0.12
$0.31
$0.62
$0.78
$0.92
$0.00
$0.25
$0.50
$0.75
$1.00
$1.25
2010 2011 2012 2013 Current
Annual
Div
idend
Per
Share
(C
$)
Dividend History
Free Cash Flow Payout Ratio
8% 23% 65% 47% 53% (LTM)
16
Experienced and Incentivized Senior Management
� Pat Priestner, Chairman and CEO, has over 40 years experience in the retail auto industry including over 35 years as a dealership owner
– Owned his first dealership at age 24
– In June 2014, extended employment agreement to May 2019
� Management team has strong depth and a demonstrated track record of successfully growing the business organically and by executing accretive acquisitions
– Grown revenue from $827 million in 2008 to $1.4 billion in 2013
– Grown number of dealerships from 14 at the time of the IPO in May 2006 to 35 today
� Dealers and general managers are very experienced and talented with pay plans that are substantially variable and tied to earnings
– Senior management turnover in dealerships remains low; 16 of the 20 dealerships that AutoCanada has owned for five years or more have the same dealer general manager
� Corporate head office (known as ‘Dealer Support Services’) includes approximately 80 individuals focused on improving dealership profitability, helping to improve customer satisfaction, train dealership personnel, and implement and share best practices
7
17
SEGMENT & FINANCIAL OVERVIEW
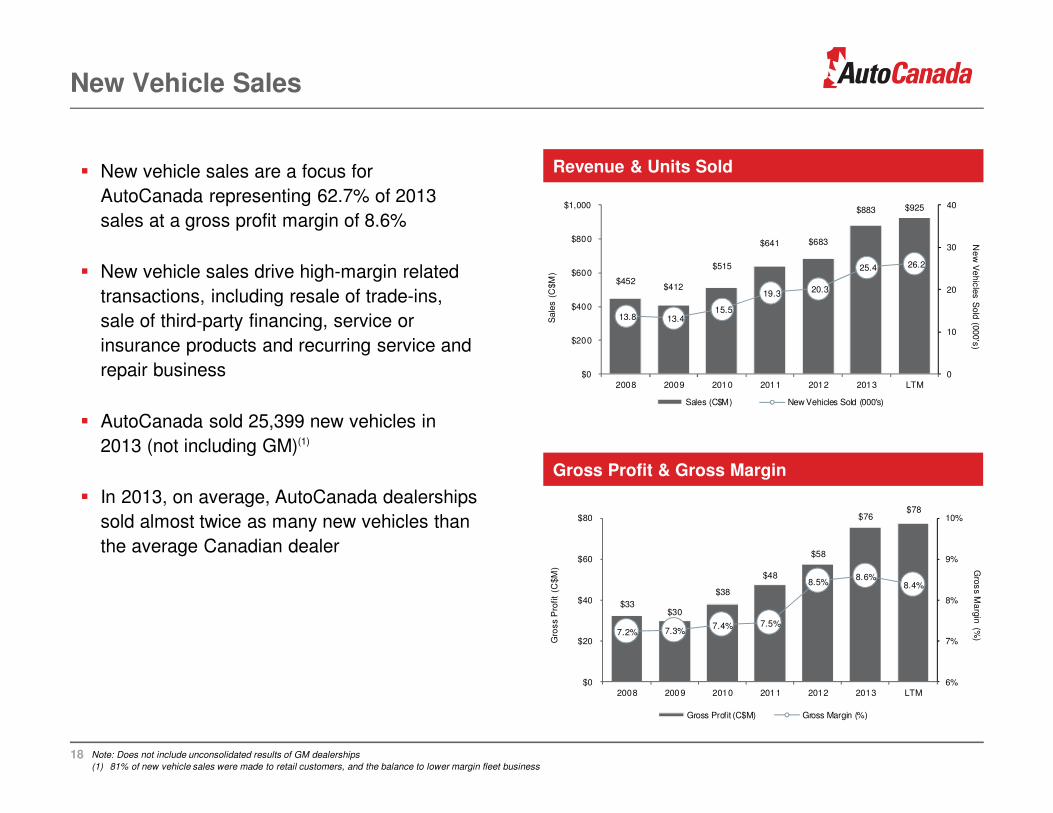
� New vehicle sales are a focus for
AutoCanada representing 62.7% of 2013
sales at a gross profit margin of 8.6%
� New vehicle sales drive high-margin related
transactions, including resale of trade-ins,
sale of third-party financing, service or
insurance products and recurring service and
repair business
� AutoCanada sold 25,399 new vehicles in
2013 (not including GM)(1)
� In 2013, on average, AutoCanada dealerships
sold almost twice as many new vehicles than
the average Canadian dealer
New Vehicle Sales
18
Revenue & Units Sold
Note: Does not include unconsolidated results of GM dealerships
(1) 81% of new vehicle sales were made to retail customers, and the balance to lower margin fleet business
Gross Profit & Gross Margin
$452 $412
$515
$641 $683
$883 $925
13.8 13.4 15.5
19.3 20.3
25.4 26.2
0
10
20
30
40
$0
$200
$400
$600
$800
$1,000
2008 2009 2010 2011 2012 2013 LTM
Ne
w V
ehic
les
Sold
(000's
)
Sale
s (
C$M
)
Sales (C$M) New Vehicles Sold (000's)
$33 $30
$38
$48
$58
$76 $78
7.2% 7.3%7.4% 7.5%
8.5%8.6%
8.4%
6%
7%
8%
9%
10%
$0
$20
$40
$60
$80
2008 2009 2010 2011 2012 2013 LTM
Gro
ss M
arg
in (%
)
Gro
ss P
rofit
(C$M
)
Gross Profit (C$M) Gross Margin (%)
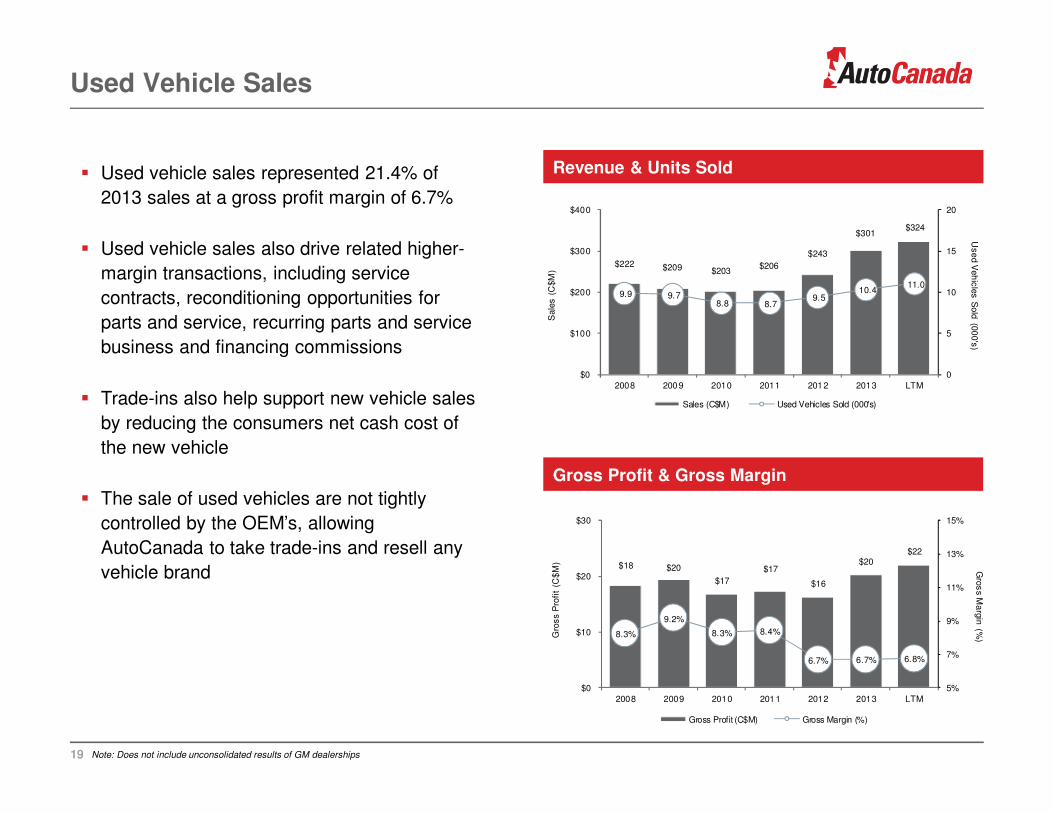
� Used vehicle sales represented 21.4% of
2013 sales at a gross profit margin of 6.7%
� Used vehicle sales also drive related higher-
margin transactions, including service
contracts, reconditioning opportunities for
parts and service, recurring parts and service
business and financing commissions
� Trade-ins also help support new vehicle sales
by reducing the consumers net cash cost of
the new vehicle
� The sale of used vehicles are not tightly
controlled by the OEM’s, allowing
AutoCanada to take trade-ins and resell any
vehicle brand
Used Vehicle Sales
19 Note: Does not include unconsolidated results of GM dealerships
Revenue & Units Sold
Gross Profit & Gross Margin
$222 $209 $203 $206
$243
$301 $324
9.9 9.7 8.8 8.7
9.5 10.4
11.0
0
5
10
15
20
$0
$100
$200
$300
$400
2008 2009 2010 2011 2012 2013 LTM
Use
d V
eh
icle
s S
old
(00
0's
)
Sale
s (
C$M
)
Sales (C$M) Used Vehicles Sold (000's)
$18 $20
$17
$17
$16
$20 $22
8.3%
9.2%
8.3% 8.4%
6.7% 6.7% 6.8%
5%
7%
9%
11%
13%
15%
$0
$10
$20
$30
2008 2009 2010 2011 2012 2013 LTM
Gro
ss M
arg
in (%
)Gro
ss
Pro
fit
(C$
M)
Gross Profit (C$M) Gross Margin (%)
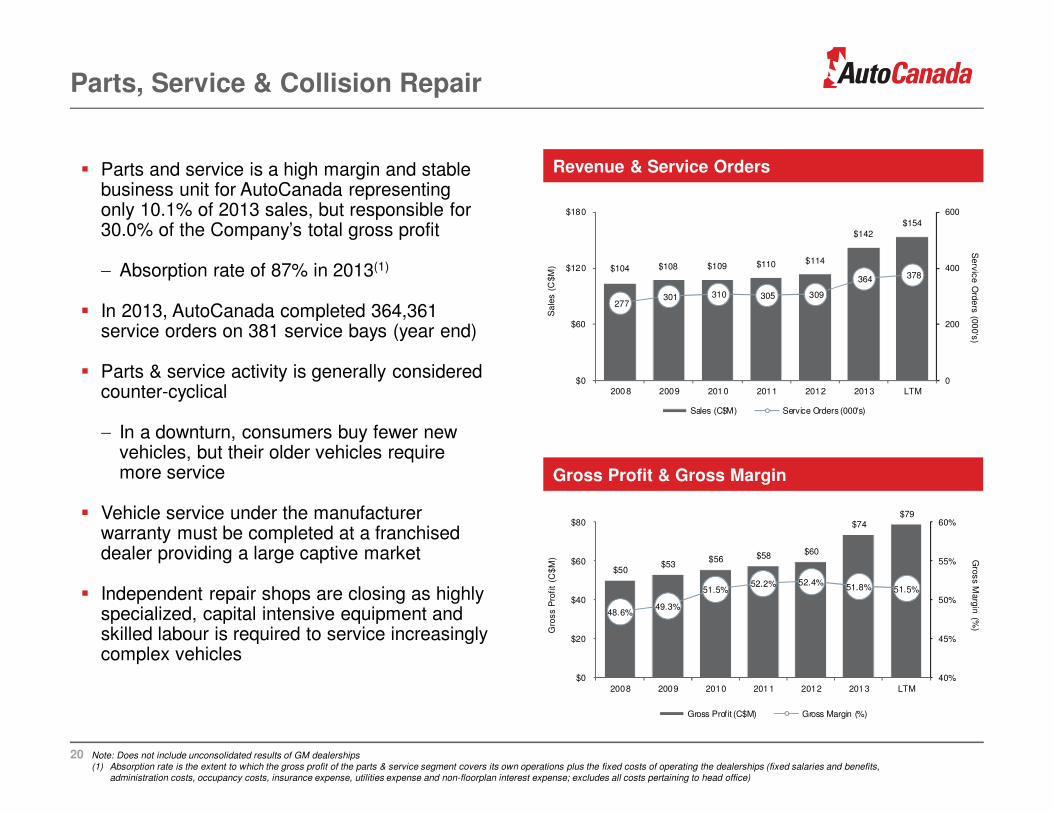
� Parts and service is a high margin and stable business unit for AutoCanada representing only 10.1% of 2013 sales, but responsible for 30.0% of the Company’s total gross profit
− Absorption rate of 87% in 2013(1)
� In 2013, AutoCanada completed 364,361 service orders on 381 service bays (year end)
� Parts & service activity is generally considered counter-cyclical
− In a downturn, consumers buy fewer new vehicles, but their older vehicles require more service
� Vehicle service under the manufacturer warranty must be completed at a franchised dealer providing a large captive market
� Independent repair shops are closing as highly specialized, capital intensive equipment and skilled labour is required to service increasingly complex vehicles
Note: Does not include unconsolidated results of GM dealerships(1) Absorption rate is the extent to which the gross profit of the parts & service segment covers its own operations plus the fixed costs of operating the dealerships (fixed salaries and benefits,
administration costs, occupancy costs, insurance expense, utilities expense and non-floorplan interest expense; excludes all costs pertaining to head office)
Parts, Service & Collision Repair
20
Revenue & Service Orders
Gross Profit & Gross Margin
$104 $108 $109 $110 $114
$142
$154
277 301 310 305 309
364 378
0
200
400
600
$0
$60
$120
$180
2008 2009 2010 2011 2012 2013 LTM
Serv
ice O
rde
rs (0
00's
)
Sa
les (
C$M
)
Sales (C$M) Service Orders (000's)
$50 $53
$56 $58 $60
$74 $79
48.6%49.3%
51.5%52.2% 52.4%
51.8% 51.5%
40%
45%
50%
55%
60%
$0
$20
$40
$60
$80
2008 2009 2010 2011 2012 2013 LTM
Gro
ss M
arg
in (%
)
Gro
ss
Pro
fit
(C$
M)
Gross Profit (C$M) Gross Margin (%)
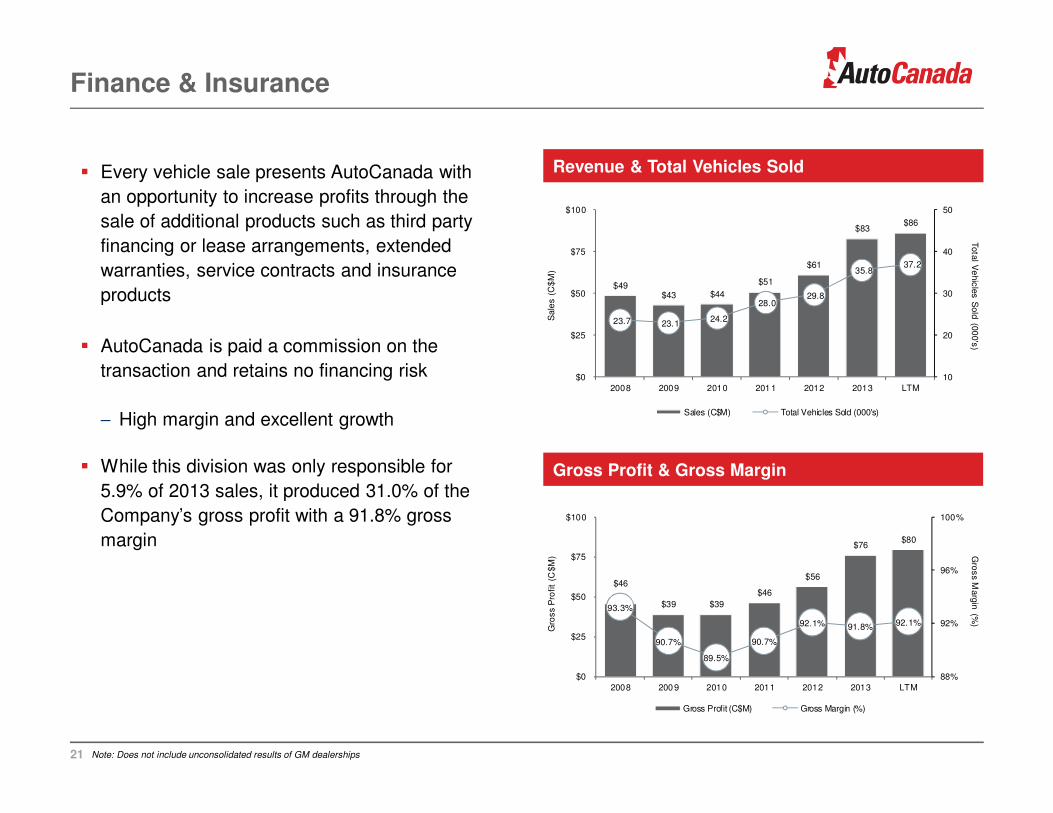
� Every vehicle sale presents AutoCanada with
an opportunity to increase profits through the
sale of additional products such as third party
financing or lease arrangements, extended
warranties, service contracts and insurance
products
� AutoCanada is paid a commission on the
transaction and retains no financing risk
− High margin and excellent growth
� While this division was only responsible for
5.9% of 2013 sales, it produced 31.0% of the
Company’s gross profit with a 91.8% gross
margin
Finance & Insurance
21
Revenue & Total Vehicles Sold
Gross Profit & Gross Margin
$49 $43 $44
$51
$61
$83 $86
23.7 23.1 24.2
28.0 29.8
35.8 37.2
10
20
30
40
50
$0
$25
$50
$75
$100
2008 2009 2010 2011 2012 2013 LTM
Tota
l Ve
hic
les
Sold
(00
0's
)
Sale
s (
C$
M)
Sales (C$M) Total Vehicles Sold (000's)
$46
$39 $39
$46
$56
$76 $80
93.3%
90.7%
89.5%
90.7%
92.1% 91.8% 92.1%
88%
92%
96%
100%
$0
$25
$50
$75
$100
2008 2009 2010 2011 2012 2013 LTM
Gro
ss M
arg
in (%
)
Gro
ss P
rofit
(C$M
)
Gross Profit (C$M) Gross Margin (%)
Note: Does not include unconsolidated results of GM dealerships
22
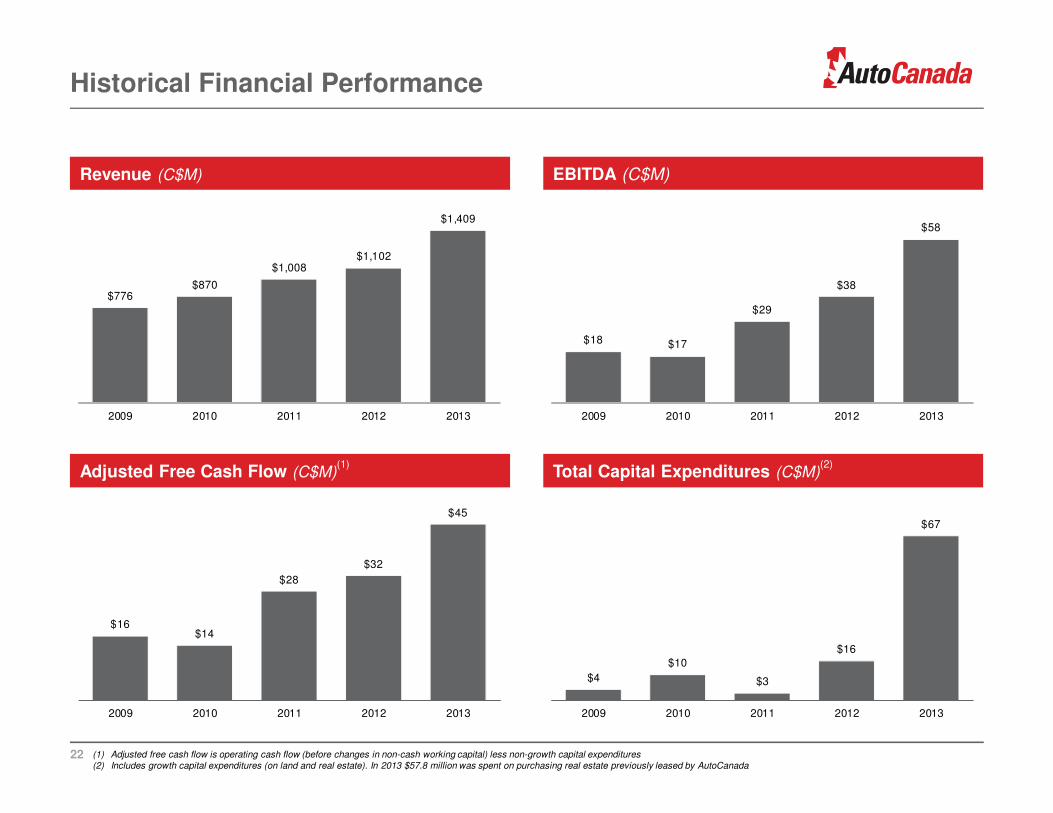
Historical Financial Performance
Revenue (C$M) EBITDA (C$M)
$776 $870
$1,008 $1,102
$1,409
2009 2010 2011 2012 2013
$18 $17
$29
$38
$58
2009 2010 2011 2012 2013
$16 $14
$28
$32
$45
2009 2010 2011 2012 2013
Adjusted Free Cash Flow (C$M)(1)
Total Capital Expenditures (C$M)(2)
(1) Adjusted free cash flow is operating cash flow (before changes in non-cash working capital) less non-growth capital expenditures(2) Includes growth capital expenditures (on land and real estate). In 2013 $57.8 million was spent on purchasing real estate previously leased by AutoCanada
$4
$10
$3
$16
$67
2009 2010 2011 2012 2013
23
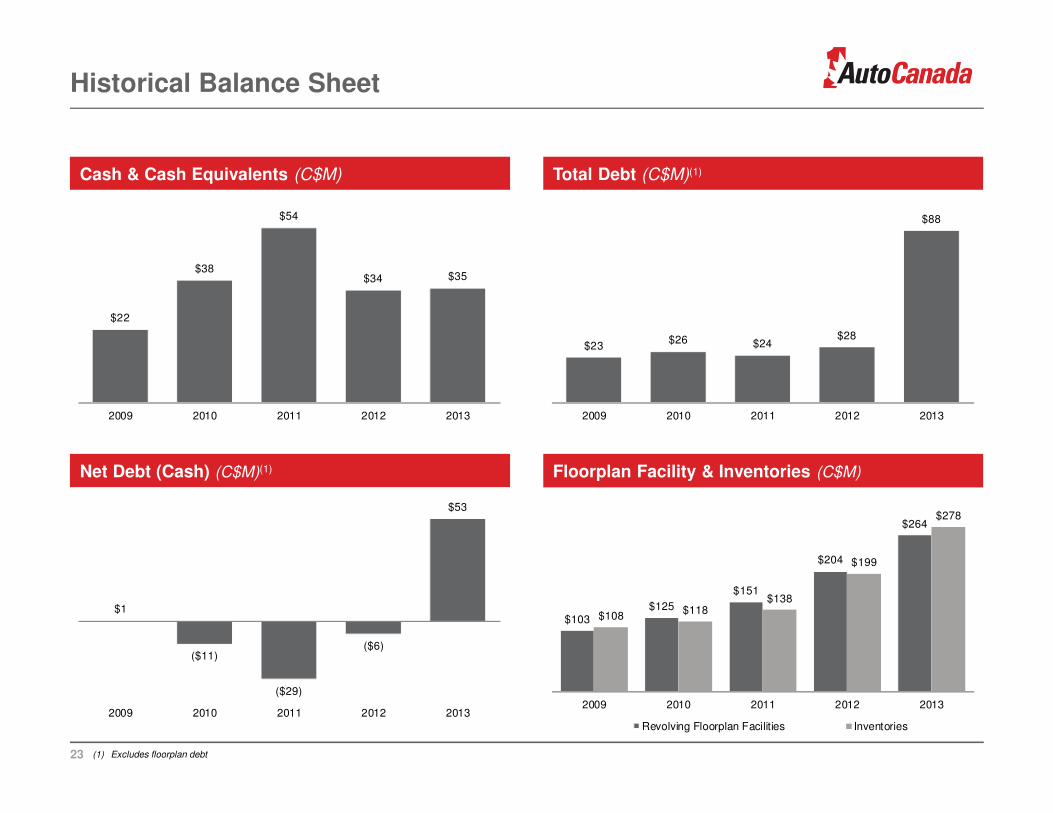
Historical Balance Sheet
Cash & Cash Equivalents (C$M) Total Debt (C$M)(1)
Net Debt (Cash) (C$M)(1) Floorplan Facility & Inventories (C$M)
(1) Excludes floorplan debt
$22
$38
$54
$34 $35
2009 2010 2011 2012 2013
$23 $26 $24
$28
$88
2009 2010 2011 2012 2013
$1
($11)
($29)
($6)
$53
2009 2010 2011 2012 2013
$103 $125
$151
$204
$264
$108 $118
$138
$199
$278
2009 2010 2011 2012 2013
Revolving Floorplan Facilities Inventories

24
SUPPLEMENTAL INFORMATION
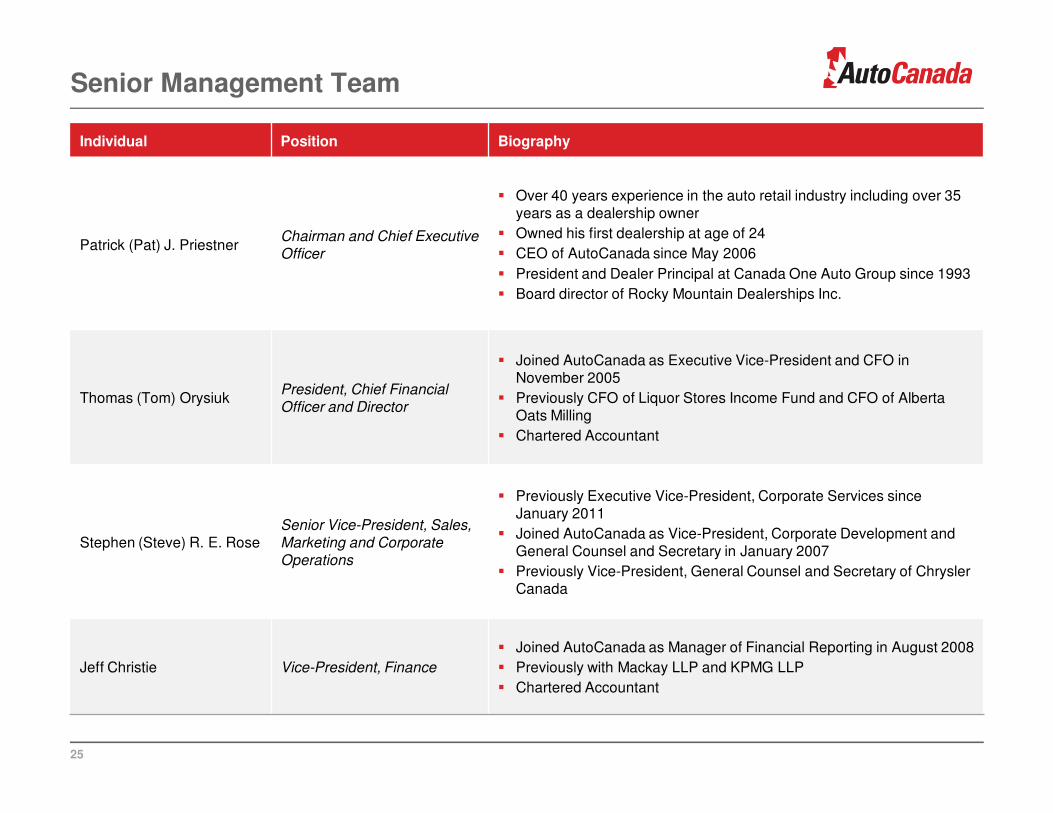
Senior Management Team
Individual Position Biography
Patrick (Pat) J. PriestnerChairman and Chief Executive Officer
� Over 40 years experience in the auto retail industry including over 35 years as a dealership owner
� Owned his first dealership at age of 24
� CEO of AutoCanada since May 2006
� President and Dealer Principal at Canada One Auto Group since 1993
� Board director of Rocky Mountain Dealerships Inc.
Thomas (Tom) OrysiukPresident, Chief Financial Officer and Director
� Joined AutoCanada as Executive Vice-President and CFO in November 2005
� Previously CFO of Liquor Stores Income Fund and CFO of Alberta Oats Milling
� Chartered Accountant
Stephen (Steve) R. E. RoseSenior Vice-President, Sales, Marketing and Corporate Operations
� Previously Executive Vice-President, Corporate Services since January 2011
� Joined AutoCanada as Vice-President, Corporate Development and General Counsel and Secretary in January 2007
� Previously Vice-President, General Counsel and Secretary of Chrysler Canada
Jeff Christie Vice-President, Finance
� Joined AutoCanada as Manager of Financial Reporting in August 2008
� Previously with Mackay LLP and KPMG LLP
� Chartered Accountant
25

Board of Directors
Individual Position Biography
Gordon R. BarefootDirector
Member of Audit Committee
� President of Cabgor Management Inc.� Previously CFO of Terasen Inc. and Partner at Ernst & Young LLP� Director of Corix Infrastructure Inc., Institute for Health System
Transformation & Sustainability and ISE Ltd.
Michael Ross
Director
Member of Audit Committee and Governance and Compensation Committee
� President of M.H. Ross Management Ltd.� Founding partner and former CEO of Conroy Ross Partners� Director of Camex Equipment Sales & Rentals, Fountain Tire, FYi
Doctors, Weatherhaven Corporation and Norseman Group
Dennis S. DesRosiers
Director
Member of Governance and Compensation Committee
� President of DesRosiers Automotive Consultants (a leading Canadian automotive industry consulting firm)
� Board director of University of Windsor
Christopher Cumming
Director
Member of Audit Committee and Governance and Compensation Committee
� President of Evident Capital Corp.� Director of Highland Therapeutics Inc.� Previously Vice-President at Phillips, Hager & North Investment
Management Ltd.� Chartered Financial Analyst
Patrick (Pat) J. PriestnerChairman and Chief Executive Officer
� See page 25
Thomas (Tom) OrysiukPresident, Chief Financial Officer and Director
� See page 25
26
Analyst Coverage
27
Derek Dley – (416) 869-7270
Neal Gilmer – (416) 343-2773
Hilda Maraachlian – (416) 943-6722
Otto Cheung – (416) 943-6620
Anthony Zicha – (514) 350-7748
Steve Arthur – (416) 842-7844