auto sector_tractors_eying new highs
TRANSCRIPT

8/2/2019 Auto Sector_Tractors_Eying New Highs
http://slidepdf.com/reader/full/auto-sectortractorseying-new-highs 1/16
AUTO SECTOR: TRACTORS
Eying new highs
Chirag ShahSenior Research [email protected]+91 22 66121252
Siddhartha BeraResearch [email protected]+91 22 66242494
December, 2011
Tractors - Demand stable vs. Cars /
M&HCVs. Demand drivers in placeor sustainable double digit growth
Moderation, if any, to be short lived.Growth in NABARD disbursementsather than Agri credit is moreelevant
Key beneficiary - M&M, valuationsactoring in sharp drop in EBITDA /
margins

8/2/2019 Auto Sector_Tractors_Eying New Highs
http://slidepdf.com/reader/full/auto-sectortractorseying-new-highs 2/16
Auto Sector: Tractors
Emkay Research 12 December 2011 2
Contents
Sector
Synopsis -------------------------------------------------------------------------------------------------------------------------------------------------------------------------3
Sector view:
Tractor demand stable vs Cars/M&HCVs -------------------------------------------------------------------------------------------------------------------------------4
Penetration levels – extremely low ---------------------------------------------------------------------------------------------------------------------------------4
Fragmented land holding----------------------------------------------------------------------------------------------------------------------------------------------5
Rising finance penetration --------------------------------------------------------------------------------------------------------------------------------------------5
Non farm usage of tractors – on a rise-----------------------------------------------------------------------------------------------------------------------------7
Replacement demand - Key near term support -----------------------------------------------------------------------------------------------------------------7
Rising labor shortage---------------------------------------------------------------------------------------------------------------------------------------------------8
Summary-------------------------------------------------------------------------------------------------------------------------------------------------------------------------9
Key concerns ----------------------------------------------------------------------------------------------------------------------------------------------------------------- 10
Company
Mahindra & Mahindra Ltd. ------------------------------------------------------------------------------------------------------------------------------------------------ 11

8/2/2019 Auto Sector_Tractors_Eying New Highs
http://slidepdf.com/reader/full/auto-sectortractorseying-new-highs 3/16
Auto Sector: Tractors
Emkay Research 12 December 2011 3
Synopsis
There have been rising concerns on the sustainability of tractor demand owing to
certain adverse developments and the strong performance of the tractor segment
over the last few years (17% CAGR during FY08-11 and 20% YTDFY12).
Recent adverse developments like (1) declining Agri terms of trade (ATOT) (2) lack of
buying support by FCI, resulting in produce being sold below MSPs and (3)slowdown in agri credit/rising NPAs (of PSU banks), have raised concerns over cash
flows of the farmers
Some of these concerns are overdone, while others are still nascent. If these
concerns materialize, then there can be pressure on tractor demand in the short
term. However, this would be a temporary blip as structurally, demand continues to
be on an upswing and it is nowhere near its peak. Our confidence stems from a
number of indicators highlighted below
¡ Indian tractor industry is more stable than Cars/M&HCVs. Since 1973, the tractor
industry has registered a CAGR of 8.6%.
¡ While India’s tractor penetration at 19 per 1000 hectares appears reasonable, we
believe it is misleading. Penetration per 1000 agricultural people is a betterindicator. At 5 per 1000, India’s tractor penetration is among the lowest.
¡ Across the globe, there has been a sharp reduction in population relying on
agriculture as a source of income. This is evident from the fact that current
penetration levels (per 1000 hectares) are significantly below their peak levels.
India is the only country, where there has been an increase in population relying
on agriculture, thereby supporting tractor demand
¡ Increasing focus of government has resulted in higher penetration of finance
amongst the target customers. Interestingly, there is no correlation between agri
lending and tractor demand. We found a much higher correlation between
NABARD disbursements and tractor demand
¡ Favorable cost dynamics and lack of restriction on use of tractors for otherpurposes have triggered additional demand for tractors. Non farm usage of
tractors is on the rise and constitutes ~40% currently.
¡ Shortening replacement age of tractors further supports short term demand. The
replacement age has reduced from ~12 years to ~8 years. In case of extensive
use of tractors for non farm purposes, the replacement age stands further
reduced to 5 years
¡ Rising multiplier effect, indicating higher demand for tractors vs. the earlier
periods
¡ Shortage of labor is a serious problem, which has acted as a key catalyst for
tractor demand
The above factors make us believe that the industry can register a strong growth of
12.5% CAGR over FY11-14E, with an upward bias (implying 12%/10% growth in
FY13E/FY14E). Even if the above mentioned concerns play out, we believe that 8%
growth is possible in FY13.
The key beneficiary of the structural demand in tractors will be M&M, given its
balanced regional and product mix as well as the ability to understand and adapt to
the market dynamics. We have a BUY on the stock with a TP of Rs 920 per share. We
find valuations attractive as they are pricing in a sharp drop in EBIDTA/margins in
FY13.

8/2/2019 Auto Sector_Tractors_Eying New Highs
http://slidepdf.com/reader/full/auto-sectortractorseying-new-highs 4/16
Auto Sector: Tractors
Emkay Research 12 December 2011 4
Tractor demand – more stable than Cars/M&HCVs
Historical data indicates that demand for tractors has been more stable compared to
cars/trucks. As can be seen from the graphs below, tractor sales have been stable over a
longer period of time, except for the period from FY00-03. This period was marked by
monsoon failures/non availability of finance. From FY1973-2011, tractors have reported a
CAGR of 8.6% compared to 6.9% for M&HCV trucks. While car sales have reported a
CAGR of 12% during the period, a closer look indicates that growth has accelerated from
2002 onwards (CAGR of 9.8% till 2002).
Tractor and car sales since 1973 (Growth) Tractor and M&HCV truck sales since1973 (Growth)
-40%
-20%
0%
20%
40%
60%
F Y 7 4
F Y 7 6
F Y 7 8
F Y 8 0
F Y 8 2
F Y 8 4
F Y 8 6
F Y 8 8
F Y 9 0
F Y 9 2
F Y 9 4
F Y 9 6
F Y 9 8
F Y 0 0
F Y 0 2
F Y 0 4
F Y 0 6
F Y 0 8
F Y 1 0
Tractors (% YoY) Cars (% YoY)
-30%
-20%
-10%
0%
10%
20%
30%
40%
50%
F Y 7 4
F Y 7 7
F Y 8 0
F Y 8 3
F Y 8 6
F Y 8 9
F Y 9 2
F Y 9 5
F Y 9 8
F Y 0 1
F Y 0 4
F Y 0 7
F Y 1 0
Tractors (% YoY) M&HCV Trucks (% YoY)
Source: Company, SIAM, Emkay Research
Tractor penetration levels – extremely low
Despite the strong volume growth in the last few years (17% CAGR during FY08-FY11 and
20% YTDFY12), the Indian tractor industry is under penetrated when compared to other
countries. The penetration level at 19 tractors per 1000 hectare appears reasonable as
there are countries having much higher as well as lower penetration levels than India.
However, looking at the data in this fashion can be erroneous. We believe that penetration
level per 1000 agricultural people is a better indicator. Based on this parameter, India is
highly under penetrated, with penetration of 5 per 1000.
Tractors - Penetration per 1000 hectares Tractors – penetration per 1000 agri population
65 64
3025
1913
6 3
-
10
20
30
40
50
60
70
G e r m a n y
F r a n c e
C h i n a
U
S
I n d
i a
B r a z i l
A r g e n t i n
a
R u s s
i a
508
741
3.9
810
5.1 38 64 31
0100200300400500600700800900
G e r m a n y
F r a n c e
C h i n a
U
S
I n d
i a
B r a z i l
A r g e n t i n
a
R u s s
i a
Source: World Bank, Emkay Research Source: FAO, Emkay Research
Higher reliance on agriculture in India is the key reason for low penetration
There is a significantly high reliance of population on agriculture in India when compared to
other countries. As can be seen from the graph below, 48% of population in India is
dependent on agriculture, second only to China. Also, India is the only country, where there
has been a steady increase in population relying on agriculture. One of the reasons for the
same is a much faster pace of urbanization in other countries. The process of urbanization
is extremely slow in India. Across the globe there has been a sharp reduction in population
relying on agriculture. This is clearly evident from the fact that their current penetration
levels (per hectares) are significantly below their peak levels.

8/2/2019 Auto Sector_Tractors_Eying New Highs
http://slidepdf.com/reader/full/auto-sectortractorseying-new-highs 5/16
Auto Sector: Tractors
Emkay Research 12 December 2011 5
Dependence of population on agriculture Rising share of agri population in India (indexed to 100)
1.6% 2.0%
61%
1.7%
48%
11% 8% 8%
0%
10%20%
30%
40%
50%
60%
70%
G e r m a n y
F r a n c e
C h i n a
U S
I n d i a
B r a z i l
A r g e n t i n a
R u s s i a
20
40
60
80
100
120
140
1 9 8 0
1 9 8 2
1 9 8 4
1 9 8 6
1 9 8 8
1 9 9 0
1 9 9 2
1 9 9 4
1 9 9 6
1 9 9 8
2 0 0 0
2 0 0 2
2 0 0 4
2 0 0 6
2 0 0 8
2 0 1 0
Brazil Canada ChinaIndia Russia United States
Source: FAO, Emkay Research
Penetration per 1000 hectare Penetration per 1000 agri pop
Year Peak Current Corres. Period Current
Argentina 1988 10 6 66 64
Brazil 199415 13
24 38
Russia 1992 10 3 67 31
USA 1967 31 25 na 810
France 1981 85 64 344 741
Germany 1986 138 65 410 508
Source: FAO, Emkay Research
Fragmented land holding – an important reason for higher dependence
The farmer landholding is very fragmented in India. As can be seen from the graph below,
62% of farmers account for 19% of land holding in India. Also, average land holding at ~2.6
acre is significantly low as compared to 444 acre in US, 675 acre in Canada and 45 acre in
EU. Given the shortage of labor and easy finance availability, we understand that there has
been sharing of tractors by small farmers. But for concerns to arise with respect to demand,the consolidation has to be far more significant.
Population of farmers Area under operations
62%19%
12%6% 1%
Marginal Small Semi-Medium Medium Large
19%
20%
24%
24%
13%
Marginal Small Semi-Medium Medium Large
Source: Ministry of Agriculture, GOI, Emkay Research
Rising penetration of finance
The clear focus of the government to increase the penetration of finance in rural areas is
evident from rising rural credit and more importantly, increase in bank’s rural network.
Another interesting point to note is that the increase in coverage is driven by reduction in
branches and increase in mobile units. This indicates focus on low cost/profitable businessmodel. This makes us believe in the sustenance and increase in rural penetration of banks
8/2/2019 Auto Sector_Tractors_Eying New Highs
http://slidepdf.com/reader/full/auto-sectortractorseying-new-highs 6/16
Auto Sector: Tractors
Emkay Research 12 December 2011 6
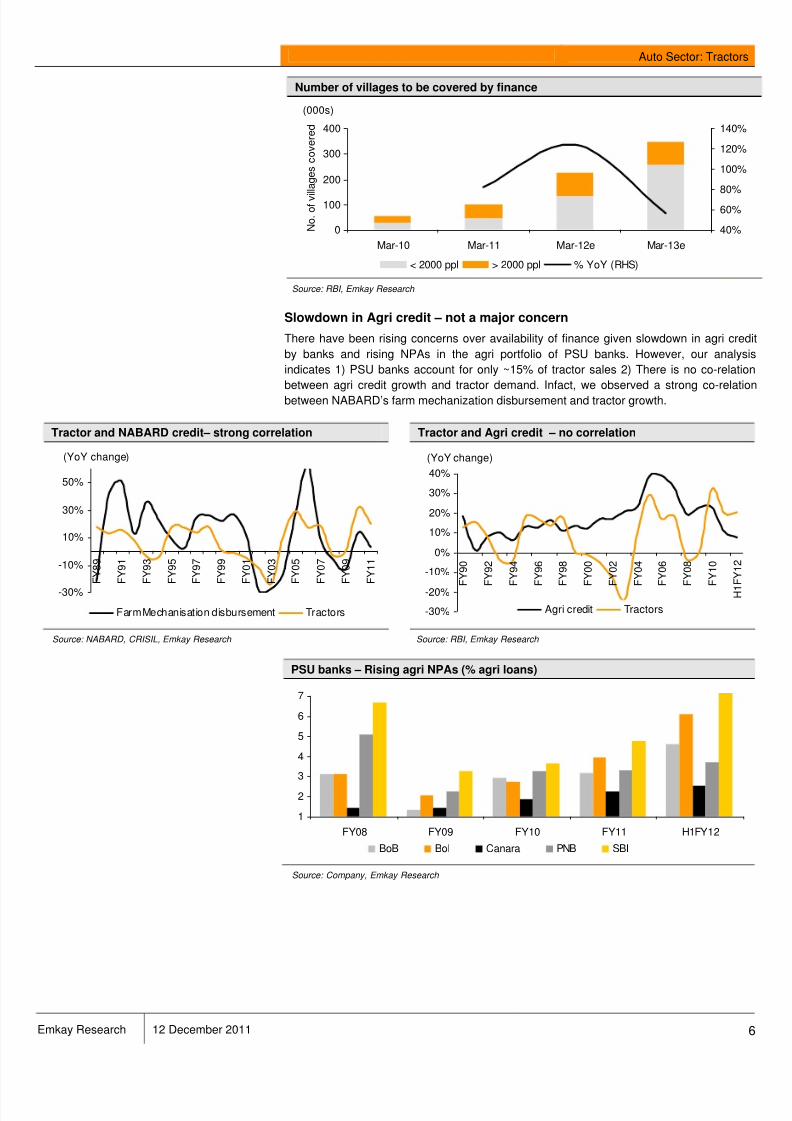
Number of villages to be covered by finance
0
100
200
300
400
Mar-10 Mar-11 Mar-12e Mar-13e
N o . o f v i l l a g e s c o v e r e d
40%
60%
80%
100%
120%
140%
< 2000 ppl > 2000 ppl % YoY (RHS)
(000s)
Source: RBI, Emkay Research
Slowdown in Agri credit – not a major concern
There have been rising concerns over availability of finance given slowdown in agri credit
by banks and rising NPAs in the agri portfolio of PSU banks. However, our analysis
indicates 1) PSU banks account for only ~15% of tractor sales 2) There is no co-relation
between agri credit growth and tractor demand. Infact, we observed a strong co-relationbetween NABARD’s farm mechanization disbursement and tractor growth.
Tractor and NABARD credit– strong correlation Tractor and Agri credit – no correlation
-30%
-10%
10%
30%
50%
F Y
8 9
F Y
9 1
F Y
9 3
F Y
9 5
F Y
9 7
F Y
9 9
F Y
0 1
F Y
0 3
F Y
0 5
F Y
0 7
F Y
0 9
F Y
1 1
Farm Mechanisation disbursement Tractors
(YoY change)
-30%
-20%
-10%
0%
10%
20%
30%
40%
F Y 9 0
F Y 9 2
F Y 9 4
F Y 9 6
F Y 9 8
F Y 0 0
F Y 0 2
F Y 0 4
F Y 0 6
F Y 0 8
F Y 1 0
H 1 F Y
1 2
Agri credit Tractors
(YoY change)
Source: NABARD, CRISIL, Emkay Research Source: RBI, Emkay Research
PSU banks – Rising agri NPAs (% agri loans)
1
2
3
4
5
6
7
FY08 FY09 FY10 FY11 H1FY12
BoB BoI Canara PNB SBI
Source: Company, Emkay Research

8/2/2019 Auto Sector_Tractors_Eying New Highs
http://slidepdf.com/reader/full/auto-sectortractorseying-new-highs 7/16
Auto Sector: Tractors
Emkay Research 12 December 2011 7
Non – farm usage of tractors – on the rise
In the last few years, there has been a sharp increase in non farm use of tractors. Also,
there are rising instances of non-farm use of tractors being a primary objective of purchase.
Currently, we estimate that approximately 40% of tractor usage will be for non farm
purposes. We attribute a sharp jump in the non-farm use to favorable cost economics over
construction equipments and lack of regulation restricting the non-farm use of tractors. A
sharp jump in the share of higher HP tractors corroborates our view point. However, we
would like to highlight that, the proportion of tractors brought for primarily non farm purpose
is not very significant (~ 10% to 15%)
Rising non-farm use of tractors Rising share of higher HP tractors
0
100
200
300
400
500
600
FY06 FY07 FY08 FY09 FY10 FY11 FY12e
10%15%
20%
25%
30%
35%
40%
45%
50%
Tractors ('000 units) % Non farm use (RHS)
5%
10%
15%
20%
25%
30%
FY06 FY07 FY08 FY09 FY10 FY11 YTD12 Oct-12
41-50 hp 51 hp and above
Source: CRISIL, Emkay Research
Replacement demand – a key support in the near term
Our analysis of replacement demand indicates that industry can register a FY11-FY14
CAGR of ~12.5% (implying a growth of 12%/10% in FY13E/FY14E) largely supported by
replacement demand. We understand that the replacement cycle for agricultural tractors
has shortened from ~12 years to ~8 years. In case of tractors used extensively for non -
farm purpose, the replacement age is ~5 years. As can be seen from the table below,
strong replacement demand (assuming ~5% scrappage) will result in a reasonable single
digit growth in new tractor demand.
Tractors FY07 FY08 FY09 FY10 FY11 FY12E FY13E FY14E
Domestic tractor sales 313,941 302,948 304,622 402,586 482,262 559,424 626,555 689,210
% YoY 18.5% -3.5% 0.6% 32.2% 19.8% 16.0% 12.0% 10.0%
Non agri usage (%) 20% 25% 25% 30% 35% 40% 40% 40%
Replacement Age (7 and 5 years)
New Sales 63,342 80,013 112,101 223,822 282,313 328,017 353,287 378,267
% YoY 31.8% 26.3% 40.1% 99.7% 26.1% 16.2% 7.7% 7.1%
Replacement Sales 250,599 222,935 192,521 178,764 199,949 231,407 273,267 310,943
% YoY 15.6% -11.0% -13.6% -7.1% 11.9% 15.7% 18.1% 13.8%
Replacement Age (8 and 5 years)
New Sales 65,138 57,887 86,310 182,217 296,108 350,155 382,846 415,545
% YoY -16.5% -11.1% 49.1% 111.1% 62.5% 18.3% 9.3% 8.5%
Replacement Sales 248,803 245,061 218,312 220,369 186,154 209,269 243,709 273,665
% YoY 33.2% -1.5% -10.9% 0.9% -15.5% 12.4% 16.5% 12.3%
Replacement Age (9 and 5 years)
New Sales 86,374 55,215 64,183 156,426 254,503 363,951 404,985 445,104
% YoY -14.8% -36.1% 16.2% 143.7% 62.7% 43.0% 11.3% 9.9%
Replacement Sales 227,567 247,733 240,439 246,160 227,759 195,473 221,570 244,106
% YoY 39.2% 8.9% -2.9% 2.4% -7.5% -14.2% 13.4% 10.2%
Source: CRISIL, Emkay Research

8/2/2019 Auto Sector_Tractors_Eying New Highs
http://slidepdf.com/reader/full/auto-sectortractorseying-new-highs 8/16
Auto Sector: Tractors
Emkay Research 12 December 2011 8
Rising multiplier effect
As can be seen from the graphs below, there is a clear multiplier impact visible for tractors
vis-à-vis agriculture (CAGR tractors/CAGR Agri GDP). This can be attributed to a number of
factors like higher farm income, improving awareness amongst farmers, rising wealth, labor
shortages, etc. However, when compared to GDP, the multiplier impact is not really visible.
This can be attributed to declining share of agriculture in the overall economy. However,
over the last six years, the scenario is changing with the growth rate exceeding historical
growth. Also, increasing use of tractors for non agri purpose will have some impact on the
multiplier impact when co-related to GDP. We believe that this is sustainable and tractor
demand can explode, going forward.
10 yr multiplier effect on tractor demand
-0.5
1.0
1.5
2.0
2.5
3.0
F Y 0 3
F Y 0 4
F Y 0 5
F Y 0 6
F Y 0 7
F Y 0 8
F Y 0 9
F Y 1 0
F Y 1 1
Vols/GDP Vols/Agri Trendline (Vols/GDP) Trendline (Vols/Agri)
Source: CRISIL, CMIE, Emkay Research
5 yr multiplier effect on tractor demand 3 yr multiplier effect on tractor demand
(8)
(6)
(4)
(2)
-
2
4
6
F Y 9 8
F Y 9 9
F Y 0 0
F Y 0 1
F Y 0 2
F Y 0 3
F Y 0 4
F Y 0 5
F Y 0 6
F Y 0 7
F Y 0 8
F Y 0 9
F Y 1 0
F Y 1 1
Vols/GDP Vols/Agri
Trendline (Vols/GDP) Trendline (Vols/Agr i)
(4)
(2)
-
2
4
6
8
F Y 9 6
F Y 9 7
F Y 9 8
F Y 9 9
F Y 0 0
F Y 0 1
F Y 0 2
F Y 0 3
F Y 0 4
F Y 0 5
F Y 0 6
F Y 0 7
F Y 0 8
F Y 0 9
F Y 1 0
F Y 1 1
Vols/GDP Vols/Agri
Trendline (Vo ls/GDP) Trendline (Vo ls/Agri)
Source: CRISIL, CMIE, Emkay Research
Labor shortage - a serious problem due to increase in alternative options
Labor shortage is the most important structural change that will drive farm mechanization.
We understand that shortage of labor is a serious issue faced by the farmers. Theshortages are arising from two sources – (1) various government schemes like MGNREGA
(2) choice of alternative profession for the young population. Both of these have resulted in
diversion of labor to various other industries.

8/2/2019 Auto Sector_Tractors_Eying New Highs
http://slidepdf.com/reader/full/auto-sectortractorseying-new-highs 9/16
Auto Sector: Tractors
Emkay Research 12 December 2011 9
MGNREGA – rising employment and wages
10
20
30
40
50
60
FY07 FY08 FY09 FY10 FY11
50
60
70
80
90
100
110
Households (in mn) Wage Rate (Rs/day RHS)
Source: NREGA, Emkay Research
Summary
We believe that the demand for tractors in India is nowhere near its peak. Given the
increasing (1) awareness amongst farmers (2) higher income in the hands of farmer and (3)
labor shortage, demand will continue to remain strong. It should be noted that during the
green revolution in Punjab, tractor demand grew at a scorching pace of >20% for more thana decade. We believe that the tractor industry is well positioned to achieve above average
growth rates in the near future led by rising participation and awareness in other key states.
We believe that the tractor industry can report a strong double digit growth in FY13. We are
modeling a growth of 12%/10% in FY13/FY14 in our estimates, with an upward bias.
Punjab – Volume CAGR for tractors during green revolution
0%
10%
20%
30%
40%
50%
1961-66 1966-72 1972-77
Source: Emkay Research

8/2/2019 Auto Sector_Tractors_Eying New Highs
http://slidepdf.com/reader/full/auto-sectortractorseying-new-highs 10/16
Auto Sector: Tractors
Emkay Research 12 December 2011 10
Key concerns
Key concerns arise from certain near term developments, which, if persists, can have a
negative impact on demand in the short term. The most important focus areas are – (1)
Declining Agri terms of trade (ATOT) (2) Lack of buying support from Food Corporation of
India, given the historic high food grain stocks. This can have a serious implication on farm
income as farmers would be forced to sell their produce below MSPs. This can create strain
on their cash flows. (3) Availability of finance.
We have not come across any major correlation with declining ATOT and tractor demand.
However, we do give importance to the same as it indicates purchasing power of farmers.
We do not see, slowdown in agri credit by banks as a major concern as PSU banks account
for only ~15% of tractor lending However, if the risk of slower credit/NPA spreads to
NBFCs, who are a bigger players in tractor financing, it can have an adverse impact on
tractor demand.
FCI – Historic high foodgrain stock ATOT: On a decline
0%
10%
20%
30%
40%
J a n - 0 0
J u l - 0 0
J a n - 0 1
J u l - 0 1
J a n - 0 2
J u l - 0 2
J a n - 0 3
J u l - 0 3
J a n - 0 4
J u l - 0 4
J a n - 0 5
J u l - 0 5
J a n - 0 6
J u l - 0 6
J a n - 0 7
J u l - 0 7
J a n - 0 8
J u l - 0 8
J a n - 0 9
J u l - 0 9
J a n - 1 0
J u l - 1 0
J a n - 1 1
J u l - 1 1
0100200300
400500600
700
Rice Wheat Foodgrain Stock (RHS)
In lakh tonnesProcurement (% of total prod.)
0.90
0.95
1.00
1.05
1.10
1.15
1.20
O c t - 9 5
O c t - 9 7
O c t - 9 9
O c t - 0 1
O c t - 0 3
O c t - 0 5
O c t - 0 7
O c t - 0 9
O c t - 1 1
(40)
(20)
-
20
40
60
80
ATOT Tractor (% YoY RHS)
Source: FCI, Emkay Research Source: CMIE, Emkay Research
M&M – the key beneficiaryM&M derives ~40% of its revenues and ~50% of its EBIT from farm equipment business.
More importantly, over the years, M&M has improved its business model and achieved
undisputable leadership by way of clear focus on (1) regional mix (2) customer
requirements (3) innovation/customization of products. From here on, there is a higher
focus of the company on farm mechanization and not just tractors. We have a BUY rating
on the stock, with a TP of Rs 920. We find valuations attractive as valuations are factoring
in a sharp drop in EBIDTA/margins in FY13.
M&M: Market share – HP wise M&M: Market share – Region wise
10%
20%
30%
40%50%
60%
FY06 FY07 FY08 FY09 FY10 FY11 Aug-11
Up to 30 HP 31-40 HP
41-50 HP 51 HP and above
10%
20%
30%
40%
50%
60%
FY06 FY07 FY08 FY09 FY10 FY11
North South East West
Source: CRISIL, Emkay Research

8/2/2019 Auto Sector_Tractors_Eying New Highs
http://slidepdf.com/reader/full/auto-sectortractorseying-new-highs 11/16Emkay Global Financial Services Ltd 11
Financial Snapshot (Standalone) (Rs mn)
YE- Net EBITDA EPS EPS RoE EV/
Mar Sales (Core) (%) APAT (Rs) % chg (%) P/E EBITDA P/BV
FY10 185,296 28,828 15.6 19,459 31.7 145.3 29.8 21.6 12.7 5.4
FY11 233,119 33,003 14.2 23,887 38.9 22.8 26.3 17.6 10.4 4.1
FY12E 308,821 37,358 12.1 27,684 45.1 15.9 24.5 15.2 8.8 3.4
FY13E 371,834 43,736 11.8 32,900 53.6 18.8 24.6 12.8 6.9 2.9
December 12, 2011
Reco
Buy
Previous Reco
BuyCMP
Rs 684
Target Price
Rs 920
EPS change FY12E/13E (%) NA
Target Price change (%) (1)
Nifty 4,765
Sensex 15,870
Price Performance
(%) 1M 3M 6M 12M
Absolute (18) (14) 3 (12)
Rel. to Nifty (11) (8) 19 8
Source: Bloomberg
Relative Price Chart
550
615
680
745
810
875
Dec-10 Feb-11 Apr-11 Jun-11 Aug-11 Oct-11
Rs
-20
-10
0
10
20
30%
Mah & Mah (LHS) Rel to Nifty (RHS)
Source: Bloomberg
Stock Details
Sector Automobiles
Bloomberg MM@IN
Equity Capital (Rs mn) 3070
Face Value(Rs) 5
No of shares o/s (mn) 614
52 Week H/L 875/584
Market Cap (Rs bn/USD mn) 420/7,981
Daily Avg Volume (No of sh) 2013874
Daily Avg Turnover (US$mn) 29.9
Shareholding Pattern (%)
Sep-11 Jun-11 Mar-11
Promoters 25.2 24.9 24.9
FII/NRI 36.7 33.8 32.7
Institutions 20.6 22.6 23.6
Private Corp 9.4 10.3 10.2
Public 8.2 8.5 8.6
Source: Capitaline
Chirag Shah
[email protected]+91 22 6612 1252
Siddhartha Bera
+91 22 6624 2494
¾ Valuations factoring in ~27% YoY drop in EBIDTA in FY13 (38%
vs our est), implying margins at 7.3% vs 12.1% in FY12E.
Believe concerns are overdone
¾ Balanced product mix and new product launches to provide
cushion against negative surprise in a particular segment
¾ MVML to account for most of the increased volumes (16% of
FY13 volumes), thereby putting pressure on standalone
margins. Valued MVML at Rs 70 per share
¾ Retain BUY on the stock with a SOTP based TP of Rs 920
(M&M – Rs 713, MVML – Rs 70, listed subsidiaries – Rs 137)
Valuations – factoring in ~38% drop in EBIDTA in FY13
Current valuations are factoring in ~38% drop in EBIDTA in FY13 vs our estimates(implying, 27% YoY decline). We believe that such a sharp drop in EBIDTA is unlikely,
thereby providing cushion against further downside.
Product profile – strong brand equity and balanced mix
M&M continues to enjoy strong brand equity across product segments (Market share of
~53% in UVs and ~42% in tractors), which led to its above industry growth rates in
H2FY12. We expect the current product portfolio to sustain volume momentum, driven by
strong non-urban demand. M&M’s tractor volumes will benefit from presence across India
and across HP segments (Yuvraj in low HP to Arjun in high HP).
New launches – the key volume driver in FY13
Recent launches (Maximmo, Genio, XUV5OO etc) have filled the gap in their productportfolio (no presence or weak presence). More importantly, new launches have achieved
reasonable success. We understand there is a waiting period for some of its products.
This, coupled with potential new launches (mini Xylo, etc), should ensure M&M
outperforming the industry growth in FY13. We forecast volume CAGR of ~12% for FY11-
13E in the UV segment and ~23% CAGR in pick-up segments (including Gio and
Maxximo) with an upward bias.
MVML and Ssangyong – future value creators
We see value in MVML, 100% manufacturing subsidiary, given the fact, most of the new
product will be manufactured at the subsidiary (16% of FY13 volumes). This will result in
pressure on margins in the standalone entity. Ssangyong which is in a turnaround phase
can also bring in value as and when the operations stabilize.
Valuations
We value the company on a SOTP basis. We have assigned a value of Rs 713 to its
standalone business and Rs 137 to listed subsidiaries and Tech Mahindra. We value
MVML business at Rs 70 per share on FY13 estimates. We believe there exists a strong
potential for higher value from MVML as and when product ramp up happens and
earnings visibility improves.
C o m p
a n y U p d a t e
Mahindra & Mahindra Ltd.
Valuations factoring in the risks
8/2/2019 Auto Sector_Tractors_Eying New Highs
http://slidepdf.com/reader/full/auto-sectortractorseying-new-highs 12/16
Mahindra & Mahindra Ltd. Auto Sector: Tractors
Emkay Research 12 December 2011 12
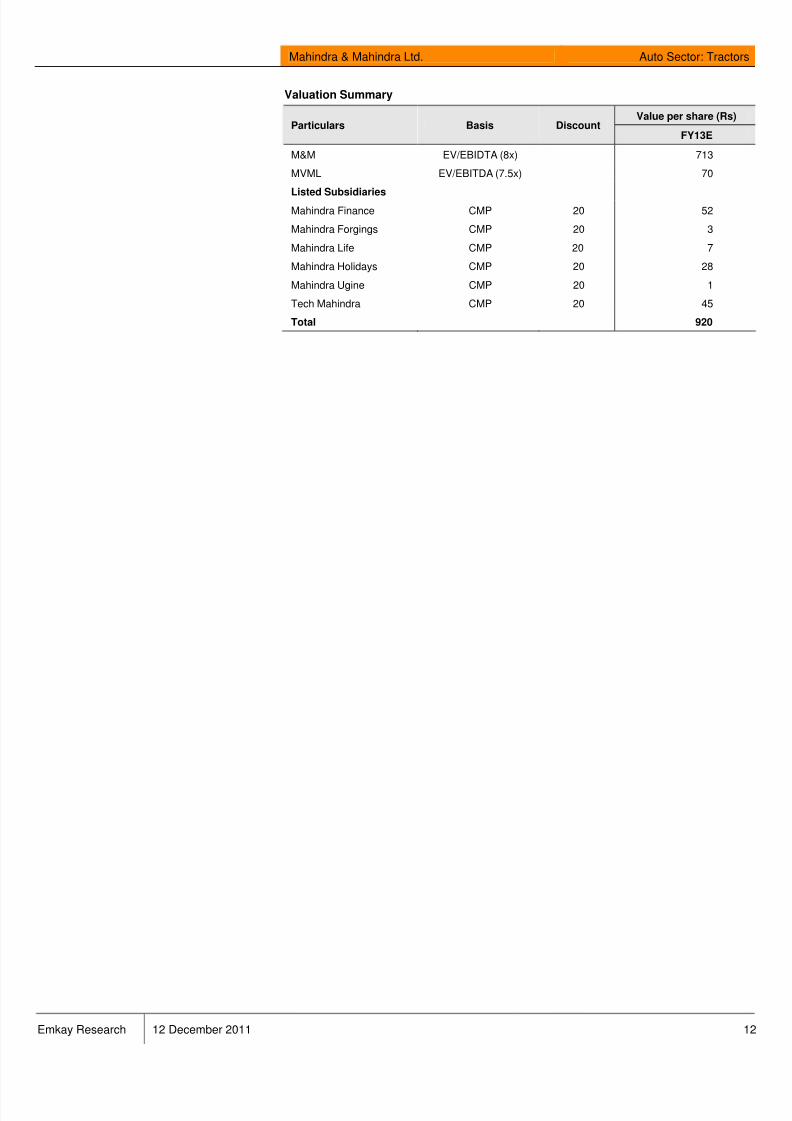
Valuation Summary
Value per share (Rs)Particulars Basis Discount
FY13E
M&M EV/EBIDTA (8x) 713
MVML EV/EBITDA (7.5x) 70
Listed Subsidiaries
Mahindra Finance CMP 20 52
Mahindra Forgings CMP 20 3
Mahindra Life CMP 20 7
Mahindra Holidays CMP 20 28
Mahindra Ugine CMP 20 1
Tech Mahindra CMP 20 45
Total 920

8/2/2019 Auto Sector_Tractors_Eying New Highs
http://slidepdf.com/reader/full/auto-sectortractorseying-new-highs 13/16
Mahindra & Mahindra Ltd. Auto Sector: Tractors
Emkay Research 12 December 2011 13
Valuations factoring in 38% drop in EBIDTA vs our est. Diversified/balanced product mix
Rs mn FY13E FY13E
Market cap - Conso 419,962 419,962
Market cap - Listed subs. 83,930 83,930
Market cap - M&M+MVML 336,032 336,032
Net debt/(cash) (74,637) (74,637)EV – M&M+MVML 261,395 261,395
EV - MVML (7.5x) 43,265 43,265
EV - M&M (bal) 218,130 218,130
M&M EBITDA
EV/EBITDA Multiple 7 x 8 x
M&M EBITDA (implied) 31,161 27,266
Drop in M&M EBITDA (vs our est.) -29% -38%
0%
20%
40%
60%
80%
100%
FY10 FY11 FY12E FY13E
Bolero Scorpio Xylo XUV5OO Others
Pick ups 3 Wheeler Tractor Exports
Volume growth in high double digits across segments… … followed by improving market share
-20%
0%
20%
40%
60%80%
100%
Q 1 F Y 0 8
Q 2 F Y 0 8
Q 3 F Y 0 8
Q 4 F Y 0 8
Q 1 F Y 0 9
Q 2 F Y 0 9
Q 3 F Y 0 9
Q 4 F Y 0 9
Q 1 F Y 1 0
Q 2 F Y 1 0
Q 3 F Y 1 0
Q 4 F Y 1 0
Q 1 F Y 1 1
Q 2 F Y 1 1
Q 3 F Y 1 1
Q 4 F Y 1 1
Q 1 F Y 1 2
Q 2 F Y 1 2
UV LCV (<3.5t) Tractors
20%
30%
40%
50%
60%
Q 1 F Y 0 8
Q 2 F Y 0 8
Q 3 F Y 0 8
Q 4 F Y 0 8
Q 1 F Y 0 9
Q 2 F Y 0 9
Q 3 F Y 0 9
Q 4 F Y 0 9
Q 1 F Y 1 0
Q 2 F Y 1 0
Q 3 F Y 1 0
Q 4 F Y 1 0
Q 1 F Y 1 1
Q 2 F Y 1 1
Q 3 F Y 1 1
Q 4 F Y 1 1
Q 1 F Y 1 2
Q 2 F Y 1 2
UV LCV (<3.5t) Tractors
Structurally higher EBIT margins of tractors led by….. … shift towards higher HP segment
5%
10%
15%
20%
25%
Q 1 F Y 0 8
Q 2 F Y 0 8
Q 3 F Y 0 8
Q 4 F Y 0 8
Q 1 F Y 0 9
Q 2 F Y 0 9
Q 3 F Y 0 9
Q 4 F Y 0 9
Q 1 F Y 1 0
Q 2 F Y 1 0
Q 3 F Y 1 0
Q 4 F Y 1 0
Q 1 F Y 1 1
Q 2 F Y 1 1
Q 3 F Y 1 1
Q 4 F Y 1 1
Q 1 F Y 1 2
Q 2 F Y 1 2
Uvs Tractors
0%
20%
40%
60%
80%
100%
F Y 0 6
F Y 0 7
F Y 0 8
F Y 0 9
F Y 1 0
F Y 1 1
<30HP 31-40HP 41-50HP >50HP
Rising MVML production to lower standalone margins Healthy cash flow generation and return ratios
0
50
100
150
F Y 1 0
F Y 1 1
F Y 1 2 E
F Y 1 3 E
0%
5%
10%
15%
20%
Uvs/LCVs XUV5OO
Others % of total sales (RHS)
'000 units
0%
5%
10%
15%
20%
25%
30%
F Y 0 5
F Y 0 6
F Y 0 7
F Y 0 8
F Y 0 9
F Y 1 0
F Y 1 1
F Y 1 2 E
F Y 1 3 E
0%
2%
4%
6%
8%
10%
EBITDA Stand.(%) ROCE FCF (% of Sales)
FCF (% Sales)
Source: Company, Emkay Research

8/2/2019 Auto Sector_Tractors_Eying New Highs
http://slidepdf.com/reader/full/auto-sectortractorseying-new-highs 14/16
Mahindra & Mahindra Ltd. Auto Sector: Tractors
Emkay Research 12 December 2011 14
Key Financials (Standalone)
Income Statement Balance Sheet
Y/E, Mar (Rs. mn) FY10 FY11 FY12E FY13E Y/E, Mar (Rs. mn) FY10 FY11 FY12E FY13E
Net Sales 185,296 233,119 308,821 371,834 Equity share capital 2,910 3,276 3,276 3,276
Growth (%) 42.0 25.8 32.5 20.4 Reserves & surplus 75,393 99,858 119,195 142,176
Expenditure 156,469 200,116 271,463 328,098 Net worth 78,302 103,134 122,471 145,452
Materials Consumed 123,462 162,633 225,514 274,440 Minority Interest - - - -Employee Cost 11,985 14,197 17,181 19,814 Secured Loans 6,025 4,072 4,072 4,072
Other Exp 21,022 23,287 28,768 33,844 Unsecured Loans 22,777 19,981 19,981 17,981
EBITDA 28,828 33,003 37,358 43,736 Loan Funds 28,802 24,053 24,053 22,053
Growth (%) 175.1 14.5 13.2 17.1 Net deferred tax liability 2,403 3,544 3,544 3,544
EBITDA margin (%) 15.6 14.2 12.1 11.8 Total Liabilities 109,507 130,731 150,068 171,049
Depreciation 3,708 4,139 4,616 5,138
EBIT 25,120 28,864 32,741 38,599 Gross Block 52,763 62,277 73,277 80,277
EBIT margin (%) 13.6 12.4 10.6 10.4 Less: Depreciation 25,378 28,417 33,034 38,172
Other Income 1,994 3,095 3,494 4,411 Net block 27,385 33,860 40,243 42,106
Interest expenses 278 (503) (191) (280) Capital work in progress 9,642 9,859 9,000 9,000
PBT 26,835 32,462 36,427 43,290 Investment 63,980 93,253 109,253 127,253
Tax 7,376 8,575 8,742 10,390 Current Assets 60,424 61,435 80,480 100,003
Effective tax rate (%) 27.5 26.4 24.0 24.0 Inventories 11,888 16,942 22,920 27,602
Adjusted PAT 19,459 23,887 27,684 32,900 Sundry debtors 12,581 13,547 19,253 23,186
Growth (%) 145.3 22.8 15.9 18.8 Cash & bank balance 17,432 6,146 6,871 11,577
Net Margin (%) 10.5 10.2 9.0 8.8 Loans & advances 18,014 23,732 30,369 36,571
(Profit)/loss from JV's/Ass/MI - - - - Other current assets 509 1,067 1,067 1,067
Adj. PAT after MI 19,459 23,887 27,684 32,900 Current lia & Prov 51,965 67,676 88,909 107,313
E/O items 1,418 2,734 - - Current liabilities 34,000 47,617 55,780 67,417
Reported PAT 20,878 26,621 27,684 32,900 Provisions 17,965 20,059 33,129 39,896
Growth (%) 149.5 27.5 4.0 18.8 Net current assets 8,458 (6,241) (8,429) (7,310)
Misc. exp 41 - - -
37,358 43,736 Total Assets 109,507 130,731 150,068 171,049
Cash Flow Key ratios
Y/E, Mar (Rs. mn) FY10 FY11 FY12E FY13E Y/E, Mar FY10 FY11 FY12E FY13E
PBT (Ex-Other income) 24,842 29,367 32,932 38,879 Profitability (%)
Depreciation 3,708 4,139 4,616 5,138 EBITDA Margin 15.6 14.2 12.1 11.8
Interest Provided 278 (503) (191) (280) Net Margin 10.5 10.2 9.0 8.8
Other Non-Cash items 6,032 1,956 - ROCE 26.8 26.6 25.8 26.8
Chg in working cap (4,119) 3,413 2,913 3,587 ROE 29.8 26.3 24.5 24.6
Tax paid (7,376) (8,575) (8,742) (10,390) RoIC 162.1 144.7 141.1 160.3
Operating Cashflow 23,365 29,798 31,528 36,934 Per Share Data (Rs)
Capital expenditure (6,999) (9,731) (10,141) (7,000) DEPS 31.7 38.9 45.1 53.6
Free Cash Flow 16,366 20,067 21,386 29,934 CEPS 37.7 45.6 52.6 62.0Other income 1,994 5,829 3,494 4,411 BVPS 127.5 168.0 199.5 236.9
Investments (8,449) (33,448) (16,000) (18,000) DPS 9.4 10.8 11.2 13.3
Investing Cashflow (6,456) (27,619) (12,506) (13,589) Valuations (x)
Equity Capital Raised 118 366 - - PER 21.6 17.6 15.2 12.8
Loans Taken / (Repaid) (11,726) (4,749) (0) (2,000) P/CEPS 18.1 15.0 13.0 11.0
Interest Paid (278) 503 191 280 P/BV 5.4 4.1 3.4 2.9
Dividend paid (incl tax) (6,238) (8,026) (8,347) (9,920) EV / Sales 2.0 1.5 1.1 0.8
Income from investments - - - - EV / EBITDA 12.7 10.4 8.8 6.9
Others 10,103 8,173 - - Dividend Yield (%) 1.4 1.6 1.6 1.9
Financing Cashflow (8,021) (3,733) (8,156) (11,639) Gearing Ratio (x)
Net chg in cash 1,890 (11,286) 725 4,705 Net Debt/ Equity 0.00 0.09 (0.00) (0.10)
Opening cash position* 15,618 17,432 6,146 6,871 Net Debt/EBIDTA 0.00 0.29 (0.00) (0.34)Closing cash position* 17,432 6,147 6,871 11,577 Working Cap Cycle (days) (18.78) (26.82) (16.08) (16.32)

8/2/2019 Auto Sector_Tractors_Eying New Highs
http://slidepdf.com/reader/full/auto-sectortractorseying-new-highs 15/16
Auto Sector: Tractors
Emkay Research 12 December 2011 15
BUY Expected total return (%) (stock price appreciation and dividend yield) of over 25% within the next 12-18 months.
ACCUMULATE Expected total return (%) (stock price appreciation and dividend yield) of over 10% within the next 12-18 months.
HOLD Expected total return (%) (stock price appreciation and dividend yield) of upto 10% within the next 12-18 months.
REDUCE Expected total return (%) (stock price depreciation) of upto (-)10% within the next 12-18 months.
SELL The stock is believed to under perform the broad market indices or its related universe within the next 12-18 months.
Emkay Rating Distribution
DISCLAIMER: This document is not for public distribution and has been furnished to you solely for your information and may not be reproduced or redistributed to anyother person. The manner of circulation and distribution of this document may be restricted by law or regulation in certain countries, including the United States. Personsinto whose possession this document may come are required to inform themselves of, and to observe, such restrictions. This material is for the personal information of theauthorized recipient, and we are not soliciting any action based upon it. This report is not to be construed as an offer to sell or the solicitation of an offer to buy any securityin any jurisdiction where such an offer or solicitation would be illegal. No person associated with Emkay Global Financial Services Ltd. is obligated to call or initiate contactwith you for the purposes of elaborating or following up on the information contained in this document. The material is based upon information that we consider reliable, butwe do not represent that it is accurate or complete, and it should not be relied upon. Neither Emkay Global Financial Services Ltd., nor any person connected with it,accepts any liability arising from the use of this document. The recipient of this material should rely on their own investigations and take their own professional advice.Opinions expressed are our current opinions as of the date appearing on this material only. While we endeavor to update on a reasonable basis the information discussed
in this material, there may be regulatory, compliance, or other reasons that prevent us from doing so. Prospective investors and others are cautioned that any forward-looking statements are not predictions and may be subject to change without notice. We and our affiliates, officers, directors, and employees world wide, including personsinvolved in the preparation or issuance of this material may; (a) from time to time, have long or short positions in, and buy or sell the securities thereof, of company (ies)mentioned herein or (b) be engaged in any other transaction involving such securities and earn brokerage or other compensation or act as a market maker in the financialinstruments of the company (ies) discussed herein or may perform or seek to perform investment banking services for such company(ies)or act as advisor or lender / borrower to such company(ies) or have other potential conflict of interest with respect to any recommendation and related information and opinions. The same persons mayhave acted upon the information contained here. No part of this material may be duplicated in any form and/or redistributed without Emkay Global Financial ServicesLtd.’sprior written consent. No part of this document may be distributed in Canada or used by private customers in the United Kingdom. In so far as this report includescurrent or historical information, it is believed to be reliable, although its accuracy and completeness cannot be guaranteed.

8/2/2019 Auto Sector_Tractors_Eying New Highs
http://slidepdf.com/reader/full/auto-sectortractorseying-new-highs 16/16
EMKAY GLOBAL FINANCIAL SERVICES LIMITED