auto loan refinancing could top 14 percent in...
TRANSCRIPT
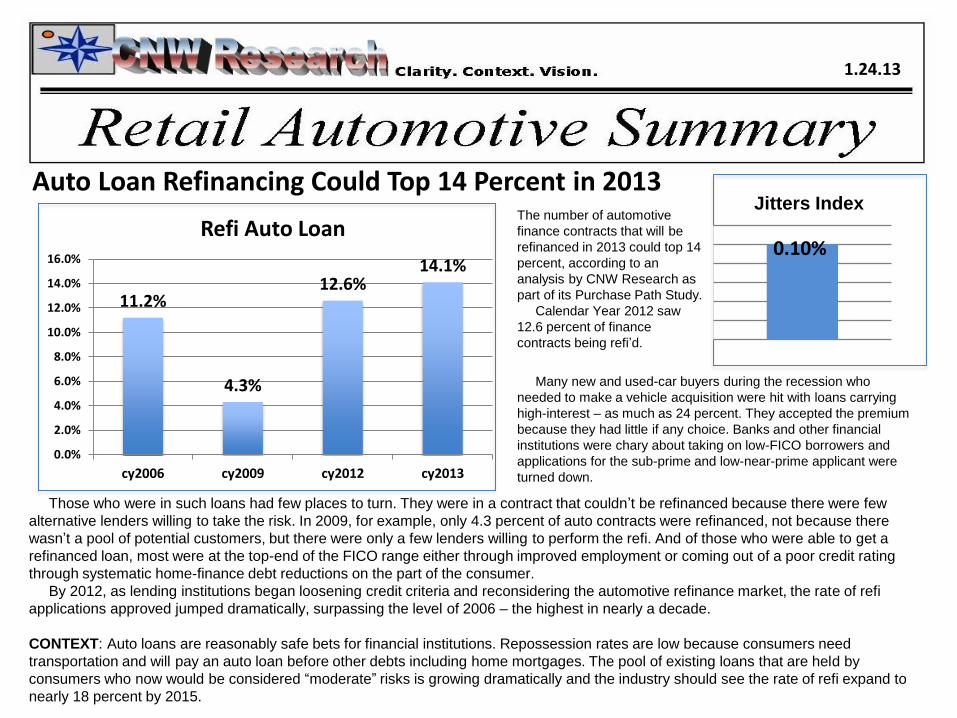
Auto Loan Refinancing Could Top 14 Percent in 2013 The number of automotive
finance contracts that will be
refinanced in 2013 could top 14
percent, according to an
analysis by CNW Research as
part of its Purchase Path Study.
Calendar Year 2012 saw
12.6 percent of finance
contracts being refi’d.
1.24.13
Those who were in such loans had few places to turn. They were in a contract that couldn’t be refinanced because there were few
alternative lenders willing to take the risk. In 2009, for example, only 4.3 percent of auto contracts were refinanced, not because there
wasn’t a pool of potential customers, but there were only a few lenders willing to perform the refi. And of those who were able to get a
refinanced loan, most were at the top-end of the FICO range either through improved employment or coming out of a poor credit rating
through systematic home-finance debt reductions on the part of the consumer.
By 2012, as lending institutions began loosening credit criteria and reconsidering the automotive refinance market, the rate of refi
applications approved jumped dramatically, surpassing the level of 2006 – the highest in nearly a decade.
CONTEXT: Auto loans are reasonably safe bets for financial institutions. Repossession rates are low because consumers need
transportation and will pay an auto loan before other debts including home mortgages. The pool of existing loans that are held by
consumers who now would be considered “moderate” risks is growing dramatically and the industry should see the rate of refi expand to
nearly 18 percent by 2015.
Jitters Index
0.10%
11.2%
4.3%
12.6% 14.1%
0.0%
2.0%
4.0%
6.0%
8.0%
10.0%
12.0%
14.0%
16.0%
cy2006 cy2009 cy2012 cy2013
Refi Auto Loan
Many new and used-car buyers during the recession who
needed to make a vehicle acquisition were hit with loans carrying
high-interest – as much as 24 percent. They accepted the premium
because they had little if any choice. Banks and other financial
institutions were chary about taking on low-FICO borrowers and
applications for the sub-prime and low-near-prime applicant were
turned down.
6.31% 12.05% 10.8%
Page 2… CNW Research: Retail Automotive Summary
Closing Ratio Closing Ratio
5.06%
January Sales Could Set the Pace for a 15.7 Million Unit Year; Still Uncertainties, Tho
It’s a mixed bag of signals for January. On one hand, deliveries during the opening weeks of January are nearly 13 percent higher than last
year’s solid January numbers (see Back Page), but same-store sales are up barely 6 percent leaving much of the increase in the first half of
January to new facilities and those that were partially closed due to extensive remodeling. The latter dealerships tend to skew the sales numbers
upward since “grand opening” sales are always well above the planning potential for a particular dealership.
Add to this the fact that more than 18 percent of all dealerships went through a remodel or location change in the final two months of 2012
compared to the usual 8 percent, and the January numbers could be well off of the true 2013 trend-line.
On the Positive Side
Floor traffic is running nearly 11 percent ahead of last year with closing ratios up about 5 percent. Combined it should be an indication of a 6 to
8 percent year-over-year gain in sales.
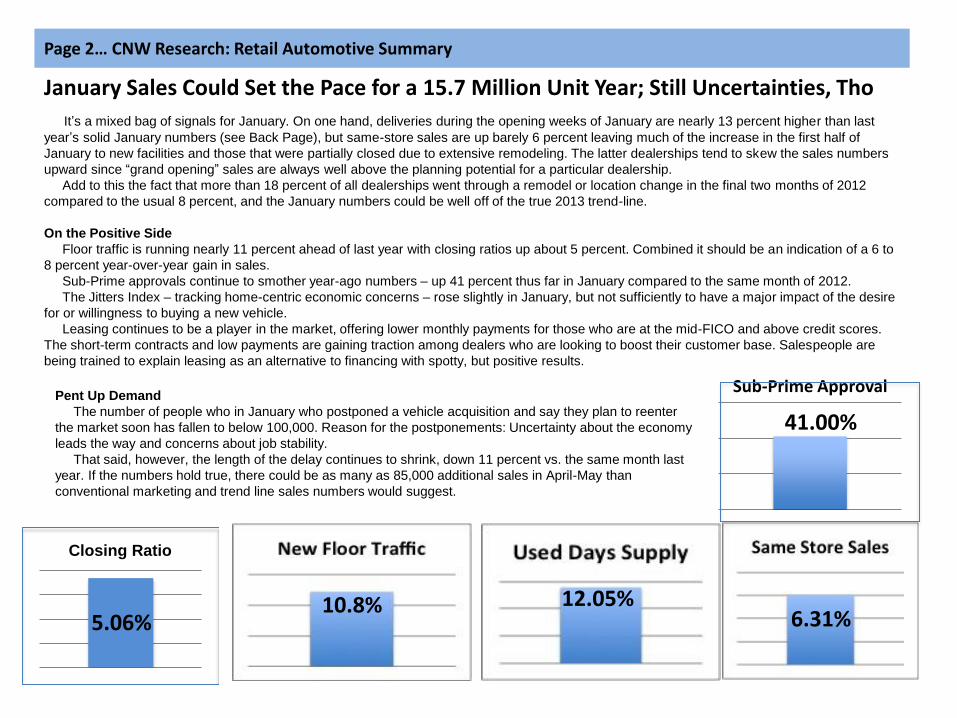
Sub-Prime approvals continue to smother year-ago numbers – up 41 percent thus far in January compared to the same month of 2012.
The Jitters Index – tracking home-centric economic concerns – rose slightly in January, but not sufficiently to have a major impact of the desire
for or willingness to buying a new vehicle.
Leasing continues to be a player in the market, offering lower monthly payments for those who are at the mid-FICO and above credit scores.
The short-term contracts and low payments are gaining traction among dealers who are looking to boost their customer base. Salespeople are
being trained to explain leasing as an alternative to financing with spotty, but positive results.
41.00% Pent Up Demand
The number of people who in January who postponed a vehicle acquisition and say they plan to reenter
the market soon has fallen to below 100,000. Reason for the postponements: Uncertainty about the economy
leads the way and concerns about job stability.
That said, however, the length of the delay continues to shrink, down 11 percent vs. the same month last
year. If the numbers hold true, there could be as many as 85,000 additional sales in April-May than
conventional marketing and trend line sales numbers would suggest.
Sub-Prime Approval
Page 3… CNW Research: Retail Automotive Summary
Is it Time for a New Way to Calculate Sales Success? DEC. '12
Document 1967 Real Sales
Strength
Jaguar car 3.12
Subaru truck 3.12
Smart 2.77
Mazda truck 2.58
Audi truck 2.47
Chrysler car 2.26
GMC truck 2.13
Lexus car 1.99
Acura truck 1.90
Dodge truck 1.84
Lexus truck 1.84
Land Rover 1.82
Subaru car 1.80
Total GM truck 1.78
Chrysler truck 1.78
Cadillac car 1.77
Chevrolet Truck 1.75
Total Chrysler car 1.75
Total GM 1.71
Lincoln car 1.69
Total Subaru 1.61
Mini 1.53
Buick car 1.53
Total Ford car 1.46
Ford car 1.45
Dodge car 1.45
Total VW truck 1.41
Total Historic Big 3
car 1.41
VW car 1.41
Lincoln truck 1.40
Total Historic Big 3 1.39
Total Mazda 1.39
Total Chrysler 1.35
Total Historic Big 3
truck 1.27
Acura car 1.25
Total VW car 1.23
Total GM car 1.21
BMW car 1.16
Buick truck 1.16
Cadillac truck 1.13
Toyota car 1.12
Total VW 1.12
Total Chrysler truck 1.10
BMW truck 1.10
Total Ford 1.09
Total Toyota 1.08
Total BMW 1.08
Chevrolet Car 1.07
Total Toyota truck 1.06
Ram truck 1.05
Mitsubishi car 1.04
Total Industry car 1.00
Total Industry truck 1.00
Total Industry 1.00
Total Toyota car 0.94
Hyundai car 0.94
Toyota truck 0.93
Total Asian car 0.88
Total Ford truck 0.87
Infiniti car 0.87
Ford truck 0.86
Total Honda car 0.81
Total Mitsubishi 0.80
Total Euro truck 0.78
Bentley 0.77
Honda car 0.77
Total Honda 0.76
Total Honda truck 0.76
Total Euro car 0.72
Total Asian 0.72
Total Nissan car 0.70
Total Euro 0.69
Nissan car 0.68
Mitsubishi truck 0.65
Jeep truck 0.62
Total Asian truck 0.61
Total Hyundai 0.60
Honda truck 0.58
Mazda car 0.54
VW truck 0.54
Audi car 0.54
Volvo car 0.48
Mercedes truck 0.24
Fiat 0.22
Total Nissan 0.17
Infiniti truck 0.02
Total Volvo 0.01
Hyundai truck 0.00
Rolls Royce 0.00
Scion car -0.08
Suzuki truck -0.10
Kia car -0.23
Total Kia -0.25
Total Nissan truck -0.26
Total Mercedes -0.26
Nissan truck -0.30
Kia truck -0.30
Volvo truck -0.35
Total Suzuki -0.68
Mercedes car -0.73
Porsche truck -0.86
Suzuki car -1.07
Total Porsche -1.25
Porsche car -1.81
One of the issues related to sales data is making
comparisons with previous years, adjusting for SAAR,
looking at month-over-month. The net result often gives a
skewed picture of just how good or bad a company is
doing.
For example, all through 2011, Ford’s month over
month data showed incredible strength as did its year-
over-year stats. When 2012 rolled around and other
makes – notably Toyota and Honda recovering from
production-crippling tsunami – Ford’s year-over-year
gains were less impressive because it was working from a
high base while the two Japanese brands looked
extremely strong mostly, though, because they were
working from a weak base.
Add the never ending and increasingly focused
incentives to the mix, and the year-over-year data can
become completely veiled. Having a huge lease incentive
this month can result in a double digit percentage increase
vs. a year ago or even last month.
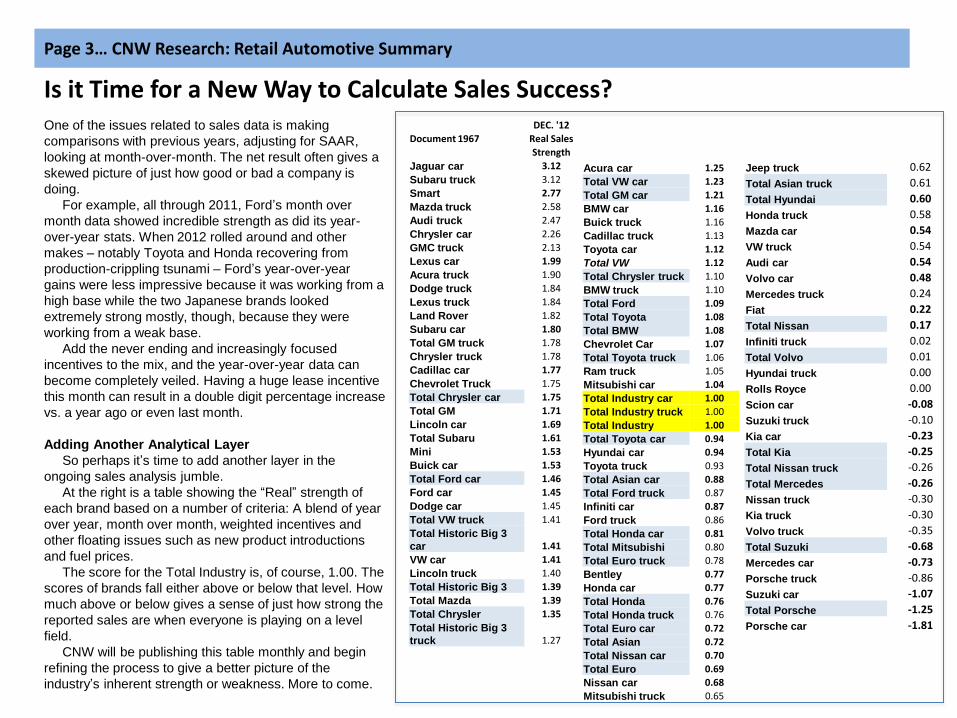
Adding Another Analytical Layer
So perhaps it’s time to add another layer in the
ongoing sales analysis jumble.
At the right is a table showing the “Real” strength of
each brand based on a number of criteria: A blend of year
over year, month over month, weighted incentives and
other floating issues such as new product introductions
and fuel prices.
The score for the Total Industry is, of course, 1.00. The
scores of brands fall either above or below that level. How
much above or below gives a sense of just how strong the
reported sales are when everyone is playing on a level
field.
CNW will be publishing this table monthly and begin
refining the process to give a better picture of the
industry’s inherent strength or weakness. More to come.
Page 4… CNW Research: Retail Automotive Summary
Jitters Index Stubbornly Vexing; Consumers Not Happy with Government
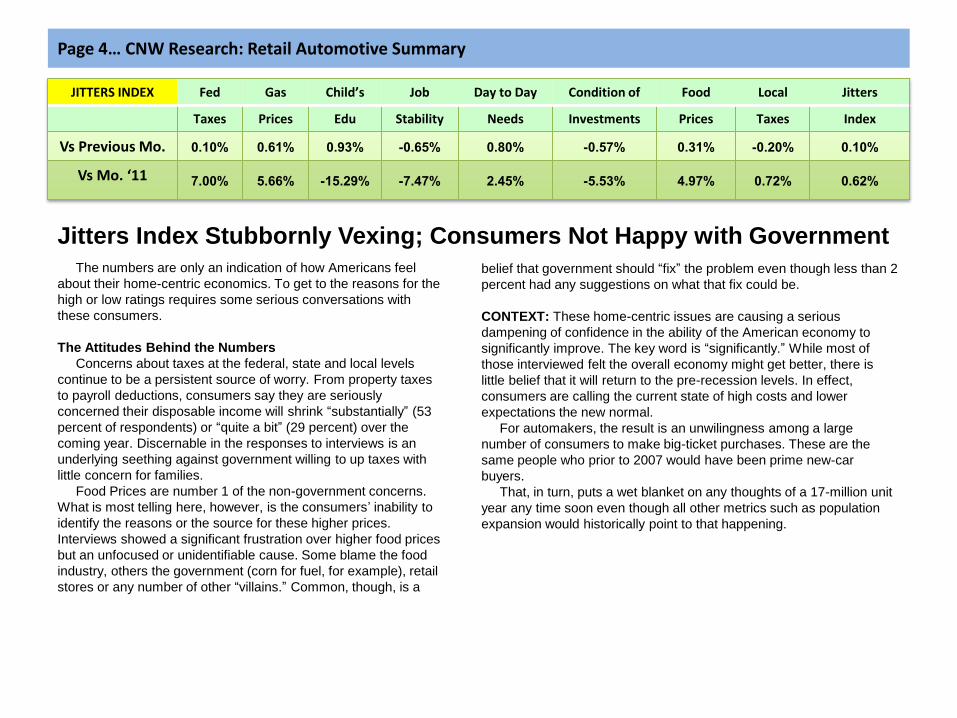
JITTERS INDEX Fed Gas Child’s Job Day to Day Condition of Food Local Jitters
Taxes Prices Edu Stability Needs Investments Prices Taxes Index
Vs Previous Mo. 0.10% 0.61% 0.93% -0.65% 0.80% -0.57% 0.31% -0.20% 0.10%
Vs Mo. ‘11 7.00% 5.66% -15.29% -7.47% 2.45% -5.53% 4.97% 0.72% 0.62%
The numbers are only an indication of how Americans feel
about their home-centric economics. To get to the reasons for the
high or low ratings requires some serious conversations with
these consumers.
The Attitudes Behind the Numbers
Concerns about taxes at the federal, state and local levels
continue to be a persistent source of worry. From property taxes
to payroll deductions, consumers say they are seriously
concerned their disposable income will shrink “substantially” (53
percent of respondents) or “quite a bit” (29 percent) over the
coming year. Discernable in the responses to interviews is an
underlying seething against government willing to up taxes with
little concern for families.
Food Prices are number 1 of the non-government concerns.
What is most telling here, however, is the consumers’ inability to
identify the reasons or the source for these higher prices.
Interviews showed a significant frustration over higher food prices
but an unfocused or unidentifiable cause. Some blame the food
industry, others the government (corn for fuel, for example), retail
stores or any number of other “villains.” Common, though, is a
belief that government should “fix” the problem even though less than 2
percent had any suggestions on what that fix could be.
CONTEXT: These home-centric issues are causing a serious
dampening of confidence in the ability of the American economy to
significantly improve. The key word is “significantly.” While most of
those interviewed felt the overall economy might get better, there is
little belief that it will return to the pre-recession levels. In effect,
consumers are calling the current state of high costs and lower
expectations the new normal.
For automakers, the result is an unwilingness among a large
number of consumers to make big-ticket purchases. These are the
same people who prior to 2007 would have been prime new-car
buyers.
That, in turn, puts a wet blanket on any thoughts of a 17-million unit
year any time soon even though all other metrics such as population
expansion would historically point to that happening.
Anticipated Jan Actual Jan % Chng YTD YTD % Chng
Document 106m cy13 cy12 13v12 cy2013 cy2012 13v12
Franchised
Dealer Sales 828,331 726,149 14.1% 828,331 726,149 14.1%
Independent
Dealer Sales 817,103 709,184 15.2% 817,103 709,184 15.2%
Casual (Private)
Sales 645,938 768,085 -15.9% 645,938 768,085 -15.9%
Total Sales 2,291,372 2,203,418 4.0% 2,291,372 2,203,418 4.0%
Page 5… CNW Research: Retail Automotive Summary
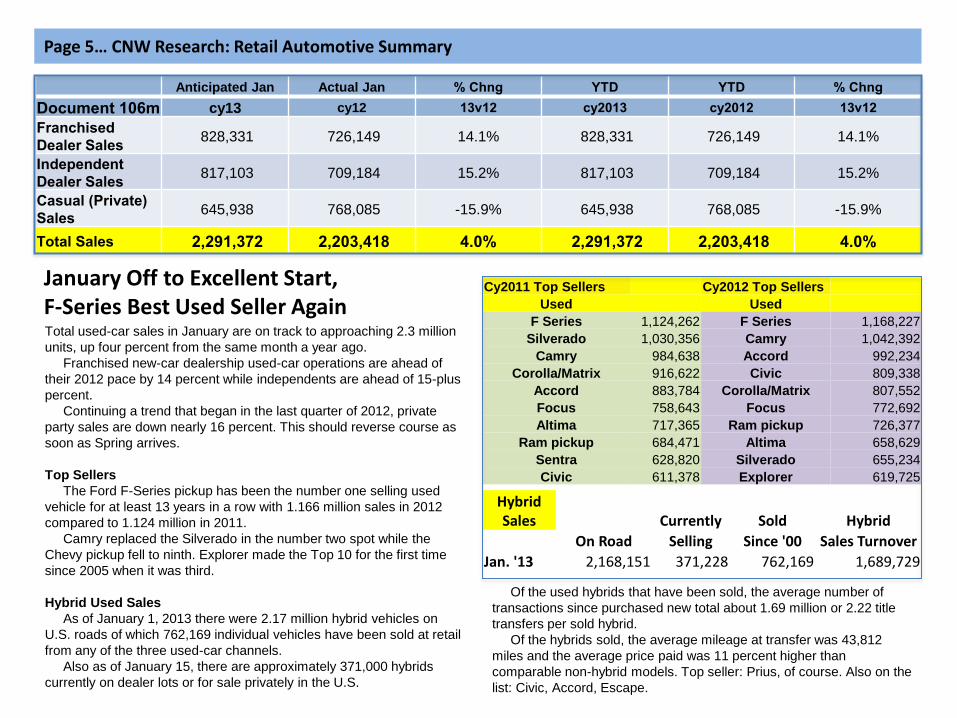
January Off to Excellent Start, F-Series Best Used Seller Again Total used-car sales in January are on track to approaching 2.3 million
units, up four percent from the same month a year ago.
Franchised new-car dealership used-car operations are ahead of
their 2012 pace by 14 percent while independents are ahead of 15-plus
percent.
Continuing a trend that began in the last quarter of 2012, private
party sales are down nearly 16 percent. This should reverse course as
soon as Spring arrives.
Top Sellers
The Ford F-Series pickup has been the number one selling used
vehicle for at least 13 years in a row with 1.166 million sales in 2012
compared to 1.124 million in 2011.
Camry replaced the Silverado in the number two spot while the
Chevy pickup fell to ninth. Explorer made the Top 10 for the first time
since 2005 when it was third.
Hybrid Used Sales
As of January 1, 2013 there were 2.17 million hybrid vehicles on
U.S. roads of which 762,169 individual vehicles have been sold at retail
from any of the three used-car channels.
Also as of January 15, there are approximately 371,000 hybrids
currently on dealer lots or for sale privately in the U.S.
Cy2011 Top Sellers Cy2012 Top Sellers
Used Used
F Series 1,124,262 F Series 1,168,227
Silverado 1,030,356 Camry 1,042,392
Camry 984,638 Accord 992,234
Corolla/Matrix 916,622 Civic 809,338
Accord 883,784 Corolla/Matrix 807,552
Focus 758,643 Focus 772,692
Altima 717,365 Ram pickup 726,377
Ram pickup 684,471 Altima 658,629
Sentra 628,820 Silverado 655,234
Civic 611,378 Explorer 619,725
Hybrid Sales Currently Sold Hybrid
On Road Selling Since '00 Sales Turnover
Jan. '13 2,168,151 371,228 762,169 1,689,729
Of the used hybrids that have been sold, the average number of
transactions since purchased new total about 1.69 million or 2.22 title
transfers per sold hybrid.
Of the hybrids sold, the average mileage at transfer was 43,812
miles and the average price paid was 11 percent higher than
comparable non-hybrid models. Top seller: Prius, of course. Also on the
list: Civic, Accord, Escape.
Page 6… CNW Research: Retail Automotive Summary
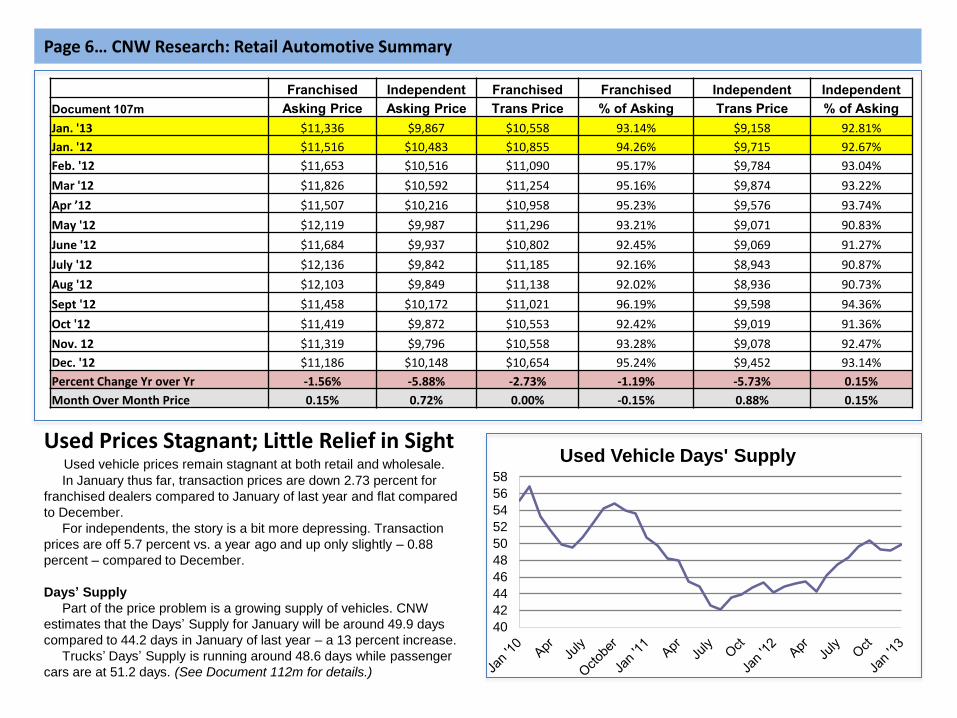
Franchised Independent Franchised Franchised Independent Independent
Document 107m Asking Price Asking Price Trans Price % of Asking Trans Price % of Asking
Jan. '13 $11,336 $9,867 $10,558 93.14% $9,158 92.81%
Jan. '12 $11,516 $10,483 $10,855 94.26% $9,715 92.67%
Feb. '12 $11,653 $10,516 $11,090 95.17% $9,784 93.04%
Mar '12 $11,826 $10,592 $11,254 95.16% $9,874 93.22%
Apr ’12 $11,507 $10,216 $10,958 95.23% $9,576 93.74%
May '12 $12,119 $9,987 $11,296 93.21% $9,071 90.83%
June '12 $11,684 $9,937 $10,802 92.45% $9,069 91.27%
July '12 $12,136 $9,842 $11,185 92.16% $8,943 90.87%
Aug '12 $12,103 $9,849 $11,138 92.02% $8,936 90.73%
Sept '12 $11,458 $10,172 $11,021 96.19% $9,598 94.36%
Oct '12 $11,419 $9,872 $10,553 92.42% $9,019 91.36%
Nov. 12 $11,319 $9,796 $10,558 93.28% $9,078 92.47%
Dec. '12 $11,186 $10,148 $10,654 95.24% $9,452 93.14%
Percent Change Yr over Yr -1.56% -5.88% -2.73% -1.19% -5.73% 0.15%
Month Over Month Price 0.15% 0.72% 0.00% -0.15% 0.88% 0.15%
Used Prices Stagnant; Little Relief in Sight
Used vehicle prices remain stagnant at both retail and wholesale.
In January thus far, transaction prices are down 2.73 percent for
franchised dealers compared to January of last year and flat compared
to December.
For independents, the story is a bit more depressing. Transaction
prices are off 5.7 percent vs. a year ago and up only slightly – 0.88
percent – compared to December.
Days’ Supply
Part of the price problem is a growing supply of vehicles. CNW
estimates that the Days’ Supply for January will be around 49.9 days
compared to 44.2 days in January of last year – a 13 percent increase.
Trucks’ Days’ Supply is running around 48.6 days while passenger
cars are at 51.2 days. (See Document 112m for details.)
40
42
44
46
48
50
52
54
56
58
Used Vehicle Days' Supply
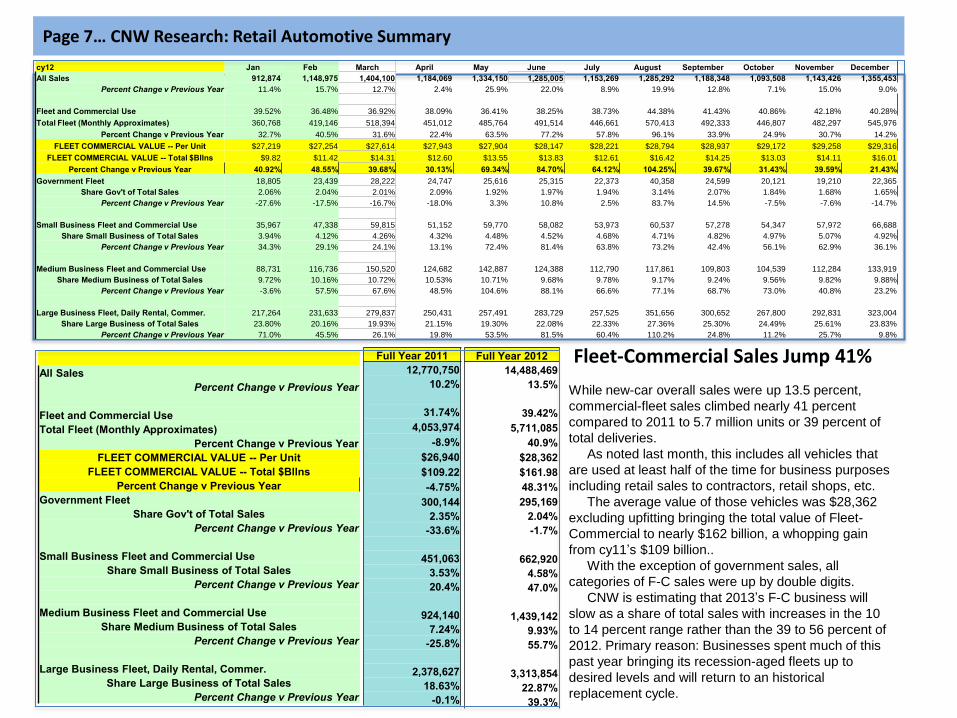
While new-car overall sales were up 13.5 percent,
commercial-fleet sales climbed nearly 41 percent
compared to 2011 to 5.7 million units or 39 percent of
total deliveries.
As noted last month, this includes all vehicles that
are used at least half of the time for business purposes
including retail sales to contractors, retail shops, etc.
The average value of those vehicles was $28,362
excluding upfitting bringing the total value of Fleet-
Commercial to nearly $162 billion, a whopping gain
from cy11’s $109 billion..
With the exception of government sales, all
categories of F-C sales were up by double digits.
CNW is estimating that 2013’s F-C business will
slow as a share of total sales with increases in the 10
to 14 percent range rather than the 39 to 56 percent of
2012. Primary reason: Businesses spent much of this
past year bringing its recession-aged fleets up to
desired levels and will return to an historical
replacement cycle.
Page 7… CNW Research: Retail Automotive Summary
Fleet-Commercial Sales Jump 41%
cy12 Jan Feb March April May June July August September October November December
All Sales 912,874 1,148,975 1,404,100 1,184,069 1,334,150 1,285,005 1,153,269 1,285,292 1,188,348 1,093,508 1,143,426 1,355,453
Percent Change v Previous Year 11.4% 15.7% 12.7% 2.4% 25.9% 22.0% 8.9% 19.9% 12.8% 7.1% 15.0% 9.0%
Fleet and Commercial Use 39.52% 36.48% 36.92% 38.09% 36.41% 38.25% 38.73% 44.38% 41.43% 40.86% 42.18% 40.28%
Total Fleet (Monthly Approximates) 360,768 419,146 518,394 451,012 485,764 491,514 446,661 570,413 492,333 446,807 482,297 545,976
Percent Change v Previous Year 32.7% 40.5% 31.6% 22.4% 63.5% 77.2% 57.8% 96.1% 33.9% 24.9% 30.7% 14.2%
FLEET COMMERCIAL VALUE -- Per Unit $27,219 $27,254 $27,614 $27,943 $27,904 $28,147 $28,221 $28,794 $28,937 $29,172 $29,258 $29,316
FLEET COMMERCIAL VALUE -- Total $Bllns $9.82 $11.42 $14.31 $12.60 $13.55 $13.83 $12.61 $16.42 $14.25 $13.03 $14.11 $16.01
Percent Change v Previous Year 40.92% 48.55% 39.68% 30.13% 69.34% 84.70% 64.12% 104.25% 39.67% 31.43% 39.59% 21.43%
Government Fleet 18,805 23,439 28,222 24,747 25,616 25,315 22,373 40,358 24,599 20,121 19,210 22,365
Share Gov't of Total Sales 2.06% 2.04% 2.01% 2.09% 1.92% 1.97% 1.94% 3.14% 2.07% 1.84% 1.68% 1.65%
Percent Change v Previous Year -27.6% -17.5% -16.7% -18.0% 3.3% 10.8% 2.5% 83.7% 14.5% -7.5% -7.6% -14.7%
Small Business Fleet and Commercial Use 35,967 47,338 59,815 51,152 59,770 58,082 53,973 60,537 57,278 54,347 57,972 66,688
Share Small Business of Total Sales 3.94% 4.12% 4.26% 4.32% 4.48% 4.52% 4.68% 4.71% 4.82% 4.97% 5.07% 4.92%
Percent Change v Previous Year 34.3% 29.1% 24.1% 13.1% 72.4% 81.4% 63.8% 73.2% 42.4% 56.1% 62.9% 36.1%
Medium Business Fleet and Commercial Use 88,731 116,736 150,520 124,682 142,887 124,388 112,790 117,861 109,803 104,539 112,284 133,919
Share Medium Business of Total Sales 9.72% 10.16% 10.72% 10.53% 10.71% 9.68% 9.78% 9.17% 9.24% 9.56% 9.82% 9.88%
Percent Change v Previous Year -3.6% 57.5% 67.6% 48.5% 104.6% 88.1% 66.6% 77.1% 68.7% 73.0% 40.8% 23.2%
Large Business Fleet, Daily Rental, Commer. 217,264 231,633 279,837 250,431 257,491 283,729 257,525 351,656 300,652 267,800 292,831 323,004
Share Large Business of Total Sales 23.80% 20.16% 19.93% 21.15% 19.30% 22.08% 22.33% 27.36% 25.30% 24.49% 25.61% 23.83%
Percent Change v Previous Year 71.0% 45.5% 26.1% 19.8% 53.5% 81.5% 60.4% 110.2% 24.8% 11.2% 25.7% 9.8%
All Sales
Percent Change v Previous Year
Fleet and Commercial Use
Total Fleet (Monthly Approximates)
Percent Change v Previous Year
FLEET COMMERCIAL VALUE -- Per Unit
FLEET COMMERCIAL VALUE -- Total $Bllns
Percent Change v Previous Year
Government Fleet
Share Gov't of Total Sales
Percent Change v Previous Year
Small Business Fleet and Commercial Use
Share Small Business of Total Sales
Percent Change v Previous Year
Medium Business Fleet and Commercial Use
Share Medium Business of Total Sales
Percent Change v Previous Year
Large Business Fleet, Daily Rental, Commer.
Share Large Business of Total Sales
Percent Change v Previous Year
Full Year 2012
14,488,469
13.5%
39.42%
5,711,085
40.9%
$28,362
$161.98
48.31%
295,169
2.04%
-1.7%
662,920
4.58%
47.0%
1,439,142
9.93%
55.7%
3,313,854
22.87%
39.3%
Full Year 2011
12,770,750
10.2%
31.74%
4,053,974
-8.9%
$26,940
$109.22
-4.75%
300,144
2.35%
-33.6%
451,063
3.53%
20.4%
924,140
7.24%
-25.8%
2,378,627
18.63%
-0.1%
Wholesale Used Vehicle Price Trends
Average Prices ($/Unit) Latest Month Versus:
Dec-12 Nov-12 Dec-11 Prior Month Prior Year
Total All Vehicles $9,849 $9,554 $9,869 3.1% -0.2%
Total Cars $8,930 $8,602 $8,878 3.8% 0.6%
Compact Car $6,990 $6,848 $6,929 2.1% 0.9%
Midsize Car $8,034 $7,789 $7,827 3.2% 2.6%
Fullsize Car $7,693 $7,674 $7,493 0.2% 2.7%
Luxury Car $12,542 $11,807 $13,023 6.2% -3.7%
Sporty Car $12,488 $11,959 $12,526 4.4% -0.3%
Total Trucks $9,889 $9,666 $10,009 2.3% -1.2%
Mini Van $6,936 $6,971 $7,297 -0.5% -5.0%
Fullsize Van $8,915 $9,471 $9,305 -5.9% -4.2%
Mini SUV $10,930 $10,592 $10,707 3.2% 2.1%
Midsize SUV $6,763 $6,828 $7,163 -1.0% -5.6%
Fullsize SUV $11,684 $11,344 $11,993 3.0% -2.6%
Luxury SUV $19,286 $18,631 $20,504 3.5% -5.9%
Compact Pickup $7,229 $7,158 $7,662 1.0% -5.7%
Fullsize Pickup $11,702 $11,398 $11,270 2.7% 3.8%
Total Crossovers $13,117 $12,777 $13,309 2.7% -1.4%
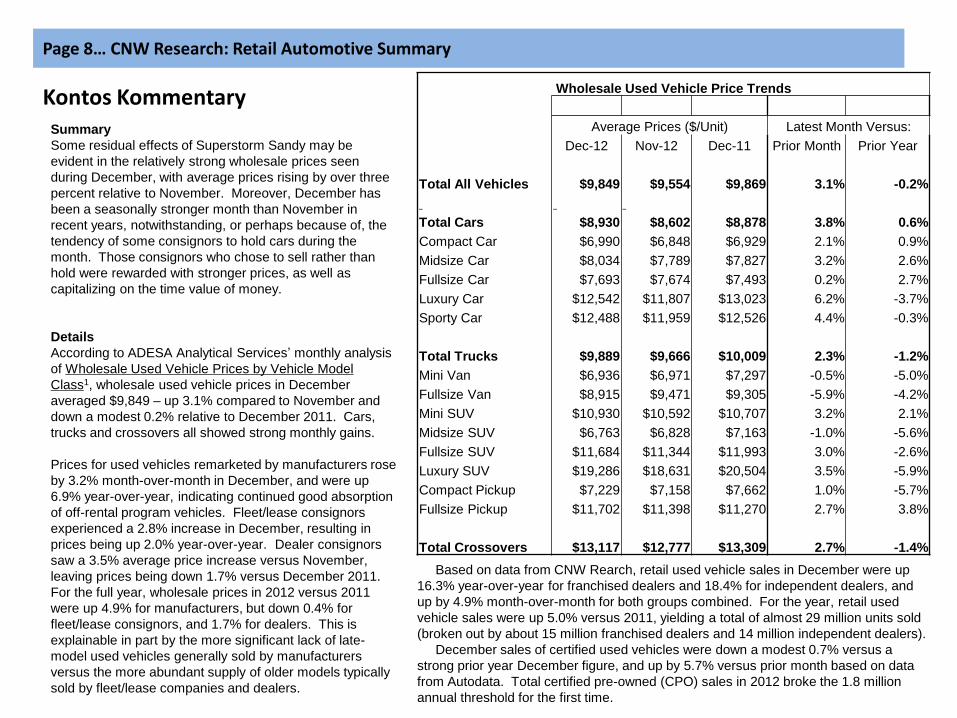
Summary
Some residual effects of Superstorm Sandy may be
evident in the relatively strong wholesale prices seen
during December, with average prices rising by over three
percent relative to November. Moreover, December has
been a seasonally stronger month than November in
recent years, notwithstanding, or perhaps because of, the
tendency of some consignors to hold cars during the
month. Those consignors who chose to sell rather than
hold were rewarded with stronger prices, as well as
capitalizing on the time value of money.
Details
According to ADESA Analytical Services’ monthly analysis
of Wholesale Used Vehicle Prices by Vehicle Model
Class1, wholesale used vehicle prices in December
averaged $9,849 – up 3.1% compared to November and
down a modest 0.2% relative to December 2011. Cars,
trucks and crossovers all showed strong monthly gains.
Prices for used vehicles remarketed by manufacturers rose
by 3.2% month-over-month in December, and were up
6.9% year-over-year, indicating continued good absorption
of off-rental program vehicles. Fleet/lease consignors
experienced a 2.8% increase in December, resulting in
prices being up 2.0% year-over-year. Dealer consignors
saw a 3.5% average price increase versus November,
leaving prices being down 1.7% versus December 2011.
For the full year, wholesale prices in 2012 versus 2011
were up 4.9% for manufacturers, but down 0.4% for
fleet/lease consignors, and 1.7% for dealers. This is
explainable in part by the more significant lack of late-
model used vehicles generally sold by manufacturers
versus the more abundant supply of older models typically
sold by fleet/lease companies and dealers.
Page 8… CNW Research: Retail Automotive Summary
Based on data from CNW Rearch, retail used vehicle sales in December were up
16.3% year-over-year for franchised dealers and 18.4% for independent dealers, and
up by 4.9% month-over-month for both groups combined. For the year, retail used
vehicle sales were up 5.0% versus 2011, yielding a total of almost 29 million units sold
(broken out by about 15 million franchised dealers and 14 million independent dealers).
December sales of certified used vehicles were down a modest 0.7% versus a
strong prior year December figure, and up by 5.7% versus prior month based on data
from Autodata. Total certified pre-owned (CPO) sales in 2012 broke the 1.8 million
annual threshold for the first time.
Kontos Kommentary
Lots of goings on in advertising at Chevrolet these days. The latest news is that General Motors' volume brand is dropping the ad tag it has used since fall 2010: “Chevy Runs Deep.” Instead Chevrolet will introduce “Find New Roads” as its new ad theme in ads arriving in February, first here in the USA then throughout the world.
The word from Chevy's global marketing VP Alan Batey is that now is the time to break this initiative because the brand will launch more than 20 vehicles all over the planet this year. “We are continuing to grow globally, especially in key emerging markets, and Find New Roads will help us drive even more consistency – both internally with our employees and externally with customers,.” he said. Ugh oh, so GM plans to use this slogan as an internal guide post for developing new models and technologies. Sound familiar? It should because it's the same thing Toyota did with its previous ad tag “Moving Forward.” The line was meant as a global rallying cry for employees, as well as for dealers and consumers. That's a pretty big job for a little slogan, don't you think? By the way Toyota just dropped that “Moving Forward” line which bowed in fall of 2004, in favor of “Let's Go Places,” which I panned in an earlier AdRap. Run Deep Didn’t It didn't take Chevy's “Run Deep” very long to run into trouble with the client. Out less than a year, GM's then CMO Joel Ewanick said the line wasn't resonating with people and that some of the ads from Chevy's agency, Goodby Silverstein and Partners, San Francisco, didn't clearly explain the meaning of the slogan. “Runs Deep” also wasn't converting buyers to the brand.
Page 9… CNW Research: Retail Automotive Summary
Jean Halliday’s Chevrolet Takes a New Road
Another Attempt at Global Identification
Continued next page
Alan Batey
Page 10… CNW Research: Retail Automotive Summary
Continued from previous page
Need to mention that the new tag is pretty darn close to “Find your own Road,” the slogan used by Saab USA in the mid-90s from Angotti, Thomas, Hedge in New York. That line worked for Saab because the niche brand was embraced by independent-minded buyers. Let's take a look at Chevy's ad tag history. After Ewanick arrived at GM in spring 2010, he quickly ditched the line “Excellence for All” for the brand from its short-termed agency, Publicis, tapped by GM's former management. That tag succeeded “American Revolution,” which had almost a 7-year run and came from Campbell-Ewald in Warren, Michigan. Campbell-Ewald, Chevy's agency of record for more than 90 years, also developed the iconic “Like a Rock” in the early 1990s, “Baseball, Hot Dogs, Apple Pie and Chevrolet” in 1974 and “See the USA in your Chevrolet” that was used from 1951 through 1961. How crucial are ad tags? Not very. Consider this: Honda's Acura brand didn't use one for 9 years before it started using “Advance” for the MDX in fall 2006. Ad tag lines don't do much or mean much if they aren't relevant to the brand, like the new ones (and old ones for that matter) for both Chevrolet and Toyota. Both of these new ad tags are generic and could be used for other car brands. Both would arguably make more sense for nav systems. Let's face it, neither Chevrolet's nor Toyota's new lines are intrinsically linked to the brands they represent. That's a big problem that will translate to virtually NO consumer recall of the lines even after several years- if they last that long. Chevy's first work with the new ad tag is due this quarter from Commonwealth, the brand's, 10-month-old global creative agency. Commonwealth is actually a sort of hybrid shop since it is a 50-50 venture between two arms of two giant holding companies: Omnicom Group's Goodby and IPG's McCann Erickson in New York. Goodby had the entire USA creative account until GM decided to consolidate the account and hold a review.
So Goodby is teamed up with McCann for Chevy work in all markets except the major, fast-growing markets of China, India and Uzbekistan. But Commonwealth took a major blow when Chevrolet recently decided to shift oversight of the Silverado pickup to Publicis Groupe's Leo Burnett in Chicago. The full-size pickup is a crucial part of the Chevrolet brand, its image and GM profits. And the clock is ticking to develop a launch blitz for the next generation of the Silverado, which arrives in the second quarter as a 2014 model. Client Not Happy With Commonwealth Agency The folks at Chevrolet claim the move is to help the Commonwealth start-up, since there's so many launches it has to do this year. But make no mistake - this is a bitch slap to Commonwealth and that the client wasn't happy with the direction of the creative ideas for the truck's launch. By the way, the top creative on Chevy at Goodby,'s Detroit office, Rick Dennis, is no longer there. Goodby had started to feel some heat on the Chevy account back in the summer of 2011, when Ewanick said the agency's ads weren't consistent. Burnett USA, based in Chicago, already handles creative for Buick and GMC, including GMC's Silverado sister, the Sierra. Burnett USA's President Rich Stoddart knows a thing or two about truck marketing, having launched the new Ford F-150 during his reign as marketing director there before returning to the agency world in 2005. How important is the new Silverado's launch? Well, GM spent more than $100 million in media to launch its newest Silverado back in the fall of 1998, which then marked Chevrolet's biggest blitz ever. And in the fall of 2006, Chevy spent almost $400 million for the arrival of the redone 2007 pickup, its last redo. The competition in the full-size pickup segment hasn't abated either, with Chrysler Group's new Ram making inroads and Ford Motor trying to upstage GM at the North American International Auto Show in Detroit in January by showing the first concept of its 2015 Ford F-150. Interesting times, indeed.
Page 11… CNW Research: Retail Automotive Summary
% Change % Change % Change % Change % Change
cy02 02 Rank cy04 04 Rank 04 v 02 cy05 05 Rank 05 v 02 cy06 06 Rank 06 v 02 cy07 07 Rank 07 v 02 cy12 12 Rank 12 v 07
Toyota 8.43 4 8.55 2 1.42% 8.04 2 -19.50% 9.13 1 8.30% 9.05 2 7.35% 9.02 1 -0.33%
Honda 9.06 1 8.91 1 -1.66% 8.95 1 -11.00% 9.01 2 -0.55% 9.09 1 0.33% 8.94 2 -1.65%
GM 8.17 5 8.49 3 3.92% 7.72 5 -15.00% 8.26 3 1.10% 8.59 3 5.14% 8.89 3 3.49%
Ford 8.67 2 8.21 4 -5.31% 8.01 3 -16.50% 7.92 4 -8.65% 7.26 8 -16.26% 8.44 4 16.25%
Nissan 5.92 16 7.64 6 29.05% 7.78 4 31.00% 7.83 6 32.26% 7.41 7 25.17% 8.32 5 12.28%
VW 8.46 3 7.81 5 -7.68% 7.49 6 -19.40% 7.46 7 -11.82% 7.59 5 -10.28% 7.71 6 1.58%
Hyundai 7.09 9 6.92 11 -2.40% 7.24 7 1.36% 7.89 5 11.28% 7.93 4 11.85% 7.52 7 -5.17%
Chrysler 6.87 13 6.92 10 0.73% 6.66 13 -2.10% 6.56 14 -4.51% 6.29 15 -8.44% 7.48 8 18.92%
Subaru 7.77 7 7.35 7 -5.41% 7.23 8 -7.71% 7.22 9 -7.08% 7.26 9 -6.56% 7.17 9 -1.24%
BMW 7.15 8 7.32 8 2.38% 7.19 9 0.50% 7.16 10 0.14% 7.15 10 0.00% 7.01 10 -1.96%
Mercedes 7.82 6 7.31 9 -6.52% 6.96 11 -9.56% 6.93 11 -11.38% 6.87 11 -12.15% 6.52 11 -5.09%
Mazda 6.94 11 6.19 15 -10.81% 6.18 15 -5.07% 6.02 15 -13.26% 6.59 13 -5.04% 6.25 12 -5.16%
Volvo 6.88 12 6.91 12 0.44% 7.03 10 1.25% 7.28 8 5.81% 7.56 6 9.88% 6.21 13 -17.86%
Kia 6.25 15 6.53 14 4.48% 6.54 14 2.07% 6.66 13 6.56% 6.56 14 4.96% 6.19 14 -5.64%
Mitsubishi 7.03 10 5.88 16 -16.36% 5.57 16 -9.13% 5.21 16 -25.89% 5.16 16 -26.60% 5.02 15 -2.71%
Saab 6.63 14 6.77 13 2.11% 6.78 12 1.15% 6.78 12 2.26% 6.77 12 2.11%
Suzuki 5.68 18 3.97 18 -30.11% 3.68 18 -11.11% 3.59 18 -36.80% 4.19 17 -26.23%
Isuzu 5.71 17 4.11 17 -28.02% 4.12 17 -9.35% 4.06 17 -28.90% 3.55 18 -37.83%
Overall Avg. 7.25 6.99 -3.63% 6.84 -5.64% 6.94 -4.26% 6.94 -4.34% 7.38 1.76%
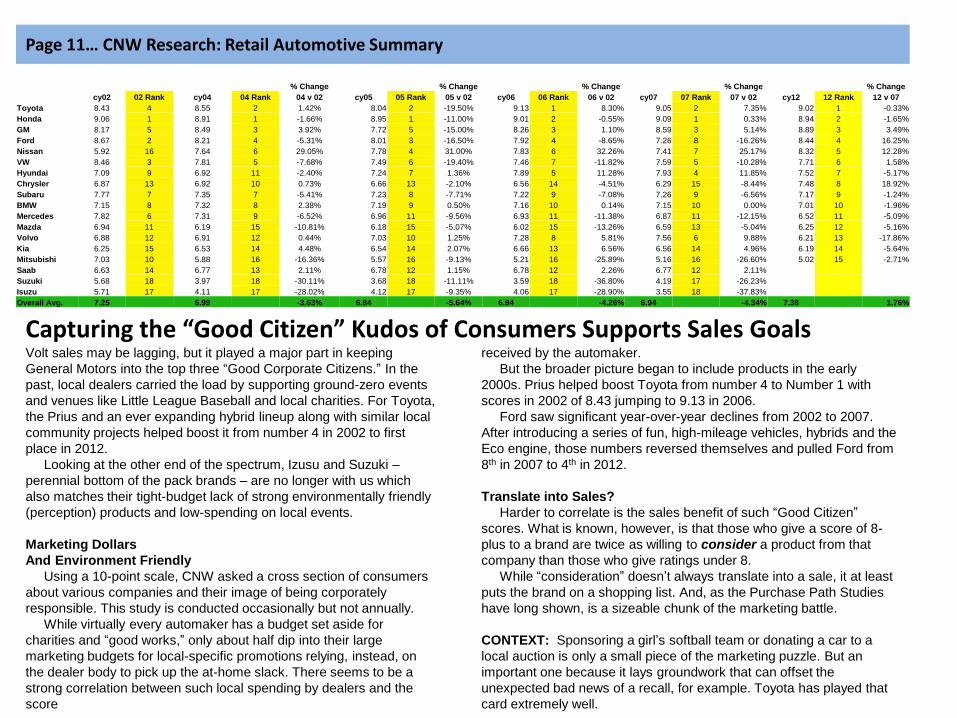
Capturing the “Good Citizen” Kudos of Consumers Supports Sales Goals Volt sales may be lagging, but it played a major part in keeping
General Motors into the top three “Good Corporate Citizens.” In the
past, local dealers carried the load by supporting ground-zero events
and venues like Little League Baseball and local charities. For Toyota,
the Prius and an ever expanding hybrid lineup along with similar local
community projects helped boost it from number 4 in 2002 to first
place in 2012.
Looking at the other end of the spectrum, Izusu and Suzuki –
perennial bottom of the pack brands – are no longer with us which
also matches their tight-budget lack of strong environmentally friendly
(perception) products and low-spending on local events.
Marketing Dollars
And Environment Friendly
Using a 10-point scale, CNW asked a cross section of consumers
about various companies and their image of being corporately
responsible. This study is conducted occasionally but not annually.
While virtually every automaker has a budget set aside for
charities and “good works,” only about half dip into their large
marketing budgets for local-specific promotions relying, instead, on
the dealer body to pick up the at-home slack. There seems to be a
strong correlation between such local spending by dealers and the
score
received by the automaker.
But the broader picture began to include products in the early
2000s. Prius helped boost Toyota from number 4 to Number 1 with
scores in 2002 of 8.43 jumping to 9.13 in 2006.
Ford saw significant year-over-year declines from 2002 to 2007.
After introducing a series of fun, high-mileage vehicles, hybrids and the
Eco engine, those numbers reversed themselves and pulled Ford from
8th in 2007 to 4th in 2012.
Translate into Sales?
Harder to correlate is the sales benefit of such “Good Citizen”
scores. What is known, however, is that those who give a score of 8-
plus to a brand are twice as willing to consider a product from that
company than those who give ratings under 8.
While “consideration” doesn’t always translate into a sale, it at least
puts the brand on a shopping list. And, as the Purchase Path Studies
have long shown, is a sizeable chunk of the marketing battle.
CONTEXT: Sponsoring a girl’s softball team or donating a car to a
local auction is only a small piece of the marketing puzzle. But an
important one because it lays groundwork that can offset the
unexpected bad news of a recall, for example. Toyota has played that
card extremely well.
Page 12… CNW Research: Retail Automotive Summary
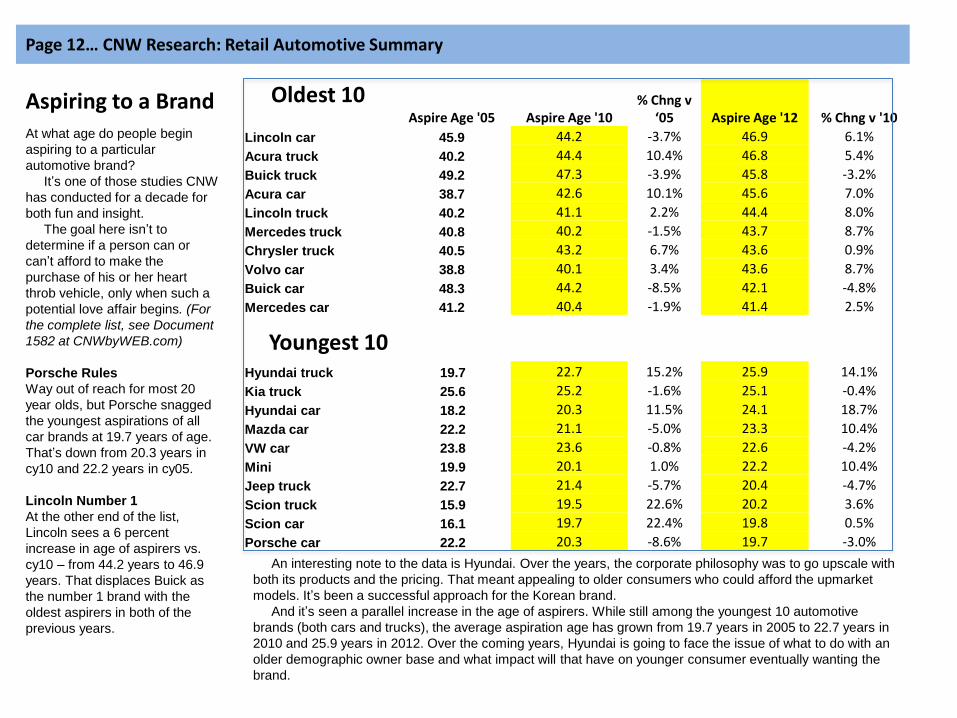
Oldest 10 Aspire Age '05 Aspire Age '10
% Chng v ‘05 Aspire Age '12 % Chng v '10
Lincoln car 45.9 44.2 -3.7% 46.9 6.1%
Acura truck 40.2 44.4 10.4% 46.8 5.4%
Buick truck 49.2 47.3 -3.9% 45.8 -3.2%
Acura car 38.7 42.6 10.1% 45.6 7.0%
Lincoln truck 40.2 41.1 2.2% 44.4 8.0%
Mercedes truck 40.8 40.2 -1.5% 43.7 8.7%
Chrysler truck 40.5 43.2 6.7% 43.6 0.9%
Volvo car 38.8 40.1 3.4% 43.6 8.7%
Buick car 48.3 44.2 -8.5% 42.1 -4.8%
Mercedes car 41.2 40.4 -1.9% 41.4 2.5%
Hyundai truck 19.7 22.7 15.2% 25.9 14.1%
Kia truck 25.6 25.2 -1.6% 25.1 -0.4%
Hyundai car 18.2 20.3 11.5% 24.1 18.7%
Mazda car 22.2 21.1 -5.0% 23.3 10.4%
VW car 23.8 23.6 -0.8% 22.6 -4.2%
Mini 19.9 20.1 1.0% 22.2 10.4%
Jeep truck 22.7 21.4 -5.7% 20.4 -4.7%
Scion truck 15.9 19.5 22.6% 20.2 3.6%
Scion car 16.1 19.7 22.4% 19.8 0.5%
Porsche car 22.2 20.3 -8.6% 19.7 -3.0%
Aspiring to a Brand
Youngest 10
At what age do people begin
aspiring to a particular
automotive brand?
It’s one of those studies CNW
has conducted for a decade for
both fun and insight.
The goal here isn’t to
determine if a person can or
can’t afford to make the
purchase of his or her heart
throb vehicle, only when such a
potential love affair begins. (For
the complete list, see Document
1582 at CNWbyWEB.com)
Porsche Rules
Way out of reach for most 20
year olds, but Porsche snagged
the youngest aspirations of all
car brands at 19.7 years of age.
That’s down from 20.3 years in
cy10 and 22.2 years in cy05.
Lincoln Number 1
At the other end of the list,
Lincoln sees a 6 percent
increase in age of aspirers vs.
cy10 – from 44.2 years to 46.9
years. That displaces Buick as
the number 1 brand with the
oldest aspirers in both of the
previous years.
An interesting note to the data is Hyundai. Over the years, the corporate philosophy was to go upscale with
both its products and the pricing. That meant appealing to older consumers who could afford the upmarket
models. It’s been a successful approach for the Korean brand.
And it’s seen a parallel increase in the age of aspirers. While still among the youngest 10 automotive
brands (both cars and trucks), the average aspiration age has grown from 19.7 years in 2005 to 22.7 years in
2010 and 25.9 years in 2012. Over the coming years, Hyundai is going to face the issue of what to do with an
older demographic owner base and what impact will that have on younger consumer eventually wanting the
brand.
0.14% 0.13%
0.21% 0.16%
0.17% 0.18% 0.20%
0.28% 0.33%
0.42%
0.27% 0.31%
12.09% 11.40% 11.87% 11.31% 11.78% 12.21%
12.48% 12.04%
12.15%
11.11% 11.66% 10.32%
12.54% 13.45% 13.81%
12.34% 12.41% 12.13% 12.24% 12.87%
13.85% 12.59%
11.86% 11.52% 2.09% 2.13%
1.96% 1.93%
1.70% 1.54% 1.68%
1.81% 1.66% 1.66%
1.56% 1.40%
Page 13... CNW Research: Retail Automotive Summary
Entry Level Utility Vehicle
Budget Car Economy Car
Electric Car
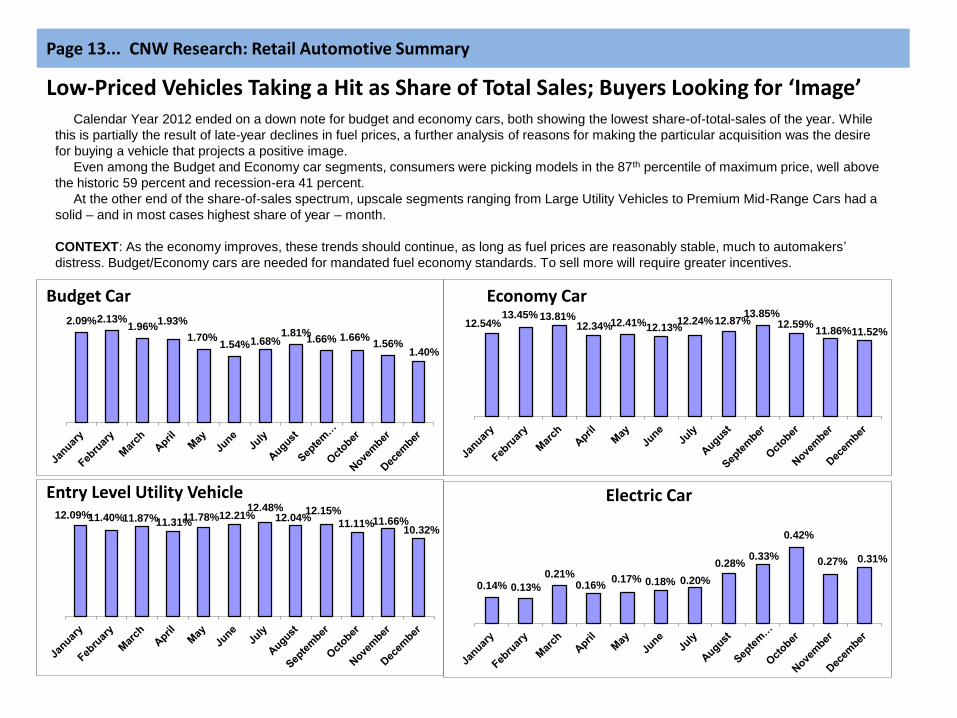
Low-Priced Vehicles Taking a Hit as Share of Total Sales; Buyers Looking for ‘Image’ Calendar Year 2012 ended on a down note for budget and economy cars, both showing the lowest share-of-total-sales of the year. While
this is partially the result of late-year declines in fuel prices, a further analysis of reasons for making the particular acquisition was the desire
for buying a vehicle that projects a positive image.
Even among the Budget and Economy car segments, consumers were picking models in the 87th percentile of maximum price, well above
the historic 59 percent and recession-era 41 percent.
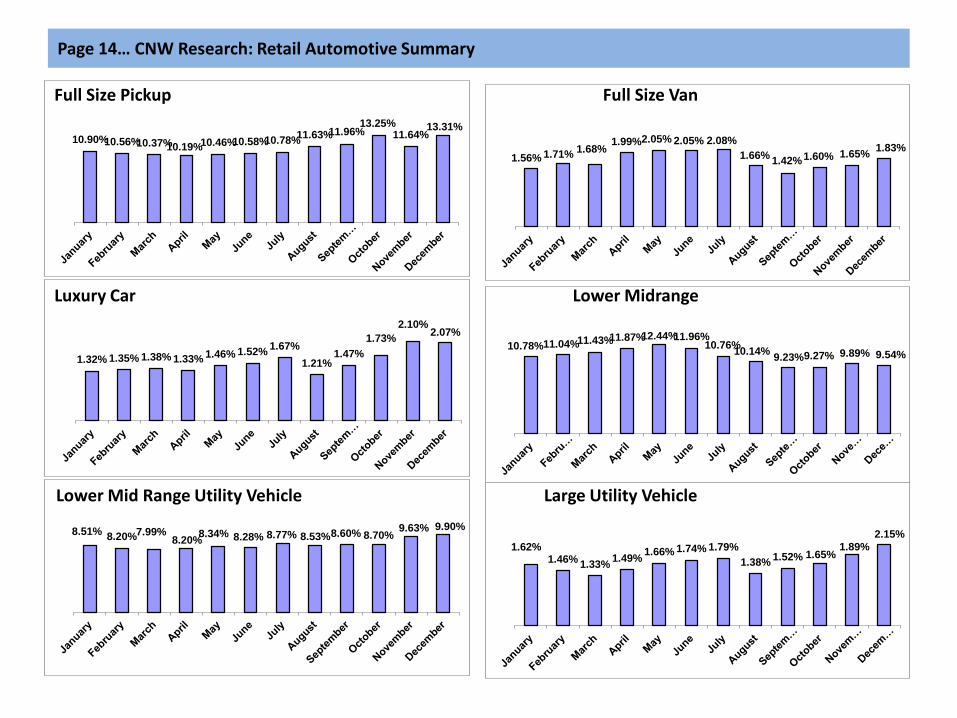
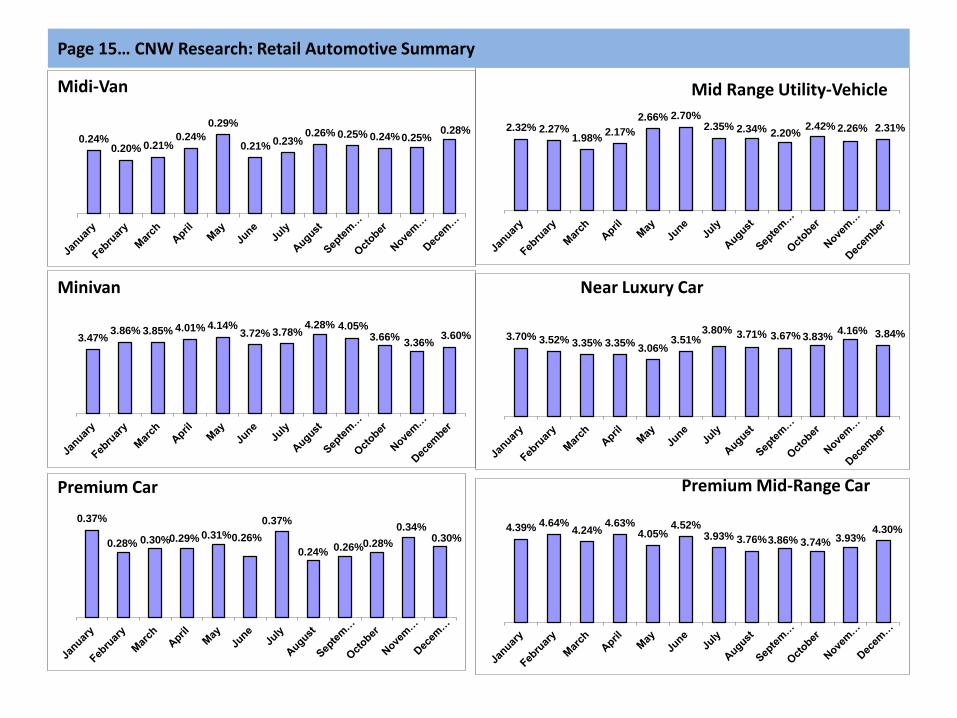
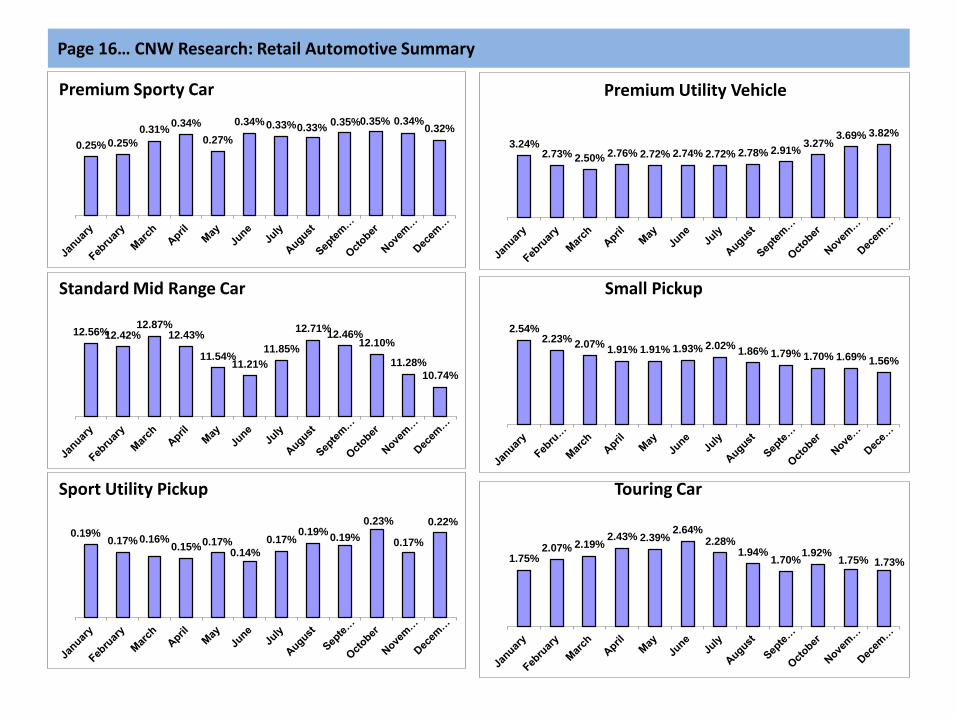
At the other end of the share-of-sales spectrum, upscale segments ranging from Large Utility Vehicles to Premium Mid-Range Cars had a
solid – and in most cases highest share of year – month.
CONTEXT: As the economy improves, these trends should continue, as long as fuel prices are reasonably stable, much to automakers’
distress. Budget/Economy cars are needed for mandated fuel economy standards. To sell more will require greater incentives.
1.62% 1.46%
1.33% 1.49%
1.66% 1.74% 1.79%
1.38% 1.52% 1.65%
1.89%
2.15% 8.51% 8.20% 7.99%
8.20% 8.34% 8.28% 8.77% 8.53% 8.60% 8.70%
9.63% 9.90%
10.78% 11.04% 11.43% 11.87% 12.44% 11.96% 10.76%
10.14% 9.23% 9.27% 9.89% 9.54% 1.32% 1.35% 1.38% 1.33% 1.46% 1.52%
1.67%
1.21% 1.47%
1.73%
2.10% 2.07%
1.56% 1.71% 1.68%
1.99% 2.05% 2.05% 2.08%
1.66% 1.42% 1.60% 1.65%
1.83% 10.90% 10.56% 10.37% 10.19% 10.46% 10.58% 10.78%
11.63% 11.96% 13.25%
11.64% 13.31%
Page 14… CNW Research: Retail Automotive Summary
Full Size Pickup Full Size Van
Luxury Car Lower Midrange
Lower Mid Range Utility Vehicle Large Utility Vehicle
4.39% 4.64% 4.24%
4.63% 4.05%
4.52% 3.93% 3.76% 3.86% 3.74% 3.93%
4.30% 0.37%
0.28% 0.30% 0.29% 0.31% 0.26%
0.37%
0.24% 0.26% 0.28%
0.34% 0.30%
3.70% 3.52% 3.35% 3.35% 3.06%
3.51% 3.80% 3.71% 3.67% 3.83%
4.16% 3.84% 3.47% 3.86% 3.85% 4.01% 4.14%
3.72% 3.78% 4.28% 4.05%
3.66% 3.36%
3.60%
2.32% 2.27% 1.98%
2.17%
2.66% 2.70% 2.35% 2.34% 2.20%
2.42% 2.26% 2.31% 0.24%
0.20% 0.21% 0.24%
0.29%
0.21% 0.23% 0.26% 0.25% 0.24% 0.25%
0.28%
Page 15… CNW Research: Retail Automotive Summary
Near Luxury Car
Midi-Van Mid Range Utility-Vehicle
Minivan
Premium Car Premium Mid-Range Car
1.75% 2.07% 2.19%
2.43% 2.39% 2.64%
2.28% 1.94%
1.70% 1.92%
1.75% 1.73%
0.19% 0.17% 0.16%
0.15% 0.17% 0.14%
0.17% 0.19%
0.19%
0.23%
0.17%
0.22%
2.54% 2.23%
2.07% 1.91% 1.91% 1.93% 2.02%
1.86% 1.79% 1.70% 1.69% 1.56%
12.56% 12.42% 12.87%
12.43%
11.54% 11.21%
11.85%
12.71% 12.46%
12.10%
11.28%
10.74%
0.25% 0.25%
0.31% 0.34%
0.27%
0.34% 0.33% 0.33% 0.35% 0.35% 0.34%
0.32%
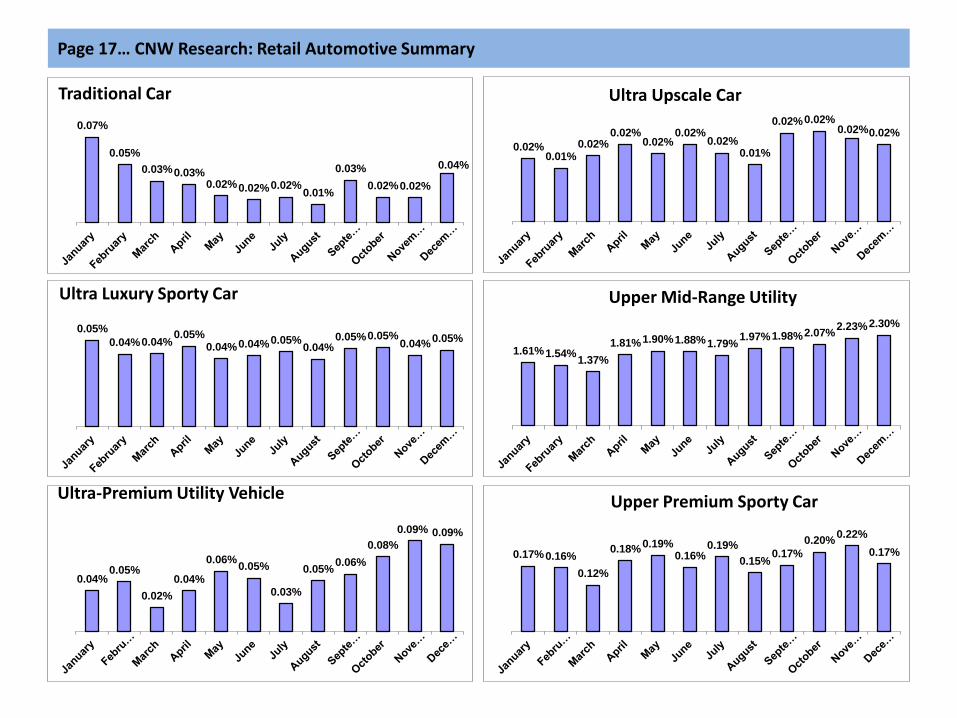
Page 16… CNW Research: Retail Automotive Summary Premium Sporty Car
Standard Mid Range Car Small Pickup
Sport Utility Pickup Touring Car
3.24% 2.73% 2.50% 2.76% 2.72% 2.74% 2.72% 2.78% 2.91%
3.27% 3.69% 3.82%
Premium Utility Vehicle
0.17% 0.16%
0.12%
0.18% 0.19%
0.16% 0.19%
0.15% 0.17%
0.20% 0.22%
0.17%
0.04% 0.05%
0.02%
0.04%
0.06% 0.05%
0.03%
0.05% 0.06%
0.08%
0.09% 0.09%
1.61% 1.54% 1.37%
1.81% 1.90% 1.88% 1.79% 1.97% 1.98% 2.07%
2.23% 2.30% 0.05%
0.04% 0.04% 0.05%
0.04% 0.04% 0.05% 0.04%
0.05% 0.05% 0.04%
0.05%
0.02% 0.01%
0.02% 0.02%
0.02% 0.02%
0.02% 0.01%
0.02% 0.02% 0.02% 0.02%
0.07%
0.05%
0.03% 0.03% 0.02% 0.02% 0.02%
0.01%
0.03%
0.02% 0.02%
0.04%
Traditional Car Ultra Upscale Car
Ultra Luxury Sporty Car Upper Mid-Range Utility
Ultra-Premium Utility Vehicle Upper Premium Sporty Car
Page 17… CNW Research: Retail Automotive Summary
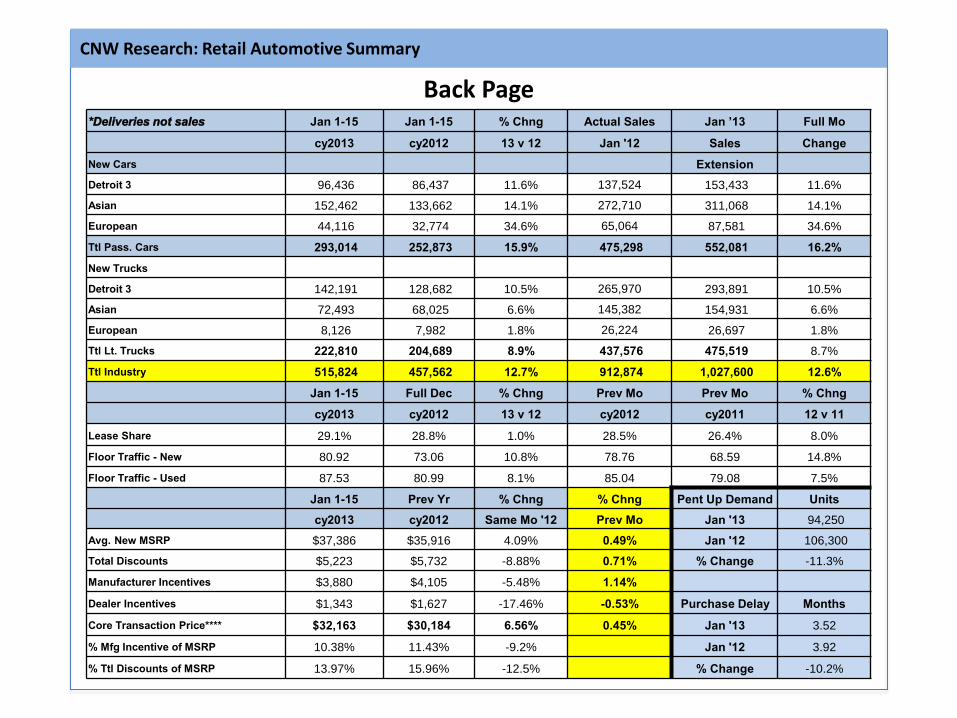
CNW Research: Retail Automotive Summary
Back Page *Deliveries not sales Jan 1-15 Jan 1-15 % Chng Actual Sales Jan ’13 Full Mo
cy2013 cy2012 13 v 12 Jan '12 Sales Change
New Cars Extension
Detroit 3 96,436 86,437 11.6% 137,524 153,433 11.6%
Asian 152,462 133,662 14.1% 272,710 311,068 14.1%
European 44,116 32,774 34.6% 65,064 87,581 34.6%
Ttl Pass. Cars 293,014 252,873 15.9% 475,298 552,081 16.2%
New Trucks
Detroit 3 142,191 128,682 10.5% 265,970 293,891 10.5%
Asian 72,493 68,025 6.6% 145,382 154,931 6.6%
European 8,126 7,982 1.8% 26,224 26,697 1.8%
Ttl Lt. Trucks 222,810 204,689 8.9% 437,576 475,519 8.7%
Ttl Industry 515,824 457,562 12.7% 912,874 1,027,600 12.6%
Jan 1-15 Full Dec % Chng Prev Mo Prev Mo % Chng
cy2013 cy2012 13 v 12 cy2012 cy2011 12 v 11
Lease Share 29.1% 28.8% 1.0% 28.5% 26.4% 8.0%
Floor Traffic - New 80.92 73.06 10.8% 78.76 68.59 14.8%
Floor Traffic - Used 87.53 80.99 8.1% 85.04 79.08 7.5%
Jan 1-15 Prev Yr % Chng % Chng Pent Up Demand Units
cy2013 cy2012 Same Mo '12 Prev Mo Jan '13 94,250
Avg. New MSRP $37,386 $35,916 4.09% 0.49% Jan '12 106,300
Total Discounts $5,223 $5,732 -8.88% 0.71% % Change -11.3%
Manufacturer Incentives $3,880 $4,105 -5.48% 1.14%
Dealer Incentives $1,343 $1,627 -17.46% -0.53% Purchase Delay Months
Core Transaction Price**** $32,163 $30,184 6.56% 0.45% Jan '13 3.52
% Mfg Incentive of MSRP 10.38% 11.43% -9.2% Jan '12 3.92
% Ttl Discounts of MSRP 13.97% 15.96% -12.5% % Change -10.2%