author's personal copy - university of...
TRANSCRIPT

This article was published in an Elsevier journal. The attached copyis furnished to the author for non-commercial research and
education use, including for instruction at the author’s institution,sharing with colleagues and providing to institution administration.
Other uses, including reproduction and distribution, or selling orlicensing copies, or posting to personal, institutional or third party
websites are prohibited.
In most cases authors are permitted to post their version of thearticle (e.g. in Word or Tex form) to their personal website orinstitutional repository. Authors requiring further information
regarding Elsevier’s archiving and manuscript policies areencouraged to visit:
http://www.elsevier.com/copyright

Author's personal copy
Characterization of topographic steady state in Taiwan
Drew B. Stolar a,b,⁎, Sean D. Willett a,c, David R. Montgomery a
a Department of Earth and Space Sciences, Box 351310, University of Washington, Seattle, WA 98195, USAb School of Earth and Space Exploration, Box 871404, Arizona State University, Tempe, AZ 85287, USA
c Geological Institute, Swiss Federal Institute of Technology Zurich, 8092 Zürich, Switzerland
Received 24 May 2006; received in revised form 1 June 2007; accepted 8 July 2007
Editor: C.P. JaupartAvailable online 2 August 2007
Abstract
The arc-continent collision in Taiwan has resulted in surface uplift, high relief and high rates of erosion. Because the collision isolder in the north and has propagated southward, Taiwan offers the opportunity to study the evolution of topography as it evolvestowards a large-scale steady state. In this paper, we analyze a 40-m digital elevation model of Taiwan to determine how topographicsteady state is expressed in the landscape; particular attention is paid to the eastern Central Range, where major drainage basins areapproximately aligned in the direction of the collision propagation. Analyses of orogen size, regional topographic slope, drainagebasin hypsometry, and local topographic slope reveal a geomorphological transition 100–125 km north of the southern tip of theisland. To the south of this transition, topographic characteristics change with distance along the island; to the north, thesecharacteristics are relatively constant, which we interpret as representing large-scale topographic steady state. Assuming that thecollision has propagated southward at a rate of 55 mm/yr, the time to topographic steady state is 1.8–2.3 Myr after emergenceabove sea level. Within the steady state region, we evaluate regional variability in the topography and find that the most prominentdeviations from a steady form are associated with large-scale structures, though our analyses of local topographic slope and riverprofile form suggest that spatial variations in rock strength and rock uplift rate also contribute to regional topographic variability.© 2007 Elsevier B.V. All rights reserved.
Keywords: topography; erosion; tectonics; GIS
1. Introduction
The strong negative feedback between local topo-graphic relief and the rate of surface lowering by erosion(Ahnert, 1970; Montgomery and Brandon, 2002) hasimportant implications for mountain range evolution
(Willett and Brandon, 2002). In convergent platetectonic settings, surface erosion encourages evolutionof the landscape towards a state in which rates of con-structive and destructive processes balance. Many theo-retical models of landscape evolution suggest thattopography can achieve a steady state (SS), such thatthe rates of rock uplift and erosion are equal everywherein the landscape (Koons, 1990; Willgoose et al., 1991a;Howard, 1994; Whipple and Tucker, 1999). In naturalsettings, however, topographic SS is likely to exist atonly the broadest spatial scales, where measures such asthe orogen size and mean relief are relatively constantthrough time (Suppe, 1981); the finer-scale variability of
Earth and Planetary Science Letters 261 (2007) 421–431www.elsevier.com/locate/epsl
⁎ Corresponding author. School of Earth and Space Exploration,Box 871404, Arizona State University, Tempe, AZ 85287, USA.Tel.: +1 206 384 9384; fax: +1 480 965 8102.
E-mail addresses: [email protected] (D.B. Stolar),[email protected] (S.D. Willett), [email protected](D.R. Montgomery).
0012-821X/$ - see front matter © 2007 Elsevier B.V. All rights reserved.doi:10.1016/j.epsl.2007.07.045

Author's personal copy
topographic characteristics at SS are not as well defined.Finer-scale topography could behave like topographyover larger scales and exhibit some mean form aboutwhich there is some variation. Alternatively, it is pos-sible that the inherent variability of topography obscuresthe expression of topographic SS at small scales. Here,we examine the characteristics of the topography inTaiwan, which is presumably at SS, thereby exploringhow topographic SS is expressed at a variety of scales ina landscape.
Taiwan is an excellent natural laboratory in which toaddress this question. Suppe (1981) recognized that thecollision between the Eurasian continental margin andthe Luzon Arc has propagated southwards over the past5–7 Myr. As a result, the age of collision and duration ofsubsequent sub-aerial erosion increase progressively tothe north. Using the implied equivalence betweendistance from the southern tip of the island and durationof sub-aerial landscape evolution, he interpreted thenorthward increase of mountain width and cross-
sectional area towards constant values as representingthe evolution toward a large-scale topographic SS. Hisanalysis also showed that the pre-SS and SS landscapesspan nearly 125 km and 150 km along the axis ofTaiwan, respectively. Thus, the topography of Taiwanrepresents an opportunity, not only to compare char-acteristics of pre-SS and SS landscapes, but also todetermine the spatial, and perhaps temporal, variabilityof topography within a SS landscape.
In this paper, we use a high-resolution (40-m grid)digital elevation model (DEM) of Taiwan and grid-based analysis tools to characterize the topography ofTaiwan. Our analysis takes advantage of the space-for-time equivalence by measuring topography withincross-island swaths and drainage basins. Projecting themeasurements onto an along-island transect allows fortrends in topography to be interpreted as the record ofprogressive landscape evolution, and allows for quan-tification of topographic variability within the steady-state region.
Fig. 1. A) Regional tectonic setting of Taiwan, with 1-, 2-, and 3-km bathymetric contours. B) Oblique collision of the continental shelf of theEurasian plate (EP) and the Luzon arc leads to propagation of the collision towards the south. Open circles show the location of the onset of collisionat three different times. C) Physiographic domains of Taiwan. Also shown are the Lishan fault and the Peikang basement high.
422 D.B. Stolar et al. / Earth and Planetary Science Letters 261 (2007) 421–431

Author's personal copy
2. Overview of the tectonic and geologic setting
Taiwan lies along the subduction zone boundarybetween the Eurasian plate (EP) and the Philippine Seaplate (PSP) (Fig. 1A). Convergence between the twoplates occurs at 82 mm/yr (Yu et al., 1997) and isaccommodated by two subduction zones of oppositepolarity (Fig. 1A). In the south, the oceanic portion ofthe EP subducts beneath the PSP at the Manila trench. Inthe north, the PSP subducts beneath the EP at the Ryukutrench. The northeastern corner of Taiwan (see Ilan plain
in Fig. 1C) is the western limit of the backarc basin ofthis subduction zone. Here, backarc extension destroysthe Taiwan orogen topography (Teng, 1996).
The Taiwan arc-continent collision zone lies betweenthe two subduction zones and is the consequence of theoblique collision of the Luzon Arc with the continentalshelf of the EP (Fig. 1B). The margin-arc obliquity hasresulted in the southward propagation of the collisionsince its initiation at 5–7 Ma (Byrne and Liu, 2002).Thus, there is a space-time equivalence that relates theage of the collision to the distance along the axis of the
Fig. 2. DEM (40-m resolution) of Taiwan with Central Range (CR) basins and river profiles used in this study highlighted. HR: Hsuehshan Range,YR: Yushan Range.
423D.B. Stolar et al. / Earth and Planetary Science Letters 261 (2007) 421–431

Author's personal copy
island. Suppe (1981) estimated the propagation rate at90 mm/yr based on the assumption that the obliquity ofthe collision is best described by the angle between theEurasian continental shelf and the axis of the island.However, paleomagnetic data (Lee et al., 1991) demon-strate that the island has undergone clockwise rotationduring collision. Byrne and Liu (2002) argued that thecollision is better described by the angle between thecontinental margin and the unrotated Luzon Arc, suchthat the propagation rate is lower (55 mm/yr).
Geology, tectonics and physiography are closelyrelated in Taiwan. Almost all of the major tectonicdomains of the island are the onshore continuations ofextensive submarine features of the Eurasian–PhilippineSea plate boundary. The Coastal Range, which is thenorthern extension of the Luzon Arc, is composed pri-marily of arc-related volcanics and olistostromal depos-its (Teng, 1987). The Longitudinal Valley (LV) mergesoffshore with the Luzon trough (Suppe, 1981) and hasaccommodated significant volumes of Miocene-to-present sediment, mainly from drainage basins in theeastern Central Range. Geodetic and creep-meter dataindicate that the Coastal Range is being thrust over theLVat a rate of 17–30 mm/yr (Yu et al., 1997; Lee et al.,2001). The Central Range (CR) consists of metamor-phosed continental shelf sediments and a pre-Tertiarybasement, which is exposed exclusively within the east-ern CR and consists of greenschists, marbles andgneisses. The geodetic study of Yu et al. (1997) in-dicates that 50–60 mm/yr of shortening is accommo-dated by deformation within and to the west of the CR.The Lishan Fault and the Hsuehshan Range (HR), acrustal-scale pop-up structure composed of slates andmeta-sandstones (Clark et al., 1993), bound the CR tothe west. Farther west are the Western Foothills, wherefaulting and fold growth have deformed Late Miocene-to-present foreland basin sediments (Suppe, 1981).
This brief overview of the setting of Taiwan indicatesthat not all regions of the island are relevant to our study.Because our goal is to characterize the landscape wheresurface erosion counteracts collision-driven accretion,we do not analyze the Coastal Range, the LongitudinalValley, or the Coastal, Ilan and Pingtung plains. In thenext Section, we measure the cross-sectional size andtopographic slope within cross-island swaths.
3. Cross-island swath analysis
3.1. Orogen size
Characteristics such as the cross-sectional area andmean elevation should reflect the mass balance of an
orogen. For instance, the cross-sectional area of a non-eroding orogenic wedge that is fed by a steady accre-tionary flux increases linearly in time; given self-similargrowth, the mean elevation should increase as the squareroot of time. Erosion of the wedge dampens growth andeventually leads to a topographic steady state.
We construct a set of 5-km wide swaths that areoriented perpendicular to the island axis and calculatethe cross-sectional area, mean elevation, and maximumelevation of each swath. These values are then projectedonto the orogen-parallel transect shown in Fig. 2. Thevalues and smoothed values are shown in Fig. 3A.
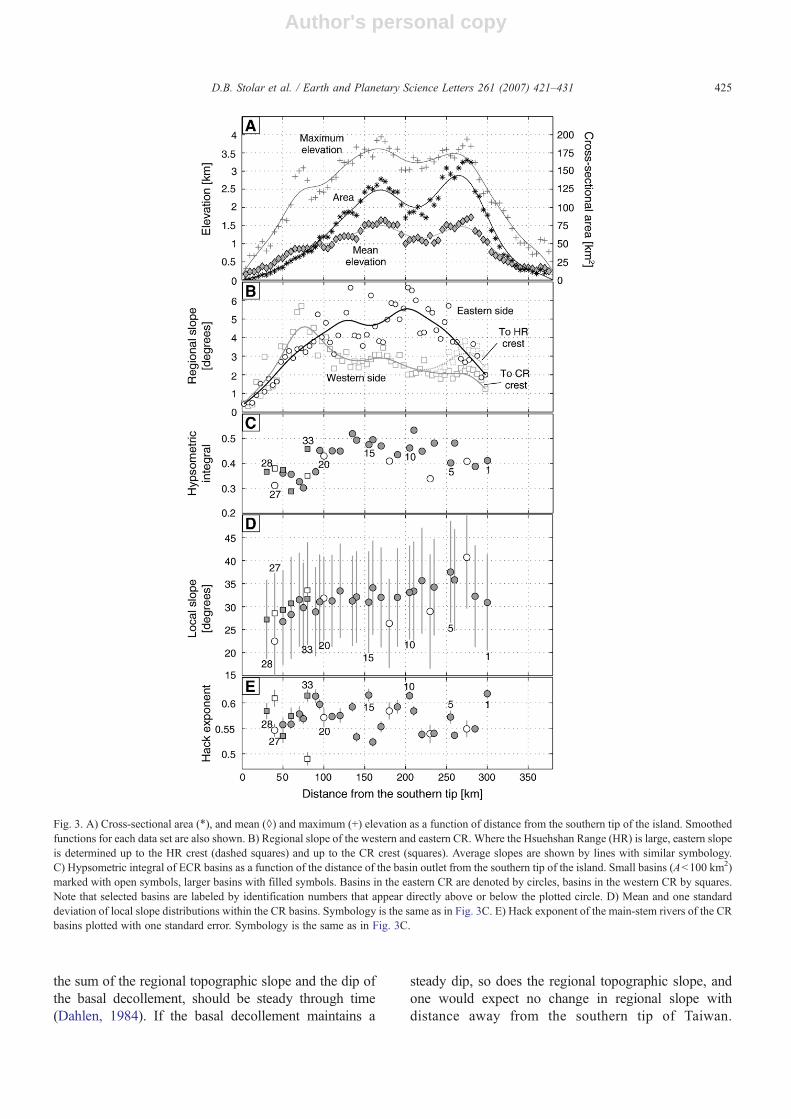
Along the axial transect, the cross-sectional area andmean and maximum elevation increase from the south-ern tip of the island to the southern end of the LV(∼125 km to the north). North of this point, thesequantities attain roughly constant values until, at 275 kmN, they decrease rapidly towards the northern tip of theisland.
From 125 km N, the largest deviations from a con-stant orogen size are associated with physiographicfeatures that, in some cases, are related to large-scalestructures. The local maxima at 175 km N are associatedwith the Yushan Range (YR in Fig. 2), which is aconsequence of the collision of the Peikang basementhigh with the Western Foothills (Liu et al., 2001). Thelocal minima at 225 km N correspond to an embaymentin the western Central Range centered about theJuoshuei river. Farther north, the local maxima at275 km N are associated with the Hsuehshan Range (HRin Fig. 2). The decrease in size north of 275 km recordsthe extensional destruction of Taiwan (Teng, 1996).
If we neglect the influence of the discrete structuresnoted above, the first-order trends in orogen size can bedescribed by three segments: an increase from thesouthern tip of the island to 125 km N, a constant valuefrom 125 km N to 300 km N, and a decrease from300 km N to the northern end of the island. Taking theaverage values of the cross-sectional area, meanelevation, and maximum elevation between 125 and300 km N to be 120 km2, 1.25 km, and 3.25 km,respectively, the maximum deviation from the mean ineach measure is approximately 30%, 20%, and 12%over this same regional extent.
3.2. Regional topographic slope
In an orogenic wedge, the regional topographic slopein the across-strike direction has particular tectonicsignificance. Assuming that the wedge deforms friction-ally and that the large-scale frictional properties of thewedge do not change with time, the taper angle, which is
424 D.B. Stolar et al. / Earth and Planetary Science Letters 261 (2007) 421–431
Author's personal copy
the sum of the regional topographic slope and the dip ofthe basal decollement, should be steady through time(Dahlen, 1984). If the basal decollement maintains a
steady dip, so does the regional topographic slope, andone would expect no change in regional slope withdistance away from the southern tip of Taiwan.
Fig. 3. A) Cross-sectional area (⁎), and mean (◊) and maximum (+) elevation as a function of distance from the southern tip of the island. Smoothedfunctions for each data set are also shown. B) Regional slope of the western and eastern CR. Where the Hsuehshan Range (HR) is large, eastern slopeis determined up to the HR crest (dashed squares) and up to the CR crest (squares). Average slopes are shown by lines with similar symbology.C) Hypsometric integral of ECR basins as a function of the distance of the basin outlet from the southern tip of the island. Small basins (Ab100 km2)marked with open symbols, larger basins with filled symbols. Basins in the eastern CR are denoted by circles, basins in the western CR by squares.Note that selected basins are labeled by identification numbers that appear directly above or below the plotted circle. D) Mean and one standarddeviation of local slope distributions within the CR basins. Symbology is the same as in Fig. 3C. E) Hack exponent of the main-stem rivers of the CRbasins plotted with one standard error. Symbology is the same as in Fig. 3C.
425D.B. Stolar et al. / Earth and Planetary Science Letters 261 (2007) 421–431

Author's personal copy
Alternatively, Hilley et al. (2004) propose that the regionaltopographic slope of an eroding wedge increases as thewedge increases in size until the accretionary and ero-sional fluxes balance. Given this expectation, the regionaltopographic slope is a possible indicator of topographicSS.
We estimate the regional slope of the sub-aerial por-tion of the orogen using mean elevation profiles fromthe cross-island swaths presented in the previous sec-tion. Where the range is characterized by only one majordivide, slopes are determined by linear regression of thewestern and eastern segments (squares and circles inFig. 3B, respectively). From 250 km N to 300 km N, theHsuehshan Range is as large or larger than the CentralRange, and the western slope is determined by linearregression of segments that extend to both the HR crest(dashed squares in Fig. 3B) and the CR crest (squares inFig. 3B). Smoothed trends are also shown in Fig. 3B.
The average eastern slope increases from near zero atthe southern tip of the island to 4° at 100 km N, remainsgreater than 4° until 250 km N and decreases to 2° at300 km N. Note that the region of highest eastern slopescoincideswith a prominent topographic embayment in thewestern side of the range that deflects the range divide tothe east. The average western slope is also low near thesouthern tip of the island and increases to a maximum of4.5° at 75 km N, which corresponds to a peak inmaximum elevation (see Fig. 3A). North of 100 kmN, thewestern slope decreases slightly, with the exception of asmall increase at 275 km N, which corresponds to thedevelopment of the Hsuehshan Range.
At the swath-to-swath scale, the variance in regionaltopographic slopes seems to increase with the averageslope value. Between 100 km N and 250 km N, slopes onthe steeper, eastern side often differ by more than 1°–1.5°from slopes from adjacent swaths. Within this same span,slopes on the western side rarely differ more than 0.5°from values from adjacent swaths. Where western slopesare high (50 to 100 km N), the variance is similar to thatobserved in the steeper portions of the eastern side.
4. Drainage basin analysis
In this section, we use a series of drainage basinanalyses to further characterize the topography of Taiwan.This analysis is complicated in the western side of therange by longitudinal drainages with structurally-con-trolled boundaries. Given the lack of a representativedistance or duration of erosion, we ignore all drainagebasins on thewestern side of the island north of 100 kmN.We consider thirty three drainage basins from the easternand western Central Range (Fig. 2). The basins range in
area from 41 to 612 km2. The statistics calculated forsmall basins (Ab100 km2) are often markedly differentthan those of adjacent, larger basins. Hence, we denotemeasurements from the smaller basins in Fig. 3 with opensymbols.
4.1. Basin hypsometry
The probability distribution of elevation within aregion, or the hypsometry, is thought to reflect thematurity of the landscape, along with the dominanttectonic and erosional processes. We quantify the hypso-metry of the CR basins using a summary value, thehypsometric integral (Strahler, 1952). For a basin withminimum elevation, zmin, and maximum elevation,zmax, the hypsometric integral is the fraction of thebasin higher than zmid= (zmin+ zmax) /2. For example, ina basin encompassing a slightly incised plateau, much ofthe basin is higher than zmid, and the hypsometricintegral is greater than 0.5.
We calculate the hypsometric integral for each of theCR drainage basins and plot the value against thedistance of the basin outlet from the southern tip of theisland (Fig. 3C). At the largest scale, the hypsometricintegral values can be divided into two populations: thetransition between the two occurs ∼100 km north of thesouthern tip of the island. Basins in the southernpopulation (Basins 22–27 and 28–32) have lowerhypsometric integral values, whereas the larger basinsin the northern population (Basins 1–21 and 33) havevalues greater than 0.39 (i.e., basins in the north havemore relative area at higher relative elevations).
North of 100 km N, the hypsometric integral ofadjacent large basins can differ by almost 0.1. Thehypsometric integral of Basin 7, which does not reachthe Central Range divide, differs by more than 0.1 fromvalues for both adjacent basins.
4.2. Local topographic slope
Measures of local topographic slope in the CentralRange should record the transition to threshold slopes,which are thought to characterize topographic SS inrapidly uplifting and eroding orogens like Taiwan(Burbank et al., 1996; Montgomery, 2001). We calculateprobability distributions of local topographic slopewithin the hillslope portion of the CR drainage basins.The distributions are all roughly Gaussian in form, andthere is no significant difference between trends in themean, median or mode.
The mean and one standard deviation of the localslope distributions are shown in Fig. 3D. Mean slope
426 D.B. Stolar et al. / Earth and Planetary Science Letters 261 (2007) 421–431
Author's personal copy
increases from 23° in Basin 27 and 27° in Basin 28 to31° in Basin 20, remains constant (30°–35°) from Basin20 to Basin 10, and increases from 33° in Basin 9 to amaximum of 41° in Basin 3. Slopes in the WCR basinstend to be slightly greater than those in the southernECR. The mean local slopes of large adjacent basins arealmost always within 5° of each other. The largest basin-to-basin differences in mean local slope are associated
with three smaller basins (Basins 3, 7 and 12), none ofwhich reach the main Central Range divide.
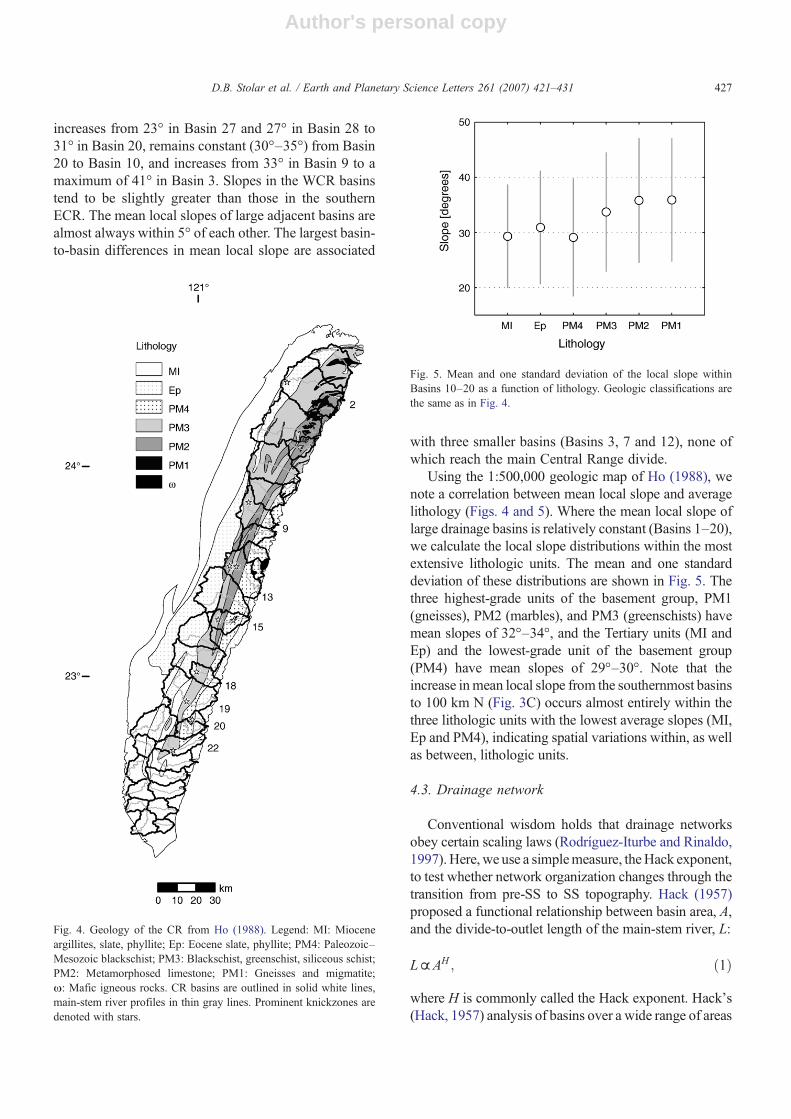
Using the 1:500,000 geologic map of Ho (1988), wenote a correlation between mean local slope and averagelithology (Figs. 4 and 5). Where the mean local slope oflarge drainage basins is relatively constant (Basins 1–20),we calculate the local slope distributions within the mostextensive lithologic units. The mean and one standarddeviation of these distributions are shown in Fig. 5. Thethree highest-grade units of the basement group, PM1(gneisses), PM2 (marbles), and PM3 (greenschists) havemean slopes of 32°–34°, and the Tertiary units (MI andEp) and the lowest-grade unit of the basement group(PM4) have mean slopes of 29°–30°. Note that theincrease inmean local slope from the southernmost basinsto 100 km N (Fig. 3C) occurs almost entirely within thethree lithologic units with the lowest average slopes (MI,Ep and PM4), indicating spatial variations within, as wellas between, lithologic units.
4.3. Drainage network
Conventional wisdom holds that drainage networksobey certain scaling laws (Rodríguez-Iturbe and Rinaldo,1997).Here, we use a simplemeasure, theHack exponent,to test whether network organization changes through thetransition from pre-SS to SS topography. Hack (1957)proposed a functional relationship between basin area, A,and the divide-to-outlet length of the main-stem river, L:
L~AH ; ð1Þ
where H is commonly called the Hack exponent. Hack's(Hack, 1957) analysis of basins over a wide range of areas
Fig. 4. Geology of the CR from Ho (1988). Legend: MI: Mioceneargillites, slate, phyllite; Ep: Eocene slate, phyllite; PM4: Paleozoic–Mesozoic blackschist; PM3: Blackschist, greenschist, siliceous schist;PM2: Metamorphosed limestone; PM1: Gneisses and migmatite;ω: Mafic igneous rocks. CR basins are outlined in solid white lines,main-stem river profiles in thin gray lines. Prominent knickzones aredenoted with stars.
Fig. 5. Mean and one standard deviation of the local slope withinBasins 10–20 as a function of lithology. Geologic classifications arethe same as in Fig. 4.
427D.B. Stolar et al. / Earth and Planetary Science Letters 261 (2007) 421–431

Author's personal copy
(∼1–1000 km2) yielded anH value of 0.56. As applied toindividual drainage basins, Eq. (1) can be inverted:
A~x1=H ; ð2Þto express the contributing area as a function ofdownstream distance, x, along the main-stem river. Wecalculate the Hack exponent of each main-stem river bylinear regression of the logarithms of contributing areaand downstream distance.
Fig. 3E shows the best-fit values and one standarderror of the Hack exponent plotted against distance ofthe basin outlet from the southern tip of the island. Notethat the correlation coefficients of all the regressionsexceed 0.95. With the exception of Basin 32, which hasan H value of 0.49, the values have a mean of 0.57 andrange from 0.53 to 0.63 with no apparent spatial trendalong the range.
5. River profile analyses
The longitudinal form of a main-stem river is animportant characteristic of the landscape and reflectsboth the local and basin-wide competition betweenrock uplift, sediment supply and transport and channellowering by erosion. As such, it is sensitive to bothtemporal and spatial variability in factors such as therock uplift rate, precipitation rate and substrateerodability. Moreover, in responding to temporalchanges in, for instance, rock uplift rate, main-stemrivers communicate these changes to the rest of adrainage basin. Thus, evidence of temporal or spatialvariability from the form of the main-stem river issuggestive of similar conditions in the rest of a drain-age basin. Because of this, river profile analysis isuseful for gaining insight into the causes of topo-graphic variability.
5.1. Profile concavity
Often, the longitudinal profile of mountain rivers canbe described by a power-law relationship between thechannel slope, S, and the contributing area, A:
S~A�h; ð3Þ
where θ is the profile concavity (Willgoose et al.,1991b; Whipple and Tucker, 1999). Much work hasgone into understanding the variability of the concavityin natural channels. In particular, Whipple and Tucker(1999) argue that the concavity, in the absence ofvariable rock uplift or precipitation, is limited to a nar-
row range of values (0.4–0.6). Work by Kirby andWhipple (2001) and Roe et al. (2002) demonstrates thatnon-uniform patterns of rock uplift and precipitation cansignificantly expand the range of expected concavities(to 0.4–2.1).
We extract the main-stem river profiles from each ofthe CR basins, remove all flat segments, and calculatethe slope of the profile by linear regression of theelevation-distance data within a moving window(Tomkin et al., 2003). We chose a window length of1 km because it is short relative to the total length ofthe profiles yet long enough to filter most of theartifacts created during filling of the original DEM.Even after filtering, perturbations in the slope-area dataare ubiquitous: in some instances, the noise is a recordof knickzones that are identifiable in the elevationprofile whereas others represent DEM artifacts andmore subtle features.
Not all CR river profiles reasonably conform to apower-law slope-area relationship (Eq. (3)). For thosethat do, we calculate the concavity by least-squaresregression of the logarithms of the slope-area data. Thesmoothest profiles yield values that are relativelyinvariant with respect to the details of the analysis,e.g., small changes in the window length and in thebounds of the regression. River profiles from Basins23–33 are smoother and yield better fits than mostprofiles from northern basins. Irregularities in most ofthe northern profiles are significant enough to precludethe calculation of meaningful concavity values.
The best-fit concavity values for the smooth CRprofiles are given in Table 1. The concavity valuesrange from 0.52 in Basin 33 to 1.54 in Basin 7. Two
Table 1Concavity values (θ) for smooth CR river profiles
Basin Area (km2) θ
2 562 0.773 48 0.785 119 0.727 44 1.5418 120 1.4120 41 1.3023 211 0.5424 140 1.0125 132 0.9626 108 0.7827 54 0.9429 68 0.9030 110 0.6531 122 0.9532 97 0.9533 300 0.52
428 D.B. Stolar et al. / Earth and Planetary Science Letters 261 (2007) 421–431

Author's personal copy
of the three highest values occur in small basins(Basins 7 and 20) that do not extend to the CR divide.There does not appear to be a significant difference inthe concavity between basins in the western andeastern CR.
5.2. Knickzones
Many of the CR river profiles that do not follow apower-law slope-area relationship are punctuated byfairly abrupt changes in channel elevation, or knick-zones. We document the location and relief of tenknickzones along eight CR river profiles (Figs. 4and 6). To avoid misinterpretation of DEM artifacts, weonly consider knickzones with relief greater than100 m. The knickzones range in relief from 250 m to600 m and in length from 0.6 km to 4.5 km (Fig. 6).Individual knickzones contribute 10%–40% of the totalrelief of the main channel. In Basins 13 and 15, whicheach have two knickzones, the cumulative proportionsare 25% and 30%, respectively.
Eight of the ten knickzones occur within 2.5 km ofmapped lithologic boundaries (Fig. 4). The twoexceptions are the prominent knickzone in Profile 9and a smaller knickzone in Profile 19, which liescompletely within the PM3 (greenschist) unit: thesymbol denoting the lower knickzone on Profile 15covers a small exposure of ultramafic rocks. Knick-zone location is not simply related to an upstreamtransition from younger to older units or vice versa(Fig. 4). In Basins 20 and 22, knickzones occur atupstream transitions from Tertiary units to pre-Tertiarybasement units whereas, in Basin 18, a knickzoneoccurs at an upstream transition from a basement unitto a Tertiary unit. The knickzone in Basin 2 occurs atan upstream transition from older to younger Tertiaryunits.
6. Discussion
6.1. Topographic steady state
The analyses of orogen size, regional topographicslope, basin hypsometry and local topographic slopereveal a consistent transition in the topography at 100–125 km N, as shown by four key metrics. 1) The trendsof cross-sectional area, mean elevation and maximumelevation indicate that the island has a roughly constantsize from 125 km N to 275 km N and that growth to thisform occurs gradually from the southern tip of the island(Fig. 3A). 2) The smoothed profiles of regional topo-graphic slope for the WCR and ECR show that slopesincrease from near zero at the southern tip of the islandand remain relatively steady (2°–3° and 4.5°–5.5°,respectively) from 100 km N to 200 km N. 3) The valueof the hypsometric integral increases at 100 km N,delimiting a northern population of basins with valuesgreater than 0.39 from a southern population with lowervalues. 4) Local topographic slopes increase from thesouth to 100 km N and maintain a relatively steady value(30°–35°) until 200 km N.
Assuming a space-time equivalence between dis-tance along the island and duration of sub-aerial erosion,we infer that the growth to a steady form represents theattainment of a large-scale topographic SS (Suppe,1981). Given a collision propagation rate of 55 mm/yr(Byrne and Liu, 2002) and the observed transitions inthe topography at 100–125 km N, the time to SS is 1.8–2.3 Myr after sub-aerial exposure.
The estimated time to SS supports the numericalmodeling results of Howard (1994), who found that, fora range of external forcing, topographic SS was attainedafter erosion removed the equivalent of three times thelandscape relief. In Taiwan, long-term erosion rates arethought to be 3–5 km/Myr (Li, 1976; Willett et al.,
Fig. 6. River profiles with prominent knickzones. Horizontal and vertical scales are 5 km and 1 km, respectively, such that the vertical exaggerationvaries by profile.
429D.B. Stolar et al. / Earth and Planetary Science Letters 261 (2007) 421–431

Author's personal copy
2003), and the topographic relief is roughly 3 km alongmuch of the island. Hence, the predicted time totopographic SS is 1.8–3 Myr.
The northern limit of the SS region is locatedbetween 250 km and 300 km N (Fig. 3A and B). Giventhe collision propagation velocity, this implies that thetopography in the northern and southern portions of theSS region differ in age by approximately 3 Myr but haveessentially the same form.
6.2. Topographic variability in the steady state region
Of the five cross-island swath and drainage basinanalyses, results from four analyses exhibit broad trendsthat we infer to be related to the transition to steady statetopography. However, the SS region, even considered inisolation, still exhibits considerable variability in mor-phological parameters. In Table 2, we show the mean andstandard deviation of the measurements made in the SSregion for each of the cross-island swath and drainagebasin analyses. Also shown is the standard deviation as apercentage of the mean, or the coefficient of variation.
In general, the variability in the swath analysisparameters is twice as large as the variability in the basincharacteristics. As noted before, large-scale structureappears to play an important role: the Yushan Range andHsuehshan Range are clearly expressed in the trends ofcross-sectional area and mean elevation (Fig. 3A).Lithology also plays a role: the highest mean localslopes are associated with exposure of the PM3, PM2and PM1 units (Gilbert, 1877) in the northern portion ofthe ECR. The connection between local slope, lithologyand duration of exhumation implies a possible obstaclefor attaining topographic steady slope, at least asmeasured by local slope. We note that: 1) similar
lithologic belts extend along most of the length of theECR, and 2) the degree of metamorphism of the rocksexposed in the ECR increases towards the north alongwith the inferred duration of exhumation. If, for a givenprotolith, rock strength increases with the degree ofmetamorphism, the rock strength at a fixed point in theECR will increase with time, and so will the localtopographic slope. The magnitude of the variation inrock strength will depend on the protolith and P–T–tpath of metamorphic rocks exposed at the surface.
Finally, the coincidence of many of the knickzoneswith mapped lithologic boundaries suggests persistentand relatively abrupt upstream changes in either or bothrock uplift rate and rock strength. That is, knickzonesmight form at these boundaries as a result of anupstream-increase in rock uplift rate or, alternatively,form farther downstream and propagate until slowing atan upstream-increase in rock strength (Crosby andWhipple, 2006). As mapped at the 1:500,000 scale(Ho, 1988), the knickzones occur at transitions from bothyounger-to-older units and from older-to-younger units,though it is certainly possible that unmapped, smaller-scale variations in rock strength might be capable ofslowing a migrating knickzone. Alternatively, lithologiccontacts might not be conformable and might insteadrepresent active faults. Distinguishing between litholog-ic and tectonic controls on knickzone location wouldrequire more detailed mapping of the eastern CentralRange.
7. Conclusions
Topographic steady state in Taiwan is expressed bythe existence and coincidence of transitions in severalcharacteristics of the landscape approximately 100–125 km N of the southern tip of the island. Assumingthat the collision between the Eurasian continentalmargin and the Luzon Arc has propagated southwardsat a rate of 55 mm/yr, a topographic SS is achieved1.8–2.3 Myr after emergence above sea level. All theanalyses indicate that significant physiographic vari-ability can exist in a landscape that is in a large-scaletopographic SS. At the regional scale (∼100 km),topographic variability can be attributed to large-scalestructure (e.g., uplift of the Yushan and HsuehshanRanges). Local slope and river profile analyses suggestvariations in rock strength and/or rock uplift rate,which might account for some of the observedvariability.
For many of the basin and river profile analyses,anomalous measurements are typically associated withsmaller basins. Significant swath-to-swath and basin-to-
Table 2Estimates of regional variability in the topographic steady state region
Analysis Mean Standard deviation C.V. (%)
Cross-sectional area 110 km2 20 km2 18Mean elevation 1.3 km 0.21 km 16Maximum elevation 3.4 km 0.26 km 8Regional slope (WCR) 2.6° 0.43° 17Regional slope (ECR) 5.0° 0.98° 20Hypsometric integral 0.47 0.04 9Mean local slope 33° 1.9° 6Hack exponent 0.57 0.03 5
C.V.—coefficient of variation is defined as the one hundred times theratio of the standard deviation and the mean; Steady-state regionextends from 125 km N to 250 km N. WCR—Western Central Range;ECR—Eastern Central Range; North of 225 km N, the regional slopeof the WCR is taken up to the crest of the Hsuehshan Range (dashedsquares in Fig. 3B).
430 D.B. Stolar et al. / Earth and Planetary Science Letters 261 (2007) 421–431

Author's personal copy
basin differences in regional topographic slope, hypso-metric integral, mean local slope, and profile concavityalso suggest that variability in the topography wouldmost likely preclude the recognition of SS by smaller-scale studies of topography. Thus, even in a setting likeTaiwan, topographic SS is revealed only by broadspatial transitions between pre-SS and SS landscapes.
Acknowledgements
We thank an anonymous reviewer for helpful com-ments. This work was supported by a National ScienceFoundation (NSF) Graduate Research Fellowship toStolar.
References
Ahnert, F., 1970. Functional relationships between denudation, relief,and uplift in large mid-latitude drainage basins. Am. J. Sci. 268 (3),243–263.
Burbank, D.W., Leland, J., Fielding, E., Anderson, R.S., Brozovic, N.,Reid, M.R., Duncan, C., 1996. Bedrock incision, rock uplift andthreshold hillslopes in the northwestern Himalayas. Nature 379(6565), 505–510.
Byrne, T.B., Liu, C.-S., 2002. Preface: introduction to the geology andgeophysics of Taiwan. Geology and Geophysics of an Arc-continent Collision, Taiwan. Geological Society of America,Boulder, CO.
Clark, M.B., Fisher, D.M., Lu, C.Y., Chen, C.H., 1993. Kinematicanalyses of the Hsuehshan Range, Taiwan — a large-scale pop-upstructure. Tectonics 12 (1), 205–217.
Crosby, B.T., Whipple, K.X., 2006. Knickpoint initiation anddistribution within fluvial networks: 236 waterfalls in the WaipaoaRiver, North Island, New Zealand. Geomorphology 82 (1–2),16–38.
Dahlen, F.A., 1984. Noncohesive critical Coulomb wedges— an exactsolution. J. Geophys. Res. 89 (NB12), 125–133.
Gilbert, G.K., 1877. Report on the geology of the HenryMountains. U.S.Geographical andGeological Survey of the RockyMountainRegion,Government Printing Office, Washington D.C., p. 170.
Hack, J.T., 1957. Studies on Longitudinal Profiles in Virginia andMaryland. United States Geological Survey, Washington D.C.,p. 294.
Hilley, G.E., Strecker, M.R., Ramos, V.A., 2004. Growth and erosionof fold-and-thrust belts with an application to the Aconcagua fold-and-thrust belt, Argentina. J. Geophys. Res. B. Solid Earth 109(B01410). doi:10.1029/2002JB002282.
Ho, C.S., 1988. An introduction to the geology of Taiwan: explanatorytext of the geological map of Taiwan. Central Geological Surveyand Ministry of Economic Affairs, Taipei. 192 pp.
Howard, A.D., 1994. A detachment-limited model of drainage-basinevolution. Water Resour. Res. 30 (7), 2261–2285.
Kirby, E., Whipple, K., 2001. Quantifying differential rock-uplift ratesvia stream profile analysis. Geology 29 (5), 415–418.
Koons, P.O., 1990. 2-sided orogen-collision and erosion from thesandbox to the Southern Alps, New-Zealand. Geology 18 (8),679–682.
Lee, T.-Q., Kissel, C., Barrier, E., Laj, C., Chi, W.-R., 1991.Paleomagnetic evidence for a diachronic clockwise rotation ofthe Coastal Range, eastern Taiwan. Earth Planet. Sci. Lett. 104,245–257.
Lee, J.-C., Angelier, J., Chu, H.-T., Hu, J.C., Jeng, F.-S., 2001.Continuous monitoring of an active fault in a plate suture zone: acreepmeter study of the Chihshang Fault, eastern Taiwan.Tectonophysics 333, 219–240.
Li, Y.H., 1976. Denudation of Taiwan island since the Pliocene epoch.Geology 4, 105–107.
Liu, T.-K., Hsieh, S., Chen, Y.-C., Chen, W.-S., 2001. Thermo-kinematic evolution of the Taiwan oblique-collision mountain beltas revealed by zircon fission track dating. Earth Planet. Sci. Lett.186 (1), 45–56.
Montgomery, D.R., 2001. Slope distributions, threshold hillslopes, andsteady-state topography. Am. J. Sci. 301 (4–5), 432–454.
Montgomery, D.R., Brandon, M.T., 2002. Topographic controls onerosion rates in tectonically active mountain ranges. Earth Planet.Sci. Lett. 201 (3–4), 481–489.
Rodríguez-Iturbe, I., Rinaldo, A., 1997. Fractal River Basins. Cam-bridge University Press, New York. 565 pp.
Roe, G.H., Montgomery, D.R., Hallet, B., 2002. Effects of orographicprecipitation variations on the concavity of steady-state riverprofiles. Geology 30 (2), 143–146.
Strahler, A.N., 1952. Hypsometric (area-altitude) analysis of erosionaltopography. Geol. Soc. Amer. Bull. 63, 1117–1142.
Suppe, J., 1981. Mechanics of mountain building and metamorphismin Taiwan. Mem. Geol. Soc. China 4, 67–89.
Teng, L.S., 1987. Stratigraphic records of the late Cenozoic Penglaiorogeny of Taiwan. Acta Geol. Taiwan 25, 205–224.
Teng, L.S., 1996. Extensional collapse of the northern Taiwanmountain belt. Geology 24, 949–952.
Tomkin, J.H., Brandon,M.T., Pazzaglia, F.J., Barbour, J.R.,Willett, S.D.,2003. Quantitative testing of bedrock incision models for theClearwater River, NW Washington state. J. Geophys. Res. B. SolidEarth 108 (B6).
Whipple, K.X., Tucker, G.E., 1999. Dynamics of the stream-powerriver incision model: implications for height limits of mountainranges, landscape response timescales, and research needs.J. Geophys. Res. B. Solid Earth 104 (B8), 17661–17674.
Willett, S.D., Brandon, M.T., 2002. On steady states in mountain belts.Geology 30 (2), 175–178.
Willett, S.D., Fisher, D., Fuller, C., En-Chao, Y., Lu, C.Y., 2003.Erosion rates and orogenic-wedge kinematics in Taiwan inferredfrom fission-track thermochronometry. Geology 31 (11), 945–948.
Willgoose, G., Bras, R.L., Rodriguez-Iturbe, I., 1991a. A coupledchannel network growth and hillslope evolution model. 1. Theory.Water Resour. Res. 27 (7), 1671–1684.
Willgoose, G., Bras, R., Rodriguez-Iturbe, I., 1991b. A physicalexplanation of an observed link area–slope relationship. WaterResour. Res. 27 (7), 1697–1702.
Yu, S.-B., Chen, H.-Y., Kuo, L.-C., 1997. Velocity field of GPSstations in the Taiwan area. Tectonophysics 274, 41–59.
431D.B. Stolar et al. / Earth and Planetary Science Letters 261 (2007) 421–431