author’s choice © 2014 by the american society for ... · from the ‡mrc human genetics unit,...
TRANSCRIPT
Comparative Performance of Four Methods forHigh-throughput Glycosylation Analysis ofImmunoglobulin G in Genetic andEpidemiological Research*□S
Jennifer E. Huffman‡e, Maja Pucic-Bakovic§e, Lucija Klaric§e, Rene Hennig¶�e,Maurice H. J. Selman**e, Frano Vuckovic§, Mislav Novokmet§, Jasminka Kristic§,Matthias Borowiak�, Thilo Muth¶�, Ozren Polasek‡‡, Genadij Razdorov§§,Olga Gornik§§, Rosina Plomp**, Evropi Theodoratou¶¶, Alan F. Wright‡, Igor Rudan¶¶,Caroline Hayward‡, Harry Campbell¶¶, Andre M. Deelder**, Udo Reichl¶��,Yurii S. Aulchenkoabf, Erdmann Rapp¶�f, Manfred Wuhrer**cf, and Gordan Lauc§§§fd
The biological and clinical relevance of glycosylation is be-coming increasingly recognized, leading to a growing inter-est in large-scale clinical and population-based studies. Inthe past few years, several methods for high-throughputanalysis of glycans have been developed, but thorough val-idation and standardization of these methods is requiredbefore significant resources are invested in large-scalestudies. In this study, we compared liquid chromatography,capillary gel electrophoresis, and two MS methods forquantitative profiling of N-glycosylation of IgG in the samedata set of 1201 individuals. To evaluate the accuracy of thefour methods we then performed analysis of associationwith genetic polymorphisms and age. Chromatographicmethods with either fluorescent or MS-detection yieldedslightly stronger associations than MS-only and multiplexed
capillary gel electrophoresis, but at the expense of lowerlevels of throughput. Advantages and disadvantages ofeach method were identified, which should inform the se-lection of the most appropriate method in future studies.Molecular & Cellular Proteomics 13: 10.1074/mcp.M113.037465, 1598–1610, 2014.
Glycans are important structural and functional componentsof the majority of proteins, but because of their structural com-plexity and the absence of a direct genetic template our currentunderstanding of the role of glycans in biological processes lagssignificantly behind the knowledge about proteins or DNA (1, 2).However, a recent comprehensive report endorsed by the USNational Academies concluded that “glycans are directly in-volved in the pathophysiology of every major disease and thatadditional knowledge from glycoscience will be needed to real-ize the goals of personalized medicine” (3).
It is estimated that the glycome (defined as the complete setof all glycans) of a eukaryotic cell is composed of more than amillion different glycosylated structures (1), which contain up to10,000 structural glycan epitopes for interaction with antibod-ies, lectins, receptors, toxins, microbial adhesins, or enzymes(4). Our recent population-based studies indicated that thecomposition of the human plasma N-glycome varies signifi-cantly between individuals (5, 6). Because glycans have impor-tant structural and regulatory functions on numerous glycopro-teins (7), the observed variability suggests that differences inglycosylation might contribute to a large part of the humanphenotypic variability. Interestingly, when the N-glycome of iso-lated immunoglobulin G (IgG)1 was analyzed, it was found to be
From the ‡MRC Human Genetics Unit, Institute of Genetics andMolecular Medicine, University of Edinburgh, Edinburgh, UK; §GenosGlycoscience Laboratory, Zagreb, Croatia; ¶Max Planck Institute forDynamics of Complex Technical Systems, Magdeburg, Germany;�glyXera GmbH, Magdeburg, Germany; **Center for Proteomics andMetabolomics, Leiden University Medical Center, Leiden, The Neth-erlands; ‡‡Faculty of Medicine, University of Split, Split, Croatia;§§University of Zagreb, Faculty of Pharmacy and Biochemistry, Za-greb, Croatia; ¶¶Centre for Population Health Sciences, School ofMedicine and Veterinary Medicine, University of Edinburgh, Edin-burgh, UK; ��Otto-von-Guericke University, Chair of Bioprocess En-gineering, Magdeburg, Germany; aInstitute of Cytology and GeneticsSB RAS, Novosibirsk, Russia; b“Yurii Aulchenko” consulting, Gronin-gen, The Netherlands; cDivision of BioAnalytical Chemistry, VU Uni-versity Amsterdam, Amsterdam, The Netherlands
Author’s Choice—Final version full access.Received January 2, 2014, and in revised form, March 14, 2014Published, MCP Papers in Press, April 9, 2014, DOI 10.1074/
mcp.M113.037465Author contributions: Y.S.A., E.R., M.W., and G.L. designed re-
search; M.P., R.H., M.H.S., M.N., J.K., M.B., and T.M. performedresearch; O.G., A.F.W., I.R., C.H., H.C., A.M.D., and U.R. contributednew reagents or analytic tools; J.E.H., L.K., F.V., O.P., G.R., E.T., andY.S.A. analyzed data; J.E.H., M.P., L.K., R.H., M.H.S., R.H.P., I.R.,Y.S.A., E.R., M.W., and G.L. wrote the paper.
1 The abbreviations used are: IgG, immunoglobulin G; GWAS, ge-nome-wide association studies; UPLC-FLR, ultraperformance liquidchromatography with fluorescence detection; CGE-LIF, multiplexcapillary gel electrophoresis with laser induced fluorescence detec-tion; MALDI-TOF-MS, matrix assisted laser desorption/ionization timeof flight MS; LC-ESI-MS, liquid chromatography electrospray MS.
Technological Innovation and Resources
Author’s Choice © 2014 by The American Society for Biochemistry and Molecular Biology, Inc.This paper is available on line at http://www.mcponline.org
1598 Molecular & Cellular Proteomics 13.6

even more variable than the total plasma N-glycome (8), indi-cating that the combined analysis of all plasma glycans releasedfrom many different glycoproteins blurs signals of protein-spe-cific regulation of glycosylation.
A number of studies have investigated the role of glycans inhuman disease, including autoimmune diseases and cancer(9, 10). However, most human glycan studies have been con-ducted with very small sample sizes. Given the complexcausal pathways involved in pathophysiology of commoncomplex disease, and thus the likely modest effect sizesassociated with individual factors, the majority of these stud-ies are very likely to be substantially underpowered. In thecase of inflammatory bowel disease, only 20% of reportedinflammatory bowel disease glycan associations were repli-cated in subsequent studies, suggesting that most are falsepositive findings and that there is publication bias favoring thepublication of positive findings (11). This situation is similar tothat which occurred in the field of genetic epidemiology in thepast when many underpowered candidate gene studies werepublished and were later found to consist of mainly falsepositive findings (12, 13). It is essential, therefore, that robustand affordable methods for high-throughput analysis are de-veloped so that adequately powered studies can be con-ducted and the publication of large numbers of small studiesreporting false positive results (which could threaten the cred-ibility of glycoscience) be avoided.
Rapid advances of technologies for high-throughput ge-nome analysis in the past decade enabled large-scale ge-nome-wide association studies (GWAS). GWAS has becomea reliable tool for identification of associations between ge-netic polymorphisms and various human diseases and traits(14). Thousands of GWAS have been conducted in recentyears, but these have not included the study of glycan traitsuntil recently. The main reason was the absence of reliabletools for high-throughput quantitative analysis of glycans thatcould match the measurements of genomic, biochemical, andother traits in their cost, precision, and reproducibility. How-ever, several promising high-throughput technologies foranalysis of N-glycans were developed (8, 15–20) recently.Successful implementation of high-throughput analyticaltechniques for glycan analysis resulted in publication of fourinitial GWAS of the human glycome (21–24).
In this study, we compared ultra-performance liquid chro-matography with fluorescence detection (UPLC-FLR), multi-plex capillary gel electrophoresis with laser induced fluores-cence detection (xCGE-LIF), matrix-assisted laser desorption/ionization time-of-flight mass spectrometry (MALDI-TOF-MS),and liquid chromatography electrospray mass spectrometry(LC-ESI-MS) as tools for mid-to-high-throughput glycomicsand glycoproteomics. We have analyzed IgG N-glycans by allfour methods in 1201 individuals from European populations.The analysis of associations between glycans and �300,000single-nucleotide genetic polymorphisms was performed andcorrelation between glycans and age was studied in all four
data sets to identify the analytical method that shows thestrongest potential to uncover biological mechanisms under-lying protein glycosylation.
EXPERIMENTAL PROCEDURES
Study Participants—All research in this study involved adult humanparticipants from the Croatian Adriatic islands of Vis and Korcula whowere recruited within a larger genetic epidemiology program previ-ously described (25). The study conforms to the ethical guidelines ofthe 1975 Declaration of Helsinki and was approved by the EthicsCommittee of the University of Split Medical School. All participants inthis study have signed the appropriate informed consent. IgG waspurified from the plasma of 1821 individuals using monolithic proteinG 96-well plates at the Genos Glycoscience Laboratory in Zagreb.Aliquots of purified IgG were sent to the Leiden University MedicalCenter for MS analysis (MALDI-TOF-MS and LC-ESI-MS) of IgGglycopeptides and to the Max Planck Institute and glyXera in Mag-deburg for xCGE-LIF analysis of IgG glycans. UPLC-FLR analysis wasperformed at Genos. Using all four methods, 1201 individuals weresuccessfully analyzed.
Isolation of IgG—Immunoglobulin G was isolated from plasma byaffinity chromatography using a 96-well protein G monolithic plate(BIA Separations, Ajdovscina, Slo). The protein G plate was firstwashed with 10 column volumes (CV) of ultrapure water and equili-brated with 10 CV of binding buffer (1� PBS, pH 7.4; Fisher Scientific,Pittsburgh, PA, USA). Plasma samples (50 �l) were diluted 10� withthe binding buffer, applied to the plate and instantly washed five timeswith 5 CV of binding buffer to remove unbound proteins. IgGs wereeluted from the protein G monoliths using 5 CV of 100 mM formic acid(FA; Fisher Scientific), pH 2.5, into a 96 deep well plate and immedi-ately neutralized to pH 7.0 with 1 M ammonium bicarbonate (FisherScientific). After each sample application, the plate was regeneratedwith the following buffers: 10 CV of 10� PBS, followed by 10 CV of0.1 M FA and afterward 10 CV of 1� PBS to re-equilibrate themonoliths. Each step of the isolation was done under vacuum (ap-prox. 60 mmHg pressure reduction while applying the samples, 500mmHg during elution and washing steps) using a manual set-upconsisting of a multichannel pipette, a vacuum manifold (BeckmanCoulter, La Brea, CA, USA), and a vacuum pump (Pall Life Sciences,Ann Arbor, MI, USA).
Hydrophilic Interaction Chromatography of IgG N-glycans-SamplePreparation and Analysis
Glycan Release and Labeling—Aliquots (1/5; 200 �l) of the proteinG eluates were applied to a 96-well flat-bottomed microtiter plate,dried down in a vacuum concentrator and reduced by adding 2 �l of5� sample buffer (125 �l of 0.5 M Tris (Sigma-Aldrich, St, Louis, MO,USA), pH 6.6, 200 �l of 10% SDS (Sigma-Aldrich), and 675 �l ofwater), 7 �l of water, and 1 �l of 0.5 M dithiothreitol (DTT; Sigma-Aldrich) and incubating at 65 °C for 15 min. Ultrapure water was usedthroughout. The samples were then alkylated by adding 1 �l of 100mM iodoacetamide (IAA; Sigma-Aldrich) and incubated for 30 min inthe dark at room temperature. Afterward, the samples were immobi-lized in a gel block by adding 22.5 �l of 30% (w/w) acrylamide/0.8%(w/v) bis-acrylamide stock solution (37.5:1, Protogel; Sigma-Aldrich),11.25 �l of 1.5 M Tris, pH 8.8, 1 �l of 10% (w/v) SDS (Invitrogen,Carlsbad, CA, USA), 1 �l of 10% (w/v) ammonium peroxodisulphate(APS; Sigma-Aldrich), and 1 �l of N,N,N,N�-tetramethyl-ethylenedia-mine (TEMED; Invitrogen). The gel blocks were transferred to a What-man protein precipitation plate and washed with 1 ml of acetonitrilewith vortexing on a plate shaker for 10 min, followed by removal of theliquid on a vacuum manifold. The gel blocks were then washed twicewith 1 ml of 20 mM sodium bicarbonate (NaHCO3; Sigma-Aldrich), pH7.2, followed by 1 ml of acetonitrile (ACN; J.T.Baker, Phillipsburg, NJ,USA). N-glycans were released by adding 50 �l of 2.5 mU PNGase F
Glycosylation Analysis for Genetics and Epidemiology
Molecular & Cellular Proteomics 13.6 1599

(ProZyme, Leandro, CA, USA) in 20 mM NaHCO3, pH 7.2, to reswellthe gel pieces. After 5 min another 50 �l of 20 mM NaHCO3 was addedand the plates were subsequently sealed with adhesive film (USAScientific, Ocala, FL, USA) and incubated overnight at 37 °C. Thereleased N-glycans were collected into a 2-ml polypropylene 96-wellplate (Waters, Milford, MA, USA) by washing the gel pieces with 3 �200 �l of water, followed by 200 �l of ACN, 200 �l of water, and finally200 �l of ACN. The released N-glycans were dried, redissolved in 20�l of 1% FA, incubated at room temperature for 40 min, and driedagain. N-glycans were labeled with 5 �l of 2-AB labeling solution (55mg of anthranilamide, 66 mg of sodium cyanoborohydride, 330 �l ofglacial acetic acid, and 770 �l of dimethyl sulfoxide (DMSO); all fromSigma-Aldrich), shaken for 5 min, incubated for 30 min at 65 °C,shaken again for 5 min, and further incubated for 90 min. Excess 2-ABwas removed using solid-phase extraction with 1-cm square piecesof prewashed Whatman 3MM chromatography paper which wasdried, folded into quarters and placed into a Whatman protein pre-cipitation plate (prewashed with 200 �l of ACN followed by 200 �l ofwater). The 5 �l of 2-AB labeled IgG N-glycans were applied to thepaper and left to dry and bind for 15 min. The excess 2-AB waswashed off the paper by shaking with 1.6 ml of ACN for 15 min andthen removing the ACN using a vacuum manifold; this step wasrepeated four times. The labeled N-glycans were eluted from thepaper by shaking with 500 �l of water for 20 min and collected byvacuum into a 2-ml 96-well plate; this step was repeated two times.The eluted 2-AB IgG N-glycans were dried before resuspending in aknown volume of water ready for analysis by UPLC-FLR.
Hydrophilic Interaction Chromatography—2-AB labeled IgG N-gly-cans were separated by hydrophilic interaction chromatography on aWaters Acquity UPLC instrument consisting of a quaternary solventmanager, sample manager and a FLR fluorescence detector set withexcitation and emission wavelengths of 330 and 420 nm, respectively.The instrument was under the control of Empower 2 software, build2145 (Waters). Labeled N-glycans were separated on a Waters BEHGlycan chromatography column, 100 � 2.1 mm i.d., 1.7 �m BEHparticles, with 100 mM ammonium formate, pH 4.4, as solvent A andACN as solvent B. A linear gradient of 75%-62% ACN was used atflow rate of 0.4 ml/min in a 20 min analytical run. Samples weremaintained at 5 °C prior to injection, and the separation temperaturewas 60 °C. The system was calibrated using an external standard ofhydrolyzed and 2-AB labeled glucose oligomers from which the re-tention times for the individual glycans were converted to glucoseunits (GU). Data processing was performed using an automatic proc-essing method with a traditional integration algorithm after whicheach chromatogram was manually corrected to maintain the sameintervals of integration for all the samples. The chromatograms ob-tained were all separated in the same manner into 24 peaks and theamount of glycans in each peak was expressed as % of total inte-grated area.
Mass Spectrometry (MALDI-TOF-MS and nanoLC-ESI-MS) of IgGN-glycopeptides - Sample Preparation and Analysis
Trypsin Digestion and Reverse-phase Solid-phase Extraction (RP-SPE)—Aliquots (1/20; 50 �l) of the protein G eluates were applied to96-well polypropylene V-bottom microtiter plates. TPCK trypsin (Sig-ma-Aldrich) was first dissolved in ice-cold 20 mM acetic acid (Merck,Darmstadt, Germany) to a final concentration of 0.4 �g/�l after whichit was further diluted to 0.02 �g/�l with ice-cold ultrapure water. Toeach sample 20 �l of the diluted trypsin was added followed byovernight incubation at 37 °C.
For reverse-phase desalting and purification of glycopeptides, 5mg of Chromabond C18ec beads (Marcherey-Nagel, Duren, Germany)were applied to each well of an OF1100 96-well polypropylene filterplate with a 10 �m polyethylene frit (Orochem Technologies Inc.,Lombard, IL, USA). The RP stationary phase was activated with 3 �
200 �l 80% ACN containing 0.1% trifluoroacetic acid (TFA; Fluka,Steinheim, Germany) and conditioned with 3 � 200 �l 0.1% TFA. TheIgG digests were diluted 10� in 0.1% TFA, loaded onto the C18
beads, and washed with 3 � 200 �l 0.1% TFA. The entire procedurewas performed on a vacuum manifold (� 3 mmHg). IgG glycopep-tides were eluted into a V-bottom microtiter plate by centrifugation at500 rpm with 90 �l of 18% ACN containing 0.1% TFA. Eluates weredried by vacuum centrifugation, reconstituted in 20 �l MQ water andstored at �20 °C until analysis by MS.
MALDI-TOF-MS—Purified and desalted tryptic IgG glycopeptides(3 �l) were spotted onto MTP 384 polished steel target plates (BrukerDaltonics, Bremen, Germany) and allowed to dry at room tempera-ture. Subsequently 1 �l of 5 mg/ml 4-chloro-�-cyanocinnamic acid(Cl-CCA; 95% purity; Bionet Research, Camelford, Cornwall, UK) in50% ACN was applied on top of each sample and allowed to dry.Glycopeptides were analyzed on an UltrafleX II MALDI-TOF/TOFmass spectrometer (Bruker Daltonics) operated in the negative-ionreflectron mode, because negative-ion mode has been found well-suited for the analysis of IgG glycopeptides and specifically for sia-lylated glycopeptides (26), while reflectron mode greatly improves theresolution and sensitivity of the analysis. Ions between m/z 1000 and3800 were recorded. To allow homogeneous spot sampling a randomwalk laser movement with 50 laser shots per raster spot was appliedand each IgG glycopeptide sum mass spectrum was generated byaccumulation of 2000 laser shots. Mass spectra were internally cali-brated using a list of known glycopeptides. Data processing andevaluation were performed with FlexAnalysis Software (Bruker Dal-tonics) and Microsoft Excel, respectively. Structural assignment of thedetected glycoforms was performed on the basis of literature knowl-edge of IgG N-glycosylation (27–32). The data were baseline sub-tracted and the intensities (peak heights) of a defined set of 27glycopeptides (16 glycoforms for IgG1 and 11 for IgG2&3) wereautomatically defined for each spectrum as described before (33).See supplementary Table S1 for a complete list of the assignedpeptides and corresponding MS signals.
In Caucasian populations, IgG2 and IgG3 have identical peptidemoieties (E293EQFNSTFR301) of their tryptic Fc glycopeptides andwere, therefore, not distinguished by the profiling method (34). Rela-tive intensities of IgG Fc glycopeptides were obtained by integratingand summing four isotopic peaks followed by normalization to thetotal subclass specific glycopeptide intensities, as described previ-ously (33).
Reverse Phase nano-LC-sheath-flow-ESI-MS—Purified and de-salted tryptic IgG glycopeptides were also analyzed on an Ultimate3000 HPLC system (Dionex Corporation, Sunnyvale, CA, USA), con-sisting of a degasser unit, binary loading pump, dual binary gradientpump, autosampler maintained at 5 °C and fitted with a 10 �l PEEKsample loop, and two column oven compartments set at 30 °C. Toprotect the trap and analytical column for particulates, samples werecentrifuged at 4000 rpm for 5 min and passed through a 2 �m poresize stainless steel frit mounted between the autosampler transfertubing and the trap column. Samples (250–5000 nl) were applied to aDionex Acclaim PepMap100 C18 (5 mm � 300 �m i.d.) SPE trapcolumn conditioned with 0.1% TFA (mobile phase A) for 1 min at 25�l/min. After sample loading the trap column was switched in-linewith the gradient and Ascentis Express C18 nano-LC column (50mm � 75 �m i.d., 2.7 �m HALO fused core particles; Supelco,Bellefonte, USA) for 8 min while sample elution took place. This wasfollowed by an off-line cleaning of the trap column with three full loopinjections containing 5 �l 5% isopropanol (IPA) � 0.1% FA and 5 �l50% IPA � 0.1% FA. On-column separation was achieved at 900nl/min using the following gradient of mobile phase A and 95% ACN(Biosolve BV, Valkenswaard, the Netherlands; mobile phase B): 0 min3% B, 2 min 5% B, 5 min 20% B, 6 min 30% B, 8 min 30% B, 9 min
Glycosylation Analysis for Genetics and Epidemiology
1600 Molecular & Cellular Proteomics 13.6

0% B, and 14 min 0% B. The separation was coupled to a quadru-pole-TOF-MS (micrOTOF-Q; Bruker Daltonics) equipped with astandard ESI source (Bruker Daltonics) and a sheath-flow ESI sprayer(capillary electrophoresis ESI-MS sprayer; Agilent Technologies,Santa Clara, USA). The column outlet tubing (20 �m i.d., 360 �m o.d.)was directly applied as sprayer needle. A 2 �l/min sheath-flow of 50%IPA, 20% propionic acid (PA) and 30% ultrapure water was applied byone of the binary gradient pumps to reduce the TFA gas phase ionpairing and assist with ESI spray formation. A nitrogen stream wasapplied as dry gas at 4 L/min with a nebulizer pressure of 0.4 bars toimprove mobile phase evaporation. Glycan decay during ion transferwas reduced by applying 2 and 4 eV quadrupole ion energy andcollision energy, respectively. Scan spectra were recorded from m/z300 to 2000 with two averaged scans at a frequency of 1 Hz. Persample the total analysis time was 16 min. The software used tooperate the Ultimate 3000 HPLC system and the Bruker micrOTOF-Qwere Chromeleon Client version 6.8 and micrOTOF control version2.3, respectively.
Each LC-MS data set was calibrated internally using a list of knownglycopeptides, exported to the open mzXML format by Bruker Data-Analysis 4.0 in batch mode (35) and aligned to a master data set of atypical sample (containing many of the (glyco)peptide species sharedbetween multiple samples) using msalign2 (36) and a simple warpingscript in AWK (37). From each data set a list of 402 predefinedfeatures, defined as the peak maximum within mass window of � m/z0.04 and a retention time window of �10 (38), were extracted usingthe in-house developed “Xtractor2D” software and merged to a com-plete data matrix as described previously (39). As input, Xtractor2Dtakes a data set in the mzXML format aligned to the master data setand a reference list with predefined features with m/z windows andretention times in seconds. The theoretical m/z values used to identifythe glycopeptide features are calculated, and the retention times onthe chromatographic time scale of the master data set are used forthe alignment. Because of the use of TFA as ion pairing reagent, allglycopeptides belonging to the same IgG subclass have approxi-mately the same retention time, regardless of the number of N-acetylneuraminic acid residues. The software and ancillary scripts arefreely available at www.ms-utils.org/Xtractor2D. The complete sam-ple-data matrix was finally evaluated using Microsoft Excel.
Structural assignment of the detected glycoforms was performedon the basis of literature knowledge of IgG N-glycosylation (27–32).Relative intensities of 20 IgG1, 20 IgG2/3, and 10 IgG4 glycopeptidespecies were obtained by integrating and summing the first threeisotopic peaks of both doubly and triply charged glycopeptides spe-cies followed by background correction and normalization to the totalIgG subclass specific glycopeptide intensities. The list of the assignedIgG1, IgG2 and 3, and IgG4 glycopeptides as well as the chargestates corresponding m/z values is given in supplemental Table S1 aswell as in (39). Nonfucosylated IgG4 species were not included in thislist, because of spectral overlap with isomeric IgG1 species (listed insupplemental Table S1). These IgG4 species are not expected toinfluence the IgG1 glycopeptide abundance levels, because theyelute after the IgG1 glycopeptides. There is also spectral overlapbetween several IgG2 and 3 and IgG4 glycopeptides, but becauseIgG4 elutes before IgG2 and 3 and is present at a much lowerabundace, this is not expected to be a problem for the analysis ofeither of the glycopeptides.
Multiplex Capillary Gel Electrophoresis with Laser-induced Fluores-cence (xCGE-LIF) of IgG N-glycans - Sample Preparation and Analysis
Glycan Release and Labeling—Approximately 10 �g of the proteinG monolithic plate IgG eluates were redissolved in 3 �l 1� PBS(Sigma-Aldrich) and dispensed in a 96-well microtiter plate (GreinerBio-One, Solingen, Germany). IgG samples were denatured with theaddition of 4 �l of 0.5% (w/v) SDS (AppliChem, Darmstadt, Germany)
in 1� PBS and by incubation at 60 °C for 10 min. Subsequently, theremaining SDS was neutralized by adding 2 �l 4% (v/v) IGEPAL(Sigma-Aldrich) in 1� PBS. IgG N-glycans were released by adding0.1 U PNGase F (BioReagent � 95%, Sigma-Aldrich) in 1 �l 1� PBS.The 96-well microtiter plate was sealed with adhesive tape and thefinal sample volume of 10 �l was incubated for 3 h at 37 °C. AfterN-glycan release samples were dried in a vacuum centrifuge andstored until labeling at �80 °C.
Dried samples were redissolved by adding 2 �l of 1� PBS, 2 �l of20 mM aminopyrene-1,3,6-trisulfonic acid (APTS; Darmstadt, Sigma-Aldrich) in 3.6 M citric acid monohydrate (CAaq; Merck-Millipore, Ger-many) and 2 �l of 0.2 M 2-picoline-borane (2-PB; Sigma-Aldrich)solution in DMSO (Sigma-Aldrich). Ultrapure water was used through-out. The 96-well microtiter plate was sealed using adhesive tapefollowed by shaking for 2 min at 900 rpm. Labeling was performed at37 °C for 16 h. To stop the reaction, 100 �l 80% ACN (LC-MSGrade � 99.5%, Sigma-Aldrich) was added and the plate was shakenfor 2 min at 500 rpm. Post derivatization sample clean-up was per-formed by HILIC-SPE. To remove free APTS, reducing agent andother impurities, 200 �l of 100 mg/ml BioGel P10 (Bio-Rad, Munich,Germany) suspension in water/EtOH/ACN (70:20:10%, v/v) was ap-plied to AcroPrep 96-well GHP Filter Plates (Pall Corporation,Dreieich, Germany). Solvent was removed by application of vacuumusing a vacuum manifold (Merck-Millipore, Germany). All wells wereprewashed with 5 � 200 �l water, followed by equilibration with 3 �200 �l 80% ACN. The samples were applied to the wells of the GHPFilter Plate and shaken for 5 min at 500 rpm to enhance glycanbinding. The plate was subsequently washed 5� with 200 �l 80%ACN containing 100 mM triethylamine (TEA; Sigma-Aldrich) adjustedto pH 8.5 with acetic acid (Sigma-Aldrich), followed by washing 3 �200 �l 80% ACN. After addition of solvent, each washing step wasfollowed by incubation for 2 min and removal of solvent by vacuum.For elution 1 � 100 �l (swelling of BioGel) and 2 � 200 �l of waterwere applied to each well followed by 5 min incubation at 500 rpm.The eluates were removed by vacuum and collected in a 96-wellstorage plate (Thermo Scientific, Germany). The combined eluateswere either analyzed immediately by xCGE-LIF or stored at �20 °Cuntil usage.
xCGE-LIF—For xCGE-LIF measurement, 1 �l of N-glycan eluatewas mixed with 1 �l GeneScan 500 LIZ Size Standard (Invitrogen,Darmstadt, Germany; 1:50 dilution in Hi-Di Formamide) and 9 �l Hi-DiFormamide (Invitrogen). The mixture was transferred to a MicroAmpOptical 384-well Reaction Plate (Invitrogen), sealed with a 384-wellplate septa (Invitrogen) and centrifuged at 1000 rpm for 1 min to avoidair bubbles at the bottom of the wells. The xCGE-LIF measurementwas performed in a 3130xl Genetic Analyzer, equipped with a 50 cm16-capillary array filled with POP-7 polymer (all from Invitrogen). Afterelectrokinetic sample injection, samples were analyzed with a runningvoltage of 15 kV. Data were collected for 45 min. Raw data files wereconverted to .xml file format using DataFileConverter (Invitrogen) andsubsequently analyzed using the MATLAB (The Mathworks, Inc.,Natick, MA, USA) based glycan analysis tools glyXtool and glyXalign.GlyXtool was used for structural identification by patented migrationtime normalization to an internal standard and N-glycan databasedriven peak annotation (40). The data comparison was performed byglyXalign (41).
Genotype and Phenotype Quality Control—Individuals with a callrate less than 97% were removed, as well as SNPs with a call rate lessthan 98% (95% for CROATIA-Vis), minor allele frequency less than0.02 or Hardy-Weinberg equilibrium p value less than 1 � 10�10. Atotal of 924 individuals from the CROATIA-Vis and 898 individualsfrom the CROATIA-Korcula cohort passed all genotype quality controlthresholds.
Glycosylation Analysis for Genetics and Epidemiology
Molecular & Cellular Proteomics 13.6 1601
IgG was purified from the plasma of 1821 individuals, out of which1201 had their IgG glycans successfully measured by all four meth-ods. Individuals who had not been successfully measured for allglycan traits using all four methods were removed in order to bias thecomparison as little as possible. This left a total of 445 individualsfrom CROATIA-Vis and 655 individuals from CROATIA-Korcula forwhich genotype data was also available, providing a final meta-analysis sample size of 1100.
Genome Wide Association Analysis—Each trait was adjusted forsex, age, and the first three principal components obtained from thepopulation-specific identity-by-state (IBS) derived distances matrix.The residuals were transformed to ensure their normal distributionusing quantile normalization. The “mmscore” function of GenABEL-package (42) (component of the GenABEL suite, http://www.genabel.org) was used for the association test under an additive model. Thisscore test for family based association takes into account relationshipstructure and allowed unbiased estimations of SNP allelic effect whenrelatedness is present between examinees. The relationship matrixused in this analysis was generated by the “IBS” function of GenABEL(using weight � “freq” option), which uses genomic data to estimatethe realized pair-wise kinship coefficient. All lambda values for thepopulation-specific analyses were below 1.05 showing that thismethod efficiently accounts for family structure. Meta-analysis wasperformed using the inverse variance method implemented with theMetABEL package for R (42). The threshold for a SNP reachinggenome wide significance was set at p � 5 � 10�8.
Correlations with Age—All glycan traits from the minimal data setwere adjusted for sex and relatedness using the “polygenic” functionof the GenABEL package for R (42). The resulting pgresiduals, that is,corrected glycan traits were used to calculate Spearman’s rank cor-relation coefficients with age using the “cor.test” function imple-mented in stats package for R (43). Correlation coefficients werecomputed using the same 1100 individuals used for GWAS as thegenetic data was required to account for relatedness within the pop-ulation. To account for multiple testing, the significance level wasBonferroni adjusted (94 tests) and set at p � 5.3 � 10�4.
Correlations with Other Methods—All glycan traits from the minimaldata set were adjusted for sex, age, and relatedness using the “poly-genic” function of the GenABEL package for R (42). The resultingpgresiduals, that is, corrected glycan traits were used to calculatePearson’s product-moment correlation coefficients and correspond-ing p values using the “cor.test” function in the stats package for R(43). Correlation coefficients were computed using the same 1100individuals used for GWAS as the genetic data was required toaccount for relatedness within the population. The correlations werethen compared for all the glycan traits from the minimal data setmeasured by the four different methods.
RESULTS
IgG N-glycosylation profiling was performed for 1201 indi-viduals using four different analytical approaches: UPLC-FLR,xCGE-LIF, MALDI-TOF-MS, and LC-ESI-MS. An importantdifference between UPLC-FLR and xCGE-LIF, on one side,and MS-based methods, on the other side, is that UPLC-FLRand xCGE-LIF analyze IgG glycosylation at the level of re-leased glycans (and therefore include glycans on both Faband Fc parts of IgG), whereas MS-based methods included inthis study analyze glycopeptides. Although in-depth analysisof released glycans may provide a detailed picture of theglycan structure, no information on the original glycan attach-ment site is provided. Such site-specific information can beobtained by the direct analysis of glycopeptides. Because
different IgG subclasses have different amino acid sequencesaround the glycosylation site, by analyzing glycans at theglycopeptide level MS-based methods measure subclass-specific Fc glycosylation. However, unlike the used MS-basedmethods, UPLC-FLR and xCGE-LIF provide branch-specificinformation, that is, separation between the 3-arm and 6-armisomers of glycan species (e.g. FA2[3]G1 and FA2[6]G1) be-cause of a slightly higher retention of the 3-arm isomer. An-other important difference between the used methods is theway they generate quantitative information. UPLC-FLR andxCGE-LIF have the advantage that only the fluorescent dye,attached to the reducing end of a glycan, is being detected.Because the structural diversity in glycans is confined to theirnonreducing ends, it is safe to assume that each glycanstructure will fluoresce with the same quantum yield. With theMS-based methods this is more complex, because the spe-cific response factor of each glycopeptide is affected by bothits own structure and by co-eluting peptides (44), thus therelative intensities of different glycans/glycopeptides cannotbe directly compared.
Representative analyses of IgG glycosylation using UPLC-FLR, xCGE-LIF, MALDI-TOF-MS, and LC-ESI-MS are shownin Fig. 1. Details of the analytical procedures are presented inthe Experimental Procedures section. In addition to the di-rectly measured glycan structures, a number of derived traitsthat represent common biologically meaningful features (e.g.galactosylation, fucosylation, etc.) shared among severalmeasured glycans were calculated as described previously (8,33). A full list of traits and a description of how they werecalculated is available in supplemental Table S1. Descriptivestatistics of IgG glycosylation measured by four methods isprovided in supplemental Table S2.
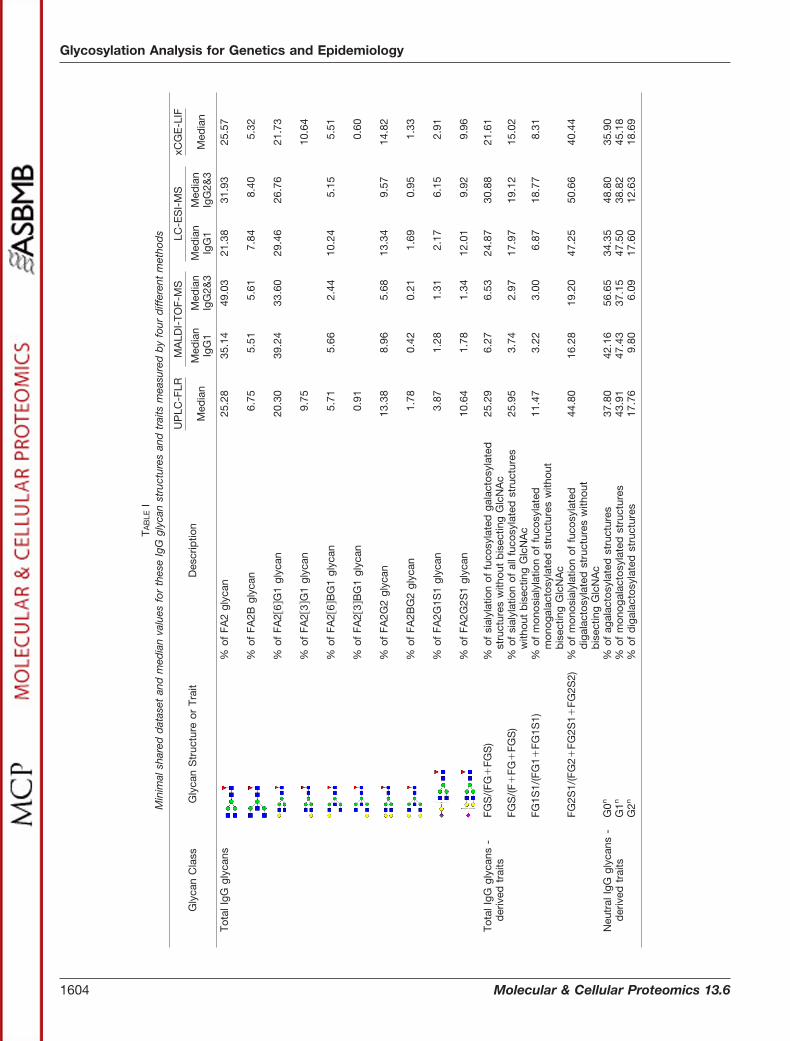
Because of the different level at which glycosylation wasanalyzed (released glycans versus glycopeptides), the infor-mation provided by the four used methods is similar, but notidentical. To enable meta-analysis of data measured by dif-ferent methods, we defined a shared set of glycan featurescommon to all four methods (Table I).
The glycome composition determined by MALDI-TOF-MSdeviated pronouncedly from the results of other three meth-ods, which produced more similar results. However, evenmethods based on fluorescent dye quantification (UPLC-FLRand xCGE-LIF) gave slightly different values for some glycantraits describing sialylation, for example FGS/(F�FG�FGS)and FG1S1/(FG1�FG1S1) (Table I). This indicates that in ad-dition to different response factors in MS-based methods(which distort quantification), sample preparation andclean-up procedures (which can lead to selective loss orenrichment of some glycans) can also significantly distort finalresults.
At the moment there is no “gold standard” method toanalyze protein glycosylation with absolute precision, thus it isnot possible to decide which of the methods we used mostaccurately reflects the real biological situation. Aiming to eval-
Glycosylation Analysis for Genetics and Epidemiology
1602 Molecular & Cellular Proteomics 13.6

uate the precision of the four methods, we analyzed associ-ations with individual genetic polymorphisms and correlationswith age under the assumption that the most precise methodwill show the strongest associations with the biology under-lying IgG glycosylation. Because glycome composition wasshown to be under strong genetic influence (5, 8), we believethat a genome wide association approach is a good tool tocomparatively assess the power of detecting associationsbetween genetic polymorphisms and IgG N-glycans meas-ured by each of the four methods. In order to have an unbi-ased approach GWAS was performed on the minimal shareddata set using only data from individuals whose glycosylationtraits were successfully measured by all four methods (n �
1201 glycomes, 1100 of them with complete genetic data).Genome wide significant association with SNPs in twogenomic loci were obtained using all four methods. Six glycantraits showed significant genome wide association in at leastone of the data sets generated by the various analytical meth-ods; LC-ESI-MS analysis uncovered all six of these glycantraits, UPLC-FLR and xCGE-LIF determined five, and four ofthe traits were found with MALDI-TOF-MS. Glycan structuresmeasured by MALDI-TOF-MS seemed to fare the worst in theGWAS comparison which also corresponded with lower cor-relation coefficients between MALDI-TOF-MS and other usedmethods for the glycan traits from the minimal data set (sup-plemental Table S4). All the observed associations replicated
FIG. 1. Representative data from IgG glycosylation analysis of the same individual by (A) UPLC-FLR (continuous lines - total IgG N-glycans),(B) MALDI-TOF-MS (dotted lines - tryptic IgG1 Fc N-glycopeptide [M-H]� ions, striated lines - IgG2&3 Fc N-glycopeptide [M-H]� ions), (C)xCGE-LIF (continuous lines - total IgG N-glycans), and (D) LC-ESI-MS (dotted lines - tryptic IgG1 Fc N-glycopeptide [M�2H]2� and [M�3H]3�
ions). Structural schemes are given in terms of pep (peptide moiety), blue square (N-acetylglucosamine), red triangle (fucose), green circle(mannose), yellow circle (galactose), and purple diamond (N-acetylneuraminic acid). Linkage information is given to indicate separation oflinkage isomers by UPLC-FLR and xCGE-LIF. Glycan structures are assigned to most of the signals. The complete list of the assigned IgGN-glycans (UPLC-FLR and xCGE-LIF) and IgG N-glycopeptides (MALDI-TOF-MS and LC-ESI-MS) with the charge states corresponding m/zvalues is given in supplementary Table S1.
Glycosylation Analysis for Genetics and Epidemiology
Molecular & Cellular Proteomics 13.6 1603
TAB
LEI
Min
imal
shar
edd
atas
etan
dm
edia
nva
lues
for
thes
eIg
Ggl
ycan
stru
ctur
esan
dtr
aits
mea
sure
db
yfo
urd
iffer
ent
met
hod
s
Gly
can
Cla
ssG
lyca
nS
truc
ture
orTr
ait
Des
crip
tion
UP
LC-F
LRM
ALD
I-TO
F-M
SLC
-ES
I-M
SxC
GE
-LIF
Med
ian
Med
ian
IgG
1M
edia
nIg
G2&
3M
edia
nIg
G1
Med
ian
IgG
2&3
Med
ian
Tota
lIgG
glyc
ans
%of
FA2
glyc
an25
.28
35.1
449
.03
21.3
831
.93
25.5
7
%of
FA2B
glyc
an6.
755.
515.
617.
848.
405.
32
%of
FA2
6G
1gl
ycan
20.3
039
.24
33.6
029
.46
26.7
621
.73
%of
FA2
3G
1gl
ycan
9.75
10.6
4
%of
FA2
6B
G1
glyc
an5.
715.
662.
4410
.24
5.15
5.51
%of
FA2
3B
G1
glyc
an0.
910.
60
%of
FA2G
2gl
ycan
13.3
88.
965.
6813
.34
9.57
14.8
2
%of
FA2B
G2
glyc
an1.
780.
420.
211.
690.
951.
33
%of
FA2G
1S1
glyc
an3.
871.
281.
312.
176.
152.
91
%of
FA2G
2S1
glyc
an10
.64
1.78
1.34
12.0
19.
929.
96
Tota
lIgG
glyc
ans
-d
eriv
edtr
aits
FGS
/(FG
�FG
S)
%of
sial
ylat
ion
offu
cosy
late
dga
lact
osyl
ated
stru
ctur
esw
ithou
tb
isec
ting
Glc
NA
c25
.29
6.27
6.53
24.8
730
.88
21.6
1
FGS
/(F�
FG�
FGS
)%
ofsi
alyl
atio
nof
allf
ucos
ylat
edst
ruct
ures
with
out
bis
ectin
gG
lcN
Ac
25.9
53.
742.
9717
.97
19.1
215
.02
FG1S
1/(F
G1�
FG1S
1)%
ofm
onos
ialy
latio
nof
fuco
syla
ted
mon
ogal
acto
syla
ted
stru
ctur
esw
ithou
tb
isec
ting
Glc
NA
c
11.4
73.
223.
006.
8718
.77
8.31
FG2S
1/(F
G2�
FG2S
1�FG
2S2)
%of
mon
osia
lyla
tion
offu
cosy
late
dd
igal
acto
syla
ted
stru
ctur
esw
ithou
tb
isec
ting
Glc
NA
c
44.8
016
.28
19.2
047
.25
50.6
640
.44
Neu
tral
IgG
glyc
ans
-d
eriv
edtr
aits
G0n
%of
agal
acto
syla
ted
stru
ctur
es37
.80
42.1
656
.65
34.3
548
.80
35.9
0G
1n%
ofm
onog
alac
tosy
late
dst
ruct
ures
43.9
147
.43
37.1
547
.50
38.8
245
.18
G2n
%of
dig
alac
tosy
late
dst
ruct
ures
17.7
69.
806.
0917
.60
12.6
318
.69
Glycosylation Analysis for Genetics and Epidemiology
1604 Molecular & Cellular Proteomics 13.6

those from a recently published IgG glycome GWA study (24).However, because of the lower sample size in this study, notall associations from the previous paper could be replicated.SNPs with the most significant p values at each of the loci arelisted in Table II. The full list of all associations with all glycansmeasured by all the methods is available in supplementalTable S3.
Glycosylation of IgG strongly correlates with age (8), andthus the strength of correlation of IgG glycans with age couldalso be used to compare the precision of different analyticalmethods. The results presented in Table III show that for themajority of glycans in the minimal shared data set all fourmethods show comparable strengths of correlation, withUPLC-FLR showing somewhat stronger correlation coeffi-cients and lower p values. Table III presents only results fromCROATIA-Vis, however, these replicated in CROATIA-Korculaand full results are present in supplemental Table S5.
An important observation is that both MS-based methodsand chromatography/electrophoresis revealed some associ-ations that were undetectable by other methods. For exam-ple, the association between monogalactosylated glycansand age was restricted to IgG glycans with galactose on the6-arm (FA2[6]G1; GP8 measured by UPLC-FLR and P19measured by xCGE-LIF in supplemental Table S2). Thisbranch-specificity could not be observed with the MS-basedmethods because they generally do not provide linkage infor-mation. On the other hand, glycopeptide-based glycosylationprofiling methods readily reveal subclass-specific glycosyla-tion profiles of IgG1, IgG2, IgG3, and IgG4, which was alsoreflected in much stronger association between galactosyla-tion and age for IgG2 and 3, than for IgG1.
DISCUSSION
In this study we have compared four different methods(UPLC-FLR, xCGE-LIF, MALDI-TOF-MS, and LC-ESI-MS) forthe quantitative analysis of IgG N-glycosylation by analyzingthe same 1201 IgG samples using all four methods. Thesefour analytical methods, together with direct infusion MSn andLC-MS/MS, have been commonly used for glycosylation anal-ysis in the past years, but there is currently no “gold standard”
analytical method for the evaluation of other methods. There-fore, we have decided to use an innovative approach todetermine the relative accuracy of the four most widely usedmethods by comparing association analysis of IgG glycanswith genetic polymorphisms and correlations of glycans withage of studied individuals.
GWAS are routinely being used to identify genetic lociassociated with specific traits. We have also successfullyapplied this approach in previous studies to identify geneticloci that are associated with the regulation of protein glyco-sylation (21, 22, 24, 45). For this study we decided to useGWAS in a different way. We analyzed IgG N-glycosylationwith four different methods in the same individuals for whomgenetic data was also available. Genetic association analysiswas performed separately on glycan data generated by thefour methods under the assumption that any imprecision inmeasurement will decrease power to detect the biologicalassociation between genetic polymorphisms and measuredglycans. Therefore the analytical method that is the mostprecise is expected to show the strongest association withgenetic loci relevant for IgG glycosylation.
The results presented in Table II (and supplemental TableS3) clearly show that all four methods generate glycan data ofsufficiently high quality to be used to detect associations withgenetic polymorphisms. The chromatography-based meth-ods, UPLC-FLR and LC-ESI-MS, appear to be somewhatmore precise because the measured glycome generallyshows stronger associations with genetic polymorphisms, butMALDI-TOF-MS and xCGE-LIF offer the advantage of higherthroughput (which could compensate in some circumstancesfor somewhat lower precision). In addition to GWAS of theminimal shared data set, we also performed the analysis of allglycans measured by all four methods (supplemental TableS3). The number of successfully analyzed samples and glycantraits was different for each method, thus direct comparisonof methods is not possible, but the results presented insupplemental Table S3 generally support the conclusion thatchromatography-based methods (UPLC-FLR and LC-ECI-MS) yield somewhat better associations with genetic poly-morphisms. The same conclusion can also be derived from
TABLE IIp values for significant associations between genetic polymorphisms and glycan structures or traits obtained by different methods.
Bold text indicates that the p value reaches genome wide significance (p � 5 � 10�8)
GlycanStructureOr Trait
Genes inAssociated
RegionSNP
Association p-Value
UPLC-FLR MALDI-TOF-MS(IgG1)
MALDI-TOF-MS(IgG2&3)
LC-ESI-MS(IgG1)
LC-ESI-MS(IgG2&3) xCGE-LIF
FA2BG1a SMARCB1;DERL3
rs9620326 1.47E-10 1.15E-07 1.70E-06 1.63E-08 4.11E-10 1.11E-101.54E-04 7.46E-06
FA2G1S1 ST6GAL1 rs6764279 2.80E-22 0.2556 4.36E-10 1.13E-28 1.15E-27 1.60E-18FGS/(FG�FGS) ST6GAL1 rs6764279 1.14E-20 0.0154 1.86E-12 4.87E-12 1.64E-25 4.83E-18FGS/(F�FG�FGS) ST6GAL1 rs6764279 3.25E-04 0.1008 1.97E-04 1.21E-05 1.44E-09 3.82E-07FG1S1/(FG1�FG1S1) ST6GAL1 rs6764279 1.50E-22 0.3941 9.60E-21 2.51E-33 1.31E-40 5.61E-22FG2S1/(FG2�FG2S1�FG2S2) ST6GAL1 rs6764279 1.54E-36 1.26E-11 3.49E-23 4.67E-26 1.37E-32 1.71E-37
aThis glycan structure is measured as two isomers with UPLC-FLR and xCGE-LIF (FA26BG1, with galactose on the 6-arm and FA23BG1,with galactose on the 3-arm), but as only one mass in the MS methods.
Glycosylation Analysis for Genetics and Epidemiology
Molecular & Cellular Proteomics 13.6 1605

the analysis of correlation between IgG glycans and age (Ta-ble III). In this study we did not detect all genetic associationswhich were previously reported (24), but this is not unex-pected because the number of studied individuals in thisstudy is much lower. Actually, for a study on only 1100 indi-vidual, the number of genetic associations is very large indi-cating that glycans are under strong genetic regulation.
It is frequently argued that methods based on mass spec-trometry are not quantitative, but this study clearly demon-strated that the relative quantification by both MALDI-TOF-MS and LC-ESI-MS is very reliable, and that very goodassociations with genetic polymorphisms and age can beobtained with glycans measured by both methods. Numericvalues generated by mass spectrometers for different glycansor glycopeptides are not directly comparable because eachmolecular specie has its own response factors in mass spec-trometry (44), but this difference is not of much relevance forcomparisons of the same glycan (or glycopeptide) betweendifferent individuals within a studied population. This is evi-dent from good associations with genetic polymorphisms andcorrelations with age observed in this study. However, if de-rived traits (like fucosylation, galactosylation, sialylation, etc.)are calculated from MS data, their numerical values may notcorrespond to real biological situation because they would bedistorted by different response factors for individual glycans/glycopeptides, and this is something that needs to be con-sidered when interpreting MS-based data. Furthermore, thereare several potential complications, such as variations in al-lotype, incomplete digestion, chemical modifications (deami-dation, oxidation), and alkylation side reactions occurring dur-ing cysteine alkylation, which might introduce a bias inglycoprofiling if they occur more frequently in association withcertain types of glycopeptides.
In addition to providing important analytical characteristicsof different methods for glycomics, this study also clarifiedone unresolved issue about IgG glycosylation. Previous stud-ies reported irreconcilable differences in the amount of IgGsialylation measured by HPLC/UPLC or by MS. Although MSstudies estimated IgG sialylation to be below 5% (33), HPLC/UPLC studies reported much higher levels, even includingvalues of over 20% of IgGs sialylated (46–49). This differencewas most often attributed to inclusion of Fab glycans in UPLCand CE analysis, but in the current study we also observedsignificant IgG Fc sialylation when quantified by LC-ESI-MS(Table I). Therefore the lower values of IgG Fc sialylationreported using MALDI-TOF-MS analysis appear to be causedby an experimental artifact most probably caused by loss ofsialic acid during MALDI-TOF-MS analysis. This finding is veryimportant in the context of further development of therapeuticintravenous immunoglobulins, because some studies indicatethat IgG with sialylated Fc glycans is an anti-inflammatoryagent (50).
Very weak associations between sialylated glycans meas-ured by MALDI-TOF-MS and genetic loci and age further
TAB
LEIII
Cor
rela
tion
ofag
ean
dgl
ycan
stru
ctur
esor
trai
tsm
easu
red
by
diff
eren
tm
etho
ds
inV
isco
hort
.P
rese
nted
pva
lues
are
corr
ecte
dfo
rm
ultip
lete
stin
gus
ing
Bon
ferr
oni
corr
ectio
n.S
igni
fican
cele
veli
sse
tat
p�
5.3
�10
�4
(94
test
s)
Gly
can
Cla
ssG
lyca
nS
truc
ture
orTr
ait
UP
LC-F
LR(T
otal
IgG
)M
ALD
I-TO
F-M
SLC
-ES
I-M
SxC
GE
-LIF
(Tot
alIg
G)
IgG
1Ig
G2&
3Ig
G1
IgG
2&3
Rp
Rp
Rp
Rp
Rp
Rp
To
talI
gG
gly
cans
FA2
0.59
81.
28E
-46
0.56
01.
95E
-39
0.62
62.
01E
-52
0.55
41.
74E
-38
0.62
12.
57E
-51
0.57
53.
25E
-42
FA2B
0.56
26.
91E
-40
0.47
22.
70E
-26
0.45
11.
26E
-23
0.55
75.
65E
-39
0.53
61.
49E
-35
0.55
51.
15E
-38
FA2G
1a�
0.34
74.
57E
-13
�0.
499
5.44
E-3
0�
0.58
54.
47E
-44
�0.
117
1.00
E�
00�
0.40
51.
56E
-18
�0.
255
1.83
E-0
6�
0.10
71.
00E
�00
�0.
035
1.00
E�
00FA
2BG
1a0.
026
1.00
E�
00�
0.08
51.
00E
�00
�0.
396
1.49
E-1
70.
053
1.00
E�
00�
0.22
68.
25E
-05
0.04
71.
00E
�00
0.29
64.
63E
-09
0.33
01.
32E
-11
FA2G
2�
0.64
65.
71E
-57
�0.
609
1.06
E-4
8�
0.63
84.
02E
-55
�0.
617
2.15
E-5
0�
0.63
42.
92E
-54
�0.
626
1.77
E-5
2FA
2BG
2�
0.39
32.
89E
-17
�0.
333
6.46
E-1
2�
0.50
74.
34E
-31
�0.
422
2.34
E-2
0�
0.52
05.
09E
-33
�0.
361
3.22
E-1
4FA
2G1S
10.
062
1.00
E�
00�
0.02
61.
00E
�00
�0.
494
2.92
E-2
90.
176
1.61
E-0
2�
0.33
11.
01E
-11
0.00
31.
00E
�00
FA2G
2S1
�0.
588
1.35
E-4
4�
0.51
96.
58E
-33
�0.
589
6.72
E-4
5�
0.58
55.
75E
-44
�0.
619
7.82
E-5
1�
0.58
48.
00E
-44
To
talI
gG
gly
cans
-der
ived
trai
tsFG
S/(
FG�
FGS
)�
0.25
91.
08E
-06
�0.
081
1.00
E�
00�
0.44
65.
31E
-23
�0.
436
7.63
E-2
2�
0.37
22.
79E
-15
�0.
457
2.17
E-2
4FG
S/(
F�FG
�FG
S)
�0.
593
1.30
E-4
5�
0.33
64.
04E
-12
�0.
577
1.55
E-4
2�
0.54
31.
25E
-36
�0.
586
2.99
E-4
4�
0.55
76.
38E
-39
FG1S
1/(F
G1�
FG1S
1)0.
194
2.84
E-0
30.
113
1.00
E�
00�
0.07
21.
00E
�00
0.25
22.
85E
-06
�0.
074
1.00
E�
000.
015
1.00
E�
00FG
2S1/
(FG
2�FG
2S1�
FG2S
2)0.
203
1.06
E-0
30.
070
1.00
E�
00�
0.18
66.
41E
-03
�0.
063
1.00
E�
00�
0.12
01.
00E
�00
0.08
71.
00E
�00
Neu
tral
IgG
gly
cans
-der
ived
trai
tsG
0n0.
626
1.68
E-5
20.
585
4.42
E-4
40.
639
3.36
E-5
50.
586
2.70
E-4
40.
638
4.71
E-5
50.
598
1.38
E-4
6G
1n�
0.47
32.
05E
-26
�0.
495
2.13
E-2
9�
0.60
55.
94E
-48
�0.
373
2.33
E-1
5�
0.58
04.
40E
-43
�0.
406
1.31
E-1
8G
2n�
0.63
85.
51E
-55
�0.
605
6.26
E-4
8�
0.63
78.
22E
-55
�0.
618
1.15
E-5
0�
0.64
82.
48E
-57
�0.
622
1.24
E-5
1
aTh
ese
glyc
anst
ruct
ures
are
mea
sure
das
two
isom
ers
with
UP
LC-F
LRan
dxC
GE
-LIF
(with
gala
ctos
eon
6-an
d3-
arm
),b
utas
sing
lem
asse
sin
the
MS
met
hod
s.
Glycosylation Analysis for Genetics and Epidemiology
1606 Molecular & Cellular Proteomics 13.6
TAB
LEIV
Com
par
ison
offo
urm
etho
ds
for
high
-thr
ough
put
glyc
omic
and
glyc
opro
teom
ican
alys
is
UP
LC-F
LRxC
GE
-LIF
MA
LDI-
TOF-
MS
LC-E
SI-
MS
Acc
epta
nce/
usag
efo
rgl
ycom
ics
Wid
ely
used
Rar
ely
used
Wid
ely
used
Mod
erat
ely
used
Thro
ughp
utM
ediu
m,
app
roxi
mat
ely
50sa
mp
les
per
inst
rum
ent
per
day
(Ver
y)hi
gh,
mul
tiple
with
upto
96ca
pill
arie
sen
able
san
alys
isof
thou
sand
sof
sam
ple
s
(Ver
y)hi
gh,
asm
easu
rem
ent
ofa
sam
ple
can
be
per
form
edat
asu
b-
min
ute
time
scal
e
Med
ium
,ap
pro
xim
atel
y10
0sa
mp
les
per
day
per
inst
rum
ent
Req
uire
dex
per
tise
Med
ium
Med
ium
Hig
hV
ery
high
Res
olut
ion
Hig
hH
igh
Ver
yhi
ghV
ery
high
Isom
erse
par
atio
nG
ood
Ver
ygo
odN
one
Som
eQ
uant
ifica
tion
Ver
ygo
odG
ood
Med
ium
Goo
dC
osts
ofeq
uip
men
tC
a.E
uro
40–7
0,00
0C
a.E
uro
100,
000
for
a4-
cap
illar
yin
stru
men
tC
a.E
uro
100–
500,
000
Eur
o20
0–50
0,00
0
Cos
tsp
ersa
mp
lein
high
thro
ughp
utm
ode
Rat
her
high
cost
s,m
ainl
yd
ueto
low
thro
ughp
utan
dco
sts
ofco
nsum
able
s
Low
cost
sp
ersa
mp
le,
due
tolo
wru
nnin
gco
sts
and
par
alle
lizat
ion
by
mul
tiple
Low
cost
sp
ersa
mp
led
ueto
high
thro
ughp
utp
erin
stru
men
t
Ver
yhi
ghco
sts,
mai
nly
due
toex
pen
sive
equi
pm
ent
and
low
thro
ughp
utp
erin
stru
men
tM
ain
adva
ntag
esfo
rge
netic
and
epid
emio
logi
cals
tud
ies
Rel
iab
leq
uant
ifica
tion,
rob
ustn
ess
Less
dem
and
ing
insa
mp
lep
rep
arat
ion,
low
cost
s,hi
ghro
bus
tnes
san
dhi
ghth
roug
hput
,no
sam
ple
carr
yov
er;
relia
ble
rela
tive
qua
ntifi
catio
n,ve
ryse
nsiti
ve(lo
wLO
D)
Low
cost
and
high
thro
ughp
ut,
site
spec
ific
glyc
osyl
atio
nan
alys
is,
sens
itive
,en
able
sst
ruct
ural
eluc
idat
ion
via
frag
men
tatio
nex
per
imen
ts
Rel
iab
leq
uant
ifica
tion,
site
spec
ific
glyc
osyl
atio
nan
alys
is,
sens
itive
,en
able
sst
ruct
ural
eluc
idat
ion
via
frag
men
tatio
nex
per
imen
ts
Mai
nd
isad
vant
ages
for
gene
tican
dep
idem
iolo
gica
lstu
die
sIn
abili
tyto
per
form
site
spec
ific
glyc
osyl
atio
nan
alys
is,
rela
tivel
ylo
wth
roug
hput
and
high
cost
Inab
ility
top
erfo
rmsi
tesp
ecifi
cgl
ycos
ylat
ion
anal
ysis
,co
mp
arat
ivel
ysm
alld
atab
ase
(tob
een
larg
ed)
Less
relia
ble
qua
ntifi
catio
n,lo
ssof
sial
icac
ids
Rel
ativ
ely
high
cost
s
Sp
ecifi
cad
vant
ages
for
IgG
glyc
osyl
atio
nan
alys
isD
iffer
entia
tion
ofga
lact
osyl
atio
non
3-an
d6-
arm
s,ac
cura
teq
uant
ifica
tion
ofIg
Gsi
alyl
atio
n
Diff
eren
tiatio
nof
gala
ctos
ylat
ion
on3-
and
6-ar
ms,
accu
rate
qua
ntifi
catio
nof
IgG
sial
ylat
ion
Diff
eren
tiatio
nof
glyc
ans
ond
iffer
ent
IgG
sub
clas
ses,
anal
ysis
ofon
lyFc
glyc
ans
Diff
eren
tiatio
nof
glyc
ans
ond
iffer
ent
IgG
sub
clas
ses,
anal
ysis
ofon
lyFc
glyc
ans,
accu
rate
qua
ntifi
catio
nof
IgG
sial
ylat
ion
Glycosylation Analysis for Genetics and Epidemiology
Molecular & Cellular Proteomics 13.6 1607
support the hypothesis that MALDI is underperforming inquantitative analysis of sialylated glycans, and stabilization ofsialic acids may be needed for a more robust quantitation ofsialic acids by MALDI methods. Interestingly, xCGE-LIF alsoshowed lower relative quantitative values for some of thesialylated glycans that resulted in weaker associations withboth genetic polymorphisms and age. Each of the methodsreveals some additional complementary information about theglycome, indicating that in some situations the combinedanalysis by different methods can yield additional useful in-formation, which helps interpretation of complex biologicalsystems.
CONCLUSIONS
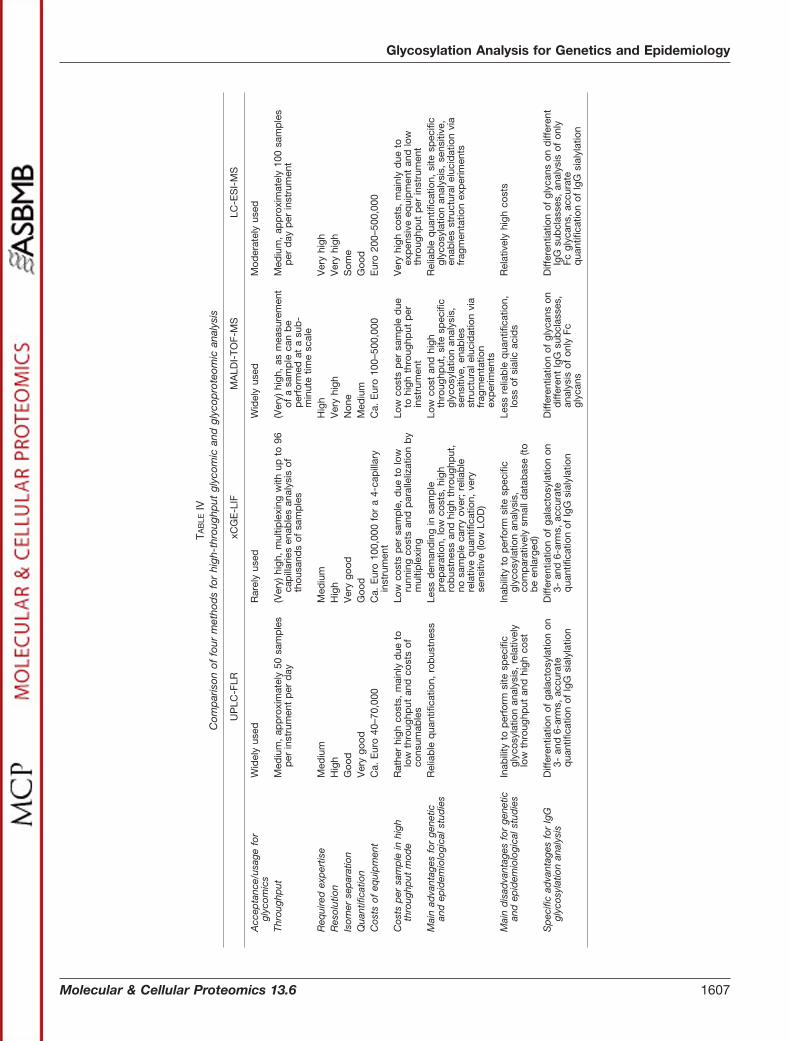
It is increasingly recognized that variation in glycan struc-tures is likely to play an essential and ubiquitous role in humanphysiology and pathophysiology. This recognition has led toglycomics being declared a research priority for the nextdecade (3), and it is expected that an increasing number offuture large clinical and population studies will include glycananalysis (1). However, methods for high-throughput glycananalysis have been developed only recently, and thoroughevaluation and standardization of the analytical methods isneeded before a significant amount of time and other re-sources should be invested in large-scale studies. In thisstudy we have used association with genetic polymorphismsand age as the evaluation criterion to compare four methods(UPLC-FLR, xCGE-LIF, MALDI-TOF-MS, and LC-ESI-MS)that are currently being used to study protein glycosylation.All four methods delivered reliable quantitative data. In thisstudy we identify a number of specific advantages and dis-advantages of each method (Table IV) in order to guide se-lection of the most appropriate and cost-effective approachfor any given research study.
Acknowledgments—We thank Carolien A. M. Koeleman for experttechnical assistance. The funders had no role in study design, datacollection and analysis, decision to publish, or preparation of themanuscript. The CROATIA-Vis and CROATIA-Korcula studies wouldlike to acknowledge the invaluable contribution of the recruitmentteams (including those from the Institute of Anthropological Researchin Zagreb) in Vis and Korcula, the administrative teams in Croatia andEdinburgh and the people of Vis and Korcula.
* The CROATIA-Vis and CROATIA-Korcula studies in the Croatianislands of Vis and Korcula were supported by grants from the MedicalResearch Council (UK), the Ministry of Science, Education and Sportof the Republic of Croatia (grant number 108–1080315-0302) and theEuropean Union framework program 6 European Special PopulationsResearch Network project (contract LSHG-CT-2006–018947). SNPgenotyping for CROATIA-Vis was performed at the Genetics CoreLaboratory at the Wellcome Trust Clinical Research Facility, WGH,Edinburgh, UK and CROATIA-Korcula at Helmholz ZentrumMunchen, GmbH, Neuherberg, Germany. Glycome analysis wassupported by the Croatian Ministry of Science, Education and Sport(grant number 309-0061194-2023), the European CommissionGlycoBioM (contract #259869), HighGlycan (contract #278535),MIMOmics (contract #305280), HTP-GlycoMet (contract #324400)
and IntegraLife (contract# 315997) grants and a Zenith grant from TheNetherlands Organization for Scientific Research (#93511033). Thework of YSA was supported by Russian Foundation for Basic Re-search grant 12-04-33182. MHJ Selman thanks Hoffmann la Rochefor financial support.
□S This article contains supplemental Tables S1 to S5.d To whom correspondence should be addressed: University of
Zagreb, Faculty of Pharmacy and Biochemistry, A. Kovacica 1, HR-10000 Zagreb, Croatia. E-mail: [email protected].
e These authors contributed equally to this work.f Shared last authorsConflict of interests: GL declares that he is a founder and owner,
and LK, FV, MPB, JK and MN declare that they are employees ofGenos Ltd, which offers commercial service of glycomic analysis andhas several patents in this field. ER and RH declare that they arefounders and owners of glyXera GmbH, which offers commercialservice of glycomic analysis. MB declares that he was employee andRH and TM declare that they are part time employees of glyXera. ERand MW have several patents in the field of glycosylation analysis.YSA declares that he is a founder and owner of “Yurii Aulchenko”consulting.
REFERENCES
1. Hart, G. W., and Copeland, R. J. (2010) Glycomics hits the big time. Cell143, 672–676
2. Zoldos, V., Novokmet, M., Beceheli, I., and Lauc, G. (2013) Genomics andepigenomics of the human glycome. Glycoconj. J. 30, 41–50
3. Walt, D., Aoki-Kinoshita, K. F., Bendiak, B., Bertozzi, C. R., Boons, G. J.,Darvill, A., Hart, G., Kiessling, L. L., Lowe, J., Moon, R., Paulson, J.,Sasisekharan, R., Varki, A., and Wong, C. H. (2012) Transforming Gly-coscience: A Roadmap for the Future, Nacional Academies Press, Wash-ington.
4. Cummings, R. D. (2009) The repertoire of glycan determinants in the humanglycome. Mol. Biosyst. 5, 1087–1104
5. Knezevic, A., Polasek, O., Gornik, O., Rudan, I., Campbell, H., Hayward, C.,Wright, A., Kolcic, I., O’Donoghue, N., Bones, J., Rudd, P. M., and Lauc,G. (2009) Variability, heritability and environmental determinants of hu-man plasma N-glycome. J. Proteome Res. 8, 694–701
6. Pucic, M., Pinto, S., Novokmet, M., Knezevic, A., Gornik, O., Polasek, O.,Vlahovicek, K., Wei, W., Rudd, P. M., Wright, A. F., Campbell, H., Rudan,I., and Lauc, G. (2010) Common aberrations from normal human N-gly-can plasma profile. Glycobiology 20, 970–975
7. Gornik, O., Pavic, T., and Lauc, G. (2012) Alternative glycosylation modu-lates function of IgG and other proteins - implications on evolution anddisease. Biochim. Biophys. Acta 1820, 1318–1326
8. Pucic, M., Knezevic, A., Vidic, J., Adamczyk, B., Novokmet, M., Polasek,O., Gornik, O., Supraha-Goreta, S., Wormald, M. R., Redzic, I., Camp-bell, H., Wright, A., Hastie, N. D., Wilson, J. F., Rudan, I., Wuhrer, M.,Rudd, P. M., Josic, D., and Lauc, G. (2011) High throughput isolation andglycosylation analysis of IgG-variability and heritability of the IgG gly-come in three isolated human populations. Mol. Cell. Proteomics 10,M111 010090
9. Mechref, Y., Hu, Y., Garcia, A., and Hussein, A. (2012) Identifying cancerbiomarkers by mass spectrometry-based glycomics. Electrophoresis 33,1755–1767
10. Adamczyk, B., Tharmalingam, T., and Rudd, P. M. (2012) Glycans as cancerbiomarkers. Biochim. Biophys. Acta 1820, 1347–1353
11. Theodoratou, E., Campbell, H., Ventham, N. T., McGovern, D. P., Satsangi,J., Lauc, G., and IBD-BIOM (2014) The role of glycosylation in inflam-matory bowel disease. Nat. Rev. Gastroentero. revised version submit-ted.
12. Theodoratou, E., Montazeri, Z., Hawken, S., Allum, G. C., Gong, J., Tait, V.,Kirac, I., Tazari, M., Farrington, S. M., Demarsh, A., Zgaga, L., Landry, D.,Benson, H. E., Read, S. H., Rudan, I., Tenesa, A., Dunlop, M. G.,Campbell, H., and Little, J. (2012) Systematic meta-analyses and fieldsynopsis of genetic association studies in colorectal cancer. J. Natl.Cancer Inst. 104, 1433–1457
13. Siontis, K. C., Patsopoulos, N. A., and Ioannidis, J. P. (2010) Replication ofpast candidate loci for common diseases and phenotypes in 100 ge-
Glycosylation Analysis for Genetics and Epidemiology
1608 Molecular & Cellular Proteomics 13.6
nome-wide association studies. Eur. J. Hum. Genet. 18, 832–83714. Visscher, P. M., Brown, M. A., McCarthy, M. I., and Yang, J. (2012) Five
years of GWAS discovery. Am. J. Hum. Genet. 90, 7–2415. Callewaert, N., Van Vlierberghe, H., Van Hecke, A., Laroy, W., Delanghe, J.,
and Contreras, R. (2004) Noninvasive diagnosis of liver cirrhosis usingDNA sequencer-based total serum protein glycomics. Nat. Med. 10,429–434
16. Miura, Y., Kato, K., Takegawa, Y., Kurogochi, M., Furukawa, J., Shinohara, Y.,Nagahori, N., Amano, M., Hinou, H., and Nishimura, S. (2010) Glycoblot-ting-assisted O-glycomics: ammonium carbamate allows for highly effi-cient o-glycan release from glycoproteins. Anal. Chem. 82, 10021–10029
17. Winnik, W. M., Dekroon, R. M., Jeong, J. S., Mocanu, M., Robinette, J. B.,Osorio, C., Dicheva, N. N., Hamlett, E., and Alzate, O. (2012) Analysis ofproteins using DIGE and MALDI mass spectrometry. Methods Mol. Biol.854, 47–66
18. Reusch, D., Haberger, M., Kailich, T., Heidenreich, A. K., Kampe, M., Bulau,P., and Wuhrer, M. (2013) High-throughput glycosylation analysis oftherapeutic immunoglobulin G by capillary gel electrophoresis using aDNA analyzer. mAbs 6, published online.
19. Royle, L., Campbell, M. P., Radcliffe, C. M., White, D. M., Harvey, D. J.,Abrahams, J. L., Kim, Y. G., Henry, G. W., Shadick, N. A., Weinblatt,M. E., Lee, D. M., Rudd, P. M., and Dwek, R. A. (2008) HPLC-basedanalysis of serum N-glycans on a 96-well plate platform with dedicateddatabase software. Anal. Biochem. 376, 1–12
20. Ruhaak, L. R., Hennig, R., Huhn, C., Borowiak, M., Dolhain, R. J., Deelder,A. M., Rapp, E., and Wuhrer, M. (2010) Optimized workflow for prepa-ration of APTS-labeled N-glycans allowing high-throughput analysis ofhuman plasma glycomes using 48-channel multiplexed CGE-LIF. J. Pro-teome Res. 9, 6655–6664
21. Huffman, J. E., Knezevic, A., Vitart, V., Kattla, J., Adamczyk, B., Novokmet,M., Igl, W., Pucic, M., Zgaga, L., Johannson, A., Redzic, I., Gornik, O.,Zemunik, T., Polasek, O., Kolcic, I., Pehlic, M., Koeleman, C. A., Camp-bell, S., Wild, S. H., Hastie, N. D., Campbell, H., Gyllensten, U., Wuhrer,M., Wilson, J. F., Hayward, C., Rudan, I., Rudd, P. M., Wright, A. F., andLauc, G. (2011) Polymorphisms in B3GAT1, SLC9A9, and MGAT5 areassociated with variation within the human plasma N-glycome of 3533European adults. Hum. Mol. Genet. 20, 5000–5011
22. Lauc, G., Essafi, A., Huffman, J. E., Hayward, C., Knezevic, A., Kattla, J. J.,Polasek, O., Gornik, O., Vitart, V., Abrahams, J. L., Pucic, M., Novokmet,M., Redzic, I., Campbell, S., Wild, S. H., Borovecki, F., Wang, W., Kolcic, I.,Zgaga, L., Gyllensten, U., Wilson, J. F., Wright, A. F., Hastie, N. D., Camp-bell, H., Rudd, P. M., and Rudan, I. (2010) Genomics meets glycomics - Thefirst GWAS study of human N-glycome identifies HNF1alpha as a masterregulator of plasma protein fucosylation. PLoS Genet. 6, e1001256
23. Kutalik, Z., Benyamin, B., Bergmann, S., Mooser, V., Waeber, G., Mont-gomery, G. W., Martin, N. G., Madden, P. A., Heath, A. C., Beckmann,J. S., Vollenweider, P., Marques-Vidal, P., and Whitfield, J. B. (2011)Genome-wide association study identifies two loci strongly affectingtransferrin glycosylation. Hum. Mol. Genet. 20, 3710–3717
24. Lauc, G., Huffman, J. E., Pucic, M., Zgaga, L., Adamczyk, B., Muzinic, A.,Novokmet, M., Polasek, O., Gornik, O., Kristic, J., Keser, T., Vitart, V.,Scheijen, B., Uh, H. W., Molokhia, M., Patrick, A. L., McKeigue, P.,Kolcic, I., Lukic, I. K., Swann, O., van Leeuwen, F. N., Ruhaak, L. R.,Houwing-Duistermaat, J. J., Slagboom, P. E., Beekman, M., de Craen,A. J., Deelder, A. M., Zeng, Q., Wang, W., Hastie, N. D., Gyllensten, U.,Wilson, J. F., Wuhrer, M., Wright, A. F., Rudd, P. M., Hayward, C.,Aulchenko, Y., Campbell, H., and Rudan, I. (2013) Loci associated withN-glycosylation of human immunoglobulin G show pleiotropy with auto-immune diseases and haematological cancers. PLoS Genet 9, e1003225
25. Rudan, I., Marusic, A., Jankovic, S., Rotim, K., Boban, M., Lauc, G.,Grkovic, I., Dogas, Z., Zemunik, T., Vatavuk, Z., Bencic, G., Rudan, D.,Mulic, R., Krzelj, V., Terzic, J., Stojanovic, D., Puntaric, D., Bilic, E.,Ropac, D., Vorko-Jovic, A., Znaor, A., Stevanovic, R., Biloglav, Z., andPolasek, O. (2009) “10001 Dalmatians:” Croatia launches its nationalbiobank. Croat. Med. J. 50, 4–6
26. Selman, M. H., Hoffmann, M., Zauner, G., McDonnell, L. A., Balog, C. I.,Rapp, E., Deelder, A. M., and Wuhrer, M. (2012) MALDI-TOF-MS analysisof sialylated glycans and glycopeptides using 4-chloro-alpha-cyanocin-namic acid matrix. Proteomics 12, 1337–1348
27. Parekh, R. B., Dwek, R. A., Sutton, B. J., Fernandes, D. L., Leung, A.,Stanworth, D., Rademacher, T. W., Mizuochi, T., Taniguchi, T., Matsuta,
K., and et al. (1985) Association of rheumatoid arthritis and primaryosteoarthritis with changes in the glycosylation pattern of total serumIgG. Nature 316, 452–457
28. Selman, M. H., McDonnell, L. A., Palmblad, M., Ruhaak, L. R., Deelder,A. M., and Wuhrer, M. (2010) Immunoglobulin G glycopeptide profiling bymatrix-assisted laser desorption ionization Fourier transform ion cyclo-tron resonance mass spectrometry. Anal. Chem. 82, 1073–1081
29. Shikata, K., Yasuda, T., Takeuchi, F., Konishi, T., Nakata, M., and Mizuochi,T. (1998) Structural changes in the oligosaccharide moiety of human IgGwith aging. Glycoconj. J. 15, 683–689
30. Stadlmann, J., Pabst, M., Kolarich, D., Kunert, R., and Altmann, F. (2008)Analysis of immunoglobulin glycosylation by LC-ESI-MS of glycopep-tides and oligosaccharides. Proteomics 8, 2858–2871
31. Wuhrer, M., Stam, J. C., van de Geijn, F. E., Koeleman, C. A., Verrips, C. T.,Dolhain, R. J., Hokke, C. H., and Deelder, A. M. (2007) Glycosylationprofiling of immunoglobulin G (IgG) subclasses from human serum. Pro-teomics 7, 4070–4081
32. Yamada, E., Tsukamoto, Y., Sasaki, R., Yagyu, K., and Takahashi, N. (1997)Structural changes of immunoglobulin G oligosaccharides with age inhealthy human serum. Glycoconjugate J. 14, 401–405
33. Bakovic, M. P., Selman, M. H., Hoffmann, M., Rudan, I., Campbell, H.,Deelder, A. M., Lauc, G., and Wuhrer, M. (2013) High-throughput IgG FcN-glycosylation profiling by mass spectrometry of glycopeptides. J. Pro-teome Res. 12, 821–831
34. Balbin, M., Grubb, A., de Lange, G. G., and Grubb, R. (1994) DNA se-quences specific for Caucasian G3m(b) and (g) allotypes: allotyping atthe genomic level. Immunogenetics 39, 187–193
35. Pedrioli, P. G., Eng, J. K., Hubley, R., Vogelzang, M., Deutsch, E. W.,Raught, B., Pratt, B., Nilsson, E., Angeletti, R. H., Apweiler, R., Cheung,K., Costello, C. E., Hermjakob, H., Huang, S., Julian, R. K., Kapp, E.,McComb, M. E., Oliver, S. G., Omenn, G., Paton, N. W., Simpson, R.,Smith, R., Taylor, C. F., Zhu, W., and Aebersold, R. (2004) A commonopen representation of mass spectrometry data and its application toproteomics research. Nat. Biotechnol. 22, 1459–1466
36. Nevedomskaya, E., Derks, R., Deelder, A. M., Mayboroda, O. A., andPalmblad, M. (2009) Alignment of capillary electrophoresis-mass spec-trometry datasets using accurate mass information. Anal. Bioanal. Chem.395, 2527–2533
37. Alfred V. Aho, B. W. K. a. P. J. W. (1988) The AWK programming language,Addison-Wesley: Reading, Massachusetts.
38. Strittmatter, E. F., Ferguson, P. L., Tang, K., and Smith, R. D. (2003)Proteome analyses using accurate mass and elution time peptide tagswith capillary LC time-of-flight mass spectrometry. J. Am. Soc. MassSpectrom. 14, 980–991
39. Selman, M. H., Derks, R. J., Bondt, A., Palmblad, M., Schoenmaker, B.,Koeleman, C. A., van de Geijn, F. E., Dolhain, R. J., Deelder, A. M., andWuhrer, M. (2012) Fc specific IgG glycosylation profiling by robust nano-reverse phase HPLC-MS using a sheath-flow ESI sprayer interface. J.Proteomics 75, 1318–1329
40. Hennig, R., Reichl, U., and Rapp, E. (2011) A Software Tool for AutomatedHigh-Throughput Processing of CGE-LIF Based Glycoanalysis Data,Generated by a Multiplexing Capillary DNA Sequencer. GlycoconjugateJ. 28, 331–332
41. Behne, A., Muth, T., Borowiak, M., Reichl, U., and Rapp, E. (2013) glyXalign:high-throughput migration time alignment preprocessing of electropho-retic data retrieved via multiplexed capillary gel electrophoresis withlaser-induced fluorescence detection-based glycoprofiling. Electropho-resis 34, 2311–2315
42. Aulchenko, Y. S., Ripke, S., Isaacs, A., and van Duijn, C. M. (2007)GenABEL: an R library for genome-wide association analysis. Bioinfor-matics 23, 1294–1296
43. R-Core-Team (2013) R: A language and environment for statistical comput-ing, R Foundation for Statistical Computing, Vienna, Austria
44. Stavenhagen, K., Hinneburg, H., Thaysen-Andersen, M., Hartmann, L.,Varon Silva, D., Fuchser, J., Kaspar, S., Rapp, E., Seeberger, P. H., andKolarich, D. (2013) Quantitative mapping of glycoprotein micro-hetero-geneity and macro-heterogeneity: an evaluation of mass spectrometrysignal strengths using synthetic peptides and glycopeptides. J. MassSpectrom.: JMS 48, 627–639
45. Zoldos, V., Horvat, T., and Lauc, G. (2013) Glycomics meets genomics,epigenomics and other high throughput omics for system biology stud-ies. Curr. Opin. Chem. Biol. 17, 34–40
Glycosylation Analysis for Genetics and Epidemiology
Molecular & Cellular Proteomics 13.6 1609
46. Anumula, K. R. (2012) Quantitative glycan profiling of normal human plasmaderived immunoglobulin and its fragments Fab and Fc. J. Immunol.Methods 382, 167–176
47. Kobata, A. (2008) The N-linked sugar chains of human immunoglobulin G:their unique pattern, and their functional roles. Biochim. Biophys. Acta1780, 472–478
48. Thobhani, S., Yuen, C. T., Bailey, M. J., and Jones, C. (2009) Identification
and quantification of N-linked oligosaccharides released from glycopro-teins: an inter-laboratory study. Glycobiology 19, 201–211
49. Youings, A., Chang, S. C., Dwek, R. A., and Scragg, I. G. (1996) Site-specific glycosylation of human immunoglobulin G is altered in fourrheumatoid arthritis patients. Biochem. J. 314 (Pt 2), 621–630
50. Nimmerjahn, F., and Ravetch, J. V. (2008) Anti-inflammatory actions ofintravenous immunoglobulin. Annu. Rev. Immunol. 26, 513–533
Glycosylation Analysis for Genetics and Epidemiology
1610 Molecular & Cellular Proteomics 13.6