austrian outward and inward direct investment 2000faa906fd-2922-4411-b812-488c...25 share and type...
TRANSCRIPT
ˆ
Oe s t erre i ch i s che Nat ionalbank
A u s t r i a n O u t w a r d a n d
I n wa r d D i r e c t I n v e s t m e n t
a t t h e E n d o f 2 0 0 0
Focus on Austria 2/2002

Publisher and editor:Oesterreichische Nationalbank
Otto-Wagner-Platz 3, A 1090 Vienna
Editor in chief:Wolfdietrich Grau, Secretariat of the Governing Board and Public Relations
Edited by:Susanne Pelz, Economic Analysis Division
Otto-Wagner-Platz 3, A 1090 Vienna
Translated by:Dagmar Dichtl, Ingrid Haussteiner, Irene Mu‹hldorf,
Ingeborg Schuch, Susanne Steinacher, Foreign Research Division
Design:Peter Buchegger, Secretariat of the Governing Board and Public Relations
Layout and typesetting:Hannes Jelinek, Printing Office
Printing and production:Oesterreichische Nationalbank, Printing Office
Published and produced at:Otto-Wagner-Platz 3, A 1090 Vienna
Paper:Salzer Demeter, 100% woodpulp paper,
bleached without chlorine, acid-free, without optical whiteners
Inquiries:Oesterreichische Nationalbank
Balance of Payments Division
Otto-Wagner-Platz 3, A 1090 Vienna
Postal address: P.O. Box 61, A 1011 Vienna
Telephone: (+43-1) 404 20, ext. 5415 Rene« Dell�mour
Fax: (+43-1) 404 20, ext. 5499
E-mail: [email protected]
Orders:Oesterreichische Nationalbank
Documentation Management and Communications Services
Otto-Wagner-Platz 3, A 1090 Vienna
Postal address: P.O. Box 61, A 1011 Vienna
Telephone: (+43-1) 404 20, ext. 2345
Fax: (+43-1) 404 20, ext. 2398
Internet:http://www.oenb.at
DVR 0031577
Vienna 2002

Time Series
1.1 Capital Structure and Number of Employees of AustrianDirect Investment Enterprises Abroad 12
1.2 Capital Structure and Number of Employees of ForeignDirect Investment Enterprises in Austria 13
2.1 Outward Direct Investment in Terms of Nominal Capitalby Major Host Countries 12
2.2 Inward Direct Investment in Terms of Nominal Capitalby Major Home Countries 13
3.1 Outward Direct Investment in Terms of Equity by Major Host Countries(incl. profit for the year) 14
3.2 Inward Direct Investment in Terms of Equity by Major Home Countries(incl. profit for the year) 15
4.1 Outward Direct Investment in Terms of Total Claims by Major Host Countries(incl. profit for the year) 14
4.2 Inward Direct Investment in Terms of Total Liabilities by Major Home Countries(incl. profit for the year) 15
5.1 Market Value of Outward Direct Investment by Major Host Countries 165.2 Market Value of Inward Direct Investment by Major Home Countries 17
Regional Breakdown
6.1 Capital Structure, Market Value and Employees of AustrianDirect Investment Enterprises Abroad by Major Host Countries at End-2000 16
6.2 Capital Structure, Market Value and Employees of ForeignDirect Investment Enterprises in Austria by Major Home Countries at End-2000 17
7.1 Credit Transactions between Austrian Direct Investors and TheirDirect Investment Enterprises Abroad by Major Host Countries at End-2000 18
7.2 Credit Transactions between Nonresident Direct Investors and TheirDirect Investment Enterprises in Austria by Major Home Countries at End-2000 19
8.1 Income from Outward Direct Investment by Major Host Countries at End-2000 188.2 Income from Inward Direct Investment in Austria
by Major Home Countries at End-2000 199.1 Royalties and Management Fees Transferred to Austrian Investors and
Direct Investors� Foreign Trade by Major Host Countries at End-2000 209.2 Royalties and Management Fees Transferred to Nonresident Investors
and Direct Investors� Foreign Trade by Major Home Countries at End-2000 2110.1 Reasons for Outward Direct Investors by Major Host Countries at End-2000 2010.2 Reasons for Inward Direct Investors by Major Home Countries at End-2000 2111.1 Nominal Capital of Austrian Direct Investment Enterprises Abroad
(incl. Indirect Investments Abroad) by Major Host Countries at End-2000 2211.2 Nominal Capital of Foreign Direct Investment Enterprises in Austria
(incl. Indirect Investments in Austria) by Major Home Countries at End-2000 2312.1 Number of Employees in Austrian Direct Investment Enterprises Abroad
(incl. Indirect Investments Abroad) by Major Host Countries at End-2000 2412.2 Number of Employees in Foreign Direct Investment Enterprises in Austria
(incl. Indirect Investments in Austria) by Major Home Countries at End-2000 25
Index of Tables
Focus on Austria 2/2002 3�

Sectoral Breakdown
13.1 Capital Structure, Market Value and Employees of AustrianDirect Investment Enterprises Abroad by Foreign Economic Sectors at End-2000 26
13.2 Capital Structure, Market Value and Employees of ForeignDirect Investment Enterprises in Austria by Austrian Economic Sectorsat End-2000 27
14.1 Credit Transactions between Austrian Direct Investors and TheirDirect Investment Enterprises Abroad by Foreign Economic Sectors at End-2000 28
14.2 Credit Transactions between Nonresident Direct Investors and TheirDirect Investment Enterprises in Austria by Austrian Economic Sectorsat End-2000 29
15.1 Income from Austrian Direct Investment Enterprises Abroad byForeign Economic Sectors at End-2000 30
15.2 Income from Foreign Direct Investment Enterprises in Austria byAustrian Economic Sectors at End-2000 31
16.1 Royalties and Management Fees Transferred to Austrian Investorsand Direct Investors� Foreign Trade by Foreign Economic Sectors at End-2000 32
16.2 Royalties and Management Fees Transferred to Nonresident Investors andDirect Investors� Foreign Trade by Austrian Economic Sectors at End-2000 33
17.1 Nominal Capital of Austrian Direct Investment Enterprises Abroad(incl. Indirect Investments Abroad) by Foreign Economic Sectors at End-2000 34
17.2 Nominal Capital of Foreign Direct Investment Enterprises in Austria(incl. Indirect Investments in Austria) by Austrian Economic Sectors at End-2000 35
18.1 Number of Employees in Austrian Direct Investment Enterprises Abroad(incl. Indirect Investments Abroad) by Foreign Economic Sectors at End-2000 36
18.2 Number of Employees in Foreign Direct Investment Enterprises in Austria(incl. Indirect Investments in Austria) by Austrian Economic Sectors at End-2000 37
Breakdown by Regions and Sectors
19.1 Austrian Direct Investment Abroad by Major Host Countriesand Foreign Economic Sectors at End-2000 38
19.2 Nonresident Direct Investment in Austria by Major Home Countriesand Austrian Economic Sectors at End-2000 39
20.1 Austrian Direct Investment Enterprises Abroad (Number, Total Capital)by Economic Regions, Continents and Foreign Economic Sectors at End-2000 40
20.2 Foreign Direct Investment Enterprises in Austria (Number, Total Capital)by Economic Regions, Continents and Austrian Economic Sectors at End-2000 42
Breakdown by Other Criteria
21.1 Capital Structure, Market Value and Number of Employeesof Austrian Direct Investment Enterprises Abroad by Laender at End-2000 44
21.2 Capital Structure, Market Value and Number of Employeesof Foreign Direct Investment Enterprises in Austria by Laender at End-2000 45
22.1 Capital Structure, Market Value and Number of Employeesof Austrian Direct Investment Enterprises by Legal Form of the Austrian Investorat End-2000 44
Index of Tables
4 Focus on Austria 2/2002�

22.2 Capital Structure, Market Value and Number of Employeesof Foreign Direct Investment Enterprises in Austria by Their Legal Format End-2000 45
23.1 Capital Structure, Market Value and Number of Employeesof Austrian Direct Investment Enterprises Abroad by Age of Enterpriseat End-2000 46
23.2 Capital Structure, Market Value and Number of Employeesof Foreign Direct Investment Enterprises in Austria by Age of Enterpriseat End-2000 47
24.1 Capital Structure, Market Value and Number of Employeesof Austrian Direct Investment Enterprises Abroad by Staff Size at End-2000 46
24.2 Capital Structure, Market Value and Number of Employeesof Foreign Direct Investment Enterprises in Austria by Staff Size at End-2000 47
25 Share and Type of Foreign Ownership of Austrian Direct Investorsand These Investors� Outward Direct Investment at End-2000 48
Legend— = The numerical value is zerox = For technical reasons no data can be indicated0 = A quantity which is smaller than half of the unit indicated or equivalent to 0_ = New series
Irrevocable euro conversion rate: EUR 1 = ATS 13.7603.
Apparent arithmetical discrepancies in the tables are due to rounding.
Index of Tables
Focus on Austria 2/2002 5�

1 IntroductionThe following special report presents the results of the OeNB�s survey on Aus-trian Direct Investment Abroad and Foreign Direct Investment in Austria at the end of2000. The two surveys provide comprehensive information complementingmore recent balance of payments data. While the balance of payments figuresare derived from payment flows over a specific period, this survey of directinvestment is based on stocks, i. e. enterprises� annual accounts. Data fromroughly 4,600 enterprises were evaluated for the 2000 survey.
Please note that the definition of equity has changed since 1999. Following arecommendation by the ECB, equity now not only covers nominal capital,reserves and profit or loss brought forward, but also the profit or loss forthe reporting year. The ECB�s recommendation is based on the fact that profitsare at a company�s free disposal until they are paid out. This reverses Austria�sprevious approach under which annual profit was not to be included underequity unless it had been appropriated (payment to owners or reinvestment).The figures contained in tables 1.1 and 1.2 have been backcast according tothe new definition.
2 DefinitionThe Austrian definition of foreign direct investment (FDI) is essentially in linewith the concept used by international organizations.1) Accordingly, Austriandirect investment abroad — outward direct investment — is understood to meancapital investment abroad by residents for the purpose of establishing and main-taining a long-term economic relationship with a foreign enterprise with theadded intention of exercising a significant degree of influence on its manage-ment. This feature distinguishes direct investment from other types of long-term capital investment such as portfolio investment, where the profit motiveis uppermost.
Basically, there are three different types of direct investment:— investment in existing or newly established enterprises in the form of a cash
contribution, setoff of claims, noncash capital contribution or the transfer ofrights;
— reinvestment of profits, i. e. retention rather than disbursement of at least aportion of the profit earned by the direct investment enterprise. (Such rein-vestment can boost capital resources in a number of ways: It can be used toincrease nominal capital, it may alternatively or additionally be appropriatedto reserves; and finally, it may be booked as profit brought forward);
— loans and other allocations to enterprises by foreign investors to reinforcethese companies� resources (in addition to investors� participation).The distinction between �nominal capital,� �other equity� and �loans� com-
monly used in international statistics is drawn on the basis of the above differ-entiation of direct investment capital.
International organizations (IMF, OECD) call for the collection of marketvalues for surveys. As in almost all other countries, however, the OeNB�s sur-veys are based on book values. The market values given in this publication are
1 See IMF (1993): Balance of Payments Manual, fifth edition; OECD (1996): Detailed Benchmark Definition of ForeignDirect Investment, third edition.
6 Focus on Austria 2/2002�
Austrian Outward and InwardDirect Investmentat the End of 2000

stock exchange prices or, failing that, estimates based on a model to determinethe capitalized value of potential earnings.
The survey conducted by the Oesterreichische Nationalbank coversonly enterprises in which the direct investor holds an investment of at least10%. Moreover, the investor must hold at least ATS 1 million (EUR 72,000)of nominal capital. Prior to 1989, the evaluation was based on a lower thresholdvalue. Increasing the reporting threshold did not reduce the informative value ofthe direct investment statistics. 1998 saw another round of streamlining: Insteadof reducing the sample, it was decided to survey enterprises with a low share ofinward direct investment in their nominal capital and small direct investors onlyevery two years and to enter the results of the previous year in the respectiveposition in years without survey. To fill the gaps, last year�s figures were to bebrought forward.
Other forms of internationalization (e. g. cooperation and consultationagreements) are not included.
3 Adjustment of Inward Direct Investment Datafor the Location of the Parent Company
When statistics on nominal capital are compiled on a country of origin basis, theproblem arises that the actual decision-maker is not always identical with thedirect investor. Consider, for example, a German company acquiring a stakein an Austrian enterprise via a holding company located in Switzerland. To takeaccount of this �distortion,� i. e. to identify the country of origin of the indirectinvestor (in other words, the location of the parent company), additional infor-mation has been collected since 1982. It is used to reassign the capital from thelocation of the direct investor�s registered office to that of the indirect investor(i. e. the parent company).
4 Structure of TablesThis publication represents the results of the two surveys on outward andinward FDI. The paired tables of inward and outward direct investment weregiven an identical structure wherever the data allowed for such a presentation.Thus it is possible to directly compare data on specific aspects of Austrian directinvestment abroad (outward FDI) with their counterpart, nonresident directinvestment in Austria (inward FDI).
In line with international standards applied to statistics on direct investment,the breakdown by economic sectors is always based on the sectoral structure ofthe host country, i. e. the country of destination. This is the Austrian surveybased on the new Austrian Statistical Classification of Economic Activities of1996, which is ultimately derived from the United Nations� �InternationalStandard Industrial Classification of All Economic Activities.�
Under the new classification system, an inward or outward direct invest-ment in a direct investment enterprise which is a holding is classified under�other business activities� because the holding in turn may contain a varietyof companies whose respective activities are assignable to different sectors, e. g.manufacturing or services. Tables 17.2 and 18.2 are exceptions; here theholdings which are majority-owned by nonresidents and which, in turn, owna majority of their own direct investment enterprises (referred to as the original
Focus on Austria 2/2002 7�
Austrian Outward and Inward
Direct Investment

direct investor�s indirect investment enterprise) are classified under that sectorto which the indirect investment enterprise with the largest staff size belongs.The comparison is complemented by a presentation of the degree of overlap ofoutward and inward direct investment (Table 25). This table indicates theextent of Austrian outward direct investment by enterprises in which nonres-idents hold investments. Important concepts are defined under 5 Glossary.
5 GlossaryDirect Investment EnterpriseAn enterprise in which one or more direct investors hold(s) a stake. The directinvestor (an individual or an associated group of individuals or enterprises) mustown at least 10% of the nominal capital of the direct investment enterprise. The10% share must be equivalent to at least ATS 1 million (EUR 72,000).
Direct InvestorOne or more individuals or legal entities owning a share of a direct investmententerprise in an economy other than that in which the direct investor is domi-ciled.
EmployeesUnless otherwise stated, the number of a direct investment enterprise�s employ-ees is weighted, i. e. multiplied by the direct investor�s percentage ownership ofthe enterprise�s nominal capital.
Direct InvestmentThe relationship between the direct investor and the direct investment enter-prise. The number of direct investments is generally higher than the numberof investors and of direct investment enterprises.
Net IncomeProfit or loss for the year adjusted for profit or loss brought forward.
Direct Investment CreditsA distinction between short-term (up to and including 1 year) and long-termcredit is made. There is a minor difference between assets- and liabilities-sidecredit data: Whereas on the assets side, only data on credits extended by thedirect investor (the parent company) to their direct investment enterprises (sub-sidiaries, associate companies or branches) are collected, the data on the liabil-ities side apply to both channels of credit relations between the direct investor(parent or group) and the direct investment enterprise. Note: On account of achange in international standards, the statistics include only those short- andlong-term direct investment relations between banks (back-dated to and includ-ing 1992) which are associated with an equity investment or subordinatedequity.
EquitySum total of nominal capital, reserves and profit or loss brought forward. Fol-lowing a recommendation by the ECB, equity now also covers the profit/loss for the cur-
8 Focus on Austria 2/2002�
Austrian Outward and Inward
Direct Investment

rent year (as of 1999). This recommendation is based on the fact that profits are ata company�s disposal until they are paid out. This reverses Austria�s previousapproach under which annual profit was not to be included under equity unlessit had been appropriated (payment to owners or reinvestment).
TotalEquity plus the net credit position, i.e. the balance of credit claims minus creditliabilities (outward) or credit liabilities minus credit claims (inward) (see alsodirect investment credit).
Indirect InvestmentsOwnership interests that a direct investment enterprise (first-tier affiliate) holdsin another enterprise (second-tier affiliate). Unless otherwise stated, nominalcapital and employment in second-tier affiliates are weighted twice, once bythe nominal capital share held by the parent company in the first-tier affiliateand then again by the latter�s share in the second-tier affiliate. As an example,a Swiss company owns 60% of the Austrian company X, which in turn owns70% of the Austrian company Y. Thus, the Swiss company owns 60% of com-pany X and 42% of company Y (70% times 60%). Note: Under outward invest-ment, the OeNB�s survey covers all indirect investment abroad, but underinward investment it covers only indirect investment in Austrian companies.
Profit or Loss for the YearProfit or loss for the year excluding profit or loss brought forward.
Market ValueBy definition, this is the amount a buyer would be willing to pay and a sellerwilling to accept. In the case of stock companies listed on the stock exchange,market value is the capitalized value of stocks. For most companies, a model todetermine the capitalized value of potential earnings must be applied to deter-mine specific approximative �market values.� In essence, this valuation is basedon the annual income situation during the four preceding years.
Nominal CapitalCapital (book value): If the enterprise is a limited liability company (GmbH),nominal capital means the company capital or equity, if it is a joint stock com-pany, it means the face value of the stock (and not the generally higher valuequoted).
Breakdown by Regions:EU-12: Belgium, Germany, Greece, Spain, France (incl. Monaco and overseasdepartments), Ireland, Italy (excl. San Marino, Vatican), Luxembourg, Nether-lands, Portugal, Finland.EU-15: EU-12 + Denmark, Sweden, United Kingdom (excl. Guernsey, Jersey,Isle of Man).Europe: Incl. European countries of the CIS.Gulf countries: Bahrain, Iraq, Yemen, Qatar, Kuwait, Oman, Saudi Arabia,United Arab Emirates.
Focus on Austria 2/2002 9�
Austrian Outward and Inward
Direct Investment

Caribbean states: Netherlands Antilles, Barbados, Bermuda, Jamaica,St. Kitts-Nevis, Cayman Islands, Montserrat, British Virgin Islands (Caribbeanoffshore financial centers).CEEC-5: Poland, Slovak Republic, Slovenia, Czech Republic, Hungary.CEEC-19: CEEC-5 + Albania, Bosnia and Herzegovina, Bulgaria, FederalRepublic of Yugoslavia, Estonia, Croatia, Latvia, Lithuania, Republic ofMoldavia, Macedonia, Romania, Russia, Ukraine, Belarus.NAFTA: U.S.A. (incl. Puerto Rico), Canada, Mexico.OECD: EU-15 + OECD overseas countries + Iceland, Norway, Poland,Switzerland, Czech Republic, Turkey, Hungary.OECD overseas countries: Australia, Japan, Canada, Mexico, New Zealand,Republic of Korea, U.S.A. (incl. Puerto Rico).
ReservesThis includes only capital reserves and profit reserves (i.e. taxed reserves inaccordance with the Austrian �Rechnungslegungsgesetz� or Financial ReportingAct, which specifies the preparation and presentation of annual financial state-ments). Accruals (such as provisions for severance pay) are not included, nor isinsurance companies� premium reserve stock.
Breakdown by Economic SectorsDirect investment enterprises (or direct investors) are classified by economicsector in line with the definitions in the Austrian Statistical Classification of Eco-nomic Activities established by the Austrian Central Statistical Office (�O‹ NACE1995�).1) The breakdown to the third hierarchical level is provided on the fol-lowing page.
1 O‹STAT (1995): Systematik der Wirtschaftsta‹tigkeiten — O‹NACE 1995.
10 Focus on Austria 2/2002�
Austrian Outward and Inward
Direct Investment

�������� ��������� �� ������ � ��� ����� �������� ���������
�� ��� ���� ���������
������ ��� ��������� ��� �� ������ ��� ����
�� ������ �� �� �� ����� �� �� � ��� �� �� �� �� � ��� �� ���� �� ������ �� � ��� ���� ������ �� ������ �� ������ ������ ������ �� �� � ������ � ��� ������ �� ���������� ��� ��� �� ��� � �� �� �� � �� �������� ���� ���� ������ ��� �� ��� ��!� ��� �� � ��
������ ����� ��� ����� ����"��� ����� � �# ���� ��� �� ���� ����� � �� !�$�����
�% ���� ��� �� �!� ����� �
&�� ��� ����� �� ����� �� �� ��� �' ���� ��� �� �� �����( ���� ��� �� ������ ������ �������� �� ������ �� ����) &����� �� �������� �� �� ���� ��� ���
*��� �� ���� ����� � �� ���� ��� �� ���� �� ����� � �� ���� �� ��+� ���� ����� ���
,��� ��!������� �� ���� ��� �� ���� ��� �� ����� ���� �� ���� ����� ��� ,�!�������� ���� ��� �� ������� ��� �� ������� ����
-������ �� ������ ����� �� ���������!!�� �� ��� � ����� �
�� ���� ��� �� �+�� ������� �� ������ ����� ��� ���� ��� �� ������ �� ����� ����� ��# ���� ��� �� ��!!�� �� ��� � ����� �
.���� ��� ������ ����� � �% ���� ��� �� � ��� ����� ��� ������ ����� �
�� � ����� � �' ���� ��� �� !�� �� �� �� �!�� �� �� � ����� ��( ���� ��� �� �!�� �� �� � ����� �� ���� ������� �� ��������
������ ����� � �) ���� ��� �� ������� �� �������� �/�//
��� ��� �� �� �� �������� �� ���� ��� �� ����� ������� �� ���� ����� ���� ��� �� ��� ��� ������� �� ��� �� �/�//�� ���� ��� �� ����� ���$����� �� ������ ��� �������� �� ��� ���� ���� ��� �� ������ �������� �� �� �� ��� ����� �� � ��� �� ��+�
&������ �������� �� ���� ��� �� �� �� $������� ������ �� ����0 �������# ���� ��� �� � ��� ������ ��������
���� ����� �/�// �% ���� ��� �� ����� ���� ���� ����� �/�//�' -������
��� �� ��� �# ��� �� ���
���� ��&��� �� ������ #� 1��� ��� ���� �� ����� �� �� �� $������ �� �� ������
#� *������� ��� �� ��������� ���#� -� �� ���
2� ��� �� ��� ��� � ## 2� ��� �� ��� ��� �
&������ �� ������ ��� %� 3�� ������ � ������ $� ���������%� * �� ������ %� 4�� ������ %� 1����� ��� �� ������� ������ �$� ���� �$� ��� �� �$�� ������%� ,�� �� ��������� ����
"����� �� ������ ��� %# "����� �� ������ ���� ���� ������� �� ������� �������%% 5������ �� ������� �������� ���� ��������� ���� ����� �%' 4 �$� ��� ������� � ������ �� ������ ���
-�� �� � �� !������� �$� ��� '� -�� �� � �$� ���'� -�� ��� �� ������� �� �������� '� ���� �� �� ��� �� �$� ���'� -����� �� ��$������� '� � ��� !������� �$� ���
� ��� ���$��� '# ,�!�� ������ � ��� �� �������� ��������� ���� ����� �(� ��� ���(# 2�� � �� ���� ���+)� 1���� �� ������ �������)� 4 �$� ��� �� ���!������ �����6 ���� �/�//)� -��� ����� �� ��� �� ���� ��� �$� ���)� � ��� ���$�� �$� ���)# ,��$ � ���������� �� � �������� �������)) �� � ���� ���� �����6 ���� �� !�����
Focus on Austria 2/2002 11�
Austrian Outward and Inward
Direct Investment

Outward direct investment
Table 1.1
Capital Structure and Number of Employees
of Austrian Direct Investment Enterprises Abroad
End of year Austriandirectinvestors
Directinvestmententerprisesabroad1)
Claims on nonresidents Numberof employees
Nominalcapital
Reserves Profit or lossbroughtforward
Net profitfor the year
Equity2) Other capital(loans toaffiliatedenterprisesnet)3)
Total capital
Number ATS billion 1,000
1981 359 685 6.37 2.46 �0.87 x 7.97 2.11 10.08 x1982 397 724 7.22 2.69 �0.93 x 8.98 2.30 11.28 x1983 588 822 8.09 4.31 �1.72 x 10.68 2.99 13.67 x1984 652 898 8.81 5.23 �1.63 x 12.41 4.05 16.46 x1985 703 941 9.32 5.62 �1.21 x 13.74 4.91 18.65 22.21986 767 1,015 8.38 6.15 �1.34 x 13.19 3.53 16.71 23.61987 786 1,028 10.63 6.88 �0.73 x 16.78 � 1.77 15.02 23.41988 880 1,170 12.69 7.25 �1.57 x 18.37 � 1.29 17.08 25.41989 550 839 16.80 9.62 �0.55 2.14 28.02 5.99 34.01 29.51990 679 1,127 28.37 11.56 �0.09 2.66 42.50 8.18 50.68 43.61991 717 1,188 38.45 12.39 0.25 � 0.39 50.71 13.36 64.07 63.11992 756 1,290 45.36 19.79 �2.16 � 3.16 59.82 14.93 74.76 72.81993 838 1,495 60.43 24.19 �6.78 � 1.63 76.21 20.62 96.83 90.91994 877 1,617 64.17 24.28 �4.52 2.61 86.54 19.02 105.56 106.11995 894 1,718 71.44 31.36 �7.50 1.31 96.61 22.75 119.36 125.01996 897 1,810 83.21 38.08 �8.72 6.68 119.25 23.81 143.06 135.41997 896 1,942 93.71 55.38 �3.32 8.86 154.62 22.38 177.00 161.41998 900 2,006 108.16 67.22 �1.24 7.98 182.11 23.08 205.20 187.71999 902 2,095 127.43 91.22 4.44 15.48 238.57 23.42 261.99 199.2
Number EUR million 1,000
1999 902 2,095 9,261 6,629 322 1,125 17,337 1,702 19,039 199.22000 917 2,227 10,744 11,301 480 1,345 23,871 2,804 26,675 248.61) Threshold values for reporting were changed in 1989 (see 2 Definition).2) From 1989, this figure includes profits for the current year.3) From 1989, this figure includes short-term loans; before 1989, it covered long-term loans only.
Table 2.1
Outward Direct Investment in Terms of Nominal Capital by Major Host Countries
1990 1995 1999 2000
Share in % Nominal capitalinvestedEUR million
Index 1995 = 100 Share in %
Germany 24.7 15.9 15.4 1,514 183 14.1Czech Republic 0.2 10.1 10.7 1,465 279 13.6Netherlands 6.2 6.4 2.7 327 98 3.0Hungary 12.2 16.2 9.1 929 111 8.7United Kingdom 6.9 5.3 7.8 736 267 6.8U.S.A 7.4 5.8 6.5 518 171 4.8Caribbean States1) 1.5 2.1 1.7 96 86 0.9Switzerland, Liechtenstein 15.1 6.7 4.2 427 123 4.0Poland 0.2 1.8 2.6 323 353 3.0Sweden 0.2 0.2 0.3 34 297 0.3Slovak Republic 0.1 2.5 3.5 360 280 3.4Slovenia 2.1 2.9 2.3 223 151 2.1Malta 0.1 3.1 0.9 267 166 2.5Denmark 0.2 0.8 2.4 262 655 2.4France 2.3 2.5 4.8 478 365 4.4Other countries 20.7 17.7 25.1 2,785 303 25.9Total 100.0 100.0 100.0 10,744 207 100.0
EU-121) 45.2 35.5 30.9 2,867 156 26.7EU-151) 52.4 41.8 41.5 3,899 180 36.3CEEC-191) 16.2 34.9 35.8 4,408 243 41.01) See glossary (breakdown by regions) for definition.
12 Focus on Austria 2/2002�
Austrian Outward and Inward
Direct Investment
Inward direct investment
Table 1.2
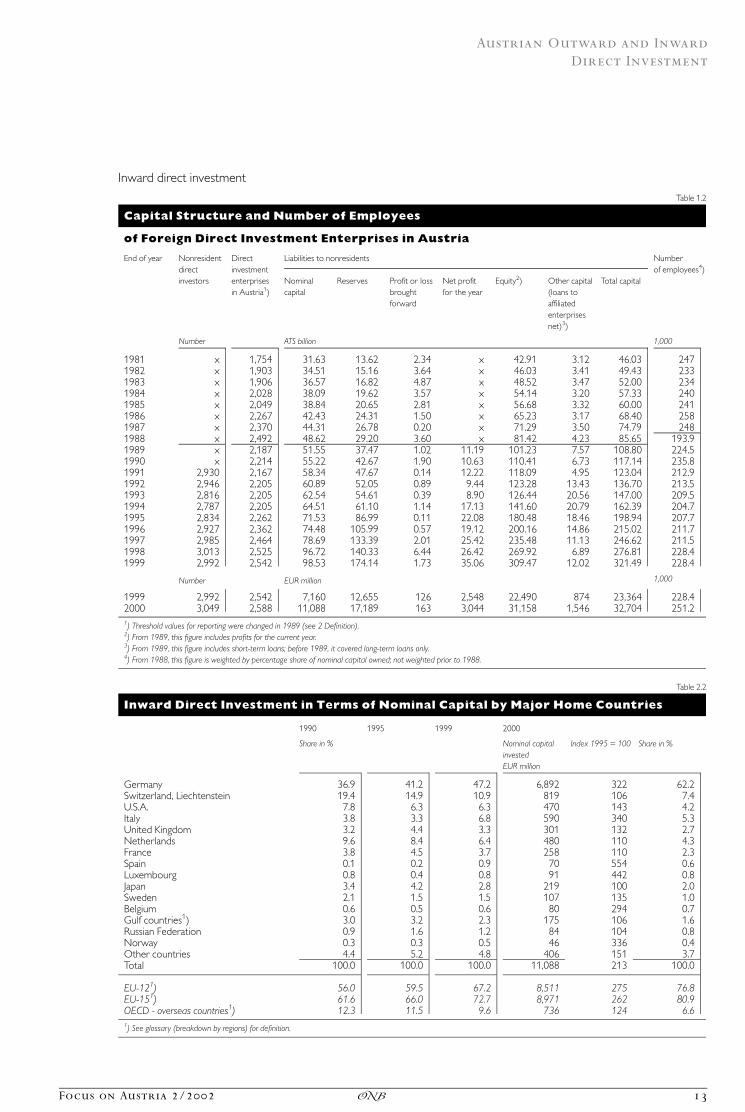
Capital Structure and Number of Employees
of Foreign Direct Investment Enterprises in Austria
End of year Nonresidentdirectinvestors
Directinvestmententerprisesin Austria1)
Liabilities to nonresidents Numberof employees4)
Nominalcapital
Reserves Profit or lossbroughtforward
Net profitfor the year
Equity2) Other capital(loans toaffiliatedenterprisesnet)3)
Total capital
Number ATS billion 1,000
1981 x 1,754 31.63 13.62 �2.34 x 42.91 3.12 46.03 2471982 x 1,903 34.51 15.16 �3.64 x 46.03 3.41 49.43 2331983 x 1,906 36.57 16.82 �4.87 x 48.52 3.47 52.00 2341984 x 2,028 38.09 19.62 �3.57 x 54.14 3.20 57.33 2401985 x 2,049 38.84 20.65 �2.81 x 56.68 3.32 60.00 2411986 x 2,267 42.43 24.31 �1.50 x 65.23 3.17 68.40 2581987 x 2,370 44.31 26.78 0.20 x 71.29 3.50 74.79 2481988 x 2,492 48.62 29.20 3.60 x 81.42 4.23 85.65 193.91989 x 2,187 51.55 37.47 1.02 11.19 101.23 7.57 108.80 224.51990 x 2,214 55.22 42.67 1.90 10.63 110.41 6.73 117.14 235.81991 2,930 2,167 58.34 47.67 �0.14 12.22 118.09 4.95 123.04 212.91992 2,946 2,205 60.89 52.05 0.89 9.44 123.28 13.43 136.70 213.51993 2,816 2,205 62.54 54.61 0.39 8.90 126.44 20.56 147.00 209.51994 2,787 2,205 64.51 61.10 �1.14 17.13 141.60 20.79 162.39 204.71995 2,834 2,262 71.53 86.99 �0.11 22.08 180.48 18.46 198.94 207.71996 2,927 2,362 74.48 105.99 0.57 19.12 200.16 14.86 215.02 211.71997 2,985 2,464 78.69 133.39 �2.01 25.42 235.48 11.13 246.62 211.51998 3,013 2,525 96.72 140.33 6.44 26.42 269.92 6.89 276.81 228.41999 2,992 2,542 98.53 174.14 1.73 35.06 309.47 12.02 321.49 228.4
Number EUR million 1,000
1999 2,992 2,542 7,160 12,655 126 2,548 22,490 874 23,364 228.42000 3,049 2,588 11,088 17,189 � 163 3,044 31,158 1,546 32,704 251.21) Threshold values for reporting were changed in 1989 (see 2 Definition).2) From 1989, this figure includes profits for the current year.3) From 1989, this figure includes short-term loans; before 1989, it covered long-term loans only.4) From 1988, this figure is weighted by percentage share of nominal capital owned; not weighted prior to 1988.
Table 2.2
Inward Direct Investment in Terms of Nominal Capital by Major Home Countries
1990 1995 1999 2000
Share in % Nominal capitalinvestedEUR million
Index 1995 = 100 Share in %
Germany 36.9 41.2 47.2 6,892 322 62.2Switzerland, Liechtenstein 19.4 14.9 10.9 819 106 7.4U.S.A. 7.8 6.3 6.3 470 143 4.2Italy 3.8 3.3 6.8 590 340 5.3United Kingdom 3.2 4.4 3.3 301 132 2.7Netherlands 9.6 8.4 6.4 480 110 4.3France 3.8 4.5 3.7 258 110 2.3Spain 0.1 0.2 0.9 70 554 0.6Luxembourg 0.8 0.4 0.8 91 442 0.8Japan 3.4 4.2 2.8 219 100 2.0Sweden 2.1 1.5 1.5 107 135 1.0Belgium 0.6 0.5 0.6 80 294 0.7Gulf countries1) 3.0 3.2 2.3 175 106 1.6Russian Federation 0.9 1.6 1.2 84 104 0.8Norway 0.3 0.3 0.5 46 336 0.4Other countries 4.4 5.2 4.8 406 151 3.7Total 100.0 100.0 100.0 11,088 213 100.0
EU-121) 56.0 59.5 67.2 8,511 275 76.8EU-151) 61.6 66.0 72.7 8,971 262 80.9OECD - overseas countries1) 12.3 11.5 9.6 736 124 6.61) See glossary (breakdown by regions) for definition.
Focus on Austria 2/2002 13�
Austrian Outward and Inward
Direct Investment

Outward direct investment
Table 3.1
Outward Direct Investment in Terms of Equity by Major Host Countries
(incl. profit for the year)
1990 1995 1999 2000
Share in % EquityEUR million
Index 1995 = 100 Share in %
Germany 24.1 15.8 13.9 4,734 427 19.8Czech Republic 0.3 6.8 6.4 1,909 399 8.0Netherlands 10.3 9.3 5.1 1,756 268 7.4Hungary 9.1 14.1 9.0 1,738 175 7.3United Kingdom 5.2 5.5 9.4 1,615 415 6.8U.S.A 5.9 4.3 8.0 1,587 524 6.6Caribbean states1) 1.9 2.1 5.0 1,181 816 4.9Switzerland, Liechtenstein 23.3 12.0 5.9 1,160 137 4.9Poland 0.2 1.4 2.9 793 815 3.3Sweden 0.1 1.1 3.9 624 826 2.6Slovak Republic 0.0 1.9 2.8 587 436 2.5Slovenia 1.6 2.7 2.8 563 301 2.4Malta 0.1 2.7 1.5 501 268 2.1Denmark 0.4 0.3 2.3 461 2,223 1.9France 2.2 2.0 2.9 451 317 1.9Other countries 15.2 17.9 18.3 4,211 334 17.6Total 100.0 100.0 100.0 23,871 340 100.0
EU-121) 46.9 37.4 28.4 7,917 301 33.2EU-151) 52.7 44.3 44.0 10,617 341 44.5CEEC-191) 12.3 28.1 27.8 6,642 337 27.81) See glossary (breakdown by regions) for definition.
Table 4.1
Outward Direct Investment in Terms of Total Claims by Major Host Countries
(incl. profit for the year)
1990 1995 1999 2000
Share in % Total claimsEUR million
Index 1995 = 100 Share in %
Germany 24.4 19.4 14.4 5,070 301 19.0Czech Republic 0.3 8.0 6.8 2,108 304 7.9Netherlands 8.1 8.2 4.9 1,693 237 6.3Hungary 7.9 13.5 8.8 1,863 159 7.0United Kingdom 8.5 4.9 8.8 1,648 386 6.2U.S.A 6.4 5.1 7.6 2,160 484 8.1Caribbean states1) 1.6 1.8 4.6 1,180 762 4.4Switzerland, Liechtenstein 20.4 10.2 5.7 1,214 138 4.6Poland 0.3 1.4 2.9 914 763 3.4Sweden 0.2 1.4 4.1 740 623 2.8Slovak Republic 0.0 1.7 3.0 1,272 838 4.8Slovenia 1.4 2.3 2.9 640 317 2.4Malta 0.1 2.2 1.4 501 268 1.9Denmark 0.4 0.4 2.5 470 1,403 1.8France 2.0 2.3 2.8 491 247 1.8Other countries 17.9 17.2 18.9 4,709 316 17.7Total 100.0 100.0 100.0 26,674 308 100.0
EU-121) 43.7 39.5 29.2 8,398 245 31.5EU-151) 52.8 46.2 44.5 11,257 281 42.2CEEC-191) 11.0 28.0 28.8 8,026 331 30.11) See glossary (breakdown by regions) for definition.
14 Focus on Austria 2/2002�
Austrian Outward and Inward
Direct Investment
Inward direct investment
Table 3.2
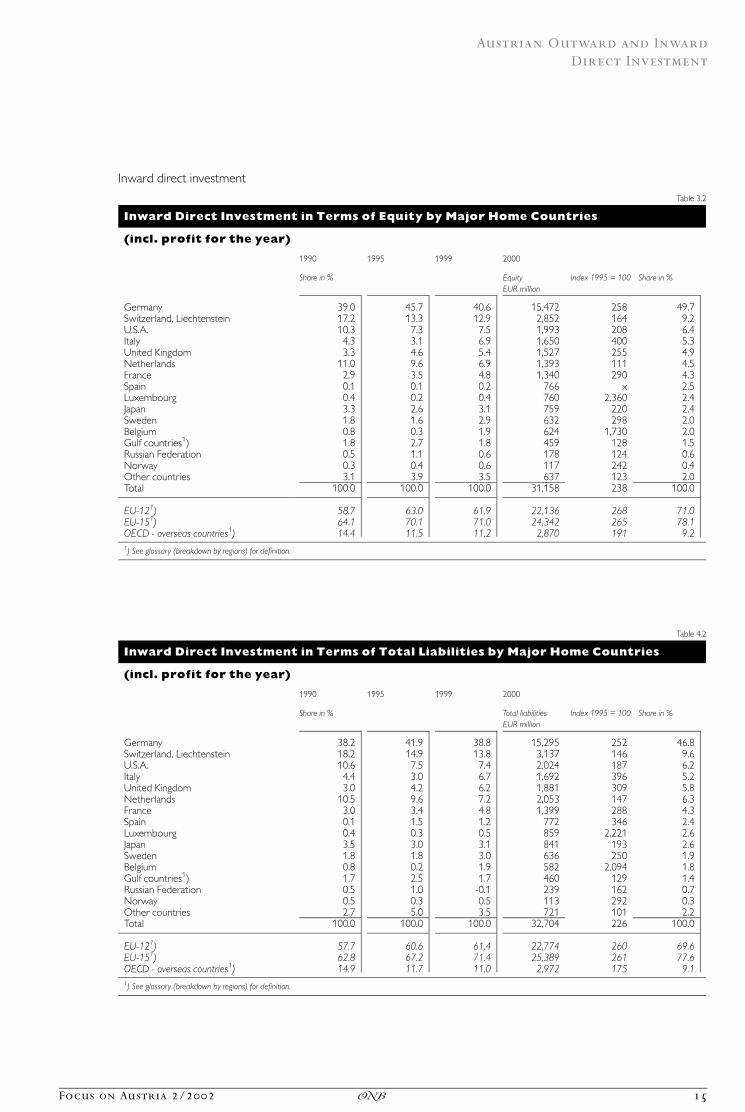
Inward Direct Investment in Terms of Equity by Major Home Countries
(incl. profit for the year)
1990 1995 1999 2000
Share in % EquityEUR million
Index 1995 = 100 Share in %
Germany 39.0 45.7 40.6 15,472 258 49.7Switzerland, Liechtenstein 17.2 13.3 12.9 2,852 164 9.2U.S.A. 10.3 7.3 7.5 1,993 208 6.4Italy 4.3 3.1 6.9 1,650 400 5.3United Kingdom 3.3 4.6 5.4 1,527 255 4.9Netherlands 11.0 9.6 6.9 1,393 111 4.5France 2.9 3.5 4.8 1,340 290 4.3Spain 0.1 0.1 0.2 766 x 2.5Luxembourg 0.4 0.2 0.4 760 2,360 2.4Japan 3.3 2.6 3.1 759 220 2.4Sweden 1.8 1.6 2.9 632 298 2.0Belgium 0.8 0.3 1.9 624 1,730 2.0Gulf countries1) 1.8 2.7 1.8 459 128 1.5Russian Federation 0.5 1.1 0.6 178 124 0.6Norway 0.3 0.4 0.6 117 242 0.4Other countries 3.1 3.9 3.5 637 123 2.0Total 100.0 100.0 100.0 31,158 238 100.0
EU-121) 58.7 63.0 61.9 22,136 268 71.0EU-151) 64.1 70.1 71.0 24,342 265 78.1OECD - overseas countries1) 14.4 11.5 11.2 2,870 191 9.21) See glossary (breakdown by regions) for definition.
Table 4.2
Inward Direct Investment in Terms of Total Liabilities by Major Home Countries
(incl. profit for the year)
1990 1995 1999 2000
Share in % Total liabilitiesEUR million
Index 1995 = 100 Share in %
Germany 38.2 41.9 38.8 15,295 252 46.8Switzerland, Liechtenstein 18.2 14.9 13.8 3,137 146 9.6U.S.A. 10.6 7.5 7.4 2,024 187 6.2Italy 4.4 3.0 6.7 1,692 396 5.2United Kingdom 3.0 4.2 6.2 1,881 309 5.8Netherlands 10.5 9.6 7.2 2,053 147 6.3France 3.0 3.4 4.8 1,399 288 4.3Spain 0.1 1.5 1.2 772 346 2.4Luxembourg 0.4 0.3 0.5 859 2,221 2.6Japan 3.5 3.0 3.1 841 193 2.6Sweden 1.8 1.8 3.0 636 250 1.9Belgium 0.8 0.2 1.9 582 2,094 1.8Gulf countries1) 1.7 2.5 1.7 460 129 1.4Russian Federation 0.5 1.0 -0.1 239 162 0.7Norway 0.5 0.3 0.5 113 292 0.3Other countries 2.7 5.0 3.5 721 101 2.2Total 100.0 100.0 100.0 32,704 226 100.0
EU-121) 57.7 60.6 61.4 22,774 260 69.6EU-151) 62.8 67.2 71.4 25,389 261 77.6OECD - overseas countries1) 14.9 11.7 11.0 2,972 175 9.11) See glossary (breakdown by regions) for definition.
Focus on Austria 2/2002 15�
Austrian Outward and Inward
Direct Investment

Outward direct investment
Table 5.1
Market Value of Outward Direct Investment by Major Host Countries
1993 1995 1999 2000
Market value Nominalcapital
Equity Total claims Market value
EUR million
Germany 699 1,485 2,277 1,514 4,734 5,070 3,014Czech Republic 159 284 710 1,465 1,909 2,108 1,750Netherlands 396 361 1,024 327 1,756 1,693 2,372Hungary 823 977 1,901 929 1,738 1,863 2,367United Kingdom 895 572 1,940 736 1,615 1,648 1,568U.S.A 201 343 897 518 1,587 2,160 1,615Caribbean states1) 21 114 1,367 96 1,181 1,180 1,761Switzerland, Liechtenstein 856 522 700 427 1,160 1,214 785Poland 44 100 761 323 793 914 1,163Sweden 26 78 191 34 624 740 461Slovak Republic 55 118 493 360 587 1,272 639Slovenia 45 190 475 223 563 640 607Malta 12 246 433 267 501 501 552Denmark 5 25 837 262 461 470 735France 91 86 97 478 451 491 137Other countries 792 1,163 3,193 2,785 4,211 4,709 4,122Total 5,120 6,664 17,296 10,744 23,871 26,674 23,648
EU-121) 1,726 2,495 4,505 2,867 7,917 8,398 6,591EU-151) 2,652 3,170 7,473 3,899 10,617 11,257 9,355CEEC-191) 1,183 1,727 4,946 4,408 6,642 8,026 7,4111) See glossary (breakdown by regions) for definition.
Table 6.1
Capital Structure, Market Value and Employees of Austrian
Direct Investment Enterprises Abroad by Major Host Countries at End-2000
Austriandirectinvestors1)
Austriandirectinvestmententerprisesabroad
Claims on nonresidents Employees
Nominalcapital
Reserves Profitor lossbroughtforward
Profitor lossfor the year
Equity Othercapital(loans toaffiliatedenter-prises)
Total Marketvalue
Number EUR million 1,000
Germany 254 317 1,514 3,239 �341 321 4,734 336 5,070 3,014 34.9Czech Republic 234 276 1,465 332 � 70 181 1,909 199 2,108 1,750 49.8Netherlands 40 44 327 1,091 259 80 1,756 � 63 1,693 2,372 0.8Hungary 307 370 929 555 58 196 1,738 125 1,863 2,367 48.5United Kingdom 56 60 736 883 � 31 28 1,615 33 1,648 1,568 4.7U.S.A 78 83 518 973 142 � 47 1,587 573 2,160 1,615 12.0Caribbean states2) 11 13 96 830 111 144 1,181 � 1 1,180 1,761 0.0Switzerland, Liechtenstein 130 133 427 363 315 56 1,160 54 1,214 785 3.1Poland 93 115 323 469 � 74 76 793 121 914 1,163 20.9Sweden 14 14 34 581 10 0 624 117 740 461 0.3Other countries 737 802 4,376 1,987 102 311 6,775 1,309 8,084 6,792 73.52Total 917 2,227 10,744 11,301 480 1,345 23,871 2,804 26,675 23,648 248.6
EU-122) x 575 2,867 4,736 � 46 360 7,917 481 8,398 6,591 52.2EU-152) x 662 3,899 6,392 � 77 403 10,617 640 11,257 9,355 57.6CEEC-192) x 1,128 4,408 1,818 �238 654 6,642 1,384 8,026 7,411 162.41) Investments may have been made in more than one country, therefore country total does not equal total number of direct investors.2) See glossary (breakdown by regions) for definition.
16 Focus on Austria 2/2002�
Austrian Outward and Inward
Direct Investment

Inward direct investment
Table 5.2
Market Value of Inward Direct Investment by Major Home Countries
1993 1995 1999 2000
Market value Nominalcapital
Equity Total claims Market value
EUR million
Germany 5,079 7,778 10,575 6,892 15,472 15,295 15,062Switzerland, Liechtenstein 1,354 2,046 3,038 819 2,852 3,137 3,318U.S.A. 1,685 1,930 3,205 470 1,993 2,024 3,495Italy 1,499 1,169 1,910 590 1,650 1,692 2,078United Kingdom 523 687 1,243 301 1,527 1,881 1,136Netherlands 1,163 1,920 2,417 480 1,393 2,053 2,026France 580 595 1,015 258 1,340 1,399 1,300Spain 9 6 60 70 766 772 1,472Luxembourg 18 31 125 91 760 859 1,064Japan 317 524 697 219 759 841 799Sweden 292 332 1,323 107 632 636 1,460Belgium 65 48 2,944 80 624 582 2,016Gulf countries1) 59 396 545 175 459 460 475Russian Federation 27 128 12 84 178 239 91Norway 42 57 163 46 117 113 130Other countries 363 762 1,262 406 637 721 982Total 13,076 18,408 30,536 11,088 31,158 32,704 36,904
EU-121) 8,427 11,600 19,168 8,511 22,136 22,774 25,258EU-151) 9,327 12,894 21,908 8,971 24,342 25,389 27,952OECD - overseas countries1) 2,139 2,759 4,252 736 2,870 2,972 4,4981) See glossary (breakdown by regions) for definition.
Table 6.2
Capital Structure, Market Value and Employees of Foreign
Direct Investment Enterprises in Austria by Major Home Countries at End-2000
Non-residentdirectinvestors
Foreigndirectinvestmententerprisesin Austria1)
Liabilities to nonresidents Employees
Nominalcapital
Reserves Profitor lossbroughtforward
Profitor lossfor the year
Equity Othercapital(loans toaffiliatedenter-prises)
Total Marketvalue
Number EUR million 1,000
Germany 1,414 1,191 6,892 7,955 �440 1,065 15,472 � 177 15,295 15,062 127.7Switzerland, Liechtenstein 505 474 819 2,049 �109 93 2,852 285 3,137 3,318 36.8U.S.A. 209 200 470 664 273 586 1,993 31 2,024 3,495 23.9Italy 129 118 590 1,005 8 47 1,650 42 1,692 2,078 9.0United Kingdom 98 97 301 1,357 �116 � 15 1,527 354 1,881 1,136 8.2Netherlands 134 130 480 863 � 36 87 1,393 661 2,053 2,026 11.4France 119 131 258 849 47 186 1,340 59 1,399 1,300 8.0Spain 18 18 70 77 � 56 675 766 6 772 1,472 1.2Luxembourg 34 35 91 562 63 43 760 100 859 1,064 2.2Japan 54 61 219 470 42 27 759 82 841 799 3.9Other countries 335 314 898 1,338 161 250 2,646 103 2,751 5,154 18.9Total 3,049 2,588 11,088 17,189 �163 3,044 31,158 1,546 32,704 36,904 251.2
EU-122) 1,892 x 8,511 11,572 �163 2,216 22,136 638 22,774 25,258 163.0EU-152) 2,082 x 8,971 13,289 �280 2,362 24,342 1,047 25,389 27,952 178.5OECD - overseas countries2) 278 x 736 1,189 317 629 2,870 102 2,972 4,498 30.51) Investments may have been made in more than one country, therefore country total does not equal total number of direct investment enterprises.2) See glossary (breakdown by regions) for definition.
Focus on Austria 2/2002 17�
Austrian Outward and Inward
Direct Investment

Outward direct investment
Table 7.1
Credit Transactions between Austrian Direct Investors
and Their Direct Investment Enterprises Abroad by Major Host Countries at End-2000
Credits to Austria Credits to other countries Net claims
long-term short-term total long-term short-term total long-term short-term total
EUR million
Germany 63 15 78 213 201 414 151 185 336Czech Republic 19 25 44 175 69 244 156 44 200Netherlands 0 79 80 13 4 17 13 � 76 � 63Hungary 28 4 32 145 12 157 117 8 125United Kingdom 3 2 5 7 31 38 4 29 33U.S.A 0 1 1 350 224 574 350 223 573Caribbean states1) 1 0 1 0 0 0 � 1 0 � 1Switzerland, Liechtenstein 18 9 27 31 50 81 13 41 54Poland 0 11 11 108 24 132 108 13 121Sweden 0 0 0 21 96 117 21 96 117Other countries 12 6 18 1,175 153 1,328 1,163 146 1,309Total 144 153 296 2,239 861 3,100 2,095 708 2,804
EU-121) 70 95 165 373 273 646 304 178 482EU-151) 72 97 169 407 402 809 335 305 640CEEC-191) 51 45 96 1,348 132 1,481 1,298 87 1,3851) See glossary (breakdown by regions) for definition.
Table 8.1
Income from Outward Direct Investment by Major Host Countries at End-2000
Austrian share of Use of theAustrian share of profit
Cover of the Austrian share of loss Investmentproducing a
Profit forthe year
Loss forthe year
Profitbroughtforward
Lossbroughtforward
Netincome
TransfertoAustria
Reinvest-ment
Otheruseabroad
CapitaltransferfromAustria
Liqui-dationof equity
Bringingforwardto newaccount
Other Profit Loss
EUR million Number
Germany 449 �128 148 � 488 � 20 250 260 28 �61 � 5 � 481 �16 174 156Czech Republic 230 � 48 107 � 177 111 18 286 4 0 � 1 � 196 0 159 128Netherlands 126 � 46 269 � 10 339 9 382 1 0 � 0 � 53 0 30 19Hungary 263 � 67 172 � 114 254 65 355 7 � 1 � 5 � 166 � 0 255 137United Kingdom 55 � 27 170 � 201 � 3 1 175 0 0 � 0 � 178 0 38 22U.S.A 107 �154 520 � 379 95 5 611 4 0 �14 � 511 0 46 39Caribbean states1) 163 � 19 111 0 255 42 213 8 � 8 0 � 0 0 10 3Switzerland, Liechtenstein 101 � 45 347 � 33 371 39 364 6 � 1 � 1 � 39 � 1 103 36Poland 104 � 28 20 � 94 2 16 97 2 � 0 � 2 � 111 � 0 55 60Sweden 5 � 4 10 � 1 10 2 10 0 0 � 1 � 1 0 11 3Other countries 652 �341 824 � 722 412 163 1,170 18 � 4 �33 � 899 � 4 448 370Total 2,253 �908 2,698 �2,218 1,825 608 3,922 79 �75 �61 �2,634 �21 1,329 973
EU-121) 723 �363 562 � 608 314 292 874 30 �62 �29 � 775 �16 340 255EU-151) 799 �395 743 � 820 327 296 1,072 30 �64 �30 � 962 �16 396 286CEEC-191) 878 �224 627 � 865 416 143 1,219 22 � 2 �10 � 953 � 2 656 5131) See glossary (breakdown by regions) for definition.
18 Focus on Austria 2/2002�
Austrian Outward and Inward
Direct Investment

Inward direct investment
Table 7.2
Credit Transactions between Nonresident Direct Investors
and Their Direct Investment Enterprises in Austria byMajor Home Countries at End-2000
Credits to Austria Credits to other countries Net liabilities
long-term short-term total long-term short-term total long-term short-term total
EUR million
Germany 410 230 640 519 298 817 � 109 � 68 � 177Switzerland, Liechtenstein 298 82 381 35 60 96 263 22 285U.S.A. 159 39 198 17 150 167 142 �111 31Italy 30 31 60 7 11 18 23 20 42United Kingdom 376 58 434 32 48 80 344 10 354Netherlands 384 286 671 2 8 10 382 278 661France 33 174 207 3 145 148 30 29 59Spain 6 0 6 0 0 0 6 0 6Luxembourg 105 1 107 3 4 7 102 � 3 100Japan 16 67 83 2 0 2 14 67 81Other countries 230 101 331 17 209 226 213 �108 105Total 2,047 1,069 3,116 637 933 1,570 1,410 136 1,546
EU-121) 984 728 1,712 535 539 1,074 449 189 638EU-151) 1,442 808 2,251 567 637 1,204 875 171 1,047OECD - overseas countries1) 193 106 299 32 165 197 161 � 59 1021) See glossary (breakdown by regions) for definition.
Table 8.2
Income from Inward Direct Investment in Austria by Major Home Countries at End-2000
Nonresident share of Use of thenonresident share of profit
Cover of the nonresident share of loss Investmentproducing a
Profit forthe year
Loss forthe year
Profitbroughtforward
Lossbroughtforward
Netincome
Transferabroad
Reinvest-ment
OtheruseinAustria
CapitaltransfertoAustria
Liqui-dationof equity
Bringingforwardto newaccount
Other Profit Loss
EUR million Number
Germany 1,928 � 863 948 �1,389 625 656 1,589 517 � 4 � 5 �2,107 �21 941 576Switzerland, Liechtenstein 446 � 354 260 � 369 � 17 256 329 58 0 0 � 661 � 1 280 267U.S.A. 669 � 84 500 � 226 859 204 914 9 0 � 4 � 262 � 3 138 86Italy 88 � 41 63 � 55 55 66 73 5 0 � 1 � 87 0 60 83United Kingdom 102 � 118 81 � 197 � 131 40 104 1 0 0 � 274 � 3 54 50Netherlands 204 � 117 161 � 198 50 97 227 10 �25 �11 � 252 � 1 73 67France 210 � 23 110 � 63 234 88 193 31 0 0 � 77 0 86 53Spain 710 � 36 1 � 57 619 2 683 1 0 0 � 67 0 9 11Luxembourg 57 � 14 75 � 12 107 41 72 19 0 0 � 20 � 5 17 20Japan 43 � 16 109 � 67 70 4 130 0 0 0 � 64 0 45 23Other countries 437 � 184 457 � 295 415 255 591 5 0 � 1 � 421 �12 189 160Total 4,894 �1,850 2,765 �2,928 2,881 1,709 4,905 656 �29 �22 �4,292 �46 1,892 1,396
EU-121) 3,320 �1,105 1,646 �1,809 2,053 994 3,188 582 �29 �17 �2,640 �27 1,214 831EU-151) 3,628 �1,267 1,802 �2,082 2,083 1,177 3,408 584 �29 �17 �3,012 �30 1,324 919OECD - overseas countries1) 742 � 113 649 � 332 946 231 1,085 12 0 � 4 � 376 � 3 196 1141) See glossary (breakdown by regions) for definition.
Focus on Austria 2/2002 19�
Austrian Outward and Inward
Direct Investment
Outward direct investment
Table 9.1
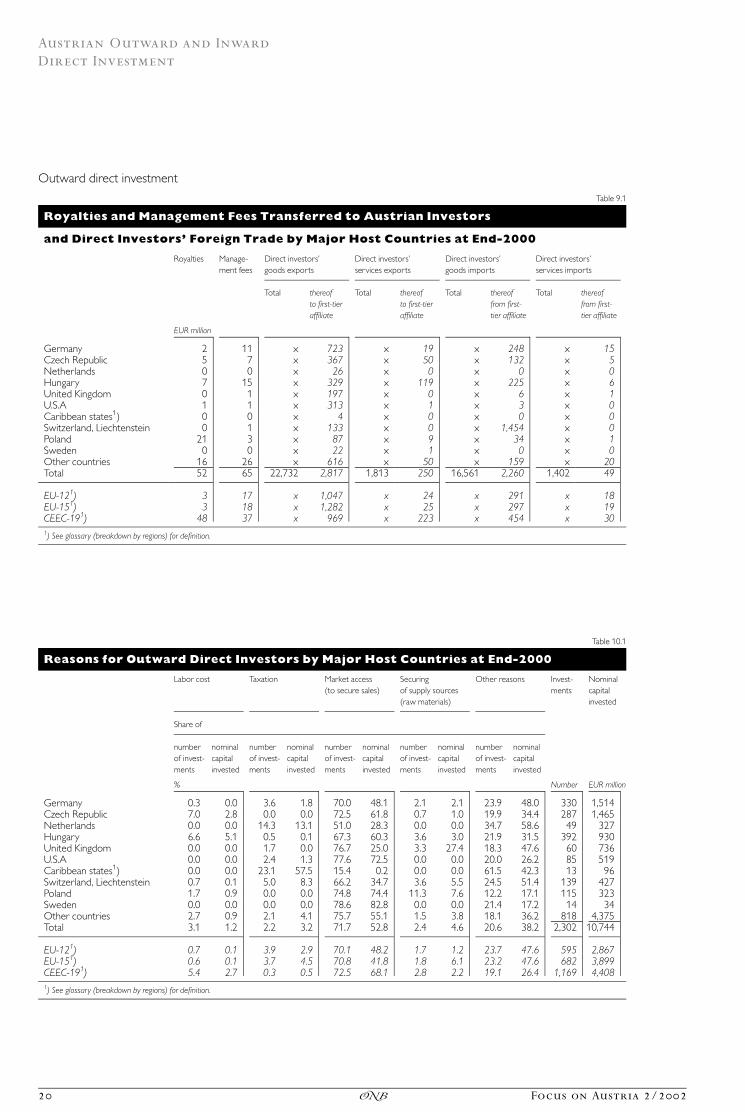
Royalties and Management Fees Transferred to Austrian Investors
and Direct Investors� Foreign Trade by Major Host Countries at End-2000
Royalties Manage-ment fees
Direct investorsZgoods exports
Direct investorsZservices exports
Direct investorsZgoods imports
Direct investorsZservices imports
Total thereofto first-tieraffiliate
Total thereofto first-tieraffiliate
Total thereoffrom first-tier affiliate
Total thereoffrom first-tier affiliate
EUR million
Germany 2 11 x 723 x 19 x 248 x 15Czech Republic 5 7 x 367 x 50 x 132 x 5Netherlands 0 0 x 26 x 0 x 0 x 0Hungary 7 15 x 329 x 119 x 225 x 6United Kingdom 0 1 x 197 x 0 x 6 x 1U.S.A 1 1 x 313 x 1 x 3 x 0Caribbean states1) 0 0 x 4 x 0 x 0 x 0Switzerland, Liechtenstein 0 1 x 133 x 0 x 1,454 x 0Poland 21 3 x 87 x 9 x 34 x 1Sweden 0 0 x 22 x 1 x 0 x 0Other countries 16 26 x 616 x 50 x 159 x 20Total 52 65 22,732 2,817 1,813 250 16,561 2,260 1,402 49
EU-121) 3 17 x 1,047 x 24 x 291 x 18EU-151) 3 18 x 1,282 x 25 x 297 x 19CEEC-191) 48 37 x 969 x 223 x 454 x 301) See glossary (breakdown by regions) for definition.
Table 10.1
Reasons for Outward Direct Investors by Major Host Countries at End-2000
Labor cost Taxation Market access(to secure sales)
Securingof supply sources(raw materials)
Other reasons Invest-ments
Nominalcapitalinvested
Share of
numberof invest-ments
nominalcapitalinvested
numberof invest-ments
nominalcapitalinvested
numberof invest-ments
nominalcapitalinvested
numberof invest-ments
nominalcapitalinvested
numberof invest-ments
nominalcapitalinvested
% Number EUR million
Germany 0.3 0.0 3.6 1.8 70.0 48.1 2.1 2.1 23.9 48.0 330 1,514Czech Republic 7.0 2.8 0.0 0.0 72.5 61.8 0.7 1.0 19.9 34.4 287 1,465Netherlands 0.0 0.0 14.3 13.1 51.0 28.3 0.0 0.0 34.7 58.6 49 327Hungary 6.6 5.1 0.5 0.1 67.3 60.3 3.6 3.0 21.9 31.5 392 930United Kingdom 0.0 0.0 1.7 0.0 76.7 25.0 3.3 27.4 18.3 47.6 60 736U.S.A 0.0 0.0 2.4 1.3 77.6 72.5 0.0 0.0 20.0 26.2 85 519Caribbean states1) 0.0 0.0 23.1 57.5 15.4 0.2 0.0 0.0 61.5 42.3 13 96Switzerland, Liechtenstein 0.7 0.1 5.0 8.3 66.2 34.7 3.6 5.5 24.5 51.4 139 427Poland 1.7 0.9 0.0 0.0 74.8 74.4 11.3 7.6 12.2 17.1 115 323Sweden 0.0 0.0 0.0 0.0 78.6 82.8 0.0 0.0 21.4 17.2 14 34Other countries 2.7 0.9 2.1 4.1 75.7 55.1 1.5 3.8 18.1 36.2 818 4,375Total 3.1 1.2 2.2 3.2 71.7 52.8 2.4 4.6 20.6 38.2 2,302 10,744
EU-121) 0.7 0.1 3.9 2.9 70.1 48.2 1.7 1.2 23.7 47.6 595 2,867EU-151) 0.6 0.1 3.7 4.5 70.8 41.8 1.8 6.1 23.2 47.6 682 3,899CEEC-191) 5.4 2.7 0.3 0.5 72.5 68.1 2.8 2.2 19.1 26.4 1,169 4,4081) See glossary (breakdown by regions) for definition.
20 Focus on Austria 2/2002�
Austrian Outward and Inward
Direct Investment

Inward direct investment
Table 9.2
Royalties and Management Fees Transferred to Nonresident Investors
and Direct Investors� Foreign Trade by Major Home Countries at End-2000
Royalties Manage-ment fees
Direct investorsZgoods exports
Direct investorsZservices exports
Direct investorsZgoods imports
Direct investorsZservices imports
Total thereofto parent
Total thereofto parent
Total thereoffrom parent
Total thereoffrom parent
EUR million
Germany 70 44 x 5,323 x 660 x 12,475 x 642Switzerland, Liechtenstein 28 15 x 1,283 x 110 x 1,038 x 44U.S.A. 90 31 x 2,319 x 264 x 2,523 x 177Italy 2 4 x 168 x 33 x 248 x 324United Kingdom 26 9 x 85 x 23 x 404 x 78Netherlands 5 98 x 1,337 x 20 x 1,222 x 21France 8 13 x 203 x 29 x 973 x 13Spain 0 1 x 9 x 1 x 10 x 2Luxembourg 0 0 x 15 x 0 x 177 x 10Japan 11 2 x 226 x 11 x 955 x 0Other countries 18 23 x 808 x 63 x 1,641 x 131Total 258 240 25,049 11,776 2,843 1,214 37,338 21,666 2,811 1,442
EU-121) 85 162 x 7,111 x 753 x 15,416 x 1,027EU-151) 123 173 x 7,436 x 785 x 16,555 x 1,113OECD - overseas coutnries1) 102 35 x 2,886 x 283 x 3,544 x 1831) See glossary (breakdown by regions) for definition.
Table 10.2
Reasons for Inward Direct Investors by Major Home Countries at End-2000
Labor costs Taxation Market access(to secure sales)
Securingof supply sources(raw materials)
Other reasons Invest-ments
Nominalcapitalinvested
Share of
numberof invest-ments
nominalcapitalinvested
numberof invest-ments
nominalcapitalinvested
numberof invest-ments
nominalcapitalinvested
numberof invest-ments
nominalcapitalinvested
numberof invest-ments
nominalcapitalinvested
% Number EUR million
Germany 1.5 0.2 1.5 0.4 68.9 62.7 2.3 0.8 25.9 35.9 1,517 6,892Switzerland, Liechtenstein 1.8 2.0 3.3 1.7 51.7 47.0 1.6 11.4 41.5 38.0 547 819U.S.A. 0.4 3.3 2.2 0.7 67.9 60.3 0.0 0.0 29.5 35.7 224 470Italy 0.0 0.0 4.9 0.2 62.9 86.2 2.8 0.5 29.4 13.1 143 590United Kingdom 1.0 0.1 1.9 0.0 67.3 74.1 2.9 3.2 26.9 22.6 104 301Netherlands 1.4 0.2 2.1 7.4 58.6 36.6 1.4 4.9 36.4 50.9 140 480France 0.0 0.0 0.7 0.3 79.9 67.9 1.4 1.4 18.0 30.3 139 258Spain 0.0 0.0 5.0 6.1 55.0 79.3 5.0 0.6 35.0 14.0 20 71Luxembourg 2.7 0.6 2.7 0.1 40.5 17.4 0.0 0.0 54.1 81.9 37 91Japan 0.0 0.0 2.9 6.6 72.1 87.9 1.5 0.9 23.5 4.6 68 219Other countries 0.0 0.0 1.7 0.2 61.9 50.2 2.9 2.1 33.5 47.5 349 898Total 1.1 0.4 2.1 0.9 64.6 61.2 2.0 1.9 30.2 35.6 3,288 11,088
EU-121) 1.2 0.2 1.7 0.8 68.1 63.0 2.2 1.1 26.8 34.9 2,045 8,511EU-151) 1.2 0.2 1.7 0.7 68.4 63.5 2.2 1.2 26.4 34.4 2,243 8,971OECD - overseas countries1) 0.3 2.2 2.3 2.4 67.4 67.8 1.0 1.2 29.0 26.4 310 7361) See glossary (breakdown by regions) for definition.
Focus on Austria 2/2002 21�
Austrian Outward and Inward
Direct Investment
Outward direct investment
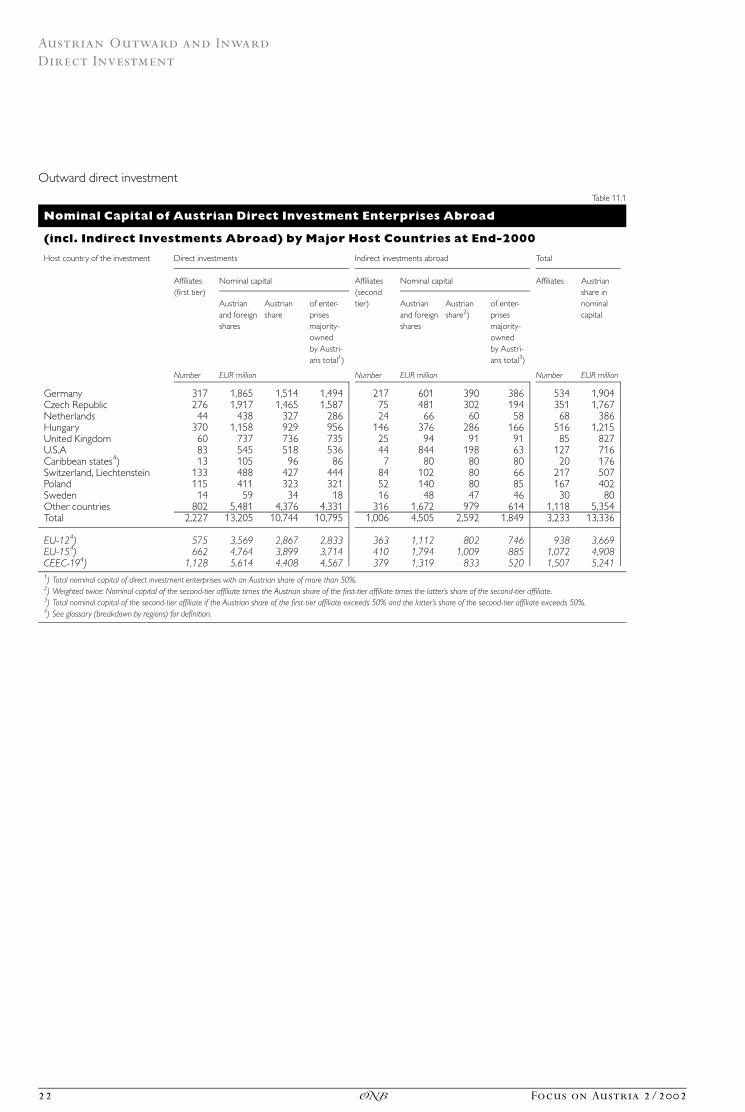
Table 11.1
Nominal Capital of Austrian Direct Investment Enterprises Abroad
(incl. Indirect Investments Abroad) by Major Host Countries at End-2000
Host country of the investment Direct investments Indirect investments abroad Total
Affiliates(first tier)
Nominal capital Affiliates(secondtier)
Nominal capital Affiliates Austrianshare innominalcapital
Austrianand foreignshares
Austrianshare
of enter-prisesmajority-ownedby Austri-ans total1)
Austrianand foreignshares
Austrianshare2)
of enter-prisesmajority-ownedby Austri-ans total3)
Number EUR million Number EUR million Number EUR million
Germany 317 1,865 1,514 1,494 217 601 390 386 534 1,904Czech Republic 276 1,917 1,465 1,587 75 481 302 194 351 1,767Netherlands 44 438 327 286 24 66 60 58 68 386Hungary 370 1,158 929 956 146 376 286 166 516 1,215United Kingdom 60 737 736 735 25 94 91 91 85 827U.S.A 83 545 518 536 44 844 198 63 127 716Caribbean states4) 13 105 96 86 7 80 80 80 20 176Switzerland, Liechtenstein 133 488 427 444 84 102 80 66 217 507Poland 115 411 323 321 52 140 80 85 167 402Sweden 14 59 34 18 16 48 47 46 30 80Other countries 802 5,481 4,376 4,331 316 1,672 979 614 1,118 5,354Total 2,227 13,205 10,744 10,795 1,006 4,505 2,592 1,849 3,233 13,336
EU-124) 575 3,569 2,867 2,833 363 1,112 802 746 938 3,669EU-154) 662 4,764 3,899 3,714 410 1,794 1,009 885 1,072 4,908CEEC-194) 1,128 5,614 4,408 4,567 379 1,319 833 520 1,507 5,2411) Total nominal capital of direct investment enterprises with an Austrian share of more than 50%.2) Weighted twice: Nominal capital of the second-tier affiliate times the Austrian share of the first-tier affiliate times the latter�s share of the second-tier affiliate.3) Total nominal capital of the second-tier affiliate if the Austrian share of the first-tier affiliate exceeds 50% and the latter�s share of the second-tier affiliate exceeds 50%.4) See glossary (breakdown by regions) for definition.
22 Focus on Austria 2/2002�
Austrian Outward and Inward
Direct Investment

Inward direct investment
Table 11.2
Nominal Capital of Foreign Direct Investment Enterprises in Austria
(incl. Indirect Investments in Austria) by Major Home Countries at End-2000
Home country of the investment Direct investments Indirect investments in Austria Total
Affiliates(first tier)1)
Nominal capital Indirectdirectinvestmententerprises
Nominal capital Affiliates1) Foreignshare innominalcapital
ForeignandAustrianshares
Foreignshare
of enter-prisesmajority-owned bynon-residentstotal2)
ForeignandAustrianshares
Foreignshare3)
of enter-prisesmajority-owned bynon-residentstotal4)
Number EUR million Number EUR million Number EUR million
Germany 1,191 7,890 6,892 6,722 624 1,729 781 599 1,815 7,673Switzerland, Liechtenstein 474 1,169 819 770 228 374 199 193 702 1,018U.S.A. 200 522 470 447 72 107 77 65 272 547Italy 118 1,478 590 258 40 241 75 59 158 665United Kingdom 97 354 301 309 57 220 95 82 154 396Netherlands 130 573 480 481 133 163 113 85 263 592France 131 353 258 238 66 150 67 45 197 324Spain 18 71 70 70 4 1 1 1 22 71Luxembourg 35 98 91 92 15 23 22 22 50 113Japan 61 231 219 215 12 22 9 5 73 228Other countries 314 1,261 898 759 132 463 249 245 446 1,147Total 2,588 14,000 11,088 10,360 1,383 3,492 1,687 1,402 3,971 12,775
EU-125) x 10,616 8,511 7,984 x 2,498 1,168 930 x 9,679EU-155) x 11,148 8,971 8,449 x 2,743 1,275 1,023 x 10,246OECD - overseas countries5) x 806 736 713 x 132 87 72 x 8231) Investments may have been made by more than one country, therefore country total does not equal total number of first-tier affiliates.2) Total nominal capital of direct investment enterprises with a foreign share of more than 50%.3) Weighted twice: Nominal capital of the second-tier affiliate if the foreign share of the first-tier affiliate exceeds 50% and the latter�s share of the second-tier affiliate exceeds 50%.4) Total nominal capital of the second-tier affiliate if the foreign share of the first-tier affiliate exceeds 50% and the latter�s share of the second-tier affiliate exceeds 50%.5) See glossary (breakdown by regions) for definition.
Focus on Austria 2/2002 23�
Austrian Outward and Inward
Direct Investment

Outward direct investment
Table 12.1
Number of Employees in Austrian Direct Investment Enterprises Abroad
(incl. Indirect Investments Abroad) by Major Host Countries at End-2000
Host country of the investment Direct investments Indirect investments abroad Total
Affiliates(first tier)
Number of employees Affiliates(second tier)
Number of employees Affiliates Employeesweightedby nominalcapital share
unweighted weightedby Austriannominalcapitalshare
of enter-prisesmajority-owned byAustrians,un-weighted1)
unweighted weightedby Austriannominalcapitalshare2)
of enter-prisesmajority-owned byAustrians,un-weighted3)
Number 1,000 Number 1,000 Number 1,000
Germany 317 49.7 34.9 43.8 217 18.4 11.9 11.2 534 46.7Czech Republic 276 66.1 49.8 53.5 75 11.1 6.7 4.3 351 56.5Netherlands 44 1.1 0.8 0.5 24 1.7 1.7 1.6 68 2.5Hungary 370 56.5 48.5 50.3 146 10.5 11.1 8.9 516 59.6United Kingdom 60 4.8 4.7 4.7 25 2.6 2.2 2.0 85 6.9U.S.A 83 12.5 12.0 12.3 44 3.1 2.8 2.8 127 14.9Caribbean states4) 13 0.0 0.0 0.0 7 0.0 0.0 0.0 20 0.0Switzerland, Liechtenstein 133 3.7 3.1 3.4 84 2.1 1.6 1.3 217 4.6Poland 115 29.9 20.9 24.3 52 8.3 4.2 4.8 167 25.2Sweden 14 0.4 0.3 0.3 16 1.9 1.8 1.8 30 2.2Other countries 802 104.4 73.5 68.9 316 23.3 12.5 11.0 1,118 86.1Total 2,227 329.0 248.6 262.0 1,006 83.1 56.5 49.6 3,233 305.1
EU-124) 575 71.2 52.2 58.4 363 26.3 18.4 17.5 938 70.6EU-154) 662 76.7 57.6 63.7 410 36.8 23.5 21.5 1,072 81.1CEEC-194) 1,128 217.3 162.4 171.3 379 35.5 25.5 20.9 1,507 187.91) Total number of employees of direct investment enterprises with an Austrian share of more than 50%.2) Weighted twice: All employees of the second-tier affiliate times the Austrian share of the first-tier affiliate times the latter�s share of the second-tier affiliate.3) Total number of employees of the second-tier affiliate if the Austrian share of the first-tier affiliate exceeds 50% and the latter�s share of the second-tier affiliate exceeds 50%.4) See glossary (breakdown by regions) for definition.
24 Focus on Austria 2/2002�
Austrian Outward and Inward
Direct Investment
Inward direct investment
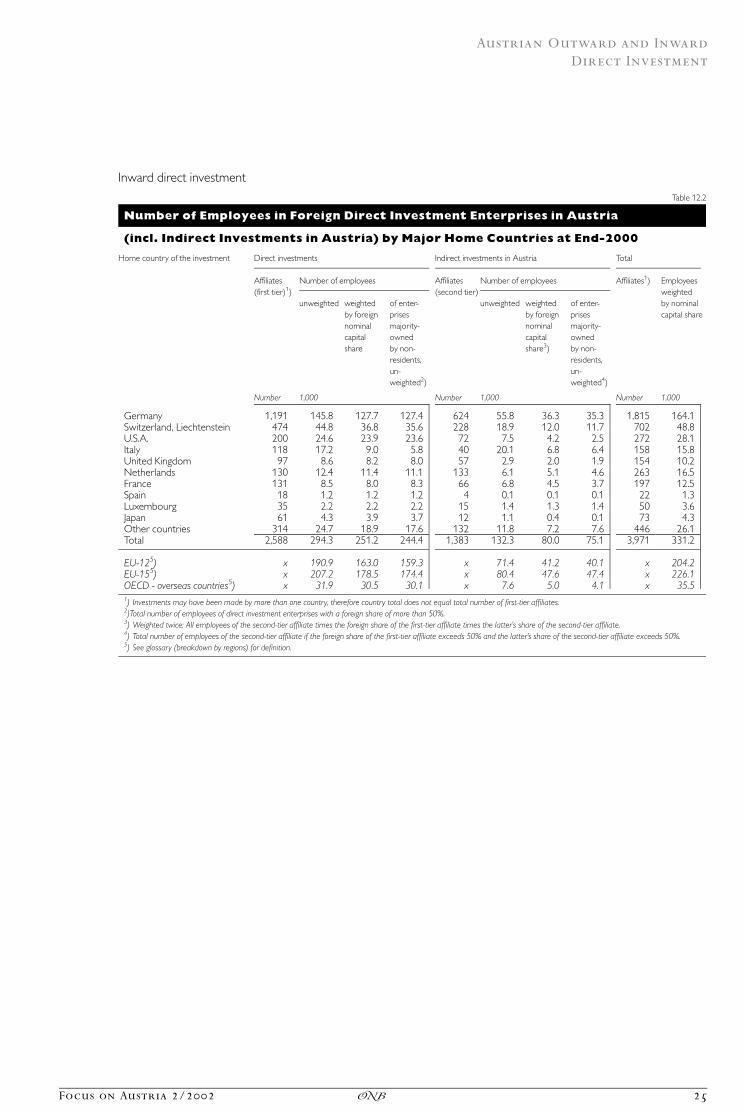
Table 12.2
Number of Employees in Foreign Direct Investment Enterprises in Austria
(incl. Indirect Investments in Austria) by Major Home Countries at End-2000
Home country of the investment Direct investments Indirect investments in Austria Total
Affiliates(first tier)1)
Number of employees Affiliates(second tier)
Number of employees Affiliates1) Employeesweightedby nominalcapital share
unweighted weightedby foreignnominalcapitalshare
of enter-prisesmajority-ownedby non-residents,un-weighted2)
unweighted weightedby foreignnominalcapitalshare3)
of enter-prisesmajority-ownedby non-residents,un-weighted4)
Number 1,000 Number 1,000 Number 1,000
Germany 1,191 145.8 127.7 127.4 624 55.8 36.3 35.3 1,815 164.1Switzerland, Liechtenstein 474 44.8 36.8 35.6 228 18.9 12.0 11.7 702 48.8U.S.A. 200 24.6 23.9 23.6 72 7.5 4.2 2.5 272 28.1Italy 118 17.2 9.0 5.8 40 20.1 6.8 6.4 158 15.8United Kingdom 97 8.6 8.2 8.0 57 2.9 2.0 1.9 154 10.2Netherlands 130 12.4 11.4 11.1 133 6.1 5.1 4.6 263 16.5France 131 8.5 8.0 8.3 66 6.8 4.5 3.7 197 12.5Spain 18 1.2 1.2 1.2 4 0.1 0.1 0.1 22 1.3Luxembourg 35 2.2 2.2 2.2 15 1.4 1.3 1.4 50 3.6Japan 61 4.3 3.9 3.7 12 1.1 0.4 0.1 73 4.3Other countries 314 24.7 18.9 17.6 132 11.8 7.2 7.6 446 26.1Total 2,588 294.3 251.2 244.4 1,383 132.3 80.0 75.1 3,971 331.2
EU-125) x 190.9 163.0 159.3 x 71.4 41.2 40.1 x 204.2EU-155) x 207.2 178.5 174.4 x 80.4 47.6 47.4 x 226.1OECD - overseas countries5) x 31.9 30.5 30.1 x 7.6 5.0 4.1 x 35.51) Investments may have been made by more than one country, therefore country total does not equal total number of first-tier affiliates.2)Total number of employees of direct investment enterprises with a foreign share of more than 50%.3) Weighted twice: All employees of the second-tier affiliate times the foreign share of the first-tier affiliate times the latter�s share of the second-tier affiliate.4) Total number of employees of the second-tier affiliate if the foreign share of the first-tier affiliate exceeds 50% and the latter�s share of the second-tier affiliate exceeds 50%.5) See glossary (breakdown by regions) for definition.
Focus on Austria 2/2002 25�
Austrian Outward and Inward
Direct Investment

Outward direct investment
Table 13.1
Capital Structure, Market Value and Employees
of Austrian Direct Investment Enterprises Abroad by Foreign Economic Sectors at End-2000
Economic sectorsto which the surveyed foreign enterprisesbelong
Austriandirectinvestmententerprisesabroad
Claims on nonresidents Employees
Nominalcapital
Reserves Profitor lossbroughtforward
Profit orlossfor the year
Equity Othercapital(loans toaffiliatedenter-prises)
Total Marketvalue
Number EUR million 1,000
Mining and quarrying and electricity,gas and water 33 168 79 2 15 264 69 333 94 2.3
Manufacturing and construction 877 2,891 1,697 109 398 5,095 1,694 6,789 5,530 142.1Food products 69 323 128 � 81 53 424 62 486 557 11.9Textile products, apparel and leather 30 46 13 � 9 � 1 49 30 79 36 7.0Wood and wood products 30 180 131 � 52 � 40 219 24 243 364 5.3Paper, publishing and printing 55 265 147 � 1 46 457 70 527 401 8.0Refined petroleum products, chemicals,rubber and plastic products 134 538 253 117 177 1,085 127 1,212 1,487 19.9Nonmetallic mineral products 100 459 135 51 71 715 435 1,150 587 12.3Metal products 98 264 132 87 44 526 788 1,314 502 10.8Mechanical products 106 270 89 60 37 456 33 490 414 9.8Electrical and optical equipment 103 204 379 35 35 652 40 692 598 23.5Transport equipment 24 83 71 � 23 � 26 105 10 116 193 8.3Manufacturing n.e.c. 28 39 19 3 � 2 59 14 73 49 5.1Construction 100 221 200 � 77 3 347 60 407 341 20.3
Service 1,317 7,684 9,525 370 932 18,511 1,041 19,553 18,024 104.2Trade and repairs 569 1,594 962 � 50 71 2,576 633 3,209 2,456 40.1Hotels and restaurants 30 186 77 � 95 21 190 41 231 352 2.9Transport and communication 33 71 10 � 25 � 2 54 39 92 60 2.2Financial intermediation 235 2,500 2,399 278 488 5,665 � 82 5,582 7,379 34.4Real estate and business activities 402 3,248 6,054 222 251 9,775 383 10,158 7,306 19.9Other services 48 85 23 39 105 252 28 280 470 4.8Total 2,227 10,744 11,301 480 1,345 23,871 2,804 26,675 23,648 248.6
26 Focus on Austria 2/2002�
Austrian Outward and Inward
Direct Investment

Inward direct investment
Table 13.2
Capital Structure, Market Value and Employees
of Foreign Direct Investment Enterprises in Austria by Austrian Economic Sectors at End-2000
Economic sectorsto which the surveyed Austrian enterprisesbelong
Foreigndirectinvestmententerprisesin Austria
Liabilities to nonresidents Employees
Nominalcapital
Reserves Profitor lossbroughtforward
Profit orlossfor the year
Equity Othercapital(loans toaffiliatedenter-prises)
Total Marketvalue
Number EUR million 1,000
Mining and quarrying and electricity,gas and water 17 100 175 � 3 24 297 19 316 87 0.6
Manufacturing and construction 669 2,054 4,418 693 1,562 8,726 289 9,016 13,223 120.5Food products 59 136 239 � 31 49 392 276 668 569 9.3Textile products, apparel and leather 48 80 76 10 16 182 70 252 233 7.6Wood and wood products 16 11 13 � 3 18 39 11 50 144 1.8Paper, publishing and printing 48 125 566 104 75 870 � 42 828 989 4.8Refined petroleum products, chemicals,rubber and plastic products 102 469 1,274 310 406 2,459 � 74 2,385 3,078 17.6Nonmetallic mineral products 34 125 232 68 58 484 � 10 474 545 3.5Metal products 87 165 281 � 9 83 518 53 572 638 13.5Mechanical products 125 281 421 35 147 884 33 917 1,411 17.4Electrical and optical equipment 74 439 1,151 187 510 2,287 6 2,293 4,333 28.0Transport equipment 18 116 124 57 153 450 � 38 412 1,038 11.1Manufacturing n.e.c. 17 59 14 � 14 24 84 2 86 90 1.8Construction 41 48 27 � 20 23 78 3 80 155 4.1
Services 1,902 8,934 12,597 �853 1,458 22,135 1,238 23,373 23,594 130.1Trade and repairs 1,132 3,271 2,115 � 36 411 5,760 571 6,331 5,919 71.6Hotels and restaurants 57 175 131 � 79 10 237 22 259 206 6.1Transport and communication 101 573 1,583 �541 � 317 1,298 478 1,775 1,020 13.2Financial intermediation 106 1,689 3,750 11 395 5,845 10 5,856 4,911 20.8Real estate and business activities 468 3,194 4,987 �194 964 8,951 141 9,092 11,424 17.1Other services 38 31 30 � 14 � 4 44 16 60 115 1.3Total 2,588 11,088 17,189 �163 3,044 31,158 1,546 32,704 36,904 251.2
Focus on Austria 2/2002 27�
Austrian Outward and Inward
Direct Investment
Outward direct investment
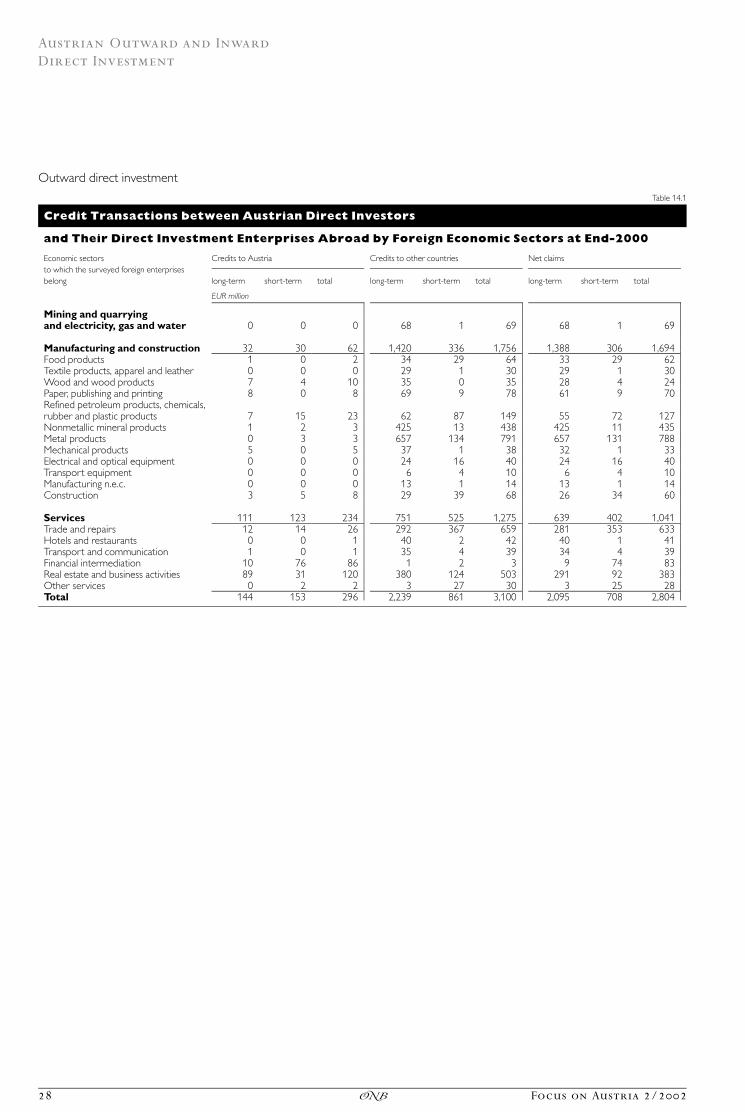
Table 14.1
Credit Transactions between Austrian Direct Investors
and Their Direct Investment Enterprises Abroad by Foreign Economic Sectors at End-2000
Economic sectorsto which the surveyed foreign enterprisesbelong
Credits to Austria Credits to other countries Net claims
long-term short-term total long-term short-term total long-term short-term total
EUR million
Mining and quarryingand electricity, gas and water 0 0 0 68 1 69 68 1 69
Manufacturing and construction 32 30 62 1,420 336 1,756 1,388 306 1,694Food products 1 0 2 34 29 64 33 29 62Textile products, apparel and leather 0 0 0 29 1 30 29 1 30Wood and wood products 7 4 10 35 0 35 28 � 4 24Paper, publishing and printing 8 0 8 69 9 78 61 9 70Refined petroleum products, chemicals,rubber and plastic products 7 15 23 62 87 149 55 72 127Nonmetallic mineral products 1 2 3 425 13 438 425 11 435Metal products 0 3 3 657 134 791 657 131 788Mechanical products 5 0 5 37 1 38 32 1 33Electrical and optical equipment 0 0 0 24 16 40 24 16 40Transport equipment 0 0 0 6 4 10 6 4 10Manufacturing n.e.c. 0 0 0 13 1 14 13 1 14Construction 3 5 8 29 39 68 26 34 60
Services 111 123 234 751 525 1,275 639 402 1,041Trade and repairs 12 14 26 292 367 659 281 353 633Hotels and restaurants 0 0 1 40 2 42 40 1 41Transport and communication 1 0 1 35 4 39 34 4 39Financial intermediation 10 76 86 1 2 3 � 9 � 74 � 83Real estate and business activities 89 31 120 380 124 503 291 92 383Other services 0 2 2 3 27 30 3 25 28Total 144 153 296 2,239 861 3,100 2,095 708 2,804
28 Focus on Austria 2/2002�
Austrian Outward and Inward
Direct Investment

Inward direct investment
Table 14.2
Credit Transactions between Nonresident Direct Investors
and Their Direct Investment Enterprises in Austria by Austrian Economic Sectors at End-2000
Economic sectorsto which the surveyed Austrian enterprisesbelong
Credits to Austria Credits to other countries Net liabilities
long-term short-term total long-term short-term total long-term short-term total
EUR million
Mining and quarryingand electricity, gas and water 6 13 20 0 0 0 6 13 19
Manufacturing and construction 439 398 836 124 422 547 314 � 25 289Food products 58 278 336 0 60 60 58 218 276Textile products, apparel and leather 63 14 77 2 4 6 61 9 70Wood and wood products 11 0 11 0 0 0 11 0 11Paper, publishing and printing 4 4 8 0 50 50 4 � 46 � 42Refined petroleum products, chemicals,rubber and plastic products 98 12 111 25 159 185 73 �147 � 74Nonmetallic mineral products 5 6 10 0 20 20 5 � 15 � 10Metal products 71 1 72 0 18 19 71 � 17 53Mechanical products 60 27 87 38 16 54 22 11 33Electrical and optical equipment 55 49 104 42 56 98 13 � 7 6Transport equipment 0 3 3 15 26 41 � 15 � 24 � 38Manufacturing n.e.c. 10 3 13 0 11 11 10 � 8 2Construction 5 1 6 1 1 3 3 � 0 3
Services 1,602 659 2,261 512 510 1,023 1,089 148 1,238Trade and repairs 491 307 799 29 199 228 462 109 571Hotels and restaurants 54 4 58 34 2 37 20 2 22Transport and communication 455 30 486 4 3 8 451 27 478Financial intermediation 85 224 309 289 9 298 � 204 215 10Real estate and business activities 498 91 590 152 297 449 346 �205 141Other services 18 2 20 3 1 4 15 1 16Total 2,047 1,069 3,116 637 933 1,570 1,410 136 1,546
Focus on Austria 2/2002 29�
Austrian Outward and Inward
Direct Investment

Outward direct investment
Table 15.1
Income from Austrian Direct Investment Enterprises Abroad by Foreign Economic Sectors
at End-2000
Economic sectorsto which the surveyedforeign enterprisesbelong
Austrian share of Use of the Austrian shareof profit
Cover of the Austrian shareof loss
Investmentproducing a
Profit forthe year
Loss forthe year
Profitbroughtforward
Lossbroughtforward
Netincome
TransfertoAustria
Re-invest-ment
Otheruseabroad
CapitaltransferfromAustria
Liqui-dationof equity
Bringingforwardto newaccount
Other Profit Loss
EUR million Number
Mining and quarryingand electricity,gas and water 20 � 5 7 � 5 17 11 15 0 0 0 � 10 0 21 14
Manufacturingand construction 727 �329 694 � 584 507 198 1,103 28 � 2 �48 � 775 � 2 542 357Food products 68 � 15 19 � 99 � 28 16 45 20 � 0 � 3 � 108 0 37 33Textile products,apparel and leather 7 � 8 5 � 13 � 10 3 7 0 0 � 0 � 20 � 0 16 16Wood and wood products 39 � 79 14 � 66 � 92 5 37 1 0 0 � 135 0 16 14Paper, publishingand printing 60 � 14 28 � 29 45 17 62 0 0 � 0 � 34 0 40 19Refined petroleum products,chemicals, rubberand plastic products 213 � 36 178 � 61 294 89 287 3 0 � 0 � 85 0 90 48Nonmetallicmineral products 82 � 11 78 � 28 122 16 132 1 0 � 1 � 28 0 67 38Metal products 62 � 18 149 � 62 130 12 181 1 0 � 1 � 62 0 59 40Mechanical products 54 � 16 98 � 38 97 7 135 1 � 1 � 0 � 43 � 1 74 34Electrical and opticalequipment 81 � 46 87 � 52 70 22 135 0 0 � 2 � 86 0 59 46Transport equipment 26 � 52 5 � 28 � 49 6 25 0 0 �40 � 38 0 14 10Manufacturing n.e.c. 3 � 5 10 � 7 1 0 12 0 0 0 � 11 0 16 12Construction 32 � 29 23 � 101 � 74 4 47 0 0 0 � 125 0 54 47
Services 1,507 �574 1,998 �1,628 1,302 399 2,804 51 �73 �13 �1,849 �19 766 602Trade and repairs 274 �204 572 � 622 21 37 739 5 � 3 � 6 � 748 � 3 322 252Hotels and restaurants 26 � 5 7 � 102 � 74 2 26 0 0 � 1 � 100 0 17 15Transportand communication 7 � 9 5 � 30 � 27 0 8 0 0 0 � 37 0 20 16Financial intermediation 610 �123 648 � 370 766 187 960 17 � 3 � 2 � 393 0 160 94Real estateand business activities 483 �233 697 � 476 472 84 995 24 �67 � 4 � 546 �16 222 202Other services 107 � 2 69 � 29 144 89 75 6 0 0 � 25 0 25 23Total 2,253 �908 2,698 �2,218 1,825 608 3,922 79 �75 �61 �2,634 �21 1,329 973
30 Focus on Austria 2/2002�
Austrian Outward and Inward
Direct Investment

Inward direct investment
Table 15.2
Income from Foreign Direct Investment Enterprises in Austria by Austrian Economic Sectors
at End-2000
Economic sectorsto which the surveyedAustrian enterprisesbelong
Nonresident share of Use of the nonresident shareof profit
Cover of the nonresident shareof loss
Investmentproducing a
Profit forthe year
Loss forthe year
Profitbroughtforward
Lossbroughtforward
Netincome
Transferabroad
Re-invest-ment
Otheruse inAustria
CapitaltransfertoAustria
Liqui-dationof equity
Bringingforwardto newaccount
Other Profit Loss
EUR million Number
Mining and quarryingand electricity,gas and water 27 � 3 21 � 23 22 4 27 1 0 � 2 � 9 0 12 10
Manufacturingand construction 1.727 � 166 1.217 � 524 2.255 796 1.706 315 � 4 � 0 � 541 �21 581 292Food products 89 � 41 85 � 116 17 29 112 2 � 0 0 � 125 0 40 34Textile products,apparel and leather 23 � 7 32 � 22 26 6 46 2 0 0 � 27 0 41 25Wood and wood products 19 � 1 6 � 9 15 4 9 9 0 0 � 8 � 0 20 8Paper, publishing and printing 82 � 7 123 � 19 179 26 148 26 � 4 0 � 20 � 2 45 21Refined petroleum products,chemicals, rubberand plastic products 455 � 49 349 � 39 716 258 501 25 0 0 � 57 �11 114 29Nonmetallicmineral products 67 � 9 105 � 37 126 11 93 66 0 0 � 41 � 3 31 18Metal products 91 � 8 47 � 56 73 38 59 33 0 0 � 54 � 2 83 36Mechanical products 163 � 15 145 � 110 182 57 199 26 0 � 0 � 97 � 3 105 56Electrical and opticalequipment 525 � 15 235 � 48 698 251 399 99 0 0 � 49 � 0 49 35Transport equipment 153 0 67 � 10 210 104 88 19 0 0 � 1 0 17 2Manufacturing n.e.c. 29 � 6 16 � 29 10 1 37 2 0 0 � 30 0 11 8Construction 31 � 8 9 � 29 3 13 15 7 0 0 � 32 0 25 20
Services 3.140 �1.681 1.527 �2.381 605 909 3.172 340 �25 �20 �3.743 �25 1.299 1.094Trade and repairs 899 � 488 744 � 780 374 272 964 252 � 0 �14 �1.085 �17 778 602Hotels and restaurants 27 � 17 55 � 134 � 69 2 65 2 �23 � 2 � 107 � 1 21 72Transportand communication 73 � 390 13 � 554 � 858 52 22 3 0 0 � 937 � 0 60 64Financial intermediation 451 � 56 43 � 32 406 218 246 20 0 � 3 � 74 � 1 91 40Real estateand business activities 1.680 � 717 658 � 852 770 361 1.855 63 � 2 � 1 �1.498 � 6 337 281Other services 10 � 14 15 � 29 � 18 3 20 1 0 0 � 42 � 0 12 35Total 4.894 �1.850 2.765 �2.928 2.881 1.709 4.905 656 �29 �22 �4.292 �46 1.892 1.396
Focus on Austria 2/2002 31�
Austrian Outward and Inward
Direct Investment

Outward direct investment
Table 16.1
Royalties and Management Fees Transferred to Austrian Investors
and Direct Investors� Foreign Trade by Foreign Economic Sectors at End-2000
Economic sectorsto which the surveyed foreign enterprisesbelong
Royalties Manage-ment fees
Direct investorsZgoods exports
Direct investorsZservices exports
Direct investorsZgoods imports
Direct investorsZservices imports
Total thereofto first-tieraffiliate
Total thereofto first-tieraffiliate
Total thereoffrom first-tier affiliate
Total thereoffrom first-tier affiliate
EUR million
Mining and quarrying and electricity,gas and water 1 1 x 5 x 0 x 30 x 0
Manufacturing and construction 44 36 x 1,151 x 65 x 768 x 24Food products 2 2 x 40 x 1 x 105 x 6Textile products, apparel and leather 0 1 x 11 x 0 x 22 x 3Wood and wood products 0 0 x 59 x 1 x 31 x 0Paper, publishing and printing 0 3 x 46 x 0 x 116 x 0Refined petroleum products, chemicals,rubber and plastic products 36 13 x 239 x 3 x 195 x 0Nonmetallic mineral products 2 4 x 51 x 7 x 34 x 0Metal products 0 3 x 197 x 8 x 52 x 2Mechanical products 1 1 x 128 x 1 x 64 x 1Electrical and optical equipment 1 6 x 276 x 35 x 79 x 10Transport equipment 0 3 x 46 x 0 x 53 x 0Manufacturing n.e.c. 0 1 x 10 x 1 x 15 x 1Construction 0 0 x 49 x 7 x 2 x 0
Services 7 27 x 1,661 x 184 x 1,463 x 25Trade and repairs 6 12 x 1,642 x 7 x 1,462 x 6Hotels and restaurants 0 1 x 0 x 0 x 0 x 0Transport and communication 0 3 x 2 x 7 x 0 x 8Financial intermediation 1 5 x 0 x 164 x 0 x 3Real estate and business activities 0 5 x 15 x 6 x 0 x 8Other services 0 2 x 2 x 0 x 0 x 1Total 53 65 22,732 2,817 1,813 250 16,561 2,260 1,402 49
32 Focus on Austria 2/2002�
Austrian Outward and Inward
Direct Investment

Inward direct investment
Table 16.2
Royalties and Management Fees Transferred to Nonresident Investors
and Direct Investors� Foreign Trade by Austrian Economic Sectors at End-2000
Economic sectorsto which the surveyed Austrian enterprisesbelong
Royalties Manage-ment fees
Direct investorsZgoods exports
Direct investorsZservices exports
Direct investorsZgoods imports
Direct investorsZservices imports
Total thereofto parent
Total thereofto parent
Total thereoffrom parent
Total thereoffrom parent
EUR million
Mining and quarrying and electricity,gas and water 4 0 x 78 x 4 x 56 x 1
Manufacturing and construction 64 170 x 8,719 x 588 x 5,441 x 294Food products 11 8 x 267 x 92 x 399 x 5Textile products, apparel and leather 0 11 x 472 x 6 x 256 x 25Wood and wood products 0 0 x 28 x 0 x 21 x 0Paper, publishing and printing 14 3 x 218 x 2 x 96 x 1Refined petroleum products, chemicals,rubber and plastic products 13 32 x 1,044 x 65 x 1,057 x 139Nonmetallic mineral products 2 3 x 123 x 3 x 115 x 3Metal products 3 5 x 334 x 4 x 139 x 5Mechanical products 15 6 x 1,160 x 44 x 545 x 12Electrical and optical equipment 2 99 x 3,345 x 331 x 1,957 x 35Transport equipment 1 2 x 1,710 x 18 x 786 x 68Manufacturing n.e.c. 0 1 x 14 x 0 x 31 x 0Construction 3 0 x 4 x 24 x 39 x 2
Services 189 70 x 2,979 x 622 x 16,169 x 1,146Trade and repairs 117 33 x 1,099 x 226 x 8,030 x 196Hotels and restaurants 13 6 x 4 x 10 x 0 x 0Transport and communication 0 19 x 5 x 140 x 9 x 198Financial intermediation 0 1 x 0 x 36 x 0 x 272Real estate and business activities 40 11 x 1,844 x 209 x 8,130 x 478Other services 19 1 x 29 x 1 x 0 x 2Total 258 240 25,049 11,776 2,843 1,215 37,338 21,666 2,811 1,442
Focus on Austria 2/2002 33�
Austrian Outward and Inward
Direct Investment

Outward direct investment
Table 17.1
Nominal Capital of Austrian Direct Investment Enterprises Abroad
(incl. Indirect Investments Abroad) by Foreign Economic Sectors at End-2000
Economic sectors to which the surveyeddirect investment enterprises abroad belong
Direct investments Indirect investments abroad Total
Affiliates(first tier)
Nominal capital Affiliates(secondtier)
Nominal capital Affiliates Austrianshare innominalcapital
Austrianandforeignshares
Austrianshare
of enter-prisesmajority-owned byAustrianstotal1)
Austrianand foreignshares
Austrianshare2)
of enter-prisesmajority-owned byAustrianstotal3)
Number EUR million Number EUR million Number EUR million
Mining and quarrying and electricity,gas and water 33 239 168 159 37 55 44 51 70 213
Manufacturing and construction 877 3,634 2,891 2,894 326 650 445 345 1,203 3,336Food products 69 396 323 350 31 47 17 6 100 340Textile products, apparel and leather 30 58 46 52 9 3 1 1 39 48Wood and wood products 30 198 180 195 15 49 46 49 45 226Paper, publishing and printing 55 398 265 259 25 39 19 21 80 284Refined petroleum products, chemicals,rubber and plastic products 134 705 538 512 44 94 66 17 178 604Nonmetallic mineral products 100 542 459 430 39 96 83 85 139 542Metal products 98 307 264 248 33 49 43 41 131 307Mechanical products 106 342 270 254 25 132 89 51 131 359Electrical and optical equipment 103 236 204 209 14 20 20 20 117 224Transport equipment 24 86 83 83 10 10 9 9 34 92Manufacturing n.e.c. 28 61 39 31 26 22 7 5 54 46Construction 100 305 221 270 55 87 44 39 155 265
Services 1,317 9,332 7,684 7,743 643 3,800 2,103 1,452 1,960 9,787Trade and repairs 569 1,689 1,594 1,572 61 172 112 71 630 1,706Hotels and restaurants 30 253 186 160 7 63 16 3 37 202Transport and communication 33 146 71 81 10 1 0 0 43 72Financial intermediation 235 3,398 2,500 2,483 178 1,967 778 470 413 3,278Real estate and business activities 402 3,718 3,248 3,356 339 1,552 1,168 874 741 4,415Other services 48 129 85 92 48 44 28 34 96 114Total 2,227 13,205 10,744 10,795 1,006 4,505 2,592 1,849 3,233 13,3361) Total nominal capital of direct investment enterprises with an Austrian share of more than 50%.2) Weighted twice: Nominal capital of the second-tier affiliate times the Austrian share of the first-tier affiliate times the latter�s share of the second-tier affiliate.3) Total nominal capital of the second-tier affiliate if the Austrian share of the first-tier affiliate exceeds 50% and the latter�s share of the second-tier affiliate exceeds 50%.
34 Focus on Austria 2/2002�
Austrian Outward and Inward
Direct Investment

Inward direct investment
Table 17.2
Nominal Capital of Foreign Direct Investment Enterprises in Austria
(incl. Indirect Investments in Austria) by Austrian Economic Sectors at End-2000
Economic sectors to whichthe Austrian enterprises belong1)
Direct investments Indirect investments in Austria Total
Affiliates(first tier)
Nominal capital Affiliates(secondtier)
Nominal capital Affiliates Foreignshare innominalcapital
ForeignandAustrianshares
Foreignshare
of enter-prisesmajority-owned bynonresidentstotal2)
ForeignandAustrianshares
Foreignshare3)
of enter-prisesmajority-owned bynonresidentstotal4)
Number EUR million Number EUR million Number EUR million
Mining and quarrying and electricity,gas and water 17 114 100 88 19 95 31 11 36 132
Manufacturing and construction 709 2,684 2,274 2,321 329 1,031 587 527 1,038 2,861Food products 62 170 140 137 29 87 40 8 91 180Textile products, apparel and leather 51 93 88 91 12 12 7 7 63 94Wood and wood products 16 12 11 11 3 2 0 0 19 12Paper, publishing and printing 54 172 155 147 51 189 142 166 105 297Refined petroleum products, chemicals,rubber and plastic products 109 658 485 443 41 154 77 60 150 562Nonmetallic mineral products 36 150 137 135 37 151 49 27 73 186Metal products 92 231 205 202 45 55 26 21 137 231Mechanical products 131 434 351 402 43 173 88 86 174 439Electrical and optical equipment 79 490 444 488 23 42 31 27 102 475Transport equipment 19 146 146 146 9 120 96 95 28 241Manufacturing n.e.c. 19 77 65 71 6 19 11 11 25 76Construction 41 49 48 48 30 26 20 17 71 68
Services 1,862 11,202 8,714 7,951 1,035 2,366 1,068 865 2,897 9,782Trade and repairs 1,150 3,468 3,355 3,334 338 243 158 135 1,488 3,513Hotels and restaurants 57 201 175 167 18 32 29 31 75 205Transport and communication 104 1,754 585 168 65 343 113 64 169 699Financial intermediation 108 2,186 1,690 1,656 108 970 519 423 216 2,209Real estate and business activities 404 3,537 2,861 2,575 459 765 244 208 863 3,105Other services 39 56 47 50 47 13 4 4 86 51Total 2,588 14,000 11,088 10,360 1,383 3,492 1,687 1,402 3,971 12,7751) Holding companies are partly classified under the economic sector to which their largest affiliate belongs (see section 4 Structure of Tables).2) Total nominal capital of direct investment enterprises with a foreign share of more than 50%.3) Weighted twice: Nominal capital of the second-tier affiliate times the foreign share of the first-tier affiliate times the latter�s share of the second-tier affiliate.4) Total nominal capital of the second-tier affiliate if the foreign share of the first-tier affiliate exceeds 50% and the latter�s share of the second-tier affiliate exceeds 50%.
Focus on Austria 2/2002 35�
Austrian Outward and Inward
Direct Investment

Outward direct investment
Table 18.1
Number of Employees in Austrian Direct Investment Enterprises Abroad
(incl. Indirect Investments Abroad) by Foreign Economic Sectors at End-2000
Economic sectors to which the surveyeddirect investment enterprises abroad belong
Direct investments Indirect investments abroad Total
Affiliates(first tier)
Number of employees Affiliates(second tier)
Number of employees Affiliates Employeesweightedby nominalcapital share
unweighted weightedby Austriannominalcapitalshare
of enter-prisesmajority-owned byAustrians,un-weighted1)
unweighted weightedby Austriannominalcapitalshare2)
of enter-prisesmajority-owned byAustrians,un-weighted3)
Number 1,000 Number 1,000 Number 1,000
Mining and quarrying and electricity,gas and water 33 2.8 2.3 2.5 37 1.4 1.2 1.3 70 3.5
Manufacturing and construction 877 183.7 142.1 147.0 326 15.5 11.3 10.7 1,203 153.4Food products 69 15.0 11.9 12.0 31 1.0 0.4 0.1 100 12.3Textile products, apparel and leather 30 9.6 7.0 6.6 9 0.1 0.1 0.1 39 7.1Wood and wood products 30 6.2 5.3 6.2 15 1.0 1.0 1.0 45 6.3Paper, publishing and printing 55 10.7 8.0 7.2 25 0.6 0.5 0.6 80 8.4Refined petroleum products, chemicals,rubber and plastic products 134 28.6 19.9 16.8 44 1.2 0.7 0.4 178 20.6Nonmetallic mineral products 100 14.3 12.3 12.2 39 1.9 1.6 1.8 139 13.8Metal products 98 12.9 10.8 10.4 33 3.8 3.5 3.4 131 14.3Mechanical products 106 12.4 9.8 9.2 25 0.5 0.5 0.5 131 10.2Electrical and optical equipment 103 24.5 23.5 23.7 14 1.4 1.4 1.4 117 24.9Transport equipment 24 8.8 8.3 8.3 10 0.8 0.7 0.8 34 9.0Manufacturing n.e.c. 28 9.3 5.1 4.4 26 2.5 0.8 0.6 54 5.9Construction 100 31.4 20.3 30.0 55 0.6 0.2 0.1 155 20.5
Services 1,317 142.6 104.2 112.4 643 66.1 44.1 37.7 1,960 148.3Trade and repairs 569 42.7 40.1 41.3 61 1.7 1.3 1.3 630 41.4Hotels and restaurants 30 3.7 2.9 2.9 7 0.2 0.2 0.0 37 3.1Transport and communication 33 3.2 2.2 2.3 10 0.2 0.1 0.1 43 2.3Financial intermediation 235 53.2 34.4 44.1 178 14.2 5.8 6.1 413 40.2Real estate and business activities 402 20.4 19.9 20.0 339 48.1 35.4 28.7 741 55.3Other services 48 19.5 4.8 1.8 48 1.7 1.3 1.5 96 6.0Total 2,227 329.0 248.6 262.0 1,006 83.1 56.5 49.6 3,233 305.11) Total number of employees of direct investment enterprises with an Austrian share of more than 50%.2) Weighted twice: Number of employees of the second-tier affiliate times the Austrian share of the first-tier affiliate times the latter�s share of the second-tier affiliate.3) Total number of employees of the second-tier affiliate if the Austrian share of the first-tier affiliate exceeds 50% and the latter�s share of the second-tier affiliate exceeds 50%.
36 Focus on Austria 2/2002�
Austrian Outward and Inward
Direct Investment

Inward direct investment
Table 18.2
Number of Employees in Foreign Direct Investment Enterprises in Austria
(incl. Indirect Investments in Austria) by Austrian Economic Sectors at End-2000
Economic sectors to which the Austrianenterprises belong1)
Direct investments Indirect investments in Austria Total
Affiliates(first tier)
Number of employees Affiliates(second tier)
Number of employees Affiliates Employeesweightedby nominalcapital share
unweighted weightedby foreignnominalcapitalshare
of enter-prisesmajority-ownedby non-residents,un-weighted2)
unweighted weightedby foreignnominalcapitalshare3)
of enter-prisesmajority-ownedby non-residents,un-weighted4)
Number 1,000 Number 1,000 Number 1,000
Mining and quarrying and electricity,gas and water 17 0.7 0.6 0.6 19 2.2 0.7 0.3 36 1.4
Manufacturing and construction 709 135.1 121.3 123.5 329 51.5 32.1 29.4 1,038 153.4Food products 62 10.5 9.3 9.6 29 1.9 1.3 1.1 91 10.6Textile products, apparel and leather 51 7.9 7.6 7.5 12 1.3 0.8 0.8 63 8.4Wood and wood products 16 1.9 1.8 1.8 3 0.3 0.1 0.1 19 1.9Paper, publishing and printing 54 5.2 5.0 5.0 51 4.6 3.7 3.9 105 8.7Refined petroleum products, chemicals,rubber and plastic products 109 21.3 17.6 16.4 41 6.4 4.6 4.2 150 22.2Nonmetallic mineral products 36 3.8 3.5 3.4 37 5.6 2.9 2.2 73 6.4Metal products 92 15.1 13.5 13.3 45 4.6 2.5 2.2 137 16.1Mechanical products 131 20.4 17.8 18.6 43 10.8 5.9 5.6 174 23.7Electrical and optical equipment 79 31.2 28.1 31.1 23 4.5 2.8 2.0 102 31.0Transport equipment 19 11.1 11.1 11.1 9 5.6 4.0 4.3 28 15.0Manufacturing n.e.c. 19 2.4 1.8 1.6 6 0.8 0.5 0.6 25 2.3Construction 41 4.4 4.1 4.1 30 5.2 3.0 2.4 71 7.2
Services 1,862 158.5 129.3 120.3 1,035 78.5 47.2 45.5 2,897 176.5Trade and repairs 1,150 77.6 72.0 70.2 338 25.2 18.7 17.2 1,488 90.7Hotels and restaurants 57 7.1 6.1 6.1 18 2.1 1.4 1.4 75 7.5Transport and communication 104 28.0 13.9 9.3 65 16.4 5.2 2.4 169 19.1Financial intermediation 108 26.1 20.9 18.9 108 16.7 10.9 12.5 216 31.8Real estate and business activities 404 18.3 15.1 14.4 459 16.3 9.9 10.6 863 25.0Other services 39 1.5 1.4 1.4 47 1.7 1.1 1.3 86 2.4Total 2,588 294.3 251.2 244.4 1,383 132.3 80.0 75.1 3,971 331.21) Holding companies are partly classified under the economic sector to which their largest affiliate belongs (see section 4 Structure of Tables).2) Total number of employees of direct investment enterprises with a foreign share of more than 50%.3) Weighted twice: Number of employees of the second-tier affiliate times the foreign share of the first-tier affiliate times the latter�s share of the second-tier affiliate.4) Total number of employees of the second-tier affiliate if the foreign share of the first-tier affiliate exceeds 50% and the latter�s share of the second-tier affiliate exceeds 50%.
Focus on Austria 2/2002 37�
Austrian Outward and Inward
Direct Investment

Outward direct investment
Table 19.1
Austrian Direct Investment Abroad by Major Host Countries and Foreign Economic Sectors
at End-2000
Economic sectors to which the surveyedforeign enterprises belong
Germany CzechRepublic
Nether-lands
Hungary UnitedKingdom
U.S.A. Carib-beanstates1)
Switzer-land,Liechten-stein
Poland Sweden Othercountries
Totalcapital
Total capital share in %
Mining and quarrying and electricity,gas and water 4.2 1.5 0.0 1.2 0.0 0.1 0.0 0.0 0.2 0.0 0.8 1.2
Manufacturing and construction 27.7 33.6 3.9 44.0 7.1 24.8 0.0 11.5 28.2 26.2 31.5 25.5Food products 0.7 2.0 0.0 9.2 0.0 0.5 0.0 0.1 2.1 0.0 2.5 1.8Textile products, apparel and leather 0.1 0.4 0.0 1.3 0.0 0.2 0.0 0.3 0.0 0.0 0.4 0.3Wood and wood products 2.5 1.2 0.0 1.6 3.7 0.0 0.0 0.3 0.3 0.0 � 0.1 0.9Paper, publishing and printing 1.8 6.7 0.4 3.0 0.0 0.0 0.0 2.6 2.6 0.0 2.2 2.0Refined petroleum products,chemicals, rubber and plastic products 6.4 6.5 3.1 5.6 1.0 2.4 0.0 0.7 12.8 2.3 4.7 4.5Nonmetallic mineral products 0.6 8.3 0.0 7.0 0.3 17.7 0.0 0.0 2.0 0.0 5.1 4.3Metal products 2.4 1.6 0.0 1.8 0.9 4.6 0.0 2.3 2.0 21.7 10.0 4.9Mechanical products 1.3 0.7 0.0 1.0 0.3 1.7 0.0 1.6 1.2 0.4 3.9 1.8Electrical and optical equipment 6.8 2.1 0.0 4.4 0.6 0.3 0.0 2.6 0.0 1.4 2.0 2.6Transport equipment 1.5 1.1 0.0 2.1 0.4 � 2.8 0.0 0.0 1.5 0.0 0.2 0.4Manufacturing n.e.c. 0.1 0.2 0.0 1.0 0.0 0.0 0.0 0.6 2.3 0.0 0.2 0.3Construction 3.5 2.6 0.3 5.9 0.0 0.2 0.0 0.4 1.4 0.4 0.5 1.5
Services 68.0 65.0 96.1 54.9 92.9 75.2 100.0 88.5 71.6 73.8 67.7 73.3Trade and repairs 1.6 18.8 0.6 12.9 10.5 53.6 0.0 8.4 8.7 0.7 11.9 12.0Hotels and restaurants 0.3 � 0.7 0.0 1.9 0.0 0.0 0.0 0.0 1.7 0.0 2.2 0.9Transport and communication 0.1 0.2 0.0 1.1 0.0 0.0 0.0 0.3 0.2 0.0 0.7 0.3Financial intermediation 6.0 35.1 4.2 26.6 2.4 12.4 43.9 30.9 51.5 0.0 28.4 20.9Real estate and business activities 57.7 11.0 91.2 10.9 79.9 9.1 56.1 47.7 9.4 73.1 23.2 38.1Other services 2.4 0.5 0.1 1.5 0.0 0.0 0.0 1.3 0.0 0.0 1.2 1.0
Total EUR million (= 100 %) 5,070 2,108 1,693 1,863 1,648 2,160 1,180 1,214 914 740 8,084 26,6741) See glossary (breakdown by regions) for definition.
38 Focus on Austria 2/2002�
Austrian Outward and Inward
Direct Investment

Inward direct investment
Table 19.2
Nonresident Direct Investment in Austria by Major Home Countries
and Austrian Economic Sectors at End-2000
Economic sectors to which the surveyedAustrian enterprises belong
Germany Switzer-land,Liechten-stein
U.S.A. Italy UnitedKingdom
Nether-lands
France Spain Luxem-bourg
Japan Othercountries
Totalcapital
Total capital share in %
Mining and quarrying and electricity,gas and water 0.3 3.0 0.2 0.0 5.4 2.1 1.3 0.0 0.0 0.0 0.0 1.0
Manufacturing and construction 27.0 32.1 44.2 9.3 11.6 41.9 23.9 5.2 10.8 65.3 26.7 27.6Food products 0.6 1.5 6.4 0.7 0.0 18.1 0.4 0.0 0.0 0.0 0.2 2.0Textile products, apparel and leather 0.9 1.8 0.1 0.0 0.0 0.0 0.0 0.0 6.8 0.0 0.0 0.8Wood and wood products 0.1 1.0 0.0 0.3 0.0 0.0 0.1 0.0 0.0 0.0 0.0 0.2Paper, publishing and printing 1.9 2.2 0.3 0.2 0.0 0.4 0.0 0.0 0.1 51.1 0.9 2.5Refined petroleum products,chemicals, rubber and plastic products 4.4 17.3 17.1 0.3 4.3 5.7 0.6 0.0 3.6 5.0 19.5 7.3Nonmetallic mineral products 1.0 0.3 0.0 1.8 2.0 0.1 17.1 0.3 0.0 0.0 0.2 1.4Metal products 2.1 1.6 1.8 0.2 4.1 0.5 0.5 4.9 0.2 3.0 0.1 1.7Mechanical products 3.3 3.7 4.3 3.6 0.6 2.1 0.0 0.0 0.0 1.7 2.7 2.8Electrical and optical equipment 10.4 2.5 8.5 1.2 0.5 15.6 3.8 0.0 0.0 2.4 1.0 7.0Transport equipment 1.9 0.0 4.9 0.8 0.0 0.0 0.0 0.0 0.2 0.0 0.5 1.3Manufacturing n.e.c. 0.1 0.2 0.3 0.2 0.0 � 0.6 0.5 0.0 0.0 2.1 1.6 0.3Construction 0.4 0.1 0.5 0.0 0.0 0.0 0.8 0.0 � 0.1 0.0 0.0 0.2
Services 72.7 65.0 55.6 90.7 83.0 56.0 74.7 94.8 89.2 34.7 73.3 71.5Trade and repairs 23.5 21.6 23.3 8.6 21.4 12.3 11.0 1.8 5.4 25.6 12.8 19.4Hotels and restaurants 0.2 0.0 5.6 1.3 � 0.3 1.1 0.2 0.0 � 0.1 6.9 0.8 0.8Transport and communciation 1.3 3.5 � 0.3 53.6 10.1 14.3 0.3 0.3 0.2 0.0 2.4 5.4Financial intermediation 26.6 10.0 6.7 25.5 1.1 8.4 22.9 0.0 0.0 0.1 14.3 17.9Real estate and business activities 20.8 29.6 20.2 1.7 50.3 19.8 40.3 92.7 83.7 2.1 42.5 27.8Other services 0.2 0.3 0.0 0.0 0.4 0.1 0.0 0.0 0.0 0.0 0.5 0.2
Total EUR million (= 100 %) 15,295 3,137 2,024 1,692 1,881 2,053 1,399 772 859 841 2,751 32,704
Focus on Austria 2/2002 39�
Austrian Outward and Inward
Direct Investment

Outward direct investment
Austrian Direct Investment Enterprises Abroad (Number, Total Capital)
by Economic Regions, Continents and Foreign Economic Sectors at End-2000
Economic sectors to which the surveyedforeign enterprises belong
Investments in foreign enterprises Austrian total capital share in foreign enterprises
EU-151) NAFTA1) OECD1) CEEC-51) EU-151) NAFTA1) OECD1) CEEC-51)
Number EUR million
Mining and quarrying and electricity,gas and water 5 x 25 25 227 x 282 82
Manufacturing and quarrying 293 49 702 373 2,464 741 5,157 2,771Food products 12 x 50 39 83 x 329 272Textile products, apparel and leather 11 x 28 13 21 x 62 40Wood and wood products 15 x 27 10 171 x 234 65Paper, publishing and printing 19 x 46 24 165 x 425 284Refined petroleum products, chemicals,rubber and plastic products 50 8 99 45 534 72 975 496Nonmetallic mineral products 11 4 70 66 148 382 855 377Metal products 42 8 86 35 380 139 635 724Mechanical products 44 11 80 25 210 151 432 51Electrical and optical equipment 39 9 86 36 442 35 651 151Transport equipment 10 x 18 7 91 x 105 81Manufacturing n.e.c. 6 x 25 19 20 x 71 44Construction 34 x 87 54 197 x 383 186
Services 384 60 1,022 576 8,567 1,652 14,400 3,944Trade and repairs 177 32 453 237 504 1,175 2,693 931Hotels and restaurants x x 23 23 x x 51 61Transport and communication 7 x 28 19 5 x 33 28Financial intermediation 40 5 134 109 893 269 2,986 2,144Real estate and business activities 150 23 351 157 7,025 209 8,429 737Other services 7 x 33 31 126 x 208 42Total 682 110 1,749 974 11,257 2,394 19,839 6,7971) See glossary (breakdown by regions) for definition.
40 Focus on Austria 2/2002�
Austrian Outward and Inward
Direct Investment

Table 20.1
Investments in foreign enterprises Austrian total capital share in foreign enterprises
Europe1) America Asia Africa Oceania Europe1) America Asia Africa Oceania
Number EUR million
32 x x x x 316 x x x x
778 68 44 4 5 5,799 772 177 14 2665 x x x x 471 x x x x27 x x x x 65 x x x x29 x x x x 242 x x x x54 x x x x 489 x x x x
110 11 14 x x 1,060 78 68 x x101 4 x x x 768 382 x x x84 10 5 x x 1,143 146 25 x x82 18 6 x x 298 163 22 x x83 12 8 x x 625 34 12 x x19 4 x x x 167 � 63 x x x27 x x x x 72 x x x x97 x x x x 399 x x x x
1,219 89 43 5 12 15,509 3,211 521 6 305501 42 23 x 6 1,769 1,227 28 x 18029 x x x x 87 x x x x33 x x x x 91 x x x x238 13 x x x 4,445 1,095 x x x371 34 12 x 5 8,864 889 305 x 9847 x x x x 253 x x x x
2,029 158 89 9 17 21,624 3,985 715 20 331
Focus on Austria 2/2002 41�
Austrian Outward and Inward
Direct Investment

Inward direct investment
Foreign Direct Investment Enterprises in Austria (Number, Total Capital)
by Economic Regions, Continents and Austrian Economic Sectors at End-2000
Economic sectors to which the surveyedAustrian enterprises belong
Investments in Austrian enterprises Foreign total capital share in Austrian enterprises
EU-151) NAFTA1) OECD1) CEEC-51) EU-151) NAFTA1) OECD1) CEEC-51)
Number EUR million
Mining and quarrying and electricity,gas and water 18 x 21 x 218 x 316 x
Manufacturing and construction 610 63 829 9 6,135 892 8,596 3Food products 47 12 67 x 490 119 661 xTextile products, apparel and leather 43 x 64 x 194 x 249 xWood and wood products 10 6 25 x 18 0 46 xPaper, publishing and printing 44 4 63 x 309 7 824 xRefined petroleum products, chemicals,rubber and plastic products 96 8 135 x 1,057 346 2,016 xNonmetallic mineral products 34 x 45 4 460 x 471 4Metal products 94 x 118 x 461 x 572 xMechanical products 116 13 153 x 693 86 898 xElectrical and optical equipment 58 7 78 x 2,023 172 2,280 xTransport equipment 15 4 19 x 304 108 412 xManufacturing n.e.c. 14 x 19 x 56 x 86 xConstruction 39 x 43 x 69 x 81 x
Services 1,614 173 2,210 52 19,028 1,175 21,988 107Trade and repairs 958 103 1,300 34 4,794 497 5,788 18Hotels and restaurants 66 10 89 x 81 113 257 xTransport and communication 83 x 111 x 1,637 x 1,773 xFinancial intermediation 83 8 112 4 5,032 136 5,541 38Real estate and business activities 388 47 554 9 7,432 434 8,576 48Other services 36 x 44 x 51 x 52 xTotal 2,242 237 3,060 61 25,380 2,072 30,899 1111) See glossary (breakdown by regions) for definition.
42 Focus on Austria 2/2002�
Austrian Outward and Inward
Direct Investment

Table 20.2
Investments in Austrian enterprises Foreign total capital share in Austrian enterprises
Europe1) America Asia Africa Oceania Europe1) America Asia Africa Oceania
Number EUR million
21 x x x x 311 x x x x
790 66 14 x x 7,242 892 867 x x62 12 x x x 549 119 x x x63 x x x x 249 x x x x22 6 x x x 49 0 x x x61 4 x x x 392 7 x x x
127 9 6 x x 1,667 345 360 x x48 x x x x 473 x x x x115 x x x x 510 x x x x143 15 x x x 814 87 x x x75 7 x x x 2,101 172 x x x15 4 x x x 304 108 x x x16 x x x x 63 x x x x43 x x x x 71 x x x x
2,112 192 84 x x 21,534 1,295 535 x x1,217 109 53 x x 5,508 562 261 x x76 11 6 x x 86 114 59 x x119 x x x x 1,773 x x x x117 9 5 x x 5,661 151 44 x x540 57 18 x x 8,446 474 171 x x43 4 x x x 60 � 0 x x x
2,923 259 98 5 3 29,088 2,192 1,402 1 21
Focus on Austria 2/2002 43�
Austrian Outward and Inward
Direct Investment

Outward direct investment
Table 21.1
Capital Structure, Market Value and Number of Employees
of Austrian Direct Investment Enterprises Abroad by Laender at End-2000
Austriandirectinvestmententerprisesabroad
Claims on nonresidents Employees
Nominalcapital
Reserves Profitor lossbroughtforward
Profitor loss forthe year
Equity Othercapital(loans toaffiliatedenter-prises)
Total Marketvalue
Number EUR million 1,000
Burgenland 24 49 36 3 10 97 7 104 159 5.3Carinthia 90 360 254 � 26 50 638 61 699 545 20.3Lower Austria 323 891 379 60 83 1,413 209 1,622 1,463 27.5Upper Austria 326 1,343 1,936 484 46 3,809 132 3,942 3,161 35.1Salzburg 148 624 234 � 16 117 960 939 1,899 1,236 11.2Styria 206 802 1,252 53 98 2,205 176 2,381 2,115 17.1Tyrol 83 308 282 � 34 � 58 498 94 593 706 11.3Vorarlberg 117 216 247 � 53 63 473 123 596 881 9.0Vienna 910 6,149 6,682 8 938 13,778 1,063 14,841 13,381 111.9Total 2,227 10,744 11,302 480 1,345 23,871 2,804 26,675 23,648 248.6
Table 22.1
Capital Structure, Market Value and Number of Employees
of Austrian Direct Investment Enterprises by Legal Form of the Austrian Investorat End-2000
Austriandirectinvestmententerprisesabroad
Claims on nonresidents Employees
Nominalcapital
Reserves Profitor lossbroughtforward
Profitor loss forthe year
Equity Othercapital(loans toaffiliatedenter-prises)
Total Marketvalue
Number EUR million 1,000
Stock corporation 837 6,385 5,034 �365 671 11,726 1,353 13,079 12,418 112.2Limited liability company 1,250 3,478 4,804 313 517 9,111 1,355 10,466 8,554 119.8Limited partnership 77 667 1,322 374 54 2,417 68 2,484 1,962 13.5Other 63 214 141 158 103 618 28 646 714 3.2Total 2,227 10,744 11,302 480 1,345 23,871 2,804 26,675 23,648 248.6
44 Focus on Austria 2/2002�
Austrian Outward and Inward
Direct Investment

Inward direct investment
Table 21.2
Capital Structure, Market Value and Number of Employees
of Foreign Direct Investment Enterprises in Austria by Laender at End-2000
Foreigndirectinvestmententerprisesin Austria
Liabilities to nonresidents Employees
Nominalcapital
Reserves Profitor lossbroughtforward
Profitor loss forthe year
Equity Othercapital(loans toaffiliatedenter-prises)
Total Marketvalue
Number EUR million 1,000
Burgenland 37 53 125 59 25 262 � 41 221 306 3.9Carinthia 91 237 796 17 127 1,177 80 1,257 2,323 10.1Lower Austria 355 694 987 29 351 2,062 230 2,292 3,471 32.8Upper Austria 275 2,314 1,499 213 489 4,515 � 107 4,409 2,879 40.1Salzburg 216 446 1,114 75 208 1,843 155 1,997 2,489 11.9Styria 126 320 688 100 265 1,373 � 41 1,333 1,559 17.1Tyrol 112 211 473 � 21 119 782 80 861 1,119 8.4Vorarlberg 105 141 279 � 3 48 465 � 9 456 834 7.0Vienna 1,271 6,672 11,229 �634 1,411 18,678 1,199 19,878 21,924 120.0Total 2,588 11,088 17,189 �163 3,044 31,158 1,546 32,704 36,904 251.2
Table 22.2
Capital Structure, Market Value and Number of Employees
of Foreign Direct Investment Enterprises in Austria by Their Legal Form at End-2000
Foreigndirectinvestmententerprisesin Austria
Liabilities to nonresidents Employees
Nominalcapital
Reserves Profitor lossbroughtforward
Profitor loss forthe year
Equity Othercapital(loans toaffiliatedenter-prises)
Total Marketvalue
Number EUR million 1,000
Stock corporation 284 3,552 8,933 74 1,106 13,665 198 13,863 14,690 79.2Limited liability company 2,098 5,385 7,555 �138 1,483 14,285 1,201 15,486 19,877 151.9Limited partnership 189 2,092 637 � 71 356 3,014 148 3,162 1,794 17.8Other 17 59 64 � 29 99 194 0 194 544 2.3Total 2,588 11,088 17,189 �163 3,044 31,158 1,546 32,704 36,904 251.2
Focus on Austria 2/2002 45�
Austrian Outward and Inward
Direct Investment

Outward direct investment
Table 23.1
Capital Structure, Market Value and Number of Employees
of Austrian Direct Investment Enterprises Abroad by Age of Enterprise at End-2000
Austriandirect in-vestmententerprisesabroad
Claims on nonresidents Employees
Nominalcapital
Reserves Profitor lossbroughtforward
Profitor loss forthe year
Equity Othercapital(loans toaffiliatedenter-prises)
Total Marketvalue
Number EUR million 1,000
New 383 2,371 4,390 16 127 6,904 388 7,292 5,328 50.22 to 5 years 702 3,676 3,511 214 264 7,666 1,341 9,007 7,764 84.1More than 5 years 1,142 4,697 3,400 250 954 9,301 1,076 10,376 10,556 114.4Total 2,227 10,744 11,302 480 1,345 23,871 2,804 26,675 23,648 248.6
thereof:Established 878 5,258 7,558 845 940 14,600 1,403 16,003 14,241 143.0Purchased 1,349 5,487 3,744 �365 406 9,271 1,401 10,671 9,407 105.7
Table 24.1
Capital Structure, Market Value and Number of Employees
of Austrian Direct Investment Enterprises Abroad by Staff Size at End-2000
Number of employees Austriandirectinvestmententerprisesabroad
Claims on nonresidents Employees
Nominalcapital
Reserves Profitor lossbroughtforward
Profitor loss forthe year
Equity Othercapital(loans toaffiliatedenter-prises)
Total Marketvalue
Number EUR million 1,000
Up to 19 1,008 4,542 6,778 109 422 11,851 594 12,445 9,959 4.520 to 49 394 762 250 �105 144 1,051 339 1,390 1,406 11.250 to 99 285 931 396 �167 48 1,208 302 1,510 1,438 17.8100 to 499 414 2,376 1,466 � 22 206 4,027 1,053 5,080 4,573 75.8500 bis 999 77 892 458 � 56 183 1,477 119 1,596 1,728 42.01,000 and over 49 1,241 1,953 721 342 4,257 398 4,654 4,544 97.3Total 2,227 10,744 11,302 480 1,345 23,871 2,804 26,675 23,648 248.6
46 Focus on Austria 2/2002�
Austrian Outward and Inward
Direct Investment

Inward direct investment
Table 23.2
Capital Structure, Market Value and Number of Employees
of Foreign Direct Investment Enterprises in Austria by Age of Enterprise at End-2000
Foreigndirectinvestmententerprisesin Austria
Liabilities to nonresidents Employees
Nominalcapital
Reserves Profitor lossbroughtforward
Profitor loss forthe year
Equity Othercapital(loans toaffiliatedenter-prises)
Total Marketvaluet
Number EUR million 1,000
New 225 3,126 4,719 �603 � 453 6,789 180 6,969 6,248 21.92 to 5 years 513 1,555 4,068 �527 252 5,348 701 6,050 7,211 39.3More than 5 years 1,850 6,407 8,402 967 3,245 19,021 665 19,686 23,445 190.1Total 2,588 11,088 17,189 �163 3,044 31,158 1,546 32,704 36,904 251.2
Table 24.2
Capital Structure, Market Value and Number of Employees
of Foreign Direct Investment Enterprises in Austria by Staff Size at End-2000
Number of employees Foreigndirectinvestmententerprisesin Austria
Liabilities to nonresidents Employees
Nominalcapital
Reserves Profitor lossbroughtforward
Profitor loss forthe year
Equity Othercapital(loans toaffiliatedenter-prises)
Total Marketvalue
Number EUR million 1,000
Up to 19 1,319 1,828 5,534 118 1,135 8,614 396 9,010 9,982 7.320 to 49 448 2,499 990 �495 � 338 2,657 287 2,944 3,249 13.050 to 99 292 635 791 �102 134 1,457 101 1,558 2,244 19.4100 to 499 415 1,754 2,791 218 819 5,582 153 5,735 8,655 82.9500 to 999 67 588 960 187 121 1,855 459 2,315 2,082 39.01,000 and over 47 3,784 6,123 � 88 1,174 10,993 150 11,143 10,692 89.6Total 2,588 11,088 17,189 �163 3,044 31,158 1,546 32,704 36,904 251.2
Focus on Austria 2/2002 47�
Austrian Outward and Inward
Direct Investment

Outward and inward direct investment
Table 25
Share and Type of Foreign Ownership of Austrian Direct Investors
and These Investors� Outward Direct Investment at End-20001)
Austrian direct investors
Total Austriandirect investorsZdirect investmententerprisesabroad
Austriandirect investorsin which foreigninvestors haveinvested
Subcategoryof 1
Foreigndirect investmentby category
Subcategoryof 2
Austriandirect investorsmajority-ownedby foreigninvestors
Subcategoryof 1 and 3
Foreigndirect investmentby category
Subcategoryof 2 and 4
1 2 3 4 5 6
Number 917 2,227 199 587 161 471Nominal capital EUR millionAustrian-owned x 10,744 1,980 4,046 211 2,739Foreign-owned 4,541 2,461 4,541 886 3,885 565Total x 13,205 6,521 4,932 4,096 3,303
Equity EUR millionAustrian-owned x 23,871 6,926 9,300 702 7,539Foreign-owned 14,855 5,943 14,855 2,312 12,577 1,413Total x 29,814 21,781 11,613 13,279 8,951
Market value EUR millionAustrian-owned x 23,648 6,957 9,702 1,229 7,940Foreign-owned 12,134 6,878 12,134 2,613 10,127 1,316Total x 30,526 19,092 12,315 11,355 9,256
Number of employees 1,000Weighted x 248.6 x 97.1 x 87.3Unweighted 267.6 329.0 102.2 117.7 65.6 103.81) Of the total of Austrian direct investors (917), 199 are partly or wholly controlled by nonresidents. Some 70% of their aggregate nominal capital of EUR 6,521million, namely EUR 4,541
million, are foreign-owned. The 199 partly or wholly foreign-controlled Austrian foreign investors have interests in 587 foreign affiliates whose nominal capital totals EUR 4,932 million.82% thereof (EUR 4,046 million) are held by foreign-controlled Austrian direct investors, with the balance of EUR 886 million accounted for by the host countries or direct investorsresident in third countries.
48 Focus on Austria 2/2002�
Austrian Outward and Inward
Direct Investment