australia’s life admin store - annualreports.com · brand and marketing 10 partners 12 ... our...
TRANSCRIPT

Australia’s Life Admin StoreAnnual Report 2016
www.iselect.com.au
iSele
ct A
nn
ual R
ep
ort 2
016

About Us
iSelect is Australia’s leading destination for personalised comparison and expert advice across insurance, utilities and personal finance products. We are a consumer-led and customer-centric business.
IMPORTANT NOTICE AND DISCLAIMER
All references to FY13, FY14, FY15, FY16 appearing in this Annual Report are to the financial years ended or ending 30 June 2013, 30 June 2014, 30 June 2015 and 30 June 2016, respectively, unless otherwise indicated. Any references to 1H FY13, 2H FY13, 1H FY14, 2H FY14, 1H FY15 and 2H FY15 appearing in this Annual Report are to the half financial years ended 31 December 2012, 30 June 2013, 31 December 2013, 30 June 2014, 31 December 2014 and 30 June 2015, respectively, unless otherwise indicated.
This Annual Report contains forward-looking statements. The statements in this Annual Report are based on an assessment of present economic and operating conditions, and on a number of assumptions regarding future events and actions that, at the date of this Annual Report, are expected to take place. Such forward-looking statements are not guarantees of future performance and involve known and unknown risks, uncertainties, assumptions and other important factors, many of which are beyond the control of the Group, the Directors and management.
The Group cannot and does not give any assurance that the results, performance or achievements expressed or implied by the forward-looking statements contained in this Annual Report will actually occur and investors are cautioned not to place undue reliance on these forward-looking statements. To the full extent permitted by law, iSelect disclaims any obligation or undertaking to release any updates or revisions to the information contained in this Annual Report to reflect any change in expectations or assumptions.
MORE THAN JUST A COMPARISON WEBSITE
While our comparison services are initially provided via our website, most of our customers choose to receive a personalised recommendation over the phone by speaking to one of our 500 highly-trained expert advisers.
Health Energy Broadband Car Life Home & Contents
Home Loans
Credit Cards
TravelInsurance
MobilePhones
NON-IFRS INFORMATION
iSelect’s results are reported under International Financial Reporting Standards (IFRS). Throughout this Annual Report, iSelect has included certain non-IFRS financial information. The information is presented to assist in making appropriate comparisons with prior periods and to assess the operating performance of the business. iSelect uses these measures to assess the performance of the business and believes that information is useful to investors. EBITDA, EBIT, Operating Cash Conversion and Revenue per Sale (RPS) have not been audited or reviewed.
Any and all monetary amounts quoted in this Annual Report are in Australian dollars (AUD) unless otherwise stated.
Any references to “Group” in this Annual Report refer to iSelect Limited and its controlled entities.
ABN: 48 124 302 932
MORE THAN
9mUNIQUE VISITS TO OUR WEBSITE - FY16
PROVIDED CUSTOMERS
6mRECOMMENDATIONS
At iSelect, we get that most people find insurance, utilities and personal finance boring. But we understand that it’s really important to always get these things right. As Australia’s life admin store, iSelect gives customers the confidence to make the right call on some of the things that matter most.
Last year, our website had more than nine million unique visits by Australians and we provided recommendations to over six million customers. But we are much more than just another online comparison website. Our highly-trained experts at iSelect HQ help customers to choose and buy from thousands of available policies, products and plans. From health and life insurance through to energy and broadband, as well as car insurance and home loans, iSelect helps Australians take care of the boring but important stuff.
www.iselect.com.au
IS
EL
EC
T A
NN
UA
L R
EP
OR
T 2
016

“ My adviser was extremely knowledgeable and very patient. She was very understanding of my needs and wants with a provider and was able to deliver expert advice with such a lovely, professional can do attitude.” Jacobie, Glynde, SA
CONTENTSChairman’s Letter 2
CEO’s Report 4
Highlights 2016 6
Segment Performance 8
Brand and Marketing 10
Partners 12
Our People and Culture 14
Board Members 16
Leadership Team 18
Financial Report 21
Directors’ Report 22
Remuneration Report 31
Corporate Governance Statement 50
Auditor’s Independence Declaration 60
Financial Statements 61
Directors’ Declaration 121
Independent auditor’s report 122
ASX Additional Information 124
Corporate Information 126
ISE
LE
CT
AN
NU
AL
RE
PO
RT
20
16
1

Chairman’s Letter
Dear Shareholders,
On behalf of the Board, I am pleased to present the FY16 Annual Report to you. I have now been in the Chair for more than a year and it is most pleasing to me that this report details some outstanding achievements by your Company over the 2016 financial year.
Following a somewhat challenging beginning to the financial year, the Company’s performance since the restructure in November 2015 has been commendable. I would like to take this opportunity to thank our CEO, Scott Wilson, and his renewed senior management and executive team for their continued efforts in realising the vast potential of the company.
FINANCIAL PERFORMANCE iSelect delivered a solid result for the financial year ending 30 June 2016, with year-on-year revenue growth of 9% to $172 million, reported EBIT up by 23% to $15 million and reported net profit after tax at $12.9 million, up by a pleasing 34% after a first-half loss.
The growth in revenue over the year was contributed predominantly by outstanding growth from the non-health business segments, which now represent over 48% of total revenue. The shift towards a more balanced revenue mix is expected to continue through FY17, with Health expected to contribute less than 50% of the company’s revenue in the current financial year.
Overall sales volumes increased 10% in FY16, driven by growth in both the Life & General Insurance and the Energy & Telecommunications businesses. These newer businesses and others in the pipeline are expected to continue to provide strong future growth for iSelect.
Our Health business returned to growth in the second half after a disappointing result in the first half. The external market environment in the health insurance sector continues to suffer from affordability headwinds and FY16 was the first year in almost a decade where participation in private health insurance declined in Australia. The softness in the market contributed to a reduction in leads of 9%, however this was offset in part by the average revenue per sale increasing by 18%.
BALANCE SHEET STRENGTH AND CAPITAL MANAGEMENT PROGRAMCash on the balance sheet increased year-on-year, showing the strong cash-generation capability of the Company. The cash balance of $87.6 million at 30 June 2016 represents an increase of 24% from June 2015. This strong cash position is in addition to almost $25 million that was used in the Board’s capital management program. FY16 saw iSelect pay its maiden fully-franked dividend to shareholders as well as the commencement of the on-market buyback. The share buyback resulted in the net assets of the Company being reduced by $12.3 million.
YOUR BOARD AND CORPORATE GOVERNANCEOne of my highest priorities when I commenced as Chair was to kick-off a full review of the Board and its processes. I and all your Directors recognise the need for the highest standards of corporate behaviour and accountability across the whole business, and particularly at board level. Corporate governance of the highest quality is essential and is, and will remain, my core focus as chairman.
With the retirement of two directors early in the financial year, we appointed a highly qualified additional board member in Melanie Wilson. Melanie rounds out our board renewal process and particularly the independent membership of the board.
During FY16, we undertook a full review of the management and board’s processes and performance and the outcomes will deliver corporate governance standards of the highest order.
OUTLOOKYour Board are very positive about the year ahead. The recovery of our Health business continues into the new financial year, despite external commentary about industry softness. With the management restructure now settled, I am confident that the new alignment of industry sectors will enable the senior management to continue to deliver outstanding results, with diversification of the Company’s revenue a demonstration of the success of iSelect’s broadening offering to customers.
Finally, I would like to thank you, our shareholders, for your support and the entire iSelect team of dedicated, talented employees for their ongoing efforts.
Regards,
Chris Knoblanche AM Chairman
Chris Knoblanche AM Chairman
CHAIRMAN'S LETTERIS
EL
EC
T A
NN
UA
L R
EP
OR
T 2
016
2

Health Energy Broadband TravelInsurance
Home Loans
Health Car
Health
Home & Contents
Home Loans
Car Home Loans
Home & Contents
Health Energy Broadband TravelInsurance
LifeEnergy Broadband TravelInsurance
iSelect’s Customer Lifetime value model is underpinned
by our “no churn” policy. We don’t proactively reengage
a customer in a business segment where they have
purchased from us in the past.
ISELECT JOURNEY THROUGH LIFE STAGES
“ Service with a smile! My first call is always to iSelect whenever I decide to shop around for my insurance.”
Antonia,Hadfield,VIC
ISE
LE
CT
AN
NU
AL
RE
PO
RT
20
16
3
CHAIRMAN'S LETTER

CEO’s Report
A CUSTOMER-CENTRIC APPROACH WILL DELIVER RESULTSPutting the customer front-and-centre is a fundamental plank in our corporate strategy. The organisational restructure implemented in November last year re-focused our business around the customers’ needs. That, and the investments we are making in technology and a new Customer Experience Platform, will all combine to deliver a truly effortless customer experience.
Ensuring that we meet, or in fact exceed, customer expectations about where, when and how we deliver our services to them will drive our business to greater heights. We are well underway on this journey and will continue to work hard throughout the coming year to achieve this goal.
OPERATIONAL TURNAROUND – 2016: A YEAR OF CHANGE FY16 was a year characterised by two very different halves. The first half saw numerous challenges at the business coalface. We encountered a number of substantial strategic and operational issues that had to be addressed, predominantly in the Health segment. In the first half, Health was impacted by an irregular and material reduction in sales conversion and an off-trend, significant increase in staff costs. Following my appointment, we immediately implemented remedial action by addressing staffing levels and recruitment selection and training. I am pleased to report that these actions succeeded and the Health business returned
to growth and, importantly, profitability, in the second half. As noted in the Chairman’s letter, our performance turnaround in Health has continued despite the softness in the external health insurance market. This tells me that iSelect is offering customers a service that they want and, in fact, need.
Pleasingly, our Energy & Telco and Life & General Insurance segments displayed continued growth throughout the entire financial year, and this is continuing during the early stages of the current period.
BRAND REFRESH As most of you will have noticed, we have relaunched our brand – moving away from “Mr iSelect” to our customer-first creative platform of “Always get it right”. Following this relaunched creative, our prompted brand awareness amongst Australians reached a staggering 87% - not far behind some of the largest global brands. Helping our customers to Always get it right has resonated!
Our website was relaunched in the second half also, with a focus on improving the customer experience. The new single, dedicated homepage has simplified access for customers and has improved our cross-segment product awareness.
Our digital marketing program has continued to be enhanced, with an increasing online presence and investment during the year. As a result we continue to see consumers engaging with iSelect across mobile devices and digital channels such as Facebook and YouTube at a dramatically increasing rate.
ENHANCING THE ISELECT MARKETPLACE – CREATING THE ‘NETWORK EFFECT’ FOR STRONGER PARTNERSHIPSIn FY16, we welcomed seven new partners to the iSelect marketplace, with our offering now including over 100 partner companies and more than 150 partner brands. With the continued growth in customer leads and the number of partner brands ever increasing, we are experiencing an improved “Network Effect”. As more customers purchase more products through iSelect and volumes increase, we are seeing more partners wanting to work with iSelect which in-turn increases the relevance for customers; a continuous and virtuous circle.
I am anticipating ongoing growth in our partner relationships as we expand our offering to customers through new business segments. We will continue to launch new product segments based on customer demand and expectations, as well as adding new brand offerings within existing verticals.
LEVERAGING DATA – A COMPETITIVE ADVANTAGE FOR ISELECTI am particularly proud of the progress we have made over the year with iSelect’s proprietary iConnect platform. The rollout has been completed in the Health business and is progressing well through the other verticals.
“ iSelect’s vision is to be Australia’s Life Admin Store. In order to achieve that, we believe it is essential to focus wholly on the customer.”
Scott Wilson Chief Executive Officer
CEO’S REPORTIS
EL
EC
T A
NN
UA
L R
EP
OR
T 2
016
4

We have doubled the number of data scientists that work with the commercial teams, as we see iConnect and data analytics as a major strength and competitive advantage.
Leveraging ‘big data’ is allowing us to service customers even better. The ever-refreshing algorithms within iConnect continually analyse our data to ensure that the right customer is served by the right consultant at the right time. Matching the needs of customers with consultants increases customer satisfaction, delivering a better customer experience which in turn increases sales conversion and business performance.
CONTINUED GROWTH EXPECTED, AND CONTINUED INVESTMENTI join the Board in their positive outlook for iSelect in the coming years. We have witnessed the dramatic turnaround in our Health business and the astonishing growth in Energy & Telco and Life and General Insurance. I believe these last two will be the growth drivers for iSelect in the near term. The momentum in our businesses has continued into the start of FY17, providing a solid base to the current period.
To ensure that the growth is maintained we will continue our investment in marketing and technology in FY17 including the recently announced Salesforce customer relationship management tool and Aspect’s Customer Engagement Centre. The installation of these two new platforms will transform the way we are able to serve
customers. They will enable us to deliver a consistent customer experience across voice, mobile, web and messaging platforms, and transform our current Customer Contact Centre from a ‘call centre’ to an ‘engagement centre’: creating a truly effortless customer experience.
Finally I would like to join our Chairman, Chris, in thanking our team of highly talented and dedicated professionals who work tirelessly in our pursuit of becoming Australia’s Life Admin Store.
Regards,
Scott Wilson Chief Executive Officer
“ Amazing service - a quick and easy phone call to get life’s mundane things in order!”
Nicholas, Dandenong Nth, VIC
ISE
LE
CT
AN
NU
AL
RE
PO
RT
20
16
5
CEO’S REPORT

Highlights 2016
REVENUE UP
9%
BALANCE SHEET: CASH UP
24%to $87 million
EBIT UP
23%
MAIDEN DIVIDEND DECLARED
2.5¢
fully franked total - FY16
FY16 KEY FINANCIAL HIGHLIGHTS
to $172 million to $15 million
NPAT UP
34%to $12.9 million
REVENUE PER SALE UP
2%
CONVERSION RATE STABLE AT
9.9%
UNIQUE VISITSTO ISELECT WEBSITE
9mCUSTOMER LEADS UP
7%
SALES UNITS UP
10%
FY16 KEY OPERATIONAL HIGHLIGHTS
to $466
up 1 million to 4 million to 397,000
Despite a challenging start within the Health segment, FY16 saw solid overall improvement in the Group’s major operational and financial performance, with the growth in the newer businesses being particularly strong.
HIgHLIgHTS 2016IS
EL
EC
T A
NN
UA
L R
EP
OR
T 2
016
6

“ iSelect found me great value for my car insurance with all the extras I wanted. I was so pleased with the service and savings. Thank you!”
Melissa, iSelect Customer
To become Australia’s
LIFEADMIN STORE
iSelect’s Vision
ISE
LE
CT
AN
NU
AL
RE
PO
RT
20
16
7
HIgHLIgHTS 2016

Segment Performance
CONVERSION UP
48%
CAR SALES UNITS UP
50%
LIFE REVENUE UP
26%
LIFE AND GENERAL INSURANCE
Continued improvements in operational metrics:
• Joint business planning with partners enhancing relationships, processes and product innovation
• Stabilised our frontline (sales) leadership teams in both Life and General Insurance
• Expanded General Insurance provider panel delivered strong sales unit increases
LIFE & GENERAL INSURANCE $M FY16 FY 15 CHANGE %
Revenue 32.7 24.7 33%
EBITDA 11.9 7.8 53%
Margin % 36.3% 31.4% 4.9pp
• Investing for FY17 growth plans:
• marketing and staffing
• transformation of processes and systems
HEALTH INSURANCE
Increased focus on our customer ‘needs based’ approach delivered:
REVENUE PER SALE (RPS) UP
18%
NET PROMOTER SCORE (NPS) A RECORD
+59 IN JUNE
• First half FY16 issues in contact centre impacted negatively on Health segment performance
• Changes to recruitment and training of sales consultants significantly improved conversion in the second half with Health returning to growth in H2
HEALTH INSURANCE $M FY16 FY 15 CHANGE %
Revenue 90.0 93.5 (4%)
EBITDA 15.0 22.5 (35%)
Margin % 16.6% 24.1% (7.5pp)
• Joint product development with strategic partners improved product coverage and options for customers
• Improved diversification of lead sources helped offset slowing industry growth
SEgMENT PERFORMANCEIS
EL
EC
T A
NN
UA
L R
EP
OR
T 2
016
8

ENERGY & TELECOMMUNICATIONS
Telco delivering explosive growth in leads, conversion and revenue:
Energy: Closer partner collaboration and product development resulted in improved RPS and conversion
EnergyWatch: Performance enhanced following return of sales operation to Australia and embedding iConnect
Telco: Platform and process optimised to increase efficiency and end to end sales performance
ENERGY & TELCO $M FY16 FY 15 CHANGE %
Revenue 40.2 30.0 34%
EBITDA 1.7 1.7 2%
Margin % 4.2% 5.5% (1.3pp)
TELCO LEADS UP
60%
TELCO CONVERSION UP
70%
TELCO REVENUE UP
250%
Partnerships:
• YourPorter partnership enhanced ‘Mover’ proposition, increasing Energy & Broadband cross-serve (multi-solution selling)
• NBN currently represents 25% of all iSelect residential and fixed broadband sales and is expected to increase due to formal NBN partnership
Home loans performing well with main focus on improving conversion through digital platforms and tech solutions – aiming to remove ‘pain points’ of the traditional approval process
• This ‘digitisation’ of home loan approvals is ground-breaking; a true representation of iSelect’s innovation culture
• Run-rate of 30% of home loan sales now via the iSelect-built fully digital approval process
• Macquarie named winner of iSelect’s Partner Award for Innovation – for its involvement in the home loan digitisation programme
Credit Cards, Travel Insurance and Mobile phones businesses planned and built in FY16, and launched in early FY17
• These emerging business are expected to provide a broadening base of lead generation and cross-serve opportunities
EMERGING BUSINESSES
ISE
LE
CT
AN
NU
AL
RE
PO
RT
20
16
9
SEgMENT PERFORMANCE
Brand and Marketing
We relaunched the entire brand platform in FY16, shifting our market positioning as the group expands further from its already dominant share of the private health insurance sector.
As our non-health verticals continue to grow, we needed to refresh our brand in line with our aspiration to become Australia’s life admin store.
Our new ‘Always Get it Right’ brand platform builds on the humour-based history of the brand to celebrate the sense of confidence anyone can get when they purchase through iSelect.
Our new creative highlights that iSelect will help customers make the right decision and buy – not just compare – when it comes to the boring but important stuff in life. At iSelect we’re all about putting our customers first and, such as, our new creative heroes our customers, not the company.
FY16 BRAND ACHIEVEMENTS
SOCIAL MEDIA REACH OF
7.9mAUSTRALIANS
87%PROMPTED BRAND AWARENESS BY AUSTRALIANS...OF THESE
34%INDICATED PURCHASE INTENT
1:1 MARKETINg
+18mEMAILS SENT
TOTAL LEADS
4m
BRAND UPDATEIS
EL
EC
T A
NN
UA
L R
EP
OR
T 2
016
10

ISE
LE
CT
AN
NU
AL
RE
PO
RT
20
16
11
BRAND UPDATE
Partners
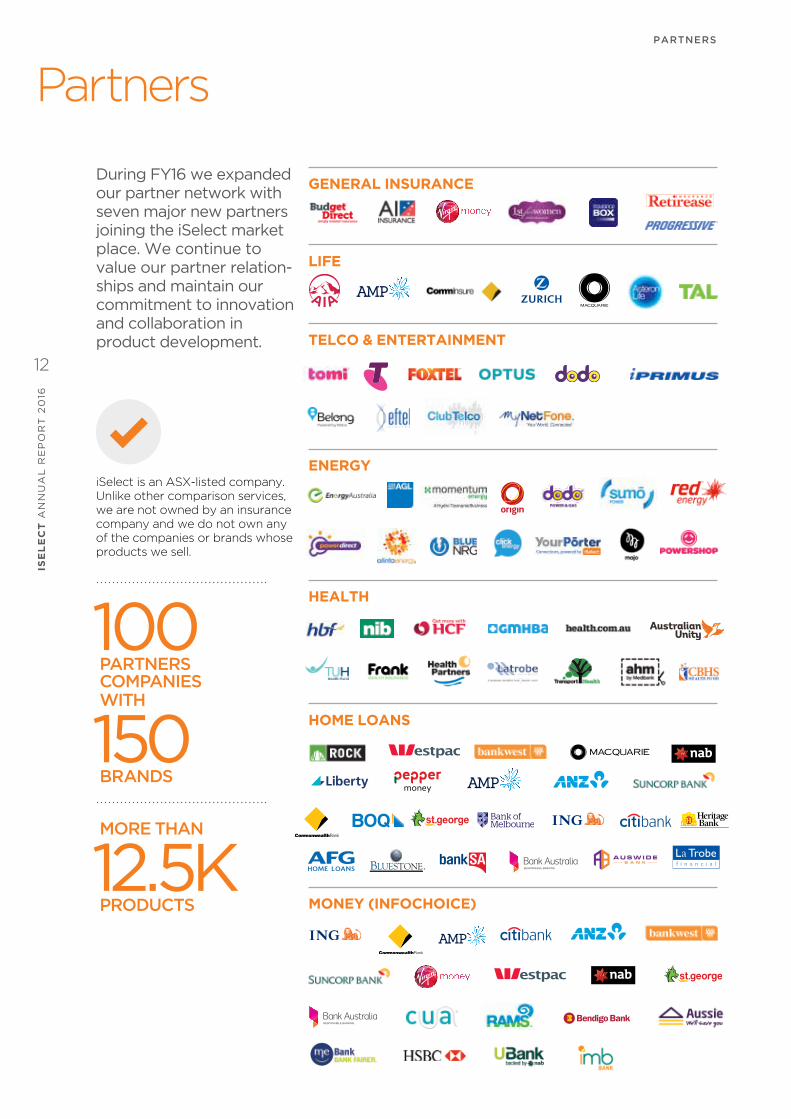
100PARTNERS COMPANIES WITH
150
BRANDS
MORE THAN
12.5KPRODUCTS
GENERAL INSURANCE
LIFE
TELCO & ENTERTAINMENT
ENERGY
HEALTH
HOME LOANS
MONEY (INFOCHOICE)
During FY16 we expanded our partner network with seven major new partners joining the iSelect market place. We continue to value our partner relation-ships and maintain our commitment to innovation and collaboration in product development.
iSelect is an ASX-listed company. Unlike other comparison services, we are not owned by an insurance company and we do not own any of the companies or brands whose products we sell.
PARTNERSIS
EL
EC
T A
NN
UA
L R
EP
OR
T 2
016
12

Life Admin Storefor all Australians
Average customer age
42yrsHalf our customers are aged
30-49yrs
Oldest customer by segment:Health 103 yrs Car 87Broadband 80Life 83Home loans 98Energy 100
Accessible to all Australians33% of our sales are to regional customers
iSelect Customers3,000
2,000
1,000
10
“ Great service, always super helpful and knowledgeable. They do all the heavy lifting and you get the rewards! Fantastic!”
Nathan, St Kilda, VIC
ISE
LE
CT
AN
NU
AL
RE
PO
RT
20
16
13
PARTNERS

Our People and Culture
At iSelect, we are proud to employ more than 600 talented Australians across two locations in Melbourne. We know that our employees are our point of difference. The personally tailored advice delivered by our highly-trained consultants is what sets us apart from our competitors.
To meet our ambitious growth aspirations, we must attract, develop and retain the best people who are committed to always putting our customers first. Our culture and values are integral to us becoming an Employer of Choice.
WE CARE | WE EMPOWER | WE LEAD
2016 PEOPLE AND CULTURE HIGHLIGHTS
Early in FY16 we renewed our senior leadership team and organisational structure and continued to develop the leadership capabilities throughout each of the renewed business segments.
We expanded to a second customer contract centre in East Bentleigh, Victoria.
We improved the recruitment and on-boarding experience by introducing an “iSelection” Assessment Centre and “iWelcome” Induction Programme.
We launched the “iSelect Academy”, redesigned and rolled out the improved “iSell” Sales Training Programme to improve employee satisfaction and results in the sales engines of our business.
ISELECT VALUES AND BEHAVIOURS
VALUES HAVE HEART KEEP IT REAL BE BRAVE CELEBRATE
BEHAVIOURS Empathy & Unity
Open & Honest Positive Intent
Be you Be Curious
Praise Play
OUR PEOPLE AND CULTUREIS
EL
EC
T A
NN
UA
L R
EP
OR
T 2
016
14

“ I was looking for a new Wi-Fi and broadband plan. The helpful, polite and informative sales consultant, Kellie, made this decision very quick and easy for me. I would recommend iSelect to anyone.”
Michelle, Ascot, WA
84% OF CUSTOMERS
AGREE
iSELECT IS LOW EFFORT
Making it easy:
ISE
LE
CT
AN
NU
AL
RE
PO
RT
20
16
15
OUR PEOPLE AND CULTURE

Board Members
Chris Knoblanche AM
Chairman & Independent Non-Executive Director
Chris joined the iSelect Board as Chairman and Independent Non-Executive Director on 1 July 2015 and brings significant experience in strategy and financial services to the Board, along with a proven track record of creating a best practice corporate governance environment.
He currently serves on the Boards of Greencross Limited (ASX:GXL), GE Capital/Money Australia (Hallmark Companies), Environment Protection Authority NSW, Norton Rose Fulbright – Lawyers, and Sydney Opera House. He has also served as an adviser to and on the Board of Aussie Home Loans. In addition, he has considerable expertise as the Chair of several board-level audit and risk committees.
Mr Knoblanche is a chartered accountant and has extensive CEO, executive and financial markets experience, having served as Managing Director and Head of Citigroup Corporate and Investment Banking (Australia and NZ), a partner in Caliburn (now Greenhill Investment Bank) and CEO of Andersen Australia and Andersen Business Consulting – Asia.
Chris holds a Bachelor of Commerce (Accounting and Financial Management) and is a Member of the Institute of Chartered Accountants in Australia (ACA), and Fellow of the Australian Society of CPAs (FCPA).
In 2014 Chris was awarded an Order of Australia (AM) for significant service to arts administration, the community and the business and finance sector. In 2000 Chris was awarded the Centenary Medal by the Australian Government for services to the arts and business.
Damien Waller
Non-Executive Director, Co-founder
Damien is an Australian online entrepreneur based in Melbourne, Australia and is a non-Executive Director of iSelect. Damien co-founded iSelect in 2000 and since then the Company has grown to become Australia’s leading multi-channel comparison service.
In recent years, Damien spearheaded the expansion of the Company into new underlying markets including Home Loans, Money and Energy. Damien’s position within iSelect has evolved over the years and has included Managing Director, CEO, Executive Chairman, and now non-Executive Director.
Prior to iSelect, Damien was recruited by JB Were & Son via its elite graduate program. Damien is currently a director of Nimble Money Pty Ltd, and other related Nimble entities.
Damien is a Fellow of FINSIA (the Financial Services Institute of Australasia) and a member of the Australian Institute of Company Directors (AICD).
Shaun Bonett
Independent Non-Executive Director, Chair of Renumeration and Nomination Committees
Shaun was appointed to the iSelect Board in May 2003. Shaun founded and is the Chief Executive Officer of Precision Group, an investor, developer and financier of retail and commercial property across Australia. Precision Group owns over A$1 billion of commercial assets in Australia and has diversified its business into financial services and private equity investments, primarily in the IT and health sectors.
Shaun is a qualified lawyer and Barrister and Solicitor of the High Court of Australia and previously held various corporate advisory roles with publicly listed and private companies. He is also a member of the AICD and Young Presidents’ Organisation.
Shaun is also a Director and Chairman of Litigation Lending Services Ltd. Shaun is founder and trustee of the Heartfelt Foundation, an Australian charitable trust.
BOARD MEMBERSIS
EL
EC
T A
NN
UA
L R
EP
OR
T 2
016
16

Bridget Fair
Independent Non-Executive Director
Bridget was appointed to the iSelect Board in September 2013 and is a senior media executive with over 20 years’ experience in government relations, business strategy, corporate affairs and commercial negotiation.
Bridget is currently Group Chief of Corporate and Regulatory Affairs at Seven West Media, following 13 years as Head of Regulatory and Business Affairs at the Seven Network. Between 1995 and 2000, Bridget held the position of General Counsel for SBS. Prior to this, she was legal counsel for the ABC and practiced as a solicitor at law firm Phillips Fox, now DLA Piper.
Bridget occupies Board positions at Freeview Australia Limited and Free TV Australia Limited.
Bridget holds a BA/LLB from the University of New South Wales (UNSW).
Brodie Arnhold
Independent Non-Executive Director, Chair of Audit and Risk Committee
Brodie joined the iSelect Board in September 2014 and has over 15 years’ domestic and international experience in private equity, investment banking and corporate finance.
Prior to his current role as CEO of Melbourne Racing Club, Brodie worked for Investec Bank from 2010-2013 where he was responsible for building a high-net-worth private client business. Prior to this, Brodie worked for Westpac Banking Corporation where he grew the institutional bank’s presence in Victoria, South Australia and Western Australia, and from 2006-2010 held the role of Investment Director at Westpac’s private equity fund.
During his career Brodie has also worked at leading accounting and investment firms including Deloitte (Australia), Nomura (UK) and Goldman Sachs (Hong Kong).
Brodie holds a Bachelor of Commerce and MBA from the University of Melbourne and is a member of the Institute of Chartered Accountants Australia (ICAA).
Melanie Wilson
Independent Non-Executive Director
Melanie joined the iSelect board in April 2016 and brings extensive experience in online business and digital marketing. In her former role as Head of Online for BIG W she managed Australia’s largest general merchandise e-commerce website.
Melanie has more than 12 years’ experience in senior management roles across Australian and global retail brands including Limited Brands (Victoria’s Secret, Bath & Bodyworks), Starwood Hotels and Woolworths. She also held corporate finance and strategy roles with leading investment banks and management consulting firms including Goldman Sachs and Bain & Company.
Melanie is currently a non-executive Director of Baby Bunting Group Ltd (ASX: BBN).
Melanie holds a Master in Business Administration (MBA) degree from the Harvard Business School and Bachelor of Commerce (Honors) degree from University of Queensland.
ISE
LE
CT
AN
NU
AL
RE
PO
RT
20
16
17
BOARD MEMBERS

Leadership Team
Scott Wilson Chief Executive Officer
Scott joined iSelect in February 2013 and was appointed to the role of Chief Executive Officer in October 2015. Prior to his current role, Scott was Commercial Director of iSelect and maintained overall responsibility for the company’s individual business units and product provider relationships.
Scott has over 20 years of sales and key account management experience within multinational fast-moving consumer goods and entertainment companies. Prior to joining iSelect, Scott was Sales Director (Australia & New Zealand) for 20th Century Fox Home Entertainment, Sales Director at PZ Cussons, following senior national sales roles at SPC Ardmona.
Scott holds a Master of Business and Graduate Certificate of Business Administration from The University of Newcastle.
David Christie Chief Administrative Officer, General Counsel and Company Secretary
David joined iSelect in September 2013 and leads the group’s legal, compliance, operations, human resources, IT and Company Secretary functions.
David has over 20 years’ experience as a senior legal executive and prior to joining iSelect served as Global Head of Legal for Renaissance Capital Limited, where he maintained global responsibility for legal affairs, including M&A, litigation and intellectual property matters.
Between 2004 and 2006, David held the position of Senior Lawyer with Deutsche Bank AG (UK), London, prior to which he held legal roles of increasing responsibility with Simmons and Simmons Lawyers London, and Minter Ellison Lawyers Sydney.
David holds a BA / LLB Law from the University of Canberra, and a LLM in International Law from the University of Edinburgh, Scotland.
Darryl Inns Chief Financial Officer
Darryl joined iSelect in July 2016 and oversees the group’s financial activities and operations.
Prior to joining iSelect, Darryl was CFO of the M2 Group, which has since merged with Vocus Communications. During his 15 years with the company, Darryl helped grow M2’s value and was closely involved key acquisitions which together resulted in M2 becoming an ASX 200 company.
An experienced CFO, Darryl has also held senior finance roles within technology and manufacturing companies in both Australia and the United Kingdom. Specialising in fast-growing, listed companies, Darryl has a proven track record in change management, integration, and mergers and acquisitions.
Darryl holds a Bachelor of Business in Accounting from University of South Australia and he is a fellow of both Certified Practising Accountant (CPA) and Governance Institute of Australia (formerly Chartered Secretaries Australia).
Geraldine Davys Chief Marketing Officer
Geraldine re-joined iSelect in August 2016 as CMO, having earlier spent almost two years as iSelect’s Director of Marketing and Customer Experience.
Her career has spanned executive marketing, product and customer experience roles within blue chip organisations both in Australia and overseas, and she has received a number of awards for her innovative approach to marketing.
During her time away from iSelect, Geraldine spent 16 months as Executive Director, Marketing and Customer Experience at General Motors Holden. Geraldine led all aspects of Holden’s marketing communications, product marketing, digital and content marketing, sponsorship and customer experience.
Prior to first joining iSelect, Geraldine held senior marketing and business strategy roles within a diverse range of organisations and industries, including Lend Lease, Arthur Andersen Business Consulting, Westpac and Sensis (Telstra Media).
Geraldine holds both a Bachelor of Business (Marketing) with Honours and a Bachelor of Arts (Politics and Industrial Relations) from Monash University. She also has an MBA from the Australian Graduate School of Management (AGSM) at the University of New South Wales.
LEADErShIp TEAMIS
EL
EC
T A
NN
UA
L R
EP
OR
T 2
016
18

Michael Siwes group Executive – Health
Michael joined iSelect in April 2012 and was appointed to the role of Group Executive for Health in November 2015 following three years in senior leadership roles within the health business.
Michael has nearly 20 years’ experience in finance, business intelligence, partnership and leadership roles and a proven track record of helping business partners deliver their strategic goals through a ‘customer first’ approach. Michael’s experience spans the digital marketing, superannuation and financial advisory industries and he has worked for a range of companies including REA Group, Superpartners and PricewaterhouseCoopers.
Michael holds a Bachelor of Computing from Monash University and is a board member of the Private Health Insurance Intermediaries Association (PHIIA).
Angela Tangas group Executive – Energy & Telco
Angela joined iSelect in October 2014 and was appointed to the role of Group Executive for Energy & Telco in November 2015. Prior to her current role, Angela was the Head of Category for iSelect’s Energy, Car and Telco verticals.
With over 10 years of digital experience, Angela has successfully led and managed implementation of multiple new and incremental digital revenue streams, with a focus on enabling realisation of optimal customer experiences via new E2E business models, product innovation and strategic partnerships.
Prior to joining iSelect, Angela spent six years at Sensis in various senior commercial and product roles, a highlight of which included the introduction of consumer rating and review site, Yelp into the Australian market.
Angela holds a Bachelor of Business (Marketing/Finance Major) from La Trobe University.
Michael Keyte group Executive – Life & general Insurance
Michael joined iSelect in March 2015 and was appointed to the role of Group Executive for Life & General Insurance in November 2015.
Prior to his current role, Michael was Head of Commercial for iSelect’s Energy & Telco Business where he was responsible for establishing and developing product partner relationships.
Michael has over 20 years of senior sales and operational experience across a range of consumer goods companies including Treasury Wine Estates, L’Oréal, George Weston Foods, Levi Strauss & Co. and Campbell Arnotts.
Michael holds a Bachelor of Business from Monash University.
Alan Caputo group Executive - Financial Services
Alan joined iSelect in May 2006 and was appointed to the role of Group Executive for Financial Services in November 2015. Alan was initially recruited by iSelect as a Sales & Operations Manager to establish a Life Insurance vertical.
The strong growth of the Life Insurance business under Alan’s leadership led to the expansion of his portfolio and in 2009 he was appointed General Manager for iSelect’s Home Loans, Life and General Insurance businesses.
Alan has over 14 years’ experience working in the financial services sector specialising in sales and distribution, including roles at both ANZ and Commonwealth Bank.
Alan holds an Advanced Diploma of Financial Planning from Kaplan.
Edward Alder group Executive – growth
Ed joined iSelect in March 2014 and was appointed to the role of Group Executive for Growth in November 2015. Prior to his current role, Ed was iSelect’s Head of Corporate Development.
Ed has spent over 15 years in roles encompassing strategy, mergers and acquisitions (M&A), corporate development, capital raisings, distressed banking and working capital management. He also has extensive experience strategic business reviews of key stakeholders.
Prior to joining iSelect, Ed worked at M&A Partners as a senior member of their corporate advisory team, ANZ Bank and in various roles at Ernst and Young across the United Kingdom, Europe and Australia.
Ed holds a Bachelor of Business (Marketing) from RMIT, a Masters of Marketing from Monash University and is a member of the Institute of Chartered Accountants of Scotland.
ISE
LE
CT
AN
NU
AL
RE
PO
RT
20
16
19
LEADERSHIP TEAM

“ iSelect helped with my gas, electricity and internet connections at my new house. Both operators I dealt with were really friendly and extremely helpful. I was also surprised at how quick the process was! Very happy iSelect customer, I would definitely use them again and recommend them to my family and friends. Thank you iSelect team!”
Jessica, Thornbury, VIC
IS
EL
EC
T A
NN
UA
L R
EP
OR
T 2
016
20

Financial ReportFor the year ended 30 June 2016
ISE
LE
CT
AN
NU
AL
RE
PO
RT
20
16
21
FINANCIAL REPORT

Directors’ Report
The Directors present their report with the consolidated financial statements of the Group comprising iSelect Limited and its subsidiaries for the financial year ended 30 June 2016 and the auditor’s report thereon.
DIRECTORSThe names of the Directors in office during or since the end of the financial year are:
Chris Knoblanche AM Non-Executive Chairman – appointed 1 July 2015
Brodie Arnhold Non-Executive Director
Shaun Bonètt Non-Executive Director
Bridget Fair Non-Executive Director
Alex Stevens Managing Director – ceased effective 12 October 2015
Damien Waller Non-Executive Director
Leslie Webb Non-Executive Director – ceased effective 28 August 2015
Melanie Wilson Non-Executive Director – appointed 1 April 2016
The above named Directors held office for the whole of the period unless otherwise specified.
COMPANY SECRETARYDavid Christie
PRINCIPAL ACTIVITIESThe principal activities during the financial year within the Group were health, life and car insurance policy sales, mortgage brokerage, energy, broadband and financial referral services. There have been no significant changes in the nature of these activities during the year.
OPERATING AND FINANCIAL REVIEW1
GROUP FINANCIAL PERFORMANCE AND REPORTED RESULTS
Summary Financial Reported Results
FY16$000
FY15$000
CHANGE%
Operating revenue 171,865 157,214 9%
Gross profit 58,477 66,286 (12%)
EBITDA 21,495 18,591 16%
EBIT 15,034 12,263 23%
NPAT 12,905 9,638 34%
EPS (cents) 5.1 3.7 38%
Normalised EBITDA 23,372 31,143 (25%)
Normalised EBIT 16,911 24,815 (32%)
Normalised NPAT 14,219 21,420 (34%)
The Group operates in the online product comparison sector and compares private health insurance, life insurance, car insurance, broadband, energy, home loans and personal financial products. The Group maintains three brands, iSelect (www.iselect.com.au), InfoChoice (www.infochoice.com.au) and Energy Watch (www.energywatch.com.au). The Group’s business model is comprised of four key pillars that are linked: brand, lead generation, conversion and product providers. The Group derives the majority of its revenue from fees or commissions paid by product providers for successful sale of their products.
Normalised operating revenue in financial year 2016 was the same as reported operating revenue at $171,865,000 and was up 9% on the prior year. Normalised EBITDA was $23,372,000, down 25%. Normalised EBIT was $16,911,000, down 32%. Normalised NPAT was $14,219,000 down 34% and has been shown for the purposes of the guidance released to the Australian Stock Exchange in January 2016, which had a normalised EBIT range between
1 Throughout this report, certain non-IFRS information, such as EBITDA, EBIT, Conversion Ratio, Leads and Revenue Per Sale (RPS) are used. Earnings (profit) before interest and income tax expense (EBIT) reflects profit for the year prior to includ-ing the effect of net finance costs and income taxes. Earnings (profit) before interest, income tax expense, depreciation and amortisation and loss on associates (EBITDA) reflects profit for the year prior to including the effect of net finance costs, income taxes, depreciation and amortisation and loss on associates. The individual components of EBITDA and EBIT are included as line items in the Consolidated State-ment of Profit or Loss and Other Comprehensive Income. Non-IFRS information is not audited.
IS
EL
EC
T A
NN
UA
L R
EP
OR
T 2
016
22
$15,000,000 and $18,000,000. Refer to Note 6 “Other Items included in the Income Statement” for normalised expenses.
Reported results for the year have been normalised for the impact of the costs incurred for the Group restructure and exit of the Group’s, former Chief Executive Officer. For comparative purposes, reported earnings for financial year 2015 have been normalised for the impact of the NIA loan receivable impairment and associated one-off costs, costs incurred in relation to the acquisition and integration of the Energy Watch business, as well as for costs incurred in relation to the resignation of the Executive Chairman, and search for a Non-executive Chairman.
The commentary that follows considers the results for financial year 2016 compared with financial year 2015 on a reported basis.
Reported operating revenue in financial year 2016 was $171,865,000, up 9% on the prior year. Reported EBITDA was $21,495,000, up 16%. Reported EBIT was $15,034,000, up 23%. Reported net profit after tax (NPAT) was $12,905,000, up 34%.
The Group recorded solid year-on-year revenue growth particularly in its newer businesses. As noted above, operating revenue was up 9% on the prior year. Leads grew solidly compared to the prior year as a result of the significant marketing investment and brand relaunch driven predominantly by the Energy and Telecommunications segment. Conversion continued to improve on the prior year as a result of the improved continuation rates, the improved operational disciplines, and the continued roll out of the iConnect platform across various segments. Overall sales volumes increased 10% on the prior year driven by significant growth in both the Life and General and Energy and Telecommunications segments. Revenue per sale at Group level increased, despite being impacted by mix of business towards those with lower commissions. This was predominantly driven by improvements in both the Health and Energy and Telecommunications segment RPS.
Gross profit for the financial year 2016 was $58,477,000, down 12% on the prior year gross profit of $66,286,000. Gross profit margin decreased to 34% of operating revenue from 42% in the prior year reflecting the mix of business towards those with lower margins. The decline in gross profit was a result of both increases in direct staffing costs and deterioration of sales conversion in the first half primarily in the Health segment. In addition, direct marketing expenditure increased, particularly in the Energy and Telecommunications segment to support expected future growth.
Despite the poor first half result, as a result of the investments made in restructuring the business, the second half gross profit experienced a 5% growth on the prior year. Gross profit for the second half was $41,946,000 compared to $39,929,000 in the prior year.
Operating expenses totalled $37,227,000 and represented 22% of operating revenue. Operating expenses were down from the prior year by 22% or $10,677,000, predominantly as a result of the NIA impairment, Energy Watch acquisition and Executive chairman and replacement costs of $12,552,000. On a normalised basis, operating expenses were in line with prior year despite the 9% growth in revenue, and the poor first half performance.
Depreciation and amortisation was $5,723,000, a decrease of 5% on the prior year (2015: $6,015,000).
Net finance income for financial year 2016 was $2,079,000 compared with $5,768,000 in financial year 2015. This decrease reflects interest being earned on the Group’s loan to NIA Health Pty Ltd in prior year.
A loss from associates of $738,000 (2015: $313,000) was recorded in relation to the Group’s investment in iMoney.
KEY OPERATING METRICS
LeadsiSelect categorises a ‘lead’ across the business (except in the Money business unit within the Other segment) as a second-page visit to one of its websites, or an inbound phone call from a potential customer to the Business Development Centre. This is considered by management to be a more conservative metric than considering all the unique visits to the homepage as leads.
Leads for the Money business unit are sourced via the Infochoice website, which operates under a lead generation model providing a low cost source of leads. On this basis, a lead for the Money business unit is considered a visit to its website.
Conversion RatioOnce a lead is generated, iSelect provides purchase advice and information to the consumer either via its websites or its Business Development Centre. If that purchase advice results in a referral to a product provider and a sale is completed, then the lead is considered to have been converted. The conversion ratio is used to measure the efficiency in turning leads into sales. An increase in the conversion ratio increases iSelect’s earnings without the need for additional marketing spend. During financial year 2016, iSelect has leveraged efficiencies from its existing resources to achieve a greater number of sales from the same lead pool.
It should be noted that product sales are subject to claw back provisions and lapses (resulting from consumers deciding not to continue with their selected products). The conversion ratio as tabled below represents the ‘gross’ conversion of leads, before the impact of claw back and lapses. Under the lead generation model operated by the Money business unit, consumers are able to directly click through to product providers, which registers as a
ISE
LE
CT
AN
NU
AL
RE
PO
RT
20
16
23
DiReCtoRS' RepoRt

Conversion Ratio (continued)visit to the Infochoice website. As a result, the click-through is recorded without registering a corresponding lead as defined previously. As such, the conversion ratio metric just described is not meaningful for the Money business unit.
Revenue per SaleRevenue per sale (RPS) measures the average revenue generated from each lead that is converted to a sale. It should be noted the RPS of different products sold by Group varies considerably.
Consolidated Key operating Metrics
FY12 FY13 FY14 FY15 FY16
Gross Consolidated (excluding Money)
Leads (000s) 2,945 3,317 3,801 3,750 4,016
Conversion ratio (%)1 5.9% 6.7% 6.6% 9.7% 9.9%
Average RPS ($)2 590 515 549 457 466
Leads growth 54% 13% 15% (1%) 7%
Sales unit growth 75% 28% 13% 45% 10%
Money
Leads (000s) 874 1,693 1,962 2,254 1,900
Average revenue per click-through ($)3 3 3 6 7 7
Leads growth/(decline) n.m. 94% 16% 15% (16%)
1 Conversion ratio is calculated as the number of gross sales units divided by leads (i.e. the average percentage of leads that are converted into sales).
2 Average RPS is calculated as gross revenue divided by the number of gross sales units. 3 Average revenue per click-through for the Money business has been re-stated historically to better reflect the key drivers of the
part of the business that relies on leads and click throughs for the generation of revenue.
n.m. = not meaningful
Discussion of Consolidated Key operating Metrics for the 2016 Financial YearThe consolidated key operating metrics for the financial year 2016 are discussed in more detail below. Key operating metrics by segment are also discussed in this Operating and Financial Review, in the section on Segment Performance.
Leads Growth for the Financial Year 2016Leads (excluding Money) increased by 7% to 4,016,000. The Energy and Telecommunications segment in particular showed strong growth. All other businesses (again excluding Money) recorded a decline in leads which was largely a managed result, but also reflected a softer market in Health over the financial year.
As already noted, a lead for Money is considered a visit to the InfoChoice website and is reported separately to leads for the other businesses where a lead is a second-page visit to the website, with consumers having entered a level of personal information. Money leads were down 16% on prior year as a result of an ageing website and increase in competition in the financial comparison space.
DiReCtoRS' RepoRtIS
EL
EC
T A
NN
UA
L R
EP
OR
T 2
016
24

Conversion Ratio for the Financial Year 2016Despite the solid growth in leads, conversion was able to be held stable with a small increase by 0.2 percentage points (pp) to 9.9% for the year, excluding Money. This continued ability to improve conversion in a lead growth environment, is a pleasing result for the Group. Improvements occurred in the Life and General segment with the other segments performing lower than prior year. The decline in the Health segment is a direct result of the staffing issues faced by the business in the first half and has improved over the second half. The continued roll out and improvement of the iConnect capabilities across the business with more intelligent data capture, customer needs assessment, skills based routing and training of the business development centre and focus on people are key drivers of this in the second half.
Revenue per Sale for the Financial Year 2016RPS increased by 2% to $466, excluding Money, driven by changing mix in contribution from each business. In particular, strong growth in Health, which has a higher RPS than the Group average, contributed to this result. The RPS in the Energy and Telecommunications segment continued to grow on the prior year but is still at a lower RPS than the Group average. This is further discussed in the Segment Performance section below.
SEGMENT PERFORMANCEThe Group reports segment information on the same basis as the Group’s internal management reporting structure at reporting date. Post a business restructure in October 2015, the segments were also restructured to align to the internal reporting framework. Commentary on the performance of the three reportable segments follows.
HEALTH INSURANCEThe Health Insurance segment offers comparison and referral services across the private health insurance category.
FINANCIAL PERFORMANCE
FY16$000
FY15$000
CHANGE%
Operating revenue 89,961 93,450 (4%)
Segment EBITDA1 14,951 22,525 (34%)
Margin % 16.6% 24.1% (7.5pp)
KEY OPERATING METRICS FY16 FY15
CHANGE%
Leads (000s) 1,272 1,399 (9%)
Conversion ratio (%) 9.2% 9.8% (0.6pp)
Average RPS ($) 894 759 18%
1 Segment EBITDA excludes certain corporate overhead costs that are not allocated at segment level.
Operating revenue decreased by 4% to $89,961,000. Leads were lower than the prior comparative period, reflective of the softer than expected Health insurance market over the financial year. Although conversion was down on the prior period, this was predominantly impacted by the poor first half result. The implementation of the staffing and iConnect investments over the second half has stabilised the segment. RPS for the 2016 financial year grew significantly by 18% to $894. The second half of the financial year, and the last quarter in particular, saw an increase on the prior period.
Health insurance policy sales moved away from low value cover towards mid and top level products, which was driven by a market shift towards older customers in addition to a stronger focus on customer needs. The increased focus on customer needs also helped deliver higher conversion and customer satisfaction results (i.e. High Net Promoter Scores).
As a further result of changing sales mix in Health, there was also a significant shift towards upfront fee revenue and away from trail commission revenue. This change in Health was one of the major contributors to the corresponding change in the Group’s sales mix, which saw upfront revenue grow and trail commission revenue for current period trail commission sales decline.
The segment posted an EBITDA result of $14,951,000 compared with the prior year of $22,525,000. The poor first half performance is the driver behind the decline on prior year, however the second half performance significantly improved ending 5% higher than the prior year. The strategic refresh and initiatives implemented were the driving force behind the second half performance improvement.
ISE
LE
CT
AN
NU
AL
RE
PO
RT
20
16
25
DiReCtoRS' RepoRt
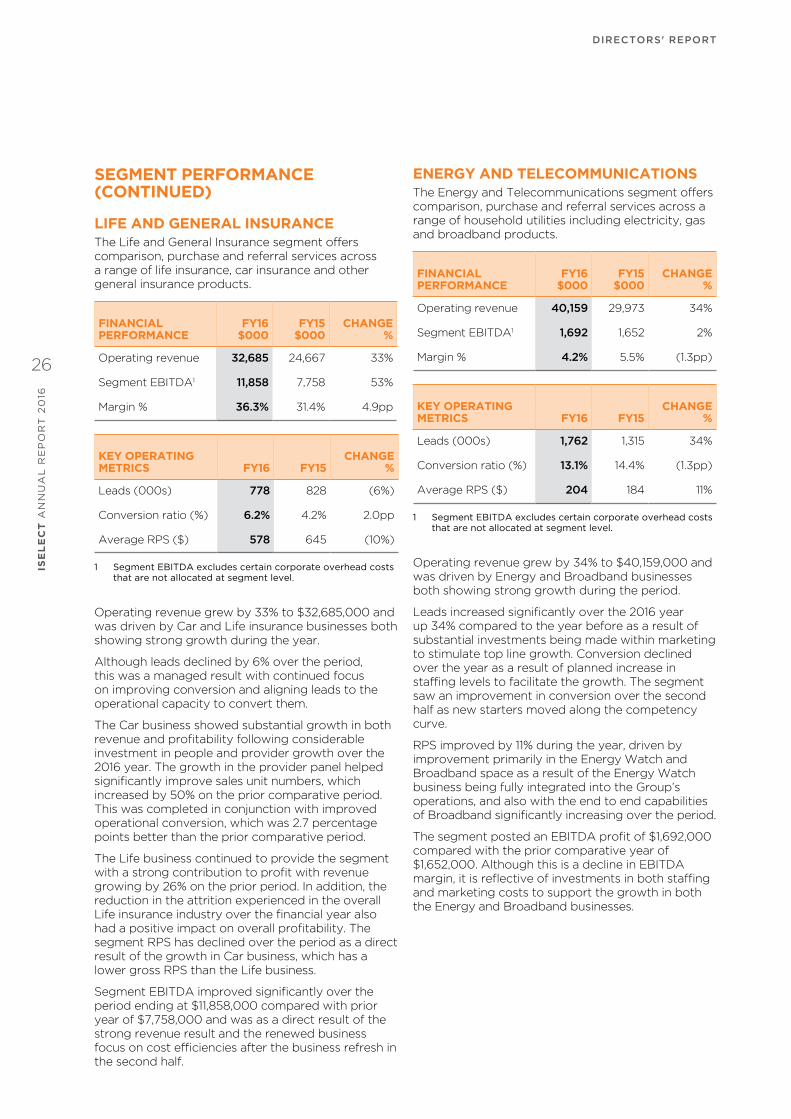
SEGMENT PERFORMANCE (CONTINUED)
LIFE AND GENERAL INSURANCEThe Life and General Insurance segment offers comparison, purchase and referral services across a range of life insurance, car insurance and other general insurance products.
FINANCIAL PERFORMANCE
FY16$000
FY15$000
CHANGE%
Operating revenue 32,685 24,667 33%
Segment EBITDA1 11,858 7,758 53%
Margin % 36.3% 31.4% 4.9pp
KEY OPERATING METRICS FY16 FY15
CHANGE%
Leads (000s) 778 828 (6%)
Conversion ratio (%) 6.2% 4.2% 2.0pp
Average RPS ($) 578 645 (10%)
1 Segment EBITDA excludes certain corporate overhead costs that are not allocated at segment level.
Operating revenue grew by 33% to $32,685,000 and was driven by Car and Life insurance businesses both showing strong growth during the year.
Although leads declined by 6% over the period, this was a managed result with continued focus on improving conversion and aligning leads to the operational capacity to convert them.
The Car business showed substantial growth in both revenue and profitability following considerable investment in people and provider growth over the 2016 year. The growth in the provider panel helped significantly improve sales unit numbers, which increased by 50% on the prior comparative period. This was completed in conjunction with improved operational conversion, which was 2.7 percentage points better than the prior comparative period.
The Life business continued to provide the segment with a strong contribution to profit with revenue growing by 26% on the prior period. In addition, the reduction in the attrition experienced in the overall Life insurance industry over the financial year also had a positive impact on overall profitability. The segment RPS has declined over the period as a direct result of the growth in Car business, which has a lower gross RPS than the Life business.
Segment EBITDA improved significantly over the period ending at $11,858,000 compared with prior year of $7,758,000 and was as a direct result of the strong revenue result and the renewed business focus on cost efficiencies after the business refresh in the second half.
ENERGY AND TELECOMMUNICATIONS The Energy and Telecommunications segment offers comparison, purchase and referral services across a range of household utilities including electricity, gas and broadband products.
FINANCIAL PERFORMANCE
FY16$000
FY15$000
CHANGE%
Operating revenue 40,159 29,973 34%
Segment EBITDA1 1,692 1,652 2%
Margin % 4.2% 5.5% (1.3pp)
KEY OPERATING METRICS FY16 FY15
CHANGE%
Leads (000s) 1,762 1,315 34%
Conversion ratio (%) 13.1% 14.4% (1.3pp)
Average RPS ($) 204 184 11%
1 Segment EBITDA excludes certain corporate overhead costs that are not allocated at segment level.
Operating revenue grew by 34% to $40,159,000 and was driven by Energy and Broadband businesses both showing strong growth during the period.
Leads increased significantly over the 2016 year up 34% compared to the year before as a result of substantial investments being made within marketing to stimulate top line growth. Conversion declined over the year as a result of planned increase in staffing levels to facilitate the growth. The segment saw an improvement in conversion over the second half as new starters moved along the competency curve.
RPS improved by 11% during the year, driven by improvement primarily in the Energy Watch and Broadband space as a result of the Energy Watch business being fully integrated into the Group’s operations, and also with the end to end capabilities of Broadband significantly increasing over the period.
The segment posted an EBITDA profit of $1,692,000 compared with the prior comparative year of $1,652,000. Although this is a decline in EBITDA margin, it is reflective of investments in both staffing and marketing costs to support the growth in both the Energy and Broadband businesses.
DiReCtoRS' RepoRtIS
EL
EC
T A
NN
UA
L R
EP
OR
T 2
016
26

FINANCIAL POSITION
Capital expenditure and Cash Flow
SUMMARY STATEMENT OF CASH FLOWSFY16
$000FY15
$000CHANGE
%
Net cash provided by operating activities1 10,775 30,600 (65%)
Net cash received/ (used) in investing activities 31,286 (36,571) 186%
Net cash used/ (received) by financing activities (24,992) 615 n.m.
Net increase/ (decrease) in cash 17,069 (5,356) 419%
1 Operating cashflow has been reclassified to include interest income received.
n.m = not meaningful
Operating cash inflow was $10,775,000 (being 65% lower than last year), which can be attributed to the poor first half result and the costs incurred with the additional investments made in the second half. In addition, the payment of $7,267,000 in income tax also contributed reduced the FY16 operating cashflow result when compared to $26,000 in the prior period. However, the business continued its shift in revenue mix towards upfront fees and away from trail commission revenue when compared to prior comparative period, seen through the increase in cash receipts year on year.
Investing cash inflows for the year ended 30 June 2016 totalled $31,286,000 and included $40,716,000 relating to the repayment of the NIA Loan facility. This was partially offset by an additional investment in iMoney and capital expenditure. Capital expenditure for financial year 2016 was $7,664,000 compared with $4,355,000 for the financial year 2015. Net financing cash outflows for the 30 June 2016 year totalled $24,992,000. This included $22,308,000 which was paid in relation to the on-market share buyback and $2,533,000 payment in relation to the Group’s maiden dividend.
Statement of Financial position
SUMMARY STATEMENT OF FINANCIAL POSITIONFY16
$000FY15
$000CHANGE
%
Current assets 155,606 176,235 (12%)
Non-current assets 142,913 131,012 9%
total assets 298,519 307,247 (3%)
Current liabilities 35,985 33,960 6%
Non-current liabilities 27,927 26,365 6%
total liabilities 63,912 60,325 6%
Net assets 234,607 246,922 (5%)
equity 234,607 246,922 (5%)
Net assets has decreased to $234,607,000 at 30 June 2016 from $246,922,000 at 30 June 2015.
Current assets has decreased from 30 June 2015 by 12% to $155,606,000. This is mostly as a result of the repayment of the NIA Loan facility on 31 July 2015 resulting in the decrease in other receivables. The share buybacks and tax payments effectively offset the corresponding net cash increase. In addition, the reduction in the trail commission asset is a reflection of the shift away to a higher proportion of upfront related providers within the Health segment and is also in line with the Group’s increase in trade receivables.
The current component of the trail commission receivable is $21,052,000 which is 25% lower than the balance at 30 June 2015.
ISE
LE
CT
AN
NU
AL
RE
PO
RT
20
16
27
DiReCtoRS' RepoRt

FINANCIAL POSITION (CONTINUED)
Statement of Financial position (continued)
Non-current assets has increased from 30 June 2015 by 9% to $142,913,000 largely a result of increases in the investments made in iMoney and capital expenditure as well as an increase in non-current trail receivable. The growth in the Life business over the period has resulted in an increase in the non-current component of trail commission receivable to $82,639,000, an increase of 13% from 30 June 2015.
Current liabilities increased from 30 June 2015 to 30 June 2016 by $2,025,000, or 6%, to $35,985,000 due to higher creditor balances at 30 June 2016, in particular marketing expenditure as a result of the brand relaunch. This has been partially offset by a reduction in provision for income tax based on the timing of tax payments made.
Non-current liabilities increased to 30 June 2016 by 6% to $27,927,000. This is mostly the result of an increase in net deferred tax liability from the growth in the trail commission asset.
Debt positionAs at 30 June 2016 the Group has nil debt (30 June 2015: nil).
FUTURE DEVELOPMENTS AND EXPECTED RESULTSLooking ahead, the Group remains positive about financial year 2017 (FY17). The ongoing recovery in the Health segment together with the continued growth in the Energy and Telecommunications segment is expected to deliver stronger revenue growth than experienced in financial year 2016 (FY16), and a significantly stronger gross profit outcome. Enabling this improved outlook are investments in a single sales CRM, new telephony platform and our data and digital marketing teams, providing the business with stronger capability in our contact centre, scalability and improved customer experience. FY17 reported earnings before interest and tax (EBIT) are expected to be between $21 million and $24 million. The first half performance is expected to improve on FY16, however it should be noted that, as in previous years, the Group’s first half revenue and earnings are expected to be significantly lower than second half revenue and earnings driven by the continued investment in technology and marketing, as noted above and the seasonality in Health segment. The growth in the non-Health segment contributions is expected to continue to improve over the FY17, as the Group further diversifies its product offerings.
Commentary on the major operational parts of each segment follows:
Health• The industry outlook is for low to flat growth
in the Health Insurance market, with a continued trending down in the new to private health insurance market. However ongoing improvements in conversion, continued focus on revenue per sale and ongoing focus on contact centre efficiencies are expected to deliver growth against FY16.
• Importantly, the improvement initiatives implemented in November 2015, centred on recruitment, training and consultant capability are expected to deliver a stronger first half position for FY17.
• The Group continues to monitor the government’s private health insurance reform agenda, where policy and legislative change has the potential to impact on performance.
energy and telecommunications• The Energy businesses outlook is for strong
growth, continuing to build on the momentum from FY16.
• The build out of the Mover channel along with the integration benefits of the Energy Watch business will help deliver this growth.
• The Telecommunications business will continue to benefit from the roll out of the NBN and the increasing number of internet providers entering the market place. Increased marketing investment and focus on consultant competency, supported by the further roll out of iConnect are all planned to deliver this growth.
Life and General insurance• The strong revenue growth experienced in
the General Insurance business through FY16 is expected to continue through FY17 with increased investment in marketing and improved contact centre competency.
• The Group continues to monitor the potential impact of the Life Industry reforms.
other• The launch of a number of new verticals is
expected through FY17. While only expected to contribute modestly to the Group’s gross profit, new verticals will provide access to new customer leads and opportunities to cross sell to our existing businesses.
The Board is continuing a number of capital management initiatives, including the on-market buyback and paying of fully franked dividends.
The Group does remain cognisant of potential risks to its business and will continue to closely monitor and work to mitigate these throughout FY17. These risks include potential changes in government policy and legislation, lower than expected cash receipts from future trail commissions, and any adverse decisions taken by product providers currently listed on the Group’s websites. All of these risks have the potential to adversely impact the Group’s revenue and profitability.
DiReCtoRS' RepoRtIS
EL
EC
T A
NN
UA
L R
EP
OR
T 2
016
28

CHANGES IN THE STATE OF AFFAIRSIn the Directors’ opinion there have been no significant changes in the state of affairs of the Group during the year. A further review of matters affecting the Group’s state of affairs is contained in the Operating and Financial Review.
SIGNIFICANT EVENTS AFTER BALANCE DATEOn the 30 August 2016 the Group declared an estimated fully franked full year dividend of $3,577,000, representing 1.5 cents per share based on the shares on issue at the 30 June 2016.
No other matters or circumstances have arisen since the end of the period that have significantly affected or may significantly affect the operations of the Group, the results of those operations, or the state of affairs of the Group in future financial years.
INDEMNIFICATION AND INSURANCE OF OFFICERS AND AUDITORSDuring the year the Group paid a premium in respect of a contract insuring the Directors and Officers of the Group against a liability incurred by such a Director or Officer to the extent permitted by the Corporations Act 2001. The contract of insurance prohibits disclosure of the nature of the liability and the amount of the premium. The Group has not otherwise, during or since the end of the period, indemnified or agreed to indemnify a Director, Officer or Auditor of the Group or of any related body corporate against a liability incurred by such a Director, Officer or Auditor.
DIRECTORS’ MEETINGSThe number of meetings of Directors, including meetings of committees of Directors, held during the year and the number of meetings attended by each Director is presented below.
DIRECTORSBOARD OF DIRECTORS
AUDIT AND RISK MANAGEMENT
COMMITTEEREMUNERATION
COMMITTEENOMINATION COMMITTEE
Held^ Attended Held^ Attended Held^ Attended Held^ Attended
C Knoblanche(1) 13 13 2 1 - - - -
B. Arnhold 13 12 4 4 - - - -
S. Bonètt 13 12 1 1 5 5 4 4
B. Fair 13 13 4 4 5 5 4 4
A. Stevens(2) 4 2 - - - - - -
D. Waller 13 12 - - 5 5 4 4
L. Webb(3) 2 2 - - - - - -
M. Wilson(4) 3 3 1 1 - - - -
^ The number of meetings held indicates the total number held whilst the director was in office during the course of the year.
(1) Appointed as Chairman on 1 July 2015.
(2) Ceased as a Director on 12 October 2015.
(3) Ceased as a Director on 28 August 2015.
(4) Appointed as a Director on 1 April 2016.
ISE
LE
CT
AN
NU
AL
RE
PO
RT
20
16
29
DiReCtoRS' RepoRt

DIVIDENDSOn the 30 August 2016 the Group declared an estimated fully franked full year dividend of $3,577,000, representing 1.5 cents per share based on the shares on issue at the 30 June 2016. The Group has also committed to a dividend policy of 40%-60% of reported net profit after tax, subject to the availability of franking credits and cash reserves.
PROCEEDINGS ON BEHALF OF THE GROUPNo proceedings have been brought or intervened in on behalf of the Group with leave of the Court under section 237 of the Corporations Act 2001.
ENVIRONMENTAL REGULATIONThe Group is not subject to significant environmental regulation in respect of its operations. The Group has not incurred any liability (including any liability for rectification costs) under any environmental legislation.
GOVERNANCEIn recognising the need for high standards of corporate behaviour and accountability, the Directors have followed the corporate governance statement found on the Group’s website at iselect.com.au.
AUDITOR’S INDEPENDENCE DECLARATIONA copy of the auditor’s independence declaration as required under section 307C of the Corporations Act 2001 in relation to the audit for the year ended 30 June 2016 is on page 58 of this report.
NON-AUDIT SERVICESThe following non-audit services were provided by the Group’s auditor, Ernst & Young. The Directors, with advice provided by the Group’s audit and risk management committee, are satisfied that the provision of non-audit services is compatible with the general standard of independence for auditors imposed by the Corporations Act 2001. The nature and scope of each type of non-audit service provided means that auditor independence was not compromised. Ernst & Young received or are due to receive fees for a non-audit service of $36,000 for regulatory compliance.
ROUNDING The Group is of the kind referred to in ASIC Class Order 2016/191, dated 24 March 2016, and in accordance with that Class Order amounts in the Directors’ report and the financial report are rounded off to the nearest thousand dollars, unless otherwise indicated.
DiReCtoRS' RepoRtIS
EL
EC
T A
NN
UA
L R
EP
OR
T 2
016
30
This Remuneration Report for the year ended 30 June 2016 outlines the remuneration arrangements of the Group in accordance with the Corporations Act 2001 (the “Act”) and its regulations. This information has been audited as required by section 308(3C) of the Act.
The remuneration report is presented under the following sections:
1. Introduction
2. Remuneration Governance
3. Executive Remuneration for the Year Ended 30 June 2016
4. Executive Contracts
5. Link Between Group Performance, Shareholder Wealth and Remuneration
6. Non-Executive Director Remuneration
7. Key Management Personnel Shareholdings
8. Key Management Personnel Option Holdings
Remuneration Report(Audited)
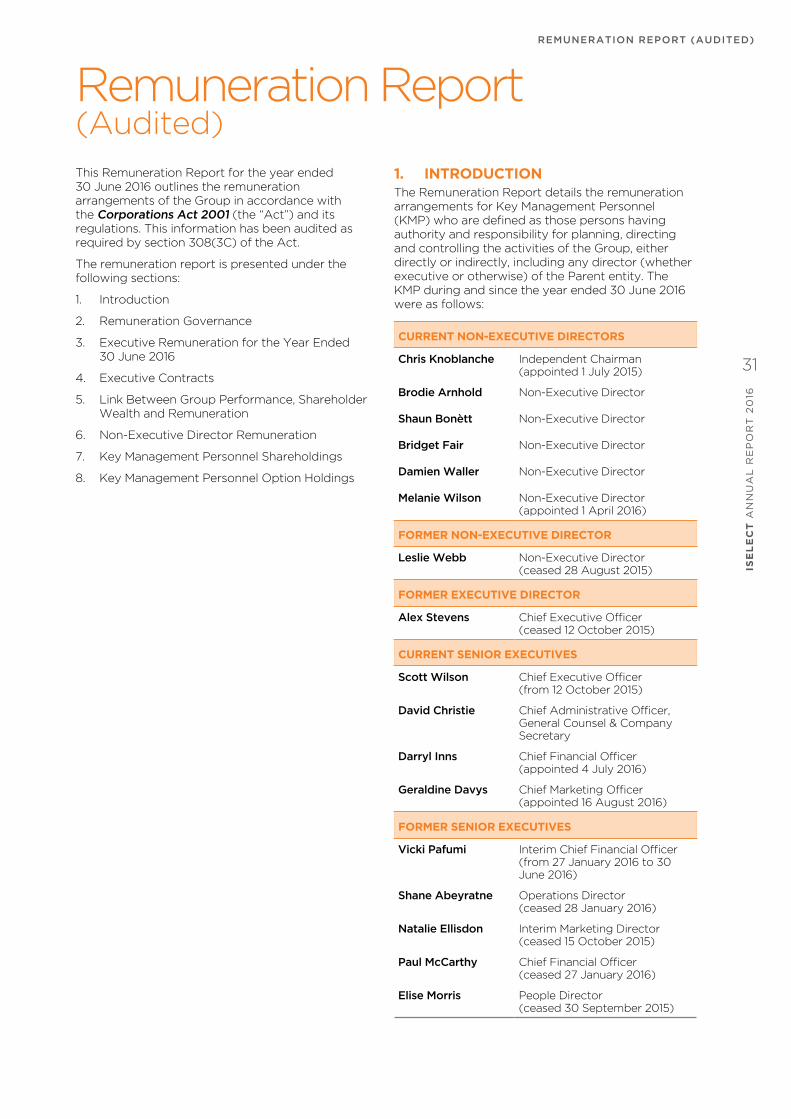
1. INTRODUCTIONThe Remuneration Report details the remuneration arrangements for Key Management Personnel (KMP) who are defined as those persons having authority and responsibility for planning, directing and controlling the activities of the Group, either directly or indirectly, including any director (whether executive or otherwise) of the Parent entity. The KMP during and since the year ended 30 June 2016 were as follows:
CURRENT NON-EXECUTIVE DIRECTORS
Chris Knoblanche Independent Chairman (appointed 1 July 2015)
Brodie Arnhold Non-Executive Director
Shaun Bonètt Non-Executive Director
Bridget Fair Non-Executive Director
Damien Waller Non-Executive Director
Melanie Wilson Non-Executive Director (appointed 1 April 2016)
FORMER NON-EXECUTIVE DIRECTOR
Leslie Webb Non-Executive Director (ceased 28 August 2015)
FORMER EXECUTIVE DIRECTOR
Alex Stevens Chief Executive Officer (ceased 12 October 2015)
CURRENT SENIOR EXECUTIVES
Scott Wilson Chief Executive Officer (from 12 October 2015)
David Christie Chief Administrative Officer, General Counsel & Company Secretary
Darryl inns Chief Financial Officer (appointed 4 July 2016)
Geraldine Davys Chief Marketing Officer (appointed 16 August 2016)
FORMER SENIOR EXECUTIVES
Vicki pafumi Interim Chief Financial Officer (from 27 January 2016 to 30 June 2016)
Shane Abeyratne Operations Director (ceased 28 January 2016)
Natalie ellisdon Interim Marketing Director (ceased 15 October 2015)
paul McCarthy Chief Financial Officer (ceased 27 January 2016)
elise Morris People Director (ceased 30 September 2015)
ISE
LE
CT
AN
NU
AL
RE
PO
RT
20
16
31
ReMuNeRAtioN RepoRt (AuDiteD)

2. REMUNERATION GOVERNANCE
2.1 Remuneration CommitteeIn accordance with the Remuneration Committee Charter (“the Charter”), the role of the Remuneration Committee is:
• To review and make recommendations to the Board on remuneration packages and policies related to the Directors and Senior Executives; and
• To ensure that the remuneration policies and practices are consistent with the Group’s strategic goals and human resources objectives.
The Remuneration Committee membership is made up of members of the Board, none of whom are Executives, as determined in accordance with the iSelect Board Charter (“the Board Charter”). For the year ended 30 June 2016:
• Shaun Bonètt acted as Chair of the Committee following Les Webb’s resignation on 28 August 2015; and
• Damien Waller and Bridget Fair served as members of the Committee.
Details regarding Remuneration Committee meetings are provided in the Directors’ report.
The Remuneration Committee meets as often as is required by the Charter or other policies approved by the Board to govern the Committee’s operation. The Remuneration Committee reports to the Board as necessary, and seeks Board approval as required. iSelect’s CEO attends certain Remuneration Committee meetings by invitation, where management input is required. The CEO is not present during any discussions related to his own remuneration arrangements.
2.2 information used to set executive RemunerationTo ensure the Remuneration Committee has sufficient information to make appropriate remuneration decisions and recommendations, it may seek and consider information from independent remuneration consultants. Remuneration advice provided by such consultants is used to aid decision making, but does not replace thorough consideration of Executive remuneration by the Directors.
During the 2016 financial year, the Chairman of the Remuneration Committee engaged KPMG to provide advice in relation to the appropriateness of iSelect’s general remuneration framework and structure, including benchmarking of the remuneration of the CEO and CFO and information regarding market practice. All advice was provided directly to the Chairman of the Remuneration Committee and KPMG provided a declaration that any advice was
provided free from undue influence by management. iSelect does not consider that the advice provided by KPMG constitutes a ‘remuneration recommendation’ for the purposes of the Corporations Act 2001.
To ensure KPMG was free from undue influence of KMP when providing this advice, the advice was provided in writing directly to the Chair of the Remuneration Committee. As a result of this approach, the Board is satisfied that the remuneration advice was made free from undue influence by the members of the KMP to whom the remuneration advice relates.
3. EXECUTIVE REMUNERATION FOR THE YEAR ENDED 30 JUNE 2016
3.1 Remuneration principles and StrategyiSelect is a fast moving and growing business with a heavy reliance on people to perform, grow and innovate.
The aim of the Group’s remuneration strategy is to align remuneration with iSelect’s strategic direction, align remuneration with the creation of shareholder value and provide a tangible link between remuneration outcomes with both Group and individual performance.
Fixed remuneration is set at a level which is competitive with remuneration for professionals with the required skills and expertise to maximise the current and future value of the business. Variable remuneration provides the opportunity for employees to share financially in iSelect’s overall performance and performance of the business, when targets are met or exceeded.
The Group’s Executive remuneration strategy is designed to:
Align the interests of executives with shareholders– the remuneration framework incorporates variable components, including short term incentives and long term incentives. Performance is assessed against both financial and non-financial targets, with key performance indicators that are relevant to the success of the Group and provide acceptable returns for shareholders; and
Attract, motivate and retain high performing individuals– the remuneration framework helps ensure that the remuneration paid by the Group is competitive with that offered by companies to professionals with the required skills and expertise to maximise the current and future value of the business, and longer-term remuneration encourages retention.
ReMuNeRAtioN RepoRt (AuDiteD)IS
EL
EC
T A
NN
UA
L R
EP
OR
T 2
016
32

3.2 Remuneration FrameworkExecutive remuneration is provided in a mix appropriate to the position, responsibilities and performance of each Executive within the Group, and considerations of relevant market practices.
For the financial year ended 30 June 2016, Executive remuneration was structured as a mix of fixed and variable remuneration utilising short and long term incentive elements. As a result, the relative weightings of the three components are as follows:
total Remuneration % (annualised at target)1 for FY2016
FIXED VARIABLE
FIXED ANNUAL REMUNERATION
(FAR)
SHORT TERM INCENTIVE
(STI)
LONG TERM INCENTIVE
(LTI)
Current organisation Structure (as announced to ASX at 2015 AGM)
CEO 50% 25% (50% of FAR) 25% (50% of FAR)
Other Executives 56% 22% (40% of FAR) 22% (40% of FAR)
Former organisation Structure
CEO 56% 22% (40% of FAR) 22% (40% of FAR)
Other Executives 58% 21% (35% of FAR) 21% (35% of FAR)
1 These figures assume on target performance on an annualised basis. The actual performance against targets for the variable com-ponents will determine the amount received by each Executive.
Further details regarding each element of the remuneration mix is provided in section 3.3.
3.3 Details of executive Remuneration Components
A. Fixed Annual Remuneration (FAR)
What is FAR?
FAR consists of base salary and statutory superannuation contributions. Executives may also elect to have a combination of benefits provided out of their FAR, including additional superannuation and the provision of a motor vehicle. The value of any non-cash benefits provided to them includes the cost of any fringe benefits tax payable by iSelect as a result of providing the benefit.
FAR is not “at risk” and is set using appropriate market benchmark data, considering the individual’s role, responsibility, skills, experience and performance.
Given the rapidly changing nature of iSelect’s business and market sector, benchmark data considers professionals with the required skills and expertise to maximise the current and future value of the business. Fixed remuneration is set with reference to this group.
How is FAR determined?
Remuneration levels are considered annually through a remuneration review that considers market data, insights into remuneration trends, the performance of the Group and individual, and the broader economic environment.
A review of FAR was undertaken during the 2016 financial year. FAR levels for a number of Executives were increased based on individual performance and to align to targeted remuneration levels.
ISE
LE
CT
AN
NU
AL
RE
PO
RT
20
16
33
ReMuNeRAtioN RepoRt (AuDiteD)

B. Short term incentive plan (Sti plan)
How does the Sti plan operate?
All Executives are eligible to participate in the STI Plan. The STI Plan puts a significant proportion of remuneration “at risk” subject to the achievement of Group financial outcomes and individual performance measures. This provides a tangible link between the interests of employees and the financial performance of the Group.
For the year ended 30 June 2016, the target STI opportunity was between 22% and 25% of the total remuneration package for Executives (as detailed in section 3.2). The STI Plan is cash-based, with payments made once per year following the announcement of the audited financial results at financial year end.
The minimum payout for each measure is 0% of FAR. The maximum payout for Group performance for each measure is 150% for outstanding performance.
What changes were made to the Sti plan during the year?
The Group made the following changes to the STI Plan for financial year 2016:
• The Group Performance measures were updated to measure EBIT as a target rather than EBITDA; and
• The maximum payout for each of the measure was aligned at 150% for outstanding performance.
What were the STI performance measures for the financial year ended 30 June 2016?
The performance measures for the Executives have been adopted to provide a balance between financial and non-financial, Group and individual, operational and strategic aspects of performance. The performance measures, which are assessed independently, are described in detail below:
MEASURE FY2016 TARGET DETAILS
Group performance 1. eBit target The EBIT target was set against the Group’s financial year 2016 Annual Operating Plan.
EBIT result Percentage of STI that vests2
Less than or equal to 95% of target 0%
At target 100%
Above target (measured between 100% and 125% of target) 150%
2. operating Revenue target The Operating Revenue target was set against the Group’s financial year 2016 Annual Operating Plan.
Operating Revenue result Percentage of STI that vests
Less than or equal to 95% of target 0%
At target 100%
Above target (measured between 100% and 125% of target) 150%
Individual Key Performance Indicators (Kpis)
individual Kpis are set for Senior Executives which take into account their area of accountability, and for the financial year ended 30 June 2016, related to key business objectives in the areas of stakeholder relationships, sales conversion, brand growth, development of the organisational model, delivering high performance ways of working, technology solutions and resources, operational performance in the Business Development Centre and developing commercialisation opportunities.
Individual KPIs are set with clearly measureable outcomes that the individual is directly able to control.
Payout levels vary between 0% and 150% for individual KPIs.
2 Straight line vesting occurs between 0% and 150%.
ReMuNeRAtioN RepoRt (AuDiteD)IS
EL
EC
T A
NN
UA
L R
EP
OR
T 2
016
34

How are the various measures weighted to determine the Sti plan payment for executives?
There are three performance measures considered under the STI Plan - EBIT, Operating Revenue, and individual KPIs. The weighting between the three measures varies for participants, dependent upon their individual functional responsibilities and their ability to influence measurement outcomes. For the financial year ended 30 June 2016, the relative weightings are as follows:
PERFORMANCE MEASURE EBIT REVENUE INDIVIDUAL KPIS
CEO and Other Senior Executives 40% 30% 30%
Who sets the Sti plan performance measures?
The Group’s financial performance targets are set by the Board, based on the recommendation of the Remuneration Committee. The CEO’s individual KPIs are set and measured by the Board, with the assistance of the Remuneration Committee. The individual KPIs for each Senior Executive are set and measured by the CEO. Recommendations by the CEO in relation to payment on the basis of achievement of performance targets set under the STI Plan are made to the Remuneration Committee.
What is eBit and why is it used as an Sti performance measure?
EBIT is an operational measure that is widely used by listed companies to measure financial performance. EBIT has been introduced as a performance measure in the financial year ended 30 June 2016. The Board uses EBIT as a primary measure to assess the Group’s operating performance, maintaining focus on the Group’s operating results and associated cash generation.
This aligns with the Group’s objective of delivering growth and shareholder returns.
Why is Operating Revenue used as an STI performance measure and how is it defined?
The use of Operating Revenue as an STI performance measure has been adopted to align performance with market top line growth expectations of the Group.
What are the individual Kpis and why are they used as an Sti performance measure?
The use of individual KPIs for each Executive creates a personal, non-financial group of measures specific to each individual. These measures also consider the behaviours that Executives are expected to display in the running of their operations. For the financial year ended 30 June 2016, KPIs related to key business objectives in the areas of:
• Key stakeholder relationships;
• Brand and consumers/customers relationships;
• Sales conversion through the provision of amazing customer experiences;
• New brand growth;
• Future growth through the establishment of organisational model enhancement;
• Simplified ways of working;
• Optimised technology solutions and resources;
• Performance in the Business Development Centre; and
• Commercialisation opportunities.
The use of individual KPIs helps ensure leadership behaviours are aligned with the Group’s corporate philosophy and objectives, and establishes a business platform for sustainable future growth.
How is performance assessed?
Performance against the EBIT and Operating Revenue targets is assessed by the Board, and independently verified following the preparation of the financial statements each financial year. Performance against individual KPIs for Senior Executives is assessed by the CEO, and approved by the Remuneration Committee based upon the CEO’s assessment. The Remuneration committee assesses the CEOs performance against individual KPIs.
ISE
LE
CT
AN
NU
AL
RE
PO
RT
20
16
35
ReMuNeRAtioN RepoRt (AuDiteD)

How are the varying levels of performance achievement rewarded?
STI Plan targets are designed to encourage and reward high performance, as well as differentiating between individual performance. Performance against the financial targets must be greater than 95% in order for any STI to be paid, and at target for 100% of STI to be paid. Performance is rewarded pro-rata from 0% to 100% for achievement of over 95% and less than 100%.
Greater rewards are available to recognise and encourage significant over-performance, ranging from greater than 100% to a maximum of 150% of the STI payment related to each of the three measures when performance exceeds target.
The maximum EBIT and Operating Revenue performance at which bonus payments are capped is determined by the Remuneration Committee each year. The individual element provides a measure of differentiation between individual levels of performance.
When are the performance conditions tested and payments made?
All elements of the STI Plan are measured and paid annually, following the preparation of the financial statements, with payments generally made in the September following financial year end.
What were the STI performance outcomes for the year ended 30 June 2016?
STI OUTCOME (%)
ACTUAL STI AWARDED
% STI FORFEITEDEBITDA REVENUE
INDIVIDUAL KPIS TOTAL
Current Senior executives
Scott Wilson - - 50% 15% $37,500 85%
David Christie - - 50% 15% $26,400 85%
Darryl Inns - - - - - n.a
Geraldine Davys - - - - - n.a
Former executive Directors
Alex Stevens - - - - - 100%
Former executives
Vicki Pafumi - - - - - 100%
Shane Abeyratne - - - - - 100%
Natalie Ellisdon - - 100% - $6,325 70%
Paul McCarthy - - - - - 100%
Elise Morris - - - - - 100%
CURRENT SENIOR EXECUTIVES
Scott Wilson Chief Executive Officer (from 12 October 2015)
David Christie Chief Administrative Officer, General Counsel & Company Secretary
Darryl inns Chief Financial Officer (appointed 4 July 2016)
Geraldine Davys Chief Marketing Officer (appointed 16 August 2016)
FORMER EXECUTIVE DIRECTOR
Alex Stevens Chief Executive Officer (ceased 12 October 2015)
ReMuNeRAtioN RepoRt (AuDiteD)IS
EL
EC
T A
NN
UA
L R
EP
OR
T 2
016
36

FORMER SENIOR EXECUTIVES
Vicki pafumi Interim Chief Financial Officer (appointed on 27 January 2016 and ceased on 30 June 2016)
Shane Abeyratne Operations Director (ceased 28 January 2016)
Natalie ellisdon Interim Marketing Director (ceased 15 October 2015)
paul McCarthy Chief Financial Officer (ceased 27 January 2016)
elise Morris People Director (ceased 30 September 2015)
C. Long term incentive plan (“Lti plan”)Grants were made under the FY2016 LTI Plan in July and December 2015, and the details provided in this section relate to these grants during the financial year ended 30 June 2016.
Further grants were made in July 2016 relating to financial year 2017, consistent with the proposed CEO grant incorporated in the Notice of Meeting for the 2016 Annual General Meeting.
What is the purpose of the FY2016 Lti plan?
The LTI Plan has been established to provide a long term incentive component of remuneration to assist with the attraction, reward and retention of key employees, including Executives. The LTI Plan links long-term reward with the ongoing creation of shareholder value, using LTI Plan shares which are subject to satisfaction of long-term performance conditions, including share price growth. The combination of these factors will help to ensure that Executives are focussed on long term value creation, linking their interests with those of shareholders. LTI Plan shares are not transferable and do not carry voting rights. Any dividends paid on the LTI Plan Shares while the loan remains outstanding are applied (on a notional after-tax basis) towards repayment of the loan.
The Remuneration Committee determines the size and allocation of the LTI Plan grant in accordance with the LTI Plan rules, for recommendation to the Board, who is responsible for final approval.
What changes were made to the Lti plan as part of the remuneration review for FY2016?
A review of the LTI Plan was undertaken during financial year 2015 in preparation for the FY2016 LTI Plan Grant in July. The LTI Plan in particular was reviewed and as a result, the FY2016 LTI Plan grant was altered to introduce relative Total Shareholder Return (“TSR”) as the performance measure.
How does the Lti plan operate for grants made in FY2016?
Executives were invited to participate in the LTI Plan, via a loan based share plan. There was no initial cost to the recipient to participate in the LTI Plan, but the loan must be repaid before or at the time of sale of the shares. The value of the loan is set by applying the market value at grant date to the number of units granted. This means the share price must increase over the life of the Plan, and pass the performance tests (below) for there to be any value to the participant between vesting and expiry.
Each LTI Plan share is offered subject to the achievement of the performance measure, which is tested once at the end of the three year performance period. The FY2016 LTI Plan Grant will be measured against one performance measure – relative Total Shareholder Return (“TSR”). LTI Plan shares that do not vest after testing of the relevant performance measure lapse, without retesting. There is no financial risk to the Group as lapsed shares are cancelled in full repayment of the portion of the loan to which they relate. Shares that pass the performance tests are able to be traded during the period between vesting and expiry, upon repayment of the loan value. This means there is only value to the participant where both the performance condition is met, and the share price exceeds the market value of the share at the grant date.
The number of LTI Plan Shares granted to each participant on 3 July 2015 was calculated using the AASB2, the fair value of awards at the allocation date being 3 July 2015.
The number of LTI Plan Shares granted to Scott Wilson as CEO was calculated using the AASB2 value of awards assuming all vesting criteria were met at the allocation date, being 11 December 2015. Scott Wilson also received a grant of 350,000 LTI Plan Shares, with a corresponding loan, on 3 July 2015 when he was the Commercial Director.
ISE
LE
CT
AN
NU
AL
RE
PO
RT
20
16
37
ReMuNeRAtioN RepoRt (AuDiteD)

What are the LTI performance measures for grants made under the LTI plan in the financial year ended 30 June 2016?
Awards granted under the FY2016 LTI plan are subject to a three year performance period and the following performance measures over that period:
MEASURE WEIGHTING DESCRIPTION OF MEASURE
Relative Total Shareholder Return (TSR)
100% The Shares will only vest if a certain Total Shareholder Return (TSR) relative to the designated comparator group, being the ASX Small Ordinaries Index excluding mining and energy companies, is achieved during the performance period.
TSR measures the total change in the value of the Shares over the performance period, plus the value of any dividends and other distributions being treated as if they were reinvested in shares.
The Group’s TSR is compared against the TSR of a designated comparator group during the performance period. The Shares will vest in line with the following Relevant TSR vesting schedule:
Relative tSR % of Lti plan shares that vest
Less than 50th Percentile 0%
50th Percentile 50%
50th Percentile to 75th Percentile Straight line vesting between 50% and 100%
75th Percentile or more 100%
Why was this Long term incentive (Lti) performance measure selected?
The relative TSR target is a market based performance measure that provides a direct link between Executive reward and security holder value. It provides an external market measure to encourage and motivate Executive performance which is relative to a designated comparator group, the ASX Small Ordinaries Index excluding mining and energy companies, during the performance period. The ASX Small Ordinaries Index was selected as it was deemed to be the best comparator to Group’s current size. The ASX Small Ordinaries Index is made up of the small cap members of the ASX 300 Index (ASX members 101-300).
How will the Lti performance targets be measured?
Relative tSR – Market data will be used to prepare a calculation of the relative TSR for the Group. This will be disclosed in the Annual Report for the year the testing occurs.
Why has a loan based share plan model been adopted?
In considering the best LTI Plan to adopt, a number of different types of employee equity alternatives were considered. The loan based share plan was adopted as it allows the benefits of employee share options, but without adverse tax implications. Participants pay tax once they sell the shares, and they are only able to sell the shares when both the performance hurdles have been met and the share price has increased above the loan value. This provides a tangible future benefit to Executives that is strongly linked to shareholder value. This approach allows Executives to be rewarded for capital growth in the shares, while also placing the Group in a superior position as a result of reduced taxation and transaction costs compared with other schemes.
What will happen if the executive ceases employment?
Where an Executive ceases employment, any unvested LTI Plan shares will be forfeited in full satisfaction of the corresponding loan, unless determined and approved otherwise by the Board.
What will happen in the event of a change in control?
Unless the Board determines otherwise, all LTI Plan shares vest upon a change in control.
ReMuNeRAtioN RepoRt (AuDiteD)IS
EL
EC
T A
NN
UA
L R
EP
OR
T 2
016
38

What was the grant and movement in the number and value of performance awards during the financial year ended 30 June 2016?
Eligible Senior Executives (excluding the CEO) received LTI Plan shares with a grant date of 3 July 2015.
Following the receipt of shareholder approval at the 2015 AGM, Scott Wilson, in his capacity as CEO, received additional LTI plan shares with a grant date of 11 December 2015. All LTI Plan shares granted in FY2016 vest subject to a performance period from 3 July 2015 to 30 June 2018.
the relevant values of the grants are as follows:
RECIPIENT GRANT DATE
FAIR VALUE OF AWARDS AT GRANT DATE ONE WEEK VWAP UP
TO AND INCLUDING GRANT DATERELATIVE TSR EPS
eligible Senior executives
3 July 2015 $0.37 $0.41 $1.44
Ceo and CAo 11 December 2015 $0.23 $0.31 $1.15
NAME
NUMBER OF PERFORMANCE AWARDS
GRANTED
VALUE AT GRANT DATE
($)3
MAXIMUM TOTAL VALUE OF GRANT YET TO VEST
($)
Alex Stevens - - -
Scott Wilson 558,870 177,540 177,540
David Christie 495,470 166,236 166,236
elise Morris 331,175 122,535 -
Shane Abeyratne 312,162 115,500 -
Natalie ellisdon 236,486 87,500 -
paul McCarthy 350,000 129,500 -
3 Determined at the time of grant per AASB2. For details on the valuation of the LTIP shares please refer to Note 31 of the
financial statements.
What clawback arrangements are in place for grants made under the FY2016 Lti plan?
Under the rules of the FY2016 LTI Plan, the Board has the power (in certain circumstances) to determine that a participant’s interest in any or all of the LTI Plan shares is forfeited and surrendered, and/or that the value that the participant has derived from any vested shares is set off against any current or future fixed remuneration or annual bonuses owed to the participant. This applies in cases of fraud, dishonesty and breach of obligations, including, without limitation, a material misstatement of financial information, whether the action or omission is intentional or inadvertent.
ISE
LE
CT
AN
NU
AL
RE
PO
RT
20
16
39
ReMuNeRAtioN RepoRt (AuDiteD)

D. previous incentive plans It is the intent of the Group to offer LTI Plans to Senior Executives annually. The following sets out the relevant details of LTI Plan Grant that was offered in previous financial year which are yet to vest:
FY2015 Long term incentive plan
DETAIL FY2015 GRANT OF LTI PLAN
Grant date Grant date for all Senior Executives (excluding CEO): 29 August 2014 Grant date for CEO: 18 November 2014
Performance period (testing date is the last day of each period)
1 July 2014 – 30 June 2017
Performance condition The FY2015 Grant was subject to two separate performance measures:
Compound annual growth rate (CAGR) in Total Shareholder Return (TSR) and CAGR in EPS.
Vesting schedule CAGR in tSR and epS performance level
percentage of awards that vest
Less than 12% 0%
12% 50%
Between 12% & 15% Straight line between 50% & 100%
15% or more 100%
Expiry date 1 July 2019
Fair value of instrument at grant Grant date Fair Value of Awards at Grant Date
tSR epS
29 August 2014 $0.26 $0.37
18 November 2014 $0.33 $0.41
LTIP Shares currently on issue 2,727,126
Share price required at testing date to vest
$1.59 (for 50% vesting) and $1.72 (for 100% vesting)
ReMuNeRAtioN RepoRt (AuDiteD)IS
EL
EC
T A
NN
UA
L R
EP
OR
T 2
016
40
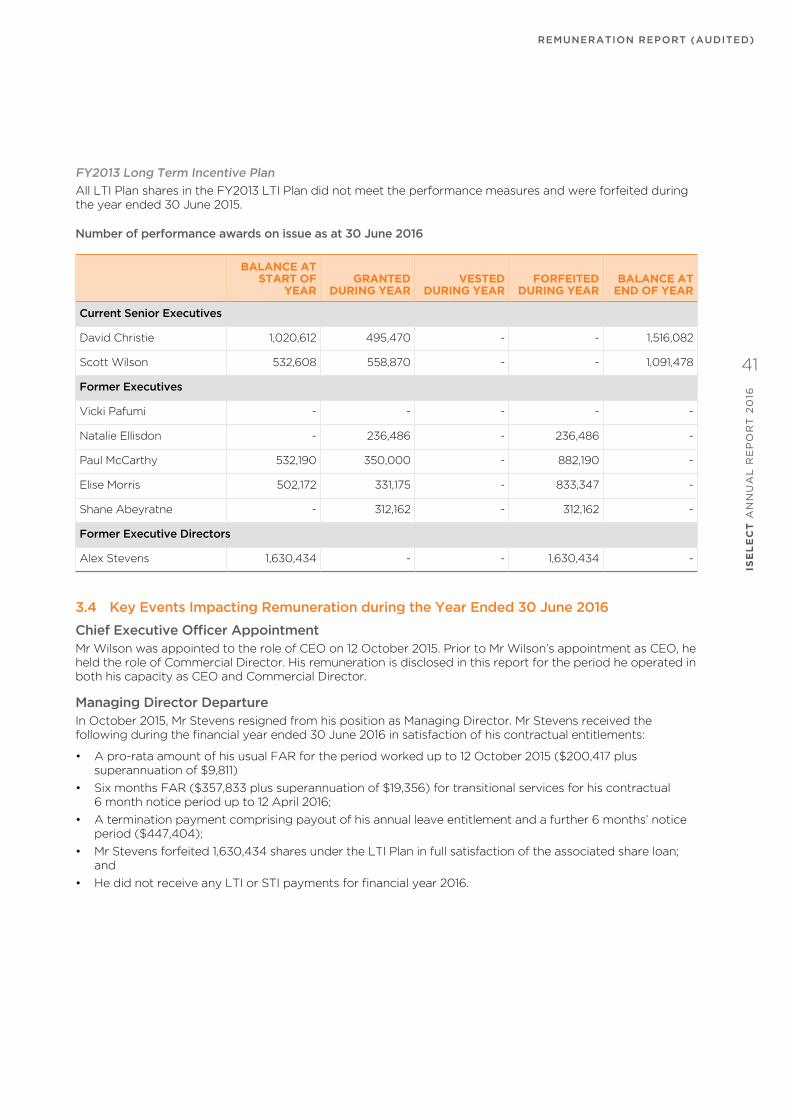
FY2013 Long term incentive plan
All LTI Plan shares in the FY2013 LTI Plan did not meet the performance measures and were forfeited during the year ended 30 June 2015.
Number of performance awards on issue as at 30 June 2016
BALANCE AT START OF
YEARGRANTED
DURING YEARVESTED
DURING YEARFORFEITED
DURING YEARBALANCE AT
END OF YEAR
Current Senior executives
David Christie 1,020,612 495,470 - - 1,516,082
Scott Wilson 532,608 558,870 - - 1,091,478
Former executives
Vicki Pafumi - - - - -
Natalie Ellisdon - 236,486 - 236,486 -
Paul McCarthy 532,190 350,000 - 882,190 -
Elise Morris 502,172 331,175 - 833,347 -
Shane Abeyratne - 312,162 - 312,162 -
Former executive Directors
Alex Stevens 1,630,434 - - 1,630,434 -
3.4 Key Events Impacting Remuneration during the Year Ended 30 June 2016
Chief Executive Officer Appointment Mr Wilson was appointed to the role of CEO on 12 October 2015. Prior to Mr Wilson’s appointment as CEO, he held the role of Commercial Director. His remuneration is disclosed in this report for the period he operated in both his capacity as CEO and Commercial Director.
Managing Director DepartureIn October 2015, Mr Stevens resigned from his position as Managing Director. Mr Stevens received the following during the financial year ended 30 June 2016 in satisfaction of his contractual entitlements:
• A pro-rata amount of his usual FAR for the period worked up to 12 October 2015 ($200,417 plus superannuation of $9,811)
• Six months FAR ($357,833 plus superannuation of $19,356) for transitional services for his contractual 6 month notice period up to 12 April 2016;
• A termination payment comprising payout of his annual leave entitlement and a further 6 months’ notice period ($447,404);
• Mr Stevens forfeited 1,630,434 shares under the LTI Plan in full satisfaction of the associated share loan; and
• He did not receive any LTI or STI payments for financial year 2016.
ISE
LE
CT
AN
NU
AL
RE
PO
RT
20
16
41
ReMuNeRAtioN RepoRt (AuDiteD)

Chief Financial Officer DepartureIn October 2015, Mr McCarthy resigned from his position as Chief Financial Officer. Mr McCarthy received the following during the financial year ended 30 June 2016 in satisfaction of his contractual entitlements:
• A pro-rata amount of his usual FAR for the period up to 27 January 2016 ($165,876 plus superannuation of $17,500)
• A termination payment comprising payout of his annual leave entitlement ($14,101);
• Mr McCarthy forfeited 882,190 shares under the LTI Plan in full satisfaction of the associated share loan; and
• He did not receive any STI payments for financial year 2016.
Interim Chief Financial OfficerMs Pafumi was appointed to the role of Interim CFO on 27 January 2016, for an initial six month period while the Group continued to search for a Chief Financial Officer. Ms Pafumi ceased in her capacity as Interim CFO on 30 June 2016, as a result of the commencement of Mr Darryl Inns as CFO. Her remuneration is disclosed in this report for the period she operated in the Interim CFO role only. Subsequent to her interim CFO position, Ms Pafumi has now taken a full time role with the business supporting Corporate Operations.
operations Director DepartureMr Abeyratne resigned as Operations Director, effective 28 January 2016. Mr Abeyratne received the following during the financial year ended 30 June 2016 in satisfaction of his contractual entitlements:
• A pro-rata amount of his usual FAR for the period worked up to 28 January 2016 ($177,344 plus superannuation of $16,848)
• A termination payment comprising payout of his annual leave entitlement ($14,147);
• Mr Abeyratne forfeited 312,162 shares under the LTI Plan in full satisfaction of the associated share loan; and
• He did not receive any STI payments for financial year 2016.
people Director DepartureMs Morris resigned as People Director, effective 30 September 2015. Ms Morris received the following during the financial year ended 30 June 2016 in satisfaction of her contractual entitlements:
• A pro-rata amount of her usual FAR for the period worked up to 30 September 2015 ($80,025 plus superannuation of $7,500)
• Three months FAR ($87,525 plus superannuation of $4,827) for services during her contractual 3 month notice period up to 31 December 2015;
• A termination payment comprising payout of her annual leave entitlement and ex-gratia ($207,039);
• Ms Morris forfeited 833,347 shares under the LTI Plan in full satisfaction of the associated share loan; and
• She did not receive any STI payments for financial year 2016.
interim Marketing Director DepartureMs Ellisdon resigned as Interim Marketing Director, effective 15 October 2015. Ms Ellisdon received the following during the financial year ended 30 June 2016 in satisfaction of her contractual entitlements:
• A pro-rata amount of her usual FAR for the period worked up to 15 December 2015 ($66,444 plus superannuation of $7,230)
• Two months FAR ($38,052 plus superannuation of $3,298) for services during her contractual 2 month notice period up to 14 December 2015;
• A payout comprising of a pro-rata of her STI payment entitlement ($6,325)
• A termination payment comprising payout of her annual leave entitlement and a further 1 months’ notice period ($24,867);
• Ms Ellisdon forfeited 236,486 shares under the LTI Plan in full satisfaction of the associated share loan.
ReMuNeRAtioN RepoRt (AuDiteD)IS
EL
EC
T A
NN
UA
L R
EP
OR
T 2
016
42
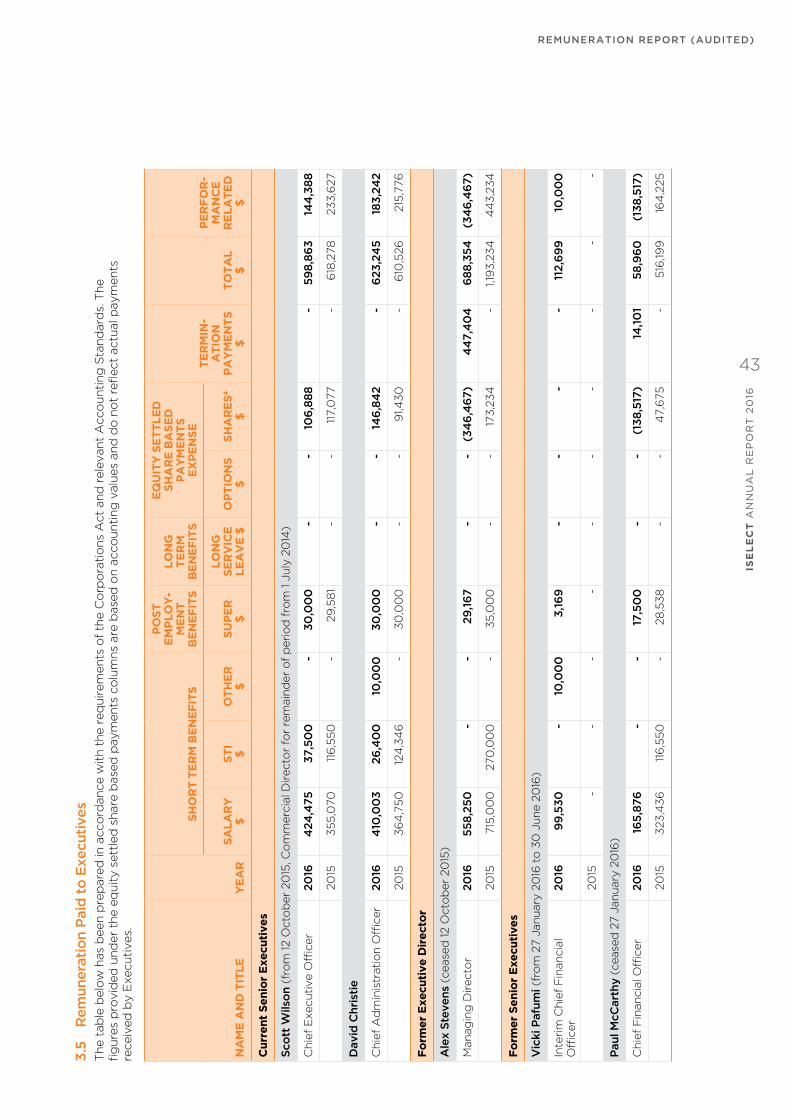
3.5
R
em
un
era
tio
n p
aid
to
execu
tives
The t
ab
le b
elo
w h
as
been p
rep
are
d in
acco
rdance w
ith t
he r
eq
uir
em
ents
of
the C
orp
ora
tio
ns
Act
and
rele
vant
Acco
unti
ng
Sta
nd
ard
s. T
he
fig
ure
s p
rovid
ed
und
er
the e
quit
y s
ett
led
share
base
d p
aym
ents
co
lum
ns
are
base
d o
n a
cco
unti
ng
valu
es
and
do
no
t re
flect
actu
al p
aym
ents
re
ceiv
ed
by E
xecuti
ves.
NA
ME
AN
D T
ITL
EY
EA
R
SH
OR
T T
ER
M B
EN
EF
ITS
PO
ST
E
MP
LO
Y-
ME
NT
B
EN
EF
ITS
LO
NG
T
ER
M
BE
NE
FIT
S
EQ
UIT
Y S
ET
TL
ED
S
HA
RE
BA
SE
D
PA
YM
EN
TS
E
XP
EN
SE
TE
RM
IN-
AT
ION
PA
YM
EN
TS
$T
OT
AL
$
PE
RF
OR
-M
AN
CE
RE
LA
TE
D$
SA
LA
RY
$S
TI
$O
TH
ER
$S
UP
ER
$
LO
NG
S
ER
VIC
E
LE
AV
E $
OP
TIO
NS
$S
HA
RE
S4
$
Cu
rren
t S
en
ior
Execu
tives
Sco
tt W
ilso
n (
fro
m 12 O
cto
ber
20
15, C
om
merc
ial D
irecto
r fo
r re
main
der
of
peri
od
fro
m 1 J
uly
20
14)
Chie
f E
xecuti
ve O
fficer
20
164
24
,475
37,5
00
-30
,00
0-
-10
6,8
88
-5
98
,86
314
4,3
88
20
15355,0
70
116
,550
-29
,58
1-
-11
7,0
77
-6
18,2
78
233,6
27
David
Chri
stie
Chie
f A
dm
inis
trati
on O
fficer
20
164
10,0
03
26
,40
010
,00
030
,00
0-
-14
6,8
42
-6
23,2
45
183,2
42
20
1536
4,7
50
124
,34
6-
30
,00
0-
-9
1,430
-6
10,5
26
215
,776
Fo
rmer
Execu
tive D
irect
or
Ale
x S
tevens
(cease
d 12 O
cto
ber
20
15)
Manag
ing
Dir
ecto
r 20
165
58
,25
0-
-29
,16
7-
-(3
46
,46
7)
44
7,4
04
68
8,3
54
(34
6,4
67)
20
15715
,00
0270
,00
0-
35,0
00
--
173,2
34
-1,1
93,2
34
44
3,2
34
Fo
rmer
Sen
ior
Execu
tives
Vic
ki p
afu
mi (
fro
m 2
7 J
anuary
20
16 t
o 3
0 J
une 2
016
)
Inte
rim
Chie
f F
inancia
l O
fficer
20
169
9,5
30
-10
,00
03,1
69
--
--
112,6
99
10,0
00
20
15-
--
--
--
--
-
paul M
cC
art
hy (
cease
d 2
7 J
anuary
20
16)
Chie
f F
inancia
l Offi
cer
20
1616
5,8
76
--
17,5
00
--
(138
,517
)14
,10
15
8,9
60
(138
,517
)
20
15323,4
36
116
,550
-28
,538
--
47,6
75
-516
,199
164
,225
ISE
LE
CT
AN
NU
AL
RE
PO
RT
20
16
43
ReMuNeRAtioN RepoRt (AuDiteD)

NA
ME
AN
D T
ITL
EY
EA
R
SH
OR
T T
ER
M B
EN
EF
ITS
PO
ST
E
MP
LO
Y-
ME
NT
B
EN
EF
ITS
LO
NG
T
ER
M
BE
NE
FIT
S
EQ
UIT
Y S
ET
TL
ED
S
HA
RE
BA
SE
D
PA
YM
EN
TS
E
XP
EN
SE
TE
RM
IN-
AT
ION
PA
YM
EN
TS
$T
OT
AL
$
PE
RF
OR
-M
AN
CE
RE
LA
TE
D$
SA
LA
RY
$S
TI
$O
TH
ER
$S
UP
ER
$
LO
NG
S
ER
VIC
E
LE
AV
E $
OP
TIO
NS
$S
HA
RE
S4
$
Fo
rmer
Sen
ior
Execu
tives
(Co
nt)
elis
e M
orr
is (
cease
d 3
0 S
ep
tem
ber
20
15)
Peo
ple
Dir
ecto
r20
1616
7,5
50
--
12,3
27
--
(130
,817
)20
7,0
39
25
6,0
99
(130
,817
)
20
15320
,100
110
,28
2-
30
,00
0-
-11
4,3
51
-574
,733
224
,633
Sh
an
e A
beyra
tne (
cease
d 2
8 J
anuary
20
16)
Op
era
tio
ns
Dir
ecto
r20
1617
7,3
44
--
16,8
48
--
(38
,50
0)
14,1
47
169
,839
(38
,50
0)
20
1511
2,0
48
38
,732
-10
,64
5-
--
-16
1,425
38
,732
Nata
lie e
llisd
on (
cease
d 15 O
cto
ber
20
15)
Inte
rim
Mark
eti
ng
Dir
ecto
r20
1610
4,4
96
6,3
25
-10
,528
--
-24
,86
714
6,2
166
,325
20
154
1,426
9,8
17-
3,9
35
--
--
55,17
89
,817
To
tal C
urr
en
t &
Fo
rmer
KM
P2
016
2,1
07,5
24
70
,22
52
0,0
00
149
,53
9-
-(4
00
,571)
70
7,5
58
2,6
54
,275
(310
,34
6)
20
152,2
31,8
30
78
6,2
77
-16
7,6
99
--
54
3,7
67
-3,7
29
,573
1,330
,04
4
The t
ota
l rem
unera
tio
n o
f K
MP
as
per
the fi
nancia
l year
20
15 a
ud
ited
financia
l sta
tem
ents
was
$5,0
42,9
48
. The fi
nancia
l year
20
15 t
ota
l dis
pla
yed
in t
he
main
tab
le a
bo
ve $
3,7
29
,573 d
oes
no
t in
clu
de f
orm
er
KM
P f
rom
financia
l year
20
15 w
ho
had
nil
rem
unera
tio
n in
financia
l year
20
16.
Co
mp
ari
son
of
tota
l fi
nan
cial year
20
16 t
o fi
nan
cial year
20
15 r
em
un
era
tio
n r
ep
ort
To
tal
20
162
,10
7,5
24
70
,22
52
0,0
00
149
,53
9-
-(4
00
,571)
70
7,5
58
2,6
54
,275
(310
,34
6)
20
152,7
05,5
61
971,8
74
-19
9,7
28
146
,410
-15
7,4
69
86
1,90
65,0
42,9
48
1,129
,34
3
4
Th
e fi
gu
res
pro
vid
ed
un
der
the e
qu
ity s
ett
led
sh
are
base
d p
aym
en
ts c
olu
mn
s are
base
d o
n a
cco
un
tin
g v
alu
es
an
d d
o n
ot
refl
ect
actu
al p
aym
en
ts r
eceiv
ed
by E
xecu
tives.
ReMuNeRAtioN RepoRt (AuDiteD)IS
EL
EC
T A
NN
UA
L R
EP
OR
T 2
016
44

4. EXECUTIVE CONTRACTSRemuneration arrangements for Executives with service during the year ended 30 June 2016 are formalised in employment contracts. All contracts are for an unlimited duration.
CURRENT SENIOR EXECUTIVES
Scott Wilson • 6 months’ notice by either party (or payment in lieu).
• Where employment terminates prior to a bonus being paid, or a bonus is due to be paid during gardening leave, may receive a bonus payment at the discretion of the Group.
David Christie • 6 months’ notice by either party (or payment in lieu).
• Where employment terminates prior to a bonus being paid, or a bonus is due to be paid during gardening leave, may receive a bonus payment at the discretion of the Group.
Darryl Inns • 3 months’ notice by either party (or payment in lieu).
• Where employment terminates prior to a bonus being paid, or a bonus is due to be paid during gardening leave, may receive a bonus payment at the discretion of the Group.
Geraldine Davys • 3 months’ notice by either party (or payment in lieu).
• Where employment terminates prior to a bonus being paid, or a bonus is due to be paid during gardening leave, may receive a bonus payment at the discretion of the Group.
FORMER SENIOR EXECUTIVES
Alex Stevens (ceased effective 12 October 2015)
• 6 months’ notice by either party (or payment in lieu).
• Entitled to pro-rata bonus, subject to achievement of KPIs, for time worked (including any payment in lieu or gardening leave period).
Shane Abeyratne (ceased effective 28 January 2016)
• 3 months’ notice by either party (or payment in lieu).
• Where employment terminates prior to a bonus being paid, or a bonus is due to be paid during gardening leave, may receive a bonus payment at the discretion of the Group.
Natalie Ellisdon (ceased effective 15 October 2015)
• Fixed term contract until 5 February 2016 in Head of Brand and Campaign Management role.
• Appointed Interim Marketing Director (temporary secondment from fixed term contract role from 27 April 2015 to 15 October 2015).
• 4 weeks’ notice by either party until 4 August 2015, thereafter 2 months by either party (or payment in lieu).
• Where employment terminates prior to a bonus being paid, payment in respect of any bonus accrued but not yet paid will not be payable.
Paul McCarthy (ceased effective 27 January 2016)
• 3 months’ notice by either party (or payment in lieu).
• Where employment terminates prior to a bonus being paid, or a bonus is due to be paid during gardening leave, may receive a bonus payment at the absolute discretion of the Group.
Elise Morris (ceased effective 30 September 2015)
• 3 months’ notice by either party (or payment in lieu).
• Where employment terminates prior to a bonus being paid, may receive a bonus payment at the absolute discretion of the Group (no entitlement where bonus is due to be paid during gardening leave).
ISE
LE
CT
AN
NU
AL
RE
PO
RT
20
16
45
ReMuNeRAtioN RepoRt (AuDiteD)

5. LINK BETWEEN GROUP PERFORMANCE, SHAREHOLDER WEALTH AND REMUNERATION The variable (or “at risk”) remuneration of Executives is linked to the Group’s performance through measures based on the operating performance of the business.
5.1 Group performance and StiFor the year ended 30 June 2016, a significant proportion of the STI award was determined with reference to EBIT and Operating Revenue.
eBitThe EBIT result for the year ended 30 June 2016 was $15,034,000. Details regarding EBIT performance of the business are provided in the Operating and Financial Review in the Directors’ Report.
operating RevenueThe Operating Revenue result for the year ended 30 June 2016 was $171,865,000.
5.2 Group performance and Lti plan GrantsLTI Plan grants were made in the financial year ended 30 June 2016. Grants made in financial year 2016 are linked to relative TSR.
5.3 Group performance
MEASURE FY2016 FY2015 FY2014 FY2013
Share price at year end $1.25 $1.44 $1.15 $1.70
5 day VWAP to 30 June $1.26 $1.45 $1.11 $1.62
Dividend paid per security 1 cent - - -
EBIT $15,034,000 $12,263,000 $5,610,000 $19,854,000
Operating Revenue $171,865,000 $157,214,000 $120,366,000 $118,037,000
Reported earnings per share 5.1 cents 3.7 cents 2.4 cents 6.6 cents
ReMuNeRAtioN RepoRt (AuDiteD)IS
EL
EC
T A
NN
UA
L R
EP
OR
T 2
016
46

6. NON-EXECUTIVE DIRECTOR REMUNERATION
6.1 Remuneration policyThe Group’s Non-Executive Director remuneration strategy is designed to:
Attract and retain Directors of the highest calibre – ensure remuneration is competitive with companies of a similar size and complexity. Independence and impartiality of directors is aided by no element of Director remuneration being ‘at risk’ (i.e. Remuneration is not based upon Group performance); and
incur a cost that is acceptable to shareholders – the aggregate pool is set by shareholders with any change requiring shareholder approval at a general meeting.
6.2 Remuneration Arrangements
Maximum aggregate remunerationThe aggregate remuneration paid to Non-Executive Directors is capped at a level approved by shareholders. The current Non-Executive Director fee pool was set at $950,000 on 31 May 2013. The amount of aggregate remuneration is reviewed annually, with no increase in the Non-Executive Director fee pool during the financial year ended 30 June 2016.
Board and Committee fees, as well as statutory superannuation contributions made on behalf of the Non-Executive Directors, are included in the aggregate fee pool.
Non-Executive Director fees for the financial year ended 30 June 2016The table below provides details of Board and Committee fees (inclusive of superannuation) for the year ended 30 June 2016. Director member fees have not increased during financial year 2016, and the remuneration of Non-Executive Directors does not include any commission, incentive or percentage of profits.
All committee members are also members of the Board. No additional fees are paid to Board members for their participation on Committees, apart from where they act as a Chair of the committee.
Fees are annualised and include super.
CHAIR FEE $ MEMBER FEE $
Board 165,000 85,000
Audit Committee 10,000
Remuneration Committee 10,000
Nomination Committee 10,000
6.3 Key events impacting Remuneration and makeup of Non-executive Directors during the year ended 30 June 2016
independent ChairmanMr Knoblanche commenced as Independent Chairman on 1 July 2015. As disclosed to the ASX at the time of his appointment, he receives director fees of $250,000 per annum. He received no remuneration for the financial year ended 30 June 2015, as he commenced in the 2016 financial year.
ISE
LE
CT
AN
NU
AL
RE
PO
RT
20
16
47
ReMuNeRAtioN RepoRt (AuDiteD)

6.4 Remuneration Paid to Non-Executive Directors for the Year Ended 30 June 2016
FEES & ALLOWANCES
$
SHORT-TERM BENEFITS
$
SUPER-ANNUATION
$OTHER
$TOTAL
$
Current Non-Executive Directors
Chris Knoblanche (appointed 1 July 2015)
2016 228,310 - 21,690 - 250,000
2015 - - - - -
Brodie Arnhold
2016 86,758 - 8,242 - 95,000
2015 66,420 - 6,310 - 72,730
Shaun Bonètt
2016 95,890 - 9,110 - 105,000
2015 86,758 - 8,242 - 95,000
Bridget Fair
2016 77,626 - 7,374 - 85,000
2015 77,626 - 7,374 - 85,000
Damien Waller (acted as Non-Executive Chairman from 1 January 2015 to 30 June 2015)
2016 77,626 - 7,374 - 85,000
2015 100,000 - - - 100,000
Melanie Wilson (from 1 April 2016)
2016 19,705 - 1,872 - 21,577
2015 - - - - -
Former Non-Executive Directors
Leslie Webb (ceased 28 August 2015)
2016 14,460 - 1,374 - 15,834
2015 86,758 - 8,242 - 95,000
Greg Camm (ceased 31 October 2014)
2016 - - - - -
2015 28,919 - 2,747 - 31,666
Total
2016 600,375 - 57,036 - 657,411
2015 446,481 - 32,915 - 479,396
ReMuNeRAtioN RepoRt (AuDiteD)IS
EL
EC
T A
NN
UA
L R
EP
OR
T 2
016
48

7. KEY MANAGEMENT PERSONNEL SHAREHOLDINGSThe numbers of ordinary shares in iSelect Limited held during the financial year (directly and indirectly) by KMP of the Group and their related parties are set out below:
BALANCE AT START OF YEAR
GRANTED AS REMUNERATION
LAPSED/FORFEITED
OTHER CHANGES
BALANCE AT END OF YEAR
Current Senior Executives
Scott Wilson 541,013 558,870 - 475,663 1,575,546
David Christie 1,020,612 495,470 - 268,000 1,784,082
Former Executives
Vicki Pafumi - - - - -
Shane Abeyratne - 312,162 312,162 - -
Natalie Ellisdon - 236,486 236,486 - -
Elise Morris 502,172 331,175 833,347 - -
Paul McCarthy 532,190 350,000 882,190 - -
Former Executive Director
Alex Stevens 1,715,818 - 1,630,434 (85,384) -
Current Non-Executive Directors5
Brodie Arnhold - - - 126,100 126,100
Shaun Bonètt 2,500,000 - - - 2,500,000
Bridget Fair 65,828 - - 14,900 80,728
Chris Knoblanche 37,836 - - 155,255 193,091
Damien Waller 31,553,660 - - - 31,553,660
Melanie Wilson - - - 43,242 43,242
Former Non-Executive Director6
Leslie Webb 2,100,000 - - (2,100,000) -
5 All increases in share holdings for Non-Executive Directors during financial year 2016 were by way of on-market purchases.
6 Balance removed on resignation as a Non-Executive Director during the year.
8. KEY MANAGEMENT PERSONNEL OPTION HOLDINGSThere were no options in iSelect Limited held during the financial year (directly or indirectly) by KMP of the Group and their related parties.
This Directors’ Report and Remuneration Report is signed in accordance with a resolution of the Directors.
On behalf of the Directors
Chris Knoblanche AM Brodie Arnhold Director Director
Melbourne, Melbourne, 30 August 2016 30 August 2016
ISE
LE
CT
AN
NU
AL
RE
PO
RT
20
16
49
ReMuNeRAtioN RepoRt (AuDiteD)

Corporate Governance Statement
This statement explains how the Board of iSelect Ltd (the Board) oversees the management of iSelect Ltd’s (iSelect or the Company) business. The Board is responsible for the overall corporate governance of iSelect, including establishing and monitoring key performance goals. The Board monitors the operational and financial position and performance of iSelect and oversees its business strategy including approving the strategic goals of iSelect and considering and approving an annual operating plan, including a budget.
As at the date of this report, the Board of Directors is comprised of an independent non-executive Chairman and five other non-executive Directors. Currently the Board consists of:
DIRECTOR POSITION APPOINTED INDEPENDENT
Chris Knoblanche Non-Executive Chairman 1 July 2015 Yes
Damien Waller Non-Executive Director 21 July 1999 No
Shaun Bonètt Non-Executive Director 01 May 2005 Yes
Brodie Arnhold Non-Executive Director 25 September 2014 Yes
Bridget Fair Non-Executive Director 30 September 2013 Yes
Melanie Wilson Non-Executive Director 1 April 2016 Yes
The following are Directors who also held office during the year ended 30 June 2016:
FORMER DIRECTOR POSITION CEASED INDEPENDENT
Leslie Webb Non-Executive Director 28 August 2015 Yes
Alex Stevens Managing Director and CEO
12 October 2015 No
Details of each Director’s skills, experience, expertise, qualifications, term of office, relationships affecting independence, their independence status and membership of committees are set out within this Annual Report.
The Board is committed to maximising performance, generating appropriate levels of shareholder value and financial return, and sustaining the growth and success of iSelect. In conducting iSelect’s business with these objectives, the Board seeks to ensure that iSelect is properly managed to protect and enhance Shareholder interests, and that iSelect, its Directors, officers and personnel operate in an appropriate environment of corporate governance. Accordingly, the Board has created a framework for managing iSelect including adopting relevant internal controls, risk management processes and corporate governance policies and practices which it believes are appropriate for iSelect’s business and which are designed to promote the responsible management and conduct of iSelect.
The ASX Corporate Governance Council has developed and released its ASX Corporate Governance Principles and Recommendations (ASX Recommendations) for Australian listed entities in order to promote investor confidence and to assist companies in meeting stakeholder expectations. The recommendations are not prescriptions, but guidelines. However, under the ASX Listing Rules, iSelect is required to provide a statement in its annual report disclosing the extent to which it has followed the ASX recommendations in the reporting period. Where iSelect does not follow a recommendation, it must identify the recommendation that has not been followed and give reasons for not following it.
An overview of iSelect’s main corporate governance practices are set out below. The information in this statement relating to the Directors, Board committee memberships and other details is current at the date of this Annual Report.
Details of iSelect’s key policies and practices and the charters for the Board and each of its committees are available in the Governance section of the Company’s website at www.iselect.com.au.
CoRpoRAte GoVeRNANCe StAteMeNtIS
EL
EC
T A
NN
UA
L R
EP
OR
T 2
016
50

PRINCIPLE 1 – LAY SOLID FOUNDATIONS FOR MANAGEMENT AND OVERSIGHT A listed entity should establish and disclose respective roles and responsibilities of its board and management and how their performance is monitored and evaluated
RECOMMENDATION 1.1
Roles and responsibilities of the Board and ManagementThe Board has adopted a formal Charter that details the functions and responsibilities of the Board. The Board Charter also establishes the functions reserved to the Board and those powers delegated to management.
The Board delegates to the Chief Executive Officer (CEO) the authority and power to manage iSelect and its businesses within the levels of authority specified.
The CEO’s role includes the day-to-day management of iSelect’s operations including effective leadership of the management team in addition to the development of strategic objectives for the business.
The number of Board and Board Committee meetings held during the year along with the attendance by Directors is set out in the Directors’ Report under Directors’ Meetings.
Roles and responsibilities of the BoardThe Board is appointed by shareholders who hold them accountable for the Company’s governance, performance, strategies and policies. To assist with the efficient and effective discharging of its responsibilities, the Board Charter allows the Board to delegate powers and responsibilities to committees established by the Board.
The Board strives to build sustainable value for shareholders whilst protecting the assets and reputation of iSelect. The Board’s responsibilities include but are not limited to:
• approving iSelect’s strategies, budgets, plans and policies;
• assessing performance against strategies implemented by management;
• reviewing operating information to understand the state of health of the Company;
• approval of proposed acquisitions, divestments and significant capital expenditure;
• approval of capital management including approving the issue or allotment of equity, borrowings, dividend policy and other financing proposals;
• ensuring that iSelect operates an appropriate corporate governance structure and compliance systems;
• approving iSelect’s risk management strategy and frameworks, and monitoring their effectiveness;
• approval and monitoring of the annual and half year financial reports; and
• appointment and removal of the CEO.
The Board may from time to time establish appropriate committees to assist in the discharge of its responsibilities. The Board has established an Audit and Risk Management Committee, a Nominations Committee and a Remuneration Committee. Other committees may be established by the Board as and when required. Membership of Board committees will be based on the needs of iSelect, relevant legislative and other requirements and the skills and experience of individual Directors.
The Board Charter provides that with guidance from the Nominations Committee and, where necessary, external consultants, the Board shall identify candidates with appropriate skills, experience, expertise and diversity in order to discharge its mandate effectively and to maintain the necessary mix of expertise on the Board.
Directors may obtain independent professional advice at iSelect’s expense on matters arising in the course of their Board and committee duties, after obtaining the Chair’s approval.
A copy of the Board Charter is publicly available in the Governance section of the Company’s website at www.iselect.com.au
RECOMMENDATION 1.2
Background checks prior to Director appointmentsThe Board is committed to ensuring appropriate checks are conducted before appointing a person, or putting forward a candidate for election to security holders, as a Director. The types of verifications the Company typically undertakes include checks as to the proposed Director’s character, experience, education, criminal and bankruptcy history.
All information relevant to a decision to elect or re-elect a Director will be provided to shareholders before a resolution is put forward to shareholders at the General Meeting. This information will include details of any other material directorships and biographical details, including relevant qualifications and experience.
RECOMMENDATION 1.3
Director and senior executive agreementsNon-executive directors are appointed pursuant to formal letters of appointment setting out the key terms and conditions of the appointment including details regarding directors’ remuneration, role and responsibilities, confidentiality of information, disclosure of interests, matters affecting independence and entering into deeds of indemnity, insurance and access. Each senior executive also has a written employment contract which sets out the terms of their employment.
ISE
LE
CT
AN
NU
AL
RE
PO
RT
20
16
51
CoRpoRAte GoVeRNANCe StAteMeNt
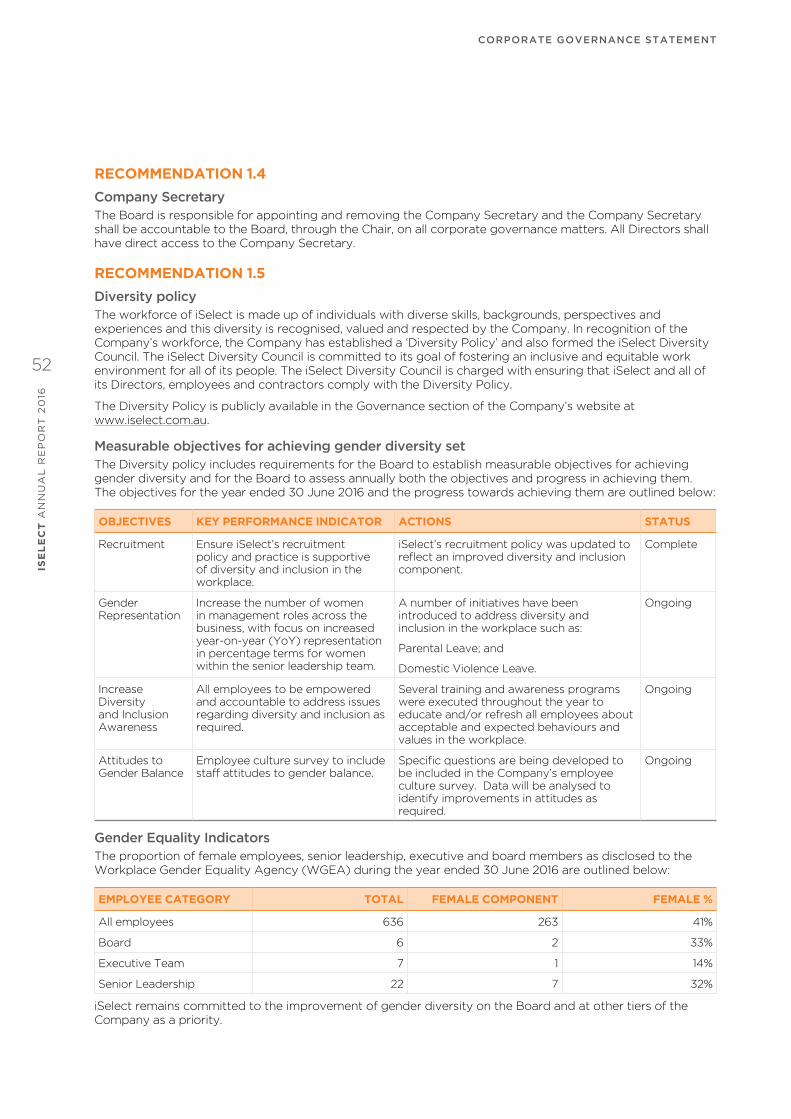
RECOMMENDATION 1.4
Company Secretary The Board is responsible for appointing and removing the Company Secretary and the Company Secretary shall be accountable to the Board, through the Chair, on all corporate governance matters. All Directors shall have direct access to the Company Secretary.
RECOMMENDATION 1.5
Diversity policy The workforce of iSelect is made up of individuals with diverse skills, backgrounds, perspectives and experiences and this diversity is recognised, valued and respected by the Company. In recognition of the Company’s workforce, the Company has established a ‘Diversity Policy’ and also formed the iSelect Diversity Council. The iSelect Diversity Council is committed to its goal of fostering an inclusive and equitable work environment for all of its people. The iSelect Diversity Council is charged with ensuring that iSelect and all of its Directors, employees and contractors comply with the Diversity Policy.
The Diversity Policy is publicly available in the Governance section of the Company’s website at www.iselect.com.au.
Measurable objectives for achieving gender diversity set The Diversity policy includes requirements for the Board to establish measurable objectives for achieving gender diversity and for the Board to assess annually both the objectives and progress in achieving them. The objectives for the year ended 30 June 2016 and the progress towards achieving them are outlined below:
OBJECTIVES KEY PERFORMANCE INDICATOR ACTIONS STATUS
Recruitment Ensure iSelect’s recruitment policy and practice is supportive of diversity and inclusion in the workplace.
iSelect’s recruitment policy was updated to reflect an improved diversity and inclusion component.
Complete
Gender Representation
Increase the number of women in management roles across the business, with focus on increased year-on-year (YoY) representation in percentage terms for women within the senior leadership team.
A number of initiatives have been introduced to address diversity and inclusion in the workplace such as:
Parental Leave; and
Domestic Violence Leave.
Ongoing
Increase Diversity and Inclusion Awareness
All employees to be empowered and accountable to address issues regarding diversity and inclusion as required.
Several training and awareness programs were executed throughout the year to educate and/or refresh all employees about acceptable and expected behaviours and values in the workplace.
Ongoing
Attitudes to Gender Balance
Employee culture survey to include staff attitudes to gender balance.
Specific questions are being developed to be included in the Company’s employee culture survey. Data will be analysed to identify improvements in attitudes as required.
Ongoing
Gender equality indicators The proportion of female employees, senior leadership, executive and board members as disclosed to the Workplace Gender Equality Agency (WGEA) during the year ended 30 June 2016 are outlined below:
EMPLOYEE CATEGORY TOTAL FEMALE COMPONENT FEMALE %
All employees 636 263 41%
Board 6 2 33%
Executive Team 7 1 14%
Senior Leadership 22 7 32%
iSelect remains committed to the improvement of gender diversity on the Board and at other tiers of the Company as a priority.
CoRpoRAte GoVeRNANCe StAteMeNtIS
EL
EC
T A
NN
UA
L R
EP
OR
T 2
016
52

RECOMMENDATION 1.6
process for evaluating the performance of the board, its committees and individual Directors.The Company’s Board Charter details a process for the review of Board, committee and individual Directors’ performance. During the year ended 30 June 2016, a formal performance evaluation was commissioned to review the Board, Committees and individual Directors to ensure that they work effectively and efficiently in fulfilling their functions.
This review, which was facilitated by an external consultant, involved a 360 degree review with the Board, its Committees and each Director and senior executives assessing their own performance and the performance of their peers. The Chairman of the Board also held discussions with individual Directors as to their performance.
RECOMMENDATION 1.7
process for evaluating the performance of senior executives The Company’s Board Charter details a process for the review of the performance of the CEO.
The performance of the Company’s senior executives, including the CEO, is reviewed regularly to ensure that executive members continue to perform effectively in their roles. Performance is measured against goals and company performance set at the beginning of the financial year and reviewed throughout the year. A performance evaluation for senior executives has occurred during the year in accordance with this process.
PRINCIPLE 2 – STRUCTURE THE BOARD TO ADD VALUEA listed entity should have a board of an appropriate size, composition, skills and commitment to be able to discharge its duties effectively
RECOMMENDATION 2.1
Nominations CommitteeThe Board has established a Nominations Committee which consists of a majority of independent Directors, is chaired by an independent Director and has at least three members.
The committee currently comprises Shaun Bonètt (chair), Bridget Fair and Damien Waller.
The Nominations Committee meets as often as is required by the Nominations Committee Charter or other policy approved by the Board to govern the operation of the Nominations Committee. The number of Nomination Committee meetings held during the year is set out in the Directors’ Report under Directors’ Meetings.
Following each meeting, the Nominations Committee reports to the Board on any matter that should be brought to the Board’s attention and on any recommendation of the Nominations Committee that requires Board approval.
Further details of the procedure for the selection of new Directors to the Board, the re-election of incumbent Directors and the Board’s policy for the nomination of Directors is contained with the Company’s ‘Nomination Committee Charter’ and ‘Board Charter’.
A copy of the Company’s ‘Nominations Committee Charter’ is publicly available in the Governance section of the Company’s website at www.iselect.com.au.
RECOMMENDATION 2.2
Board skills matrixThe Nominations Committee is responsible for reviewing and making recommendations in relation to the composition and performance of the Board and its committees and ensuring that adequate succession plans are in place (including for the recruitment and appointment of Directors and senior management). Independent advice will be sought where appropriate.
The criteria to assess nominations of new Directors is reviewed annually and the Nominations Committee regularly compares the skill base of existing Directors with that required for the future strategy of iSelect to enable identification of attributes required in new Directors. In searching for and selecting new directors for the Board, the Committee assesses certain criteria to make recommendations to the Board. The criteria which will be assessed includes the candidate’s background, experience, professional skills, personal qualities, gender, capability of the candidate to devote the necessary time and commitment to the role, potential conflicts of interest, independence and whether their skills and experience will complement the existing Board.
The Board’s objective is to have an appropriate mix of expertise and experience on our Board and its Committees so that the Board can effectively discharge its corporate governance and oversight responsibilities. This mix is described in the Board skills matrix below:
• Accounting and Financial Reporting;
• Legal and compliance;
• Strategy;
• Corporate governance;
• Audit and risk management;
• Remuneration, workplace health & safety and human resources management;
• Government relations;
• CEO and Board experience; and
• Industry experience.
ISE
LE
CT
AN
NU
AL
RE
PO
RT
20
16
53
CoRpoRAte GoVeRNANCe StAteMeNt

RECOMMENDATIONS 2.3, 2.4 & 2.5
independence The Board considers an independent Director to be a non-executive Director who is not a member of iSelect’s management and who is free of any business or other relationship that could materially interfere with or reasonably be perceived to interfere with the independent exercise of their judgement. The Board will consider the materiality of any given relationship on a case-by-case basis and has adopted guidelines to assist in this regard. The Board reviews the independence of each Director in light of interests disclosed to the Board from time to time.
The iSelect Board Charter sets out guidelines and thresholds of materiality for the purpose of determining independence of Directors in accordance with the ASX Recommendations and has adopted a definition of independence that is based on that set out in the ASX Recommendations.
The Board considers thresholds of materiality for the purpose of determining ‘independence’ on a case-by-case basis, having regard to both quantitative and qualitative principles. Without limiting the Board’s discretion in this regard, the Board has adopted the following guidelines:
• The Board will determine the appropriate base to apply (e.g. revenue, equity or expenses), in the context of each situation;
• In general, the Board will consider an affiliation with a business that accounts for less than 5% of the relevant base to be immaterial for the purpose of determining independence. However, where this threshold is exceeded, the materiality of the particular circumstance with respect to the independence of the particular Director should be reviewed by the Board; and
• Overriding the quantitative assessment is the qualitative assessment. Specifically, the Board will consider whether there are any factors or considerations which may mean that the Director’s interest, business or relationship could, or could be reasonably perceived to, materially interfere with the Director’s ability to act in the best interests of iSelect.
The Board considers that each of the independent Directors is free from any business or any other relationship that could materially interfere with, or reasonably be perceived to interfere with, the independent exercise of the Director’s judgement and is able to fulfil the role of independent Director for the purpose of the ASX Recommendations. The Board considers that the following current Directors are independent:
• Chris Knoblanche;
• Bridget Fair;
• Shaun Bonètt;
• Brodie Arnhold; and
• Melanie Wilson.
Damien Waller is the co-founder of iSelect, former Executive Chairman and is also a substantial shareholder of iSelect. Damien Waller is not currently considered to be independent.
RECOMMENDATION 2.4 The Board consists of a majority of independent Directors.
RECOMMENDATION 2.5
independent Chair The Board recognises the ASX Corporate Governance Council’s recommendation that the Chairman should be an independent Director. Chris Knoblanche, in his role as independent Chairman for the year ended 30 June 2016 (appointed on 1 July 2015) is in line with the recommendation.
Roles of the Chair and Chief Executive Officer The role of Chairman and CEO were not exercised by the same individual at any time during the year ended 30 June 2016.
RECOMMENDATION 2.6
Director induction and professional developmentThe Board recognises the importance of having a program for inducting new Directors and providing appropriate professional development opportunities for Directors to maintain the skills to perform their role as Directors effectively.
The induction program for new Directors includes briefings by the CEO and other members of senior management about iSelect. The briefings will provide details on iSelect’s structure, people, policies, culture, business strategies and performance. The induction program also includes site visits to review operations and understand the industries in which iSelect operates.
The Company operates a program of professional development for Directors including regular written updates on key developments within corporate governance and ad-hoc seminars on relevant topics including corporate governance and accounting. Formal professional development opportunities for Directors are considered by the Chair on a case-by-case basis.
CoRpoRAte GoVeRNANCe StAteMeNtIS
EL
EC
T A
NN
UA
L R
EP
OR
T 2
016
54

PRINCIPLE 3 – ACT ETHICALLY AND RESPONSIBLYA listed entity should act ethically and responsibly
Code of conductThe Board recognises that it has a responsibility for setting the ethical tone and standards of the Company and iSelect’s senior executives recognise that they have a responsibility to implement practices that are consistent with those standards. The reputation of the Company is one of its most valuable assets and the Board acknowledge the importance of protecting this asset by acting ethically and responsibly.
The Company has developed a ‘Code of Conduct’ Policy which has been fully endorsed by the Board and applies to all Directors and employees. The Code of Conduct is designed to identify and encourage:
• the practices necessary to maintain confidence in the Company’s integrity;
• the practices necessary to take into account the Company’s legal obligations; and
• the responsibility and accountability of individuals for reporting and investigating reports of unethical practices.
A copy of the Company’s ‘Code of Conduct’ is publicly available in the Governance section of the Company’s website at www.iselect.com.au.
PRINCIPLE 4 – SAFEGUARD INTEGRITY IN CORPORATE REPORTINGA listed entity should have formal and rigorous processes that independently verify and safeguard the integrity of its corporate reporting
RECOMMENDATION 4.1
Audit and Risk Management CommitteeThe Board has established an Audit and Risk Management Committee to assist in the discharge of its responsibilities. The role of the Audit and Risk Management Committee is to assist the Board in fulfilling its responsibilities for corporate governance and overseeing iSelect’s internal control structure and risk management systems. The Audit and Risk Management Committee also confirms the quality and reliability of the financial information prepared by iSelect, works with the external auditor on behalf of the Board and reviews non-audit services provided by the external auditor, to confirm they are consistent with maintaining external audit independence.
The Audit and Risk Management Committee provides advice to the Board and reports on the status and management of the risks to iSelect. The purpose of the committee’s risk management process is to ensure that risks are identified, assessed and appropriately managed.
The Board has adopted a policy regarding the services that iSelect may obtain from its external auditor. It is the policy of iSelect that the external auditor:
• Must be independent of iSelect and the Directors and senior executives. To ensure this, iSelect requires a formal confirmation of independence from its external auditor on a six monthly basis; and
• May not provide services to iSelect that are, or are perceived to be, materially in conflict with the role of the external auditor. Non-audit or assurance services that may impair, or appear to impair, the external auditor’s judgement or independence are not appropriate. However, the external auditor may be permitted to provide additional services which are not, or are not perceived to be, materially in conflict with the role of the auditor, if the Board or Audit and Risk Management Committee has approved those additional services. Such additional services may include financial audits, tax compliance, advice on accounting standards and due diligence in certain acquisition or sale transactions.
Information on the procedures for the selection and appointment of the external auditor, and for the rotation of external audit engagement partners is contained with the Company’s ‘Audit and Risk Management Committee’ Charter.
The Audit and Risk Management Committee must comprise, to the extent practicable given the size and composition of the Board, at least three Directors, all of whom must be non-executive Directors and the majority of which must be independent in accordance with the independence criteria set out in the Board Charter. A member of the Audit and Risk Management Committee, that does not chair the Board, shall be appointed the chair of the committee.
The committee currently comprises Brodie Arnhold (chair), Melanie Wilson and Bridget Fair. Chris Knoblanche also served on the committee during the year ended 30 June 2016.
The Board acknowledges the ASX Recommendation that the Audit and Risk Management Committee should be chaired by an independent Director (who is not chair of the board) and in recognition of this, Brodie Arnhold currently chairs the Audit and Risk Management Committee.
An Audit and Risk Management Committee Charter has been adopted by the Board and sets out the functions and responsibilities of the committee.
ISE
LE
CT
AN
NU
AL
RE
PO
RT
20
16
55
CoRpoRAte GoVeRNANCe StAteMeNt

RECOMMENDATION 4.1 (CONT)
Audit and Risk Management Committee (cont)The Audit and Risk Management Committee meets as often as is required by the Audit and Risk Management Committee Charter. The number of Audit and Risk Management Committee meetings held during the year is set out in the Directors’ Report under Directors’ Meetings.
The chair of the Audit and Risk Management Committee invites members of management and representatives of the external auditor to be present at meetings of the committee and may seek advice from external advisors. The Audit and Risk Management Committee regularly reports to the Board about committee activities, issues and related recommendations.
A copy of the Company’s ‘Audit and Risk Management Committee Charter’ is publicly available in the Governance section of the Company’s website at www.iselect.com.au.
RECOMMENDATION 4.2Before approval of the financial statement for the periods ended 31 December 2015 and 30 June 2016, the Board received assurance from the CEO and the Chief Financial Officer (CFO) that the declaration provided in accordance with section 295A of the Corporations Act 2001 (Corporations Act) is founded on a sound system of risk management and internal control and that the system is operating effectively in all material respects in relation to financial reporting risks. This assurance was given on 25 February 2016 and 30 August 2016 by Scott Wilson (the CEO) with respect to the financial statement for the periods ended 31 December 2015 and 30 June 2016 and by Darryl Innes (the CFO) with respect to the financial statement for the period ended 30 June 2016, only.
The Board has also received from the CEO and the CFO written affirmations concerning the Company’s financial statements as set out in the Director’s Declaration.
RECOMMENDATION 4.3The Board recognises the importance of the external auditor attending its AGM and being available to answer questions from shareholders. To this end, the Company’s auditors are requested to attend each AGM.
PRINCIPLE 5 – MAKE TIMELY AND BALANCED DISCLOSUREA listed entity should make timely and balanced disclosure of all matters concerning it that a reasonable person would expect to have a material effect on the price and value of its securities
RECOMMENDATION 5.1As a company listed on ASX, iSelect is required to comply with the continuous disclosure requirements of the ASX Listing Rules and the Corporations Act. iSelect is required to disclose to the ASX any information, with the exception of certain carve-outs, concerning iSelect which is not generally available and which, if it was made available, a reasonable person would expect to have a material effect on the price or value of iSelect’s securities.
The Board aims to ensure that shareholders and stakeholders are informed of all major developments affecting iSelect’s state of affairs. As such, iSelect has adopted a Disclosure Policy and Shareholder Communication Policy, which together establish procedures to ensure that Directors and senior management are aware of, and fulfil, their obligations in relation to providing timely, full and accurate disclosure of material information to iSelect’s stakeholders and comply with iSelect’s disclosure obligations under the Corporations Act and Listing Rules. The Disclosure Policy also sets out procedures for communicating with shareholders, the media and the market.
iSelect has formed a disclosure committee which meets as frequently as needed to determine, among other things, whether there are matters that require disclosure to the ASX. The disclosure committee will make recommendations to the Board on matters which may require disclosure to the market. The members of the disclosure committee consist of a Non-executive Director, CEO, CFO, Company Secretary and the General Counsel.
iSelect is committed to observing its disclosure obligations under the ASX Listing Rules and the Corporations Act. Information is to be communicated to shareholders through the lodgement of all relevant financial and other information with the ASX and continuous disclosure announcements are made available on iSelect’s website, www.iselect.com.au.
Share trading policyiSelect has adopted a Share Trading Policy which applies to iSelect and its Directors, officers, employees and senior management, including those persons having authority and responsibility for planning, directing and controlling the activities of iSelect (Key Management Personnel), whether directly or indirectly.
CoRpoRAte GoVeRNANCe StAteMeNtIS
EL
EC
T A
NN
UA
L R
EP
OR
T 2
016
56

The policy is intended to explain the types of conduct in relation to dealings in shares that is prohibited under the Corporations Act and establish procedures in relation to Directors, senior management or employees dealing in shares.
Subject to certain exceptions, including exceptional financial circumstances, the policy defines certain ‘closed periods’ during which trading in Shares by the Company’s Directors, officers, employees and Key Management Personnel is prohibited. Those closed periods are currently defined as the following periods:
• The period commencing six weeks prior to the release of iSelect’s half-year and annual financial results to the ASX and ending 24 hours after such release; and
• The period commencing two weeks prior to the Company’s annual general meeting and ending 24 hours after the annual general meeting.
Outside of these periods, Directors, management and iSelect employees must receive clearance for any proposed dealing in Shares. In all instances, buying or selling Shares is not permitted at any time by any person who possesses price-sensitive information.
A copy of the Company’s ‘Disclosure Policy’, ‘Shareholder Communication Policy’ and ‘Share Trade Policy’ are publicly available in the Governance section of the Company’s website at www.iselect.com.au.
PRINCIPLE 6 – RESPECT THE RIGHTS OF SHAREHOLDERSA listed entity should respect the rights of its security holders by providing them with appropriate information and facilities to allow them to exercise those rights effectively
RECOMMENDATION 6.1The Company maintains an investor section of its website which includes information about itself which is relevant to shareholders and other stakeholders. The investors section includes a Governance section which includes detailed information on the Company’s governance framework and documents.
RECOMMENDATIONS 6.2, 6.3 & 6.4The Board has adopted a ‘Shareholder Communication Policy’ which is designed to supplement the iSelect ‘Disclosure Policy’. The ‘Shareholder Communication Policy’ aims to promote effective communication with shareholders and other stakeholders.
The policy recognises the following key methods of communication which will be used to provide information to shareholders and other stakeholders:
• releases to the Australian Securities Exchange (ASX) in accordance with continuous disclosure obligations;
• iSelect’s website;
• iSelect’s annual and half-yearly reports;
• the annual general meeting; and
• email and other electronic means.
In addition to the abovementioned communications methods, since listing on the ASX in 2013 the Company has maintained an active investor relations program to facilitate effective two-way communication with retail and institutional shareholders and other relevant equity market stakeholders. This program includes face-to-face meetings with investors, broker analysts and proxy firms as well as responding to shareholder enquiries as appropriate. The Company utilises public investor webcasts and conference calls for key announcements such as the full year and half year financial results. The Board encourages effective participation at iSelect’s General Meetings by providing opportunity for shareholders to ask questions of the Company’s Directors and auditors.
iSelect encourages shareholders to receive company information electronically by registering their email address online with iSelect’s shareholder registry. The Company also allows shareholders to communicate electronically with the Company and share registry including providing shareholders the ability to submit proxy voting instructions online.
A copy of the Company’s ‘Shareholder Communication Policy’ are publicly available in the Governance section of the Company’s website at www.iselect.com.au.
PRINCIPLE 7 – RECOGNISE AND MANAGE RISK A listed entity should establish a sound risk management framework and periodically review the effectiveness of that framework
RECOMMENDATION 7.1 As stated in Principle 4, the Board has established an Audit and Risk Management Committee to assist in the discharge of its responsibilities to establish a sound risk management framework and periodically review effectiveness of that framework. This Committee is structured to ensure it consists of a majority of independent Directors and it is chaired by an independent Director.
The Company has also developed a ‘Risk Management Policy’ which is publicly available in the Governance section of the Company’s website at www.iselect.com.au.
ISE
LE
CT
AN
NU
AL
RE
PO
RT
20
16
57
CoRpoRAte GoVeRNANCe StAteMeNt

RECOMMENDATION 7.2The Company’s Board Charter provides that, a function of the Board, with the guidance of the Audit and Risk Management Committee is:
i. approving policies on and overseeing the management of business, financial and non-financial risks (including foreign exchange and interest rate risks, enterprise risk and risk in relation to occupational health and safety);
ii. reviewing and monitoring processes and controls to maintain the integrity of accounting and financial records and reporting; and
iii. approving financial results and reports for release and dividends to be paid to shareholders.
The Company’s Audit and Risk Management Charter also provides that the Committee’s specific function with respect to risk management is to review and report to the Board that:
i. iSelect’s ongoing risk management program effectively identifies all areas of potential risk;
ii. adequate policies and procedures have been designed and implemented to manage identified risks;
iii. a regular program of audit is undertaken to test the adequacy of and compliance with prescribed policies; and
iv. proper remedial action is undertaken to redress areas of weakness.
The Company seeks to take and manage risk in ways that will generate and protect shareholder value and recognises that the management of risk is a continual process and an integral part of the management and corporate governance of the business.
The Company acknowledges that it has an obligation to all stakeholders, including shareholders, customers, employees, contractors and the wider community and that the efficient and effective management of risk is critical to the Company meeting these obligations and achieving its strategic objectives.
The Board, with assistance from the Audit and Risk Management Committee, requires management to design and implement a suitable risk management framework to manage the Company’s material business risks. During the year, Management reported to the Board as to the effectiveness of the Company’s management of its material business risks. The Audit and Risk Management Committee is responsible for evaluating the adequacy and effectiveness of a risk management framework established by management.
The Audit & Risk Management Committee conducted a review of the Company’s risk management framework during the year and were satisfied that it continues to be sound having regard to the size and complexity of the Company’s operations.
RECOMMENDATION 7.3 iSelect’s internal audit function provides independent and objective assurance on the adequacy and effectiveness of the Company’s systems for internal control, together with recommendations to improve the efficiency of the relevant systems and processes.
iSelect may use external service providers to supplement its core internal team to deliver the internal audit function.
The annual internal audit plan is approved by the Audit and Risk Management Committee and internal audit has full access to all functions, records, property and personnel of the Company. Internal audit administratively reports to the CFO and has a direct reporting line to the Chair of the Audit and Risk Management Committee.
RECOMMENDATION 7.4iSelect’s Risk Management Policy supports its strategy of creating an environment in which risk management underpins consistently good practice – enabling informed decisions that optimise returns within a specified appetite for risk.
iSelect understands that “material exposure” in this context means a real possibility that the risk in question could substantively impact the Company’s ability to create or preserve value for shareholders over the short, medium or long term. In this context materiality is linked to the rating attributed to residual risks taking into account the risk mitigation strategies and controls in place, and Very High rated risk would be considered material.
At the time of reporting, iSelect has no material exposure to Very High rated risks to our economic, environmental and social sustainability profile.
CoRpoRAte GoVeRNANCe StAteMeNtIS
EL
EC
T A
NN
UA
L R
EP
OR
T 2
016
58
PRINCIPLE 8 – REMUNERATE FAIRLY AND RESPONSIBLYA listed entity should pay director remuneration sufficiently to attract and retain high quality directors and design its executive remuneration to attract retain and motivate high quality senior executives and to align their interests with the creation of value for security holders
RECOMMENDATION 8.1The Board has established a Remuneration Committee to assist in the discharge of its responsibilities. The role of the Remuneration Committee is to review and make recommendations to the Board on remuneration packages and polices related to the Directors and senior executives. The Remuneration Committee is also charged with ensuring that the remuneration policies and practices are consistent with iSelect’s strategic goals and human resources objectives.
The Remuneration Committee meets as often as is required by the Remuneration Committee Charter. The number of Remuneration Committee meetings held during the year is set out in the Directors’ Report under Directors’ Meetings.
Following each meeting, the Remuneration Committee reports to the Board on any matter that should be brought to the Board’s attention and on any recommendation of the Remuneration Committee that requires Board approval.
The Remuneration Committee must comprise, to the extent practicable given the size and composition of the Board, at least three Directors, all of whom must be non-executive Directors and the majority of which must be independent in accordance with the independence criteria set out in the Board Charter. An independent member of the Remuneration Committee, that does not chair the Board, shall be appointed the chair of the committee.
A copy of the Company’s ‘Remuneration Committee Charter’ is publicly available in the Governance section of the Company’s website at www.iselect.com.au.
The committee currently comprises Shaun Bonètt (Chair), Damien Waller, and Bridget Fair.
RECOMMENDATION 8.2iSelect clearly distinguishes the structure of non-executive Directors’ remuneration from that of executive Directors and senior executives.
Non-executive Director remuneration is fixed and non-executive Directors do not participate in any ’at risk’ incentive plans. Remuneration paid to executives in the 2016 financial year includes fixed and variable components.
Board and Non-executive DirectorThe remuneration policy for the Board and the remuneration of each Director is set out in both the Remuneration report which forms part of the Directors’ Report, and in Notes to the Financial Report.
The Board acknowledges the guidelines which recommend that non-executive Directors should not be provided with retirement benefits other than superannuation. The Company also notes that Chris Knoblanche has a notice period of 3 months which may constitute a retirement benefit. The Company believes that a notice period for the Chair is appropriate to ensure continuity.
Senior executivesInformation on the performance evaluation and structure of remuneration for the Company’s Senior Executives can be found in the Remuneration Report, which forms part of the Directors’ Report.
RECOMMENDATION 8.3The Company’s Share Trading Policy prohibits the Directors and Senior Executives from entering into transactions or arrangements which limit the economic risk of participating in unvested entitlements.
ISE
LE
CT
AN
NU
AL
RE
PO
RT
20
16
59
CoRpoRAte GoVeRNANCe StAteMeNt

Auditor’s Independence Declaration
AuDitoR’S iNDepeNDeNCe DeCLARAtioNIS
EL
EC
T A
NN
UA
L R
EP
OR
T 2
016
60

CONSOLIDATED STATEMENT OF PROFIT OR LOSS AND OTHER COMPREHENSIVE INCOME For the year ended 30 June 2016
NOTE
CONSOLIDATED CONSOLIDATED
30 JUNE 2016$’000
30 JUNE 2015$’000
Upfront revenue 6 140,694 125,167
Trail commission revenue 6 31,171 32,047
total operating Revenue 171,865 157,214
Cost of sales
(113,388)
(90,928)
Gross Profit 58,477 66,286
Other income
245
209
Administrative expenses (37,164) (37,630)
Share-based payments expense 6 (63) (287)
Impairment of NIA loan receivable 6 - (9,987)
Share of loss from associate, net of tax 14 (738) (313)
Depreciation and amortisation 6 (5,723) (6,015)
Profit Before Interest and Tax
15,034
12,263
Finance income
2,568
6,357
Finance costs (489) (589)
Net Finance income 2,079 5,768
Profit Before Income Tax Expense
17,113
18,031
Income tax expense 7 (4,208) (8,393)
Profit After Tax for the Period
12,905
9,638
other Comprehensive income/(Loss) Items that are or may be reclassified to profit or loss
Foreign operations – foreign currency translation movements 49 (49)
other Comprehensive income/(Loss) Net of tax 49 (49)
total Comprehensive income for the period 12,954 9,589
Profit attributable to owners of the Group 12,905 9,638
Total comprehensive income attributable to owners of the Group 12,954 9,589
earnings per share (cents per share)
Basic profit for the year attributable to ordinary equity holders of the parent
22 5.1 3.7
Diluted profit for the year attributable to ordinary equity holders of the parent
22 5.0 3.7
The accompanying notes form part of these consolidated financial statements.
Financial Statements
ISE
LE
CT
AN
NU
AL
RE
PO
RT
20
16
61
FiNANCiAL StAteMeNtS

CONSOLIDATED STATEMENT OF FINANCIAL POSITION
As at 30 June 2016
NOTE
CONSOLIDATED CONSOLIDATED
30 JUNE 2016$’000
30 JUNE 2015$’000
ASSETS
Current Assets
Cash and cash equivalents 8 87,620 70,542
Trade and other receivables 9 43,922 73,761
Trail commission receivable 10 21,052 28,174
Other assets 11 3,012 3,758
total Current Assets 155,606 176,235
Non-Current Assets
Trail commission receivable 10 82,639 73,451
Property, plant and equipment 12 8,768 7,096
Intangible assets 13 46,213 46,200
Investment in associate 14 5,293 4,265
total Non-Current Assets 142,913 131,012
total Assets 298,519 307,247
LIABILITIES
Current Liabilities
Trade and other payables 15 27,760 21,050
Provisions 16 7,464 6,394
Income tax payable 236 5,434
Other 525 1,082
total Current Liabilities 35,985 33,960
Non-Current Liabilities
Provisions 16 1,699 2,276
Net deferred tax liabilities 7 26,228 24,089
total Non-Current Liabilities 27,927 26,365
total Liabilities 63,912 60,325
Net Assets 234,607 246,922
EQUITY
Contributed equity
18
150,914
173,713
Reserves 19 7,317 7,205
Retained earnings 20 76,376 66,004
total equity 234,607 246,922
The accompanying notes form part of these consolidated financial statements.
FiNANCiAL StAteMeNtSIS
EL
EC
T A
NN
UA
L R
EP
OR
T 2
016
62

CONSOLIDATED STATEMENT OF CHANGES IN EQUITY For the year ended 30 June 2016
NOTE
CONTRI-BUTEDEQUITY$’000
SHARED-BASED
PAYMENTRESERVES
$’000
BUSINESSCOMBIN-
ATIONRESERVE
$’000
FOREIGN CURRENCY
TRANS- LATION
RESERVE$’000
RETAINEDEARNINGS
$’000TOTAL$’000
Balance at 1 July 2014
172,963
1,396
5,571
-
56,366
236,296
Profit for the period
-
-
-
-
9,638
9,638
Other comprehensive income
- - - (49) - (49)
total Comprehensive income for the Year
-
-
-
(49)
9,638
9,589
transactions with owners in their Capacity as owners
Recognition of share-based payments
6 - 287 - - - 287
Issue/(buy-back) of share capital
18 750 - - - - 750
Dividends paid 21 - - - - - -
Balance at 30 June 2015
173,713
1,683
5,571
(49)
66,004
246,922
Profit for the period - - - - 12,905 12,905
Other comprehensive income
- - - 49 - 49
total Comprehensive income for the Year
-
-
-
49
12,905
12,954
transactions with owners in their Capacity as owners
Recognition of share-based payments
6
-
63
-
-
-
63
Issue/(buy-back) of share capital
18
(22,799)
-
-
-
-
(22,799)
Dividends paid 21 - - - - (2,533) (2,533)
Balance at 30 June 2016
150,914
1,746
5,571
-
76,376
234,607
The accompanying notes form part of these consolidated financial statements.
ISE
LE
CT
AN
NU
AL
RE
PO
RT
20
16
63
FiNANCiAL StAteMeNtS

CONSOLIDATED STATEMENT OF CASH FLOWS
For the year ended 30 June 2016
NOTE
CONSOLIDATED CONSOLIDATED
30 JUNE 2016$’000
30 JUNE 2015$’000
Cash Flows from operating Activities
Receipts from customers 176,491 166,062
Payments to suppliers and employees (162,181) (141,084)
Interest received 3,732 5,648
Income taxes paid (7,267) (26)
Net cash provided from operating activities 8 10,775 30,600
Cash Flows from investing Activities
Payments for property, plant and equipment and intangible assets (7,664) (4,355)
Net payment for acquisition of subsidiaries 5 - (9,701)
Payment for investment in associate 14 (1,766) (4,578)
Repayment from / (advance to) NIA facility 40,716 (17,937)
Net cash from/(used in) investing activities 31,286 (36,571)
Cash Flows from Financing Activities
Interest paid (151) (135)
Proceeds from issue of shares - 750
Payments for share buy-backs (22,308) -
Dividends paid to shareholders of the parent 21 (2,533) -
Net cash provided from/(used in) financing activities (24,992) 615
Net increase/(decrease) in cash and cash equivalents
17,069
(5,356)
Net foreign exchange difference 9 (8)
Cash and cash equivalents at the beginning of the year 70,542 75,906
Cash and cash equivalents at the end of the year 8 87,620 70,542
The accompanying notes form part of these consolidated financial statements.
FiNANCiAL StAteMeNtSIS
EL
EC
T A
NN
UA
L R
EP
OR
T 2
016
64

NOTES TO THE FINANCIAL STATEMENTS
For the year ended 30 June 2016
1. CORPORATE INFORMATIONThe financial report of iSelect Limited for the year ended 30 June 2016 was authorised for issue in accordance with a resolution of Directors on 30 August 2016.
iSelect Limited is a for-profit entity limited by shares incorporated in Australia whose shares are publicly traded on the Australian Securities Exchange (Code: ISU). The consolidated financial statements of the company as at and for the year ended 30 June 2016 comprise the financial statements of the company and its subsidiaries (as outlined in Note 27), together referred to in these financial statements as the “Group” and individually as “Group entities”.
The nature of the operations and principal activities of the Group are described in the Directors’ Report.
2. BASIS OF PREPARATION
(a) Basis of AccountingThe financial report is a general purpose financial report, which has been prepared in accordance with the requirements of the Corporations Act 2001, Australian Accounting Standards and other authoritative pronouncements of the Australian Accounting Standards Board. The financial report has also been prepared on a historical cost basis, except for certain assets, which as noted have been measured at amortised cost. Certain comparative information has been reclassified to conform to the current year presentation.
All amounts are presented in Australian dollars unless otherwise noted. The company is a company of the kind referred to in ASIC Class Order 2016/191, dated 24 March 2016, and in accordance with that Class Order amounts in the Directors’ report and the financial report are rounded off to the nearest thousand dollars, unless otherwise indicated.
(b) Statement of ComplianceThe financial report complies with the Corporations Act 2001, Australian Accounting Standards and International Financial Reporting Standards (IFRS) as issued by the International Accounting Standards Board.
(c) Clarification of Terminology Used in the Consolidated Statement of Profit or Loss and other Comprehensive income and the Consolidated Statement of Cash FlowsUnder the requirements of AASB 101: “Presentation of Financial Statements”, the Group classifies expenses (apart from any finance costs) according to either the nature (type) of the expense or function (activity to which the expense relates). The Directors have chosen to classify expenses using the nature classification as it more accurately reflects the type of operations undertaken.
Earnings (profit) before interest and income tax expense (EBIT) reflects profit for the year prior to including the effect of net finance costs, income taxes and depreciation and amortisation. Depreciation and amortisation are calculated in accordance with AASB 116: “Property, Plant and Equipment” and AASB 138 “Intangible Assets” respectively. In addition to this, the Directors believe that EBIT is a relevant and useful financial measure used by management to measure the Group’s operating performance.
Group management uses earnings (profit) before interest, income tax expense, depreciation and amortisation and loss on associates (EBITDA) and EBIT, in combination with other financial measures, primarily to evaluate the Group’s operating performance before financing, income tax and non-cash capital related expenses. In addition, the Directors believe EBIT is useful to investors because analysts and other members of the investment community largely view EBIT as a key and widely recognised measure of operating performance.
EBITDA is a similar measure to EBIT, but it does not take into account depreciation, amortisation and loss from associate.
ISE
LE
CT
AN
NU
AL
RE
PO
RT
20
16
65
FiNANCiAL StAteMeNtS

2. BASIS OF PREPARATION (CONTINUED)
(d) New Accounting Standards and interpretations
New standards effective from 1 July 2015The Group has adopted the following new and revised Accounting Standards issued by the AASB that are relevant to its operations.
REFERENCE TITLE
APPLICATION DATE OF STANDARD
APPLICATION DATE FOR GROUP
AASB 2013-9 Amendments to Australian Accounting Standards – Conceptual Framework, Materiality and Financial Instruments
The Standard contains three main parts and makes amendments to a number of Standards and Interpretations.
Part A of AASB 2013-9 makes consequential amendments arising from the issuance of AASB CF 2013-1.
Part B makes amendments to particular Australian Accounting Standards to delete references to AASB 1031 and also makes minor editorial amendments to various other standards.
Part C makes amendments to a number of Australian Accounting Standards, including incorporating Chapter 6 Hedge Accounting into AASB 9 Financial Instruments.
1 January 2015 1 July 2015
AASB 2015-3 Amendments to Australian Accounting Standards arising from the withdrawal of AASB 1031 Materiality.
The Standard completes the AASB’s project to remove Australian guidance on materiality from Australian Accounting Standards.
1 July 2015 1 July 2015
FiNANCiAL StAteMeNtSIS
EL
EC
T A
NN
UA
L R
EP
OR
T 2
016
66
NOTES TO THE FINANCIAL STATEMENTS CONTINUED

Australian Accounting Standards and Interpretations that have recently been issued or amended but are not yet effective and have not been adopted by the Group for the annual reporting period ending 30 June 2016 are outlined below. Management is currently working through the implications of these changes.
REFERENCE TITLESUMMARY AND IMPACT ON GROUP FINANCIAL REPORT
APPLICATION DATE OF STANDARD
APPLICATION DATE FOR GROUP
AASB 9 Financial Instruments
AASB 9 (December 2014) is a new Principal standard which replaces AASB 139. This new Principal version supersedes AASB 9 issued in December 2009 (as amended) and AASB 9 (issued in December 2010) and includes a model for classification and measurement, a single, forward-looking ‘expected loss’ impairment model and a substantially-reformed approach to hedge accounting.
AASB 9 is effective for annual periods beginning on or after 1 January 2018. However, the Standard is available for early application. The own credit changes can be early applied in isolation without otherwise changing the accounting for financial instruments.
AASB 9 includes requirements for a simpler approach for classification and measurement of financial assets compared with the requirements of AASB 139.
The main changes are described below
a. Financial assets that are debt instruments will be classified based on (1) the objective of the entity’s business model for managing the financial assets; (2) the characteristics of the contractual cash flows.
b. Allows an irrevocable election on initial recognition to present gains and losses on investments in equity instruments that are not held for trading in other comprehensive income. Dividends in respect of these investments that are a return on investment can be recognised in profit or loss and there is no impairment or recycling on disposal of the instrument.
c. Financial assets can be designated and measured at fair value through profit or loss at initial recognition if doing so eliminates or significantly reduces a measurement or recognition inconsistency that would arise from measuring assets or liabilities, or recognising the gains and losses on them, on different bases.
1 January 2018 1 July 2018
ISE
LE
CT
AN
NU
AL
RE
PO
RT
20
16
67
FiNANCiAL StAteMeNtS
NOTES TO THE FINANCIAL STATEMENTS CONTINUED

2. BASIS OF PREPARATION (CONTINUED)
(d) New Accounting Standards and interpretations (Continued)
New standards and interpretations issued not yet adopted (Continued)
REFERENCE TITLESUMMARY AND IMPACT ON GROUP FINANCIAL REPORT
APPLICATION DATE OF STANDARD
APPLICATION DATE FOR GROUP
AASB 9 (continued)
Financial Instruments (continued)
Changes introduced by AASB 9 in respect of financial liabilities are limited to the measurement of liabilities designated at fair value through profit or loss (FVPL) using the fair value option.
Where the fair value option is used for financial liabilities, the change in fair value is to be accounted for as follows:
a. The change attributable to changes in credit risk are presented in other comprehensive income (OCI)
b. The remaining change is presented in profit or loss
AASB 9 also removes the volatility in profit or loss that was caused by changes in the credit risk of liabilities elected to be measured at fair value. This change in accounting means that gains or losses attributable to changes in the entity’s own credit risk would be recognised in OCI. These amounts recognised in OCI are not recycled to profit or loss if the liability is ever repurchased at a discount.
The final version of AASB 9 introduces a new expected-loss impairment model that will require more timely recognition of expected credit losses. Specifically, the new Standard requires entities to account for expected credit losses from when financial instruments are first recognised and to recognise full lifetime expected losses on a more timely basis.
Amendments to AASB 9 (December 2009 & 2010 editions and AASB 2013-9) issued in December 2013 included the new hedge accounting requirements, including changes to hedge effectiveness testing, treatment of hedging costs, risk components that can be hedged and disclosures.
Consequential amendments were also made to other standards as a result of AASB 9, introduced by AASB 2009-11 and superseded by AASB 2010-7, AASB 2010-10 and AASB 2014-1 – Part E.
AASB 2014-7 incorporates the consequential amendments arising from the issuance of AASB 9 in Dec 2014.
AASB 2014-8 limits the application of the existing versions of AASB 9 (AASB 9 (December 2009) and AASB 9 (December 2010)) from 1 February 2015 and applies to annual reporting periods beginning on after 1 January 2015.
FiNANCiAL StAteMeNtSIS
EL
EC
T A
NN
UA
L R
EP
OR
T 2
016
68
NOTES TO THE FINANCIAL STATEMENTS CONTINUED

REFERENCE TITLESUMMARY AND IMPACT ON GROUP FINANCIAL REPORT
APPLICATION DATE OF STANDARD
APPLICATION DATE FOR GROUP
AASB 15 Revenue from Contracts with Customers
AASB 15 Revenue from Contracts with Customers replaces the existing revenue recognition standards AASB 111 Construction Contracts, AASB 118 Revenue and related Interpretations (Interpretation 13 Customer Loyalty Programmes, Interpretation 15 Agreements for the Construction of Real Estate, Interpretation 18 Transfers of Assets from Customers, Interpretation 131 Revenue—Barter Transactions Involving Advertising Services and Interpretation 1042 Subscriber Acquisition Costs in the Telecommunications Industry). AASB 15 incorporates the requirements of IFRS 15 Revenue from Contracts with Customers issued by the International Accounting Standards Board (IASB) and developed jointly with the US Financial Accounting Standards Board (FASB).
AASB 15 specifies the accounting treatment for revenue arising from contracts with customers (except for contracts within the scope of other accounting standards such as leases or financial instruments).The core principle of AASB 15 is that an entity recognises revenue to depict the transfer of promised goods or services to customers in an amount that reflects the consideration to which the entity expects to be entitled in exchange for those goods or services. An entity recognises revenue in accordance with that core principle by applying the following steps:
a. Step 1: Identify the contract(s) with a customer
b. Step 2: Identify the performance obligations in the contract
c. Step 3: Determine the transaction price
d. Step 4: Allocate the transaction price to the performance obligations in the contract
e. Step 5: Recognise revenue when (or as) the entity satisfies a performance obligation
AASB 2015-8 amended the AASB 15 effective date so it is now effective for annual reporting periods commencing on or after 1 January 2018. Early application is permitted.
AASB 2014-5 incorporates the consequential amendments to a number Australian Accounting Standards (including Interpretations) arising from the issuance of AASB 15.
AASB 2016-3 Amendments to Australian Accounting Standards – Clarifications to AASB 15 amends AASB 15 to clarify the requirements on identifying performance obligations, principal versus agent considerations and the timing of recognising revenue from granting a licence and provides further practical expedients on transition to AASB 15.
1 January 2018 1 July 2018
ISE
LE
CT
AN
NU
AL
RE
PO
RT
20
16
69
FiNANCiAL StAteMeNtS
NOTES TO THE FINANCIAL STATEMENTS CONTINUED
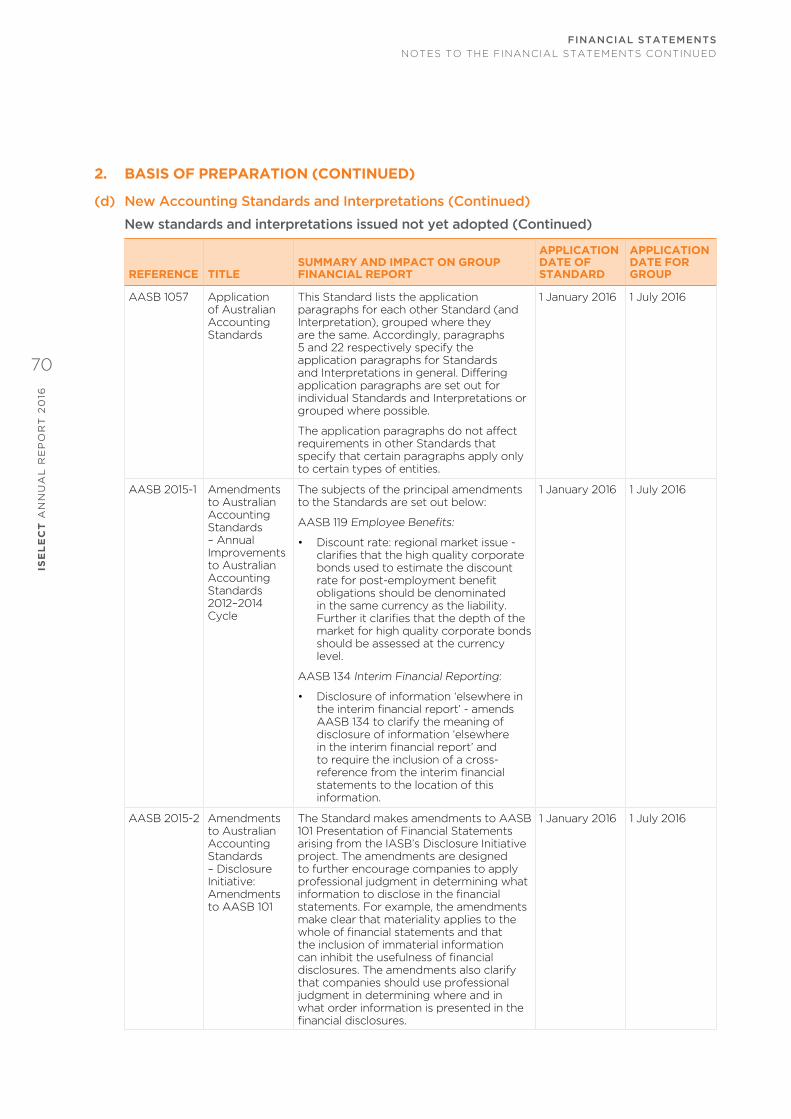
2. BASIS OF PREPARATION (CONTINUED)
(d) New Accounting Standards and interpretations (Continued)
New standards and interpretations issued not yet adopted (Continued)
REFERENCE TITLESUMMARY AND IMPACT ON GROUP FINANCIAL REPORT
APPLICATION DATE OF STANDARD
APPLICATION DATE FOR GROUP
AASB 1057 Application of Australian Accounting Standards
This Standard lists the application paragraphs for each other Standard (and Interpretation), grouped where they are the same. Accordingly, paragraphs 5 and 22 respectively specify the application paragraphs for Standards and Interpretations in general. Differing application paragraphs are set out for individual Standards and Interpretations or grouped where possible.
The application paragraphs do not affect requirements in other Standards that specify that certain paragraphs apply only to certain types of entities.
1 January 2016 1 July 2016
AASB 2015-1 Amendments to Australian Accounting Standards – Annual Improvements to Australian Accounting Standards 2012–2014 Cycle
The subjects of the principal amendments to the Standards are set out below:
AASB 119 Employee Benefits:
• Discount rate: regional market issue - clarifies that the high quality corporate bonds used to estimate the discount rate for post-employment benefit obligations should be denominated in the same currency as the liability. Further it clarifies that the depth of the market for high quality corporate bonds should be assessed at the currency level.
AASB 134 Interim Financial Reporting:
• Disclosure of information ‘elsewhere in the interim financial report’ - amends AASB 134 to clarify the meaning of disclosure of information ‘elsewhere in the interim financial report’ and to require the inclusion of a cross-reference from the interim financial statements to the location of this information.
1 January 2016 1 July 2016
AASB 2015-2 Amendments to Australian Accounting Standards – Disclosure Initiative: Amendments to AASB 101
The Standard makes amendments to AASB 101 Presentation of Financial Statements arising from the IASB’s Disclosure Initiative project. The amendments are designed to further encourage companies to apply professional judgment in determining what information to disclose in the financial statements. For example, the amendments make clear that materiality applies to the whole of financial statements and that the inclusion of immaterial information can inhibit the usefulness of financial disclosures. The amendments also clarify that companies should use professional judgment in determining where and in what order information is presented in the financial disclosures.
1 January 2016 1 July 2016
FiNANCiAL StAteMeNtSIS
EL
EC
T A
NN
UA
L R
EP
OR
T 2
016
70
NOTES TO THE FINANCIAL STATEMENTS CONTINUED

REFERENCE TITLESUMMARY AND IMPACT ON GROUP FINANCIAL REPORT
APPLICATION DATE OF STANDARD
APPLICATION DATE FOR GROUP
AASB 16 Leases The key features of AASB 16 are as follows:
Lessee accounting
• Lessees are required to recognise assets and liabilities for all leases with a term of more than 12 months, unless the underlying asset is of low value.
• A lessee measures right-of-use assets similarly to other non-financial assets and lease liabilities similarly to other financial liabilities.
• Assets and liabilities arising from a lease are initially measured on a present value basis. The measurement includes non-cancellable lease payments (including inflation-linked payments), and also includes payments to be made in optional periods if the lessee is reasonably certain to exercise an option to extend the lease, or not to exercise an option to terminate the lease.
• AASB 16 contains disclosure requirements for lessees.
Lessor accounting
• AASB 16 substantially carries forward the lessor accounting requirements in AASB 117. Accordingly, a lessor continues to classify its leases as operating leases or finance leases, and to account for those two types of leases differently.
• AASB 16 also requires enhanced disclosures to be provided by lessors that will improve information disclosed about a lessor’s risk exposure, particularly to residual value risk.
AASB 16 supersedes:
a. AASB 117 Leases
b. Interpretation 4 Determining whether an Arrangement contains a Lease
c. SIC-15 Operating Leases—Incentives
d. SIC-27 Evaluating the Substance of Transactions Involving the Legal Form of a Lease
The new standard will be effective for annual periods beginning on or after 1 January 2019. Early application is permitted, provided the new revenue standard, AASB 15 Revenue from Contracts with Customers, has been applied, or is applied at the same date as AASB 16.
1 January 2019 1 July 2019
ISE
LE
CT
AN
NU
AL
RE
PO
RT
20
16
71
FiNANCiAL StAteMeNtS
NOTES TO THE FINANCIAL STATEMENTS CONTINUED
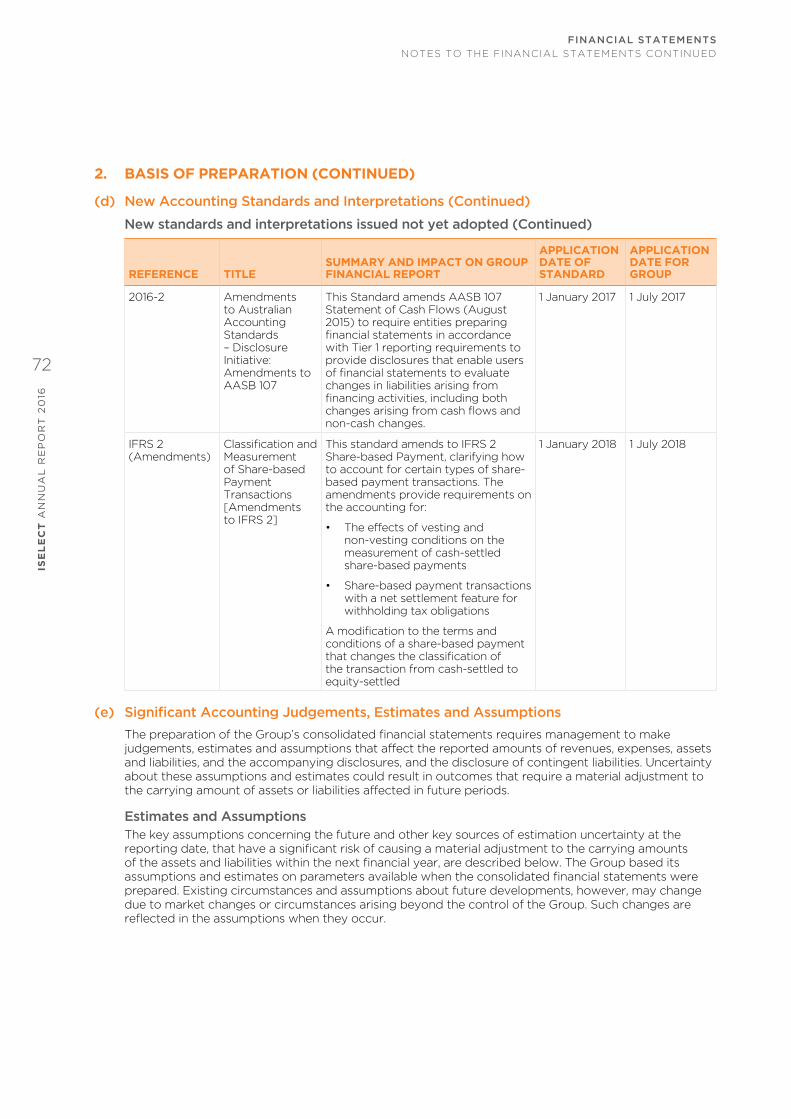
2. BASIS OF PREPARATION (CONTINUED)
(d) New Accounting Standards and interpretations (Continued)
New standards and interpretations issued not yet adopted (Continued)
REFERENCE TITLESUMMARY AND IMPACT ON GROUP FINANCIAL REPORT
APPLICATION DATE OF STANDARD
APPLICATION DATE FOR GROUP
2016-2 Amendments to Australian Accounting Standards – Disclosure Initiative: Amendments to AASB 107
This Standard amends AASB 107 Statement of Cash Flows (August 2015) to require entities preparing financial statements in accordance with Tier 1 reporting requirements to provide disclosures that enable users of financial statements to evaluate changes in liabilities arising from financing activities, including both changes arising from cash flows and non-cash changes.
1 January 2017 1 July 2017
IFRS 2 (Amendments)
Classification and Measurement of Share-based Payment Transactions [Amendments to IFRS 2]
This standard amends to IFRS 2 Share-based Payment, clarifying how to account for certain types of share-based payment transactions. The amendments provide requirements on the accounting for:
• The effects of vesting and non-vesting conditions on the measurement of cash-settled share-based payments
• Share-based payment transactions with a net settlement feature for withholding tax obligations
A modification to the terms and conditions of a share-based payment that changes the classification of the transaction from cash-settled to equity-settled
1 January 2018 1 July 2018
(e) Significant Accounting Judgements, Estimates and Assumptions
The preparation of the Group’s consolidated financial statements requires management to make judgements, estimates and assumptions that affect the reported amounts of revenues, expenses, assets and liabilities, and the accompanying disclosures, and the disclosure of contingent liabilities. Uncertainty about these assumptions and estimates could result in outcomes that require a material adjustment to the carrying amount of assets or liabilities affected in future periods.
estimates and AssumptionsThe key assumptions concerning the future and other key sources of estimation uncertainty at the reporting date, that have a significant risk of causing a material adjustment to the carrying amounts of the assets and liabilities within the next financial year, are described below. The Group based its assumptions and estimates on parameters available when the consolidated financial statements were prepared. Existing circumstances and assumptions about future developments, however, may change due to market changes or circumstances arising beyond the control of the Group. Such changes are reflected in the assumptions when they occur.
FiNANCiAL StAteMeNtSIS
EL
EC
T A
NN
UA
L R
EP
OR
T 2
016
72
NOTES TO THE FINANCIAL STATEMENTS CONTINUED
Revenue Recognition
Revenue is recognised at the point in time where the Group has essentially completed its contracted service with its product providers and it is probable that the Group will receive the revenue in relation to the underlying consumer. This point in time is where a consumer is referred to a product provider. As such, the Group determines a reliable measurement of its revenue on the basis of the probability of a ‘referred’ sale becoming a ‘financial’ or paid sale on the basis of extensive historical statistical and trend data. Revenue is recognised on a net basis of the historical percentage of ‘referred’ sales expected to become ‘financial’ and is adjusted to actual percentages experienced at each reporting date. Where this information cannot be reliably measured, the Group recognises revenue at the time the consumer makes its first payment to the product provider.
trail Commission Receivable
The Group has elected to account for trail commission revenue at the time of selling a product to which trail commission attaches, rather than on the basis of actual payments received from the relevant fund or providers involved. This method of revenue recognition requires the Directors and management to make certain estimates and assumptions based on industry data and the historical experience of the Group. In undertaking this responsibility, the Group engages Deloitte Actuaries and Consultants Limited, a firm of consulting actuaries, to assist in reviewing the accuracy of assumptions for health, mortgages and life trail revenue. These estimates and assumptions include, but are not limited to: termination or lapse rates, mortality rates, inflation, risk free and other discount rates, counter party credit risk, forecast fund premium increases and the estimated impact of known Australian Federal and State Government policy.
The Directors consider this method of trail commission recognition to be a more accurate representation of the Group’s financial results. This method is further detailed in Note 3(f).
Clawback provisions
Upfront fees received from certain insurance funds, broadband providers and mortgage brokers can be clawed back in the event of early termination of membership. They vary across the insurance industry and insurers and are usually triggered where a referred member terminates their policy. Each relevant Product Provider has an individual agreement
and the clawback period ranges between 0 and 12 months, depending on the agreement. The Group provides for this liability based upon historic average rates of attrition and recognises revenue net of these clawback amounts.
Provisions for Employee Benefits
Provisions are measured at the present value of management’s best estimate of the expenditure required to settle the present obligation at the reporting date using the discounted cash flow methodology. The risks specific to the provision are factored into the cash flows and as such a corporate bond rate relative to the expected life of the provision is used as a discount rate. If the effect of the time value of money is material, provisions are discounted using a current pre-tax rate that reflects the time value of money and the risks specific to the liability. The increase in the provision resulting from the passage of time is recognised as interest expense.
Research and Development Costs
Internal project costs are classified as research or development based on management’s assessment of the nature of each cost and the underlying activities performed. Management performs this assessment against the Group’s development costs policy which is consistent with the requirements of AASB 138 Intangible Assets.
taxation
The Group’s accounting policy for taxation requires management’s judgement as to the types of arrangements considered to be a tax on income in contrast to an operating cost. Judgement is also required in assessing whether deferred tax assets and certain deferred tax liabilities are recognised on the consolidated statement of financial position. Deferred tax assets, including those arising from unrecouped tax losses, capital losses and temporary differences, are recognised only where it is considered more likely than not that they will be recovered, which is dependent on the generation of sufficient future taxable profits. Assumptions about the generation of future taxable profits depend on management’s estimates of future cash flows. These depend on estimates of future sales volumes, operating costs, capital expenditure, dividends and other capital management transactions.
ISE
LE
CT
AN
NU
AL
RE
PO
RT
20
16
73
FiNANCiAL StAteMeNtS
NOTES TO THE FINANCIAL STATEMENTS CONTINUED
2. BASIS OF PREPARATION (CONTINUED)
estimates and Assumptions (continued)
taxation (continued)
Judgements are also required about the application of income tax legislation in respect of the availability of carry forward tax losses. These judgements and assumptions are subject to risk and uncertainty, hence there is a possibility that changes in circumstances will alter expectations, which may impact the amount of deferred tax assets and deferred tax liabilities recognised on the consolidated statement of financial position and the amount of other tax losses and temporary differences not yet recognised. In such circumstances, some or all of the carrying amounts of recognised deferred tax assets and liabilities may require adjustment, resulting in a corresponding credit or charge to the consolidated statement of profit or loss and other comprehensive income in future periods.
Share-Based payments
Accounting estimates and assumptions in relation to share-based payments are discussed in Note 31.
Initial Recognition of Identifiable Assets and Liabilities upon Acquisition.
On 1 July 2014, the Group obtained control of General Brokerage Services Pty Ltd and its controlled entities (Energy Watch), an online comparison company dealing in energy products. Accounting estimates and assumptions in relation to the initial recognition of the identifiable assets and liabilities at fair value are discussed in detail in Note 5.
Determination of Value-in-use of Goodwill, Brand Names and trademarks
As part of the Group’s annual impairment testing for indefinite life intangible assets, accounting estimates and assumptions have been applied in determining the value-in-use of cash-generating units where such intangible assets have been allocated. Further information of these estimates and assumptions are discussed in detail in Note 13.
3. SIGNIFICANT ACCOUNTING POLICIES
(a) Basis of ConsolidationThe consolidated financial statements comprise the financial statements of the Group and its subsidiaries as at 30 June 2016. Control is achieved when the Group is exposed, or has rights, to variable returns from its involvement with the investee and has the ability to affect those returns through its power over the investee. Specifically, the Group controls an investee if and only if the Group has the power over the investee (i.e. existing rights that give it the current ability to direct the relevant activities of the investee), the exposure, or rights, to variable returns from its involvement with the investee, and has the ability to use its power over the investee to affect its returns.
When the Group has less than a majority of the voting or similar rights of an investee, the Group considers all relevant facts and circumstances in assessing whether it has power over an investee, including the contractual arrangement with the other vote holders of the investee, rights arising from other contractual arrangements and the Group’s voting rights and potential voting rights.
The Group re-assesses whether or not it controls an investee if facts and circumstances indicate that there are changes to one or more of the three elements of control. Consolidation of a subsidiary begins when the Group obtains control over the subsidiary and ceases when the Group loses control of the subsidiary. Assets, liabilities, income and expenses of a subsidiary acquired or disposed of during the year are included in the consolidated statement of profit or loss and other comprehensive income from the date the Group gains control until the date the Group ceases to control the subsidiary.
Profit or loss and each component of other comprehensive income (OCI) are attributed to the equity holders of the parent of the Group and to the non-controlling interests, even if this results in the non-controlling interests having a deficit balance. When necessary, adjustments are made to the financial statements of subsidiaries to bring their accounting policies into line with the Group’s accounting policies. All intra-group assets, liabilities, equity, income, expenses and cash flows relating to transactions between members of the Group are eliminated in full on consolidation.
A change in the ownership interest of a subsidiary, without a loss of control, is accounted for as an equity transaction. If the Group loses control over a subsidiary, it de-recognises the assets (including goodwill) and
FiNANCiAL StAteMeNtSIS
EL
EC
T A
NN
UA
L R
EP
OR
T 2
016
74
NOTES TO THE FINANCIAL STATEMENTS CONTINUED

liabilities of the subsidiary, non-controlling interest and other components of equity while any resultant gain or loss is recognised in profit or loss. Any investment retained is recognised at fair value.
(b) Business Combinations and GoodwillBusiness combinations are accounted for using the acquisition method. The cost of an acquisition is measured as the aggregate of the consideration transferred measured at acquisition date fair value and the amount of any non-controlling interest in the acquiree. For each business combination, the Group elects whether to measure the non-controlling interests in the acquiree at fair value or at the proportionate share of the acquiree’s identifiable net assets. Acquisition-related costs are expensed as incurred and included in administrative expenses.
When the Group acquires a business, it assesses the financial assets and liabilities assumed for appropriate classification and designation in accordance with the contractual terms, economic circumstances and pertinent conditions as at the acquisition date. This includes the separation of embedded derivatives in host contracts by the acquiree.
If the business combination is achieved in stages, any previously held equity interest is remeasured at its acquisition date fair value and any resulting gain or loss is recognised in profit or loss.
Any contingent consideration to be transferred by the acquirer will be recognised at fair value at the acquisition date. Contingent consideration classified as an asset or liability that is a financial instrument and within the scope of AASB 139 Financial Instruments: Recognition and Measurement, is measured at fair value and changes in fair value recognised either in profit or loss or as a change to OCI. If the contingent consideration is not within the scope of AASB 139, it is measured in accordance with the appropriate Australian Accounting Standard. Contingent consideration that is classified as equity is not remeasured and subsequent settlement is accounted for within equity.
Goodwill is initially measured at cost, being the excess of the aggregate of the consideration transferred and the amount recognised for non-controlling interests, and any previous interest held, over the net identifiable assets acquired and liabilities assumed. If the fair value of the net assets acquired is in excess of the aggregate consideration transferred, the Group re-assesses whether it has correctly identified all of the assets acquired and all of the liabilities assumed and reviews the procedures used to
measure the amounts to be recognised at the acquisition date. If the reassessment still results in an excess of the fair value of net assets acquired over the aggregate consideration transferred, then the gain is recognised in profit or loss.
After initial recognition, goodwill is measured at cost less any accumulated impairment losses. For the purpose of impairment testing, goodwill acquired in a business combination is, from the acquisition date, allocated to each of the Group’s cash-generating units that are expected to benefit from the combination, irrespective of whether other assets or liabilities of the acquiree are assigned to those units.
Where goodwill has been allocated to a cash-generating unit and part of the operation within that unit is disposed of, the goodwill associated with the disposed operation is included in the carrying amount of the operation when determining the gain or loss on disposal. Goodwill disposed in these circumstances is measured based on the relative values of the disposed operation and the portion of the cash-generating unit retained.
Business Combination ReserveThe internal Group restructure performed in the 2007 financial year, which interposed the holding Company, iSelect Limited, into the consolidated Group was exempted by AASB 3 Business Combinations as it precludes entities or businesses under common control.
The carry-over basis method of accounting was used for the restructuring of the iSelect Group. As such, the assets and liabilities were reflected at their carrying amounts. No adjustments were made to reflect fair values, or recognise any new assets or liabilities. No goodwill was recognised as a result of the combination and any difference between the consideration paid and the ‘equity’ acquired was reflected within equity as an equity reserve titled “Business Combination Reserve”.
(c) Investment in Associates and Joint VenturesAn associate is an entity over which the Group has significant influence. Significant influence is the power to participate in the financial and operating policy decisions of the investee, but is not control or joint control over those policies.
A joint venture is a type of joint arrangement whereby the parties that have joint control of the arrangement have rights to the net assets of the joint venture. Joint control is the contractually agreed sharing of control of an arrangement, which exists only when decisions about the relevant activities require unanimous consent of the parties sharing control.
ISE
LE
CT
AN
NU
AL
RE
PO
RT
20
16
75
FiNANCiAL StAteMeNtS
NOTES TO THE FINANCIAL STATEMENTS CONTINUED

3. SIGNIFICANT ACCOUNTING POLICIES (CONTINUED)
(c) Investment in Associates and Joint Ventures (continued)The considerations made in determining significant influence or joint control are similar to those necessary to determine control over subsidiaries.
The Group’s investments in its associate is accounted for using the equity method. The Group does not hold an investment in joint ventures.
Under the equity method, the investment in an associate is initially recognised at cost. The carrying amount of the investment is adjusted to recognise changes in the Group’s share of net assets of the associate or joint venture since the acquisition date. Goodwill relating to the associate is included in the carrying amount of the investment and is neither amortised nor individually tested for impairment.
The consolidated statement of profit or loss and other comprehensive income reflects the Group’s share of the results of operations of the associate. Any change in OCI of those investees is presented as part of the Group’s OCI. In addition, when there has been a change recognised directly in the equity of the associate, the Group recognises its share of any changes, when applicable, in the statement of changes in equity. Unrealised gains and losses resulting from transactions between the Group and the associate are eliminated to the extent of the interest in the associate.
The financial statements of the associate is prepared for the same reporting period as the Group. When necessary, adjustments are made to bring the accounting policies in line with those of the Group.
After application of the equity method, the Group determines whether it is necessary to recognise an impairment loss on its investment in its associate. At each reporting date, the Group determines whether there is objective evidence that the investment in the associate or joint venture is impaired. If there is such evidence, the Group calculates the amount of impairment as the difference between the recoverable amount of the associate and its carrying value, then recognises the loss as ‘Share of profit or loss of an associate, net of tax’ in the consolidated statement of profit or loss and other comprehensive income.
Upon loss of significant influence over the associate, the Group measures and recognises any retained investment at its fair value. Any difference between the recoverable amount of the associate upon loss of significant influence and the fair value of the retained investment and proceeds from disposal is recognised in profit or loss.
(d) Current versus Non-Current ClassificationThe Group presents assets and liabilities in the statement of financial position based on current/non-current classification.
An asset is current when it is expected to be realised or intended to be sold or consumed in the Group’s normal operating cycle, held primarily for the purpose of trading, expected to be realised within twelve months after the reporting date or cash or cash equivalent unless restricted from being exchanged or used to settle a liability for at least twelve months after the reporting period. The Group classifies all other assets as non-current.
A liability is current when it is expected to be settled in the Group’s normal operating cycle, it is held primarily for the purpose of trading, it is due to be settled within twelve months after the reporting period or there is no unconditional right to defer the settlement of the liability for at least twelve months after the reporting period. The Group classifies all other liabilities as non-current.
Deferred tax assets and liabilities are classified as non-current assets and liabilities.
(e) Foreign Currency translationThe Group’s consolidated financial statements are presented in Australian dollars, which is also the Parent’s functional currency. For each entity, the Group determines the functional currency and items included in the financial statements of each entity are measured using that functional currency. The Group uses the direct method of consolidation and on disposal of a foreign operation, the gain or loss that is reclassified to profit or loss reflects the amount that arises from using this method.
transactions and BalancesTransactions in foreign currencies are initially recorded by the Group’s entities at their respective functional currency spot rates at the date the transaction first qualifies for recognition.
Monetary assets and liabilities denominated in foreign currencies are translated at the functional currency spot rates of exchange at the reporting date.
Differences arising on settlement or translation of monetary items are recognised in profit or loss with the exception of monetary items that are designated as part of the hedge of the Group’s net investment of a foreign operation. These are recognised in other comprehensive income until the net investment is disposed of, at which time, the cumulative amount is
FiNANCiAL StAteMeNtSIS
EL
EC
T A
NN
UA
L R
EP
OR
T 2
016
76
NOTES TO THE FINANCIAL STATEMENTS CONTINUED
reclassified to profit or loss. Tax charges and credits attributable to exchange differences on those monetary items are also recorded in other comprehensive income.
Non-monetary items that are measured in terms of historical cost in a foreign currency are translated using the exchange rates at the dates of the initial transactions. Non-monetary items measured at fair value in a foreign currency are translated using the exchange rates at the date when the fair value is determined. The gain or loss arising on translation of non-monetary items measured at fair value is treated in line with the recognition of gain or loss on change in fair value of the item (i.e. translation differences on items whose fair value gain or loss is recognised in other comprehensive income or profit or loss are also recognised in other comprehensive income or profit or loss, respectively).
Group CompaniesOn consolidation, the assets and liabilities of foreign operations are translated into Australian dollars at the rate of exchange prevailing at the reporting date and their statements of profit or loss are translated at exchange rates prevailing at the dates of the transactions. The exchange differences arising on translation for consolidation purposes are recognised in other comprehensive income. On disposal of a foreign operation, the component of other comprehensive income relating to that particular foreign operation is recognised in profit or loss.
Any goodwill arising on the acquisition of a foreign operation and any fair value adjustments to the carrying amounts of assets and liabilities arising on the acquisition are treated as assets and liabilities of the foreign operation and translated at the spot rate of
exchange at the reporting date.
(f) Revenue RecognitionRevenue is recognised to the extent that it is probable that the economic benefits will flow to the Group and can be reliably measured.
Fee Revenue The Group primarily earns two distinct types of fee based revenue: upfront fees and trail commission.
(i) upfront fees
Upfront fees (net of applicable rebates, if any) are earned upon new members joining a health fund, initiating a life insurance policy, obtaining general insurance products, mortgages, broadband or energy products via iSelect. Upfront fees may trigger a ‘clawback’ of revenue in the event of early termination by customers as specified in individual product provider agreements. These clawbacks are provided for by the Group on a monthly basis by utilising industry data and historical experience.
(ii) trail commission revenue
Trail commissions are ongoing fees for customers referred to individual providers or who have applied for mortgages via iSelect. Trail commission revenue represents commission earned calculated as a percentage of the value of the underlying policy relationship to the expected life and in the case of mortgages a proportion of the underlying value of the loan. The Group is entitled to receive trail commission without having to perform further services. On initial recognition, trail revenue and receivables are recognised at fair value, being the expected future trail cash receipts discounted to their present value using discounted cash flow valuation techniques. These calculations require the use of assumptions. Due to the differences in underlying product characteristics and product provider circumstances, the discount rates applied in the most recent valuation of the trail commission receivable range between 4.0% and 7.0% (2015: 3.2% and 7.8%) across financial institutions and health, life, car insurers and mortgage providers. The Group specifically provides for known or expected risks to future cash flows outside of the discount rate, particularly for the impact of attrition. Attrition rates in Health are particularly relevant to the overall trail commission receivable considering the relative size of the Health trail commission receivable. Attrition rates vary substantially by provider and also by the duration of time the policy has been in force, with rates generally higher in policies under two years old.
The attrition rates used in the valuation of the Health portfolio at 30 June 2016 ranged from 6.5% to 23.2% (2015: 6.5% to 21.0%). The simple average duration band attrition increase was up to 2.1% during the period, with higher increases experienced for policies that have been in force for shorter periods of time.
ISE
LE
CT
AN
NU
AL
RE
PO
RT
20
16
77
FiNANCiAL StAteMeNtS
NOTES TO THE FINANCIAL STATEMENTS CONTINUED

3. SIGNIFICANT ACCOUNTING POLICIES (CONTINUED)
(f) Revenue Recognition (continued)
(ii) trail commission revenue (continued)
The key assumptions underlying the fair value calculations of trail revenue receivable at reporting date include, but are not limited to: lapse and mortality rates, commission term, premium increases and discount rate, incorporating risk free rates and estimates of the likely credit risk associated with the funds and credit providers.
It is the Directors’ responsibility to determine the assumptions used and the fair value of trail revenue. In undertaking this responsibility, the Group engages Deloitte Actuaries and Consultants Limited, a firm of consulting actuaries, to assist in reviewing the accuracy of assumptions and the fair value model utilised to determine the fair value of health, life and mortgages fund trail revenue and the accompanying asset. The trail commission is a Directors’ valuation and is based on the same principles as outlined above. Subsequent to initial recognition and measurement, the trail revenue asset is measured at amortised cost. The carrying amount of the trail revenue asset is adjusted to reflect actual and revised estimated cash flows by recalculating the carrying amount through computing the present value of estimated future cash flows at the original effective interest rate. The resulting adjustment is recognised as income or expense in the consolidated statement of profit or loss and other comprehensive income.
Click-through FeeClick-through fee is recognised based on the contractual arrangement with the relevant product provider. This can occur at one of three points, either when an internet user clicks on a paying advertiser’s link, submits an application, or a submitted application is approved.
Advertising and Subscription FeeRevenue for contracted services, including advertising and subscription fee, is recognised systematically over the term of the contract. Revenue for services provided other than pursuant to a defined period contract is recognised during the month services are provided.
(g) LeasesThe determination of whether an arrangement is, or contains, a lease is based on the substance of the arrangement at the inception of the lease. The arrangement is, or contains, a lease if fulfilment of the arrangement is dependent on the use of a specific asset or assets or the arrangement conveys a right to use the asset or assets, even if that right is not explicitly specified in an arrangement.
Group as a LesseeA lease is classified at the inception date as a finance lease or an operating lease. A lease that transfers substantially all the risks and rewards incidental to ownership to the Group is classified as a finance lease. An operating lease is a lease other than a finance lease.
Finance leases are capitalised at the commencement of the lease at the inception date fair value of the leased property or, if lower, at the present value of the minimum lease payments. Leases payments are apportioned between finance charges and reduction of the lease liability so as to achieve a constant rate of interest on the remaining balance of the liability. Finance charges are recognised in finance costs in the consolidated statement of profit or loss and other comprehensive income.
A leased asset is depreciated over the useful life of the asset. However, if there is no reasonable certainty that the Group will obtain ownership by the end of the lease term, the asset is depreciated over the shorter of the estimated useful life of the asset and the lease term.
Group as a LessorLeases in which the Group does not transfer substantially all the risks and benefits of ownership of an asset are classified as operating leases. Initial direct costs incurred in negotiating an operating lease are added to the carrying amount of the leased asset and recognised over the lease term on the same basis as rental income. Contingent rents are recognised as revenue in the period in which they are earned.
(h) Cash and Short term DepositsCash and short-term deposits in the consolidated statement of financial position comprise cash at bank and on hand and short-term deposits with an original maturity of three months or less, which are subject to an insignificant risk of changes in value.
For the purposes of the consolidated statement of cash flows, cash and cash equivalents consist of cash and short-term deposits, as defined above, net of outstanding bank overdrafts as they are considered an integral part of the Group’s cash management.
(i) trade and other ReceivablesAll trade and other receivables recognised as current assets are due for settlement within no more than 30 days for marketing fees and within one year for trail commission. Trade receivables are measured on the basis of amortised cost and trail commission is initially measured at fair value and subsequently at amortised cost.
FiNANCiAL StAteMeNtSIS
EL
EC
T A
NN
UA
L R
EP
OR
T 2
016
78
NOTES TO THE FINANCIAL STATEMENTS CONTINUED
Recoverability of trade and other receivables is reviewed on an ongoing basis. Debts which are known to be uncollectible are written off. A provision for doubtful debts is raised where some doubt as to collection exists.
(j) taxes
Current income taxCurrent income tax assets and liabilities are measured at the amount expected to be recovered from or paid to the taxation authorities. The tax rates and tax laws used to compute the amount are those that are enacted or substantively enacted at the reporting date in the countries where the Group operates and generates taxable income.
Current income tax relating to items recognised directly in equity is recognised in equity and not in the consolidated statement of profit or loss and other comprehensive income. Management periodically evaluates positions taken in the tax returns with respect to situations in which applicable tax regulations are subject to interpretation and establishes provisions where
appropriate.
Deferred taxDeferred tax is provided using the liability method on temporary differences between the tax bases of assets and liabilities and their carrying amounts for financial reporting purposes at the reporting date.
Deferred tax liabilities are recognised for all taxable temporary differences except:
• When the deferred income tax liability arises from the initial recognition of goodwill or of an asset or liability in a transaction that is not a business combination and that, at the time of the transaction, affects neither the accounting nor taxable profit or loss.
• In respect of taxable temporary differences associated with investments in subsidiaries, associates and interests in joint arrangements, when the timing of the reversal of the temporary differences can be controlled and it is probable that the temporary differences will not reverse in the foreseeable future.
Deferred tax assets are recognised for all deductible temporary differences, the carry forward of unused tax credits and any unused tax losses. Deferred tax assets are recognised to the extent that it is probable that taxable profit will be available against which the deductible temporary differences, and the carry forward of unused tax credits and unused tax losses can be utilised, except:
• When the deferred tax asset relating to the deductible temporary difference arises from the initial recognition of an asset or liability in a transaction that is not a business combination and, at the time of the transaction, affects neither the accounting profit nor taxable profit or loss.
• In respect of deductible temporary differences associated with investments in subsidiaries, associates and interests in joint arrangements, deferred tax assets are recognised only to the extent that it is probable that the temporary differences will reverse in the foreseeable future and taxable profit will be available against which the
temporary differences can be utilised.
The carrying amount of deferred tax assets is reviewed at each reporting date and reduced to the extent that it is no longer probable that sufficient taxable profit will be available to allow all or part of the deferred tax asset to be utilised. Unrecognised deferred assets are re-assessed at each reporting date and are recognised to the extent that it has become probable that future taxable profits will allow the deferred tax asset to be recovered.
Deferred tax assets and liabilities are measured at the tax rates that are expected to apply in the year when the asset is realised or the liability is settled, based on tax rates (and tax laws) that have been enacted or substantively enacted at the reporting date.
Deferred tax relating to items recognised outside profit or loss is recognised outside profit or loss. Deferred tax items are recognised in correlation to the underlying transaction either in other comprehensive income or directly in equity.
Deferred tax assets and deferred tax liabilities are offset if a legally enforceable right exists to set off current tax assets against current tax liabilities and the deferred taxes relate to the same taxable entity and the same taxation authority.
Tax benefits acquired as part of a business combination, but not satisfying the criteria for separate recognition at that date, are recognised subsequently if new information about facts and circumstances change. The adjustment is either treated as a reduction in goodwill (as long as it does not exceed goodwill) if it was incurred during the measurement period or recognised in profit or loss.
ISE
LE
CT
AN
NU
AL
RE
PO
RT
20
16
79
FiNANCiAL StAteMeNtS
NOTES TO THE FINANCIAL STATEMENTS CONTINUED

3. SIGNIFICANT ACCOUNTING POLICIES (CONTINUED)
(j) taxes (continued)
tax Consolidation LegislationiSelect Limited and its wholly-owned Australian controlled entities have implemented the tax consolidation legislation. Members of the tax consolidated group have entered into a tax funding agreement. Each entity is responsible for remitting its share of the current tax payable/receivable assumed by the head entity.
In accordance with Group accounting policy, the Group has applied UIG 1052, in which the head entity, iSelect Limited, and the controlled entities in the tax consolidated Group continue to account for their own current and deferred tax amounts.
In addition to its own current and deferred tax amounts, iSelect Limited also recognises the current tax liabilities (or assets) and the deferred tax assets arising from unused tax losses and unused tax credits assumed from controlled entities in the tax consolidated Group.
The allocation of taxes to the head entity is recognised as an increase/decrease in the controlled entities intercompany accounts with the tax consolidated Group head entity.
Goods and Services tax (GSt)Revenues, expenses and assets are recognised net of the amount of GST, except:
• When the GST incurred on a sale or purchase of assets or services is not payable to or recoverable from the taxation authority, in which case the GST is recognised as part of the revenue or the expense item or as part of the cost of acquisition of the asset, as applicable.
• When receivables and payables are stated with the amount of GST included.
The net amount of GST recovered from, or payable to, the taxation authority is included as part of receivables or payables in the consolidated statement of financial position. Commitments and contingencies are disclosed net of the amount of GST recoverable from, or payable to, the taxation authority.
Cash flows are included in the consolidated statement of cash flows on a gross basis and the GST component of cash flows arising from investing and financing activities, which is from, or payable to, the taxation authority is classified as part of operating cash flows.
(k) property, plant and equipmentPlant and equipment is stated at cost less accumulated depreciation and accumulated impairment loss, if any. When significant parts of plant and equipment are required to be replaced at intervals, the Group depreciates them separately based on their specific useful lives. Likewise, when a major inspection is performed, its cost is recognised in the carrying amount of the plant and equipment as a replacement if the recognition criteria are satisfied. All other repair and maintenance costs are recognised in profit or loss as incurred.
Depreciation is calculated over the estimated useful life of the asset as follows:
USEFUL LIFE METHOD
Computer software/equipment
2 to 5 years Straight-line method
Furniture, fixtures and fittings
8 years Straight-line method
Leasehold improvements
8 to 10 years Straight-line method
Motor vehicles 3 years Straight-line method
An item of property, plant and equipment and any significant part initially recognised is derecognised upon disposal or when no future economic benefits are expected from its use or disposal. Any gain or loss arising on derecognition of the asset (calculated as the difference between the net disposal proceeds and the carrying amount of the asset) is included in profit or loss when the asset is derecognised.
The residual values, useful lives and methods of depreciation of property, plant and equipment are reviewed at each financial year end and adjusted prospectively, if appropriate.
(l) intangible AssetsIntangible assets acquired separately are measured on initial recognition at cost. The cost of intangible assets acquired in a business combination is measured at fair value as at the date of acquisition. Following initial recognition, intangible assets are carried at cost less any accumulated amortisation and any accumulated impairment losses. Internally generated intangible assets, excluding capitalised development costs, are not capitalised and expenditure is recognised in profit or loss in the year in which the expenditure is incurred.
FiNANCiAL StAteMeNtSIS
EL
EC
T A
NN
UA
L R
EP
OR
T 2
016
80
NOTES TO THE FINANCIAL STATEMENTS CONTINUED

The useful lives of intangible assets are assessed to be either finite or infinite. Intangible assets with finite lives are amortised over the useful life and tested for impairment whenever there is an indication that the intangible asset may be impaired. The amortisation period and the amortisation method for an intangible asset with a finite useful life are reviewed at least at the end of each reporting period. Changes in the expected useful life or the expected pattern of consumption of future economic benefits embodied in the asset are considered to modify the amortisation period or method, as appropriate, and are treated as changes in accounting estimates and adjusted on a prospective basis. The amortisation expense on intangible assets with finite lives is recognised in the profit or loss as the expense category that is consistent with the function of the intangible
assets.
Amortisation is calculated over the estimated useful life of the asset as follows:
USEFUL LIFE
Development costs (including website development)
2 to 5 years
Trademarks and domain names Indefinite
Computer software 2 to 4 years
Brand names Indefinite
Goodwill Indefinite
Intangible assets with indefinite useful lives are tested for impairment annually either individually or at the cash-generating unit level. Such intangibles are not amortised. The useful life of an intangible asset with an indefinite life is reviewed at each reporting period to determine whether indefinite life assessment continues to be supportable. If not, the change in the useful life assessment from indefinite to finite is accounted for as a change in an accounting estimate and is made on a prospective basis.
Gains and losses arising from the derecognition of an intangible asset are measured as the difference between the net disposal proceeds and the carrying amount of the asset and are recognised in profit or loss when the asset is derecognised.
Research and Development costsResearch costs are expensed as incurred. An intangible asset arising from development expenditure on an internal project is recognised only when the Group can demonstrate the technical feasibility of completing the intangible
asset so that it will be available for use or sale, its intention to complete, its ability to use or sell the asset, how the asset will generate future economic benefits, the availability of resources to complete the asset, the ability to measure reliably the expenditure during development and the ability to use the intangible asset generated. Following the initial recognition of the development expenditure as an asset, the asset is carried at cost less any accumulated amortisation and accumulated impairment losses. Amortisation of the asset begins when development is complete and the asset is available for use. It is amortised over the period of expected future benefit. During the period of development, the asset is tested for impairment annually. Website development costs capitalised as an intangible asset are amortised on a straight line basis with a useful life as previously detailed.
trademarks and Domain NamesThe Group made upfront payments to purchase trademarks and domain names and can be renewed at little or no cost to the Group. As a result, those trademarks and domain names are assessed as having an indefinite useful life.
GoodwillGoodwill that arises upon the acquisition of subsidiaries is included in intangible assets. For the measurement of goodwill at initial recognition, see Note 3(b). Subsequently goodwill is measured at cost, and is tested for impairment annually. For the purpose of impairment testing, goodwill acquired in a business combination is, from the acquisition date, allocated to each of the Group’s cash-generating units that are expected to benefit from the combination, irrespective of whether other assets or liabilities of the acquiree are assigned to those units.
Where goodwill forms part of a cash-generating unit and part of the operation within that unit is disposed of, the goodwill associated with the operation disposed of is included in the carrying amount of the operation when determining the gain or loss on disposal of the operation. Goodwill disposed of in this circumstance is measured based on the relative values of the operation disposed of and the portion of the cash-generating unit retained.
(m) investments Investments in controlled entities are carried at the lower of cost or recoverable amount.
ISE
LE
CT
AN
NU
AL
RE
PO
RT
20
16
81
FiNANCiAL StAteMeNtS
NOTES TO THE FINANCIAL STATEMENTS CONTINUED

3. SIGNIFICANT ACCOUNTING POLICIES (CONTINUED)
(n) Loans and borrowingsLoans and borrowings are recognised initially at fair value plus directly attributable transaction costs. After initial recognition, interest bearing loans and borrowings are subsequently measured at amortised cost using the effective interest rate method. Gains and losses are recognised in the statement of profit or loss and other comprehensive income when the liabilities are derecognised as well as through the effective interest rate method amortisation process.
Amortised cost is calculated by taking into account any discount or premium on acquisition and fees or costs that are an integral part of the effective interest rate method. The effective interest rate method amortisation is included in finance costs in the statement of profit or loss and other comprehensive income.
(o) Financial instruments – initial Recognition and Subsequent MeasurementA financial instrument is any contract that gives rise to a financial asset of one entity and a financial liability or equity instrument of another entity.
i. Financial Assets
initial Recognition and Measurement
Financial assets are classified, at initial recognition, as loans and receivables (including trail commission receivable) or held-to-maturity investments. All financial assets are recognised initially at fair value plus, in the case of financial assets not subsequently measured at fair value through profit or loss, transaction costs that are attributable to the acquisition of the financial asset.
Subsequent Measurement
For the purposes of subsequent measurement, financial assets are classified into two categories: Loans and receivables (including trail commission receivable) and held-to-maturity investments.
Loans and Receivables (Including Trail Commission Receivable)
This category is the most relevant to the Group. Loans and receivables are non-derivative financial assets with fixed or determinable payments that are not quoted in an active market. After initial measurement, such financial assets are subsequently measured at amortised cost using the effective interest rate (EIR) method, less impairment. Amortised cost is calculated by taking into account any discount or premium on acquisition and fees or costs that are an integral part of the EIR. The EIR amortisation is included in finance income in the consolidated statement of profit or loss and other comprehensive income. The losses arising from impairment are recognised in the consolidated statement of profit or loss and other comprehensive income in finance costs for loans and in cost of sales or other operating expenses for receivables. This category generally applies to trade and other receivables. For more information on receivables, refer to notes 9 and 10.
Held-To-Maturity Investments
Non-derivative financial assets with fixed or determinable payments and fixed maturities are classified as held-to-maturity when the Group has the positive intention and ability to hold them to maturity. After initial measurement, held-to-maturity investments are measured at amortised cost using the EIR, less impairment. Amortised cost is calculated by taking into account any discount or premium on acquisition and fees or costs that are an integral part of the EIR. The EIR amortisation is included as finance income in the consolidated statement of profit or loss and other comprehensive income. The losses arising from impairment are recognised in the consolidated statement of profit or loss and other comprehensive income as finance costs.
Derecognition
A financial asset (or, where applicable, a part of a financial asset or part of a group of similar financial assets) is primarily derecognised (i.e. removed from the Group’s consolidated statement of financial position) when the rights to receive cash flows from the asset have expired or the Group has transferred its rights to receive cash flows from the asset or has assumed an obligation to pay the received cash flows in full without material delay to a third party under a ‘pass-through’ arrangement; and either (a) the Group has transferred
FiNANCiAL StAteMeNtSIS
EL
EC
T A
NN
UA
L R
EP
OR
T 2
016
82
NOTES TO THE FINANCIAL STATEMENTS CONTINUED
substantially all the risks and rewards of the asset, or (b) the Group has neither transferred nor retained substantially all the risks and rewards of the asset, but has transferred control of the asset.
When the Group has transferred its rights to receive cash flows from an asset or has entered into a pass-through arrangement, it evaluates if and to what extent it has retained the risks and rewards of ownership. When it has neither transferred nor retained substantially all of the risks and rewards of the asset, nor transferred control of the asset, the Group continues to recognise the transferred asset to the extent of the Group’s continuing involvement. In that case, the Group also recognises an associated liability. The transferred asset and the associated liability are measured on a basis that reflects the rights and obligations that the
Group has retained.
Continuing involvement that takes the form of a guarantee over the transferred asset is measured at the lower of the original carrying amount of the asset and the maximum amount of consideration that the Group could be required to repay.
impairment of Financial Assets
The Group assesses, at each reporting date, whether there is objective evidence that a financial asset or a group of financial assets is impaired. An impairment exists if one or more events that has occurred since the initial recognition of the asset (an incurred ‘loss event’) has an impact on the estimated future cash flows of the financial asset or the group of financial assets that can be reliably estimated. Evidence of impairment may include indications that the debtor or a group of debtors is experiencing significant financial difficulty, default or delinquency in interest or principal payments, the probability that they will enter bankruptcy or other financial reorganisation and observable data indicating that there is a measurable decrease in the estimated future cash flows, such as changes in arrears or economic conditions that correlate with defaults.
The amount of any impairment loss identified is measured as the difference between the asset’s carrying amount and the present value of estimated future cash flows (excluding future expected credit losses that have not yet been incurred). The present value of the estimated future cash flows is discounted at the financial asset’s original EIR.
Financial Assets Carried at Amortised Cost
For financial assets carried at amortised cost, the Group first assesses whether impairment exists individually for financial assets that are individually significant, or collectively for financial assets that are not individually significant. If the Group determines that no objective evidence of impairment exists for an individually assessed financial asset, whether significant or not, it includes the asset in a group of financial assets with similar credit risk characteristics and collectively assesses them for impairment. Assets that are individually assessed for impairment and for which an impairment loss is, or continues to be, recognised are not included in a collective assessment of impairment.
The carrying amount of the asset is reduced through the use of an allowance account and the loss is recognised in profit or loss. Interest income (recorded in finance income in the consolidated statement of profit or loss and other comprehensive income) continues to be accrued on the reduced carrying amount and is accrued using the rate of interest used to discount the future cash flows for the purpose of measuring the impairment loss. Loans, together with the associated allowance, are written off when there is no realistic prospect of future recovery and all collateral has been realised or has been transferred to the Group. If, in a subsequent year, the amount of the estimated impairment loss increases or decreases because of an event occurring after the impairment was recognised, the previously recognised impairment loss is increased or reduced by adjusting the allowance account. If a write-off is later recovered, the recovery is credited to finance costs in the consolidated statement of profit or loss and other comprehensive income.
ii. Financial Liabilities
initial Recognition and Measurement
Financial liabilities are classified, at initial recognition, as financial liabilities at fair value through profit or loss, loans and borrowings or payables. All financial liabilities are recognised initially at fair value and, in the case of loans and borrowings and payables, net of directly attributable transaction costs.
The Group’s financial liabilities include trade and other payables and may include loans and borrowings (including bank overdrafts).
ISE
LE
CT
AN
NU
AL
RE
PO
RT
20
16
83
FiNANCiAL StAteMeNtS
NOTES TO THE FINANCIAL STATEMENTS CONTINUED

3. SIGNIFICANT ACCOUNTING POLICIES (CONTINUED)
(o) Financial instruments – initial Recognition and Subsequent Measurement (continued)
ii. Financial Liabilities (continued)
Subsequent Measurement
The measurement of financial liabilities depends on their classification as described below:
Financial Liabilities at Fair Value Through Profit or Loss
Financial liabilities at fair value through profit or loss include financial liabilities held for trading and financial liabilities designated upon initial recognition as at fair value through profit or loss. Financial liabilities are classified as held for trading if they are incurred for the purpose of repurchasing in the near term. Gains or losses on liabilities held for trading are recognised in profit or loss. Financial liabilities designated upon initial recognition at fair value through profit or loss are designated at the initial date of recognition, and only if the criteria in AASB 139 are satisfied. The Group has not designated any financial liability as at fair
value through profit or loss.
Loans and Borrowings
After initial recognition, interest-bearing loans and borrowings are subsequently measured at amortised cost using the EIR method. Gains and losses are recognised in profit or loss when the liabilities are derecognised as well as through the EIR amortisation process. Amortised cost is calculated by taking into account any discount or premium on acquisition and fees or costs that are an integral part of the EIR. The EIR amortisation is included in finance costs in the consolidated statement of profit or loss and other comprehensive income. As at 30 June 2016, the Group does not have any loans and borrowings. For more information refer to Note 17.
Derecognition
A financial liability is derecognised when the obligation under the liability is discharged or cancelled, or expired. When an existing financial liability is replaced by another from the same lender on substantially different terms, or the terms of an existing liability are substantially modified, such an exchange or modification is treated as the derecognition of the original liability and the recognition of a new liability. The difference in the respective carrying amounts is recognised in profit or loss.
iii. offsetting of Financial instrumentsFinancial assets and liabilities are offset and the net amount reported in the consolidated statement of financial position if there is a currently enforceable legal right to offset the recognised amounts and there is an intention to settle on a net basis, to realise the assets and settle the liabilities simultaneously.
(p) impairment of Non-Financial AssetsThe Group assesses, at each reporting date, whether there is an indication that an asset may be impaired. If any indication exists, or when annual impairment testing for an asset is required, the Group estimates the asset’s recoverable amount. An asset’s recoverable amount is the higher of an asset’s or cash-generating unit’s (CGU) fair value less costs of disposal and its value in use. Recoverable amount is determined for an individual asset, unless the asset does not generate cash inflows that are largely independent of those from other assets or group of assets. When the carrying amount of an asset or CGU exceeds its recoverable amount, the asset is considered impaired and is written down to its recoverable amount.
In assessing value in use, the estimated future cash flows are discounted to their present value using a pre-tax discount rate that reflects current market assessments of the time value of money and the risks specific to the asset. In determining fair value less costs of disposal, recent market transactions are taken into account. If no such transactions can be identified, an appropriate valuation model is used. These calculations are corroborated by valuation multiples, quoted share prices for publicly traded companies or other available fair value indicators.
An assessment is also made at each reporting date as to whether there is any indication that previously recognised impairment losses may no longer exist or may have decreased, except in relation to goodwill. If such indication exists, the recoverable amount is estimated. A previously recognised impairment loss is reversed only if there has been a change in the estimates used to determine the asset’s recoverable amount since the last impairment loss was recognised. If that is the case, the carrying amount of the asset is increased to its recoverable amount. That increased amount cannot exceed the carrying amount that would have been determined, net of depreciation, had no impairment loss been recognised for the asset in prior periods. Such reversal is recognised in the consolidated statement of profit or loss and other comprehensive income.
FiNANCiAL StAteMeNtSIS
EL
EC
T A
NN
UA
L R
EP
OR
T 2
016
84
NOTES TO THE FINANCIAL STATEMENTS CONTINUED

The Group bases its impairment calculation on detailed budgets and forecast calculations, which are prepared separately for each of the Group’s CGUs to which the individual assets are allocated. These budgets and forecast calculations generally cover a period of five years. For longer periods, a long-term growth rate is calculated and applied to projected future cash flows after the fifth year.
Impairment losses on continuing operations are recognised in the consolidated statement of profit or loss and other comprehensive income in expense categories consistent with the function of the impaired asset.
For assets excluding goodwill, an assessment is made at each reporting date to determine whether there is an indication that previously recognised impairment losses no longer exist or have decreased. If such indication exists, the Group estimates the asset’s or CGU’s recoverable amount. A previously recognised impairment loss is reversed only if there has been a change in the assumptions used to determine the asset’s recoverable amount since the last impairment loss was recognised. The reversal is limited so that the carrying amount of the asset does not exceed its recoverable amount, nor exceed the carrying amount that would have been determined, net of depreciation, had no impairment loss been recognised for the asset in prior years. Such reversal is recognised in the consolidated statement of profit or loss and other comprehensive income unless the asset is carried at a revalued amount, in which case, the
reversal is treated as a revaluation increase.
Goodwill is tested for impairment annually and when circumstances indicate that the carrying value may be impaired.
Impairment is determined for goodwill by assessing the recoverable amount of each CGU (or group of CGUs) to which the goodwill relates. When the recoverable amount of the CGU is less than its carrying amount, an impairment loss is recognised in profit or loss. Impairment losses relating to goodwill cannot be reversed in future periods.
Intangible assets with indefinite useful lives are tested for impairment annually at the CGU level, as appropriate, and when circumstances indicate that the carrying value may be impaired.
(q) trade and other payablesTrade payables and other payables are carried at amortised cost and represent liabilities for goods and services provided to the Group prior to the end of the reporting date that are unpaid and arise when the Group becomes obliged to make future payments in respect of the purchase of these goods and services.
(r) onerous ContractsA provision for onerous contracts is recognised when the expected benefits to be derived by the Group from the contract are lower than the unavoidable cost of meeting its obligations under the contract. The provision is measured at the present value of the lower of the expected cost of terminating the contract and the expected net cost of continuing with the contract. Before a provision is established, the Group recognises any impairment loss on assets associated with the contract.
(s) provisionsProvisions are recognised when the Group has a present obligation (legal or constructive) as a result of a past event, it is probable that an outflow of resources embodying economic benefits will be required to settle the obligation and a reliable estimate can be made of the amount of the obligation. Where the Group expects some or all of a provision to be reimbursed, for example under an insurance contract, the reimbursement is recognised as a separate asset but only when the reimbursement is virtually certain. The expense relating to any provision is presented in the consolidated statement of profit or loss and other comprehensive income net of any reimbursement.
If the effect of the time value of money is material, provisions are determined by discounting the expected future cash flows at a pre-tax rate that reflects current market assessments of the time value of money and the risks specific to the liability. Where discounting is used, the increase in the provision due to the passage of time is recognised as a borrowing cost.
Wages, Salaries and Sick LeaveLiabilities for wages and salaries, including non-monetary benefits are recognised in respect of employees’ services up to the reporting date. They are measured at the amounts expected to be paid when the liabilities are settled. Expenses for non-accumulating sick leave are recognised when the leave is taken and are measured at the rates paid or payable.
ISE
LE
CT
AN
NU
AL
RE
PO
RT
20
16
85
FiNANCiAL StAteMeNtS
NOTES TO THE FINANCIAL STATEMENTS CONTINUED
3. SIGNIFICANT ACCOUNTING POLICIES (CONTINUED)
(s) provisions (continued)
Long Service Leave and Annual LeaveThe Group does not expect its long service leave or annual leave benefits to be settled wholly within 12 months of each reporting date. The Group recognises a liability for long service leave and annual leave measured as the present value of expected future payments to be made in respect of services provided by employees up to the reporting date using the projected unit credit method. Consideration is given to expected future wage and salary levels, experience of employee departures, and periods of service. Expected future payments are discounted using market yields at the reporting date on corporate bond rates with terms to maturity and currencies that match, as closely as possible, the estimated future cash outflows.
Clawback provisionsUpfront fees received from certain insurance funds, broadband providers and mortgage brokers can be clawed back in the event of early termination of membership. They vary across the insurance industry and insurers and are usually triggered where a referred member terminates their policy. Each relevant Product Provider has an individual agreement and the clawback period ranges between 0 and 12 months, depending on the agreement. The Group provides for this liability based upon historic average rates of attrition and recognises revenue net of these clawback amounts.
(t) Share-based paymentsThe Group provides benefits to its employees (including key management personnel) in the form of share-based payments, whereby employees render services in exchange for shares or rights over shares (equity settled transactions).
During the year there were two plans in place to provide these benefits:
• The FY2016 Long Term Incentive Plan (FY2016 LTI Plan), which provides benefits to employees and key management personnel; and
• The FY2015 Long Term Incentive Plan (FY2015 LTI Plan), which provides benefits to employees and key management personnel.
The cost of these equity-settled transactions with employees is measured by reference to the fair value of the equity instruments at the date at which they were granted. The fair value was determined by the Directors and management using a Binomial model.
The cost of equity-settled transactions is recognised, together with a corresponding increase in equity, over the period in which the performance and/or service conditions are fulfilled (the vesting period), ending on the date on which the relevant employees become fully entitled to the award (the vesting date).
At each subsequent reporting date until vesting, the cumulative charge to the consolidated statement of profit or loss and other comprehensive income is the product of (i) the grant date fair value of the award; (ii) the current best estimate of the number of awards that will vest, taking into account such factors as the likelihood of employee turnover during the vesting period and the likelihood of non-market performance conditions being met; and (iii) the expired portion of the vesting period. The charge to the consolidated statement of profit or loss and other comprehensive income for the period is the cumulative amount as calculated above less the amounts already charged in previous periods where there is a corresponding credit to equity.
Until an award has vested, any amounts recorded are contingent and will be adjusted if more or fewer awards vest than were originally anticipated to do so. Any award subject to a market condition is considered to vest irrespective of whether or not that market condition is fulfilled, provided that all other conditions are satisfied. If the terms of an equity-settled award are modified, as a minimum an expense is recognised as if the terms had not been modified. An additional expense is recognised for any modification that increases the total fair value of the share-based payment arrangement, or is otherwise beneficial to the employee, as measured at the date of modification.
If an equity-settled award is cancelled, it is treated as if it had vested on the date of cancellation, and any expense not yet recognised for the award is recognised immediately. However, if a new award is substituted for the cancelled award and designated as a replacement award on the date that it is granted, the cancelled and new award are treated as if they were a modification of the original award, as described in the previous paragraph.
FiNANCiAL StAteMeNtSIS
EL
EC
T A
NN
UA
L R
EP
OR
T 2
016
86
NOTES TO THE FINANCIAL STATEMENTS CONTINUED
(u) Finance income and Finance CostsThe Group’s finance income and finance costs include:
• Interest income;
• Interest expense;
• The net gain or loss on financial assets at fair value through profit or loss;
• The foreign currency gain or loss on financial assets and financial liabilities; and
• Impairment losses recognised on financial assets (other than trade receivables).
Interest income or expense is recognised using the effective interest rate method.
(v) Contributed equityOrdinary shares are classified as equity. Incremental costs directly attributable to the issue of new shares or options are shown in equity as a deduction, net of tax, from the proceeds.
(w) earnings per Share
Basic earnings per ShareBasic earnings per share is calculated as net profit attributable to members of the parent, adjusted to exclude any costs of servicing equity (other than dividends), divided by the weighted average number of ordinary shares outstanding during the financial year.
Diluted earnings per ShareDiluted earnings per share adjusts the figures used in the determination of basic earnings per share to take into account:
• The after-tax effect of interest and other financing costs associated with dilutive potential ordinary shares; and
• The weighted average number of additional ordinary shares that would have been outstanding assuming the conversion of all dilutive potential ordinary shares.
ISE
LE
CT
AN
NU
AL
RE
PO
RT
20
16
87
FiNANCiAL StAteMeNtS
NOTES TO THE FINANCIAL STATEMENTS CONTINUED

4. SEGMENT INFORMATIONFor management purposes, the Group is organised based on its products and services and has three reportable segments as follows:
• Health, which offers comparison, purchase and referral services across private health insurance;
• Life and General Insurance, which offers comparison, purchase and referral services across car, life and general insurance; and
• Energy and Telecommunications, which offers comparison, purchase and referral services across energy and broadband.
Other, comprises of comparison, purchase and referral services but predominantly offer financial service products including home loans. The Group considers these to be insignificant to warrant separate disclosure. The 30 June 2015 comparative segment information has been reclassified to align with the reported 30 June 2016 balances.
Geographical locationsAll revenue and operating assets are attributed to geographic location based on the location of customers, which are entirely in Australia.
REPORTED REPORTED
30 JUNE 2016$’000
30 JUNE 2015$’000
operating revenue
Health Insurance 89,961 93,450
Life and General Insurance 32,685 24,667
Energy and Telecommunications 40,159 29,973
Other 9,060 9,124
Consolidated Group operating revenue 171,865 157,214
Profit before interest, tax, depreciation, amortisation and loss from associate
Health Insurance 14,951 22,525
Life and General Insurance 11,858 7,758
Energy and Telecommunications 1,692 1,652
Other 1,022 2,015
Unallocated (Corporate)^ (8,028) (15,359)
Consolidated Group profit before interest, tax, depreciation, amortisation and loss from associate (eBitDA)
21,495
18,591
Depreciation and amortisation
(5,723)
(6,015)
Net finance income 2,079 5,768
Loss from associate (738) (313)
Consolidated Group profit before income tax 17,113 18,031
Income tax expense (4,208) (8,393)
Consolidated Group net profit for the year
12,905
9,638
^ Unallocated corporate costs in the current period include costs associated with the business restructure and CEO exit and replacement costs. In the prior year, unallocated corporate costs include the integration of Energy Watch, NIA loan impairment and associated costs and Chairman exit and replacement costs. These are further explained in Note 6.
FiNANCiAL StAteMeNtSIS
EL
EC
T A
NN
UA
L R
EP
OR
T 2
016
88
NOTES TO THE FINANCIAL STATEMENTS CONTINUED

5. ENERGY WATCH ACQUISITIONOn 1 July 2014, the Group obtained control of General Brokerage Services Pty Ltd and its controlled entities (Energy Watch Group), an online comparison company dealing in energy products.
purchase considerationThe Group paid cash consideration of $9,701,000 for the purchase of Energy Watch Group, and has recognised assets and liabilities assumed at the acquisition date.
Details of net assets and liabilities acquiredThe fair value of the assets and liabilities arising from the acquisition are as follows:
FAIR VALUE$’000
Cash 423
Trade debtors 56
Accrued income 1,358
Property, plant and equipment -
Brand name 1,754
Other assets 110
Deferred taxes 298
Trade and other payables (1,269)
Prepaid income (202)
Provisions (808)
Net identifiable assets 1,720
Add goodwill acquired 7,981
purchase consideration transferred 9,701
Fair value of assetsThe following fair values have been determined by management:
• The brand names acquired as part of the Energy Watch Group acquisition were initially recognised at fair value and this intangible asset has been determined to have an indefinite useful life; and
• The fair value of property, plant and equipment as well as any development and software assets have been determined to be nil at acquisition.
Acquisition, integration and closure related costsThe Group incurred acquisition related costs of $983,000 relating to external legal fees, due diligence costs, consultancy costs, redundancy and staff associated costs which were expensed in the consolidated statement of profit or loss and other comprehensive income in the previous financial periods. There were no acquisition costs in the current financial period.
ISE
LE
CT
AN
NU
AL
RE
PO
RT
20
16
89
FiNANCiAL StAteMeNtS
NOTES TO THE FINANCIAL STATEMENTS CONTINUED

6. REVENUE AND EXPENSES
CONSOLIDATED CONSOLIDATED
30 JUNE 2016$’000
30 JUNE 2015$’000
upfront Revenue
Upfront fees 135,112 118,425
Click-through fees 2,328 3,331
Advertising and subscription fees 3,254 3,411
140,694 125,167
trail Commission Revenue
Trail commission revenue – current period trail commission sales 25,690 26,189
Trail commission revenue – discount unwind 5,481 5,858
31,171 32,047
Employee Benefits Expense
Cost of sales and administration expenses include the following employee benefits expenses:
Remuneration, bonuses, on-costs and amounts provided for benefits (i)
59,810
52,442
Superannuation expenses 5,480 4,385
Share-based payments 63 287
65,353 57,114
Depreciation and Amortisation
Depreciation 2,750 2,537
Amortisation of previously capitalised development costs 2,973 3,478
5,723 6,015
occupancy Related expenses
Operating lease rental expense 2,120 1,833
Doubtful Debt Related expenses
Doubtful debt expense / (recovery) (21) -
other expenses included in the income Statement
Acquisition and integration costs (ii) - 699
Executive chairman exit and replacement costs (iii) - 1,029
CEO exit and replacement costs (iv) 450 -
Restructure costs (iv) 1,427 -
NIA associated costs (v) - 837
Impairment of NIA loan receivable (v) - 9,987
1,877 12,552
(i) Employee benefits expense is net of amounts capitalised as development costs of $1,748,000 (2015: $1,719,000) and superannuation expenses which are separately disclosed.
(ii) Acquisition and integration costs relate to the purchase of the Energy Watch business in the previous financial period.
(iii) Executive Chairman exit and replacement costs in relation to the resignation of Damien Waller and the search for a Non-Executive Chairman (Chris Knoblanche, appointed effective 1 July 2015).
(iv) Costs relate to the expenditure and associated on-costs incurred as a result of the exit of Alex Stevens, former CEO (ceased 12 October 2015), and costs associated with the restructure of the business.
(v) NIA loan receivable impairment and associated legal and advisory related costs.
FiNANCiAL StAteMeNtSIS
EL
EC
T A
NN
UA
L R
EP
OR
T 2
016
90
NOTES TO THE FINANCIAL STATEMENTS CONTINUED

7. INCOME TAX
CONSOLIDATED CONSOLIDATED
30 JUNE 2016$’000
30 JUNE 2015$’000
Current income tax
Current income tax expense (4,492) (7,854)
Adjustment in respect of current income tax of previous years 2,187 421
Deferred income tax
Relating to origination and reversal of temporary differences (566) (2,632)
Adjustments in respect of deferred income tax of previous years (1,573) (384)
Utilisation of carried forward tax losses 236 2,056
income tax reported in income statement (4,208) (8,393)
A reconciliation of income tax benefit/(expense) and accounting profit before income tax at the statutory income tax rate is as follows:
Accounting profit before income tax 17,113 18,031
Prima facie income tax (expense)/benefit using the statutory income tax rate of 30% (2015: 30%)
(5,134)
(5,409)
Share of loss /(profit) of associate reported, net of tax (221) (77)
Adjustments in respect of current income tax of previous years 2,187 421
Adjustments in respect of deferred income tax of previous years (1,573) (384)
Share-based payments (19) (86)
Entertainment (46) (102)
Initial recognition of available research and development concessional credits
350
223
Initial recognition of tax losses relating to the Energy Watch Group acquisition
236
-
Impairment of NIA loan receivable - (2,996)
Other 12 17
total income tax expense (4,208) (8,393)
Deferred tax assets relate to the following:
Deferred tax assets from temporary differences on:
Trade and other payables 634 1,935
Provisions 2,642 2,301
Property, Plant and Equipment 1,296 1,175
Expenditure for initial public offering costs 803 1,606
Other - 8
total deferred tax assets 5,375 7,025
Deferred tax liabilities from temporary differences on:
Trail commission receivable (31,237) (30,613)
Development costs (284) (501)
Other (82) -
total deferred tax liabilities (31,603) (31,114)
Net deferred tax liabilities (26,228) (24,089)
ISE
LE
CT
AN
NU
AL
RE
PO
RT
20
16
91
FiNANCiAL StAteMeNtS
NOTES TO THE FINANCIAL STATEMENTS CONTINUED

7. INCOME TAX (CONTINUED)
tax ConsolidationThe iSelect Group formed an income tax consolidated group as at 30 April 2007. iSelect Limited continues to act as the head entity of this Group. Upon the 100% acquisitions of Infochoice Limited and the Energy Watch Group, these companies became part of the tax consolidated group. Members of the Group entered into a tax sharing agreement at that time that provided for the allocation of income tax liabilities between the entities should the head entity default on its tax payment obligations. No amounts are expected to be recognised in the consolidated financial statements in respect of this agreement on the basis that the probability of default is remote. The head entity and the controlled entities in the likely tax consolidated group continue to account for their own current and deferred tax balances.
unrecognised deferred tax assetsThe Group has not recognised a deferred tax benefit on the loss on the NIA, which would be $2,996,000.
8. CASH AND CASH EQUIVALENTS
CONSOLIDATED CONSOLIDATED
30 JUNE 2016$’000
30 JUNE 2015$’000
Cash at bank and on hand 27,620 25,542
Term deposits 60,000 45,000
87,620 70,542
Cash at bank and on hand earns interest at floating rates based on daily bank deposit rates. Short-term deposits are made for varying periods of between one day and three months, depending on the immediate cash requirements of the Group, and earn interest at the respective short-term deposit rates.
FiNANCiAL StAteMeNtSIS
EL
EC
T A
NN
UA
L R
EP
OR
T 2
016
92
NOTES TO THE FINANCIAL STATEMENTS CONTINUED

CONSOLIDATED CONSOLIDATED
30 JUNE 2016$’000
30 JUNE 2015$’000
Reconciliation of profit after tax to net cash flows from operating activities
Net profit after tax 12,905 9,638
Adjustments for non-cash income and expense items:
Foreign exchange movements 40 (41)
Depreciation and amortisation 5,723 6,015
Impairment of NIA loan receivable - 9,987
Share-based payments expense 63 287
Share of loss in associate 738 313
Other 256 -
Adjustments for items in net profit but not in operating cash flows:
Interest expense classified as financing cash flow 489 589
Changes in net assets and liabilities:
(Increase)/decrease in trade receivables (10,877) (5,085)
(Increase)/decrease in trail commission receivable (2,066) (2,629)
(Increase)/decrease in other assets 385 (580)
Increase/(decrease) in trade and other payables 6,242 3,325
Increase/(decrease) in deferred taxes 2,139 2,632
Increase/(decrease) in provisions 493 5,434
Increase/(decrease) in income tax payable (5,198) (28)
Increase/(decrease) in other liabilities (557) 743
Net cash flow provided from operating activities1
10,775
30,600
1 Interest income received has been reclassified to be included as part of Operating ActivitiesIS
EL
EC
T A
NN
UA
L R
EP
OR
T 2
016
93
FiNANCiAL StAteMeNtS
NOTES TO THE FINANCIAL STATEMENTS CONTINUED

9. TRADE AND OTHER RECEIVABLES
CONSOLIDATED CONSOLIDATED
30 JUNE 2016$’000
30 JUNE 2015$’000
Current
Trade receivables 43,922 33,066
Allowance for credit losses - (21)
Other receivables (secured NIA facility) - 40,716
43,922 73,761
Refer to Note 23 for information on the credit risk management policy of the Group.
Allowance for credit loss
As at 30 June 2016, current trade receivables with a nominal value of nil (2015: $21,000) were provided for as doubtful.
Movements in the allowance account for credit losses were as follows:
Carrying value and the beginning of the year 21 80
Allowance for credit losses recognised during the year - -
Receivables written off during the year as uncollectable - (59)
Unused amount reversed (21) -
Carrying value at the end of the year - 21
trade and other receivables past due but not provided for as doubtful
As at 30 June 2016, trade receivables of $2,042,000 (2015: $1,129,000) were past due but not impaired. These relate to customers for whom there is no recent history of default or other indicators of impairment.
The ageing analysis of trade and other receivables that were not provided for as doubtful is as follows:
Neither past due nor impaired 41,880 72,632
Past due 1 – 30 days 1,133 281
Past due 31 – 90 days 727 403
Past due 90+ days 182 445
43,922 73,761
With respect to trade receivables that are neither past due nor provided for as doubtful, there are no indications as at the reporting date that the debtors will not meet their payment obligations. It is the Group’s policy that all key partners who wish to trade on credit terms are subject to credit verification procedures. Receivable balances are monitored on an ongoing basis.
Secured NiA facilityNIA Limited launched health.com.au in April 2012, which was the first major new health insurance fund in Australia for over 20 years. health.com.au has an online-focused marketing strategy and a suite of products that have been designed to appeal to underserviced consumer segments within online comparison. NIA Limited appointed the Group as a distributor of health.com.au’s private health insurance products.
The Group had provided a secured facility to NIA Health Pty Ltd (NIA Health) for the sole purpose of allowing NIA Health to defer the time at which it is required to make commission payments under distribution arrangements with the Group. The facility did not allow NIA Health to draw down cash amounts, rather, it created a deferred payment obligation for which NIA Health provides security and paid interest.
On 31 July 2015, the Group received a cash settlement of $42,133,667 in full satisfaction of interest owing with the balance being applied to remaining amounts owed under the NIA Health loan facility, subject to the terms and certain conditions of an agreement entered into on 25 July 2015, under which GMHBA will acquire health.com.au Pty Ltd.
In the financial year 2015 accounts, the Group adjusted for an impairment to the NIA Health loan facility of $9,987,000 plus additional one-off costs of approximately $837,000.
FiNANCiAL StAteMeNtSIS
EL
EC
T A
NN
UA
L R
EP
OR
T 2
016
94
NOTES TO THE FINANCIAL STATEMENTS CONTINUED
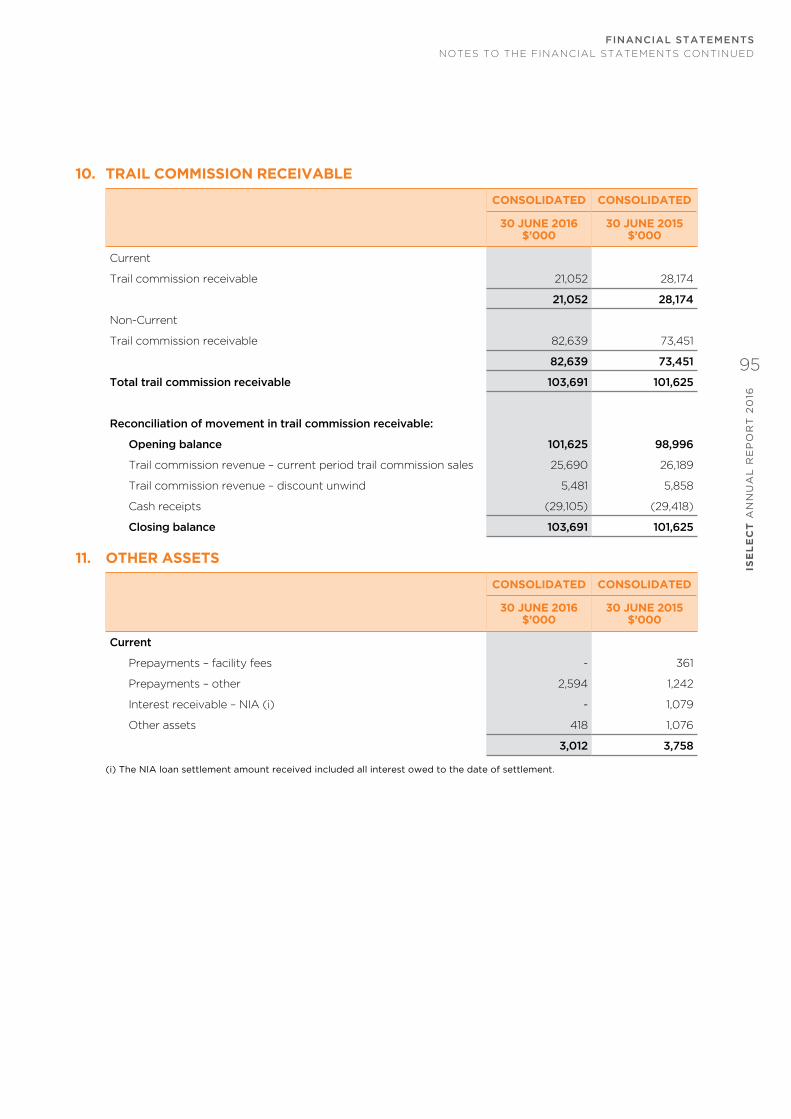
10. TRAIL COMMISSION RECEIVABLE
CONSOLIDATED CONSOLIDATED
30 JUNE 2016$’000
30 JUNE 2015$’000
Current
Trail commission receivable 21,052 28,174
21,052 28,174
Non-Current
Trail commission receivable 82,639 73,451
82,639 73,451
total trail commission receivable 103,691 101,625
Reconciliation of movement in trail commission receivable:
opening balance 101,625 98,996
Trail commission revenue – current period trail commission sales 25,690 26,189
Trail commission revenue – discount unwind 5,481 5,858
Cash receipts (29,105) (29,418)
Closing balance 103,691 101,625
11. OTHER ASSETS
CONSOLIDATED CONSOLIDATED
30 JUNE 2016$’000
30 JUNE 2015$’000
Current
Prepayments – facility fees - 361
Prepayments – other 2,594 1,242
Interest receivable – NIA (i) - 1,079
Other assets 418 1,076
3,012 3,758
(i) The NIA loan settlement amount received included all interest owed to the date of settlement.
ISE
LE
CT
AN
NU
AL
RE
PO
RT
20
16
95
FiNANCiAL StAteMeNtS
NOTES TO THE FINANCIAL STATEMENTS CONTINUED

12. PROPERTY, PLANT AND EQUIPMENT
LEASEHOLDIMPROVE-
MENTS$’000
OFFICE AND COMPUTER EQUIPMENT
$’000
COMPUTER SOFTWARE
$’000
FURNITURE, FIXTURES
AND FITTINGS
$’000TOTAL$’000
As at 30 June 2016
Cost 8,565 7,179 7,102 1,020 23,866
Accumulated depreciation (5,396) (5,027) (4,464) (211) (15,098)
Net carrying amount 3,169 2,152 2,638 809 8,768
Net carrying amount at 1 July 2015
3,632
1,938
1,234
292
7,096
Additions 569 1,076 2,193 584 4,422
Disposals - - - - -
Depreciation expense (1,032) (862) (789) (67) (2,750)
Net carrying amount at 30 June 2016
3,169
2,152
2,638
809
8,768
As at 30 June 2015
Cost 7,996 6,103 4,909 436 19,444
Accumulated depreciation (4,364) (4,165) (3,675) (144) (12,348)
Net carrying amount 3,632 1,938 1,234 292 7,096
Net carrying amount at 1 July 2014
4,564
1,958
1,035
152
7,709
Additions 82 848 818 176 1,924
Disposals - - - - -
Depreciation expense (1,014) (868) (619) (36) (2,537)
Net carrying amount at 30 June 2015
3,632
1,938
1,234
292
7,096
FiNANCiAL StAteMeNtSIS
EL
EC
T A
NN
UA
L R
EP
OR
T 2
016
96
NOTES TO THE FINANCIAL STATEMENTS CONTINUED

13. INTANGIBLE ASSETS
DEVELOP-MENT COSTS$’000
TRADE-MARKS
AND DOMAIN NAMES$’000
GOOD- WILL$’000
BRAND NAMES$’000
CUSTOMER CONTRACTS
$’000TOTAL$’000
As at 30 June 2016
Cost 22,198 368 31,216 8,204 806 62,792
Accumulated amortisation (15,773) - - - (806) (16,579)
Net carrying amount 6,425 368 31,216 8,204 - 46,213
Net carrying amount at 1 July 2015
6,412
368
31,216
8,204
-
46,200
Additions 3,242 - - - - 3,242
Disposals (256) - - - - (256)
Amortisation (2,973) - - - - (2,973)
Net carrying amount at 30 June 2016
6,425
368
31,216
8,204
-
46,213
As at 30 June 2015
Cost 19,212 368 31,216 8,204 806 59,806
Accumulated amortisation (12,800) - - - (806) (13,606)
Net carrying amount 6,412 368 31,216 8,204 - 46,200
Net carrying amount at 1 July 2014
7,511
350
23,235
6,450
-
37,546
Acquisitions through business combination
-
-
7,981
1,754
-
9,735
Additions 2,379 18 - - - 2,397
Amortisation (3,478) - - - - (3,478)
Net carrying amount at 30 June 2015
6,412
368
31,216
8,204
-
46,200
ISE
LE
CT
AN
NU
AL
RE
PO
RT
20
16
97
FiNANCiAL StAteMeNtS
NOTES TO THE FINANCIAL STATEMENTS CONTINUED

13. INTANGIBLE ASSETS (CONTINUED)
Description of intangible assets
(i) Development costsDevelopment costs relate to the development of the Group’s various websites and customer conversion systems and are carried at cost less accumulated amortisation and accumulated impairment losses. This intangible asset has been assessed as having a finite life and is amortised using the straight line method over a period of between 2 and 5 years. The amortisation has been recognised in the consolidated statement of profit or loss and other comprehensive income in amortisation. If an impairment indication arises, the recoverable amount is estimated and an impairment loss is recognised to the extent that the recoverable amount is lower than the carrying amount.
(ii) trademarks and domain namesTrademark and domain names are carried at cost and are not amortised. These intangible assets have been determined to have indefinite useful lives. These assets were tested for impairment as at 30 June 2016, on a ‘value-in-use’ basis. Also refer Note 3(l), 3(p) and below.
(iii) GoodwillGoodwill relates to the acquisitions of Infochoice Limited and the Energy Watch group. Goodwill has
been tested for impairment on a value-in-use basis as at 30 June 2016, refer to Note 3(l), 3(p), and below.
(iv) Brand NamesThe brand names acquired as part of the Infochoice Limited and the Energy Watch Group acquisitions were initially recognised at fair value. These intangible asset have been determined to have an indefinite useful life. These assets were tested for impairment on a value-in-use basis as at 30 June 2016, refer to Note 3(l), 3(p) and below.
(v) Customer ContractsThe customer contract asset acquired as part of the Infochoice Limited acquisition is carried at cost less accumulated amortisation and accumulated impairment losses. This asset is fully written down.
Impairment testing of goodwill and intangible assets with indefinite livesGoodwill acquired through the Infochoice Limited and Energy Watch group acquisitions have been allocated to the cash generating units (CGUs) for impairment testing as outlined in the table below:
SEGMENT CGU $’000
Health Health 6,645
Car and Life Insurance Car 2,379
Life 77
Other Home loans 4,380
Money 9,754
Goodwill from infochoice acquisition 23,235
Energy and Telecommunications Household 7,981
Goodwill from energy Watch acquisition 7,981
total Group total Goodwill 31,216
The brand name acquired through the Infochoice Limited acquisition has an indefinite useful life and is allocated at a Group level. Trademarks and domain names also have an indefinite useful life and are allocated at a Group level. The brand name acquired through the Energy Watch acquisition has an indefinite useful life and is allocated to the Household CGU, which is comprised of iSelect Energy, iSelect Broadband and Energy Watch.
The Group has performed its annual impairment test as at 30 June 2016. The recoverable amount of CGUs has been determined based on a value-in-use calculation using the financial year 2017 long-term plan approved by the Board with a growth rate increment for subsequent years, and cash flow projections based on management forecasts. As a result of this analysis, no impairment was identified for the CGUs to which goodwill or brand names are allocated.
FiNANCiAL StAteMeNtSIS
EL
EC
T A
NN
UA
L R
EP
OR
T 2
016
98
NOTES TO THE FINANCIAL STATEMENTS CONTINUED

Key assumptions used in value-in-use calculation
Discount ratesDiscount rates represent the current market assessment of the risks specific to each CGU, taking into consideration the time value of money and individual risks of the underlying assets that have not been incorporated in the cash flow estimates. The discount rate calculation is based on the specific circumstances of the Group and its operating segments and is derived from its weighted average cost of capital (WACC). The WACC takes into account both debt and equity. The cost of equity is derived from the expected return on investment by the Group’s investors. The cost of debt is based on the interest bearing borrowings the Group is obliged to service. CGU-specific risk is incorporated into the WACC rate where it is considered appropriate. The pre-tax discount rates are as follows:
CGU FY16 FY15
Health 11.4% 12.2%
Car 10.8% 11.8%
Home loans 19.7% 19.9%
Money 13.8% 14.7%
Life 11.7% 12.7%
Household 10.9% 12.2%
Growth rate estimates For each CGU, 5 years of cash flows have been included in the cash flow models. These are based on the long-term plan and growth rates of 3% for all CGU’s other than Home Loans.
Whilst the Home Loans CGU remains an immature business and its operation to-date has incurred losses, 2016 financial results came in better than expected, exceeding prior year forecasts. Management continues to believe improved focus and attention will drive substantial growth in the business over the forecast time period. The cash flows for Home Loans are based on management projections with an anticipated loss in financial year 2017 (though an improvement on financial year 2016) and continued significant forecasted growth into the 2018 to 2021 financial years. Subsequently, a long term terminal growth rate of 3%, which is in line with the assessment for other CGUs, has been applied.
Market share assumptionsThese assumptions are important because management assesses how the unit’s position, relative to its competitors, might change over the budget period. Management expects the Group’s share of its respective markets to grow over the forecast period.
Sensitivity to changes in assumptionsWith regard to the assessment of ‘value-in-use’ of the CGUs other than the Home Loans CGU, management believes that no reasonable change in any of the above key assumptions would cause the carrying value of the units to materially exceed its recoverable amount.
For the Home Loans CGU, the estimated recoverable amount is $4.1 million greater than its carrying value. Despite this headroom, certain adverse changes in a key assumption may result in an impairment loss. The implications of these adverse changes in the key assumptions for the recoverable amount are discussed below:
• Growth and discount rate assumptions – management recognises that the Home Loans CGU is still in its infancy and the speed of its growth may have a significant impact on growth rate assumptions applied. However, as an indication of the potential impact on impairment, if cash flows were discounted by 20% and the discount rate was increased by 2%, this would lead to impairment.
ISE
LE
CT
AN
NU
AL
RE
PO
RT
20
16
99
FiNANCiAL StAteMeNtS
NOTES TO THE FINANCIAL STATEMENTS CONTINUED

14. INVESTMENT IN ASSOCIATEOn 10 October 2014, the Group acquired a 20% interest on a fully dilutive basis for $4.6 million (US $4.0 million) in the Intelligent Money Group (iMoney), an online comparison company dealing in financial products across South East Asia.
On the 19 February 2016, the Group acquired an additional 85,690 shares on a fully dilutive basis for $1.8 million (US $1.3 million. As part of the additional investment, the Group has also obtained a call option to purchase additional interest for a period of 12 months from the 19 February 2016.
The Group has 23% (2015: 20%) of the voting rights on the Board of Directors. It has also determined that the investment in associate is immaterial in nature for the Group’s overall operations.
The following table analyses, in aggregate, the carrying amount of the share of profit and other comprehensive income of this investment.
CONSOLIDATED CONSOLIDATED
30 JUNE 2016$’000
30 JUNE 2015$’000
Carrying amount of interest in associates
5,293
4,265
As represented by:
Balance at beginning of year
4,265
-
Acquisition of shares 1,766 4,578
Share of:
Loss from continuing operations (738) (313)
Other comprehensive income - -
Balance at the end of year 5,293 4,265
15. TRADE AND OTHER PAYABLES
CONSOLIDATED CONSOLIDATED
30 JUNE 2016$’000
30 JUNE 2015$’000
Trade payables
15,921
5,310
Other payables 11,839 15,740
27,760 21,050
Trade payables and other payables are non-interest bearing and are normally settled on 30 day terms.
FiNANCiAL StAteMeNtSIS
EL
EC
T A
NN
UA
L R
EP
OR
T 2
016
100
NOTES TO THE FINANCIAL STATEMENTS CONTINUED

16. PROVISIONS
CONSOLIDATED CONSOLIDATED
30 JUNE 2016$’000
30 JUNE 2015$’000
Current
Employee benefits – annual leave 2,584 2,403
Employee benefits – long service leave 482 357
Lease incentive (i) 319 319
Clawback (ii) 2,630 1,961
Other (iii) 1,449 1,354
7,464 6,394
Non-Current
Employee benefits – long service leave 422 680
Lease Incentive (i) 1,277 1,596
1,699 2,276
Nature and timing of provisions
(i) provision for lease incentiveRelates to the receipt of lease incentive payments in relation to the Group’s premises. This income has been deferred and is being recognised in the consolidated statement of profit or loss and other comprehensive income over the life of the lease.
(ii) Clawback provision The Group has recognised a provision for expected clawback of marketing fees receivable from health, life and general funds due to early termination of policies by new members. This is based on historical and average industry rates of attrition. Clawback of fees is incurred within 0 to 12 months of the sale of the relevant policies.
(iii) otherPredominantly relates to the make good provision in relation to the Group’s premises and rebates.
17. LOANS AND BORROWINGSThis note provides information about the contractual terms of the Group’s interest-bearing loans and borrowings, which are measured at amortised cost. For more information about the Group’s exposure to interest rate, foreign currency and liquidity risk, see Note 23.
Funding activitiesThe Group currently maintains a revolving facility with CBA, on the terms outlined below.
Revolving facilityOn 18 April 2013 the Group entered into a $40 million facility with the Commonwealth Bank of Australia (CBA). The arrangements included a term debt revolving facility of up to $35 million and a secured letter of credit facility of up to $5 million. The term of the facility was 3 years, from 18 April 2013 to 17 April 2016.
During financial year 2014 the Group renegotiated its terms and facility limit with CBA and an updated arrangement for a $15 million facility. The arrangement reduced the term debt revolving facility down to $10 million, whilst the credit limit facility terms remained unchanged.
The purpose of the facility is to provide funding for general corporate purposes, including ongoing working capital requirements and to meet the ongoing liquidity requirements of the Group. Interest is payable at a rate calculated as BBSY plus a pre-determined margin.
ISE
LE
CT
AN
NU
AL
RE
PO
RT
20
16
101
FiNANCiAL StAteMeNtS
NOTES TO THE FINANCIAL STATEMENTS CONTINUED

17. LOANS AND BORROWINGS (CONTINUED)The term debt revolving facility contains financial covenants that are required to be met. As at 30 June 2016, the Group has complied with these covenants.
The Group has provided a General Security Deed over all the present and after-acquired property of all entities in the consolidated Group.
On the expiry of the initial facility agreement in April 2016, the Group is currently in renegotiations on a new facility term. Whilst this is ongoing the Group has reduced the facility limit to nil and currently is only utilising the secured letter of credit facility of $5 million.
18. CONTRIBUTED EQUITY
CONSOLIDATED CONSOLIDATED
30 JUNE 2016$’000
30 JUNE 2015$’000
Issued capital
150,914
173,713
issued capital – ordinary shares
Movement in shares on issueNUMBER OF
SHARESSHARE CAPITAL
$’000
Total quoted shares outstanding at 1 July 2014 260,889,894 172,963
Issue of shares – ESOP(1) 600,000 750
Total quoted shares outstanding at 30 June 2015 261,489,894 173,713
Issue of shares – ESOP - -
Buyback of share capital(2) (23,005,379) (22,799)
Total quoted shares outstanding at 30 June 2016 238,484,515 150,914
Total LTI Plan shares outstanding at 1 July 2014 5,086,119 -
Issue of shares – LTI Plan(3) 7,546,080 -
Forfeiture of Shares – LTI Plan (6,109,847) -
Total LTI Plan shares outstanding at 30 June 2015 6,522,352 -
Issue of shares – LTI Plan(3) 2,284,163 -
Forfeiture of Shares – LTI Plan (5,025,049) -
Total LTI Plan shares outstanding at 30 June 2016 3,781,466 -
(1) Net of transaction costs of $64,000 and associated tax of $(19,000).
(2) The Group announced in December 2015 the implementation of an on-market buy-back over a 12 month period of up to 10% of the Groups’ ordinary shares on issue resulting in 23.0 million ordinary shares being bought back during the period. The Groups also announced on 7 July 2016 commencement of purchase of a further 25.5 million ordinary shares subject to circumstance being considered beneficial to the efficient capital management of the Group under the approval provided by shareholders on 16 March 2016.
(3) Shares issued as part of Long Term Incentive Plan are unquoted ordinary shares. Refer to Note 31 for further details of the Long Term Incentive Plan.
ordinary SharesOrdinary shares have no par value and entitle the holder to the right to receive dividends as declared and, in the event of winding up the Group, to participate in the proceeds from the sale of all surplus assets in proportion to the number and amount paid up on shares held. Ordinary shares entitle their holder to one vote, either in person or by proxy, at a meeting of the Group.
FiNANCiAL StAteMeNtSIS
EL
EC
T A
NN
UA
L R
EP
OR
T 2
016
102
NOTES TO THE FINANCIAL STATEMENTS CONTINUED

19. RESERVES
30 JUNE 2016$’000
30 JUNE 2015$’000
Share-based payment reserve (i)
1,746
1,683
Business combination reserve (ii) 5,571 5,571
Foreign currency translation reserve (iii) - (49)
7,317 7,205
(i) Share-based payment reserve This reserve records the value of shares under the Long Term Incentive Plan, and historical Employee and CEO Share Option plans offered to the CEO, Executives and employees as part of their remuneration. Refer to Note 31 for further details of these plans.
(ii) Business combination reserveThis reserve records the difference between the consideration paid and the ‘equity’ acquired from the internal Group restructure performed in the 2007 financial year. Refer to Note 3(b) for further details.
(iii) Foreign currency translation reserveThis reserve records translation differences arising as a result of translating the financial statement items of a foreign operation into the Group’s functional currency and on translation of receivables/payables from/to a foreign operation, where settlement is neither planned nor likely to occur in the foreseeable future and therefore recorded as part of the net investment in the foreign operation.
20. RETAINED EARNINGS
30 JUNE 2016$’000
30 JUNE 2015$’000
Balance at beginning of period 66,004 56,366
Profit for the period 12,905 9,638
Dividend paid (2,533) -
Balance at end of period 76,376 66,004
ISE
LE
CT
AN
NU
AL
RE
PO
RT
20
16
103
FiNANCiAL StAteMeNtS
NOTES TO THE FINANCIAL STATEMENTS CONTINUED

21. DIVIDENDS
30 JUNE 2016$’000
30 JUNE 2015$’000
Cash dividends on ordinary shares declared and paid:
Interim dividend for 2016: 1 cent per share (2015: nil cents per share) 2,533 -
2,533 -
Proposed dividends on ordinary shares:
Estimated final cash dividend payable for 2016: 1.5 cents per share (2015: nil cent per share)
3,577
-
Proposed dividends on ordinary shares at the date of this report are subject to approval at the annual general meeting and are not recognised as at 30 June.
Franking credit balance
The amount of franking credits available for the subsequent financial year are:
Franking account balance as at the end of the financial year at 30% (2015: 30%)
6,181
-
Franking credits that will arise from the payment of income tax payable as at the end of the financial year
236
5,434
Franking debits that will arise from the payment of dividends as at the end of the financial year
-
-
Franking credits that will arise from the receipt of dividends recognised as receivables at the reporting date
-
-
6,417 5,434
22. EARNINGS PER SHAREBasic earnings per share is calculated as net profit attributable to owners of the Group by the weighted average number of ordinary shares outstanding during the financial year.
Diluted earnings per share is calculated as above with an adjustment for the weighted number of ordinary shares that would be issued on conversion of all dilutive ordinary shares.
Basic and dilutive earnings per share are calculated as follows:
30 JUNE 2016$’000
30 JUNE 2015$’000
Profit after attributable to the owners of the Group
12,905
9,638
SHARES (‘000) SHARES (‘000)
Weighted average number of ordinary shares for basic earnings per share
255,247
261,299
Effect of dilution 921 774
Weighted average number of ordinary shares adjusted for effect of dilution
256,168
262,073
CENTS CENTS
Earnings per share:
Basic for profit for the year attributable to ordinary members of the parent
5.1
3.7
Diluted for profit for the year attributable to ordinary members of the parent
5.0
3.7
FiNANCiAL StAteMeNtSIS
EL
EC
T A
NN
UA
L R
EP
OR
T 2
016
104
NOTES TO THE FINANCIAL STATEMENTS CONTINUED

23. FINANCIAL RISK MANAGEMENT OBJECTIVES AND POLICIESThe Group’s principal financial instruments comprise trade and other receivables, trade and other payables, loans and borrowings and cash and short-term deposits. The Group does not use derivative financial instruments such as foreign exchange contracts and interest rate swaps to hedge risk exposures. It is not exposed to either securities price risk or commodity price risk. Foreign exchange risk is limited to international operations (Energy Watch Services Ltd whose functional currency is New Zealand Dollars) and transactional currency exposure for some purchases made by the Australian entities in currencies other than the functional currency. However, the New Zealand operations and foreign currency denominated purchases made by the Australian entities are not significant parts of the overall iSelect business and therefore the exposure is minor. At 31 May 2016 the Group ceased operations in New Zealand.
The main risks arising from the Group’s financial instruments are:
• Market risk (including interest rate risk and foreign currency risk);
• Credit risk; and
• Liquidity risk.
The Group uses different methods to measure and manage different types of risks to which it is exposed. These include monitoring levels of exposure to interest rate risk and assessments of market forecasts for interest rates and exchange rates. Ageing analysis and monitoring of specific credit allowances are undertaken to manage credit risk, and liquidity risk is monitored through the development of future rolling cash flow forecasts and comprehensive capital management planning.
The Board of Directors continues to review the Group’s risk and capital management framework and has an Audit and Risk Management Committee to aid and oversee this process.
The Group’s policies in relation to financial risks to which it has exposure are detailed below.
(a) Market RiskMarket risk is the risk that the fair value of future cash flows of a financial instrument will fluctuate due to changes in market prices. Market prices comprise four types of risk: interest rate risk, currency risk, commodity price risk and other price risk, such as equity price risk. Financial instruments affected by market risk include trade and other receivables, trail commission receivables, short term deposits, trade and other payables and borrowings.
(i) Cash flow and fair value interest rate risk The Group’s main interest rate risk arises from cash and cash equivalents, trail commission receivables and borrowings. The following sensitivity analysis is based on the interest rate risk exposures in existence at the reporting date:
30 JUNE 2016$’000
30 JUNE 2015$’000
Financial Assets
Current
Cash and cash equivalents 87,620 70,542
Trade and other receivables 43,922 73,761
Trail commission receivable 21,052 28,174
Non-Current
Trail commission receivable 82,639 73,451
235,233 245,928
Financial Liabilities
Current
Trade and other payables 27,760 21,050
27,760 21,050
Net exposure 207,473 224,878
ISE
LE
CT
AN
NU
AL
RE
PO
RT
20
16
105
FiNANCiAL StAteMeNtS
NOTES TO THE FINANCIAL STATEMENTS CONTINUED

23. FINANCIAL RISK MANAGEMENT OBJECTIVES AND POLICIES (CONTINUED)
(a) Market Risk (continued)
(i) Cash flow and fair value interest rate risk (continued)At 30 June 2016, if interest rates had moved as illustrated in the table below, with all other variables being held constant, post-tax profit would have been higher/(lower) as follows:
30 JUNE 2016$’000
30 JUNE 2015$’000
totAL
Consolidated
+1% (100 basis points) 613 494
-1% (100 basis points) (613) (494)
CASH At BANK
Consolidated
+1% (100 basis points) 613 494
-1% (100 basis points) (613) (494)
Judgements of reasonably possible movements
The movements in profit are due to higher/lower interest income from cash balance.
(ii) Foreign currency risk The Group has minimal transactional currency exposure. Such exposure arises from operating in New Zealand (Energy Watch Services Limited) and purchases by an Australian operating entity in currencies other than the functional currency. No hedging instruments have been or are in place. At 31 May 2016 the Group ceased operations in New Zealand.
(b) Credit RiskCredit risk is managed on a Group basis. Credit risk arises from cash and cash equivalents, trade and other receivables and trail commission receivable in future periods. The Group’s maximum exposure to credit risk at reporting date in relation to each class of financial asset is the carrying amount of those assets as indicated in the statement of financial position.
exposure to credit riskThe carrying amount of the financial assets represents the maximum credit exposure. The maximum credit risk at the reporting date was as follows:
30 JUNE 2016$’000
30 JUNE 2015$’000
Cash and cash equivalents 87,620 70,542
Trade and other receivables 43,922 33,045
Secured NIA facility - 40,716
Trail commission receivable 103,691 101,625
235,233 245,928
FiNANCiAL StAteMeNtSIS
EL
EC
T A
NN
UA
L R
EP
OR
T 2
016
106
NOTES TO THE FINANCIAL STATEMENTS CONTINUED
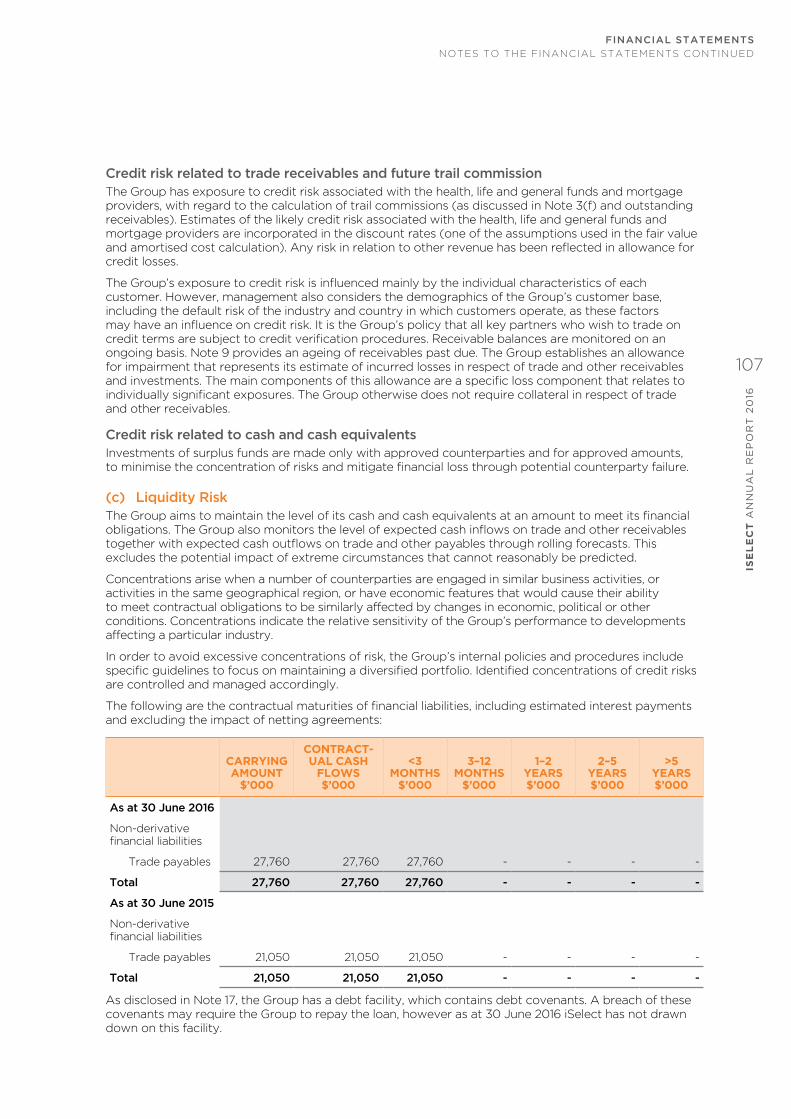
Credit risk related to trade receivables and future trail commissionThe Group has exposure to credit risk associated with the health, life and general funds and mortgage providers, with regard to the calculation of trail commissions (as discussed in Note 3(f) and outstanding receivables). Estimates of the likely credit risk associated with the health, life and general funds and mortgage providers are incorporated in the discount rates (one of the assumptions used in the fair value and amortised cost calculation). Any risk in relation to other revenue has been reflected in allowance for credit losses.
The Group’s exposure to credit risk is influenced mainly by the individual characteristics of each customer. However, management also considers the demographics of the Group’s customer base, including the default risk of the industry and country in which customers operate, as these factors may have an influence on credit risk. It is the Group’s policy that all key partners who wish to trade on credit terms are subject to credit verification procedures. Receivable balances are monitored on an ongoing basis. Note 9 provides an ageing of receivables past due. The Group establishes an allowance for impairment that represents its estimate of incurred losses in respect of trade and other receivables and investments. The main components of this allowance are a specific loss component that relates to individually significant exposures. The Group otherwise does not require collateral in respect of trade and other receivables.
Credit risk related to cash and cash equivalents Investments of surplus funds are made only with approved counterparties and for approved amounts, to minimise the concentration of risks and mitigate financial loss through potential counterparty failure.
(c) Liquidity RiskThe Group aims to maintain the level of its cash and cash equivalents at an amount to meet its financial obligations. The Group also monitors the level of expected cash inflows on trade and other receivables together with expected cash outflows on trade and other payables through rolling forecasts. This excludes the potential impact of extreme circumstances that cannot reasonably be predicted.
Concentrations arise when a number of counterparties are engaged in similar business activities, or activities in the same geographical region, or have economic features that would cause their ability to meet contractual obligations to be similarly affected by changes in economic, political or other conditions. Concentrations indicate the relative sensitivity of the Group’s performance to developments affecting a particular industry.
In order to avoid excessive concentrations of risk, the Group’s internal policies and procedures include specific guidelines to focus on maintaining a diversified portfolio. Identified concentrations of credit risks are controlled and managed accordingly.
The following are the contractual maturities of financial liabilities, including estimated interest payments and excluding the impact of netting agreements:
CARRYING AMOUNT
$’000
CONTRACT-UAL CASH
FLOWS$’000
<3 MONTHS
$’000
3–12 MONTHS
$’000
1–2 YEARS$’000
2–5 YEARS$’000
>5 YEARS$’000
As at 30 June 2016
Non-derivative financial liabilities
Trade payables 27,760 27,760 27,760 - - - -
Total 27,760 27,760 27,760 - - - -
As at 30 June 2015
Non-derivative financial liabilities
Trade payables 21,050 21,050 21,050 - - - -
Total 21,050 21,050 21,050 - - - -
As disclosed in Note 17, the Group has a debt facility, which contains debt covenants. A breach of these covenants may require the Group to repay the loan, however as at 30 June 2016 iSelect has not drawn down on this facility.
ISE
LE
CT
AN
NU
AL
RE
PO
RT
20
16
107
FinAnCiAL STATemenTS
NOTES TO THE FINANCIAL STATEMENTS CONTINUED

23. FINANCIAL RISK MANAGEMENT OBJECTIVES AND POLICIES (CONTINUED)
(d) Fair ValuesThe fair values of financial assets and liabilities, together with the carrying amounts shown in the consolidated statement of financial position are as follows:
CARRYING AMOUNT ($’000) FAIR VALUE ($’000)
NOTE 2016 2015 2016 2015
Financial Assets
Cash and cash equivalents (i) 8 87,620 70,542 87,620 70,542
Trade and other receivables – current (i)
9
43,922
73,761
43,922
73,761
Trail commission receivable (ii) 10 103,691 101,625 104,953 103,164
235,233 245,928 236,495 247,467
Financial Liabilities
Trade and other payables (i) 15 27,760 21,050 27,760 21,050
27,760 21,050 27,760 21,050
Sensitivity of trail commission receivableA combined premium price decrease of 1% and termination rate increase of 1% would have the effect of reducing the carrying value by $12,011,000 (2015: $9,269,000). A combined premium price increase of 1% and termination rate decrease of 1% would have the effect of increasing the carrying value by $10,854,000 (2015: $11,303,000). Individually, the effects of these inputs would not give rise to any additional amount greater than those stated.
The methods and assumptions used to estimate the fair value of financial instruments are as follows:
(i) For financial assets and financial liabilities with a short term to maturity the carrying amount is considered to approximate fair value.
(ii) The fair value has been calculated by discounting the expected future cash flows at prevailing interest rates.
NOTE
QUOTED MARKET
PRICE (LEVEL 1)
$’000
VALUATION TECHNIQUE - MARKET
OBSERVABLE INPUTS
(LEVEL 2)$’000
VALUATION TECHNIQUE - NON-MARKET OBSERVABLE
INPUTS(LEVEL 3)
$’000 TOTAL
30 June 2016
Financial Assets
Trail commission receivable - - 104,953 104,953
- - 104,953 104,953
Financial Liabilities -
-
-
-
30 June 2015
Financial Assets
Other receivables 9 - - 40,716 40,716
Trail commission receivable - - 103,164 103,164
- - 143,880 143,880
Financial Liabilities
-
-
-
-
FiNANCiAL StAteMeNtSIS
EL
EC
T A
NN
UA
L R
EP
OR
T 2
016
108
NOTES TO THE FINANCIAL STATEMENTS CONTINUED

For financial instruments not quoted in the active markets, the Group used valuation techniques such as present value techniques (which include lapse and mortality rates, commission terms, premium increases, credit risk), comparison to similar instruments for which market observable prices exists and other relevant models used by market participants. These valuation techniques use both observable and unobservable market inputs.
(e) Capital ManagementThe Board’s policy is to maintain a strong capital base so as to maintain investor, creditor and market confidence and to sustain operations and future development of the business. Capital consists of ordinary shares and retained earnings. The Board of Directors monitors the return on capital and seeks to maintain a balance between the higher returns that might be possible with higher levels of borrowings and the advantages and security afforded by a sound capital position.
24. COMMITMENTS AND CONTINGENCIES
CONSOLIDATED CONSOLIDATED
30 JUNE 2016$’000
30 JUNE 2015$’000
Commitments
Non-cancellable operating lease commitments
Not later than 1 year 2,981 2,419
Later than 1 year and not later than 5 years 11,335 10,272
Later than 5 years - 2,691
14,316 15,382
The Group has entered into operating leases on office premises with lease terms between 4 to 10 years. The Group has the option to lease the premises for additional terms of 2.5 to 10 years.
Contingencies
Guarantees
Trading guarantees 2,089 2,089
The Group has issued a number of bank guarantees and letters of credit for various operational purposes. It is not expected that these guarantees will be called upon. All trading guarantees are issued in the name of iSelect Limited.
otherOn 24 October 2011, iSelect Life Pty Ltd reported to the Australian Securities and Investment Commission a breach in relation to its Australian Financial Services License relating to life insurance policies sold between April 2009 and March 2011. As a result of this breach, an internal review of all life insurance policies sold during that period was undertaken. The review and remediation work commenced in October 2011. As at 30 June 2016, 100% (2015: 100%) of the initial 5,095 policies had been reviewed by iSelect with only 664 (2015: 665) policies in relation to one provider still subject to final remediation.
The amount, if any, of liability associated with those policies yet to be remediated cannot be reliably determined at this time, and accordingly no amounts have been recorded in the consolidated financial statements for the year ended 30 June 2016 (2015: nil).
Potential liabilities for the Group, should any obligation be identified, are expected to be covered by insurance maintained by the Group.
ISE
LE
CT
AN
NU
AL
RE
PO
RT
20
16
109
FiNANCiAL StAteMeNtS
NOTES TO THE FINANCIAL STATEMENTS CONTINUED

25. EVENTS AFTER BALANCE SHEET DATEOn the 30 August 2016 the Group declared an estimated fully franked full year dividend of $3,577,000, representing 1.5 cents per share based on the shares on issue at the 30 June 2016.
No other matters or circumstances have arisen since the end of the period that have significantly affected or may significantly affect the operations of the Group, the results of those operations, or the state of affairs of the Group in future financial years.
26. PARENT ENTITY INFORMATIONThe accounting policies of the parent entity, iSelect Limited, which have been applied in determining the financial information shown below, are the same as those applied in the consolidated financial statements. Refer to Note 3 for a summary of accounting policies relating to the Group.
30 JUNE 2016$’000
30 JUNE 2015$’000
Financial position
Assets
Current Assets 60,738 87,536
Non-Current Assets 153,254 167,915
Total Assets 213,992 255,451
Liabilities
Current Liabilities 65,853 83,424
Non-Current Liabilities - -
Total Liabilities 65,853 83,424
Net Assets 148,139 172,027
equity
Contributed Equity 150,914 173,713
Reserves 1,746 1,683
Accumulated Losses (4,521) (3,369)
total equity 148,139 172,027
Financial performance
Profit/(loss) of the parent entity 1,381 (6,417)
Total comprehensive income/(loss) of the parent entity 1,381 (6,417)
There are no contractual or contingent liabilities of the parent as at reporting date (2015: $nil). iSelect Limited has issued bank guarantees and letters of credit to third parties for various operational purposes. It is not expected these guarantees will be called on. The amount of trading guarantees in place at reporting date is disclosed in Note 24.
FiNANCiAL StAteMeNtSIS
EL
EC
T A
NN
UA
L R
EP
OR
T 2
016
110
NOTES TO THE FINANCIAL STATEMENTS CONTINUED
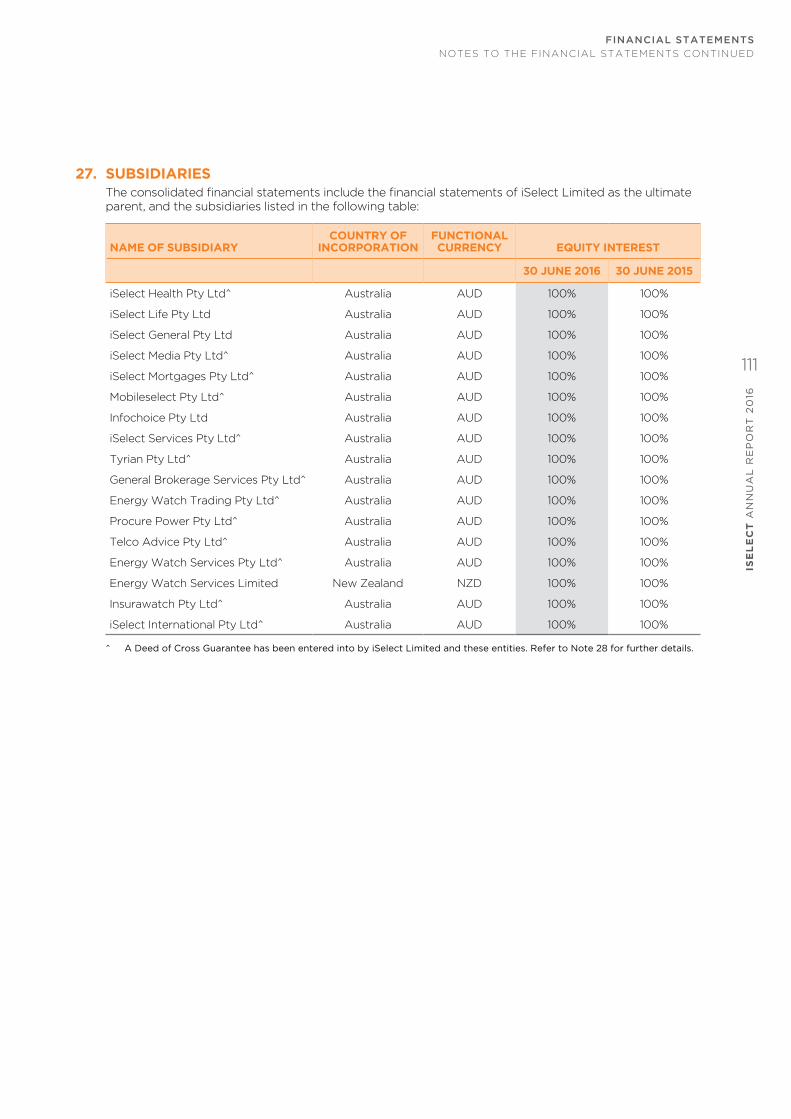
27. SUBSIDIARIESThe consolidated financial statements include the financial statements of iSelect Limited as the ultimate parent, and the subsidiaries listed in the following table:
NAME OF SUBSIDIARYCOUNTRY OF
INCORPORATIONFUNCTIONAL CURRENCY EQUITY INTEREST
30 JUNE 2016 30 JUNE 2015
iSelect Health Pty Ltd^ Australia AUD 100% 100%
iSelect Life Pty Ltd Australia AUD 100% 100%
iSelect General Pty Ltd Australia AUD 100% 100%
iSelect Media Pty Ltd^ Australia AUD 100% 100%
iSelect Mortgages Pty Ltd^ Australia AUD 100% 100%
Mobileselect Pty Ltd^ Australia AUD 100% 100%
Infochoice Pty Ltd Australia AUD 100% 100%
iSelect Services Pty Ltd^ Australia AUD 100% 100%
Tyrian Pty Ltd^ Australia AUD 100% 100%
General Brokerage Services Pty Ltd^ Australia AUD 100% 100%
Energy Watch Trading Pty Ltd^ Australia AUD 100% 100%
Procure Power Pty Ltd^ Australia AUD 100% 100%
Telco Advice Pty Ltd^ Australia AUD 100% 100%
Energy Watch Services Pty Ltd^ Australia AUD 100% 100%
Energy Watch Services Limited New Zealand NZD 100% 100%
Insurawatch Pty Ltd^ Australia AUD 100% 100%
iSelect International Pty Ltd^ Australia AUD 100% 100%
^ A Deed of Cross Guarantee has been entered into by iSelect Limited and these entities. Refer to Note 28 for further details.
ISE
LE
CT
AN
NU
AL
RE
PO
RT
20
16
111
FiNANCiAL StAteMeNtS
NOTES TO THE FINANCIAL STATEMENTS CONTINUED

28. DEED OF CROSS GUARANTEEPursuant to the iSelect Deed of Cross Guarantee (“the Deed”) and in accordance with ASIC Class Order 98/1418, the subsidiaries identified with a ‘^’ in Note 27 are relieved from the requirements of the Corporations Act 2001 relating to the preparation, audit and lodgment of their financial reports.
iSelect Limited and the subsidiaries identified with a ‘^’ in Note 27 together are referred to as the “Closed Group”. The Closed Group, with the exception of General Brokerage Services Pty Ltd, Energy Watch Trading Pty Ltd, Procure Power Pty Ltd, Telco Advice Pty Ltd and Insurawatch Pty Ltd, Energy Watch Services Pty Ltd and iSelect International Pty Ltd entered into the Deed on 26 June 2013.
General Brokerage Services Pty Ltd, Energy Watch Trading Pty Ltd, Procure Power Pty Ltd, Telco Advice Pty Ltd, Energy Watch Services Pty Ltd and Insurawatch Pty Ltd entered into the Deed on 1 July 2014, the date they were acquired as part of the Energy Watch Group acquisition. iSelect International entered the Deed on 8 September 2014. The effect of the Deed is that iSelect Limited guarantees to each creditor payment in full of any debt in the event of winding up any of the entities in the Closed Group.
The consolidated income statement of the entities that are members of the Closed Group is as follows:
30 JUNE 2016CLOSED GROUP
30 JUNE 2015CLOSED GROUP
$’000 $’000
Consolidated income statement
(Loss)/profit from continuing operations before income tax (12,483) 2,401
Income tax expense/(benefit) 4,482 (3,559)
Net loss for the year (8,001) (1,158)
Retained earnings at the beginning of the period
60,677
61,835
Net loss for the year (8,001) (1,158)
Dividends paid (2,533) -
Retained earnings at the end of the year 50,143 60,677
FiNANCiAL StAteMeNtSIS
EL
EC
T A
NN
UA
L R
EP
OR
T 2
016
112
NOTES TO THE FINANCIAL STATEMENTS CONTINUED

The consolidated balance sheet of the entities that are members of the Closed Group is as follows:
30 JUNE 2016CLOSED GROUP
30 JUNE 2015CLOSED GROUP
$’000 $’000
Consolidated balance sheet
Assets
Current assets
Cash and cash equivalents 78,544 58,628
Trade and other receivables 39,558 71,039
Trail commission receivable 16,898 23,900
Other assets 2,993 3,730
Total current assets 137,993 157,297
Non-current assets
Investments 53,711 52,683
Trail commission receivable 51,330 53,006
Property, plant and equipment 8,748 6,993
Intangible assets 15,820 14,877
Total non-current assets 129,609 127,559
total assets 267,602 284,856
Liabilities
Current liabilities
Trade and other payables 40,257 18,932
Provisions 6,888 5,493
Income Tax Payable 236 5,434
Total current liabilities 47,381 29,859
Non-current liabilities
Provisions 1,699 2,276
Net deferred tax liabilities 15,719 16,648
Total non-current liabilities 17,418 18,924
total liabilities 64,799 48,783
Net Assets 202,803 236,073
equity
Contributed equity 150,914 173,713
Reserves 1,746 1,683
Retained earnings 50,143 60,677
total equity 202,803 236,073
ISE
LE
CT
AN
NU
AL
RE
PO
RT
20
16
113
FiNANCiAL StAteMeNtS
NOTES TO THE FINANCIAL STATEMENTS CONTINUED

29. RELATED PARTIES
a. transactions with key management personnelIn accordance with AASB 124: “Related Party Disclosures”, key management personnel (KMP) have authority and responsibility for planning, directing and controlling the activities of the Group. For a list of key management personnel and additional disclosures, refer to the remuneration report on pages 31 to 49.
During financial years 2016 and 2015, the aggregate compensation provided to KMP was as follows:
30 JUNE 2016$
30 JUNE 2015$
Short-term employee benefits 2,798,124 4,123,916
Post-employment benefits 206,575 232,643
Long term employee benefits - 146,410
Share-based payments (400,571) 157,469
Termination benefits 707,558 861,906
3,311,686 5,522,344
During financial year 2016, apart from transactions trivial and domestic in nature and on normal commercial terms and conditions, there were no other transactions with KMP and their related parties.
b. other related party transactionsThe following table provides the total amount of transactions that were entered into with related parties for the relevant financial year.
SALES TO RELATED PARTIES
$
PURCHASES FROM
RELATED PARTIES
$
OTHER TRANSACTIONS WITH RELATED
PARTIES$
BALANCES AT
REPORTING DATE
$
30 June 2016
Associates - iMoney Group service fee - - - -
30 June 2015
Associates - iMoney Group service fee - - 57,003 24,216
30. REMUNERATION OF AUDITORS
30 JUNE 2016$
30 JUNE 2015$
(a) Ernst & Young
Audit and review of financial statements 298,000 288,000
Other assurance services
- Regulatory compliance 36,000 36,000
total remuneration of ernst & Young 334,000 324,000
FiNANCiAL StAteMeNtSIS
EL
EC
T A
NN
UA
L R
EP
OR
T 2
016
114
NOTES TO THE FINANCIAL STATEMENTS CONTINUED

31. SHARED-BASED PAYMENTSThe recognised expense arising from equity settled share-based payment plans during the period is shown in Note 6. During the year ended 30 June 2016, the Group had the following share-based payment plans in place (described below):
• FY2016 Long Term Incentive Plan (FY2016 LTI Plan);
• FY2015 Long Term Incentive Plan (FY2015 LTI Plan);
There have been no cancellations or modifications to any of the plans during the period.
(a) Description of Share-Based payment plans
FY2015 & FY2016 Lti plansThe FY2015 and FY2016 LTI Plans were established as the long-term incentive component of remuneration in order to assist in the attraction, reward and retention of certain employees. The LTI Plans are designed to link long-term reward with the ongoing creation of shareholder value, through the allocation of LTI Plan Shares which are subject to satisfaction of long-term performance conditions.
The key terms of the FY2015 and FY2016 LTI Plans are as follows:
• Participants are invited to join, via a loan based share plan. There is no initial cost to the recipient to participate in the LTI Plan, but the loan must be repaid before or at the time of sale of the shares. The value of the loan is set by applying the market value at grant to the number of units granted. This means the share price must increase over the life of the Plan, and pass the performance tests for there to be any value to the participant between vesting and expiry;
• The LTI Plan Shares are issued to each participant upfront, with the number of LTI Plan Shares determined by dividing the remuneration value by the fair value of the LTI Plan Shares at the time of allocation;
• The LTI Plan Shares will only vest upon satisfaction of conditions set by the Board at the time of the offer;
• If the conditions are met and LTI Plan Shares vest, the loan becomes repayable and participants have up to three years from the date of allocation of the LTI Plan Shares to repay the outstanding balance. The LTI Plan Shares cannot be dealt with (other than to repay the loan) until the loan in respect of the vested LTI Plan Shares is repaid in full;
• Until the LTI Plan Shares vest, the participant is not entitled to exercise any voting rights attached to the LTI Plan Shares. Any dividends paid on the LTI Plan Shares while the loan remains outstanding are applied (on a notional after-tax basis) towards repayment of the loan; and
• In general, if the conditions are not satisfied by the relevant testing date for those conditions, or if the participant ceases employment before the LTI Plan Shares vest, the participant forfeits all interest in the LTI Plan Shares in full satisfaction of the loan.
FY2015 offer under Lti plan
The FY2015 LTI Plan shares were granted in two tranches, with each tranche being subject to one of two performance conditions over the period 1 July 2014 to 30 June 2017.
The first condition is a compound annual growth rate (CAGR) in total shareholder return (TSR). TSR measures the total change in the value of the Shares over the period, plus the value of any dividends and other distributions being treated as if they were reinvested in Shares. In relation to the FY2015 offer, vesting starts where CAGR over the period is 12%. The second condition is a CAGR in earnings per share (EPS) over the period, and again, vesting starts where the CAGR over the period is 12%.
At 12% TSR CAGR and 12% EPS CAGR, 50% of each respective tranche of LTI Plan Shares will vest. All LTI Plan Shares will vest if CAGR over the period is 15% or more for both tranches. Between these points, the percentage of vesting increases on a straight line basis.
In the event that the performance conditions are not met at 30 June 2017, the iSelect Board believes
that the loss of any remuneration value from the LTI Plan is sufficient penalty to the participants.
FY2016 offer under Lti plan
The FY2016 LTI Plan shares granted are subject to the achievement of the performance measure, which is tested once at the end of the 3 year performance period. The FY2016 LTI Plan Grant will be measured against one performance measure – relative Total Shareholder Return (TSR). LTI Plan shares that do not vest after testing of the relevant performance measure lapse, without retesting.
ISE
LE
CT
AN
NU
AL
RE
PO
RT
20
16
115
FiNANCiAL StAteMeNtS
NOTES TO THE FINANCIAL STATEMENTS CONTINUED

31. SHARED-BASED PAYMENTS (CONTINUED)
(a) Description of Share-Based payment plans (continued)
FY2016 offer under Lti plan (continued)
The Shares will only vest if a certain Total Shareholder Return (TSR) relative to the designated comparator group, being the ASX Small Ordinaries Index excluding mining and energy companies, is achieved during the performance period. In relation to the FY2016 offer, vesting starts where relative TSR reaches 50th Percentile.
At 50th Percentile, 50% of LTI Plan Shares will vest. All LTI Plan Shares will vest if relative TSR is above
75th Percentile. Between these points, the percentage of vesting increases on a straight line basis.
Cessation of employment
Except where the Board determines otherwise in a specific instance, where a participant ceases employment with iSelect prior to any conditions attaching to LTI Plan Shares issued under the LTI Plan being satisfied, their LTI Plan Shares will be forfeited and surrendered (in full satisfaction of the loan) and the participant will have no further interest in the LTI Plan Shares. However the Board has discretion to approve the reason for a participant ceasing employment before LTI Plan Shares have vested in appropriate circumstances. Such circumstances may include ill health, death, redundancy or other circumstances approved by the Board.
Where the Board has approved the reason for ceasing employment, it has discretion to determine any treatment in respect of the unvested LTI Plan Shares it considers appropriate in the circumstances – for example, that a pro-rata number of LTI Plan Shares are eligible to vest, having regard to time worked during the performance period and the extent the performance condition has been satisfied at the time of cessation.
In relation to vested LTI Plan Shares that remain subject to the loan, the participant will have 12 months from the date of the cessation of their employment to repay the loan. Once the loan is repaid, the participant may deal in the LTI Plan Shares.
For the purposes of Sections 200B and 200E of the Corporations Act, iSelect Shareholders have approved the giving of any potential benefits under the LTI Plan provided in connection with any future retirement of a participant who holds a ‘managerial or Executive office’ such that for the purposes of the provisions, those benefits will not be included in the statutory limit.
Change in control
Unless the Board determines otherwise, all LTI Plan Shares will vest upon a ‘change of control’, and participants’ loans will become repayable (including in respect of any outstanding loan where LTI Plan Shares had already vested prior to the ‘change of control’). If the share price has fallen, LTI Plan Shares will be forfeited and surrendered in full satisfaction of the loan.
FY2013 Lti planAll LTI Plan shares in the FY2013 LTI Plan did not meet the performance measures and were forfeited during the year ended 30 June 2015.
FiNANCiAL StAteMeNtSIS
EL
EC
T A
NN
UA
L R
EP
OR
T 2
016
116
NOTES TO THE FINANCIAL STATEMENTS CONTINUED

2016 performance Rights planThe key terms of the FY2016 Performance Rights Plans are as follows:
• The Performance Rights Plan allows the Group to issue rights to employee. The number of Performance Rights issued is determined by dividing the remuneration value by the fair value of the Performance Rights at the time of allocation;
• The Performance Rights Plan will only vest upon satisfaction of certain conditions which are set by the Board at the time of the offer;
• If the conditions are met and the Performance Rights vest, each participant is entitled to an ordinary shares for each Performance Right which vests;
• Until the Performance Rights vest and ordinary shares are issued, the participant is not entitled to exercise any voting rights attached to the Performance Rights and is not entitled to any dividends payments;
• In general, if the conditions are not satisfied by the relevant testing date for those conditions, or if the participant ceases employment before the Performance Rights Plan Shares vest, the participant forfeits all interest in the Performance Rights.
FY2016 offer under performance Rights plan
The FY2016 Performance Rights Plan rights granted are subject to the achievement of the performance measure, which is tested once at the end of the 3 year performance period. The FY2016 Performance Rights will be measured against one performance measure – Relative Total Shareholder Return (TSR). The FY2016 Performance Rights that do not vest after testing of the relevant performance measure lapse, without retesting.
Cessation of employment
Except where the Board determines otherwise in a specific instance, where a participant ceases employment with iSelect prior to any conditions attaching to Performance Rights Plan Shares issued under the Performance Rights Plan being satisfied, their Performance Rights will be forfeited and the participant will have no further interest in the Performance Rights. However the Board has discretion to approve the reason for a participant ceasing employment before Performance Rights have vested in appropriate circumstances. Such circumstances may include ill health, death, redundancy or other circumstances approved by the Board.
Where the Board has approved the reason for ceasing employment, it has discretion to determine any treatment in respect of the unvested Performance Rights it considers appropriate in the circumstances – for example, that a pro-rata number of Performance Rights are eligible to vest, having regard to time worked during the performance period and the extent the performance condition has been satisfied at the time of cessation.
For the purposes of Sections 200B and 200E of the Corporations Act, iSelect Shareholders have approved the giving of any potential benefits under the Performance Rights Plan provided in connection with any future retirement of a participant who holds a ‘managerial or Executive office’ such that for the purposes of the provisions, those benefits will not be included in the statutory limit.
Change in control
Upon a ‘Control Event’, the Board has discretion to determine that some or all of the participants’ Performance Rights vest immediately.
ISE
LE
CT
AN
NU
AL
RE
PO
RT
20
16
117
FiNANCiAL StAteMeNtS
NOTES TO THE FINANCIAL STATEMENTS CONTINUED

31. SHARED-BASED PAYMENTS (CONTINUED)
(b) Summary of Shares issued under the Lti plansThe fair value shares granted under the LTI Plan takes into account the terms and conditions upon which the LTI Plan shares were granted. The fair value is estimated as at the date of the grant using a binomial option pricing model for shares subject to an EPS hurdle. For shares subject to a TSR hurdle, a Monte Carlo simulation option pricing model has been used to estimate the fair value.
The expected life of the performance shares is based on historical data and is not necessarily indicative of exercise patterns that may occur. The expected volatility reflects the assumption that the historical volatility is reflective of future trends, which may also not necessarily be reflective of the actual outcome. No other features of shares granted were incorporated into the measurement of fair value.
(i) 2016 Lti planThe following table illustrates the number of, and movements in, shares issued under the 2016 LTI Plan during the year:
30 JUNE 2016NUMBER
30 JUNE 2015NUMBER
outstanding at the beginning of the period
-
-
Granted during the period 2,284,163 -
Forfeited during the period (1,229,823) -
Exercised during the period - -
outstanding at the end of the period 1,054,340 -
GRANT ON3 JULY 2015
GRANT ON 11 DECEMBER
2015
the following table lists the inputs to the model for grants made under the FY2016 Lti plan:
Five day volume weighted average price (VWAP) as at grant date $1.44 $1.15
Exercise price (same as underlying share price at grant date) $1.44 $1.15
Expected life of LTI Plan shares 3 years 3 years
Risk free rate 2.0% 2.2%
Dividend yield 1.3% 1.3%
Expected volatility 30% 30%
GRANT ON3 JULY 2015
GRANT ON 11 DECEMBER
2015
Fair value of 2016 Lti plan shares at grant date:
Relative TSR Class $0.37 $0.23
FiNANCiAL StAteMeNtSIS
EL
EC
T A
NN
UA
L R
EP
OR
T 2
016
118
NOTES TO THE FINANCIAL STATEMENTS CONTINUED

(ii) 2016 performance Rights planThe following table illustrates the number of, and movements in, shares issued under the 2016 Performance Rights Plan during the year:
30 JUNE 2016NUMBER
30 JUNE 2015NUMBER
outstanding at the beginning of the period
-
-
Granted during the period 1,074,099 -
Forfeited during the period (523,024) -
Exercised during the period - -
outstanding at the end of the period 551,075 -
GRANT ON3 JULY 2015
the following table lists the inputs to the model for grants made under the 2016 performance Rights plan:
Five day volume weighted average price (VWAP) as at grant date $1.44
Expected life of Performance Rights Plan 3 years
Risk free rate 2.0%
Dividend yield 1.3%
Expected volatility 30%
GRANT ON3 JULY 2015
Fair value of FY2016 performance Rights plan shares at grant date :
Relative TSR Class $0.87
Retention Rights Class $1.37
ISE
LE
CT
AN
NU
AL
RE
PO
RT
20
16
119
FiNANCiAL StAteMeNtS
NOTES TO THE FINANCIAL STATEMENTS CONTINUED

31. SHARED-BASED PAYMENTS (CONTINUED)
(b) Summary of Shares issued under the Lti plans (continued)
(iii) 2015 Lti planThe following table illustrates the number of, and movements in, shares issued under the 2015 LTI Plan during the year:
30 JUNE 2016NUMBER
30 JUNE 2015NUMBER
outstanding at the beginning of the period
6,522,352
-
Granted during the period - 7,546,080
Forfeited during the period (3,795,226) (1,023,728)
Exercised during the period - -
outstanding at the end of the period 2,727,126 6,522,352
GRANT ON 29 AUGUST
2014
GRANT ON18 NOVEMBER
2014
the following table lists the inputs to the model for grants made under the FY2015 Lti plan:
Five day volume weighted average price (VWAP) as at grant date $1.20 $1.38
Exercise price (same as underlying share price at grant date) $1.20 $1.38
Expected life of LTI Plan shares 3 years 3 years
Risk free rate 2.88% 2.80%
Dividend yield 0% 0%
Expected volatility 30% 30%
GRANT ON 29 AUGUST
2014
GRANT ON18 NOVEMBER
2014
Fair value of 2015 Lti plan shares at grant date :
TSR component $0.26 $0.33
EPS component $0.37 $0.41
FiNANCiAL StAteMeNtSIS
EL
EC
T A
NN
UA
L R
EP
OR
T 2
016
120
NOTES TO THE FINANCIAL STATEMENTS CONTINUED

In accordance with a resolution of the Directors of iSelect Limited we state that:
1. In the opinion of the Directors:
a. the consolidated financial statements and notes that are set out on pages 61 to 120 and the Directors’ report, are in accordance with the Corporations Act 2001, including:
i. giving a true and fair view of the Group’s financial position as at 30 June 2016 and of its performance, for the financial year ended on that date; and
ii. complying with Australian Accounting Standards and the Corporations Regulations 2001; and
iii. there are reasonable grounds to believe that the Group will be able to pay its debts as and when they become due and payable.
2. There are reasonable grounds to believe that the Company and the Group entities identified in Note 27 will be able to meet any obligations or liabilities;
3. The Directors have been given the declarations required by Section 295A of the Corporations Act 2001 from the Chief Executive Officer and the Chief Financial Officer for the financial year ended 30 June 2016;
4. The Directors draw attention to Note 2 to the consolidated financial statements, which includes a statement of compliance with International Financial Reporting Standards; and
5. As at the date of this declaration, there are reasonable grounds to believe that the members of the Closed Group identified in Note 27 will be able to meet any obligations or liabilities to which they are or may become subject, by virtue of the Deed of Cross Guarantee.
On behalf of the Directors
Chris Knoblanche AM Brodie Arnhold Director Director
Melbourne, Melbourne, 30 August 2016 30 August 2016
Directors’ Declaration
ISE
LE
CT
AN
NU
AL
RE
PO
RT
20
16
121
DiReCtoRS' DeCLARAtioN

Independent auditor’s reportiNDepeNDeNt AuDitoR’S RepoRt
ISE
LE
CT
AN
NU
AL
RE
PO
RT
20
16
122

ISE
LE
CT
AN
NU
AL
RE
PO
RT
20
16
123
iNDepeNDeNt AuDitoR’S RepoRt

Additional information required by the Australian Securities Exchange Ltd and not shown elsewhere in this report is as follows. The information is current as of 23 August 2016.
DISTRIBUTION OF SHAREHOLDINGS
SIZE OF HOLDINGFULLY PAID ORDINARY SHARES
NUMBER OF SHARES^
1 – 1,000 74,242
1,001 – 5,000 641,294
5,001 – 10,000 1,146,491
10,001 – 100,000 7,703,617
100,001 and over 228,250,317
^ The total number of shares on issue as at 30 June 2016 was 238,484,515 and 23 August 2016 was 237,815,961.
MARKETABLE PARCELThe number of holders holding parcels of less than $500 was 67 as at 23 August 2016.
SHARE SUBJECT TO VOLUNTARY ESCROWAs at 23 August 2016, there are no shares subject to voluntary escrow.
ASX Additional InformationASX ADDitioNAL iNFoRMAtioN
ISE
LE
CT
AN
NU
AL
RE
PO
RT
20
16
124

TWENTY LARGEST SHAREHOLDERSThe twenty largest shareholders of fully paid ordinary shares as at 23 August 2016 were:
NAME
NUMBER OF ORDINARY
SHARES HELD% OF ISSUED
CAPITAL
HSBC Custody Nominees (Australia) Limited 55,469,645 23.32
Citicorp Nominees Pty Limited 20,511,630 8.63
RBC Investor Services Australia Nominees Pty Limited <PI Pooled A/C> 17,836,960 7.50
J P Morgan Nominees Australia Limited 17,045,349 7.17
BNP Paribas Nominees Pty Ltd <Agency Lending Drp A/C> 14,359,904 6.04
Spectrum VI IS LLC 13,263,454 5.58
National Nominees Limited 9,860,810 4.15
UBS Nominees Pty Ltd 8,469,868 3.56
RBC Investor Services Australia Pty Limited <VFA A/C> 7,539,213 3.17
HSBC Custody Nominees (Australia) Limited - A/C 3 4,819,726 2.03
Argo Investments Limited 4,472,554 1.88
BNP Paribas Nominees Pty Ltd <Agency Lending Collateral> 4,453,000 1.87
CS Fourth Nominees Pty Limited <HSBC Cust Nom Au Ltd 11 A/C> 4,178,258 1.76
RBC Investor Services Australia Nominees Pty Ltd <Picredit> 4,113,728 1.73
BNP Paribas Noms Pty Ltd <Drp> 3,616,795 1.52
Starfish Technology Fund Ii Nominees A Pty Ltd <Trust A A/C> 3,041,470 1.28
Starfish Technology Fund Ii Nominees B Pty Ltd <Trust B A/C> 3,041,470 1.28
Sandhurst Trustees Ltd <Endeavor Asset Mgmt Mda A/C> 2,242,566 0.94
Lambrook Pty Ltd <Raymonde Superfund A/C> 2,080,000 0.87
George Tauber Management Pty Ltd 2,000,000 0.84
The percentage holding of the 20 largest shareholders of iSelect Ltd fully-paid ordinary shares was 85.12%.
SUBSTANTIAL SHAREHOLDERS AS AT 23 AUGUST 2016
NAME
NUMBER OF ORDINARY
SHARES HELD% OF VOTING
RIGHTS
Damien Michael Trevor Waller 31,553,660 13.27
Perpetual Limited and subsidiaries 24,627,129 10.36
Quest Asset Partners Pty Ltd 23,774,294 10.00
Regal Funds Management Pty Limited 22,023,628 9.26
BNP Paribas Pty Limited 13,593,243 5.72
Spectrum VI IS LLC 13,263,454 5.58
UBS Group AG and its related bodies corporate 12,578,819 5.29
ISE
LE
CT
AN
NU
AL
RE
PO
RT
20
16
125
ASX ADDitioNAL iNFoRMAtioN

Corporate Information
ABN 48 124 302 932
DIRECTORS Chris KnoblancheBrodie ArnholdShaun BonèttBridget Fair Damien WallerMelanie Wilson
CHIEF EXECUTIVE OFFICERScott Wilson
COMPANY SECRETARYDavid Christie
REGISTERED OFFICE294 Bay RoadCheltenham Victoria 3192AustraliaPhone: +61 3 9276 8000
PRINCIPAL PLACE OF BUSINESS294 Bay RoadCheltenham Victoria 3192AustraliaPhone: +61 3 9276 8000
SHARE REGISTERComputershare investor Services pty LtdYarra Falls452 Johnston StreetAbbotsford Victoria 3067Australia
iSelect Limited shares are listed on the Australian Securities Exchange (ASX: ISU)
SOLICITORSClayton utz18/333 Collins StreetMelbourne Victoria 3000Australia
BANKERSCommonwealth Bank of Australia385 Bourke StreetMelbourne Victoria 3000Australia
AUDITORSernst & Young8 Exhibition StreetMelbourne Victoria 3000Australia
CoRpoRAte iNFoRMAtioNIS
EL
EC
T A
NN
UA
L R
EP
OR
T 2
016
126

THIS PAGE HAS BEEN LEFT BLANK INTENTIONALLY
ISE
LE
CT
AN
NU
AL
RE
PO
RT
20
16
127

THIS PAGE HAS BEEN LEFT BLANK INTENTIONALLY
ISE
LE
CT
AN
NU
AL
RE
PO
RT
20
16
128

Corporate Directory
ABN 48 124 302 932
DIRECTORS Chris KnoblancheBrodie ArnholdShaun BonèttBridget Fair Damien WallerMelanie Wilson
CHIEF EXECUTIVE OFFICERScott Wilson
COMPANY SECRETARYDavid Christie
REGISTERED OFFICE294 Bay RoadCheltenham Victoria 3192AustraliaPhone: +61 3 9276 8000
PRINCIPAL PLACE OF BUSINESS294 Bay RoadCheltenham Victoria 3192AustraliaPhone: +61 3 9276 8000
SHARE REGISTERComputershare investor Services pty LtdYarra Falls452 Johnston StreetAbbotsford Victoria 3067Australia
iSelect Limited shares are listed on the Australian Securities Exchange (ASX: ISU)
SOLICITORSClayton utz18/333 Collins StreetMelbourne Victoria 3000Australia
BANKERSCommonwealth Bank of Australia385 Bourke StreetMelbourne Victoria 3000Australia
AUDITORSernst & Young8 Exhibition StreetMelbourne Victoria 3000Australia

Australia’s Life Admin StoreAnnual Report 2016
www.iselect.com.au
iSele
ct A
nn
ual R
ep
ort 2
016