australian liquid honey - agrifutures australia · australian liquid honey ... the chemistry...
TRANSCRIPT

Australian Liquid Honey in Commercial Bakery Products A report for the Rural Industries Research and Development Corporation by Bruce D'Arcy, Nola Caffin, Bhesh Bhandari, Nicole Squires, Paul Fedorow, Darren MacKay University of Queensland November 1999 RIRDC Publication No.: 99/145 RIRDC Project No.: UQ-50A
ii
© 1999 Rural Industries Research and Development Corporation. All rights reserved. ISBN 0 642 57919 9 ISSN 1440-6845 Australian Liquid Honey in Commercial Bakery Products Publication No. 99/145 Project No. UQ-50 The views expressed and the conclusions reached in this publication are those of the author and not necessarily those of persons consulted. RIRDC shall not be responsible in any way whatsoever to any person who relies in whole or in part on the contents of this report. This publication is copyright. However, RIRDC encourages wide dissemination of its research, providing the Corporation is clearly acknowledged. For any other enquiries concerning reproduction, contact the Publications Manager on phone 02 6272 3186.
Researcher Contact Details Dr Bruce D’Arcy School of Land and Food Food Science & Technology The University of Queensland Gatton College QUEENSLAND 4345 Phone: 07 5460 1384 Fax: 07 5460 1171 Email: [email protected] Website: http:/www.laf.uq.edu.au/foodsci/index.html
RIRDC Contact Details Rural Industries Research and Development Corporation Level 1, AMA House 42 Macquarie Street BARTON ACT 2600 PO Box 4776 KINGSTON ACT 2604 Phone: 02 6272 4539 Fax: 02 6272 5877 Email: [email protected] Website: http://www.rirdc.gov.au Published in November 1999 Printed on environmentally friendly paper by Canprint

iii
Foreword Honey has the potential to retard the staling of bread and thus lead to large economic savings for the Australian baking industry. While there is some evidence that honey can retard bread staling, more research is needed to convince the Australian baking industry that there are positive effects from incorporating honey in bakery products such as bread. This publication considers some of the research issues involved in the use of honey in bakery products. It examines the effect of Australian liquid honey on the functional properties of bread doughs and cake batters, including dough development and gelatinization of batters and doughs, in addition to the effect of honey on the staling of bread. This project is part of RIRDC’s Honeybee Program which aims to improve the overall image of honey in Australia so that domestic use of liquid honey can be increased particularly by the food industry, the largest manufacturing sector in Australia. Research into the food uses of liquid honey has been funded by RIRDC since 1991, and is continuing at present. This report is a new addition to RIRDC’s diverse range of over 400 research publications, most of which are available for viewing, downloading or purchasing online through our website: • downloads at www.rirdc.gov.au/reports/Index.htm • purchases at www.rirdc.gov.au/pub/cat/contents.html Peter Core Managing Director Rural Industries Research and Development Corporation
iv
Acknowledgments The authors gratefully acknowledge the assistance of Defiance Milling Ltd. which provided access to facilities at the Defiance Milling Research and Development Facility (Acacia Ridge, Queensland, Australia). We further acknowledge the assistance provided during the baking trial by staff at the Defiance Milling Research and Development Facility (Acacia Ridge, Queensland, Australia). Without their assistance the baking trials of this project could not have proceeded. Additionally, the authors acknowledge Capilano Honey Ltd. for their kind donation of honey samples for this research. The Chemistry Department at The University of Queensland is acknowledged for providing access to the differential scanning calorimeter (DSC) used in this study, while Mr David Hunter of The University of Queensland is acknowledged for his kind assistance in using the DSC. Mr Steven Nottingham of the Centre for Food Technology, QDPI, and Mr Alan Lisle of The University of Queensland are thanked for their statistical analysis assistance during the project. Finally, Ms Anne Ford of the Centre for Food Technology, QDPI is thanked for her assistance in planning and running sensory evaluations on bread.

v
Contents Foreword ............................................................................................................................................ iii
Acknowledgments................................................................................................................................. iv
Executive Summary .............................................................................................................................. x
1 Introduction ........................................................................................................................................ 1 1.1 Food Uses of Honey by Processors in Australia ......................................................................... 1
1.1.1 Developing Honey Markets................................................................................................. 2 1.2 Honey .......................................................................................................................................... 3
1.2.1 Honey Production................................................................................................................ 3 1.2.2 General Composition of Honey........................................................................................... 3 1.2.3 Moisture Content of Honey ................................................................................................. 4 1.2.4 Water Activity of Honey ..................................................................................................... 4 1.2.5 Sugar Content of Honey ...................................................................................................... 5 1.2.6 Acids of Honey.................................................................................................................... 5 1.2.7 Proteins and Amino Acids of Honey................................................................................... 5 1.2.8 Minerals of Honey............................................................................................................... 5 1.2.9 Enzymes of Honey .............................................................................................................. 6 1.2.10 Colour of Honey.................................................................................................................. 6 1.2.11 Flavour and Aroma of Honey.............................................................................................. 6 1.2.12 Physical Characteristics of Honey....................................................................................... 7 1.2.13 Calorific Value of Honey .................................................................................................... 7
1.3 Competitive Sweeteners .............................................................................................................. 8 1.3.1 Sucrose as a Sweetener........................................................................................................ 8 1.3.2 Corn Based Sweeteners ....................................................................................................... 8 1.3.3 Dried Honey Powder as a Sweetener .................................................................................. 8
1.4 Functional Properties of Bakery Products ................................................................................... 9 1.4.1 Effect of Sweeteners on the Functional Properties of Doughs and Batters ......................... 9 1.4.2 Factors Affecting the Functional Properties of Bread ....................................................... 11
1.5 Conclusion................................................................................................................................. 21 1.6 The Problem .............................................................................................................................. 21
2. Aims and Objectives........................................................................................................................ 22 2.1 To Determine the Effect of Honey Addition on the Rheological Properties of Bread Doughs During High Shear Mixing........................................................................................................ 22 2.2 To Study the Kinetics of Gelatinization of Plain Bread Doughs Containing Honey ................ 22 2.3 To Study the Viscosity of Gelatinization of Batters Containing Honey ................................... 22
3. Methodology .................................................................................................................................... 23 3.1 The Effect of Honey Addition on the Rheological Properties of Bread Doughs During High Shear Mixing ............................................................................................................................. 23
3.1.1 Introduction ....................................................................................................................... 23 3.1.2 Honey Sample ................................................................................................................... 23 3.1.3 Determination of the Fructose, Glucose, Sucrose and Maltose Composition of Iron Bark Honey ................................................................................................................................ 23 3.1.4 Dough Formulation and Preparation ................................................................................. 24 3.1.5 Mixograph Operation ........................................................................................................ 25 3.1.6 Experimental Design ......................................................................................................... 25 3.1.7 Statistical Analysis ............................................................................................................ 27
3.2 Kinetics of Gelatinization of Plain Bread Doughs Containing Honey ..................................... 27 3.2.1 Introduction ....................................................................................................................... 27
vi
3.2.2 Honey and Model Sugar Solutions.................................................................................... 27 3.2.3 Experimental Design ......................................................................................................... 27 3.2.4 Dough Formulation and Preparation ................................................................................. 28 3.2.5 Determination of Gelatinization of Doughs using Differential Scanning Calorimetry ..... 28 3.2.6 Determination of the Glass Transition Temperature of Dough using Differential Scanning Calorimetry........................................................................................................ 28 3.2.7 Statistical Analysis ............................................................................................................ 28
3.3 Viscosity of gelatinization of batters containing honey ............................................................ 29 3.3.1 Introduction ....................................................................................................................... 29 3.3.2 Honey and Model Sugar Solution ..................................................................................... 29 3.3.3 Experimental Design ......................................................................................................... 29 3.3.4 Batter Formulation and Preparation .................................................................................. 29 3.3.5 Determination of Rheological Properties of Batters.......................................................... 30 3.3.6 Statistical Analysis ............................................................................................................ 30
3.4 The Effect of Honey on the Staling of White Pan Bread as Determined by Physical and Sensory Analyses ...................................................................................................................... 30
3.4.1 Introduction ....................................................................................................................... 30 3.4.2 Materials............................................................................................................................ 30 3.4.3 Experimental Design ......................................................................................................... 31 3.4.4 Baking of Bread................................................................................................................. 31 3.4.5 Texture Measurements on Bread....................................................................................... 31 3.4.6 Sensory Evaluation of Bread ............................................................................................. 32 3.4.7 Statistical Analysis ............................................................................................................ 32
3.5 The Effect of Honey Incorporation on Dough and Bread Properties Under Commercial Bread-Making Conditions ......................................................................................................... 33
3.5.1 Introduction ....................................................................................................................... 33 3.5.2 Honey Sample ................................................................................................................... 33 3.5.3 Determination of Fructose, Glucose, Sucrose and Maltose Composition of Iron Bark Honey ................................................................................................................................ 33 3.5.4 Experimental Design ......................................................................................................... 33 3.5.5 Preparation of Bread.......................................................................................................... 34 3.5.6 Storage of Bread................................................................................................................ 35 3.5.7 Sampling Plan of Slices for Measurement ........................................................................ 35 3.5.8 Texture Measurements on Bread....................................................................................... 36 3.5.9 Other Parameters Determined ........................................................................................... 37 3.5.10 Statistical Analysis ............................................................................................................ 37
4. Results ........................................................................................................................................... 38 4.1 The Effect of Honey Addition on the Rheological Properties of Bread Doughs During High Shear Mixing ............................................................................................................................. 38
4.1.1 Peak Dough Development Time/Dough Mixing Time ..................................................... 38 4.1.2 Dough Strength.................................................................................................................. 40 4.1.3 Dough Stability.................................................................................................................. 41
4.2 Kinetics of Gelatinization of Plain Bread Doughs Containing Honey ...................................... 42 4.2.1 Gelatinization Temperature of Doughs ............................................................................. 42 4.2.2 Gelatinization Energy of Doughs ...................................................................................... 42 4.2.3 Glass Transition Temperature of Doughs.......................................................................... 44
4.3 Viscosity of Gelatinization of Batters Containing Honey ......................................................... 46 4.3.1 Torque Resistance to Shear of Batters at Various Temperatures ...................................... 46 4.3.2 Peak Viscosity (Torque Resistance to Shear at 75 °C) of Batters ..................................... 47 4.3.3 Pasting Temperature of Batters ......................................................................................... 47 4.3.4 Rate of Gelatinization [Temperature at a Viscosity of 500 BU (Brabender Units)] of Batters................................................................................................................................ 48

vii
4.4 The Effect of Honey on the Staling of White Pan Bread as Determined by Physical and Sensory Analyses ...................................................................................................................... 49
4.4.1 Proofing Performance of Dough ....................................................................................... 49 4.4.2 Texture of Bread................................................................................................................ 49 4.4.3 Sensory Evaluation of Bread ............................................................................................. 52
4.5 The Effect of Honey Incorporation on Dough and Bread Properties under Commercial Bread- Making Conditions .................................................................................................................... 59
4.5.1 Proofing Performance of Doughs...................................................................................... 59 4.5.2 Structure of Bread ............................................................................................................. 59 4.5.3 Effect of Storage on Bread ................................................................................................ 63
5. Discussion......................................................................................................................................... 65 5.1 Effect of Honey Addition on the Rheological Properties of Bread Doughs During High Shear Mixing ....................................................................................................................................... 65
5.1.1 Peak Dough Development Time/Dough Mixing Time ..................................................... 65 5.1.2 Dough Strength.................................................................................................................. 65 5.1.3 Dough Stability.................................................................................................................. 66 5.1.4 Possible Causes of the Positive Effect of Honey Addition on Dough Development Relative to Sugar Addition ................................................................................................ 66 5.1.5 Conclusions ....................................................................................................................... 66
5.2 Kinetics of Gelatinization of Plain Bread Doughs Containing Honey ...................................... 67 5.2.1 Gelatinization Temperature of Doughs ............................................................................. 67 5.2.2 Gelatinization Energy of Doughs ...................................................................................... 67 5.2.3 Glass Transition Temperature of Doughs.......................................................................... 68 5.2.4 Conclusions ....................................................................................................................... 68
5.3 Viscosity of Gelatinization of Batters Containing Honey ......................................................... 69 5.3.1 Peak Viscosity ................................................................................................................... 69 5.3.2 Pasting Temperature and Rate of Gelatinization of Batters .............................................. 69 5.3.3 Conclusions ....................................................................................................................... 69
5.4 The Effect of Honey on the Staling of White Pan Bread as Determined by Physical And Sensory Analyses ...................................................................................................................... 70
5.4.1 Proofing performance of Dough........................................................................................ 70 5.4.2 Texture of Bread................................................................................................................ 70 5.4.3 Sensory Evaluation of Bread ............................................................................................. 71 5.4.4 Conclusions ....................................................................................................................... 71
5.5 The Effect of Honey Incorporation on Dough and Bread Properties Under Commercial Bread- Making Conditions .................................................................................................................... 71
5.5.1 Proofing Performance........................................................................................................ 72 5.5.2 Cellular Structure of Bread................................................................................................ 72 5.5.3 Effect of Storage on Bread ................................................................................................ 73 5.5.4 Conclusions ....................................................................................................................... 73
6. Implications...................................................................................................................................... 74
7. Recommendations ........................................................................................................................... 76
8. Publications from Project ............................................................................................................... 77
9 References ......................................................................................................................................... 78
10. Appendix ........................................................................................................................................ 83

viii
List of Tables Table 1.1 Number of commercial products in each food category containing honey found during a
1991 food industry survey (Squires, 1991) ......................................................................... 2 Table 1.2 General composition of English and Australian honey (adapted from Egan et al., 1981) .. 4 Table 1.3 Colour grades of honey and their corresponding pfund values (Honey Corporation of
Australia (Anon, Honey Corporation of Australia, Pers. Comm. 1992) ............................. 7 Table 1.4 Physical properties of honey (Crane, 1974) ........................................................................ 7 Table 3.1 Composition of Queensland liquid iron bark honey, Gemsweet 42® and dried honey ..... 31 Table 3.2 Sugar composition of iron bark honey .............................................................................. 33 Table 4.1 Mean gelatinization temperatures (°C) of doughs containing various levels of honey or a
model sugar solution ......................................................................................................... 42 Table 4.2 Mean glass transition temperatures (°C) of doughs containing various levels of honey or a
model sugar solution ......................................................................................................... 44 Table 4.3 Mean peak viscosities of batters containing various levels of honey or a model sugar
solution .............................................................................................................................. 47 Table 4.4 Mean pasting temperatures of batters containing various levels of honey or a model sugar
solution .............................................................................................................................. 48 Table 4.5 Mean temperature (°C) at a viscosity of 500 BU for batters containing various levels of
honey or a model sugar solution........................................................................................ 49 Table 4.6 Mean sensory scores for characteristics of bread containing liquid honey, Gemsweet 42®
(sugar) or dried honey (% w/w flour, dry basis)............................................................... 53 Table 4.7 The probability, calculated by analysis of variance, that source (honey or sugar) and
addition level affect the cellular elongation, crumb fineness, crust thickness and crust contrast of bread ................................................................................................................ 60
Table 4.8 Mean crumb fineness of bread containing honey or a model sugar solution at various levels.................................................................................................................................. 61
Table 4.9 Mean crust thickness of bread containing honey or a model sugar solution at various levels.................................................................................................................................. 61
Table 4.10 Mean crust contrast of bread containing honey or a model sugar solution at various levels..................................................................................................................... 62

ix
List of Figures Figure 3.1 Representative mixograph showing the mixing time, dough development curve
width and dough breakdown curve width ..................................................................... 26 Figure 3.3 Sampling plan for each slice for texture and water activity measurements .................. 36 Figure 4.1 Mean peak dough development time (mixing time; min) of doughs made using standard
bakers flour with increasing levels of honey compared to the mixing time of doughs containing increasing levels of a model sugar solution................................................. 39
Figure 4.2 Mean strength (BU) of doughs made using standard bakers flour with increasing levels of honey compared to the dough strength (BU) of doughs containing increasing levels of a model sugar solution .............................................................................................. 40
Figure 4.3 Mean stability (min) of doughs made using standard bakers flour with increasing levels of honey compared to the dough stability (min) of doughs containing increasing levels of a model sugar solution .............................................................................................. 41
Figure 4.4 Mean gelatinization energy (J/g) of doughs made using standard bakers flour with increasing levels of honey compared to the gelatinization energy (J/g) of doughs containing increasing levels of a model sugar solution................................................. 43
Figure 4.5 Example differential scanning calorimetry (DSC) thermograms for determination of glass transition temperatures for: (a) doughs with 8% honey; and (b) doughs with 4% model sugar solution ..................................................................................................... 45
Figure 4.6 Comparison of mean viscosities during heating of batters made from high-ratio flour using honey or a model sugar solution at various levels. .............................................. 46
Figure 4.7 Mean crumb firmness of bread containing liquid honey, Gemsweet 42® (sugar) or dried honey as average texture measurements (graph points) versus storage time ....... 50
Figure 4.8 Mean texture measurements of bread containing 3% liquid honey or 3% sugar, and a control bread (no sugar or honey) based on five individual points on a slice (% w/w flour, dry basis) (Means are means of replications) .................................................... 51
Figure 4.9 Mean sensory scores of crust colour of bread containing liquid honey, Gemsweet 42® (sugar) or dried honey at Day 2 of storage .................................................................... 54
Figure 4.10 Mean sensory scores of odour ‘yeastiness’ of bread containing liquid honey, Gemsweet 42® (sugar) or dried honey at Day 1 of storage ............................................................ 55
Figure 4.11 Changes in mouthfeel ‘moistness’ of bread containing liquid honey, Gemsweet 42® (sugar) or dried honey during storage ........................................................................... 56
Figure 4.12 Changes in ‘overall quality’ of bread containing liquid honey, Gemsweet 42® (sugar) or dried honey during storage........................................................................................ 57
Figure 4.13 Bi-plot of mean sensory results for bread containing liquid honey, Gemsweet 42® (sugar) or dried honey, based on seven sensory parameters and showing the separation of treatments across 4 days storage ............................................................................... 58
Figure 4.14 Comparison of the changes in the proofing volumes (mL) of doughs containing honey or a model sugar solution at various levels taken at 7 different times during proofing (0, 10, 20, 30, 40, 50, 60 min) ........................................................................ 59
Figure 4.15 Comparison of the means for cellular elongation (SE=0.009), crust thickness (SE = 0.006), crust contrast (SE = 0.026) and crumb fineness (SE = 10.9) for bread containing honey or a model sugar solution at various levels ....................................... 60
Figure 4.16 Comparison of the mean firmness (averaged over the 5 points of measurement) of bread containing honey or a model sugar solution at various levels ............................. 63
Figure 4.17 Comparison of the mean water activity of bread containing honey or a model sugar solution at various levels ............................................................................................... 64

x
Executive Summary It is the aim of the Australian honey industry to improve the overall image of liquid honey amongst the food industry in Australia, so that domestic use of liquid honey can be increased in this manufacturing sector, the largest in Australia. Dried honey is used extensively by the food industry, but it is not similar in composition to liquid honey. The Australian honey industry would prefer to increase its direct sales of liquid honey to food processors, rather than via dried honey manufacturers. Previous research has suggested that liquid honey (not dried honey) has the potential to retard the staling of bread, and thus lead to large economic savings for the Australian baking industry, the largest food sector and the one most likely to increase its use of honey should there be evidence of its benefits. Therefore, it was the aim of this project to investigate the use of Australian liquid honey in commercial bakery products, and to determine the effect of the incorporation of honey on the quality and functional properties of bakery products; and to communicate research findings to the Australian food processing industry. Two previous RIRDC funded projects (1990-1996 involving Ms Nicole Squires, and Mrs Alison Hepworth, Dr Bruce D’Arcy and Ms Nola Caffin) provide background to this project. Through a food industry survey (Ms Squires: 1990-1993), it was identified that the baking industry was most likely to use large quantities of honey in food manufacturing processes. However, a review of the literature has shown that little data are available on the use of sugars and none on the use of honey in bakery products. For honey to be used to retard staling, data on the effect of honey on aspects of the baking process need to be studied, eg. dough mixing and gelatinization. As a result, five studies were undertaken to overcome some of these deficiencies. The first study examined the effect of honey addition, at various levels, on the rheological properties of bread doughs during high shear mixing in order to determine: firstly, the maximum practicable level of honey that can be added to the bread dough to still support dough development; secondly, the effect of honey on the dough mixing time; thirdly, the effect of honey on dough strength; and fourthly, the effect of honey on dough stability. Rheological properties such as development time (mixing time), strength and stability of doughs containing honey were measured with a 35g National Mixograph, and then compared to those properties of a control dough sample (containing no honey or sugar) and dough samples containing various levels of a model sugar solution (consisting of the same levels of glucose, fructose, sucrose and maltose as the honey used). Here, it was found that the addition of honey at levels of 6%-10% (w/w flour, dry basis) produced doughs that had a significantly shorter (P<0.05) mixing time than doughs containing the model sugar solution at the same levels. These results suggest that honey addition introduces nonsugar substances into dough that decrease the cross-linking (primarily disulphide bonding) present in the protein matrix during dough development. This effect of honey leads to smaller proteins that hydrate more easily and, thus, produce shorter mixing times than would sugars alone. However, it was also found in this study that the addition to dough of any level of honey or the model sugar solution did not produce a significantly different (P>0.05) mixing time from that of the control (0%) dough. In conclusion, the results suggest that the non-sugar components of the honey are overriding the slowing of the dough development process produced by sugars, and not producing any undesirable effects on the mixing time of bread doughs. Thus, honey is a viable alternative, with positive effects relative to sugars, as an ingredient in dough. The fact that doughs with 4% honey were significantly stronger (P<0.05) than doughs containing 6% and 8% honey, while doughs containing a 3% level of the model sugar solution were significantly stronger (P<0.05) than doughs containing 6%, 8% and 9% levels of the model sugar solution, suggest that honey is having an effect on dough strength even though it is not consistent. Lower levels of honey addition produce stronger doughs. A study of dough stability after reaching peak dough development found that doughs with honey levels of 5%-10% were stable for significantly longer times (P<0.05) during overmixing than doughs containing 6%-10% levels of the model sugar solution, while both were not significantly different (P>0.05) from the control (0%) dough. In conclusion, the
xi
overall result for the baking industry is that honey addition does not adversely affect dough strength or stability, and in fact may enhance these, suggesting it is a good alternative to sugar addition. The second study examined the kinetics of gelatinization of plain bread doughs containing various levels of liquid honey, in order to determine: firstly, the maximum practicable level of honey that can be added to doughs to support gelatinization; secondly, the effect of honey addition on the gelatinization temperature of bread doughs; thirdly, the effect of honey addition on the gelatinization energy of bread doughs; and fourthly, the effect of honey addition on the glass transition temperature of bread doughs. The rheological properties and glass transition temperatures of doughs containing honey were measured with a Perkin Elmer DSC-7 differential scanning calorimeter (DSC) and then compared to the same properties of a control dough sample (containing no honey or sugar) and dough samples containing various levels of a model sugar solution. Gelatinization is the process where starch granules absorb water and swell as the temperature is increased. Rheological changes in starch aid in crumb setting, and are essential for the crumb structure. In study one, although only the addition of 6% levels of any sugar mixture (honey or model sugar solution) yielded significantly higher (P<0.05) gelatinization temperatures than the control (0%), the addition of honey does not produce significantly higher (P>0.05) gelatinization temperatures than the addition of a model sugar solution. In low water systems, such as in bread, it is important that the gelatinization temperature is not increased too much. In this study, the gelatinization temperature was raised by less than 10 °C for 6% addition levels of honey or the model sugar solution. However, the addition of substances that delay starch gelatinization, such as sugars and honey may improve baking performance since such a delay would prolong the volume expansion in the oven. Furthermore, the fact that all other addition levels of honey or the model sugar solution did not significantly affect (P>0.05) the gelatinization temperature of doughs, suggests that on the whole, honey or sugar can be added to dough without adversely affecting gelatinization. In the second study, adding honey to dough significantly reduced (P<0.05) the energy required for dough gelatinization compared to adding the model sugar solution. The fact that high levels of honey addition (6%-8%) significantly lowered (P<0.05) the gelatinization energy of doughs relative to the addition of the model sugar solution at levels of 6% or lower (including the 0% control) and the addition of honey at levels of 4% or lower (including the 0% control), indicates that adding 6-8% honey to dough will yield faster baking times than using a sugar mixture and lower levels of honey addition. The results for the glass transition temperature work on doughs suggested there is no significant difference (P>0.05) in the glass transition temperatures of doughs containing honey relative to those containing the model sugar solution. The glass transition temperature (Tg) measured in this study seems to be unaffected by the addition of sugars. To affect the Tg of a system, the various components should be compatible, which did not occur in this study. Therefore, the observed Tg value is probably the Tg of the sugar or honey added. In conclusion, the significant result from this Tg experiment is that the interaction between sugar and a starch system is only induced at the gelatinization temperature, when the starch granules start swelling. The third study determined the effect of honey on the rheological properties of high-ratio flour-water batter during programmed heating, in order to quantify the effect of honey on the viscosity of a batter during gelatinization. Various levels of honey were added to batter, and the torque resistance to shear, during the programmed (1.5 °C/min) heating of each batter from 50 °C to 95 °C, was measured with a Haake-Brabender visco-amylograph. These results were compared to those of a control batter sample (containing no honey or sugar), and batters containing various levels of a model sugar solution. Other properties determined from the data were the pasting temperature, temperature at 500 BU (rate of gelatinization), and peak viscosity (torque resistance to shear at 75 °C). The controlling of starch gelatinization in a cake system is important in producing a porous, noncollapsing cake structure. During the baking of batter products such as cakes, the batter undergoes a transition from colloidal foam to a solid porous starch matrix.

xii
The addition of a model sugar solution at levels of less than 180% did not significantly change (P>0.05) the peak viscosities of the batters relative to each other and to the control (0%). Only at a model sugar solution level of 180% did the peak viscosity significantly increase (P<0.05). However, on addition of honey at levels of 100% and 140%, batters were produced with significantly higher (P<0.05) peak viscosities than batters with the same levels of a model sugar solution and than the control batter (0%). Thus, use of honey yields a thicker (more viscous) batter after gelatinization than does a mixture of sugars. This increase in viscosity may be due to a change in the glass transition temperature of starch induced by honey. The thicker batter (from honey addition) equates to a structure that is more likely to solidify before a heat-induced collapse occurs during baking. This is of advantage to the baking industry. The fourth study involved the determination of the ability of liquid iron bark honey, Gemsweet 42® (fructose:glucose syrup) and dried honey to retard the bread staling process. This involved a reanalysis of the data of RIRDC Project UQ-54A, an experiment undertaken by Ms Nicole Squires. The reanalysed results are being reported here as they are of interest to the RIRDC and the food industry. The effects on staling were measured by objective physical texture measurement (TA-XT2 analyser), and by sensory evaluation using trained panellists. Samples containing 3% honey (w/w dry basis) consistently stood apart from the other treatments throughout this evaluation. The physical texture analysis found that the loaves containing 3% honey were of significantly better quality (P<0.05) in terms of texture measurements, and taste panel results rated 3% honey loaves as significantly better (P<0.05) in terms of ‘overall quality’ than the control, 1% honey, 4% honey and 5% honey on Day 3 of storage. Loaves containing 3% honey were significantly softer (less firm) (P<0.05) on all days than loaves containing 3% sugar and than loaves containing no honey or sugar (control) when the results for individual texture measuring points were considered separately. The loaves containing 3% honey were significantly softer (P<0.05) at Day 0 (just after baking) and stayed softer at all storage days. The overall result was at least a 20 h extension of shelf-life. This result would be of economic benefit to the baking industry since it would delay and reduce the size of the daily return or disposal of out-of-date bread by bakeries and supermarkets. Finally, the 3% honey level that retards bread staling was not detected by the sensory panel in terms of sweetness and, thus, could be added to bread by the baking industry to retard staling. The fifth study was undertaken to determine the effect of honey incorporation on dough and bread properties under commercial bread-making conditions. Properties of doughs such as proofing performance (proofing time and volume) were determined. These results were then compared to those properties of a control dough sample (containing no honey or sugar) and dough samples containing various levels of a model sugar solution. The doughs containing honey were then baked, and the properties of bread such as texture (TA-XT2 analyser), water activity (Novasina water activity meter), cellular structure (crumb cellular elongation and fineness using a scanner), and crust thickness and contrast (using a scanner) were compared to a control bread sample (no honey or sugar) and to bread samples containing various levels of a model sugar solution. With respect to proofing performance, there was no significant effect (P>0.05) on the proof time or volume through the use of honey or the model sugar solution in doughs, which would not add to the cost of baking. The grain of a loaf of bread is not a random collection of cells. Cell elongation is a measure of the dough strength and a measure of the chewiness of the bread. The only effect on the elongation of the crumb cells from the honey addition was that the cells were significantly less elongated (P<0.05) in bread containing honey compared to bread containing the model sugar solution. However, there was no significant difference (P>0.05) in elongation of the crumb cells between the control bread and bread containing any level of honey or the model sugar solution. Furthermore, the addition honey or sugars did not produce any significant effect (P>0.05) on the crumb fineness. The crust of bread forms a barrier against the loss of water and flavour from the loaf. Honey addition did not significantly (P>0.05) affect the crust thickness relative to the addition of the model sugar solution. However, bread made with 3% and 4% honey had crusts that were significantly thicker (P<0.05) than bread made with honey levels of 2% or lower. Thus, the addition of honey to doughs produces bread
xiii
loaves with thicker crusts, which may aid in the prevention of moisture loss from the loaf. In conclusion, honey can be added to bread without adversely affecting crumb structure. The critical determinate of bread staling is the firmness of the crumb. This study found that there was no significant difference (P>0.05) between the firmness of the honey and model sugar solution treatments on any day of storage, in contrast to the fourth study detailed earlier. This anomaly arises from the fact that only the average texture of the five texture measuring points per slice was statistically analysed in the fifth study. As expected, for all combinations of addition levels of honey or the model sugar solution, there was a significant increase (P<0.05) in firmness (decrease in softness) with an increase in storage time. Finally, the pattern of the overall water activity of the bread loaves during storage is interesting. It was found that the water activity of bread containing honey or the model sugar solution significantly increased (P<0.05) after 48 and 72 h relative to the control (0%) bread at 0 h (just after being baked), although there was no significant effect of increasing levels of honey or sugar at any storage time. This result suggests honey or sugar(s) may be having an effect on the level of available water in the loaf, although the reason for this increase is not clear. In conclusion, compared to a plain formulation, there is no discernible difference in those bread loaves made using honey and those made using a model sugar solution. The overall implication of the data and conclusions arising from this project is that the Australian baking industry now has some data on the effect of honey on most parts of the baking and staling processes of bread. This data will enable the Australian baking industry to seriously consider the use of increased amounts of Australian liquid honey in the domestic manufacture of commercial bakery products such as bread. Such an occurrence will be of great benefit to the Australian honey industry since increased domestic sales of honey to industry may result.

1
1 Introduction It is the aim of the Australian honey industry to improve the overall image of liquid honey amongst the food industry in Australia, so that domestic use of liquid honey can be increased in this manufacturing sector, the largest in Australia. Dried honey is used extensively by the food industry, but it is not similar in composition to liquid honey. The Australian honey industry would prefer to increase its direct sales of liquid honey to food processors, rather than via dried honey manufacturers. Previous research has suggested that liquid honey (not dried honey) has the potential to retard the staling of bread, and thus lead to large economic savings for the Australian baking industry, the largest food sector and the one most likely to increase its use of honey should there be evidence of its benefits. Therefore, it was the aim of this project to investigate the use of Australian liquid honey in commercial bakery products, and to determine the effect of the incorporation of honey on the quality and functional properties of bakery products; and to communicate research findings to the Australian food processing industry. Two previous RIRDC funded projects (1990-1996 involving Ms Nicole Squires, and Mrs Alison Hepworth, Dr Bruce D’Arcy and Ms Nola Caffin) have led to the development of this project and provide background to this project. Through a food industry survey (Ms Squires: 1990-1993), it was identified that the baking industry was most likely to use large quantities of honey in food manufacturing processes. Such findings led to a study of the incorporation of liquid honey in dry food premixes (Ms Nicole Squires: 1990-1993), since premixes are extensively used during the production of bakery products by the Australian baking industry. On completion of this project, further research in two areas began in the year 1994-95. The first project was an extension of the premix work, which was funded by RIRDC as project UQ-54A. It was completed by Ms Nicole Squires in 1996 (Caffin et al., 1996). The second project is the one detailed in this final report. Additionally, this chapter provides background to the research undertaken by reviewing the literature involving honey and its use in bakery products. Firstly, the composition of honey is reviewed as this has some bearing on the effect that honey has on the functional properties of such products. Secondly, the staling of bread is reviewed. Based on the previous work of Ms Nicole Squires (Caffin et al., 1996), it is possible that the addition of honey retards the staling of bread. The main reason to continue the research of Nicole Squires in this RIRDC project was to extend the investigation of the use of Australian liquid honey in commercial bakery products, and to determine the effect of the incorporation of honey on the quality and functional properties of bakery products. Thus, this review of the literature concentrates on the most important functional property of bakery products, namely staling. While little work has been done on the effects of honey, in this respect, outside Australia, a review of other factors that affect staling is included as background to the project. 1.1 Food Uses of Honey by Processors in Australia A study was done (Squires, 1991; Hepworth and Squires, 1991, 1992) to re-evaluate the position of the industrial market for honey in the early 1990’s. Table 1.1 summarises the numbers of products containing honey that were identified during the survey. Most manufacturers (54.8%) indicated that they used blended honey in their applications and 21.4% used straightline floral varieties. Dried honey was used by four manufacturers (9.5%) and accounted for 3.7 tonnes per annum which was 0.27% of the total honey volume used. Additionally, the survey (Squires, 1991; Hepworth and Squires, 1991, 1992) indicated that the volumes of honey used by industry were approximately 10% of the total honey market. This survey accounted for 1351.5 tonnes of honey, which is much higher than that of Rath (1984). Analysis of the collected data suggested that there were few products in the Australian market place in the areas of meat products, bread
2
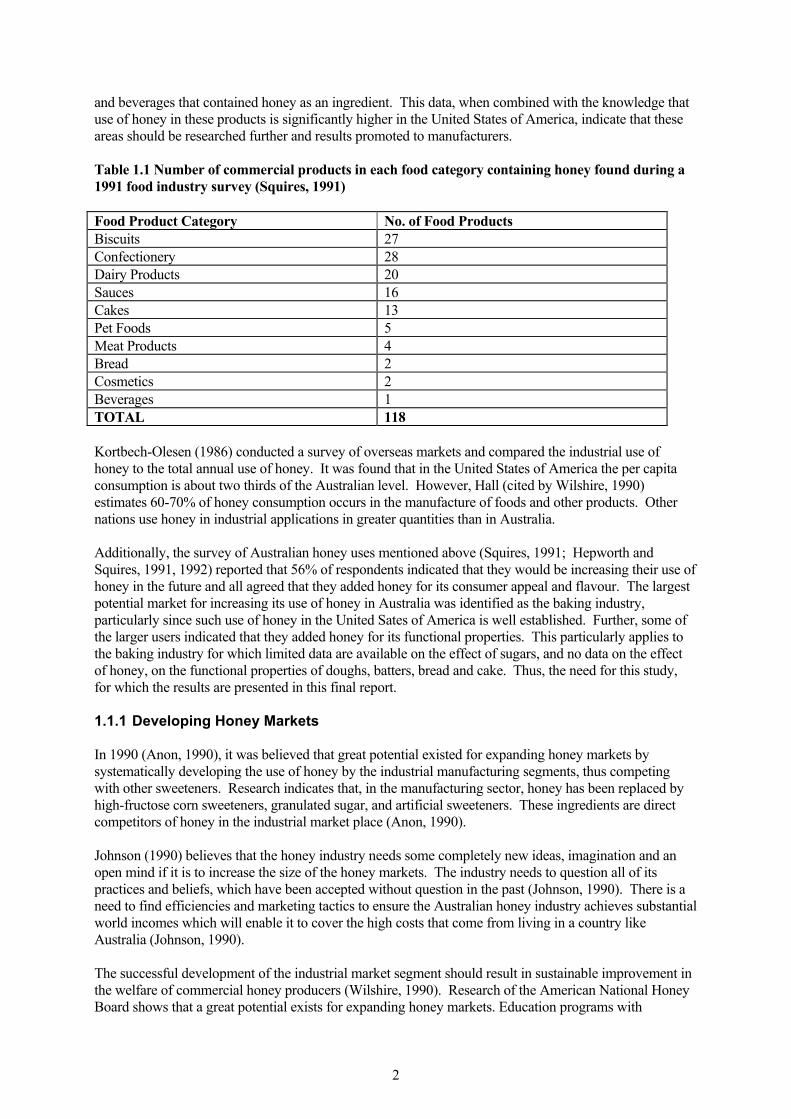
and beverages that contained honey as an ingredient. This data, when combined with the knowledge that use of honey in these products is significantly higher in the United States of America, indicate that these areas should be researched further and results promoted to manufacturers. Table 1.1 Number of commercial products in each food category containing honey found during a 1991 food industry survey (Squires, 1991) Food Product Category No. of Food Products Biscuits 27 Confectionery 28 Dairy Products 20 Sauces 16 Cakes 13 Pet Foods 5 Meat Products 4 Bread 2 Cosmetics 2 Beverages 1 TOTAL 118 Kortbech-Olesen (1986) conducted a survey of overseas markets and compared the industrial use of honey to the total annual use of honey. It was found that in the United States of America the per capita consumption is about two thirds of the Australian level. However, Hall (cited by Wilshire, 1990) estimates 60-70% of honey consumption occurs in the manufacture of foods and other products. Other nations use honey in industrial applications in greater quantities than in Australia. Additionally, the survey of Australian honey uses mentioned above (Squires, 1991; Hepworth and Squires, 1991, 1992) reported that 56% of respondents indicated that they would be increasing their use of honey in the future and all agreed that they added honey for its consumer appeal and flavour. The largest potential market for increasing its use of honey in Australia was identified as the baking industry, particularly since such use of honey in the United Sates of America is well established. Further, some of the larger users indicated that they added honey for its functional properties. This particularly applies to the baking industry for which limited data are available on the effect of sugars, and no data on the effect of honey, on the functional properties of doughs, batters, bread and cake. Thus, the need for this study, for which the results are presented in this final report. 1.1.1 Developing Honey Markets In 1990 (Anon, 1990), it was believed that great potential existed for expanding honey markets by systematically developing the use of honey by the industrial manufacturing segments, thus competing with other sweeteners. Research indicates that, in the manufacturing sector, honey has been replaced by high-fructose corn sweeteners, granulated sugar, and artificial sweeteners. These ingredients are direct competitors of honey in the industrial market place (Anon, 1990). Johnson (1990) believes that the honey industry needs some completely new ideas, imagination and an open mind if it is to increase the size of the honey markets. The industry needs to question all of its practices and beliefs, which have been accepted without question in the past (Johnson, 1990). There is a need to find efficiencies and marketing tactics to ensure the Australian honey industry achieves substantial world incomes which will enable it to cover the high costs that come from living in a country like Australia (Johnson, 1990). The successful development of the industrial market segment should result in sustainable improvement in the welfare of commercial honey producers (Wilshire, 1990). Research of the American National Honey Board shows that a great potential exists for expanding honey markets. Education programs with
3
manufacturers will help to regain honey’s market share and encourage new products utilising honey (Anon, 1990). Boogs (1990) discussed that honey needs to be promoted as being a refined, natural sweetener. By doing this, it should target shoppers who want unadulterated natural foods (Boogs, 1990). In the early 1990’s, the Australian Honey Board believed that honey had a bright future because demand would increase with consumer awareness of healthy eating and ‘green’ products (Boogs, 1990). In conclusion, by focusing on the advantages of honey in terms of purity and wholesomeness, the Australian honey industry will be in a better position to compete for joules in the diet. Increasing the industrial uses for honey will require the application of considerable resources in terms of man power and capital in order to identify and exploit opportunities (Wilshire, 1990). Observations of overseas markets show that there is potential growth for honey used for manufacturing purposes at prices well above those achievable from export sales of bulk honey. Wilshire (1990) believes that the identification and exploitation of technical research and marketing skills will require considerable financial resources and time, but will be necessary to increase the use of honey in Australia. 1.2 Honey White and Underwood (1974) describe honey as a sweet viscous fluid made by honeybees from the nectar that they obtain from plants, mainly flowers. It is ready to be consumed as produced and is essentially a fructose solution supersaturated with glucose (White and Underwood, 1974). 1.2.1 Honey Production Honey is produced in temperate regions throughout Australia and approximately 75% of Australian honey originates from natural Eucalypt forests (AHB, 1990). Due to the climate, which ensures a flow of honey throughout the year, and the vast number of floral sources available to honeybees, beekeeping in Australia is seen to be unique (AHB, 1990). To produce honey, the forager honeybees gather pollen and nectar from nearby plants, store it in their honey sacs and return to the hive. After carrying the nectar solution to the hive, the honeybee ripens the ‘nectar’ fluid and stores it in the comb as food. Sucrose in the nectar is hydrolysed, and at this point the solution is concentrated to about 82% solids (w/w) by the beating of the honeybee’s wings (Ruëgg and Blanc, 1980). This process enables the honeybees to concentrate the solution, without crystallization, to a supersaturated syrup with a moisture content as low as 12-14% (w/w basis). This concentrated solution now resembles honey as known to consumers. Ruëgg and Blanc (1980) noted that the enzymatic hydrolysis of sucrose liberates glucose and the highly soluble fructose. As soon as the honeycomb in the hive is filled with honey it is capped with beeswax and is ready to be harvested. At harvest, the beekeeper removes the wax from the hive. The honey is then extracted from the honeycomb using a centrifuge. The honey is sent to honey packers where it is strained to remove any extraneous matter and bottled. The objectives of processing are to stabilise the honey, keeping it free from fermentation and in the desired physical state, be it liquid or finely granulated (White and Underwood, 1974). Honey production and packing facilities are located in all states of Australia. 1.2.2 General Composition of Honey Honey is not just a sugar, rather it is a complex mixture containing more than 180 identified substances, including flavouring materials, minerals, acids, enzymes and pigments (Anon, 1990). The general characteristics of honey - sugar composition, colour and flavour - depend upon its floral source (White and Underwood, 1974). It is believed (Anon, 1987) that the floral source of honey determines its physical and chemical composition. The variable characteristics of honey are a result of the variable nutrient composition of nectar produced by the variable soil composition. Additionally, the moisture content is thought to vary in this way (White and Underwood, 1974).

4
White and Underwood (1974) suggested that the physical characteristics and behaviour of honey are due to its sugars. However, the minor components such as flavouring materials, pigments, acids and minerals are largely responsible for the differences among individual types (White and Underwood, 1974). For example, honeys produced from Eucalypts are known to be among the densest in the world. The general composition and properties of honey are detailed in Table 1.2, which compares literature values for English honey with those of Australian varieties. Table 1.2 General composition of English and Australian honey (adapted from Egan et al., 1981) Component English Australian Moisture (% w/w basis) 15.7 - 26.7 16 - 18 Ash (%d.b.) 0.04 - 0.38 As for English Nitrogen (% d.b.) 0.05 - 0.38 As for English Reducing sugars (% d.b.) 85 - 94.9 As for English Specific rotation -20.4 - +4.820D Not available Dextrin 1.70 - 5.22 Not available Free acid (mL 0.1M NaOH/100g)
12.9 -58.0 12 - 40
PH 3.8 - 5.6 As for English The results in Table 1.2 demonstrates the similarity of Australian honey to that of English honey in terms of chemical composition. However, the large range in terms of moisture for English honeys compared to Australian varieties is noted. 1.2.3 Moisture Content of Honey The moisture content of honey can vary from as low as 12% to as high as 27% w/w basis (Egan et al., 1981) with Australian honeys usually between 16-18% (Table 1.2). A study examining a large number of Australian honeys is presently underway in Australia and will further add to the limited knowledge concerning the moisture composition of unifloral Australian honeys (Mossel and D’Arcy, 1999). The low moisture content and high osmotic pressure of honey prevents the growth of bacteria. A study (Scott, 1957 cited by Ruëgg and Blanc, 1980) found that the water related physical parameters that determine the growth and survival of microorganisms are not due to water content per se, but to the water activity. The water activity of several Australian honeys has been researched and it was found that the water holding properties, as described by sorption isotherms, varied with the floral source (Squires and Hepworth, 1990, 1992). Blande (1986) suggested that when honey is used as a humectant it is able to bind moisture, ie. water molecules, to its structure through hydrogen bonding. This inhibits the growth of microorganisms and aids the extension of its shelf life. The interest in this property arises for two reasons. The first is the ability of honey to absorb moisture from the environment under ideal conditions, thus becoming dilute and more susceptible to fermentation. The second, and more relevant to this study, is the ability to impart desirable properties, such as softness or non-drying characteristics, to the food products in which it is incorporated. 1.2.4 Water Activity of Honey A study performed on seven Australian honeys found that the blended Australian honeys, Spotted Gum, Grey Iron Bark and Extra Light Amber (ELA) showed signs of hysteresis at 40°C between the water activities of 0.7 and 0.95 (Squires and Hepworth, 1990, 1992). Therefore, the natural structure of honey had some effect on its ability to bind moisture (Squires and Hepworth, 1990, 1992).
5
1.2.5 Sugar Content of Honey Honey is first and foremost a carbohydrate (White and Underwood, 1974). Its sugars are simple carbohydrates that are readily absorbed by the digestive tract so they can be utilised by the body. The sugars of honey are similar to those found in many fruits (White and Underwood, 1974). Sugars account for 95-99.9% of the solids content of honey, and the identification of these sugars has been a topic for research for many years. Sugars are largely responsible for much of the physical nature of honey including its hygroscopicity, granulation properties, energy value, and viscosity (White, 1976). In most honeys, the monosaccharide fructose predominates. Some honey varieties such as rape seed honey contain greater amounts of glucose than fructose (White, 1976). White and Underwood (1974) discussed research carried out in the United States of America, Japan, and Canada on sugar composition and highlighted that there were at least eleven disaccharides in honey in addition to sucrose: maltose; isomaltose; nigerose; turanose; maltulose; leucrose; kojibiose; neotrehalase; gentiobiose; laminaribiose and isomaltulose. No extensive studies were noted for Australian honeys so results have been extrapolated as being the same as the above results. The last major review of Australian honey composition (Chandler, 1985) found a variety of different sugar ratios. Australian honey was similar in terms of sugar types and amount present when compared to its overseas counterparts (Squires, 1991). A study examining a large number of Australian honeys is presently underway in Australia and will further add to the limited knowledge concerning the sugar composition of unifloral Australian honeys (Mossel and D’Arcy, 1999). 1.2.6 Acids of Honey The acids present in honey are of little significance in terms of quantity, since they only make up 0.5% of the total honey solids. However, acids are believed to play an important role in the pronounced flavour of honey (White and Underwood, 1974). At least 18 organic acids have been reported to be present in honey. These include: gluconic, formic, acetic, butyric, lactic, oxalic, succinic, tartaric, maleic, pyroglutamic, pyruvic, α-ketoglutamic, and glycollic. It is suggested that gluconic acid is present in the highest amount (White and Underwood, 1974). An extensive study of organic acids in New Zealand honeys has been undertaken by the research group headed by Dr Alistair Wilkins of Waikato University (Tan et al., 1990; Wilkins et al., 1995a); some of these acids impact on the taste of New Zealand honey. 1.2.7 Proteins and Amino Acids of Honey The nitrogen content of honey is quite low, on average 0.4%, though it may range to 1% of the total solids (Egan et al., 1981). Crane (1974) has shown that only 40–65% of the total nitrogen in honey is protein in nature. The remainder of the nitrogen is derived from the free amino acids found only in trace amounts. The most predominant of these are: proline, glutamic acid, alanine, phenylalanine, tyrosine, leucine and isoleucine (White and Underwood, 1974). 1.2.8 Minerals of Honey The natural mineral content of honey varies from 0.02% to slightly over 1% for floral honeys (White and Underwood, 1974). Many minerals have been identified, including potassium, sodium, calcium, magnesium, iron, copper, chlorine, phosphorous, and sulphur (White, 1976). These are believed to be of little significance in the human diet due to their small quantities.

6
1.2.9 Enzymes of Honey White (1976) suggests that enzymes are among the most interesting materials in honey. The most predominant of the enzymes are those added by the honeybee when converting nectar to honey. Invertase added by the honeybee splits the sucrose into constituent sugars and produces other more complex sugars in small percentages during this process (White and Underwood, 1974). The substrate for invertase is sucrose which is hydrolysed to give glucose and fructose (White, 1976). Diastase (α- and β-amylases) is another predominant enzyme and is frequently used to measure honey quality. It is used as a predictor to determine if honey has undergone any heat treatment (White and Underwood, 1974). Additionally, glucose oxidase has been found in honey, and is responsible for the conversion of glucose to gluconolactone, which in turn forms gluconic acid. Gluconic acid was mentioned in Section 1.2.6 as the predominant acid of honey and is believed to contribute greatly to its flavour. A study examining a large number of Australian honeys is presently underway in Australia and will further add to the limited knowledge concerning the enzyme composition and activity of unifloral Australian honeys (Mossel and D’Arcy, 1999). In conclusion, the enzymes found in honey are said to have no nutritional value as they are found in such small quantities and are destroyed by the digestive process (White, 1976). However, the presence of such enzymes may effect the performance of honey as an ingredient in food systems, particularly in bakery products such as bread. 1.2.10 Colour of Honey Substances responsible for the colour of honey are largely unknown (White, 1976). However, colour can vary greatly from nearly colourless (eg. clover honey), through yellow, yellow green, gold, amber, dark brown or red brown to almost black. Colour (measured using the industry standard pfund scale) is used as a measure of quality in Australia, with certain colour grades gaining premium prices compared to poorer ones. The colour grades and corresponding pfund values are listed in Table 1.3. 1.2.11 Flavour and Aroma of Honey Although there seems to be a characteristic ‘honey’ flavour, an infinite number of aroma and flavour variations exist (White, 1976). D’Arcy et al. (1997) reviewed research done on the volatiles, including flavour and aroma compounds, in honeys from throughout the world. Further, an extensive study of organic extractives, including flavour compounds, from New Zealand honeys was undertaken by the research group headed by Dr Alistair Wilkins of Waikato University (Tan, 1989; Tan et al., 1988, 1989a,b, 1990; Wilkins et al., 1993a,b, 1995a,b; Sun, 1995). This study is pertinent to Australian honey as there are many similarities between New Zealand and Australian honey with respect to flavour compounds. Four studies on flavour compounds in Australian honeys have been reported, two of which were recent studies (Wootton et al., 1978; Graddon et al., 1979; Rowland et al., 1995; D’Arcy et al., 1997). A large project is presently underway in Australia to better establish the volatile flavour profile of Australian honey (B. D’Arcy, RIRDC Project UQ-67A). This work will give further insight into Australian honeys.

7
Table 1.3 Colour grades of honey and their corresponding pfund values (Honey Corporation of Australia (Anon, Honey Corporation of Australia, Pers. Comm. 1992) Colour Grade pfund value White Less than 34mm Extra light amber (ELA) 35 – 48 mm Light amber (LA) 49 – 65mm Pale amber (PA) 66 – 82mm Medium amber (MA) 83 – 100mm Table 1.4 Physical properties of honey (Crane, 1974) Characteristic Value Specific gravity (17% moist 20°C) 1.423 Viscosity (17.1% moist 25°C) 150 poise Specific heat (17.4% moist 20°C) 2.26 kJ/kg/K Thermal conductivity (17% moist 21°C) (17% moist 71°C)
5.36 X 10⁻⁵ W/MK 5.95 X 10⁻⁵ W/MK
Freezing point (15% soln.) -1.42 - -1.53°C Water activity (aw) 0.5 - 0.6 Energy 1230kJ (290 cal.)/100g 1.2.12 Physical Characteristics of Honey Since sugars are the most important constituents of honey, many physical attributes are affected by the type and concentration of these carbohydrates (White, 1976). Table 1.4 summarises some of the physical properties (Crane, 1974). One large project is presently underway in Australia to better establish the physical properties of Australian honey such as viscosity at various temperatures, including below 0 °C, crystallization, and glass transition temperatures (B. D’Arcy, RIRDC Project UQ-84A). This work will overcome the lack of knowledge on the physical properties of Australian honey, particularly how they relate to honey crystallization and flow characteristics. 1.2.13 Calorific Value of Honey The energy value of an average English honey was reported to be 304 Calories per 100g (Crane, 1974). By comparison, a 100 g serve of Australian honey supplies 1230 kilojoules (290 Calories) compared to 100 g of table sugar (sucrose) which contains 1680 kilojoules (400 Calories) (Anon, 1991). Therefore, honey is a lower joule sweetener than sugar when used as a weight for weight substitute.

8
1.3 Competitive Sweeteners In the 1970’s, honey was progressively replaced by syrups of various types because of relative costs (Vlitos, 1974). Research indicates that in many countries the high-use sweetener industrial manufacturing markets are being forfeited to the high fructose corn sweeteners, granulated sugar and artificial sweeteners. 1.3.1 Sucrose as a Sweetener The Australian sweetener market is estimated to be worth $700 M per annum, of which sugar cane accounts for 800,000 tonnes or 84% (Anon, Pers. Comm. Australian Sugar Board, Brisbane). In comparison, honey accounts for a small portion of the total sweetener market. The challenges facing the sweetener industry are said to be : 1. health and safety of natural and artificial sweeteners; 2. sweeter syrups from corn; 3. superior synthetic sweeteners and 4. a better scientific understanding of sweetness (Vlitos, 1974). The above challenges are still being faced by the industry in Australia. Brooke (1970) believed sucrose to be one of the purest food raw materials that was available in large quantities to the food manufacturer, the houseperson and the caterer, and one of the most consistent in composition. Sugar is an essential ingredient in many manufactured foods, due to its ability to add bulk to a product relatively cheaply (Brooke, 1970). In the early 1990’s, the Australian sugar industry promoted sugar by stating that ‘nothing else matches sugar for purity, economy or taste’, ‘sugar is a natural part of the things we enjoy ... and it comes straight from the sunny cane fields of Australia’. Consumption of sugar has been constant for the past eighty years in Australia. Unlike honey, only a quarter of the sugar consumed is used in the home, the remainder is used as an ingredient in food and beverage processing. There is a lesson in this for the Australian honey industry. 1.3.2 Corn Based Sweeteners Corn sweeteners are the other main competitor to honey. This group includes glucose syrups, maltodextrins and glucose. Glucose syrup is a purified, concentrated solution of nutritive saccharides obtained from starch and having a dextrose equivalent (DE) of 20 or more. Glucose powder is manufactured by spray drying this concentrated solution. In Australia today, glucose syrup is incorporated into a large number of food products, often to replace honey. Some of these are bakery products, beverages, canned fruits, frozen foods, ice cream, dairy products, infant food, jams, jellies, preserves, syrups and toppings. 1.3.3 Dried Honey Powder as a Sweetener The development of a dried honey powder of good flavour, colour, physical form, and keeping quality, and which could be produced and sold at a reasonable cost, was believed to enhance the acceptance of honey, especially by the baking industry (Turkot et al., 1960). Even as early as the 1960’s, American manufacturers and honey marketeers realised the potential commercial uses for honey in a ‘dried’ form believing that such a product could lead to a significant increase in honey consumption (Turkot et al., 1960). Honey is difficult to handle in a high speed factory and it poses problems by frequently granulating in the storage containers. Honey’s high viscosity causes appreciable losses in adherence to containers of up to

9
10%, unless special removal procedures are undertaken (Turkot et al., 1960). Free flowing dried powders are said to eliminate such problems. Dried honey was first considered in the United States of America because a large portion of the total honey crop was being used by the baking trade. However, the actual amount consumed was quite small compared to the total quantity of sweeteners (chiefly sucrose) that was being used in baked goods. The main objective of manufacturing a dried honey powder was to develop a process to render honey more suitable for bakery use and to investigate its potential as a baking ingredient (Glabe et al., 1963). In addition to its sales appeal, honey powder was believed to give baked goods the advantage of improving flavour, colour, texture, aroma and keeping quality (Turkot et al., 1960). Ironically, the very properties that made honey attractive to food manufacturers made it difficult to dehydrate (Glabe et al., 1963). The high percentage (30-40%) of invert sugar in honey makes it very hygroscopic. Therefore, by dehydrating honey, crystals are formed which rapidly absorb large amounts of moisture from the atmosphere with only slight exposure, therefore making dried honey undesirable to bakers (Glabe et al., 1963). Storage facilities have greatly improved and to some extent this problem has less impact today. Powder products are most commonly produced by spray or drum drying of the syrup on a carrier, such as starch, corn syrup solids or maltodextrin (Magnuson, 1984). Original work in the United States of America yielded products with starch and flour as diluents. Unfortunately, drying honey reduces the honey solids from 81% to less than 40%. There are several honey powders on the market in Australia and many of these are currently imported. The highest percentage of honey solids found in imported dried honey is 56% with some products containing as little as 30%. Honi-Bake®, first manufactured by Henkel Corporation in the United States of America in the 1960’s remains the world market leader (Magnuson, 1984). This product is said to have colour and flavour similar to that of the original honey. Honi-Bake® contains almost as much honey solids (75%) as is found in liquid honey (Glabe et al., 1963). 1.4 Functional Properties of Bakery Products The two bakery products of most interest are cakes and bread. Functional properties of these products that are important are dough development (mixing time, dough strength and dough stability), gelatinization of dough (temperature, energy and rate), glass transition temperature of dough, and the staling and water activity of bread. In the mid 1970’s, manufacturers in the United States of America looked to corn sweeteners to add to their bakery products. Jackel (1975) noted that fructose-containing corn syrups were commercially available and had the same benefits in baked products as cane or beet sugars. The advantage of corn sweeteners at the time were their lower cost. However, the disadvantage was that corn sweeteners were only available in bulk and required heating so as to prevent crystallization. The following review details some of factors, particularly sweeteners, that affect the functional properties of bakery products. 1.4.1 Effect of Sweeteners on the Functional Properties of Doughs and Batters The role of sweeteners in bread is to supply fermentable solids, influence crust colour, improve crumb texture and softness, and to extend shelf-life (retard staling) (Henry, 1976; Kulp et. al., 1991) of bread. Formulations containing sweeteners have been trialed by many researchers.

10
1.4.1.1 Effect of sweeteners on dough development In the production of bread, it is essential that the bread dough is fully developed during the mixing process. When honey is added to dough, the system exhibits different molecular properties, such as changes in the water activity of the dough, and changes in the starch and gluten hydration. The rheological properties of dough that must be studied to gauge the effect of honey addition are mixing time, dough strength, and dough stability during overmixing. A dough initially consists of a flour-water system that when continuously mixed results in changes in consistency. The system becomes less wet and sticky, and a dough is produced with cohesive and elastic properties; this dough is resistant to extension. On mixing for longer times, resistance to extension is increased and the dough is ‘developed’ (Hoseney, 1994). When water is added to flour, which consists of small wheat particles, the surface of these particles becomes rapidly hydrated because water is in large excess compared to the surface area of the particles (Hoseney, 1994). This large excess of water produces a system that is fluid and not very resistant to extension. These flour particles are dense and, thus, water penetrates them slowly due to diffusion. Mixing leads to the hydrated surface of the flour particles being rubbed off as particles are rubbed against each other, the mixer bowl and the mixer blades. This exposes a new surface to the excess water which then becomes hydrated. As this process continues during mixing, flour particles become completely worn away and hydrated. Thus, the protein and starch become hydrated, and resistance to extension is progressively increased. The dough eventually reaches peak development where a mixed dough with minimum mobility is produced. Here, all the flour particles are completely hydrated and, thus, all the protein and starch are hydrated. The time to reach peak development is termed the mixing time (Hoseney, 1994). It is known that the bonding involved in a dough is probably hydrogen or hydrophobic or both (Hoseney, 1994). The level of protein in flour affects the mixing time. Low protein flours (<12%) require longer mixing times because they contain less protein. Chemical agents, particularly reducing agents such as cysteine and sodium bisulphite shorten mixing times. Additionally, dough mixing times are shorter at lower pH and higher at higher pH (Hoseney, 1994). No work is available on the effect of honey on dough development, including the mixing time. 1.4.1.2 Effect of sweeteners on gelatinization of bakery products Gelatinization is a phenomenon that occurs when starch is heated in water. Gelatinization describes the changes in rheological behaviour of starch that occur at different temperatures, including loss of birefringence (main indicator of gelatinization), loss of X-ray diffraction pattern, absorption of water and swelling, change of shape and size of starch granules, leaching of amylose (and amylopectin) from the granules, and formation of a gel or paste with an increase in viscosity (Eliasson and Larsson, 1993). The amount of these changes depend on the type of starch and on the amount of water present. Lowering the water content (eg. as from a batter to a typical dough) increases the conclusion gelatinization temperature (Tc) but has little effect on the onset temperature (To). Rheological changes in starch aid in crumb setting, and are essential for the crumb structure. Gelatinization is the process where starch granules absorb water and swell as the temperature is increased. The viscosity of the starch then increases as granule swelling occurs. The temperature where the first increase in viscosity occurs is called the onset of pasting. Swelling continues until maximum swelling is reached where the viscosity reaches a maximum. The temperature at this point is termed the gelatinization temperature. Further increases in temperature leads to bursting of the swelled starch granules and a decrease in viscosity. Godshall and Solms (1992) indicated that sweeteners interact with starch retarding gelatinization through raising of the temperature of gelatinization. Earlier, Koch et al. (1954 cited in Kulp et al., 1991) found that sweeteners were able to raise the gelatinization temperature in the order of

11
sucrose>glucose>fructose. Work on wheat starch has shown that various sugars raise the gelatinization temperature (Bean and Yamazaki, 1978; Spies and Hoseney, 1982; Slade and Levine, 1987; Buck and Walker, 1988; Kim and Walker, 1992). Monosaccharides delay gelatinization less than dissacharides, although maltose behaves similarly to a monosaccharide. The delay in starch gelatinization in a sugar solution is thought to involve four mechanisms: sugar has the ability to limit water availability to the starch granule by competing more strongly for water than the starch granule, and by entering the starch granule and preventing water gelling into the granule; sugar lowers the water activity of the starch; sugar forms sugar bridges between starch chains; and sugar exerts an antiplasticizing effect relative to water. However, the exact mechanism by which sugar delays gelatinization is unclear (Kim and Walker, 1992). Controlling starch gelatinization in a cake system is important in producing a porous, noncollapsing cake structure (Bean and Yamazaki, 1973; Glover et al., 1986). Kim and Walker (1992) found that sucrose raised the gelatinization temperature of high-ratio cake batters more than did glucose. Additionally, they suggested that the solubility of the sugars may be important in starch gelatinization. During the baking of batter products such as cakes, the batter undergoes a transition from colloidal foam to a solid porous starch matrix. During this transition, it is important that the foam structure solidifies before a heat-induced collapse occurs. Thus, any ingredient added to the batter should not adversely affect the solidification of the foam structure produced from gelatinization. In conclusion, no work has been reported in the literature on the effect of honey on dough or batter gelatinization. The research presented in this report will help overcome this deficiency. 1.4.1.3 Effect of sweeteners on starch gels The addition of sugars to starch gels has resulted in the suppression of crystallization (I’Anson, 1990). The mechanism by which sugars have this affect on starch gels is not known. However, it is believed to involve the ability of sugars to affect phase separation of the starch and water (I’Anson et al., 1990). Salde and Levine (cited by I’Anson et al., 1990) believe that sugars are able to suppress crystallization by raising the glass transition temperature of the amylose matrix. This study concluded that as well as affecting taste, the addition of sweeteners could significantly alter the staling process of the starch matrix (I’Anson et al., 1990). No published work on the effect of honey on starch gels, which could be related to bakery products is available. 1.4.2 Factors Affecting the Functional Properties of Bread The most important functional property of bread is staling. 1.4.2.1 Importance of staling in bread Staling causes major economic losses to the baking industry. This section gives a summary of the theories of staling, including the causes of staling and the changes that occur in bread during staling. At present, there is debate over the cause of staling, with there being no definite answer. There are two theories, one suggesting that staling is caused by the retrogradation of starch, and the other that gluten plays a role in staling. The process of bread staling has been investigated by many researchers over the past 100 years. Most agree that the storage of bread loaves brings about unacceptable changes. The economic loss by the baking industry due to the staling process is great (Reineccius, 1992). The Australian bread market is currently worth Aus$3 billion. The return from stores of out-of-date goods costs the industry 10% of total sales (M. Basczinski, Pers. Comm 1996). The industry has for many years tried to retard the staling process using additives such as α-amylases, lipids, surfactants and other chemicals. A better understanding of the staling process would permit processes to be developed that delay or retard staling, including the incorporation of honey into a bread formulation.

12
1.4.2.2 The definition of staling Willhoft (1973a) defined staling as changes that decrease the acceptance of bread by the consumer. The staling of bread as stated by D’Appolonia and Morad (1981) is an extremely complex phenomenon and is difficult to define in straightforward terms, but generally speaking, bread staling refers to all changes that occur in bread after baking. Bechtel et al. (1952 cited in He and Hoseney, 1990) thought that staling referred to the changes that take place after baking other than spoilage by microorganisms. The staling of baked goods is generally defined as an increase in crumb firmness upon storage and corresponding loss in product freshness (Galal and Johnson, 1976; Hebeda et al., 1990). Flavour, aroma, texture, perceived moisture level, and other product characteristics are also negatively affected as staling proceeds. Other authors (Piazza and Masi, 1995; Zobel and Kulp, 1996) agreed with the definition of staling by Bechtel et al. (1952 cited in He and Hoseney, 1990) in that they believe staling to be changes occurring during storage such as changing texture, flavour, aroma, etc., and not those associated with microbiological contamination, which causes the waste of baked products or makes them less acceptable to the consumer. Knightly (1977) referred to work by Geddes and Rice (1946), which listed the following changes as characteristic of staling: (1) change in taste and aroma; (2) increased hardness of crumb; (3) increased opacity of crumb; (4) increased crumbliness of crumb; (5) increased starch crystallization of crumb; (6) decreased absorptive capacity of crumb; (7) decreased susceptibility of crumb to β-amylase; and (8) decreased soluble starch content. 1.4.2.3 Present ideas/theories on staling The staling of bread has been an issue that has intrigued scientists for over a hundred years. Work on staling goes back as early as 1852, with Boussingault (cited in Maga, 1975) demonstrating that staling was not specifically due to the loss of moisture, as was previously believed. The rate of staling has been reviewed by Platt and Powers (1940), Willhoft (1973a), Maga (1975), and Kim and D’Appolonia (1977a). All these reviewers and researchers appear to agree that starch is the major component involved in the changes that occur in bread loaves upon storage (D’Appolonia and Morad, 1981). A broad consensus has been developed that bread stales largely because of physical changes that occur in the starch gel component and in the crumb (Zobel and Kulp, 1996). Colwell et al. (1969 cited in Zobel and Kulp, 1996) concluded from their research that ‘the basic mechanism of bread staling is now established with reasonable certainty as involving changes, analogous to crystallization, in the starch fraction of the crumb’. Other authors such as Krog et al. (1989) state ‘that it is well known that retrogradation of the starch fraction in wheat bread plays a major role in the staling process’. This theory is supported by Hebeda et al. (1990) who maintain that ‘it is now generally accepted that staling is due to a gradual transition of starch from an amorphous structure to a partially crystalline state’. Several authors have considered that, during the process of staling, water is released from the retrograding starch and may be absorbed by the gluten. The reverse process has also been suggested but by fewer workers (Willhoft, 1971a). Moisture content affects the staling rate, and increasing the absorption in bread dough has been shown to enhance the softness and retard staling (D’Appolonia and Morad, 1981). Although consumers believe firming of the crumb is due to a loss of moisture in the loaf, there is no significant moisture loss upon storage (Galal and Johnson, 1976). During staling, both the crust and crumb are affected, but in different ways. The crisp crust of fresh bread becomes soft and leathery, while the soft crumb becomes hard and crumbly. In terms of flavour, the typical aroma of fresh bread disappears upon storage, and the flavour of the crumb and crust deteriorates (Neukom and Rusk, 1981). Willhoft (1971a) in his study on bread staling concluded that gluten appears to be completely satisfied in its water requirements at all stages once the dough has been fermented. He also found that moisture

13
is released prior to, during, and after baking, and this release continues on into storage. Following on from this, he suggested that once the moisture is freed from the gluten it moves to the partially gelatinized starch. The starch granules in baked materials are considered to function as inert sponges by simply absorbing free water from the gluten-starch interface. It is important to note that the work conducted by Willhoft (1971a) was in a test system where the gluten and starch were separated and not in continuous association with each other. Martin et al. (1991) developed a theory that takes into account both the protein and starch. Their model of staling suggested that starch swelling is a factor in determining the rate of firming of bread. The effect of protein quality on bread firming may be explained in terms of interactions among swollen starch granules, partial solubilization of starch molecules, and protein. During baking, interaction (cross-links) occur between gluten and starch. During staling, as the crumb loses kinetic energy, interactions increase in number and strength. Gluten is the continuous phase, and remnants of starch granule are the discontinuous phase. The cross-links between gluten and starch that contribute to bread firming must be relatively weak, possibly hydrogen bonds, because refreshing bread restores freshness (Martin et al., 1991). This model of Martin et al. (1991) was not completely accepted by Zobel and Kulp (1996), who pointed out that the theory involving the formation of cross-links between starch and gluten has not been established. However, Zobel and Kulp (1996) agreed that it was not possible to completely neglect the ‘starch remnant’, and they devised a composite scheme, which is as follows: 1. Assume some form of interaction is promoted during baking between the swollen starch granules
and gluten because of their close contact, and perhaps due to the presence of amylose. 2. Studies of the gluten/starch interface suggest any interaction is relatively short lived. One
advantage of any short-term cross-bonding, however, could be that of contributing to initial loaf firmness.
3. As the gluten/starch interface weakens, the amylopectin fraction takes over through retrogradation, by which a molecular network structure develops and imparts rigidity to the crumb.
4. At this point, the accepted norms for staling inhibition such as surfactants, enzymes, and refreshing by heating are applied, with known results.
(Zobel and Kulp 1996) Senti and Dimler (1960 cited in Kim and D’Appolonia, 1977a) proposed that the apparent ‘drying out’ of the crumb might result from a transfer of moisture from one constituent to another, and that a decrease in moisture content of either, or both, gluten and starch could cause increased stiffness of crumb cell walls and, therefore, greater crumb firmness. After all of the work and studies conducted on bread staling over the years, at present, no interpretation is available that yet encompasses the whole body of changes that are observed. 1.4.2.4 Role of starch in bread staling Bread is composed predominantly of proteins, starches and water in the approximate ratio of 1:6:5 (Willhoft, 1973a), or alternatively, the starch component makes up approximately 80% of the dry substance of bread. With starch being present in such amounts, it must play a significant role in staling (Zobel and Kulp, 1996). Galliard and Bowler (1987 cited by Biliaderis, 1992) define starch as a major structure-forming component of food made up of a mixture of amylose (linear fraction) and amylopectin (branched α-D-glucan molecules). The amylose molecule is a linear polymer of glucose, joined with α-1,4 linkages, and is made up of 500-2000 glucose units. Amylopectin is a branched polymer of glucose. The linear sections are joined by α-1,4 linkages, while the branch points are joined by α-1,6 linkages. Amylopectin is a very large molecule. Starch granules are made by successive layers of amylose and
14
amylopectin being laid down around a central hilum in the form of concentric shells to give a tightly packed granule. Starch granules in flour are water-insoluble, partially crystalline materials that reversibly swell in the dough stage, but only slightly. After baking, microscopic examination of the crumb shows that most granules are partially swollen and separated by a thin layer of gluten. This change occurs during baking, whereby the combination of heat, moisture and time transforms the granules into an amorphous (noncrystalline) state (Zobel and Kulp, 1996). It is generally accepted that staling is due to a change in the state of the starch, from an amorphous structure to a partially crystalline state (Hebeda et al., 1990). Starch granules swell and absorb moisture during the baking process (Hedeba et al., 1990). Starch gelatinizes during baking and is evenly distributed throughout the loaf. Some moisture is lost upon removal from the oven and during cooling, and some of the moisture is absorbed by other components, such as coagulated gluten (Singh et al., 1991). The solubilized linear molecules diffuse into the surrounding area (Galal and Johnson, 1976). Here it is concentrated and rapidly forms crystalline networks. This amylose association gives structure to bread and other baked foods upon cooling (Hebeda et al., 1990). As starch is distributed evenly in the crumb, its loss of moisture must contribute significantly to the staling/firming process (Cross et al., 1971). Work by Katz (1913 cited in Singh et al., 1991) highlighted the fact that water released by starch during cooling and storage is taken up by proteins. Starch cells have an α-pattern and are elastic. Therefore, they can absorb more water when bread is fresh. On lowering the temperature, the α-pattern changes slowly to a β-pattern, which holds less water (Singh et al., 1991). The intermolecular and intramolecular association of the starch molecules via hydrogen bonding causes starch to crystallize. It is believed that the prevention of moisture evaporation from the crust to the atmosphere could retard staling (Singh et al., 1991). Honey incorporated in bread may act in this way as honey is know to be hygroscopic. After the completion of the baking cycle, a cooling and ageing process begins in which the starch molecules reassociate or reorder. This phenomena is called retrogradation, and was recognised and named by Lindet (1902 cited in Maga, 1975) who postulated that there was a change in the form of starch during staling; the reaction involved was termed ‘retrogradation’. A more recent description of retrogradation comes from Krog et al. (1989), who defined retrogradation as ‘a physical change of the starch amylose and amylopectin from a swollen, gel-like state to a more crystalline state’. Furthermore, Krog et al. (1989) believed that retrogradation ‘is probably related to the undesirable increase in crumb firmness during the storage of bread’. Research indicates that although both amylose and amylopectin retrograde, the rate varies due to their different polymer structures (Hebeda et al., 1990). Amylose is made up of D-glucose units which are connected by α-1,4 linkages. The retrogradation of amylose occurs rapidly as the linear fragments are joined by random α-1,6 linkages. The branched structure of amylopectin interferes with molecular alignment, therefore retrogradation occurs at a much slower rate (Hebeda, et al., 1990). Many studies have investigated the roles of amylose and amylopectin in the staling process (Knightly, 1977; D’Appolonia and Morad, 1981). Schoch and French (1947) presented a theory that has been generally accepted as fact. They suggested that during baking, starch granules swell, amylose is partially leached out of the granules, and amylopectin is dilated. The limited amount of water in bread restricts this process. Fresh bread consists of soft, extensible granules embedded in a firm gel network of amylose. Bread firming during storage was attributed to changes in amylopectin within the swollen granules (Schoch and French, 1947). In examining the roles of the amylose and amylopectin fractions in wheat starch during gelation, Schoch (1965 cited in Willhoft, 1971b) concluded that the amylopectin fraction was chiefly responsible for the firming of bread. Unlike amylose, amylopectin remains in the starch granule and

15
retrogrades slowly during storage (Cross et al., 1971). Intermolecular and intramolecular association of linear segments occur during retrogradation. To a lesser extent, this also occurs at the amylopectin-amylose interface of the starch granules and the interstitial volume (Cross et al., 1971). Additionally, studies carried out by Russell (1983a) support the theory that amylopectin plays an important role in the retrogradation of starch and, hence, in bread staling (Kim and D’Appolonia, 1977b). As the retrogradation of amylopectin proceeds during bread storage, association of the branched molecules within the swollen granules slowing occurs producing a three dimensional structure. This causes an increase in firmness of the crumb, and hence staling (Hebeda et al., 1990). Bread firms because the granules became rigid (Schoch and French, 1947). However, Cornford et al. (1964 cited in D’Appolonia and Morad, 1981), Maga (1975), and Krog et al. (1989) have concluded that the increase in crumb modulus is proportional to the growth of starch crystallinity. Other researchers believe that the aggregation of amylopectin is responsible for crumb staling (Siljeström et al., 1988 and Galal and Johnson, 1976). This theory is supported by the work of Kim and D’Appolonia (1977b). This stance on the role of amylopectin in staling is supported by Zobel and Kulp (1996) in their review of the staling mechanism. They stated that the amylopectin fraction of starch is believed to have a major role in bread staling. The role of amylopectin in staling is also demonstrated by bread-refreshening experiments in which stale bread becomes more acceptable. In this type of experiment bread is heated in a moist atmosphere at temperatures of 80-95 °C. Softening results when the crystallinity of the aged amylopectin fraction is ‘melted out’; the amylose and gluten fractions are virtually unaffected (Zobel and Kulp 1996). 1.4.2.5 Role of gluten in staling Gluten is the major storage protein of wheat. It is a heterogeneous mixture of proteins, mainly gliadins and glutenins, with limited solubility in water. The formation of a viscoelastic dough capable of entrapping gas during fermentation is attributed entirely to the gluten proteins (Damodaran 1996). The role of flour proteins in bread staling has been investigated at length over the years, using several approaches (Zobel and Kulp, 1996): 1. Whole flours in which protein levels and protein ‘quality’ were varied. 2. Flour fractions of gluten and starch were interchanged and evaluated in bread-baking experiments. 3. Model systems in which fresh and aged gels of isolated starch and gluten were measured for
rigidity development after undergoing a simulated bake. 4. Water transfer between gluten and starch was studied for a possible effect on staling. Katz (cited in Zobel and Kulp, 1996) found compelling evidence against a major gluten effect in staling. It was demonstrated that starch granules in fresh crumb are surrounded by a gluten film. Upon ageing, the swollen granules are shown as shrinking away from the gluten matrix, leaving a channel between the two phases. A weaker rather than a stronger crumb structure should be indicated by the progress of crumbliness and starch release on ageing (Zobel and Kulp 1996). Model gel systems of gluten and starch were the basis for wide-ranging studies on the role of these fractions in staling. Gluten is judged as unlikely of having a major role in firming, since (1) the proportion of gluten to starch in flour is relatively small, approximately one-sixth that of starch, and (2) the rigidity development of gluten is low, being about one-fourth to one-tenth of starch gels (Senti and Dimler, 1960 cited in Zobel and Kulp, 1996). Another approach to determining the role of gluten in staling is through studying glass transition. In dry gluten, the X-ray diffraction pattern gives no indication of crystalline order but rather that typical of glass. Furthermore, X-ray patterns taken of moistened, baked and aged samples indicated the

16
inflexible nature of gluten, through it not displaying any changes that would suggest molecular reordering in the gel structure (Hoseney et al., 1986 cited in Zobel and Kulp, 1996). A different view was taken by Bechtel and Meisner (1954 cited in Kim and D’Appolonia, 1977a) who reported that after three days of storage, the increased crumb harshness caused by the moisture loss from gluten was of major importance in the staling process. Willhoft (1971b) believed that the hydrated protein of natural bread crumb undergoes a mild, first order transformation during baking and subsequent storage. The transformation may be associated with an increase in the extent of denaturation of the protein and possibly involves a configurational modification in the protein. Therefore, it was concluded that bread staling involves, in addition to starch retrogradation, an irreversible modification in the water structure of the gluten, where a significant amount of the water bound to protein was released. Loss of this amount of water to form the continuous three-dimensional matrix of the crumb would be expected to result in a significant rigidification of the gluten phase. This modification would result in firming of the loaf since gluten forms the continuous matrix of the crumb (Willhoft, 1971b). 1.4.2.6 Role of moisture in bread staling Bread stales most rapidly at 4 °C, however the process is arrested at or below 0 °C, due to the moisture in the system becoming immobilized (Galal and Johnson, 1976). As the staling process can be reversed at 35 °C or by re-heating the loaf, it is believed that bread staling involves the redistribution of moisture in the loaf (Pintauro, 1974 cited in Galal and Johnson, 1976). As early as 1875, it was noted that the main transfer between components of a bread loaf was that between the starch and gluten networks (Hunsford, 1875 cited in Galal and Johnson, 1976). Many factors are known to affect the staling (firming) of a bread loaf, such as product formulation, baking procedures and the conditions under which it is stored (Hebeda et al., 1990). Moisture redistribution between components during bread storage has been a controversial subject. It is believed (Hebeda et al., 1990) that some of the water in the loaf is thermodynamically bound. Some of this water can be found in the intermolecular spaces of the protein and some as part of the swollen gelatinized starch (Knjaginicev, 1970 cited in Kim and D’Appolonia, 1977a). Measurements of the moisture-sorption capacity of starch and gluten gels (Senti and Dimler, 1960 cited in Kim and D’Appolonia, 1977a) showed that the water-sorbing capacity of the starch decreases rapidly with ageing, whereas that of gluten remains virtually constant. On the basis of the results by Senti and Dimler (1960 cited in Kim and D’Appolonia, 1977a), it was concluded that moisture transfer would occur from the starch to the gluten in the crumb during ageing. In an earlier study, this movement of moisture (ie. from starch to gluten) did not occur (Knjaginicev, 1970 cited in Kim and D’Appolonia, 1977a). The total moisture content has been the basis of some research on bread staling. Moisture content has been shown to be inversely proportional to the rate of firming (He and Hoseney, 1990). Bread firmness is caused mainly by the formation of cross-links between partially solubilized starch and gluten (Martin et al., 1989 cited in He and Hoseney, 1990). In bread, water acts as a plasticizer. When moisture decreases, the formation of cross-links between starch and protein are accelerated, and the bread firms faster. Therefore, crumb moisture and firmness are closely related. However, over one century ago, it was shown that bread firmed without loss of water (Boussingault, 1852 cited in He and Hoseney 1990). Maleki et al. (1980) found that even though bread with a higher moisture content has a softer crumb, the moisture content of the bread affects absolute softness but not the staling rate. This theory has the support of Zobel and Kulp (1996), who pointed to experiments in which gelatinized starch and baked gluten are sealed in an airtight container. Over seven days the water held by starch dropped from 58% of its weight to 51%, while the water sorption capacity of baked gluten changed very slowly if at all over the seven days. From these results, it was concluded that any moisture movement would take

17
place from starch to gluten (Zobel and Kulp, 1996). However, work conducted by Knjaginicev (1970 cited in Kim and D’Appolonia, 1977a) showed that there was no significant redistribution of moisture from starch to gluten. Experimental work by Willhoft (1971a) showed the opposite result to that of Senti and Dimler (1960 cited in Kim and D’Appolonia, 1977a) and Zobel and Kulp (1996), with water moving from the gluten fraction to starch in a model system. A study by Cross et al. (1971) found that during storage the baked gluten phase lost about one seventh of its water. This water is gained by the starch fraction. Further supporting these findings, Betchel and Meisner (1954 cited in Kim and D’Appolonia, 1977a) suggested that the moisture from the gluten matrix migrates from the crumb to the crust during storage. Once bread is removed from the oven, consistent changes in the moisture content of the loaf occur during the cooling stage. A temperature gradient exists within the bread loaf. As a consequence, vapour pressure varies noticeably between the loaf crust and the internal part of the loaf, promoting moisture migration from the crumb to the crust (Stear, 1990 cited in Piazza and Masi, 1995). Besides the internal moisture transport during the cooling stage, part of the moisture migrates from the crust to the surrounding atmosphere. Finally, Galal and Johnson (1976) confirmed that the changes that occur during staling are not necessarily due to a loss of moisture (Kim and D’Appolonia, 1977b). Hebeda et al. (1990) indicated that moisture is redistributed during staling, however, it is not a requirement for the process. Actual moisture loss was minimal if the loaf was packaged adequately. 1.4.2.7 Role of flour quality in bread staling Additionally, flour quality and strength are reported to be major factors in the staling rate of bread (Kim and D’Appolonia, 1977b). As stated earlier, there is an inverse relationship between the rate of staling of bread and the protein content of the flour. Therefore, bread made from flour of different protein content would exhibit a different staling rate (Kim and D’Appolonia, 1977b). Erlander and Erlander (1969 cited by D’Appolonia and Morad, 1981) found that the ratio of starch to protein in the dough was critical in determining the rate of staling. 1.4.2.8 Role of natural pentosans in flour in staling The natural pentosans found in flour are known to have a high water binding capacity, of up to 10 times their own weight (Voll, 1974). Kim and D’Appolonia (1977b) studied the ability of pentosans to retard the staling process in starch gels, and concluded that pentosans had a significant effect on slowing down firming. 1.4.2.9 Role of the bread making process in staling Mixing Research shows that over-mixing a dough effects the staling process by increasing the rate of firming (Platt and Powers, 1940). Fermentation Platt and Powers (1940) showed that bread from over-fermented dough gave a softer crumb than bread that is under-fermented. Proof time Research indicates that reducing the proof time yields loaves that will firm more slowly than loaves which were over-proofed (Ponte et al., 1962 cited in Singh et al., 1991).

18
Baking time The actual baking time, ie. from 25 min (under-baking) to 45 min (over-baking) can affect the amount of moisture in the loaf and hence the rate of staling (Singh et al., 1991). Therefore, over-baked loaves have lower moisture content, and therefore, will firm more quickly. 1.4.2.10 Role of specific loaf volume in bread staling The actual staling rate depends on the specific loaf volume (D’Appolonia and Morad, 1981). The rate and extent of staling are affected by the specific loaf volume, decreasing in a linear manner with increasing volume (Willhoft, 1973b). Russell (1983a) pointed out that loaf volume is the actual measured volume of the loaf as opposed to the derived specific loaf volume. Loaf volume is directly related to flour protein content and quality. Studies on the effect of these factors on the behaviour of bread during storage have indicated an inverse relationship between protein content and the rate of increase in crumb firmness. An increase in protein level leads to increased loaf volume, increased specific loaf volume and reduced loaf firmness (Russell, 1983a). 1.4.2.11 Role of enzymes in bread staling When a baker adds enzymes to a bread dough, the goal is to achieve a certain amount of change in the dough and finished product: a certain amount of gluten hydrolysis is required for improved machinability; a certain amount of starch hydrolysis, to provide sugars for fermentation; a certain amount of lipid peroxidation for dough strengthening; or a certain amount of hydrolysis of gelatinized starch, to reduce retrogradation and crumb firming (Stauffer, 1990). To get these changes in bread or baked goods certain enzymes are added. These enzymes include amylases, proteases, lipoxygenases, pentosanases, and others. Amylases Fox and Mulvihill (1982 cited in Bowles, 1996) detailed six reasons for the supplementation of flour with amylases: 1. Amylases increase the level of fermentable sugars present in doughs. 2. Amylases improve crust colour. The reducing sugars produced by amylases react with other
components in bread to produce Maillard reaction products. These are responsible for the golden colour of the crust.
3. The flavour of bread is improved by both the simple sugars produced by the amylases and by the Maillard reaction products.
4. Gas retention properties of dough are improved by starch modification. 5. The crumb has improved moisture retention properties, as a result of starch modification by
amylases. 6. Heat stable amylases retard the staling of bread. Bakers have conventionally added a surfactant to retard staling, however, an alternative approach involves the addition of a small quantity of the α-amylases. These specifically hydrolyse the α-1,4 glucosidic linkages in the starch, at random locations within both the amylose and amylopectin molecules (Hebeda et al., 1990). There are several different sources of α-amylase, however only a few are believed to be effective in retarding the staling process. These are the bacterial α-amylases and the intermediate stability amylases. They are able to hydrolyse the glucosidic linkages within the amorphous areas of the gelatinized starch. Bacterial α-amylases are heat stable and therefore persist throughout the baking process (unlike fungal α-amylases), and are able to produce an excessive level of soluble dextrins. This can result in an unacceptably ‘gummy’ or ‘sticky’ loaf which does not slice well (Hebeda et al., 1990). Loaves of this nature are undesirable to both the manufacturer and the consumer.

19
A somewhat recent development is the use of intermediate stability amylases. These are heat stable and combine the positive characteristics of bacterial and fungal α-amylases; these are now widely used by the baking industry (Hebeda et al., 1990). It should be noted that small quantities of α- and β-amylases (diastase activity) are present in honey and may impact on the staling of bread. Two different theories suggest reasons why amylases achieve shelf-life extension. In the first, the enzyme is believed to cleave a few bonds in the soluble region of starch, leaving insoluble regions that can ‘flex’ (Boyce, 1986 cited in Dziezak 1991). In the second, the enzyme is thought to shorten the chain length of amylopectin from 19-21 units to 12-15 units, which reduces its tendency to retrograde (Boyle and Hebeda, 1990 cited in Dziezak, 1991). Proteases Proteases are added to bread to improve loaf symmetry and uniformity, to improve grain and texture, and to provide a softer crumb. Fungal proteases are used for this particular application. The proteases work by freeing amino acids from gluten, which then react with sugars in the Maillard reaction resulting in improved flavour and crust colour; they also help with yeast growth and gassing power (Reichelt, 1983 cited in Dziezak, 1991). Pentosanase Wheat flour contains about 2-3% pentosans. These long, branched polymers exist in both soluble and insoluble forms, and can assert important effects on the finished bread quality. The significant fact about flour pentosans is that they are extremely hydrophilic, accounting for almost one quarter of the water absorption of a wheat flour dough, but in most cases are detrimental to loaf volume (Stauffer, 1990). Pentosanases are added to bread because they break down pentosans, resulting in easier handling doughs and finished products with a larger loaf volume (Mullins et al., 1989 cited in Dziedak 1991). 1.4.2.12 Role of salt and yeast in bread staling Salt and yeast are used in most bread formulations and, therefore, their effect on the staling process has been researched. Salt has been shown to extend shelf life, however it is not commonly used to control staling (Singh et al., 1991). A higher level of yeast produces a firmer loaf of bread upon storage (Freilich, 1848 cited by Singh et al., 1991). 1.4.2.13 Role of surfactants in bread staling For over 30 years, surfactants have been used to improve the quality of bread (Birnbaum, 1977 cited in Pisesookbunterng and D’Appolonia, 1983). Surfactants that function as bread softeners by complexing with starch and interacting with gluten are referred to as dough conditioners. Birnbaum (1955 cited in Pisesookbunterng and D’Appolonia, 1983) concluded that surfactants reduce the effective concentration of moisture in the starch phase and increase the moisture retention of the gluten, tying up moisture in the bread crumb. Therefore, surfactants would assist in moisture retention during baking resulting in greater initial crumb softness. These results are not consistent with those of Pisesookbunterng and D’Appolonia (1983), who in their experiments found that the addition of surfactants permitted greater moisture migration from the crumb to the crust than in a control bread. From these results, Pisesookbunterng and D’Appolonia (1983) theorised that surfactant molecules on the starch granule surface plus complex formation could inhibit the absorption of moisture by granules – in particular, any moisture released from gluten during ageing. Although surfactants might tend to promote moisture migration from the crumb to the crust resulting in crumb staling, this is viewed by consumers to be much more acceptable than crust staling (Pisesookbunterng and D’Appolonia 1983). The mode of action in improving the shelf life of bread has been controversial. One hypothesis is that surfactants form a complex with amylose, resulting in a softer crumb in fresh bread, but that they have

20
no influence on the firming rate (Schoch, 1965 cited in Pisesookbunterng and D’Appolonia, 1983). Other workers have shown that surfactants have little or no effect on initial bread crumb firmness but do affect the firming rate during storage (Favour and Johnston, 1947; Skovholt and Dowdle, 1950; Ofelt et al., 1958; all cited in Pisesookbunterng and D’Appolonia, 1983). Additionally, the results of work conducted by Pisesookbunterng and D’Appolonia (1983) indicated that surfactants retard firming during bread storage rather than produce an initially softer crumb in freshly baked bread. Studies of the complexing effect of surfactants with starch (Katz, 1934; Mikus et al., 1942; Osman et al., 1961; all cited in Knightly, 1977) agree that the addition of surfactants to starch results in the formation of a crystalline complex between amylose and fatty acids. Surfactants with known anti-firming properties all demonstrated the same crystalline pattern (Knightly, 1977). Helical complexes between surfactant and amylose were observed when these interactions were studied by X-ray diffraction Raman spectroscopy, high resolution 1H nuclear magnetic resonance spectroscopy, optical rotation, and optical dispersion measurements (Russell, 1983b). These interactions were stabilized by hydrophobic interactions between the hydrocarbon portion of the surfactant and the interior of the amylose helix. This is where the C-H groups of anhydroglucose residues are located (Russell, 1983b). In conclusion, these results were used to back up claims that amylose was responsible for bread firming through the association of amylose chains by hydrogen bonding (Knightly 1977). 1.4.2.14 Effect of sweeteners on bread staling The role of sweeteners in bread is to supply fermentable solids, influence crust colour, improve crumb texture and softness, and to extend shelf-life (Henry, 1976; Kulp et al., 1991). A study by I’Anson et al. (1990) concluded that as well as affecting taste, the addition of sweeteners could significantly alter the staling process of the starch matrix. Platt and Powers (1940) reported that the addition of 4% sugar to a dough formulation could slightly slow down the rate of crumb staling. The study showed that maltose is the most effective; followed by glucose syrup, dextrin, beet sugar, maltose and glucose. The study also indicated that the addition of higher oligosaccharides appeared to accelerate the staling process. It is believed that this is a result of the oligosaccharides serving as aggregating agents of starch and promoting the retrogradation process (Singh et al., 1991). Henry (1976) reported that the most hygroscopic of the sweeteners used in baking are glucose and fructose. Many studies (Jackel, 1975; Henry, 1976; Kulp et al.,1991) have proved that corn syrups and high fructose:glucose syrups have the ability to retard staling through their ability to bind moisture. Studies indicate that when high fructose corn syrups are used in the commercial production of white pan bread, buns and sweet rolls, these bakery products are consistently rated higher by consumers than sucrose formulations. Therefore, in many yeast leavened products sucrose is replaced by high fructose corn syrups (Henry, 1976). Yeast can only utilise simple sugars (ie. glucose and fructose). More complex sugars are hydrolysed enzymatically by invertase (sucrose to glucose and fructose) and maltase (maltose to two glucose molecules) (Henry, 1976). Research indicates that yeast is able to consume two percent (based on flour weight) of the sweetener solids in a bread formulation (Henry, 1976). However, honey has a large proportion of fructose and glucose and, therefore, may exhibit similar effects on staling. Voll (1974) indicated that the addition of honey to baked goods may increase the flavour and sweetness, but more importantly increase the shelf life. Conforti and Strait (1998) showed that the addition of liquid honey to muffins increased the moisture content and decreased the water activity, but did not decrease firmness or retard staling after prolonged storage. However, sensory results found that the addition of honey increased the cohesive force and decreased the tenderness in these muffins (Conforti and Strait, 1998). Increasing the absorption of water in bread dough slows the development of starch crystals, and results in a bread loaf remaining soft, with the staling process being retarded (D’Appolonia and Morad, 1981). Sugars are thought to increase the absorption of water in a loaf. However, there is little evidence in the literature to support this theory. Handling

21
liquid honey in a high speed production environment and uniformity of product upon delivery were concerns that were highlighted in terms of the use of honey by the baking industry (Voll, 1974). These concerns are being faced through a present RIRDC project (B. D’Arcy, RIRDC Project UQ-84A) that is studying the movement and flow characteristics of honey in a commercial processing environment. Market research (Squires, 1991; Hepworth and Squires, 1991, 1992) carried out with the baking industry indicated that a potential for growth in sales exists for premixes containing honey. The study of Australian honey as a food ingredient in bakery premixes found that honey could be added to a commercial oatbran bread premix and a commercial muffin premix at a level of 5%, without adversely affecting bake performance, shelf life or eating quality (Squires, 1994). All this research indicated that honey could be added to bakery products as a functional ingredient and not simply as a sweetener. No studies have been published determining the effect of Australian honey on the bread staling phenomena. It is believed that the high level of fructose and glucose in Australian honey will yield similar results to studies conducted by Jackel (1975), Henry (1976), I’Anson (1990), and more recently Kulp et al. (1991). All found that the addition of sweeteners containing predominantly fructose and glucose yielded loaves that staled at a slower rate. 1.5 Conclusion This review of the literature has shown that little data are available on the use of sugars and none on the use of honey in bakery products, particularly relating to a possible role in retarding staling, the main reason why any additive would be added to bakery products. For honey to be used to retard staling, data on the effect of honey on aspects of the baking process need to be obtained, eg. on dough mixing and gelatinization. As the review indicated above, some work on the effect of sugars on gelatinization has been reported but there is none on the effect of honey on dough or batter properties. Thus, further research on honey and bakery products is needed. 1.6 The Problem
• There is no data on the effect of honey on the functional properties of doughs and batters, eg. dough development, and gelatinization of doughs and batters;
• The antistaling effects of honey on bread are inconclusive and need to be confirmed.
To solve the problem, a project was undertaken, and the results are presented in this report. One study of this project examined the effect of honey on the staling of bread, and is included in this project in the form of a commercialization trial. This study extended the work of Ms Nicole Squires that was previously funded by the RIRDC Honeybee Program (Caffin et al., 1996). In addition, part of the work of this project was to reanalyse her texture data to find a quantitative effect that would be of use to the baking industry. By studying the effect of honey and sugars on the functional properties of doughs and batters, including dough development and gelatinization, this project should overcome the identified lack of information on the effects of honey incorporation on the properties of bakery products such as bread.
22
2. Aims and Objectives Overall Project Aims To investigate the use of Australian liquid honey in commercial bakery products, and to determine the effect of the incorporation of honey on the quality and functional properties of bakery products; to communicate research findings to the Australian food processing industry. To achieve these overall project aims, five studies were undertaken. The aims and objectives of each individual study are listed below: 2.1 To Determine the Effect of Honey Addition on the Rheological Properties of Bread Doughs During High Shear Mixing 2.1.1 To determine the maximum practicable level of honey that can be added to bread dough to
still support dough development; 2.1.2 To determine the effect of honey on the peak dough development time (mixing time); 2.1.3 To determine the effect of honey on dough strength; 2.1.4 To determine the effect of honey on dough stability. 2.2 To Study the Kinetics of Gelatinization of Plain Bread Doughs Containing Honey 2.2.1 To determine the maximum practicable level of honey that can be added to doughs to support
gelatinization; 2.2.2 To determine the effect of honey addition on the gelatinization temperature of bread doughs; 2.2.3 To determine the effect of honey addition on the gelatinization energy of bread doughs; 2.2.4 To determine the effect of honey addition on the glass transition temperature of bread doughs. 2.3 To Study the Viscosity of Gelatinization of Batters Containing Honey 2.3.1 To determine the effect of honey on the rheological properties of a batter made from high-ratio
flour and water during programmed heating, in order to quantify the effect of honey on the viscosity of a batter during gelatinization.
2.4 To Determine the Effect of Honey on the Staling of White Pan Bread as
Determined by Physical and Sensory Analyses 2.4.1 To determine the ability of Australian liquid iron bark honey, Gemsweet 42® (sugar syrup)
and dried honey to retard the bread staling process by reanalysing the data of RIRDC Project UQ-54A.
2.5 To Study the Effect of Honey Incorporation on Dough and Bread Properties
Under Commercial Bread-Making Conditions 2.5.1 To determine the effect of honey incorporation in a commercial bread formulation on the
physical and chemical properties of dough and bread (including during post-baking storage) prepared as part of a commercial bread-making process.

23
3. Methodology Five experiments were done to fulfil the aims and objectives of the project. One of these experiments involved a reanalysis of the data of Ms Nicole Squires from the 1996 RIRDC Report on the Project UQ-54A (Caffin et al., 1996). The findings from this reanalysis (Section 3.4) are of such significance to the industry that they need to be included in this final report so that dissemination of the findings and industry implications to the food industry can take place. 3.1 The Effect of Honey Addition on the Rheological Properties of Bread Doughs During High Shear Mixing 3.1.1 Introduction Honey was added to the dough at varying levels. Rheological properties such as development time (mixing time), strength and stability of doughs containing honey were measured with a 35g National Mixograph. The results for these doughs were then compared to those of dough samples containing various levels of a model sugar solution (consisting of the same levels of glucose, fructose, sucrose and maltose as the honey used), and to those of a control dough sample (containing no honey or model sugar solution). 3.1.2 Honey Sample A bulk sample of iron bark honey (13 kg) was supplied by Capilano Honey Limited (Brisbane Australia). The bulk honey was stored in its original container at 4°C, to minimise enzymatic and chemical activity, until needed. 3.1.3 Determination of the Fructose, Glucose, Sucrose and Maltose Composition of
Iron Bark Honey 3.1.3.1 Honey sample preparation Aliquots of honey (15 g) were centrifuged at 5000 rpm at 4°C for 30 min. After centrifuging, the waxy top layer of the sample was removed and all samples from the centrifuge tubes were then combined. The clarified honey sample (20 g) was diluted to 100 mL with distilled and purified (Milli-Q® water purification system) (hereafter known as purified water) water and mixed thoroughly. A portion of the diluted sample (2 mL) was micro-filtered through a 0.45 µm HPLC filter membrane (Millipore). Stock sample solutions were then stored at 4 °C until required. Stock solutions were discarded and remade after one week. 3.1.3.2 Preparation of standard sugar solutions for determination of D-fructose, D-glucose, sucrose and maltose by HPLC Individual stock solutions (50mL) of 20%w/w D-fructose, 15%w/w D-glucose, 10%w/w sucrose and 10%w/w maltose were prepared using purified water. A mixed stock solution consisting of 4%w/w D-fructose, 3%w/w D-glucose, 2%w/w sucrose and 2%w/w maltose was then prepared by diluting 20 mL of each stock solution to 100 mL using purified water. A portion (5 mL) of the mixed stock solution was filtered through a 0.45 µm HPLC filter membrane, degassed in an ultrasonic bath for 10 min, and then stored at 4 °C. All standard solutions were discarded and remade after 7 days.
24
3.1.3.3 Preparation of the HPLC mobile phase HPLC grade acetonitrile and purified water were each microfiltered under vacuum using a 0.45 µm HPLC filter membrane (Millipore) and degassed (using a vacuum), then mixed in a ratio of 80:20 (acetonitrile:H2O). The combined mobile phase was then degassed using an ultrasonic bath. 3.1.3.4 HPLC column conditions A programmable Shimadzu HPLC pump with a 20 µL fixed volume loop injector was connected to a Waters® Carbohydrate column. Peaks were detected using a Waters® refractive index detector and integrated with Waters® Maxima HPLC software (IBM MSDOS version). 3.1.3.5 Sugar determination An aliquot (20 µL) of the standard solution was injected into the HPLC system to calibrate the response factor for the detector. An aliquot (20 µL) of the filtered honey sample was injected into the HPLC to determine the concentrations of D-fructose, D-glucose, sucrose and maltose. 3.1.4 Dough Formulation and Preparation Room temperature was maintained at 25 °C. Equipment, flour and other ingredients were equilibrated at room temperature. 3.1.4.1 Honey solution preparation The same honey sample as described earlier was used, except that the honey was not filtered or centrifuged. Storage conditions of the honey were the same. A stock solution of honey was prepared by diluting the honey to 50%w/w. The stock honey solution was then stored at 4 °C until required. To prevent possible microbial activity, the stock solution was remade every 48 h. 3.1.4.2 Model sugar solution preparation The sugar composition of the model sugar solution was exactly the same as that of honey, with the only difference being the absence of the other components of honey such as wax, acids, volatile constituents, enzymes etc., ie. the model sugar solution was formulated to give the same D-fructose, D-glucose, sucrose and maltose concentration as a 1:1 diluted sample (with purified water) of the honey used in this experiment (Section 3.1.4.1). Solutions were stored at 4 °C until required. Each model sugar solution was kept for no longer than 48 h before discarding. 3.1.4.3 Flour samples Bakers flour was supplied by Defiance Milling Ltd., Brisbane. The bakers flour is a standard bread making flour. 3.1.4.4 Dough sample preparation Doughs were prepared using a standard baking formulation. A sample of flour (10 g) (14% H2Ow/w basis) was transferred into the mixograph bowl. A tongue depressor was used to make a hexagonal hole in the flour. In the hole made in the flour was placed the required measure of the 50% honey solution or model sugar solution. The balance of purified water needed to produce a standard dough was then added. Doughs containing honey or the model sugar solution at levels of 1%, 2%, 3%, 4%, 5%, 6%, 7%, 8%, 9% and 10% w/w flour (dry basis) were prepared. All dough samples were compared against a control sample, which did not have any honey or model sugar solution in its formulation.

25
3.1.5 Mixograph Operation The dough samples were mixed using a 35g National Mixograph (Lincoln, Nebraska), and dough development was measured. The mixograph measures the torque resistance of the dough to mixing. The mixing action is high shear, and has been found to closely model large scale mixing operations as found in continuous bread making processes. The torsion spring was set at 12, and each dough was mixed for a total of 6 min. 3.1.5.1 Mixograph report interpretation Each mixograph report was scanned at 150 dpi and 8 bit colour depth (256 colours) to produce an electronic image. The image was then imported into Micrografx Picture Publisher. The image was then smoothed by 5 pixels, followed by another smoothing by 5 pixels. The data points were then easily read from the resultant smoothed graph. Figure 3.1 shows a representative mixograph report with the peak dough development time (mixing time), dough development curve width (dough strength) and dough breakdown width (dough stability) boundaries. 3.1.6 Experimental Design This experiment was intended to determine the effect (if any) that honey has on: • the peak development time (mixing time) of bread dough; • the dough strength; and • the dough stability. Thus, the following factors were investigated: • influence of the honey addition level on the dough development time and breakdown of the dough; • whether the sugars in the honey, or the unique properties of the honey matrix itself, produce a
desirable effect on dough development or breakdown.
26
Figure 3.1 Representative mixograph showing the mixing time, dough development curve width and dough breakdown curve width
26

27
A full factorial design was used, being: 1. Sugar type (honey or model sugar solution); 2. Addition level of honey or the model sugar solution (1% to 10% in 1% increments); 3. Three replications of each treatment. The sugar composition of the model sugar solution was exactly the same as that of honey, with the only difference being the absence of the other components of honey such as wax, acids, volatile constituents, enzymes etc. A completely randomized design was used. These samples were then compared to a control dough (containing 0% honey or model sugar solution). The control variable was repeated for each of the combinations of treatments. Reasoning for this was to provide for a balanced full factorial design to facilitate easier statistical analysis. 3.1.7 Statistical Analysis Data were analysed using a simple factorial analysis of variance model (General Linear Model) in SPSS version 6.1 for Microsoft Windows 3.1x, with a completely randomized design. Peak dough development time (mixing time), dough development curve width (dough strength) and dough breakdown width (dough stability) were entered as the dependent variables against the independent variables of: (a) Source (ie. honey or model sugar solution) (b) Addition level Where a significant (P<0.05) F ratio was found, 95% confidence intervals for mean measurements were determined based on pooled standard deviations. 3.2 Kinetics of Gelatinization of Plain Bread Doughs Containing Honey 3.2.1 Introduction Honey was added to the dough at various levels. The glass transition temperatures and rheological properties such as gelatinization time and energy for doughs containing honey were measured with a Perkin Elmer DSC-7 differential scanning calorimeter (DSC). The result for these doughs were then compared to those of a control dough sample (containing no honey or model sugar solution), and dough samples containing various levels of a model sugar solution (consisting of the same levels of glucose, fructose, sucrose and maltose as the honey used). 3.2.2 Honey and Model Sugar Solutions The same honey and model sugar solutions as in Sections 3.1.4.1 and 3.1.4.2 were used again. 3.2.3 Experimental Design A full factorial design was used, being: 1. Sugar type (honey or model sugar solution); 2. Level of honey or model sugar addition (2%, 4%, 6%, and 8%); 3. Three replications of each treatment.

28
The sugar composition of the model sugar solution was exactly the same as that of honey, with the only difference being the absence of the other components of honey such as wax, acids, volatile constituents, enzymes etc. A completely randomized design was used. These samples were then compared to a control dough (containing 0% honey or model sugar solution). The control variable was repeated for each of the combinations of treatments. Reasoning for this was to provide for a balanced full factorial design to facilitate easier statistical analysis. 3.2.4 Dough Formulation and Preparation Doughs were prepared using the National Mixograph (as used in the dough rheology experiment) based on the methods in Sections 3.1.4.4 and 3.1.5. The doughs were mixed to a peak torque resistance. Doughs consisting of 0% (control), and 2%, 4%, 6%, and 8% levels of either honey or the model sugar solution (w/w flour, dry basis) were prepared. 3.2.5 Determination of Gelatinization of Doughs using Differential Scanning
Calorimetry Approximately 5 mg of a dough sample was transferred into an aluminium pan and then placed in a differential scanning calorimeter (DSC). A DSC is used to determine transition temperatures and energies between physical states (eg. solid-liquid) or during phase changes (eg. raw, denaturation, gelatinization). The gelatinization temperature and transition energy (gelatinization energy) were measured using a Perkin Elmer DSC-7 differential scanning calorimeter (DSC). Indium was used to calibrate the instrument. The pan containing the equilibrated dough was placed in the DSC sample chamber where temperature equilibration for 1 min was permitted before starting to increase its temperature from 20-150 °C. Samples were heated in the DSC at a rate of 10 °C/min, with a sensitivity of 0.5 mcal/sec. DSC thermograms were recorded directly to computer file and printed out later. Another aluminium pan, containing an appropriate amount of aluminium to balance the heat capacity of the sample, was used as the reference. The starch gelatinization characteristics in a DSC thermogram were determined at various temperatures. The gelatinization temperature and gelatinization energy were determined. The gelatinization temperature was determined by measuring where the extrapolated endotherm intersected the baseline. The energy required for gelatinization was determined by converting the areas under the gelatinization peak to joules using a calibration coefficient previously determined using indium and relative to starch. 3.2.6 Determination of the Glass Transition Temperature of Dough using Differential
Scanning Calorimetry The doughs and bread loaves were analysed using a Perkin Elmer DSC-7 differential scanning calorimeter (DSC) in order to measure the effect of honey and the model sugar solution on the glass transition temperature of dough. A sample of dough was removed and stored in a container at –70 oC until analysed. A small portion of this sample was dried by dipping it in liquid nitrogen. This dried sample (10-15 mg) was then placed in an aluminium sample pan (50 µL), and the pan was hermetically sealed. An empty aluminium pan was used as the reference. The standard heating rate was 10 oC/min over the range of 20-80 °C. DSC thermograms were recorded directly to computer file and printed out later. The glass transition temperature was determined by analysing the deflection point on the thermogram. 3.2.7 Statistical Analysis The results for the gelatinization temperature and energy analyses were analysed using a simple factorial analysis of variance model (General Linear Model) in SPSS version 6.1 for Microsoft
29
Windows 3.1x, with a completely randomized design. The results for the glass transition temperature analysis were analysed using The SAS System (1992) for Windows 3.95, release 6.08. Gelatinization temperature, gelatinization energy, and glass transition temperature were entered as the dependent variables against the independent variables of:
(a) Source (ie. honey or model sugar solution); (b) Addition level.
For gelatinization temperature and gelatinization energy, where a significant (P<0.05) F ratio was found, 95% confidence intervals for mean measurements were determined based on pooled standard deviations. For glass transition temperature, Duncan's multiple range test was used to detect significant differences (P<0.05) between the mean glass transition temperatures for doughs containing various levels of honey or the model sugar solution. 3.3 Viscosity of gelatinization of batters containing honey 3.3.1 Introduction Honey was added to a flour-water batter at varying levels. The torque resistance to shear during programmed heating (50-95 °C) of these batters was measured with a Haake-Brabender visco-amylograph, and then compared to those of a control batter sample (containing no honey or sugar), and batter samples containing various levels of a model sugar solution (consisting of the same levels of glucose, fructose, sucrose and maltose as the honey used). Other properties determined from the data were the pasting temperature, temperature at 500 BU (rate of gelatinization), and peak viscosity (torque at 75 °C). 3.3.2 Honey and Model Sugar Solution The same honey and model sugar solutions as in Sections 3.1.4.1 and 3.1.4.2 were used again. The model sugar solution had the same fructose, glucose, sucrose and maltose content as the honey. 3.3.3 Experimental Design A full factorial design was used, being: 1. Sugar type (honey or model sugar solution); 2. Level of honey or model sugar addition (60%, 100%, 140% and 180%); 3. Three replications of each treatment. The sugar composition of the model sugar solution was exactly the same as that of honey, with the only difference being the absence of the other components of honey such as wax, acids, volatile constituents, enzymes etc. A completely randomized design was used. These samples were then compared to a control dough (containing 0% honey or model sugar solution). The control variable was repeated for each of the combinations of treatments. Reasoning for this was to provide for a balanced full factorial design to facilitate easier statistical analysis. 3.3.4 Batter Formulation and Preparation A high-ratio cake flour and water were used to produce a batter (12% flour) containing 7% starch using a standard baking formulation. The batters were formulated to contain 0% (control), 60%, 100%, 140% and 180% honey or model sugar solution (w/w flour, dry basis).

30
3.3.5 Determination of Rheological Properties of Batters The rheological properties of the batters were measured using a Haake-Brabender visco-amylograph (Haake Inc.: Saddle Brook, New York, USA). Here, the torque resistance to shear (Brabender Units) was recorded during programmed (1.5 °C/min) heating from 50-95 °C. The batters containing various levels of honey were compared against a control containing no honey or the model sugar solution, and against batters containing various levels of the model sugar solution. The pasting temperature (temperature where viscosity first increases), temperature at 500 BU (Brabender Units) and torque at 75 °C were measured as indicators. The temperature at 500 BU gives an indication of the rate of gelatinization. The torque resistance to shear at 75 °C indicates the peak viscosity of the batter. 3.3.6 Statistical Analysis Data were analysed using a simple factorial analysis of variance model (General Linear Model) in SPSS version 6.1 for Microsoft Windows 3.1x, with a completely randomized design. Pasting temperature, temperature at 500 BU, and viscosity at 75 °C were entered as the dependent variables against the independent variables of:
(a) Source (ie. honey or model sugar solution) (b) Addition level
Where a significant (P<0.05) F ratio was found, 95% confidence intervals for mean measurements were determined based on pooled standard deviations. 3.4 The Effect of Honey on the Staling of White Pan Bread as Determined by Physical and Sensory Analyses 3.4.1 Introduction This experiment was undertaken by Ms Nicole Squires as part of an earlier RIRDC project (UQ-54A), and is being reported again here as her work was further statistically analysed yielding new results of interest to RIRDC and the food industry. In this study, various levels of Australian iron bark honey and Gemsweet 42® (sugar syrup) were added to a white pan bread formulation. The study was done to determine if the hygroscopic nature of liquid honey can play a role in the retardation of the bread staling process. Its performance is compared to that of a commercial high fructose:glucose syrup (Gemsweet 42®) and to dried honey. The effects on staling were measured by both objective texture measurement (TA-XT2 analyser) and by sensory evaluation using trained panellists. 3.4.2 Materials Defiance Milling bakers flour was used for all trials (Defiance Milling Ltd., Toowoomba, Queensland). Queensland iron bark honey was obtained from Capilano Honey Ltd. (Richlands, Queensland). A unifloral (straightline) variety was used to provide a consistent product. This bulk iron bark honey sample was different to the honey sample described in Sections 3.1, 3.2, 3.3, and the one detailed in Section 3.5. The sugar syrup used was Gemsweet 42®, a high fructose:glucose syrup manufactured by Manildra (Auburn, New South Wales). Dried honey was obtained from Earlee Products (Tingalpa, Queensland). The bread formulation contained Super Improver 1200 (Bakels® Improver Lecinta 1200) obtained from Defiance Milling (Toowoomba, Queensland), Pinnacle® compressed yeast (Mauri Integrated Ingredients, Toowoomba, Queensland, Australia), Fluid Bread Shortening (FBS) supplied by GFW Food Services (Botany, New South Wales, Australia) and

31
standard food grade salt. The composition of the honey, Gemsweet 42® and dried honey are displayed in Table 3.1. Table 3.1 Composition of Queensland liquid iron bark honey, Gemsweet 42® and dried honey
Sample Fructose %
Glucose %
Sucrose %
Maltose %
Moisture %
Iron Bark Honey 37.1 27.9 2.1 3.1 16.8 Gemsweet 42® 25.1 30.5 0.7 Nd >25.0 Dried Honey 12.8 9.3 Nd 1.9 3.5
3.4.3 Experimental Design Ten bread formulations, involving the addition of either honey or Gemsweet 42® at 1%, 3%, 4% or 5% w/w flour (dry basis), dried honey at 5% w/w flour (dry basis) and a control with no honey or sugar were prepared. An incomplete block experimental design was used due to the following limitations in the baking and sensory evaluation steps: only five treatments (30 loaves) could be baked in one day, and only five samples could be tasted at any one session. Each replicate was carried out over two consecutive weeks, since each bread sample was assessed over four days. Three replicates were conducted over an eight-month period. 3.4.4 Baking of Bread Baking trials were conducted at the Defiance Milling Research and Development Facility (Acacia Ridge, Queensland, Australia). Preliminary trials were first conducted to determine optimum mixing and baking conditions. The dough was cut, moulded, proofed and baked by a qualified baker, using standard Defiance Milling Ltd. procedures. Loaves made from the preliminary trials were used to train taste panellists. The dough was mixed in a Jeffco 3 kg high-speed mixer (Jeffries Bros. Ltd., Northgate, Queensland, Australia) for a total of 3 min and 15 s (time determined in the preliminary trials). Honey or the sugar syrup was added after 2 min and 15 s of mixing. After mixing, the dough was removed from the mixer bowl, placed on a bench covered in plastic for 10 min, then cut into 780 g portions, rounded by hand and rested for a further 10 min under plastic. Dough portions were then punched and moulded using a GTP moulder (GTP, Taiwan). Moulded portions were then rolled by hand, cut into four pieces and arranged in tins. The loaves were placed in a prover (38 °C and 85% R.H.) until the dough was 1 cm from the top of the tin. Proof time was recorded and the loaves were baked in a Baker Perkins rotary oven (Baker Perkins, Smithfield, New South Wales, Australia) for 30 min at 220 °C. At 2 h after removal from the oven, loaves were sliced into 11 mm thick slices (22 slices per loaf) and placed in commercial bread wrappers made from 35 µm low density polyethylene (LDPE). All loaves were stored at room temperature (22-24 °C). 3.4.5 Texture Measurements on Bread Bread firmness was measured using a TA-XT2 Texture Analyser (Stable Micro Systems Ltd, Surrey, England) in accordance with the current method used by Defiance Milling (described below). This was an industry adaptation of the AACC official method 74-09 (Boyacioglu and D’Appolonia, 1994). To determine the progress of staling, measurements were taken at the same time on five consecutive days, which are defined as Day 0 through to Day 4, with Day 0 being the day of baking. Two different texture measurements were taken, side wall and crumb firmness. Sidewall was measured to determine overall firmness of the loaf. Consumers ‘squeeze’ the loaf in the supermarket

32
to determine freshness; therefore measuring sidewall resistance to pressure gives an indication of consumer preference (Hebeda et al., 1990). Crumb firmness is considered to be more indicative of the loaves eating quality. Only the crumb firmness measurements are reported here, as the loaves eating quality was assessed by sensory evaluation. In order to conduct the texture measurements, loaves were removed from their packaging and divided into sections. From the left hand end of the loaf, slices were counted until slices 6 and 7 were found. These were marked samples 1 and 2 respectively. This was repeated from the right hand end of the loaf. In this case, slices 6 and 7 from the right hand end were marked samples 4 and 3 respectively. The contact surfaces of samples 1 and 2 and those of samples 3 and 4 were used as the test surfaces, with all slices under these samples remaining in place. Five different points around each of the samples were measured to determine the crumb firmness of the loaf. One measurement was taken at each of the four corners (1 cm from the crust) and one in the centre of the slice. The TA-XT2 flat 36 mm diameter and 5 mm high plunger was set to penetrate 10 mm into the slice from the first resistance with a speed of 1.7 mm/sec. In addition to the texture results for individual measuring points of each slice, the five results (per slice) were averaged to determine the graph point for each loaf. 3.4.6 Sensory Evaluation of Bread Sensory evaluation is often used in the baking industry to assess the degree of staling and predict consumer judgement of the crumb. A standard AACC method 74-30 has been developed for the sensory evaluation of bread staling in industry. The method is reported to have fundamental procedural problems and uses poorly defined scales (Bramesco and Sester, 1990). Due to these limitations, the official method was not used for this work. Panellists were selected from staff in the Centre for Food Technology (Hamilton, Queensland) who were experienced in sensory profiling methods and were regular consumers of white bread. Round table discussion sessions were held where panellists tasted the bread from the preliminary trials and agreed on descriptors to define the scales for the questionnaire. Taste panels were conducted on Days 1, 2, 3 and 4, ie. 21, 45, 69 and 93 h after the last sample was removed from the oven. It was not logistically possible to taste on Day 0, and in commercial situations it is more usual for sliced bread to be purchased through supermarkets the day following baking. Two loaves of each treatment, stored in LDPE bags at room temperature (22-24 °C) were tested in each trial. Bread slices were cut into triangle shape quarters and presented, 5 per session, to 12 panellists according to the incomplete block design used for the baking. The panellists evaluated the sample for crust colour, openness of texture, yeastiness, sweet odour, consistency, moistness, breakdown of pastiness, freshness, sweetness and white bread flavour. These characteristics were scored on “just right” scales where end points were identified as “too little or too much” of the labelled descriptor. Data were collected using a fully integrated computerised software system (CSA fivever 4.3, Compusense Inc., Canada) which converted ratings to scores between 0 and 100. 3.4.7 Statistical Analysis To determine the changes in crumb firmness during staling, texture measurements were averaged to give the average Graph Point Value and analysed using analysis of variance. Additionally, texture measurements for individual texture measuring points (five per slice) were analysed using analysis of variance. Mean panellist scores for each characteristic were analysed by analysis of variance according to the incomplete block design. Where a significant (P<0.05) F ratio was found, pairwise comparisons of

33
adjusted (for session effects) means were made using Fisher’s least significant difference (LSD) procedure. Additionally, the sensory data (excluding ‘overall acceptability’) were subjected to principal components analysis to help identify groupings or trends over the storage period. 3.5 The Effect of Honey Incorporation on Dough and Bread Properties Under Commercial Bread-Making Conditions 3.5.1 Introduction Honey was added to dough at varying levels. Properties of these samples such as proofing performance (time and volume) were then compared to a control dough sample (containing no honey or model sugar solution) and dough samples containing various levels of a model sugar solution (consisting of the same levels of glucose, fructose, sucrose and maltose as the honey used). The doughs containing honey were then baked and properties of bread such as texture (using a TA-XT2 analyser), water activity (using a Novasina water activity meter), cellular structure (crumb cellular elongation and fineness using a scanner), and crust thickness and contrast (using a scanner) were compared to those of a control bread sample (containing no honey or model sugar solution) and bread samples containing various levels of a model sugar solution (consisting of the same levels of glucose, fructose, sucrose and maltose as the honey used). 3.5.2 Honey Sample A bulk sample of iron bark honey was supplied by Capilano Honey Limited (Brisbane Australia). This bulk iron bark honey sample was different to the one detailed in Sections 3.1, 3.2 and 3.3, and the one described in Section 3.4. The bulk honey was stored in its original container at 4°C, to minimize enzymatic and chemical activity, until needed. 3.5.3 Determination of Fructose, Glucose, Sucrose and Maltose Composition of Iron
Bark Honey The levels of fructose, glucose and sucrose in the honey were determined by HPLC using the same method as in Section 3.1.3. These values are detailed in Table 3.2.
Table 3.2 Sugar composition of iron bark honey
Sample Fructose %
Glucose %
Sucrose %
Maltose %
Iron Bark Honey 41.3 30.2 2.6 1.0 3.5.4 Experimental Design The baking performance of bread was measured using honey addition levels of 2%, 3%, 4% and 6% w/w flour (dry basis). These loaves were compared against loaves of bread containing the same levels of the model sugar solution, and both against a control bread containing no honey or model sugar solution. The baked loaves were then stored at room temperature for 4 days, with testing occurring at Days 0, 1, 2, 3 and 4. Separate loaves were used for testing at each storage time. The whole experiment was replicated 3 times [ie. a 5 levels x 2 sugar sources (honey and model sugar solution) x 5 storage times x 3 replications: a total of 150 loaves]. The loaves were baked over a three day period (50 loaves per day). A completely randomized design was used for the baking of the 150 loaves. Additionally, each batch of dough was used to prepare 5 loaves which were assigned as Day 0, 1, 2, 3, 4. Each replication represented a different dough batch. Thus, a total of 30 (5 levels x 2 sources x 3 replications) batches of dough were prepared.

34
The sugar composition of the model sugar solution was exactly the same as that of honey, with the only difference being the absence of the other components of honey such as wax, acids, volatile constituents, enzymes etc. 3.5.5 Preparation of Bread Room temperature was maintained at 25 °C. Equipment, bread premix and other ingredients were equilibrated at room temperature. 3.5.5.1 Honey solution preparation A stock solution of honey was prepared by diluting the honey to 50%w/w. The stock honey solution was then stored at 4 °C until required. To prevent possible microbial activity, the stock solution was remade every 48 h. 3.5.5.2 Model sugar solution preparation The model sugar solution was formulated to give the same D-fructose, D-glucose, sucrose and maltose concentration as a 1:1 diluted sample (with purified water) of the honey used in this experiment. Solutions were stored at 4 °C until required. Each model sugar solution was kept for no longer than 48 h before discarding. 3.5.5.3 Bakers flour sample A commercial bakers flour (Defiance Milling Ltd.) was used. This bakers flour is currently the bread formulation supplied to small bakeries in Queensland and Northern New South Wales. 3.5.5.4 Preparation of dough sample Baking trials were conducted at the Defiance Milling Research and Development Facility (Acacia Ridge, Queensland, Australia). The following dough formulation was used: Flour 3 kg; Improver 30 g; compressed yeast 90 g; salt 60 g; fluidized bread shortening (FBS) 60 g; water 1600-1800 g; treatment 60-120 g; and calcium propanate 6 g. The doughs used to prepare all the loaves were subject to the same mixing time, as it was found in preliminary trials that the mixer used for the investigation did not produce different mixing times for the control doughs compared to the doughs containing honey or the model sugar solution. The dough was cut, moulded, proofed, and baked by a qualified baker, using standard Defiance Milling Ltd. procedures. The dough was mixed in a Jeffco 3 kg high-speed mixer (Jeffries Bros. Ltd., Northgate, Queensland, Australia) for a total of 3 min and 15 s. The honey or model sugar solutions were added prior to commencing the mixing. After mixing, the dough was removed from the mixer bowl, placed on a bench covered in plastic for 10 min, then cut into 780 g portions, rounded by hand, and finally rested for a further 10 min under plastic. Dough portions were then punched and moulded using a GTP moulder (GTP, Taiwan). Moulded portions were then rolled by hand, cut into four pieces and arranged in tins. 3.5.5.5 Baking of bread The loaves were placed in a prover (38 °C and 85% R.H.) until the dough was 1 cm from the top of the tin. Proof time and volume were recorded, and the loaves were baked in a Baker Perkins rotary oven (Baker Perkins, Smithfield, New South Wales, Australia) for 30 min at 220 °C. At 2 h after removal

35
from the oven, loaves were sliced and placed in commercial bread wrappers made from 35 µm low density polyethylene (LDPE). All loaves were stored at room temperature (22-24 °C). Baking was done over a period of 3 days. 3.5.6 Storage of Bread Water activity and bread firmness were measured every 24 h from when the loaves first cooled down, until the loaves were considered to be too stale to consume (96 h). Water activity was determined using a ‘Novasina’ water activity meter, and firmness was measured using a TA-XT2 texture analyser at 5 points on a slice. 3.5.7 Sampling Plan of Slices for Measurement Figure 3.2 details the sampling plan for the slices. The two middle slices (S1 and S2 in Figure 3.2) in each loaf were chosen giving two internal (facing) surfaces to be tested. Of these two adjacent internal surfaces, one was used for water activity measurement and one for texture measurement. A randomized design was used for the texture and water activity measurements, ie. which of the two slices (S1 or S2) per loaf was chosen for texture measurement and which for water activity measurement was randomized for the 150 loaves prior to the experiment commencing. The circular samples for water activity were physically removed from the slices, thus destroying the slice. Once tests on slices were completed or samples of slices were physically removed (for later testing) from a particular loaf on a particular storage day, the loaf was discarded. Thus, there was a need for completely separate loaves for each storage day.
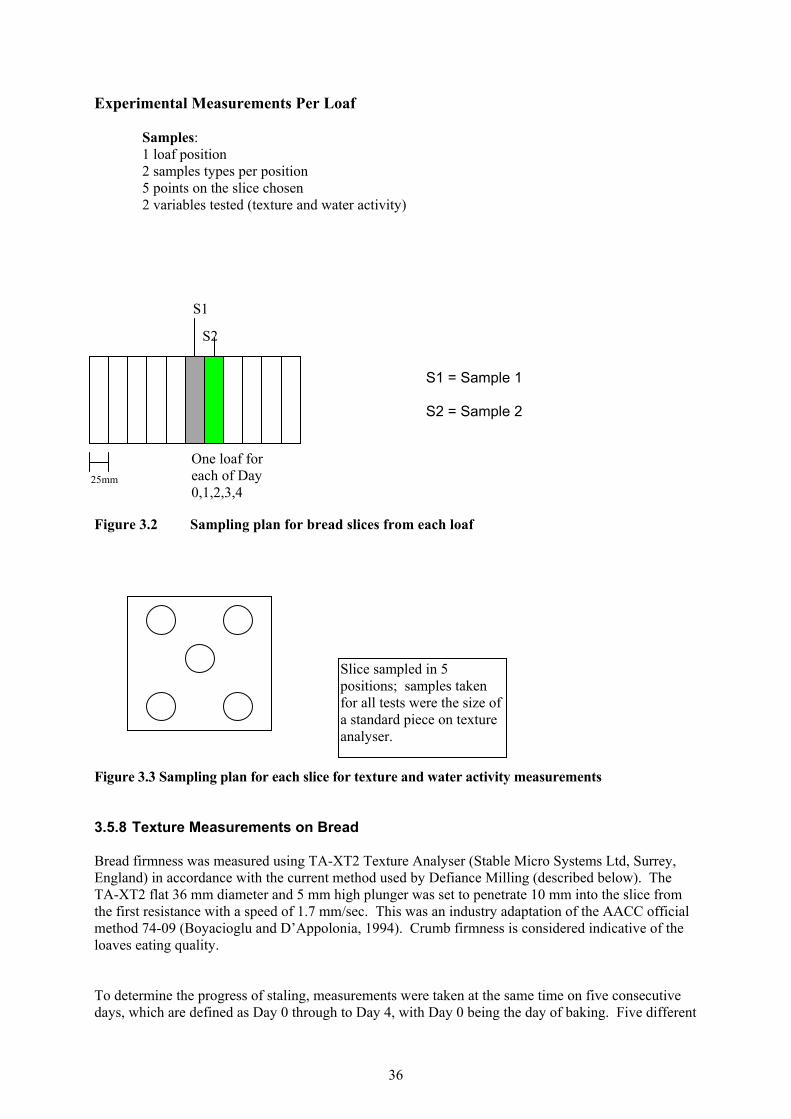
36
Experimental Measurements Per Loaf
Samples: 1 loaf position 2 samples types per position 5 points on the slice chosen 2 variables tested (texture and water activity)
Figure 3.2 Sampling plan for bread slices from each loaf
Figure 3.3 Sampling plan for each slice for texture and water activity measurements 3.5.8 Texture Measurements on Bread Bread firmness was measured using TA-XT2 Texture Analyser (Stable Micro Systems Ltd, Surrey, England) in accordance with the current method used by Defiance Milling (described below). The TA-XT2 flat 36 mm diameter and 5 mm high plunger was set to penetrate 10 mm into the slice from the first resistance with a speed of 1.7 mm/sec. This was an industry adaptation of the AACC official method 74-09 (Boyacioglu and D’Appolonia, 1994). Crumb firmness is considered indicative of the loaves eating quality. To determine the progress of staling, measurements were taken at the same time on five consecutive days, which are defined as Day 0 through to Day 4, with Day 0 being the day of baking. Five different
25mm
One loaf for each of Day 0,1,2,3,4
S1
S1 = Sample 1 S2 = Sample 2
S2
Slice sampled in 5 positions; samples taken for all tests were the size of a standard piece on texture analyser.

37
points around the surface of each middle slice (S1 or S2) per loaf were measured to determine the crumb firmness of the loaf (Figure 3.3). One measurement was taken at each of the four corners (1 cm from the crust) and one in the centre of the slice (Figure 3.3). The five texture measurements for one slice per loaf were averaged to give the graph point for each loaf. 3.5.9 Other Parameters Determined The other parameters under investigation were: proofing performance (time and volume) of the bread doughs during baking; cellular structure of the baked bread; and water activity changes in the bread loaves during storage. This is an extension of the work detailed in Section 3.4. 3.5.9.1 Proofing performance of doughs Gas production was measured as the volume change every 10 min, over 60 min of dough fermentation. The time to complete proofing was also measured. 3.5.9.2 Cellular structure of bread loaves Cellular elongation, cell fineness, crust thickness, and crust contrast (lightness/darkness contrast against the bread crumb at the centre of the bread slice) were objectively measured as arbitrary scores using a scanner and specially designed computer software (courtesy of Defiance Milling Ltd.). 3.5.9.3 Water activity of bread The middle slice facing the one used for the texture measurements was removed from each loaf, and a 36 mm diameter circular piece of the slice was then removed from the middle of the slice as per Figures 3.2 and 3.3, and its water activity immediately determined using a Thermoconstanter Water Activity Meter (Novasina, Switzerland). 3.5.10 Statistical Analysis Data were analysed using a simple factorial analysis of variance model (General Linear Model) in SPSS version 6.1 for Microsoft Windows 3.1x, with a completely randomized design. Proofing time, crumb cellular elongation, crumb cell fineness, crust thickness, and crust contrast, were entered as the dependent variables against the independent variables of:
(a) Source (ie. honey or model sugar solution)
(b) Addition level Water activity and texture (firmness) of the bread were entered as the dependent variables against the independent variables of:
(a) Source (ie. honey or model sugar solution)
(b) Addition level
(c) Time of storage Where a significant (P<0.05) F ratio was found, 95% confidence intervals for mean measurements were determined based on pooled standard deviations.

38
4. Results 4.1 The Effect of Honey Addition on the Rheological Properties of Bread Doughs During High Shear Mixing The results of the effect of addition, at various levels, of honey or a model sugar solution (with the same amounts of fructose, glucose, sucrose and maltose as the honey) on dough development time (mixing time), dough strength, and dough stability are detailed below. 4.1.1 Peak Dough Development Time/Dough Mixing Time The results for the effect of honey or the model sugar solution on the dough development time are graphically presented in Figure 4.1. The mixing times or peak development times of doughs containing honey were significantly different (P<0.05) to those of doughs containing the model sugar solution. However, there was no significant difference (P>0.05) in the mixing times of doughs containing different levels (including the control, 0%) of honey or the model sugar solution. At low levels of addition of honey or the model sugar solution (1%-4% w/w flour, dry basis), there was no significant difference (P>0.05) (Figure 4.1) in the mixing time of dough containing honey compared to dough containing the model sugar solution for the same levels of addition (even though Figure 4.1 with actual standard deviations, rather than pooled standard deviations, suggests otherwise for 2%). The addition of honey to dough at a 5% (w/w flour, dry basis) level did not produce a significant difference (P>0.05) in the mixing time compared to that of a dough containing the same level of the model sugar (even though Figure 4.1 with actual standard deviations, rather than pooled standard deviations, suggests otherwise for 5%). Doughs containing higher levels of honey (6%-10% w/w flour, dry basis) had significantly shorter (P<0.05) mixing times than doughs containing 6%-10% levels of the model sugar solution, no matter what level is chosen for comparison (Figure 4.1).

39
0.0
0.5
1.0
1.5
2.0
2.5
3.0
3.5
4.0
0 1 2 3 4 5 6 7 8 9 10Addition Level (%w/w flour)
Mix
ing
Tim
e (m
inut
es)
Honey
Model Sugar Solution
Figure 4.1 Mean peak dough development time (mixing time; min) of doughs made using standard bakers flour with increasing levels of honey compared to the mixing time of doughs containing increasing levels of a model sugar solution
(The model solution contains the same fructose, glucose, sucrose and maltose concentration as the honey sample; actual standard deviations for each sample are included, rather than the pooled ones used for significance) Means are means of replications; SE = 0.09; Source (honey or sugar) P = 0.000; Addition Level P = 0.537
-Honey; -Model sugar solution.

40
4.1.2 Dough Strength The results for the effect of honey and the model sugar solution on dough strength are graphically presented in Figure 4.2. The strength of dough containing honey was significantly different (P<0.05) to that of dough containing the model sugar solution. Additionally, there was a significant difference (P<0.05) in the strengths of doughs containing different levels of honey or the model sugar solution. There was no significant effect (P>0.05) on dough strength through using any level of addition of honey in the dough formulation compared to using no honey or sugar (0% control). However, there was a significant difference (P<0.05) between individual doughs containing honey, with the 4% levels producing significantly stronger (P<0.05) doughs than the 6% and 8% levels, which were not significantly different (P>0.05) from each other (Figure 4.2). Additionally, there was no significant difference (P>0.05) in dough strength between using honey relative to using the model sugar solution at all individual levels, except the 4% and 9% levels (even though Figure 4.2 with actual standard deviations, rather than pooled standard deviations, suggests 5% and 8% as well). At these two levels (4% and 9%), honey addition significantly increased (P<0.05) dough strength relative to addition of the model sugar solution. Further, doughs containing the model sugar solution at a 3% level had a significantly higher (P<0.05) dough strength than doughs formulated using 6%, 8% and 9% levels of the model sugar solution. Finally, doughs formulated using any level of addition of the model sugar solution were not significantly (P>0.05) weaker or stronger than the control sample (0%).
500
520
540
560
580
600
620
640
660
680
700
0 1 2 3 4 5 6 7 8 9 10Addition Level (%w/w flour)
Dou
gh S
tren
gth
(Bra
bend
er U
nits
)
Honey
Model Sugar Solution
Figure 4.2 Mean strength (BU) of doughs made using standard bakers flour with increasing levels of honey compared to the dough strength (BU) of doughs containing increasing levels of a model sugar solution
(The model solution contains the same fructose, glucose, sucrose and maltose concentration as the honey sample; actual standard deviations for each sample are included, rather than the pooled ones used for significance) Means are means of replications; SE = 9.1; Source (honey or sugar) P = 0.000; Addition Level P = 0.025
-Honey; -Model sugar solution.
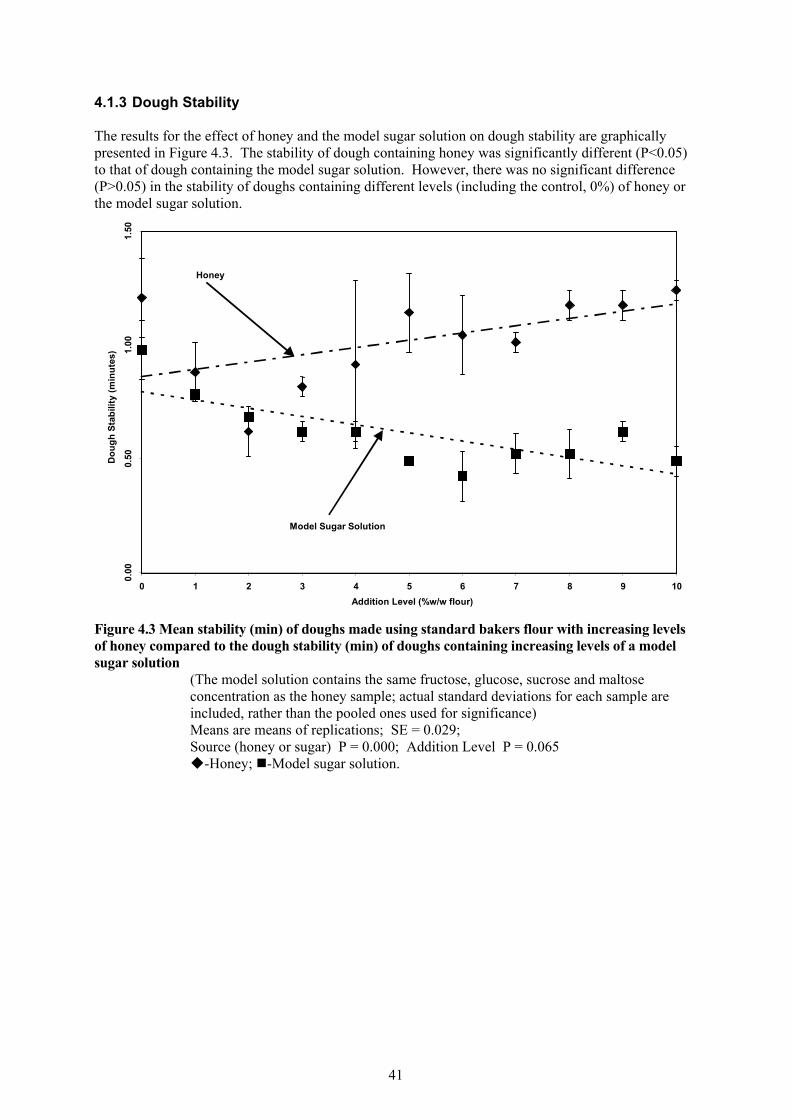
41
4.1.3 Dough Stability The results for the effect of honey and the model sugar solution on dough stability are graphically presented in Figure 4.3. The stability of dough containing honey was significantly different (P<0.05) to that of dough containing the model sugar solution. However, there was no significant difference (P>0.05) in the stability of doughs containing different levels (including the control, 0%) of honey or the model sugar solution.
0.00
0.50
1.00
1.50
0 1 2 3 4 5 6 7 8 9 10Addition Level (%w/w flour)
Dou
gh S
tabi
lity
(min
utes
)
Model Sugar Solution
Honey
Figure 4.3 Mean stability (min) of doughs made using standard bakers flour with increasing levels of honey compared to the dough stability (min) of doughs containing increasing levels of a model sugar solution
(The model solution contains the same fructose, glucose, sucrose and maltose concentration as the honey sample; actual standard deviations for each sample are included, rather than the pooled ones used for significance) Means are means of replications; SE = 0.029; Source (honey or sugar) P = 0.000; Addition Level P = 0.065
-Honey; -Model sugar solution.

42
The model sugar solution at levels of 5%, 6%, 7%, 8%, 9%, and 10% produced doughs that were significantly less stable (P<0.05) than the doughs containing honey added at the same levels. On the other hand, doughs containing 1%-4% levels of the model sugar solution were not significantly different (P>0.05) from the doughs containing honey added at the same levels (even though for 3% in Figure 4.3, the actual standard deviation, rather than the pooled standard deviation, suggests otherwise). 4.2 Kinetics of Gelatinization of Plain Bread Doughs Containing Honey The results of the effect of addition, at various levels, of honey and the model sugar solution (with the same amounts of fructose, glucose, sucrose and maltose as the honey) on the gelatinization temperature, gelatinization energy, and glass transition temperature of dough is presented below. 4.2.1 Gelatinization Temperature of Doughs The results for the effect of honey and the model sugar solution on the gelatinization temperatures of doughs are presented in Table 4.1 (see also Appendix 1). The gelatinization temperatures of doughs containing honey were not significantly different (P>0.05) to those of doughs containing the model sugar solution. However, there was a significant difference (P<0.05) in the gelatinization temperatures of doughs containing different levels (including the control, 0%) of honey or the model sugar solution. Dough containing honey at a 6% level had a significantly higher (P<0.05) gelatinization temperature than the control dough (0%) (Table 4.1). Furthermore, there was no significant difference (P>0.05) in the gelatinization temperatures between the control dough (0%) and the doughs containing 2%, 4% and 8% honey or model sugar solution. For doughs containing the model sugar solution, those with levels of 6% had significantly higher (P<0.05) gelatinization temperatures than the control dough (0%) and the doughs containing levels of 2% and 4%, but were not significantly different (P>0.05) from doughs with levels of 8%. Table 4.1 Mean gelatinization temperatures (°C) of doughs containing various levels of honey or a model sugar solution
Level of addition (%w/w flour)
Mean+ Gelatinization Temperature (°C)
Honey* Model Sugar Solution*
Control (0%) 108.5a 108.5a 2 108.7ab
107.0a
4 115.3ab 106.3a
6 116.0b
116.3b
8 109.7ab 109.7ab
*ANOVA significant (P<0.05) +Means are means of replications; SE = 1.5 Means in the same column with the same superscript are not significantly different (P>0.05) (The model sugar solution contains the same level of fructose, glucose, sucrose, and maltose as the honey sample.) Source (honey or sugar) P = 0.288; Addition Level P = 0.012
4.2.2 Gelatinization Energy of Doughs The results for the effect of honey and the model sugar solution on the gelatinization energy of doughs are graphically represented in Figure 4.4. The gelatinization energy of dough containing honey was significantly different (P<0.05) to that of dough containing the model sugar solution. Additionally,

43
there was a significant difference (P<0.05) in the gelatinization energies of doughs containing different levels (including the control, 0%) of honey or the model sugar solution. The gelatinization energies for the doughs containing honey at 6% and 8% levels were significantly lower (P<0.05) than for doughs containing honey levels of 4% or lower (including the 0% control). Additionally, the gelatinization energies for the doughs containing honey at 6% and 8% levels were significantly lower (P<0.05) than the energies for the doughs containing the model sugar solution at levels of 6% or lower (Figure 4.4). Further, there was no significant difference (P>0.05) between the gelatinization energies of the control (0%) dough and the doughs containing 2% honey, 4% honey, 2% model sugar solution, or 4% model sugar solution, which were not significantly different (P>0.05) from each other. Finally, doughs containing 6% and 8% model sugar solution had significantly lower (P<0.05) gelatinization energies than the control dough (0%) and doughs containing 2% and 4% model sugar solution.
500
600
700
800
900
1000
0 2 4 6 8Addition level (%w/w flour)
Gel
atin
isat
ion
Ener
gy (J
/g)
Honey
Model Sugar Solution
Figure 4.4 Mean gelatinization energy (J/g) of doughs made using standard bakers flour with increasing levels of honey compared to the gelatinization energy (J/g) of doughs containing increasing levels of a model sugar solution
(The model solution contains the same fructose, glucose, sucrose and maltose concentration as the honey sample; actual standard deviations for each sample are included, rather than the pooled ones used for significance) Means are means of replications; SE = 11.5; Source (honey or sugar) P = 0.017; Addition Level P = 0.000
-Honey; -Model sugar solution.
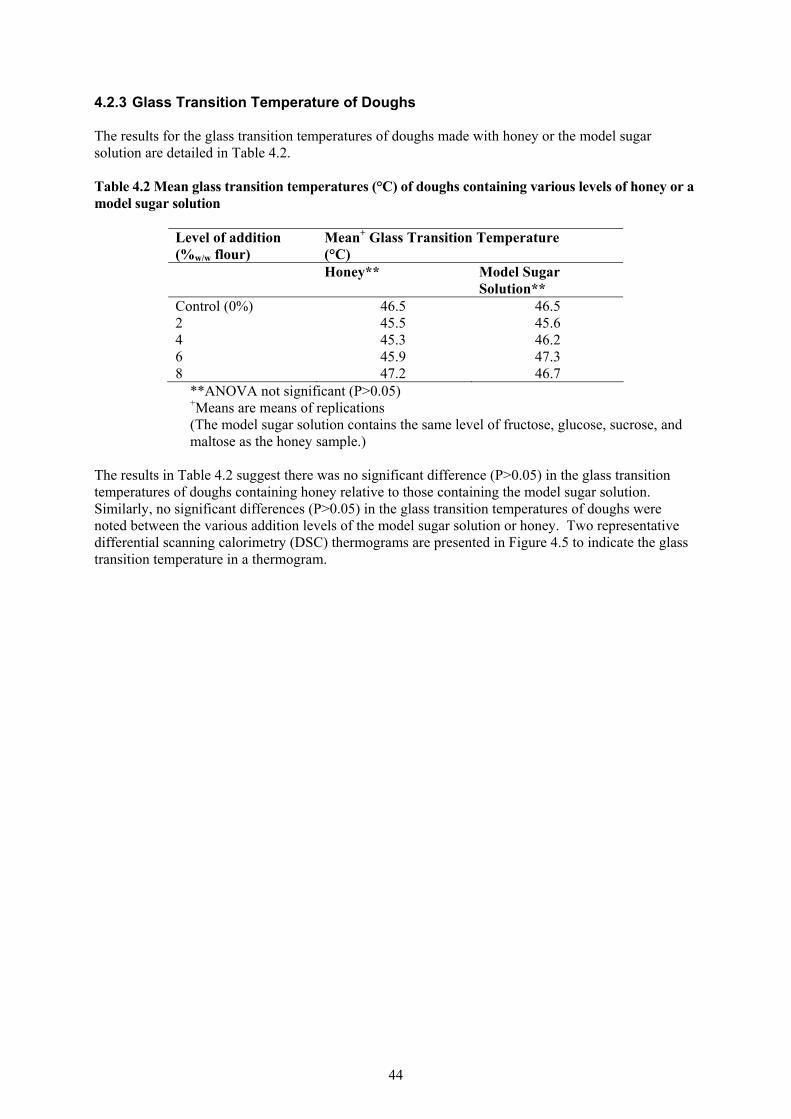
44
4.2.3 Glass Transition Temperature of Doughs The results for the glass transition temperatures of doughs made with honey or the model sugar solution are detailed in Table 4.2. Table 4.2 Mean glass transition temperatures (°C) of doughs containing various levels of honey or a model sugar solution
Level of addition (%w/w flour)
Mean+ Glass Transition Temperature (°C)
Honey** Model Sugar Solution**
Control (0%) 46.5 46.5 2 45.5 45.6 4 45.3 46.2 6 45.9 47.3 8 47.2 46.7
**ANOVA not significant (P>0.05) +Means are means of replications (The model sugar solution contains the same level of fructose, glucose, sucrose, and
maltose as the honey sample.) The results in Table 4.2 suggest there was no significant difference (P>0.05) in the glass transition temperatures of doughs containing honey relative to those containing the model sugar solution. Similarly, no significant differences (P>0.05) in the glass transition temperatures of doughs were noted between the various addition levels of the model sugar solution or honey. Two representative differential scanning calorimetry (DSC) thermograms are presented in Figure 4.5 to indicate the glass transition temperature in a thermogram.

45
(a)
(b)
Figure 4.5 Example differential scanning calorimetry (DSC) thermograms for determination of glass transition temperatures for: (a) doughs with 8% honey; and (b) doughs with 4% model sugar solution

46
4.3 Viscosity of Gelatinization of Batters Containing Honey The results for the effect of addition, at various levels, of honey and the model sugar solution (with the same amounts of fructose, glucose, sucrose and maltose as the honey) on the viscosity and gelatinization of batters are presented below. 4.3.1 Torque Resistance to Shear of Batters at Various Temperatures The results for the torque resistance to shear (resistance viscosities) with units of Brabender Units of the batters containing various levels of honey or the model sugar solution are graphically presented in Figure 4.6. Important data from Figure 4.6 will be highlighted below.
0
100
200
300
400
500
600
700
800
900
1000
50 60 70 80 90 100
Temperature
Visc
osity
(BU
)
H60 H100 H140 H180 S60 S100 S140 S180 Control Figure 4.6 Comparison of mean viscosities during heating of batters made from high-ratio flour using honey or a model sugar solution at various levels.
Legend: H = honey, S = model sugar solution; numeric = level of addition % w/w flour, dry basis. Means are means of replications. Note: Data plotted from original data, which used a viscosity of 100 BU as the zero point.
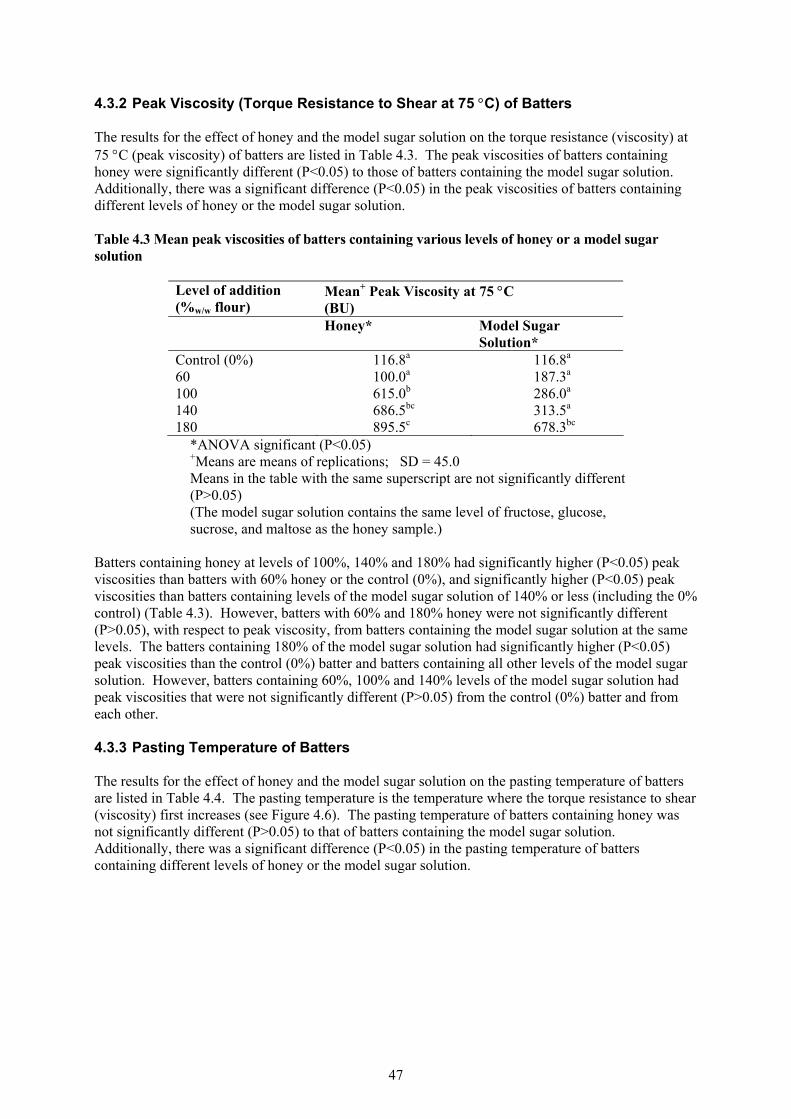
47
4.3.2 Peak Viscosity (Torque Resistance to Shear at 75 °C) of Batters The results for the effect of honey and the model sugar solution on the torque resistance (viscosity) at 75 °C (peak viscosity) of batters are listed in Table 4.3. The peak viscosities of batters containing honey were significantly different (P<0.05) to those of batters containing the model sugar solution. Additionally, there was a significant difference (P<0.05) in the peak viscosities of batters containing different levels of honey or the model sugar solution. Table 4.3 Mean peak viscosities of batters containing various levels of honey or a model sugar solution
Level of addition (%w/w flour)
Mean+ Peak Viscosity at 75 °C (BU)
Honey* Model Sugar Solution*
Control (0%) 116.8a 116.8a 60 100.0a 187.3a
100 615.0b 286.0a
140 686.5bc 313.5a
180 895.5c 678.3bc
*ANOVA significant (P<0.05) +Means are means of replications; SD = 45.0
Means in the table with the same superscript are not significantly different (P>0.05) (The model sugar solution contains the same level of fructose, glucose, sucrose, and maltose as the honey sample.)
Batters containing honey at levels of 100%, 140% and 180% had significantly higher (P<0.05) peak viscosities than batters with 60% honey or the control (0%), and significantly higher (P<0.05) peak viscosities than batters containing levels of the model sugar solution of 140% or less (including the 0% control) (Table 4.3). However, batters with 60% and 180% honey were not significantly different (P>0.05), with respect to peak viscosity, from batters containing the model sugar solution at the same levels. The batters containing 180% of the model sugar solution had significantly higher (P<0.05) peak viscosities than the control (0%) batter and batters containing all other levels of the model sugar solution. However, batters containing 60%, 100% and 140% levels of the model sugar solution had peak viscosities that were not significantly different (P>0.05) from the control (0%) batter and from each other. 4.3.3 Pasting Temperature of Batters The results for the effect of honey and the model sugar solution on the pasting temperature of batters are listed in Table 4.4. The pasting temperature is the temperature where the torque resistance to shear (viscosity) first increases (see Figure 4.6). The pasting temperature of batters containing honey was not significantly different (P>0.05) to that of batters containing the model sugar solution. Additionally, there was a significant difference (P<0.05) in the pasting temperature of batters containing different levels of honey or the model sugar solution.

48
Table 4.4 Mean pasting temperatures of batters containing various levels of honey or a model sugar solution
Level of addition (%w/w flour)
Mean+ Pasting Temperature (°C)
Honey* Model Sugar Solution*
Control (0%) 75.7a 75.7a 60 79.7a 75.1a
100 64.1b 67.1b
140 66.7b 68.8ab
180 65.5b 65.0b
*ANOVA significant (P<0.05) +Means are means of replications; SE = 1.4
Means in the same column with the same superscript are not significantly different (P>0.05) (The model sugar solution contains the same level of fructose, glucose, sucrose, and maltose as the honey sample.)
Batters containing honey at 100%, 140% and 180% had significantly lower (P<0.05) pasting temperatures than the control batter (0%) and those containing 60% honey (Table 4.4). Batters with honey or the model sugar solution at a level of 60% were not significantly different (P>0.05) from the control. Additionally, batters containing 100% and 180% levels of the model sugar solution had significantly lower (P<0.05) pasting temperatures than the control batter (0%) and those containing a 60% level of the model sugar solution. 4.3.4 Rate of Gelatinization [Temperature at a Viscosity of 500 BU (Brabender Units)]
of Batters The results for the effect of addition, at various levels, of honey or the model sugar solution on the temperature at which the viscosity of the batters reached 500 BU are listed in Table 4.5. The temperature at a viscosity of 500 BU of batters containing honey was not significantly different (P>0.05) to that of batters containing the model sugar solution. Additionally, there was a significant difference (P<0.05) in the temperature at a viscosity of 500 BU of batters containing different levels of honey or the model sugar solution. The temperatures at which batters containing honey at levels of 100%, 140% and 180% reached a viscosity of 500 BU were not significantly different (P>0.05) from each other, while all were significantly lower (P<0.05) than the temperature reached by the control batter (Table 4.5). The batters containing 180% levels of the model sugar solution had significantly lower (P<0.05) temperatures at a viscosity of 500 BU than the control, whereas those batters with levels of the model sugar solution of 60%, 100% and 140% had temperatures that were not significantly different (P>0.05) from each other or from the control batter (0%). Those batters containing 60% honey were not analysed, as their viscosity did not reach 500 BU.

49
Table 4.5 Mean temperature (°C) at a viscosity of 500 BU for batters containing various levels of honey or a model sugar solution
Level of addition (%w/w flour)
Mean+ Temperature at a Viscosity of 500 BU (°C)
Honey* Model Sugar Solution*
Control (0%) 85.6a 85.6a 60 - 85.5a
100 74.6b 80.5ab
140 74.1b 79.6ab
180 71.5b 73.9b
*ANOVA significant (P<0.05) +Means are means of replications; SE = 1.5
Means in the same column with the same superscript are not significantly different (P>0.05) (The model sugar solution contains the same level of fructose, glucose, sucrose, and maltose as the honey sample.)
4.4 The Effect of Honey on the Staling of White Pan Bread as Determined by Physical and Sensory Analyses This experiment was undertaken by Ms Nicole Squires as part of an earlier RIRDC project (UQ-54A), and is being reported again here as her results have been further statistically analysed, yielding new results of interest to RIRDC and the food industry. 4.4.1 Proofing Performance of Dough The addition of 3% honey to the dough reduced the proof time by 16 min, while 3% sugar reduced the proof time by 10 min. 4.4.2 Texture of Bread The previously reported analysis of the texture data for RIRDC Project UQ-54A (Caffin et al., 1996) gave results for the change in the firmness of bread (average graph point from 5 texture measurement points) during storage, ie. 0-4 days. This is graphically presented in Figure 4.7. There was no significant difference (P>0.05) in firmness between the treatments on any day of storage. As expected, there was a significant increase (P<0.05) in firmness (decrease in softness) with increase in storage times. These previously obtained results (Caffin et al., 1996) were reanalysed such that the texture results for each of the five individual measurement points (rather than averaging them as above) were individually statistically analysed. This reanalysis showed that bread containing 3% honey was significantly softer (P<0.05) relative to bread containing 3% sugar and the control bread (containing no honey or sugar), at all storage times, including immediately after baking (Day 0) (Figure 4.8). These results are presented graphically in Figure 4.8. This significant difference (P<0.05) equated to at least a 20 h retarding of bread staling by 3% honey addition levels. The decreased firmness (increased softness) immediately after baking (Day 0) was so evident that bread made with 3% honey was very difficult to slice in a mechanical slicer.

50
Figure 4.7 Mean crumb firmness of bread containing liquid honey, Gemsweet 42® (sugar) or dried honey as average texture measurements (graph points) versus storage time
% w/w flour, dry basis Across days within a treatment LSD: P<0.05 = 32.26, LSD: P<0.01 = 42.80 (Means are means of replications)
100.00
150.00
200.00
250.00
300.00
350.00
400.00
Day 0 Day 1 Day 2 Day 3 Day 4
Days
g/fo
rce
1% Honey 1% Sugar 3% Honey 3% Sugar 4% Honey
4% Sugar 5% Dried Honey 5% Honey 5% Sugar Control

51
9672
4824
03% Honey TL
3% Honey TR
3% Honey BL
3% Honey BR
3% Honey Centre
50
100
150
200
250
300
350
400
450
500
3% Honey Staling
450-500400-450350-400300-350250-300200-250150-200100-15050-100
Figure 4.8 Mean texture measurements of bread containing 3% liquid honey or 3% sugar, and a control bread (no sugar or honey) based on five individual points on a slice (% w/w flour, dry basis) (Means are means of replications)
9672
4824
03% Sugar TL
3% Sugar TR
3% Sugar BL
3% Sugar BR
3% Sugar Centre
0
50
100
150
200
250
300
350
400
450
500
3% Sugar Staling
450-500400-450350-400300-350250-300200-250150-200100-15050-1000-50
9672
4824
0Control TL
Control TR
Control BL
Control BR
Control Centre
50
100
150
200
250
300
350
400
450
500
Control Staling
450-500400-450350-400300-350250-300200-250150-200100-15050-100
51

52
4.4.3 Sensory Evaluation of Bread To evaluate the taster scores, the position mark on the line scale made by the taster was converted by the computer to a numerical score between zero and hundred, with the score of ‘just right’ being equal to a numerical score of fifty. The results from the ANOVA where significant differences were detected are displayed in Table 4.6. These values represent adjusted means from the incomplete block design with the significance of the F ratio (comparing treatments at each storage time) indicated by asterisks. Pairwise comparisons of treatment means are marked where the F ratio is significant (P<0.05). Scores for treatments that differ significantly from the control (0%) are printed in bold. Most of the significant differences (P<0.05) found between treatments occurred at Day 3 of storage. Only those attributes for which significant differences were found will be discussed. 4.4.3.1 Appearance Honey and sugar syrups have the ability to add sweetness to baked foods and darken the crust colour. To establish the impact of this addition on panellists, they were asked to rate the colour of the crust for each sample on ‘just right’ scales. Significant differences (P<0.05) were found between several treatments on Days 2, 3 and 4 of storage. On Day 2, crusts of bread containing higher levels of sugar or honey were generally significantly darker (P<0.05) and were actually rated closer to ‘just right’ (score of 50) (Figure 4.9). 4.4.3.2 Odour To determine the strength of the odour in terms of ‘yeastiness’ and ‘sweetness’, panellists were asked to rate these two attributes on ‘just right’ scales. The bread samples containing 4% sugar were significantly stronger (P<0.05) than: the control; the samples containing 3% or 5% sugar; and the samples containing 4% or 5% honey. Additionally, the bread samples containing 4% sugar were rated furthest away from the ‘just right’ point, indicating that a strong ‘yeasty’ odour was not desirable (ie. too yeasty). All honey treatments produced loaves that were not significantly different (P>0.05) in ‘yeasty’ odour from the control (see Figure 4.10).
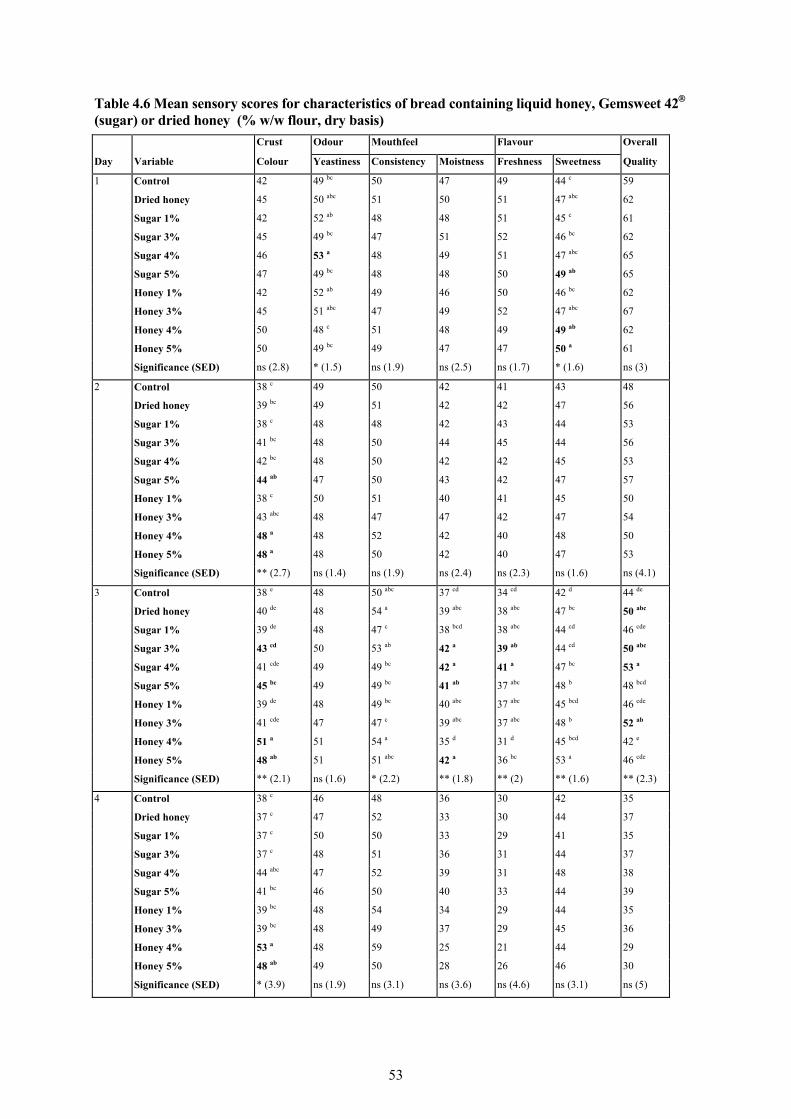
53
Table 4.6 Mean sensory scores for characteristics of bread containing liquid honey, Gemsweet 42® (sugar) or dried honey (% w/w flour, dry basis)
Crust Odour Mouthfeel Flavour Overall
Day Variable Colour Yeastiness Consistency Moistness Freshness Sweetness Quality
1 Control 42 49 bc 50 47 49 44 c 59
Dried honey 45 50 abc 51 50 51 47 abc 62
Sugar 1% 42 52 ab 48 48 51 45 c 61
Sugar 3% 45 49 bc 47 51 52 46 bc 62
Sugar 4% 46 53 a 48 49 51 47 abc 65
Sugar 5% 47 49 bc 48 48 50 49 ab 65
Honey 1% 42 52 ab 49 46 50 46 bc 62
Honey 3% 45 51 abc 47 49 52 47 abc 67
Honey 4% 50 48 c 51 48 49 49 ab 62
Honey 5% 50 49 bc 49 47 47 50 a 61
Significance (SED) ns (2.8) * (1.5) ns (1.9) ns (2.5) ns (1.7) * (1.6) ns (3)
2 Control 38 c 49 50 42 41 43 48
Dried honey 39 bc 49 51 42 42 47 56
Sugar 1% 38 c 48 48 42 43 44 53
Sugar 3% 41 bc 48 50 44 45 44 56
Sugar 4% 42 bc 48 50 42 42 45 53
Sugar 5% 44 ab 47 50 43 42 47 57
Honey 1% 38 c 50 51 40 41 45 50
Honey 3% 43 abc 48 47 47 42 47 54
Honey 4% 48 a 48 52 42 40 48 50
Honey 5% 48 a 48 50 42 40 47 53
Significance (SED) ** (2.7) ns (1.4) ns (1.9) ns (2.4) ns (2.3) ns (1.6) ns (4.1)
3 Control 38 e 48 50 abc 37 cd 34 cd 42 d 44 de
Dried honey 40 de 48 54 a 39 abc 38 abc 47 bc 50 abc
Sugar 1% 39 de 48 47 c 38 bcd 38 abc 44 cd 46 cde
Sugar 3% 43 cd 50 53 ab 42 a 39 ab 44 cd 50 abc
Sugar 4% 41 cde 49 49 bc 42 a 41 a 47 bc 53 a
Sugar 5% 45 bc 49 49 bc 41 ab 37 abc 48 b 48 bcd
Honey 1% 39 de 48 49 bc 40 abc 37 abc 45 bcd 46 cde
Honey 3% 41 cde 47 47 c 39 abc 37 abc 48 b 52 ab
Honey 4% 51 a 51 54 a 35 d 31 d 45 bcd 42 e
Honey 5% 48 ab 51 51 abc 42 a 36 bc 53 a 46 cde
Significance (SED) ** (2.1) ns (1.6) * (2.2) ** (1.8) ** (2) ** (1.6) ** (2.3)
4 Control 38 c 46 48 36 30 42 35
Dried honey 37 c 47 52 33 30 44 37
Sugar 1% 37 c 50 50 33 29 41 35
Sugar 3% 37 c 48 51 36 31 44 37
Sugar 4% 44 abc 47 52 39 31 48 38
Sugar 5% 41 bc 46 50 40 33 44 39
Honey 1% 39 bc 48 54 34 29 44 35
Honey 3% 39 bc 48 49 37 29 45 36
Honey 4% 53 a 48 59 25 21 44 29
Honey 5% 48 ab 49 50 28 26 46 30
Significance (SED) * (3.9) ns (1.9) ns (3.1) ns (3.6) ns (4.6) ns (3.1) ns (5)

54
Control c
Dried Honey bc
Sugar 1% c
Sugar 3% bc
Sugar 4% bc
Sugar 5% ab
Honey 1% c
Honey 3% abc
Honey 4% a
Honey 5% a
30 35 40 45 50 55 60
Trea
tmen
ts
Sensory Score Figure 4.9 Mean sensory scores of crust colour of bread containing liquid honey, Gemsweet 42® (sugar) or dried honey at Day 2 of storage
% w/w flour, dry basis Means with the same letters are not significantly different (P>0.05) Means are means of replications; SED = 2.7

55
4.4.3.3 Mouthfeel Significant differences (P<0.05) in terms of mouthfeel ‘consistency’ were not found until Day 3 of storage. On this day, bread containing 4% honey was rated as being significantly heavier (P<0.05) in terms of ‘consistency’ than bread containing 1% or 3% honey, and 1%, 4% or 5% sugar, which were all rated close to a ‘just right’ score. None of the honey treatments were rated to be significantly different (P>0.05) to the control sample and this sample scored a perfect ‘just right’ score.
Control bc
Dried Honey abc
Sugar 1% ab
Sugar 3% bc
Sugar 4% a
Sugar 5% bc
Honey 1% ab
Honey 3% abc
Honey 4% c
Honey 5% bc
40 45 50 55 60
Trea
tmen
ts
Sensory Score
Figure 4.10 Mean sensory scores of odour ‘yeastiness’ of bread containing liquid honey, Gemsweet 42® (sugar) or dried honey at Day 1 of storage
% w/w flour, dry basis Means with the same letters are not significantly different (P>0.05) Means are means of replications; SED = 1.5

56
Sensory scores for mouthfeel ‘moistness’ could be directly related to changes in the texture of the loaf and, therefore, staling. These scores are presented in a radar graph format in Figure 4.11, which highlights the changes in the different treatments during the storage period.
0
10
20
30
40
50
60Control
Dried honey
Sugar 1%
Sugar 3%
Sugar 4%
Sugar 5%
Honey 1%
Honey 3%
Honey 4%
Honey 5%
Day 1
Day 2
Day 3
Day 4 Figure 4.11 Changes in mouthfeel ‘moistness’ of bread containing liquid honey, Gemsweet 42® (sugar) or dried honey during storage Significant differences (P<0.05) between treatments were found on Day 3 of storage when all samples were rated quite dry (Figure 4.11). Bread samples containing 5% honey were significantly moister (P<0.05) than the control bread (0%) and those bread loaves containing 1% sugar or 4% honey. The 1%, 3% and 4% honey treatments produced bread that was not significantly different (P>0.05) in terms of mouthfeel ‘moistness’ from the control bread (0%). The greatest changes in mouthfeel ‘moistness’ of bread occurred between Days 3 and 4 in the 4% and 5% honey treatment loaves. 4.4.3.4 Flavour No significant differences (P>0.05) were found in freshness until Day 3, when the control loaf was significantly staler (P<0.05) than the loaves containing 3% or 4% sugar. In addition, bread containing 4% honey was found to be significantly staler (P<0.05) than bread produced by all treatments, except the control (0%) and 1% sugar. Additionally, significant differences (P<0.05) were found in terms of flavour ‘sweetness’ on Day 1 and Day 3 of storage. On Day 1, bread containing 5% honey was rated “just right” and significantly sweeter than the control bread (0%) and bread containing 1% and 3 % sugar. However, on Day 3
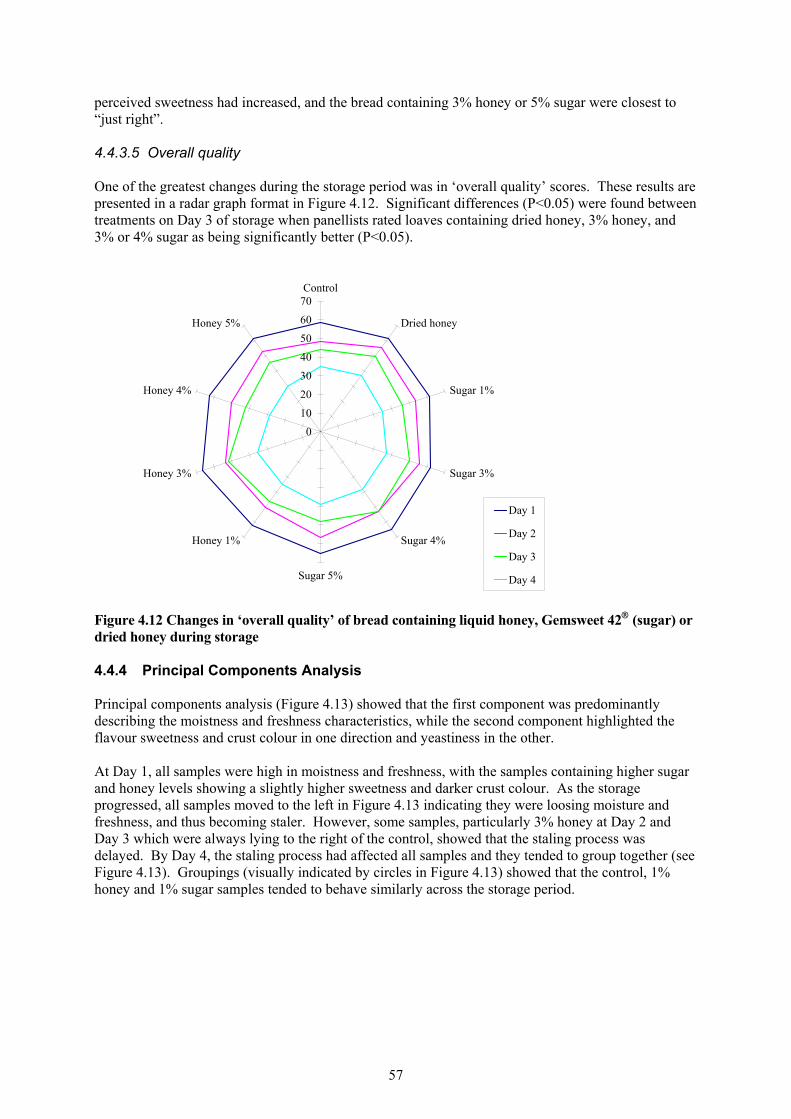
57
perceived sweetness had increased, and the bread containing 3% honey or 5% sugar were closest to “just right”. 4.4.3.5 Overall quality One of the greatest changes during the storage period was in ‘overall quality’ scores. These results are presented in a radar graph format in Figure 4.12. Significant differences (P<0.05) were found between treatments on Day 3 of storage when panellists rated loaves containing dried honey, 3% honey, and 3% or 4% sugar as being significantly better (P<0.05).
0
10
20
30
40
50
60
70Control
Dried honey
Sugar 1%
Sugar 3%
Sugar 4%
Sugar 5%
Honey 1%
Honey 3%
Honey 4%
Honey 5%
Day 1
Day 2
Day 3
Day 4
Figure 4.12 Changes in ‘overall quality’ of bread containing liquid honey, Gemsweet 42® (sugar) or dried honey during storage 4.4.4 Principal Components Analysis Principal components analysis (Figure 4.13) showed that the first component was predominantly describing the moistness and freshness characteristics, while the second component highlighted the flavour sweetness and crust colour in one direction and yeastiness in the other. At Day 1, all samples were high in moistness and freshness, with the samples containing higher sugar and honey levels showing a slightly higher sweetness and darker crust colour. As the storage progressed, all samples moved to the left in Figure 4.13 indicating they were loosing moisture and freshness, and thus becoming staler. However, some samples, particularly 3% honey at Day 2 and Day 3 which were always lying to the right of the control, showed that the staling process was delayed. By Day 4, the staling process had affected all samples and they tended to group together (see Figure 4.13). Groupings (visually indicated by circles in Figure 4.13) showed that the control, 1% honey and 1% sugar samples tended to behave similarly across the storage period.

58
Figure 4.13 Bi-plot of mean sensory results for bread containing liquid honey, Gemsweet 42® (sugar) or dried honey, based on seven sensory parameters and showing the separation of treatments across 4 days storage % w/w flour, dry basis
(Means are means of replications)
Control 5% Dried Honey 1% Sugar 3% Sugar 4% Sugar
5% Sugar 1% Honey 3% Honey 4% Honey 5% Honey
crust colour
flavour sweet
breakdownwhitebread moistness
freshness
yeastiness
80%
11%
symbol size increases with days stored 1 to 4
Day 1Day 2Day 3Day 4
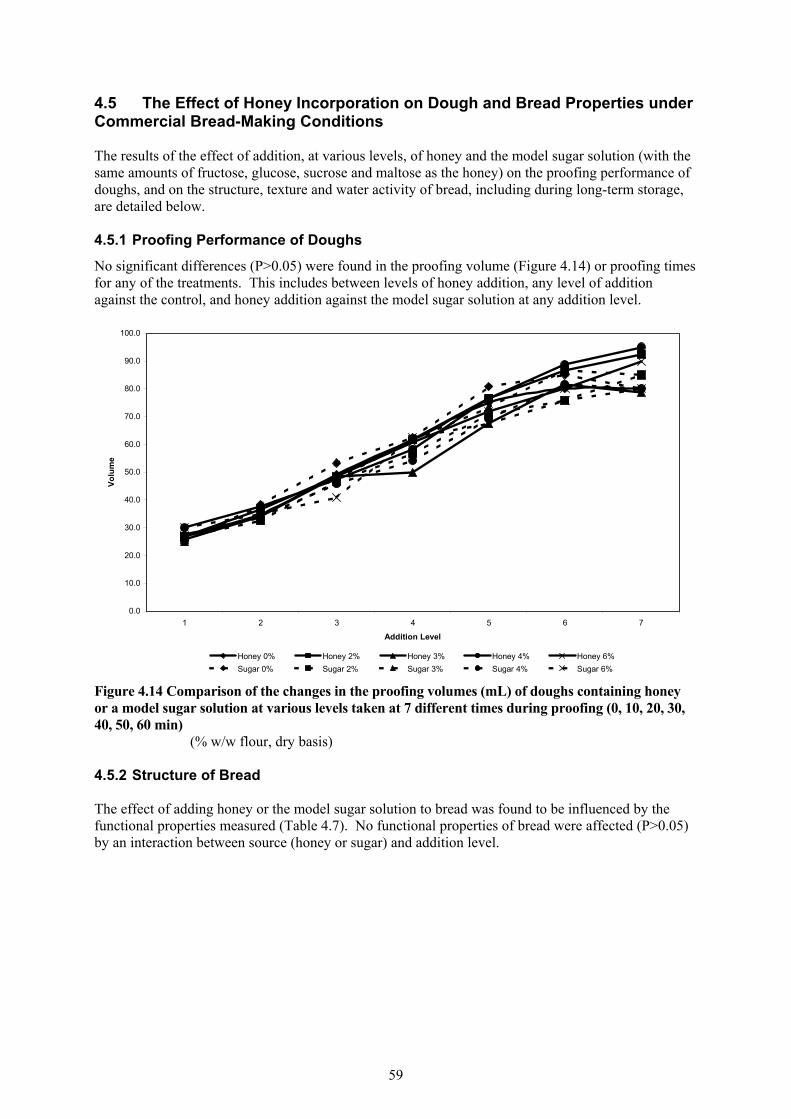
59
4.5 The Effect of Honey Incorporation on Dough and Bread Properties under Commercial Bread-Making Conditions The results of the effect of addition, at various levels, of honey and the model sugar solution (with the same amounts of fructose, glucose, sucrose and maltose as the honey) on the proofing performance of doughs, and on the structure, texture and water activity of bread, including during long-term storage, are detailed below. 4.5.1 Proofing Performance of Doughs
No significant differences (P>0.05) were found in the proofing volume (Figure 4.14) or proofing times for any of the treatments. This includes between levels of honey addition, any level of addition against the control, and honey addition against the model sugar solution at any addition level.
0.0
10.0
20.0
30.0
40.0
50.0
60.0
70.0
80.0
90.0
100.0
1 2 3 4 5 6 7
Addition Level
Volu
me
Honey 0% Honey 2% Honey 3% Honey 4% Honey 6%Sugar 0% Sugar 2% Sugar 3% Sugar 4% Sugar 6%
Figure 4.14 Comparison of the changes in the proofing volumes (mL) of doughs containing honey or a model sugar solution at various levels taken at 7 different times during proofing (0, 10, 20, 30, 40, 50, 60 min)
(% w/w flour, dry basis)
4.5.2 Structure of Bread The effect of adding honey or the model sugar solution to bread was found to be influenced by the functional properties measured (Table 4.7). No functional properties of bread were affected (P>0.05) by an interaction between source (honey or sugar) and addition level.

60
Table 4.7 The probability, calculated by analysis of variance, that source (honey or sugar) and addition level affect the cellular elongation, crumb fineness, crust thickness and crust contrast of bread
Probability of a Significant Effect (P values) Cellular
Elongation Crumb Fineness Crust Thickness Crust Contrast
Sourcea 0.025 0.721 0.570 0.666 Addition Levelb 0.228 0.092 0.001 0.996 Source * Addition Level 0.636 0.133 0.056 0.518 aSource: honey or the model sugar solution bAddition Level: 2%, 3%, 4% and 6% (w/w flour, dry basis) (The model sugar solution contains the same level of fructose, glucose, sucrose, and maltose as the honey sample.) 4.5.2.1 Crumb cell elongation The results for the elongation of the cellular structure for bread made with honey or the model sugar solution are graphically presented in Figure 4.15. There was no significant interactions (P>0.05) between source (honey or model sugar solution) and the addition level for the elongation of the cellular structure of bread made with honey or the model sugar solution. Thus, only main effects (within treatments) are presented. Bread made using honey was significantly less elongated (P<0.05) in the cellular structure than bread made using the model sugar solution (Figure 4.15). However, within the honey or model sugar solution treatments, there were no significant differences (P>0.05) in cellular elongation between the levels of addition.
0.00
0.25
0.50
0.75
1.00
1.25
1.50
0 1 2 3 4 5 6 7
Addition Level
Elon
gatio
n / C
rust
Thi
ckne
ss /
Cru
st C
ontr
ast
400
425
450
475
500
525
550
Fine
ness
Elongation - Honey Elongation - Sugar Crust Thickness - Honey Crust Thickness - SugarCrust Contrast - Honey Crust Contrast - Sugar Fineness - Honey Fineness - Sugar
Figure 4.15 Comparison of the means for cellular elongation (SE=0.009), crust thickness (SE = 0.006), crust contrast (SE = 0.026) and crumb fineness (SE = 10.9) for bread containing honey or a model sugar solution at various levels Addition level % w/w flour, dry basis (The model solution contains the same fructose, glucose, sucrose and maltose concentration as
the honey sample) Means are means of replications

61
4.5.2.2 Crumb fineness No significant differences (P>0.05) between treatments were found for crumb fineness (Figure 4.15 and Table 4.8). Table 4.8 Mean crumb fineness of bread containing honey or a model sugar solution at various levels
Level of addition (%w/w flour)
Mean+ crumb fineness
Honey** Model Sugar Solution**
Control (0%) 490.0 490.0 2 499.0 535.3 3 481.7 474.0 4 493.3 460.0 6 488.0 507.0
**ANOVA not significant (P>0.05) +Means are means of replications; SE = 10.9
(The model sugar solution contains the same level of fructose, glucose, sucrose, and maltose as the honey sample.)
4.5.2.3 Crust thickness The results for the crust thickness of bread made with honey or the model sugar solution are detailed in Table 4.9 (and Figure 4.15). There was no significant interaction (P>0.05) between source (honey or model sugar solution) and the addition level for the crust thickness of bread made with honey or the model sugar solution. Thus, only main effects (within treatments) are presented. Here, there were no significant difference (P>0.05) in the crust thickness of bread made with honey compared to bread made with the model sugar solution (Table 4.9; Figure 4.15). However, there were significant differences (P<0.05) in crust thickness between bread made with different honey levels, and between bread made with different levels of the model sugar solution. For example, bread made with 3% and 4% honey contained crusts that were significantly thicker (P<0.05) than the control bread (0%) and bread made with 2% honey. Additionally, bread made with 6% honey was not significantly different (P>0.05) in crust thickness to bread made with any of the other levels of honey. Similarly, bread made with 4% and 6% model sugar solution contained crusts that were significantly thicker (P<0.05) than the control bread (0%) and bread made with 2% or 3% model sugar solution. Table 4.9 Mean crust thickness of bread containing honey or a model sugar solution at various levels
Level of addition (%w/w flour)
Mean+ Crust Thickness
Honey* Model Sugar Solution*
Control (0%) 0.087a 0.087a 2 0.080a 0.090a
3 0.120b 0.087a
4 0.123b 0.127b
6 0.110ab 0.127b
*ANOVA significant (P<0.05) +Means are means of replications SE = 0.006 Means in the same column with the same superscript are not significantly different (P>0.05)
(The model sugar solution contains the same level of fructose, glucose, sucrose, and maltose as the honey sample.)

62
4.5.2.4 Crust contrast No significant differences (P>0.05) between treatment were found for crust contrast (Figure 4.15 and Table 4.10). Table 4.10 Mean crust contrast of bread containing honey or a model sugar solution at various levels
Level of addition (%w/w flour)
Mean+ Crust Contrast
Honey** Model Sugar Solution**
Control (0%) 0.587 0.587 2 0.567 0.620 3 0.597 0.597 4 0.630 0.567 5 0.593 0.607
**ANOVA not significant (P>0.05) Means are means of replications; SE = 0.026
(The model sugar solution contains the same level of fructose, glucose, sucrose, and maltose as the honey sample.)

63
4.5.3 Effect of Storage on Bread 4.5.3.1 Effect of storage on the firmness (texture) of bread Results for the firmness of bread (average graph point from 5 texture measurement points) during storage, ie. 0-3 days are graphically presented in Figure 4.16. There was no significant interaction (P>0.05) and no main effects (P>0.05) for the two treatments, source (honey or sugar) and addition level, on the firmness (average graph point) of bread on any day of storage. However, there was a significant effect (P<0.05) of storage time, with there being a significant increase (P<0.05) in firmness (decrease in softness) of bread with increase in storage time, which is to be expected as the bread stales (Figure 4.16). Finally, the 3% honey and model sugar solution additions produced qualitatively less firm (softer) crumb.
0
100
200
300
400
500
600
0 24 48 72 96
Storage Time
Firm
ness
Honey 0% Honey 2% Honey 3% Honey 4% Honey 6%Sugar 0% Sugar 2% Sugar 3% Sugar 4% Sugar 6%
Figure 4.16 Comparison of the mean firmness (averaged over the 5 points of measurement) of bread containing honey or a model sugar solution at various levels
% w/w flour, dry basis Means are means of replications; SE = 13.3
Storage Time P = 0.000 4.5.3.2 Effect of storage on the water activity of bread Results for the water activity of bread loaves during storage, ie. 0-4 days are presented graphically in Figure 4.17. Water activity was not significantly affected (P>0.05) by interactions between any of the treatments (see probability of significance (P) values in Figure 4.17). Thus, only main effects (within treatments) are presented. Here, of all the three treatments [source (honey or sugar), addition level and storage time], the only significant effect (P<0.05) on the water activity of bread containing honey or the model sugar solution was due to storage time. The water activity of bread containing honey or the model sugar solution stored for 48 and 72 h was significantly higher (P<0.05) than that of the control bread (0%) at 0 h (just after being baked) (Figure 4.17).

64
90.0
90.5
91.0
91.5
92.0
92.5
93.0
93.5
94.0
94.5
95.0
0 24 48 72 96
Storage Time
Wat
er A
ctiv
ity
Honey 0% Honey 2% Honey 3% Honey 4% Honey 6%Sugar 0% Sugar 2% Sugar 3% Sugar 4% Sugar 6%
Figure 4.17 Comparison of the mean water activity of bread containing honey or a model sugar solution at various levels % w/w flour, dry basis
Means are means of replications; SE = 0.13 Source (honey or sugar) P = 0.676; Addition Level P = 0.708;
Storage Time P = 0.000; Source * Addition Level P = 0.915; Source * Storage Time P = 0.385; Addition Level * Storage Time P = 0.999; Source * Addition Level * Storage Time P = 0.998

65
5. Discussion 5.1 Effect of Honey Addition on the Rheological Properties of Bread Doughs During High Shear Mixing In the production of bread, it is essential that the dough is fully developed during the mixing process. The rheological properties of dough that were studied to determine the effect of honey addition were mixing time, dough strength and dough stability during overmixing. It is known that the bonding involved in a dough is probably hydrogen or hydrophobic or both (Hoseney, 1994). The level of protein in flour affects the mixing time. Low protein flours (<12%) require longer mixing times because they contain less protein. Chemical agents, particularly reducing agents such as cysteine and sodium bisulphite shorten mixing times. Additionally, dough mixing times are shorter at lower pH and higher at higher pH (Hoseney, 1994). Little useful data are available on the effect of sugars and honey on dough development, so a study was done. 5.1.1 Peak Dough Development Time/Dough Mixing Time In this study, it was found that the addition of honey at levels of only 6%-10% (w/w flour) produced doughs that had a significantly shorter (P<0.05) mixing time (Figure 4.1) than doughs containing the model sugar solution at 6%-10% levels. Lower levels (1%-5%) of addition of honey or the model sugar solution produced no significant effects (P>0.05) on the mixing time relative to each other or to the control (0%). These findings fulfil the first objective of the study to determine the maximum practicable level of honey that can be added to bread dough to still support dough development, and the second objective concerning the effect of honey on the mixing time. It is known that the addition of sugar to dough inhibits the hydration of the protein (glutenin-gliadin) matrix, thus slowing down the development process (increase the mixing time). However, from this data it may be proposed that the addition of honey introduces nonsugar substances that decrease the cross-linking (primarily disulphide bonding) that occurs in the protein matrix during dough development, leading to smaller proteins that hydrate more easily and thus produce shorter mixing times than would sugars alone. Unsaturated carbonyl compounds such as organic acids (fumaric acid, maleic acid or ferulic acid) are known to reduce the mixing time of bread doughs (Hoseney, 1994). Organic acids are some of the nonsugar components present in honey (Tan et al., 1990; Wilkins et al., 1995a). Additionally, it is thought that the compounds responsible for this effect are primarily reducing agents. Similarly, the number of possible reducing agents in honey may be large, although the effect would possibly be greatest with thiol compounds (as found in cysteine) if present in Australian honey. In conclusion, the results suggest that the nonsugar components of the honey are overriding the slowing of the dough development process produced by sugars. However, it was also found in this study that the addition of any level of honey or the model sugar solution to dough did not produce significantly different (P>0.05) mixing times compared to that of the control (0%) dough. This suggests that the sugars in the honey, other honey components (waxes, volatiles, minerals, enzymes) or an interaction between the sugars and other honey components do not produce any undesirable effects such as changing (eg. increasing) the mixing times of bread doughs. This is important to the baking industry where costs are increased as mixing times are increased. 5.1.2 Dough Strength The fact that doughs with 4% honey were significantly stronger (P<0.05) than doughs containing 6% and 8% honey, while doughs containing a 3% level of the model sugar solution were significantly stronger (P<0.05) than doughs containing 6%, 8% and 9% levels of the model sugar solution, suggest that honey is having an effect on dough strength even though it is not consistent. Lower levels of honey addition produce stronger doughs. Additionally, the result that showed doughs containing 4%
66
and 9% honey were significantly stronger (P<0.05) than doughs with similar levels of the model sugar solution leads to the conclusion that high levels of honey addition produce stronger doughs than high levels of sugar addition. Honey appears to aid bond formation between protein molecules to a greater extent than sugar alone. However, since all doughs containing honey or the model sugar solution were not significantly (P>0.05) weaker or stronger than the control dough (0%), then this effect on dough strength is small. The more important result for the baking industry is that honey addition does not adversely affect dough strength. In conclusion, these results fulfil the third objective of the study to determine the effect of honey on dough strength. 5.1.3 Dough Stability After reaching optimum dough development, continued mixing leads to dough that is sticky with an overmixed sheen (Hoseney, 1994). It is known that unsaturated carbonyl compounds such as organic acids (fumaric acid maleic acid or ferulic acid) increase the rate of dough breakdown (Hoseney, 1994). Similarly structured organic acids exist in honey (Tan et al., 1990; Wilkins et al., 1995a). Thus, the effect of honey and sugar on dough stability (intolerance to over mixing) is worth examining. A study of dough stability after reaching peak dough development suggested that doughs with honey levels of 5%-10% were stable for significantly longer (P<0.05) times during overmixing than doughs containing 6%-10% levels of the model sugar solution (Figure 4.3), while both were not significantly different (P>0.05) from the control (0%) dough. Thus, honey is better at protecting dough during overmixing than are sugars alone. Nonsugar components are clearly involved. Since none of the doughs appeared to suffer from an intolerance to over mixing relative to the control (0%) dough, it is thought that reductant(s) found in the honey shorten the mixing time relative to sugars alone, while the sugars in the honey help maintain the water potential and do not affect the structural integrity of the dough. In conclusion, these results fulfil the fourth objective of the study to determine the effect of honey on dough stability; there is no effect. 5.1.4 Possible Causes of the Positive Effect of Honey Addition on Dough Development
Relative to Sugar Addition The results of this study suggest that components in the honey other than the simple saccharides (fructose, glucose, sucrose and maltose used in the model sugar solution) may play a role in affecting the mixing time of bread dough. The shorter mixing time for a dough containing honey compared to one containing the model sugar solution may be induced by a combination of the nonsugar components of honey such as organic acids, metal ions, active enzymes, and honey reducing agents such as flavonoids (antioxidants). In the production of bread, it is essential that the bread dough be fully developed during the mixing process. When honey or sugar is added to dough, the system would exhibit different molecular properties, such as changes in the water activity of the dough, and changes in the starch and gluten hydration. To a bread manufacturer, the addition of honey ideally should not increase the time to reach peak dough development (or preferably reduce it), not decrease dough strength, and should still produce a stable dough matrix once the dough has reached peak development. The results of this study suggest honey does this, often better than a sugar mixture. 5.1.5 Conclusions In the future, if Australian bread manufacturers want to add Australian liquid honey to bread for texture and shelf life improvement, or even added flavour (sweetness) as occurs in the United States of America, then this project will be of benefit to them since it provides data suggesting that the mixing time, and dough strength and stability will not be affected by honey addition. In conclusion, if sugars (eg. a high fructose syrup) are to be added to bread for shelf-life improvement or for some other reason, then honey would clearly be a better ingredient.
67
5.2 Kinetics of Gelatinization of Plain Bread Doughs Containing Honey Gelatinization is the process where starch granules absorb water and swell as the temperature is increased. The viscosity of the starch then increases as granule swelling occurs. The temperature where the first increase in viscosity occurs is called the onset of pasting. Swelling continues until maximum swelling is reached where the viscosity reaches a maximum. The temperature at this point is termed the gelatinization temperature. Further increases in temperature leads to bursting of the swelled starch granules and a decrease in viscosity. Differential scanning calorimetry (DSC) is now the preferred method (Atwell, et al., 1988) for determining the gelatinization temperature and energy. The DSC thermogram displays the heat flow as a function of temperature during the heating of starch. The first transition (maximum) in the DSC thermogram involves gelatinization. During the baking of bread and cakes, it is important that gelatinization is not adversely affected. Too great an increase in the gelatinization temperature may yield a bread that is not fully baked in a standard oven (higher gelatinization temperature leads to greater energy cost). In addition, a slight increase in gelatinization temperature will increase the glass transition temperature of the bread (increased glass transition temperatures are thought to slow the rate of staling). Thus, a small increase in gelatinization temperature is thought to slow the rate of staling, but too high an increase would render the process not cost-beneficial. 5.2.1 Gelatinization Temperature of Doughs In this study, although the addition of any sugar mixture (honey or model sugar solution) to dough at a level of 6% yielded significantly higher (P<0.05) dough gelatinization temperatures (and, thus, baking temperatures) than the control (0%) dough, the addition of honey does not produce significantly higher gelatinization temperatures that the addition of the model sugar solution (Table 4.1). The finding that honey and sugars raise the gelatinization temperature of doughs and, thus, delay gelatinization agrees with previous work on wheat starch where it was found that various sugars (but not honey) raise the gelatinization temperature (Bean and Yamazaki, 1978; Spies and Hoseney, 1982; Slade and Levine 1987; Buck and Walker, 1988; Kim and Walker, 1992). Further, the addition of substances that delay starch gelatinization, such as sugars and honey, may improve baking performance (Eliasson and Larsson, 1993), since such a delay would prolong the volume expansion in the oven. The delay in starch gelatinization in a sugar solution is thought to involve four mechanisms, although the exact mechanism remains unclear. Firstly, sugar has the ability to limit water availability to the starch granule by competing more strongly for water than the starch granule, and by entering the starch granule and preventing water gelling into the granule. Secondly, sugar lowers the water activity of the starch. Thirdly, sugar forms sugar bridges between starch chains. Finally, sugar exerts an antiplasticizing effect relative to water. In low water systems, such as in bread, it is important that the gelatinization temperature is not increased too much. In this study, the gelatinization temperature was raised by less than 10 °C for the 6% addition level of honey or the model sugar solution. Furthermore, the fact that all other addition levels of honey or the model sugar solution did not significantly affect (P>0.05) the gelatinization temperature of doughs, suggests honey or sugar can be added to dough without adversely affecting gelatinization. In conclusion, these results fulfil the second objective of this study to determine the effect of honey addition on the gelatinization temperature of bread doughs, which is very little. 5.2.2 Gelatinization Energy of Doughs An increase in gelatinization temperature may or may not result in increased heat (energy) of gelatinization (the total energy required for gelatinization to proceed). Ideally, if there was an increase in gelatinization temperature, then the gelatinization energy should remain the same, resulting in the total energy required to bake the product being the same. However in this study, adding honey to a dough significantly reduces (P<0.05) the energy required for gelatinization relative to adding the
68
model sugar solution to a dough. The fact that high levels of honey addition (6%-8%) significantly lowered (P<0.05) the gelatinization energy of doughs relative to the addition of the model sugar solution at levels of 6% or lower (including the 0% control) and the addition of honey at levels of 4% or lower (including the 0% control), indicates that adding 6-8% honey to dough will yield faster baking times than using a sugar mixture (fructose, glucose, sucrose and maltose) and lower levels of honey addition. Currently, when manufacturers increase the baking temperature, baking times are not necessarily reduced, but these findings suggest that the addition of honey would reduce the baking time as less energy is required for the dough to gelatinize. Therefore, these results fulfil the third objective of this study to determine the effect of honey addition on the gelatinization energy of bread doughs. In conclusion, adding honey to dough produces better effects on gelatinization than adding a mixture of sugars. 5.2.3 Glass Transition Temperature of Doughs Although the gelatinization temperature (as measured by differential scanning calorimetry, DSC) of a starch system is normally increased by sugars, in this study the glass transition temperature (Tg) of the ungelatinized native starch seems to be unaffected by the addition of honey or sugars. In the ungelatinized state, and in absence of moisture, it can be assumed that there is at least a chemical or physical interaction between sugar and starch molecules. To effect the Tg of a system, the various components should be compatible, which did not occur in this case. Therefore, the observed Tg value is probably the Tg of the sugar or honey added, not the starch. Additionally, this conclusion is supported by the fact that increasing the level of these additives did not produce any significant change in the Tg values. In this situation, a separate Tg of starch should be observed. However, the Tg of starch in a dough is above its thermal decomposition (carbonization), therefore its measurement is not possible using a DSC. In conclusion, the results of this experiment show that the interaction between sugar and the starch system (in a dough) can only be induced at the gelatinization temperature, when the starch granules start swelling. These results fulfil the fourth objective of this study to determine the effect of honey addition on the glass transition temperature of bread doughs. 5.2.4 Conclusions Honey addition has little affect on dough gelatinization, since the findings of this study indicate that although honey addition at a level of 6% significantly increases (P<0.05) the gelatinization temperature of dough (as expected from previous work on sugars), this increase is only slight (<10ºC) and gelatinization is still supported. Further support for this assertion is that all other addition levels (2%, 4%, and 8%) of honey produce no change in the gelatinization temperature of dough. This fulfils the first objective of this study to determine the practicable level of honey that can be added to doughs to support gelatinization. Additionally, the gelatinization energy of dough is significantly decreased (P<0.05) overall by honey addition at levels of 6%-8% relative to lower levels of addition of honey or a model sugar solution. Finally, the results suggest that there may be an interaction between the honey and the gelatinization energy. This interaction may be induced by the unique honey composition, including the presence of components such as organic acids, metals ions, enzymes etc., and the unique physical characteristics, such as low water activity, which collectively alter the water availability for the starch during gelatinization. In conclusion, the baking industry now has some research data which suggest that honey addition will not adversely affect the gelatinization of bread doughs, and may in fact lower the energy requirement during baking.
69
5.3 Viscosity of Gelatinization of Batters Containing Honey Controlling starch gelatinization in a cake system is important in producing a porous, noncollapsing cake structure (Bean and Yamazaki, 1973; Glover et al., 1986). During the baking of batter products such as cakes, the batter undergoes a transition from colloidal foam to a solid porous starch matrix. During this transition, it is important that the foam structure solidifies before a heat-induced collapse occurs. Thus, any ingredient added to the batter should not adversely affect the solidification of the foam structure produced by gelatinization. 5.3.1 Peak Viscosity The addition of a model sugar solution at levels of less than 180% did not significantly change (P>0.05) the peak viscosities of the batters relative to each other and to the control (0%). Only at a level of 180% model sugar solution did the peak viscosity significantly increase (P<0.05). In starch-sugar-water mixtures (eg. batters), sugars are known to interact with starch chains and stabilize the amorphous regions (Spies and Hoseney, 1982). This stabilization would restrict the starch chain’s flexibility (Spies and Hoseney, 1982) and may lead to increased viscosity. For the addition of honey at levels of 100% and 140%, batters were produced with significantly higher (P<0.05) peak viscosities than the control batter (0%) and batters with the same levels of the model sugar solution. These findings suggest that using honey at these levels produces a thicker (more viscous) batter than using a mixture of sugars. Thus, honey appears to be exerting an antiplasticizing effect relative to water, while sugar is not. This effect on batters is lost at 180% levels of honey addition relative to the same addition level of a model sugar solution. The thickening of the batters during gelatinization is maximized when the level of honey is above 100%. At high levels of addition, the thicker batter that results equates to a structure that is less likely to collapse during baking. These results fulfil the objective of the study to determine the effect of honey on the viscosity of a batter during gelatinization. This increase in viscosity may be due to a change in the glass transition temperature of starch induced by honey. Another possible explanation for this effect is related to the ionic components of honey, particularly anion components. It has been found that starch gelatinization can be regulated by the presence of both organic and inorganic anions (no effect was observed from cations addition) in such a way that viscosity is increased. Honey contains numerous organic acids (Section 1.2.6), which could provide the anion base for the regulation of starch gelatinization of batters. 5.3.2 Pasting Temperature and Rate of Gelatinization of Batters In this study, the addition of honey to a high-ratio flour at levels of 100%-180% accelerated the formation of a batter gel [significantly (P<0.05) lower pasting temperature and lower temperatures at a viscosity of 500 BU; Tables 4.4 and 4.5], while the model sugar solution produced no change. These results are difficult to explain as sugars are known to retard gelatinization by raising the gelatinization temperature (as discussed in Section 5.2.1). This study fulfils the objective to determine the effect of honey on the rheological properties of high-ratio flour during programmed heating; they were inconclusive. In conclusion, the physical properties of batters appear to be somewhat different depending on whether honey or a model sugar solution is used. 5.3.3 Conclusions The addition of honey to batters produce more viscous gels that are less likely to collapse. This suggests honey addition may have a beneficial effect on cake batters relative to sugar addition, and the replacement of some of the sugar (sucrose) in batters with honey should be seriously considered by the baking industry.

70
5.4 The Effect of Honey on the Staling of White Pan Bread as Determined by Physical And Sensory Analyses This experiment was undertaken by Ms Nicole Squires as part of an earlier RIRDC project (UQ-54A), and is being reported again here as her work has been further statistically analysed yielding new results of interest to RIRDC and the food industry. The staling of baked foods is broadly defined as an increase in crumb firmness and corresponding loss in product freshness (Hebeda et al., 1990). It is generally accepted that staling is due to a change in starch, from an amorphous structure to a partially crystalline one (Hebeda et al., 1990). In terms of flavour, the typical aroma of fresh bread disappears upon storage and the flavour of the crumb and crust deteriorates (Nekom and Rutz, 1981). Although consumers believe firming of the crumb is due to a loss of moisture in the loaf, there is no significant moisture loss upon storage (Hebeda et al., 1990). The addition of honey to baked goods could be expected to not only increase the flavour and sweetness, but more importantly increase the shelf life (Voll, 1974). However, there is little evidence in the literature to support this theory. Many researchers have investigated the process of bread staling over the past 100 years. Most agree that the storage of bread loaves brings about unacceptable changes. This causes approximately 10% of all bread manufactured in Australia to be returned due to being out-of-date. The bread manufacturing industry has for many years tried to retard the staling process by using various additives. In this study, various levels of Australian liquid iron bark honey and Gemsweet 42® (sugar syrup) were added to a white pan bread formulation. The study was done to investigate if the hygroscopic nature of liquid honey can play a role in the retardation of the bread staling process. Its performance is compared to that of a commercial high fructose:glucose syrup and to dried honey. The effects on staling were measured by objective texture measurement (TA-XT2 analyser) and by sensory evaluation using trained panellists. 5.4.1 Proofing Performance of Dough The reduction in proof time of dough (by 16 min) observed for 3% honey addition (Section 4.4.1) would lead to a reduction in processing time; thus, it has some commercial benefits. It would provide bakeries with benefits such as reduced costs in terms of labour and efficiency, more flexibility in terms of planning and scheduling production, increased plant capacity and, therefore, throughput. 5.4.2 Texture of Bread The addition of certain levels of Australian liquid iron bark honey or Gemsweet 42® (sugar syrup), or of 5% dried honey to a white bread formulation resulted in a reduction in staling rate. By Day 3 of storage, loaves were yielding texture analysis results that indicated the staling process was under way. At this storage time, sensory results also began to show significant differences (P<0.05) between treatments for many attributes, especially those directly related to staling such as: ‘freshness’, ‘consistency’, ‘moistness’ and ‘overall quality’. Samples containing 3% honey (by dry weight of flour) consistently stood apart from the other treatments throughout this evaluation. The physical texture analysis found that the loaves containing 3% honey were of better quality (softer) in terms of texture measurements, and taste panel results indicated that 3% honey loaves were significantly better (P<0.05) in terms of ‘overall quality’ than the control, 1% honey, 4% honey and 5% honey on Day 3 of storage. Loaves containing 3% honey were significantly less firm (softer) (P<0.05) than loaves containing 3% sugar and no honey or sugar (control) when individual texture points were considered separately. The loaves containing 3% honey were significantly less firm (softer) (P<0.05) at Day 0 (just after baking) and stayed softer at all storage days (Figure 4.8). This equated to at least a 20 h extension of shelf-life.

71
This new finding, compared to that of the initial data analysis in the final report of RIRDC project UQ-54A, would be of great economic benefit to the baking industry since it would reduce the size of the daily return or disposal of out-of-date bread by bakeries and supermarkets. 5.4.3 Sensory Evaluation of Bread With respect to the sensory data, loaves containing 3% honey were found to be not significantly different (P>0.05) to the control (0%) loaves in terms of the sensory characteristics of ‘crust colour’, visual ‘openness’ of texture, ‘yeasty’ odour, ‘sweet odour’, ‘sweetness’, or ‘white bread flavour’, or ‘breakdown in the mouth-pastiness’. Additionally, loaves containing 3% honey were found to be significantly better (P<0.05) in terms of ‘overall quality’ on Day 3 of storage when compared to the control loaves or loaves containing 1%, 4% or 5% honey. However, loaves containing 3% sugar had a similar ‘overall quality’ score. The shape of the graph that records changes in ‘overall quality’ (Figure 4.12) is very similar to that of the graphs for mouthfeel ‘moistness’ (Figure 4.11) and ‘freshness’, indicating that the eating quality of a loaf may be directly related to the perceived amount of moisture that the bread contains. Of most importance was the fact that the panellists were able to discriminate between the treatments and assess staling changes (on storage) consistently. Analysis of these changes in eating quality attributes over the storage time indicated that the initial reduction in the staling rate extended the storage life of fresh bread to three days. They indicate that the staling phenomenon has a similar effect on several eating attributes such as: ‘moistness’, ‘freshness’, ‘mouthfeel consistency’ and ‘overall quality’. The results showed that panellists were able to detect the physical changes (as measured by texture analysis) in terms of the eating qualities of the loaf, and were consistent when rating the samples over the four storage days. The use of multivariate analysis such as principal components analysis of the sensory data was invaluable in getting the maximum results from this data (part of reanalysis of sensory data), and can be used to detect the staling of bread. This study found that sweeteners can be added to bread at levels less than 5% sugar or 4% honey without being detected by panellists, which may be an advantage when marketing such products in Australia, where bread loaves are not traditionally sweet. 5.4.4 Conclusions These results fulfil the objective of this study to determine the ability of Australian liquid iron bark honey to retard the bread staling process. Honey, when added at 3% levels to bread retards its staling by at least 20 h. In addition, such a level of addition would not be detected by the consumers in terms of sweetness. Thus, the reanalysis of data from an earlier RIRDC project (detailed in this study), when combined with the results for the effect of honey on the baking process presented earlier in this report, produced a significant result for the honey industry in terms of improving the profile of honey, which needs to be disseminated to the rest of the food industry. 5.5 The Effect of Honey Incorporation on Dough and Bread Properties Under Commercial Bread-Making Conditions Previous studies in this project have concentrated on how honey performs in bread using a model system, consisting of bakers flour, water and honey. These model system studies were used to determine if the addition of honey adversely affects baking performance (without the other normal bread ingredients creating interferences in the results). All of these previous trials were successful in demonstrating that components in the honey other than the 4 major sugars (fructose, glucose, sucrose and maltose) did not have a detrimental effect, and in some cases (such as gelatinization) had a beneficial effect in delaying the higher energy requirement of gelatinization compared to when a sugar solution is added to bread dough. This experiment extended these previous studies by incorporating

72
honey in a commercial bread formulation to ensure that comparable baking performance could be commercially achieved in a small-scale commercial baking process. 5.5.1 Proofing Performance There was no significant effect (P>0.05) on the proof time or proofing volume through the use of honey or the model sugar solution in doughs. This is different to the result found in Section 4.4.1, where 3% honey reduced the proof time by 16 min and 3% sugar reduced it by 10 min. Most importantly there was no increase in proof time which would add to the cost of baking. 5.5.2 Cellular Structure of Bread The grain of a bread loaf is not a random collection of cells. In conventionally made bread (not continuous bread-making systems), many crumb cells are elongated due to the considerable force that is put on cells in such a process. Cell elongation is a measure of the dough strength and chewiness of the bread. In a developed loaf, there should be a large number of elongated cells (Hoseney, 1994). 5.5.2.1 Crumb cell elongation The only effect on the elongation of the crumb cells from the honey addition was that the cells were significantly less (P<0.05) elongated in bread containing honey compared to bread containing a model sugar solution. However, there was no significant difference (P>0.05) in elongation of the crumb cells between the control (0%) bread and bread containing any level of honey or the model sugar solution. Thus, bread made using honey contained cells that were more spherical than bread containing the model sugar solution, indicating that as the bread rises, there is a more even distribution of dough strength within the matrix when honey is present compared to when only sugars are present. In conclusion, honey can be added to bread without it adversely affecting the shape of crumb cells. 5.5.2.2 Crumb fineness The addition honey or the model sugar solution did not produce any significant effect (P>0.05) on the crumb fineness suggesting honey can be added to bread without it adversely affecting crumb fineness. 5.5.2.3 Crust thickness Bread crust is a hard, vitreous surface layer formed of collapsed crumb pore walls. It consists of dried starch gel with dispersed protein and lipid aggregates. It forms a barrier against the loss of water and flavour. Honey addition did not significantly (P>0.05) affect the crust thickness relative to the addition of the model sugar solution. However, bread made with 3% and 4% honey had crusts that were significantly thicker (P<0.05) than the bread made with honey levels of 2% or lower (including the 0% control). Similarly, bread made with 4% and 6% levels of the model sugar solution were significantly thicker (P<0.05) than bread made with levels of the model sugar solution of 3% or lower. The maximum increase in crust thickness was 50%. Thus, the addition of honey or sugar to doughs produces bread with thicker crusts, which would aid in the prevention of water loss from the loaf, as this occurs via the crust. Such prevention would aid any antistaling effect as moisture loss from the crust is a factor in bread staling (see review in Section 1.4.2.6; Stear, 1990 cited in Piazza and Masi, 1995) 5.5.2.4 Crust contrast The addition of honey or sugars did not produce any significant effect (P>0.05) on the crust contrast suggesting honey can be added to bread without adversely affecting crust contrast.

73
5.5.3 Effect of Storage on Bread 5.5.3.1 Effect of storage on the firmness (texture) of bread The critical determinate of bread staling is the firmness (texture) of the crumb. This study found that there were no significant differences (P>0.05) between the firmness of loaves made with any level of honey or the model sugar solution, on any day of storage. The 3% honey and model sugar solution additions produced qualitatively less firm (softer) crumb (Figure 4.16). However, in the present study, because the average graph point (average of five measurement points on a slice) was analysed, it is not possible to determine if this effect extends to individual measuring points on slices as observed in Section 5.4.2. The experimental design used may limit such an extension. However, this commercial optimization study will form part of Ms Nicole Squire’s PhD thesis (in preparation) and statistical reanalysis of this data will be attempted in the future by her and, thus, can not be reported here. As expected, for all combinations of addition levels of honey or the model sugar solution, there was a significant increase (P<0.05) in firmness (decrease in softness) with an increase in storage time (Figure 4.16) as the bread stales. 5.5.3.2 Effect of storage on water activity of bread The pattern of the overall water activity of the bread loaves during storage is interesting. It was found that the water activity of bread containing honey or the model sugar solution significantly increased (P<0.05) after 48 h and 72 h relative to the control (0%) bread at 0 h (just after being baked) (Figure 4.17), although there was no significant effect (P>0.05) of increasing levels of honey or the model sugar solution relative to the control (0%) loaves at any storage time. This increase in water activity of bread would suggest that moisture migration may be occurring, with moisture becoming more available during storage due to the presence of honey or sugar. Theoretically during storage, the water activity should decrease due to the water being released from the system and the bread drying out. The reason for this anomaly is not clear at this time, and further research in this area is required. 5.5.4 Conclusions The performance of honey in a commercial formulation does not appear to be different to that without honey, indicating that honey could be added to white pan bread by the Australian baking industry without adversely affecting the commercial bread-making process. This fulfils the objective of the study to determine the effect of honey incorporation on the physical and chemical properties of dough and bread (including during post-baking storage) prepared as part of a commercial bread-making process.

74
6. Implications The data and conclusions arising from this project suggest that the Australian baking industry will now have hard data on the effect of liquid honey on most parts of the baking and staling processes for bread. The overall implication of this data is that the Australian baking industry can now seriously consider increasing its use of Australian liquid honey in the domestic manufacture of commercial bakery products such as bread. Any increased use of liquid honey by this large food manufacturing sector will mean increased domestic sales of honey for Australian beekeepers and honey packers, to their benefit. The following discussion is an assessment of the implications and impact that each aspect of the work will have on the use of honey by the Australian baking industry. The retarding of staling by at least 20 h through the use of liquid honey, at levels of 3%, in bread manufacture, as found during the reanalysis of bread texture data of Ms Nicole Squires (RIRDC Project UQ-54A; Caffin et.al., 1996), will be of economic benefit to the Australian baking industry where the daily return of out-of-date bread by supermarkets reduces profits. The exact size of the dollar value to the baking industry is not available but may be enough to convince bread manufacturers to use the low levels (3%) of honey that do not affect the taste (sweetness) of bread or the functional properties of doughs during the bread-making process. In conclusion, the honey industry will benefit from increased sales, if liquid honey can be sold as a reasonable price to the baking industry. To ensure such an addition is considered by the baking industry, data on the effect of honey on the baking process were obtained. To a bread manufacturer, the addition of honey ideally should not increase the time to reach peak dough development, and should still produce a stable dough matrix once the dough has reached peak development. Thus, the results of this experiment have major implications for the baking industry since the addition of honey did not significantly lengthen (P>0.05) the mixing time or decrease the dough strength relative to dough without added honey. At the 3% level of honey addition which retards bread staling noted above, there was no change in mixing time (none for 2% or 4%). Thus, in the future, if Australian bread manufacturers want to add Australian liquid honey to bread for added flavour, texture improvement or shelf life improvement, as occurs in the U.S.A., then this project tells them that the mixing time and dough strength will not be affected by honey addition. Conversely, adding honey at higher concentrations produces a dough that is more resistant to over mixing. In addition, the results of this study suggest that the addition of honey at levels greater than 6% produce shorter dough mixing times and more stable doughs than those produced by a comparable mixed sugar solution, should various sugars be contemplated for addition. In conclusion, if sugars (eg. a high fructose syrup) are to be added to bread for shelf-life improvement or for some other reason, then honey would clearly be a better ingredient than sugars, should the price be competitive. Adding honey to bread doughs at levels of 6% increases the gelatinization temperature only marginally (<10 °C) but lowers the gelatinization energy, suggesting that when honey is added to doughs, the rate of gelatinization during dough baking will probably be increased at this addition level. At the 3% level of honey addition, the functional properties of bread doughs were unaffected. The implications of this, when combined with the anti staling effect of 3% honey addition, are that the baking industry should take a closer look at liquid honey as a possible ingredient in bread. In conclusion, any renewed interest by the baking industry sparked by this project report will be to the benefit of the Australian honey industry in terms of possible increased sales of liquid honey. With respect to batters rather than bread doughs, during the baking of batter products such as cakes, the batter undergoes a transition from colloidal foam to a solid porous starch matrix. During this transition, it is important that the foam structure solidifies before a heat-induced collapse occurs. Thus, any ingredient added to the batter should not adversely affect the solidification of the foam

75
structure produced by gelatinization. This experiment showed that adding honey to batters at 100%-180% levels increased the peak viscosity of the final batter relative to batters without any honey or sugar, and relative to batters made with levels of a model sugar solution of 140% or less. The implication of this for the baking industry is that honey could replace some of the sugar in cakes and similar products, leading to improved functional properties or at worse no adverse effect on functional properties. In conclusion, these findings may lead to an increase in the usefulness of liquid honey for cake manufacture, leading to increased consumption of liquid honey by the baking industry to the benefit of the Australian honey industry. Finally, the commercialization study in this project found honey could be added to bread during a small commercial bread-making process without adversely affecting any steps in the baking process, although retardation of staling was not observed as noted in another study of this project. The implication of this for the baking industry is that honey can be added to bread in a commercial baking process without producing any adverse effects, which may lead to increased use of Australian honey to the benefit of the Australian honey industry. In conclusion, the findings from this project could mean that small additions of honey (a 3% level that does not affect the taste) to bread formulations may retard the staling of bread by at least 20 h, without significantly affecting the dough mixing time, dough strength, dough stability, or gelatinization during the baking process. This result, when combined with the already ‘natural’ image of honey, should significantly improve the profile of honey amongst food manufacturers, with a possible practice in Australia of adding liquid honey to bakery products, particularly bread, representing a major new domestic market for Australian honey producers. Such a practice occurs in the United States of America, although consumers there are used to a sweeter bread than consumers in Australia.

76
7. Recommendations (1) That extracts of honey containing constituents such as organic acids and metal ions
(particularly anions), etc. need to be investigated to determine which honey constituents or combination of honey constituents produce significantly shorter dough mixing times and more stable doughs, decreased dough gelatinization energies, and optimum viscosities of batters when combined with a model sugar solution.
(2) That when the constituents that produce the above effect are identified, the different
Australian honeys known to contain higher concentrations of these desired constituents should be evaluated in terms of the desired dough mixing properties and stability of bread dough, dough gelatinization energies and batter viscosities.
(3) That chemical properties, and physical properties such as water activity, viscosity and glass
transition temperature, of Australian honey be further investigated, as it is thought that these properties of honey may produce some of the effects found in this report.
(4) Different honey types should be trialed to determine if the bread antistaling effect resulting
from the incorporation of Australian liquid honey is universal across a number of common floral honey types available to the food industry.

77
8. Publications from Project Published Articles 1. Squires, N.K., D’Arcy, B.R. and Caffin, N.A. 1997. Australian honey as an ingredient in white pan bread to retard staling. Cereals ‘97: Proceedings of the 47th Australian Cereal Chemistry Conference, Perth, 14-18 September 1997, 42-46. Melbourne, R Aust Chem Inst. 2. Mackay, D.C., D’Arcy, B.R., Caffin, N.A. and Bhandari, B.R. 1997. Kinetics of gelatinization of plain bread doughs using honey. Cereals ‘97: Proceedings of the 47th Australian Cereal Chemistry Conference, Perth, 14-18 September 1997, 262-264. Melbourne, R Aust Chem Inst. 3. Squires, N., Ford, A., Nottingham, S. Caffin, N. and D’Arcy, B. 1998. The use of sensory evaluation to determine changes in bread texture during the staling process. Culinary Arts and Sciences II Global and National Perspectives. Worshipful Company of Cooks Centre for Culinary Research: Poole, UK. pp. 411-419. Poster Presentations Mackay, D.C., D’Arcy, B.R. and Caffin, N.A. 1997. Functional properties of honey during mixing and baking of plain bread doughs. 35th International Apicultural Congress, Antwerp, Belgium, 1-6 September 1997. Poster. Apimondia.

78
9. References AHB. 1990. Australian Honey Board Annual Report. (Australian Honey Board: Canberra). Anon. 1987. Market honey when the buyers are buying. Australasian Beekeeper. (11): 91. Anon. 1990. World market opportunities. Am. Bee J. 130: 21. Anon. 1991. Here’s to honey. Geelong News. Melbourne. Atwell, W.A., Hood, B.L., Lineback, D.R., Varriano-Marston, E., and Zobel, H.F. 1988. The terminology and methodology associated with basic starch phenomena. Cereal Foods World. 33: 306. Bean, M.M. and Yamazaki, W.T. 1973. Wheat starch gelatinization in sugar solution. (Abstr.) Cereal Sci. Today. 18: 308. Bean, M.M. and Yamazaki, W.T. 1978. Wheat starch gelatinization in sugar solutions. I. Sucrose: microscopy and viscosity effects. Cereal Chem. 55: 936. Biliaderis, C. 1992. Structures and phase transitions of starch in food systems. Food Technol. 46: 98-100, 102, 104, 106, 108-109, 145. Blande, K.M.. 1986. Food products from honey and tropical fruits. Unpublished Study Project. The University of Queensland: Brisbane, Australia. Boogs, M. 1990. Future looks sweet for honey. Retail World. 43 (11). Bowles, L.K. 1996. Amylolytic Enzymes. Chapter 3 in: Baked Goods Freshness. Marcel Dekker, Inc.: New York. p. 105. Boyacioglu, M. H. and D’Appolonia, B. L. 1994. Characterization and utilization of durum wheat for bread making. I. Comparison of chemical, rheological, and baking properties between bread and wheat flours and durum wheat flours. Cereal Chem. 71: 21. Bramesco, N. P. and Sester, C.S. 1990. Application of sensory texture profiling to baked products: some considerations for evaluation, definition of parameters and reference products. J. Texture Stud. 21: 235. Brooke, M. 1970. Sucrose and food manufacture. In: Sugar. J. Yudkin, J. Edelman and L. Hough, eds. Butterworths: London. p. 32. Buck, J.S. and Walker, C.E. 1988. Sugar and sucrose ester effects on maize and wheat starch gelatinization patterns by differential scanning calorimetry. Starch/Staerke. 40: 353. Caffin, N., Squires, N. and D’Arcy, B. 1996. Australian Honey in Dry Food Mixes. RIRDC: Canberra, Australia. Chandler, B.V., Fenwick, D., Orlova, T. and Reynolds, T. 1985. Composition of Australian Honeys. CSIRO: Melbourne, Australia. Conforti, F.D. and Strait, M.J. 1998. The effect of liquid honey as a partial replacement for sugar on the baking and keeping qualities of fat reduced muffins. 1998 IFT Annual Conference. Abstract 34D-24. Crane, E. ed. 1974. Honey. A Comprehensive Survey. Heineman: London.

79
Cross, D.E., Willhoft, M.A. and Wren, J.J. 1971. Migration of water from gluten to starch during bread staling. Chem. and Ind. 2: 174. D’Appolonia, B. L. and Morad, M. M. 1981. Bread staling. Cereal Chem. 58: 186. D’Arcy, B.R., Rintoul, G.B., Rowland, C.Y. and Blackman, A.J. 1997. Composition of Australian honey extractives. 1. Norisoprenoids, monoterpenes, and other natural volatiles from blue gum (Eucalyptus leucoxylon) and yellow box (Eucalyptus melliodora) honeys. J. Agric. Food Chem. 45: 1834. Damodaran, S. 1996. Amino acids, peptides and proteins. Chapter 6 in: Food Chemistry, 3rd ed. O. Fennema, ed. Marcel Dekker, Inc.: New York, USA. p. 394. Dziezak, J.D. 1991. Enzymes: catalysts for food process. Food Technol. (1): 78. Egan, H., Kirk, R.S. and Sawyer, R. (1981). Pearson’s Chemical Analysis of Foods. Longman Scientific and Technical: England, UK. p. 170. Eliasson, A-C. and Larsson, K. 1993. Cereals in Breadmaking. Marcel Dekker Inc.: New York, USA. pp 115-122. Galal, A. and Johnson, J. 1976. Effect of pectin and glycerol on bread staling. Baker’s Dig. 50(6): 20. Glabe, E.F., Golman, P.F. and Anderson, P.W. 1963. Honey solids. Baker’s Dig. 37(5): 3. Glover, J.M., Walker, C.E. and Mattern, P.J. 1986. Functionality of sorghum flour components in a high-ratio cake. J. Food Sci. 51: 1280. Godshall, M.A., and Solms, J. 1992. Flavour interactions with starch. Food Technol. (6): 140, 142, 144. Graddon, A. D., Morrison, J. D. and Smith, J. F. 1979. Volatile constituents of some unifloral Australian honeys. J. Agric. Food Chem. 27: 832. He, H. and Hoseney, R.C. 1990. Changes in bread firmness and moisture during long-term storage. Cereal Chem. 67: 603. Hebeda, R. E., Bowles, L. K. and Teague, W. M. 1990. Developments in enzymes for retarding staling of baked goods. Cereal Foods World. 35: 453. Henry, R.E. 1976. High fructose corn syrup - new sweetener for the baker. Baker’s Dig. 50 (2): 25-26, 74.
Hepworth, A. and Squires, N.K. 1991. Honey as a food ingredient. Proceedings of the 24th Annual Convention of the Australian Institute of Food Science and Technology. AIFST Tasmanian Branch Scottsdale, 83. Hepworth, A. and Squires, N.K. (1992). Opportunities for Australian honey. Australasian Beekeeper 94: 243.
Hoseney, R.C. 1994. Principles of Cereal Science and Technology. 2nd ed. American Association of Cereal Chemists Inc.: Minnesota, USA. pp. 238-244.
I’Anson, K.J., Miles, M.J., Morriss, V.J., Besford, L.S., Jarvis, D.A. and Marsh, R.A. 1990. The effects of added sugars on the retrogradation of wheat starch gels. J. Cereal Sci. 11: 243.
Jackel, S. 1975. Sugar alternatives in bread and rolls. Bakery Production. 4: 66-68, 70.
80
Johnson, L. 1990. Honey marketing is it time for a change? Australasian Beekeeper. (3): 393. Kim, S. and D’Appolonia, B. 1977a. The role of wheat flour constituents in bread staling. Baker’s Dig. 51(1): 38-42, 44, 57. Kim, S.K. and D’Appolonia, B.L. 1977b. Bread staling studies I. Effect of protein content on staling rate and bread crumb pasting properties. Cereal Chem. 52: 207. Kim, C.S. and Walker, C.E. 1992. Effects of sugars and emulsifiers on starch gelatinization evaluated by differential scanning calorimetry. Cereal Chem. 69: 212. Knightly, W.H. 1977. The staling of bread – a review. Baker’s Dig. 51(5): 52-56, 144-150. Kortbech-Olesen, R. 1986. Honey exports: possibilities in a highly competitive market. Int. Trade Forum. 22: 4-7, 30. Krog, N., Olesen, S.K., Toernaes, H. and Joensson, T. 1989. Retrogradation of the starch fraction in wheat bread. Cereal Foods World. 34: 281. Kulp, K., Lorenz, K., and Stone, M. 1991. Functionality of carbohydrate ingredients in bakery products. Food Technol. (3): 136, 138-140, 142. Maga, J.A. 1975. Bread staling. In: Critical Reviews in Food Technol. T.E. Furia, ed. Chemical Rubber Co.: Ohio, USA. 5: 443. Magnuson, K. 1984. Liquid to dry ingredient form affects processing ease. Baker's Dig. 58(5): 20. Maleki, M., Hoseney, R. and Mattern, P. 1980. Effects of loaf volume, moisture content, and protein quality on the softness and staling rate of bread. Cereal Chem. 57: 138. Martin, M.L., Zeleznak, K.J. and Hoseney, R.C. 1991. A mechanism of bread firming. I. Role of starch swelling. Cereal Chem. 68: 498. Mossel, B. and D’Arcy, B.R. 1999. Unpublished Study. The University of Queensland: Brisbane, Australia. Nekom, H. and Rutz, W. 1981. Observations on starch retrogradation and bread staling. Lebensm.-wiss.u.-Technol. 14: 292. Piazza, L. and Masi, P. 1995. Moisture redistribution throughout the bread loaf during staling and its effect on mechanical properties. Cereal Chem. 72: 320. Piesookbunterng, W. and D’Appolonia, B.L. 1983. Bread Staling Studies. I. Effect of surfactants on moisture migration from crumb to crust and firmness values of bread crumb. Cereal Chem. 60: 298. Platt, W. and Powers, R. 1940. Compressibility of bread crumb. Cereal Chem. 17: 601. Rath, S.L. 1984. Australian Honey Board Survey of the Industrial Market for Honey in NSW and Victoria. Polymex Consultants: Sydney, Australia. Reineccius, G.A. 1992. Staling of bakery products. Cereal Foods World. 37: 272. Rowland, C. Y., Blackman, A. J., D’Arcy, B. R. and Rintoul, G. B. 1995. Comparison of organic extractives found in leatherwood (Eucryphia lucida) honey and leatherwood flowers and leaves. J. Agric. Food Chem. 43: 753.

81
Ruëgg, M and Blanc, B. 1980. The water activity of honey and related sugar solution. Lebensm.-wiss.u.-Technol. 14: 1. Russell, P. 1983a. A kinetic study of bread staling by differential scanning calorimetry and compressibility measurements. The effect of different grists. J. Cereal Sci. 1: 285. Russell, P. 1983b. A kinetic study of bread staling by differential scanning calorimetry and compressibility measurements. The effect of added monoglycerides. J. Cereal Sci. 1: 297. Schoch, T.J. and French, D. 1947. Studies on bread staling 1. The role of starch. Cereal Chem. 24: 231. Siljeström, M., Björck, I., Eliasson, A., Lönner, C., Nyman, M., and Asp, N. 1988. Effects of polysaccharides during baking and storage of bread - in vitro and in vivo studies. Cereal Chem. 65: 1. Singh, B., Bajal, M. and Sidhu, J. 1991. Spoilage of bread - causes and remedies. Indian Food Packer. (5-6): 66. Slade, L. and Levine, H. 1987. Recent advances in starch retrogradation. In: Recent Developments in Industrial Polysaccharides. S.S. Stivala, V. Crescenzi and I.C.M. Dea eds. Gordon and Breach Science Pubs.: New York, USA. p. 387. Spies, R.D. and Hoseney, R.C. 1982. Effect of sugars on starch gelatinization. Cereal Chem. 59: 128. Squires, N. 1991. Industrial and consumer marketing research studies. An Unpublished Report. The University of Queensland: Brisbane, Australia. Squires, N.K. 1994. The potential use of Australian honey in commercial bread premixes. Proceedings of the 27th Annual Convention of the Australian Institute of Food Science and Technology. AIFST New South Wales Branch. Squires, N.K. and Hepworth, A. 1990. Sorption isotherms of honey. Proceedings of the Australian and New Zealand Institutes of Food Science and Technology Convention. AIFST Queensland Branch. 236. Squires, N.K. and Hepworth, A. 1992. Sorption isotherms of honey. ASEAN Food J. 7: 219. Stauffer, C.E. 1990. Functional Additives for Bakery Foods. Van Nostrand Reinhold. New York, USA. Sun, Y. 1995. A chemical investigation of some New Zealand native honeys. M. Phil. Dissertation. University of Waikato: Hamilton, New Zealand. Tan, S.-T. 1989. A chemical investigation of some New Zealand honeys. D. Phil. Dissertation. University of Waikato: Hamilton, New Zealand. Tan, S.-T., Holland, P. T., Wilkins, A. L. and Molan, P. C. 1988. Extractives from New Zealand honeys. 1. White clover, manuka, and kanuka unifloral honeys. J. Agric. Food Chem. 1988, 36: 453. Tan, S.-T., Wilkins, A. L., Holland, P. T. and McGhie, T. K. 1989a. Extractives from New Zealand unifloral honeys. 2. Degraded carotenoids and other substances from heather honey. J. Agric. Food Chem. 37: 1217.

82
Tan, S.T., Wilkins, A.L., Holland, P.T. and McGhie, T.K. 1990. Extractives from New Zealand honeys. 3. Unifloral thyme and willow honey constituents. J. Agric. Food Chem. 38: 1833. Tan, S.-T., Wilkins, A. L., Molan, P. C., Holland, P. T. and Reid, M. 1989b. A chemical approach to the determination of floral sources of New Zealand honeys. J. Apic. Res. 28, 212. Turkot, V.A., Eskew, R.K. and Claffey, J.B. 1960. A continuous process for dehydrating honey. Food Technol. (8): 387. Vlitos, A.J. 1974. Sucrose. In: Symposium. Sweeteners. G.E. Inglett et al. eds. AVI Publishing Co.: Westpoint, USA. Voll, H. 1974. New adaptation of honey to bread making. Baker’s Dig. (8): 45, 48-49, 58. White, J.W. 1976. Composition of honey. Chapter 5 In: Honey. A Comprehensive Survey. E. Crane ed. Heinemann: London, UK. pp 157-206. White, J.W. and Underwood, J.C. 1974. Maple syrup and honey. In: Symposium. Sweeteners. G.E. Inglett et al. eds. AVI Publishing Co.: Westpoint, USA. Wilkins, A. L., Lu, Y. and Molan, P. C. 1993a. Extractable organic substances from New Zealand unifloral manuka (Leptospermum scoparium) honeys. J. Apic. Res. 32: 3. Wilkins, A. L., Lu, Y. and Tan, S.-T. 1993b. Extractives from New Zealand honeys. 4. Linalool derivatives and other components from nodding thistle (Carduus nutans) honey. J. Agric. Food Chem. 41: 873. Wilkins, A.L., Lu, Y. and Tan, S-T. 1995a. Extractives from New Zealand honeys. 5. Aliphatic dicarboxylic acids in New Zealand rewarewa (Knightea excelsa) honey. J. Agric. Food Chem. 43: 3021. Wilkins, A.L., Tan, S.-T.; and Molan, P.C. 1995b. Extractable organic substances from New Zealand unifloral vipers bugloss (Echium vulgare) honey. J. Apic. Res. 34, 73. Willhoft, E.M.A. 1971a. Bread staling I. – Experimental study. J. Sci. Food Agric. 22: 176. Willhoft, E.M.A. 1971b. Bread staling II. – Theoretical study. J. Sci. Food Agric. 22: 180. Willhoft, E. 1973a. Recent developments on the bread staling problem. Baker’s Dig. (12): 14-16, 20. Willhoft, E. 1973b. Mechanism and theory of staling of bread and baked goods and associated changes in textural properties. J. Texture Stud. 4: 292. Wilshire, W.B. 1990. Honey marketing – past, present and future. Australasian Beekeeper. (6): 515. Wootton, M., Edwards, R. A. and Faraji-Haremi, R. 1978. Effect of accelerated storage conditions on the chemical composition and properties of Australian honeys. 3. Changes in volatile components. J. Apic. Res. 17: 167. Zobel, H.F. and Kulp, K. 1996. The staling mechanism. Chapter 1 In: Baked Goods Freshness. Marcel Dekker, Inc.: New York, USA. p. 1.

83
10. Appendix
100
105
110
115
120
125
0 2 4 6 8Addition Level (%w/w flour)
Ons
et T
empe
ratu
re (D
egre
es C
) Honey
Model Sugar Solution
Appendix 1 Mean gelatinization temperature (°C) using standard bakers flour with
increasing levels of honey addition compared to the gelatinization temperature of a dough using a model sugar solution at the same level of addition. (The model solution contains the same fructose, glucose, sucrose and maltose concentration as the honey sample; actual standard deviations for each sample are included, rather than the pooled ones used for significance) Mean are means of replications; SE = 1.5; Source (honey or sugar) P = 0.288; Addition Level P = 0.012
-Honey; -Model sugar solution.

84

85