australian infrastructure...
TRANSCRIPT

Australian Infrastructure AuditOur Infrastructure ChallengesReport – Volume 1April 2015

Infrastructure Australia is an independent statutory body that is the key source of research and advice for governments, industry and the community on nationally significant infrastructure needs.
It leads reform on key issues including means of financing, delivering and operating infrastructure and how to better plan and utilise infrastructure networks.
Infrastructure Australia has responsibility to strategically audit Australia’s nationally significant infrastructure, and develop 15 year rolling infrastructure plans that specify national and state level priorities.
Online
ISBN 978-1-925352-03-0
ISBN 978-1-925352-04-7
Ownership of intellectual property rights in this publication
Unless otherwise noted, copyright (and any other intellectual property rights, if any) in this publication is owned by the Commonwealth of Australia (referred to below as Infrastructure Australia).
© Infrastructure Australia 2015
Disclaimer
The material contained in this publication is made available on the understanding that the Commonwealth is not providing professional advice, and that users exercise their own skill and care with respect to its use, and seek independent advice if necessary.
The Commonwealth makes no representations or warranties as to the contents or accuracy of the information contained in this publication. To the extent permitted by law, the Commonwealth disclaims liability to any person or organisation in respect of anything done, or omitted to be done, in reliance upon information contained in this publication.
Creative Commons licence
With the exception of the Coat of Arms, the copyright in this publication is licensed under a Creative Commons Attribution 3.0 Australia Licence.
Creative Commons Attribution 3.0 Australia Licence is a standard form licence agreement that allows you to copy, communicate and adapt this publication provided that you attribute the work to the Commonwealth and abide by the other licence terms.
A summary of the licence terms is available from http://creativecommons.org/licenses/by/3.0/au/deed.en.
The full licence terms are available from http://creativecommons.org/licenses/by/3.0/au/legalcode
This publication should be attributed in the following way: © Infrastructure Australia 2015

Australian Infrastructure AuditOur Infrastructure ChallengesReport – Volume 1April 2015

2 Australian Infrastructure Audit Report

Australian Infrastructure Audit Report 3
ContentsVolume 1Chairman’s introduction 4Audit Findings 6
THE AUDIT – NATIONAL VIEW 11
1 Introduction 12
2 Infrastructure expectations and drivers of demand 16
3 Current and prospective infrastructure gaps 30
4 Governance and policy reform 38
5 Social and sustainability considerations 56
6 Infrastructure maintenance 68
7 NationalAuditfindingsbysector 76
7.1 Transport 79
7.2 Energy 107
7.3 Telecommunications 116
7.4 Water 121
Lists of Figures and Tables in Volume 1 130
Volume 2THE AUDIT – BY STATE AND TERRITORY 133
1 Auditobservations−NewSouthWales 136
2 Auditobservations−Victoria 160
3 Auditobservations−Queensland 182
4 Auditobservations−WesternAustralia 202
5 Auditobservations−SouthAustralia 222
6 Auditobservations−Tasmania 242
7 Auditobservations−AustralianCapitalTerritory 254
8 Auditobservations−NorthernTerritory 266
APPENDICES AND TABLES 280
Appendix 1 Direct Economic Contribution (DEC) 280
Appendix 2 Tables showing Direct Economic Contribution by geographic area and sector 285
Appendix 3 Glossary 298
Appendix 4 Acronyms 299
Appendix 5 Lists of Figures and Tables in Volume 2 300
Appendix 6 Bibliography 304
4 Australian Infrastructure Audit Report
Chairman’s introduction Our infrastructure challenges
Australia has many great advantages. We have an impressive natural and built environment, a highly educated population and a diverse business and employment base. We have enjoyed many years of prosperity and social progress.
But the nation’s ability to deliver the infrastructure we need to sustain – and deepen – those advantages is being severely tested. A costly shortfall of infrastructure has seen congestion, bottlenecks and queues constrain economic performance, depress productivity and limit improvements in our living standards.
Experiences of transport networks failing to keep pace with demand, water quality standards being uneven, energy costs being too high, telecommunication services being outdated, or freight corridors being neglected are now so common that they necessitate a strategic response.
It is therefore timely that the Australian Government commissioned Infrastructure Australia to undertake the first ever audit of the nation’s infrastructure.
Infrastructure is important to us all because our infrastructure aspirations are a reflection of our ambition as a country. Delivered and operated well, it enhances our nation’s competitiveness and provides a foundation for a sustainable future. So there is one particularly compelling reason for us to act. If we get our infrastructure right, we will protect Australia’s quality of life at a time of population growth and global economic change.
The Australian Infrastructure Audit examines our asset base and studies the drivers of future demand. It will be followed by a 15 year Australian Infrastructure Plan, which we are developing now and will present to the Government later in 2015.
The Audit highlights ten particular challenges that Australia will face:
Productivity – national productivity levels need to be increased through regular strategic investment in economic infrastructure
Population – huge population growth, particularly in our major cities, will necessitate the delivery of new and renewed infrastructure
Connectivity – modernised infrastructure networks and gateways are needed to link businesses, boost trade and improve access to workplaces
Funding – reforms are essential to increase the total pool of funds made available for infrastructure, especially by facilitating private investment
Competitive Markets – national infrastructure markets must operate to improve investment decisions and give consumers choice
Governance – integrated planning, transparent project selection, and stakeholder consultation are essential and all have to improve
Sustainability and Resilience – we will need to cut environmental impacts and improve resilience, using new technology to run our infrastructure better
Australian Infrastructure Audit Report 5
Regional – we must see how infrastructure improvements can enhance local service standards and facilitate rural and regional growth
Indigenous – across the nation we can do more to achieve equity and close the infrastructure gap faced by remote communities
Best Practice – a uniting theme is how to pursue best practice procurement and delivery, and encourage whole-of-life asset management.
Investment in infrastructure is required to address these issues and allow new economic and social opportunities to be realised. Funding constraints therefore present a core challenge.
Existing institutional arrangements, especially in the transport sector, do not provide sufficient funding to address the required infrastructure needs. The combined expenditure of the public and private sectors on infrastructure will need to be expanded, all at a time when spending by governments is being constrained by other legitimate demands (notably for health services and welfare).
The Audit also highlights the importance of good governance and modern regulatory settings that get the best out of our existing and new infrastructure.
Transparency in decision making can help us prioritise the choices we face. Efficient markets will drive higher standards of service delivery. Greater sharing of information on infrastructure performance and outcomes will improve long-term decision making.
We should, in an ambitious but practical way, seek to fill the nation’s infrastructure gaps by continuously improving the way projects are planned, constructed and operated.
By forming a comprehensive picture of our existing infrastructure, and making informed projections about our future, we have the opportunity to consider where we want to be as a nation. Seeing our future will allow us to shape it.
Infrastructure Australia is committed to working with governments, business and the community to ensure that Australia’s infrastructure – and the planning behind it – is working in the national interest.
A central purpose of the Audit is to motivate public discussion and encourage input into the forthcoming Australian Infrastructure Plan. I therefore welcome your comments on this report.
Mark Birrell
Chairman, Infrastructure Australia
If we get our infrastructure right, we will protect Australia’s quality of life at a time of population growth and global economic change.”
6 Australian Infrastructure Audit Report
Australia’s infrastructure needs and expectations 1. Australians expect their infrastructure
networks to support a high quality, first world standard of living. They expect infrastructure to improve their quality of life in the future, notwithstanding significant population growth and major economic, social and environmental change.
2. There are grounds for concern that Australia’s infrastructure networks and the systems under which they are managed are not meeting these expectations.
3. Infrastructure exists to provide services. The focus of governments and the private sector must be on the quality of infrastructure services, and their cost to users and the community at large.
4. Inadequate attention is being given to the level of service Australians need and expect from their infrastructure, how much different service levels cost, and how they will be paid for. In some sectors, there is insufficient public data and information to support informed public discussion about these questions.
Future demand for infrastructure5. Future demand for infrastructure will be
directly affected by growth in population, broader developments in the local and global economy, technological change, the need for environmental sustainability and consumer preferences.
6. Population growth will drive a significant rise in the demand for infrastructure services. On medium level projections, Australia’s population is projected to grow from 22.3 million in 2011 to 30.5 million in 2031 − an increase of 8.2 million or 36.5 per cent.
7. Almost three-quarters of this growth (72.0 per cent) is projected to be in the four largest capitals – Sydney, Melbourne, Brisbane and
Perth. In total, these four cities are projected to grow by 5.9 million people, or 46 per cent, to 18.6 million in 2031. This growth will impose additional demands on urban infrastructure already subject to high levels of demand.
8. The other capital cities – Adelaide, Canberra, Hobart and Darwin − are projected to grow in total by slightly more than 0.5 million people or 26.7 per cent. Given this, it is worth considering what steps could be taken to foster greater long-term growth in those cities, which may moderate the consequential infrastructure challenges in the larger cities.
9. The value-add (economy-wide spending) attributable to infrastructure services was estimated to be 13.3 per cent of GDP in 2011. Over 70 per cent of this was attributable to transport. The value-add attributable to infrastructure services is projected to grow roughly proportionate with the economy to 2031.
10. The infrastructure sectors projected to grow faster than GDP are transport, ports, telecommunications, gas pipelines and airports. The sectors projected to grow slower than GDP are water, petroleum, electricity, non-urban roads and non-urban rail.
11. Infrastructure decision making must place a high priority on productivity growth. This can only be achieved through efficient management of existing infrastructure, rigorous and disciplined evaluation of investment initiatives, and efficient delivery of new projects.
12. International and local reviews show that rigorous project selection is key to boosting economic activity and supporting productivity growth. However, investment in poorly conceived projects can undermine a country’s economic prospects.
Auditfindings
Australian Infrastructure Audit Report 7
Current and prospective infrastructure gaps13. Across various sectors, gaps in service quality
already exist and will grow. These gaps are particularly evident in urban transport. Gaps in the quality and reliability of water services in some rural towns are also evident.
14. There is also a gap between expectations about infrastructure quality, and the willingness or ability to pay. There is a need for serious public discussion about infrastructure service levels and funding.
15. In several areas, Australia’s infrastructure performance compares poorly with a number of other countries (including those that have similar population densities and harsh weather conditions). These international rankings indicate that Australia can perform better in infrastructure effectiveness and quality.
Governance and policy reform16. Australia needs integrated infrastructure
and land-use planning, across all levels of government. Progress has been slow in securing the efficiency and service delivery benefits of strategic decision making.
17. Sound infrastructure planning requires an ongoing commitment to engage communities throughout the decision-making process. This improves the likelihood of meeting community needs and expectations, and reduces objections to development.
18. Improvements in long-term infrastructure planning, project appraisal and project selection (including the consistent use and transparent reporting of cost−benefit analyses) are necessary if Australians’ expectations are to be realised.
19. Long-term planning necessarily involves dealing with uncertainty, with current issues including:
a. the implications of demographic change for Australian society generally and government finances in particular;
b. the scope and direction of technological change;
c. changes in the global economy;
d. the future of work, e.g. where people work, incomes, and part-time work; and
e. the prospect of climate change, and uncertainty as to how the international community will respond.
20. There is a need for more detailed information on infrastructure performance to be assembled consistently, at a national level, and for this information to be reported publicly to assist the forecasting of benefits and costs when planning infrastructure.
21. An improved framework is required to protect corridors for transport and other linear infrastructure. The failure to protect corridors can lead to significantly higher construction costs, making otherwise beneficial projects uneconomic.
22. Post-completion reviews are not regularly undertaken for infrastructure projects, limiting the opportunities for governments and others to learn from mistakes and successes. This is to the detriment of current and future decision-making processes.
23. Ineffective and inconsistent regulation has had adverse outcomes for infrastructure users and the Australian community. These include high costs in parts of the electricity sector, poor pricing decisions leading to potential problems in the future in the water sector, and poor levels of cost-recovery in the transport sector. Greater independence of regulatory oversight would improve the quality of decision making.
8 Australian Infrastructure Audit Report
24. Environmental considerations should form a fundamental aspect of infrastructure project selection and planning processes.
25. More rigorous and transparent strategic planning offers the potential to minimise project level disputes about the environmental merits and impacts of specific projects.
Funding26. Over recent years, rates of public and private
investment in infrastructure have been higher than the long-term average.
27. The current level of public sector expenditure – especially in the transport sector, which remains largely funded by government rather than user charges – may be unsustainable in the face of increasing budget pressures to fund welfare and health services.
28. Current arrangements for the funding of land transport represent the most significant opportunity for public policy reform in Australia’s infrastructure sectors.
29. Government funding alone is unlikely to be sufficient to provide the infrastructure that Australia requires. Maintaining or strengthening conditions to facilitate private sector investment in and operation of Australia’s infrastructure networks is fundamentally important.
30. The country needs to consider a broader system of transport pricing, both for road and public transport.
31. Amalgamation of local government in some areas, and other reforms such as shared services arrangements, will be necessary if local councils are to have the scale and financial capacity to meet their local infrastructure responsibilities.
32. Skills shortages contribute to cost increases for infrastructure construction. Development of an infrastructure pipeline presents an opportunity to develop a better skilled workforce and to minimise skills shortages in the future.
33. Australia would benefit from a strong and consistent pipeline of future infrastructure projects. Without this, there is uncertainty and less likelihood of a well-resourced environment for project procurement. The effectiveness and cost of current procurement processes in some jurisdictions are also an ongoing concern.
34. Governments, industry and the community should ensure there is a continuous focus on reducing construction costs, and promoting modern building practices.
Social considerations35. Access to transport remains a critical social
equity consideration, particularly for the outer suburbs of Australia’s cities and most parts of regional Australia. These areas generally have an undersupply of transport services (especially public transport) and of local employment options.
36. Telecommunications have become a highly important part of people’s lives, for social as well as economic reasons. The National Broadband Network (NBN) is expected to materially improve service levels and the ability of households in rural and remote regions to connect with their wider social networks.
37. Following completion of the NBN roll-out, governments will still need to consider what steps are required to provide appropriate and equitable services in rural and urban telecommunications services.
38. Dealing equitably with the affordability of infrastructure services is an important consideration, as a matter of social policy. Unless affordability concerns are addressed, the necessary shift to greater application of user charging will struggle to gain community and political support.
39. Households with incomes in the lowest 20 per cent are the most exposed to the monetary costs of inefficient economic infrastructure. Public policy settings need to assist Australians on low incomes to access the infrastructure services they need, in an equitable manner.
Sustainability considerations 40. Adapting to climate change and pursuing
sustainable environmental outcomes is a core responsibility of infrastructure planners, owners and operators.
41. The projected decrease in rainfall (and the associated increasing exposure to severe drought) in the heavily populated southern parts of Australia presents significant challenges for the water sector.
42. The number and intensity of extreme weather events is increasingly likely to threaten certain infrastructure assets. Repairing these assets, and enhancing their resilience, will require an increase in maintenance expenditure.

Australian Infrastructure Audit Report 9
43. Infrastructure operations can be disrupted by a range of hazards, including natural disasters. Ensuring infrastructure is able to continue operating through minor disruptions, and recover quickly from major disruptions, will be critical.
44. Infrastructure-related emissions accounted for approximately half of Australia’s total greenhouse gas inventory in the year to September 2014, mainly from the electricity sector (33 per cent) and transport sector (17 per cent).
45. Transitioning to a lower emissions economy will require full consideration of reducing greenhouse gas emissions when infrastructure plans, construction methods and operational frameworks are being determined.
46. Underinvestment in the maintenance of some parts of Australia’s infrastructure networks, notably in regional Australia, could reduce the ability of those networks to provide reasonable levels of service in the future. The most significant risks are in:
a. local roads, especially in regional and remote areas, where there are large road networks to be maintained and local councils have limited or declining income bases;
b. regional rail infrastructure carrying low volumes of grain and/or general freight, especially those with ageing timber bridges and timber sleepers; and
c. regional town water services provided by local councils.
47. All jurisdictions need to direct attention towards improving whole-of-life asset management processes, and to ensuring adequate long-term funding strategies are in place.
Transportsector–specificfindings48. Demand for urban transport infrastructure is
projected to increase significantly. The cost of congestion in our capital cities, estimated at $13.7 billion in 2011, is expected to increase to around $53.3 billion in 2031, or around 290 per cent, in the absence of additional capacity and/or demand management.
49. Demand for many key urban road and rail corridors is projected to significantly exceed current capacity by 2031.
50. Urban transport decisions need to complement land use decisions (especially about the supply and affordability of housing). Although some improvements have been made in this area, there remains a risk that community resistance to land use change and higher densities will undermine the economic, social and environmental benefits of investment in urban transport.
51. The national land freight task is expected to grow by 80 per cent between 2011 and 2031, with a large component of this task expected to be handled by road freight vehicles.
52. Accommodating this growth will require a focus on policy reform to enable the wider use of higher productivity heavy vehicles (such as B-triples), and selected investment (such as increasing bridge load limits and targeted safety improvements, aimed at improving the performance of national highway infrastructure).
53. Demand for freight rail infrastructure is projected to grow, in particular for resource bulk commodity haulage in WA, Queensland and NSW.
54. Freight rail will need to play a growing role in the movement of goods between ports and inland freight terminals, and in the movement of containerised and general freight over longer distances.
55. Demand for container terminal port infrastructure and bulk terminal infrastructure are both projected to grow faster than GDP. Traffic through some ports is projected to significantly exceed current capacity by 2031.
56. The nation’s larger ports are operated as commercial enterprises, whether they are publicly or privately owned, or leased. Accordingly, investment requirements for these ports are expected to be met by user charges.
57. Given wider funding constraints, governments face challenges in ensuring adequate landside rail and road access to ports.
58. Demand for airport infrastructure is projected to approximately double between 2011 and 2031.
59. Australia’s 10 busiest airports handle more than 80 per cent of total passenger traffic. Over the next 15 years, additional capacity will be required in Sydney, Brisbane, Perth and Melbourne. The regulatory framework for airports, which obliges private airport operators to provide required airport capacity, appears to be working appropriately.
10 Australian Infrastructure Audit Report
60. The larger airports are all privately operated commercial enterprises, and investment requirements for these airports should be able to be met by user charges. However, given wider funding constraints, governments and airport operators face challenges in ensuring adequate landside access to airports.
61. A number of smaller airports are unlikely to have the throughput to cover their maintenance and potential capital costs. Governments will need to prioritise their outlays in support of these airports.
62. As well as being the largest infrastructure sector, transport is also the most challenging, with relatively high projected growth in demand, a low proportion of user-based funding and market-based pricing mechanisms, challenges with project selection processes, and emerging maintenance issues in some segments.
Energysector–specificfindings63. Lack of certainty on national and international
approaches to dealing with climate change directly affects investment in the energy sector.
64. Demand for electricity infrastructure is projected to grow significantly slower than GDP.
65. There is expected to be sufficient electricity generating capacity for at least the next five to 10 years.
66. The National Electricity Market is functioning well. However, several regulatory issues will require attention, including tariff reform to reduce peak period demand.
67. There is a need for continued government assistance to support electricity supply in remote communities where generation is not able to be provided on a commercial basis.
68. Australia’s dependence on imported fuel has increased. The current arrangements for managing petroleum reserves and ensuring energy security deserve wider public policy consideration.
Telecommunicationssector–specificfindings69. The quality of telecommunications service
across Australia is mixed, with generally good services in cities and with lower quality services in rural areas and some outer urban areas. The NBN is expected to reduce service disparities within the next five years.
70. Demand for telecommunications infrastructure will continue growing rapidly across the nation, faster than GDP growth.
71. A key challenge will be the efficient rolling-out of an open access, wholesale only fixed-line broadband network.
72. Governments and the private sector will need to focus on making the best use of the NBN, thereby delivering the expected economic and social benefits to the country.
73. The telecommunications sector’s economic contribution will be best served by continuing support for effective competition.
Watersector–specificfindings74. Demand for water infrastructure is projected to
grow significantly slower than GDP.
75. Economic regulation of the sector is fragmented and may not effectively protect the long-term interests of consumers: objectives are often not clearly specified; links between economic, health and environmental regulation are not well identified; and existing economic regulation does not provide the consistency, certainty and transparency necessary to support further private involvement in the sector.
76. There is a need for more transparent and competitive pricing of water supply and wastewater treatment services, across urban and regional areas. In encouraging greater competition, careful consideration of the appropriate market structure(s) is required.
77. There is a need for additional market reform in the rural water sector, including market-based allocation of defined catchment resources, and transparent pricing of irrigation water.
78. Water quality in urban areas is good, but in parts of regional Australia it does not meet relevant drinking water standards.
79. Future climate variability could lead to a need for further water infrastructure to augment supplies.
80. A number of urban water utilities have increased their borrowings over recent years, for various reasons, with consequential impacts on their commercial performance and their ability to take on additional debt.
81. Underinvestment in maintenance of some water assets, and ageing infrastructure, will require an increased focus on maintenance and renewal.
Australian Infrastructure Audit Report 11
Volume 1The AuditNational View

12 Australian Infrastructure Audit Report
IntroductionHigh quality economic and social infrastructure is vital to ensure Australia can maximise its productivity and maintain a high standard of living. It supports business and trade, connects people and places, fosters innovation, and enhances our quality of life.
Infrastructure Australia is mandated to develop plans for nationally significant infrastructure. Under its Act, ‘nationally significant’ infrastructure is defined to include the four sectors of transport, energy, telecommunications and water infrastructure.
Local, state and territory governments play critical roles in planning and providing infrastructure to their communities, and in certain cases work with the Commonwealth to do so. In addition to the economic benefits derived from our economic infrastructure, services such as health, education and recreation are delivered to Australians by social, cultural, sporting and environmental infrastructure assets.
The Australian Government has asked Infrastructure Australia to undertake two significant tasks. The first is to conduct an Audit of our national economic infrastructure. The findings of this Audit will form the basis for the second task – to develop a 15 year Australian Infrastructure Plan.
The Audit examines Australia’s infrastructure assets and networks from a national perspective. This report records the findings of the Audit and seeks to answer a key question: where do we need to focus our attention to ensure that our infrastructure supports Australia’s growth?
The Audit assesses the following infrastructure sectors and subsectors:
■ transport: with subsectors for urban transport networks, national highways, freight rail, ports and airports;
■ energy: with subsectors for electricity, gas and petroleum terminals;
■ water:with subsectors for water and sewerage facilities; and
■ telecommunications: including fixed line, mobiles and broadband.
For the first time, the Audit provides a ‘top down’ assessment of the nation’s current economic infrastructure and the contribution it makes to Gross Domestic Product (GDP). It assess the value-add of the infrastructure sectors using the Direct Economic Contribution (DEC) measure (see Appendix 1). It also considers infrastructure demands and needs at both national and regional levels as we look ahead to 2031. Finally, based on available evidence, it identifies the gaps. This economic assessment is based on a range of assumptions to consider how, when and where demand for infrastructure services will change.
The analysis indicates the value-add from the four key economic infrastructure sectors (Figure 1) was approximately $187 billion in 2011,1 i.e. around 13 per cent of GDP.2 Based on a range of indicators, the Audit finds that Australia’s infrastructure faces significant current and emerging pressures. Carefully planned and prioritised investment, as well as reform in broader infrastructure policies, will be necessary to maximise our national potential and living standards.
1. The base year for the Audit is 2011, which was selected because it was a national census year. There is therefore more complete and reliable data about infrastructure available for 2011 than is available for more recent years. 2. ACIL Allen Consulting (2014a)

Australian Infrastructure Audit Report 13
Figure 1: Sectoral distribution of infrastructure’s value-add by Direct Economic Contribution (DEC) in 2011 ($ million, 2011 prices)
$21,050
$10,610
$1,077
$2,345
$16,064
$5,426
$20,677
$20,655
$9,499
$79,685
90%
100%
80%
70%
60%
50%
40%
30%
20%
10%
0%
Telecommunications
Water and sewerage
Petroleum product terminals
Gas pipelines
Electricity
Freight Rail
Airports
Ports
National highways
Urban transport
Telecommunications$21,050
Water and Sewerage $10,610
Energy $19,486
Transport$56,257
Urban transport$79,685
Infrastructure sectorDEC value Infrastructure sector DEC
Source: ACIL Allen Consulting (2014a)
1.1 Inputs to the AuditIn conducting the Audit, Infrastructure Australia has commissioned a number of reports. It has also consulted with state and territory governments and a range of stakeholders in the infrastructure sector. The commissioned background documents provide a range of ‘data points’ that contribute to the Audit (including reports on the DEC of our infrastructure, a report on demographic projections, a report on infrastructure maintenance, and transport modelling assessments).
Research from government agencies as well as private and non-government parties has also been
reviewed as part of the process.3 Infrastructure Australia has also considered the demographic and other projections contained in the Australian Government’s 2015 Intergenerational Report.
The Audit estimates the value-add of the four infrastructure sectors across 73 geographic Audit regions. These Audit regions are consistent with the geographic boundaries used by the Australian Bureau of Statistics (ABS).
The demand for economic infrastructure is strongly driven by changes in the population and patterns of economic activity. Population growth is often a key determinant of demand projections
13. See Appendix 6 Bibliography.
14 Australian Infrastructure Audit Report
underlying the business cases for infrastructure investments.
It was therefore necessary to prepare a base set of population projections for the Audit. Details of the demographic analysis behind the Audit are set out in two associated reports.4
Long-term population projections prepared by the ABS have been used to set ‘control totals’ at the national, state/territory and capital city levels. Infrastructure Australia’s consultants prepared a finer breakdown into the 73 regions based on economic analysis as well as a review of projections prepared by state and territory governments.
This approach enabled a nationally consistent approach to the demographic projections to be pursued. Although individual states and territories have their own projections, they tend to work from the ABS national control total. In the main, the states and territories projections align reasonably closely with the ABS projections.5
In addition, the Audit refers to associated transport modelling for Australia’s six largest capital cities, which was commissioned to complement the DEC analysis in those locations. The transport modelling undertaken for the Audit has assumed that the following elements comprise the minimum transport network that we can be sure will be in place in 2031:
■ the existing 2014 network;
■ projects under construction; and
■ projects where a budget commitment has been made (e.g. in Sydney, WestConnex Stages 1 and 2, but not Stage 3).
This approach is intended to clearly show where transport demand is projected to grow in excess of supply.6 A complete description of the methodology is contained in the consultant’s report.7
The DEC measure is not the only analytical tool that could be applied when assessing infrastructure. Other tools, such as cost-benefit analysis, are particularly important for detailed, project-level decision making. But it is not possible, in practical terms, to undertake a cost-benefit analysis for every possible infrastructure initiative, to determine which would provide
the greatest value-add to Australia’s economy. The DEC measure facilitates a national view of the sectors and regions where infrastructure investment and/or reform are likely to provide the greatest value-add. Other tools like cost-benefit analysis can then be applied to determine, in detail, which possible initiatives warrant further investigation.
Data for the Audit has been drawn from a wide range of sources. In some cases, data has not been available on a consistent basis, e.g. at a regional level, and in other cases data has had to be interpreted from a variety of sources to arrive at inputs to the assessment. As such, this Audit report does not seek to provide a specific evidence base for making decisions about individual projects. However, it is a valuable nation-wide indicator of the sectors and regions requiring additional focus.
A focus of the Audit was to measure the:
■ supply of infrastructure (using broad capacity metrics);
■ demand for infrastructure (using broad utilisation metrics); and
■ value-add of infrastructure services, and their contributions to GDP and Gross Regional Product (GRP).
The base year for auditing is 2011, which was selected because it was a national census year. There is therefore more complete and reliable data about infrastructure available for 2011 than is available for more recent years.
The Audit projects demand for infrastructure services in 2031. The year 2031 was chosen to align with the national census cycle and five yearly population projections commonly used by governments, and to provide data to underpin development of the 15 year Australian Infrastructure Plan.
Where projected demand is likely to exceed the capacity of existing infrastructure, options for intervention include:
■ introduction of reforms to change the way services are delivered or to manage demand; and/or
■ investment in new infrastructure to expand capacity.
4. Infrastructure Australia (2015b) and ACIL Allen Consulting (2014a) 5. Advice from the Western Australian Government suggests that its projections for the state and for the Perth Greater Capital City Statistical Area are likely to be lower than those prepared by the Australian Bureau of Statistics. As at April 2015, the Western Australian Government has not released updated population projections. 6. In undertaking the analysis, it was necessary to find a surrogate measure for the value that will be contributed by efficient road transport. Travel time savings (or losses) through congestion are that surrogate. The shadow toll includes a measure of the cost of delays due to congestion. The delay cost is measured as the difference between the time it takes to travel on a road link under congested conditions and the time it takes to travel the road link under uncongested conditions. This approach recognises that, although congestion and delay are undesirable, drivers nevertheless use the road in question, knowing that there is likely to be a delay. In other words, even though there may not be an uncongested choice, drivers are making a choice to use the road. 7. ACIL Allen Consulting (2014a)
Australian Infrastructure Audit Report 15
In developing the Australian Infrastructure Plan, initiatives will be proposed and tested to determine the most efficient and effective means of infrastructure delivering sustainable economic growth.
1.1.1 DealingwithuncertaintyThe future is inherently uncertain. Key drivers of demand for infrastructure, e.g. rates of population and economic growth and changes in the climate, as well as our means of responding to change, e.g. new technologies, may evolve in a manner that is different from our current expectations.
This does not mean that attempts cannot or should not be made to make projections of the future environment which will be affected by our infrastructure decisions today. Each time decisions with long-term implications are taken, whether they are infrastructure-related or otherwise, the parties making those decisions cannot avoid taking a view about the future.
The projections underpinning the Audit’s economic analysis represent a set of views about the future. The economic analysis provided two scenarios driven by different views about the rate of population growth in Australia and a third scenario which tested, at a high level, the potential implications of decisions aimed at improving the productivity of the infrastructure sectors.
In preparing the Audit, Infrastructure Australia recognises that other factors may bear on Australia’s development. Equally, it is recognised that different assumptions about factors such as population growth could lead to different conclusions. Depending on how these factors ‘play out’, they may:
■ change the demand for infrastructure;
■ change what we need from our infrastructure; and in turn
■ influence judgments about the most appropriate infrastructure response.
That said, the factors and assumptions used in the economic analysis represent a plausible view about the future that is broadly consistent with the views of Australian governments and other organisations.
1.2 Auditnow–PlantocomeThe Audit is intended to provide the foundation for the preparation of the Plan, which will follow public consultation on this Audit report and the issues it raises.
The Plan is expected to identify a portfolio of reforms and initiatives that are most likely to support the achievement of Australians’ aspirations. These will include:
■ capital investment, i.e. areas where governments should consider spending on new infrastructure; and
■ policy, i.e. changes in the broader settings within which infrastructure decisions are made.
The Plan is also expected to propose changes to the way decisions about infrastructure are made, aimed at increasing the rigour and transparency of decision making. Infrastructure Australia’s existing Infrastructure Priority List, and the assessment methodology by which it is determined, will be updated as part of the Plan.
1.3 Structure of the Audit ReportThis report is structured so that readers can view the Audit results in two ways. The first part ‘The Audit – National View’ provides national level results. The second part ‘The Audit – By State and Territory’ presents observations for each of the wstates and territories.
Some data for the Audit base year (2011) relates to calendar year 2011, while other data relates to financial year 2010-11. In both cases, the data is attributed to 2011 for simplicity.
Figures in tables and in the text may be rounded. Any difference between a total and the sum of its components is the result of rounding.
To assist readers, the full name of key terms (e.g. Australian Bureau of Statistics, New South Wales) is used at the start of each chapter. These terms are then abbreviated in the rest of the chapter (e.g. ABS, NSW).
16 Australian Infrastructure Audit Report
Infrastructure expectations and drivers of demand
Key Points ■ Australians expect the nation’s infrastructure to sustain and improve current living standards and quality of life.
■ Australia’s population is projected to grow at around 1.6 per cent per year to 2031. Most of this growth will be in the largest capital cities.
■ The economy is projected to grow at around three per cent per year, with some variation in growth rates between the states and across industries. Governments will need to focus on how decisions in the infrastructure sector can strengthen industries in which Australia has a competitive advantage.
■ Productivity in the infrastructure sectors has been static or falling, although there are cyclical influences. Declines in multi factor productivity need to be addressed.
This chapter provides context for the discussion in subsequent chapters of particular infrastructure issues.
It opens with an examination of Australians’ higher order aspirations. This provides important guidance as to what Australians expect from their infrastructure. It then considers the two principal drivers of demand for infrastructure − growth in population and economic activity. The discussion on economic issues includes an examination of trends in economic productivity, both generally and within the infrastructure sectors.
2.1 Qualityoflife–aspirationsand expectationsInfrastructure exists to provide a service. Services provided by Australia’s infrastructure must be aimed at supporting Australians’ aspirations, expectations and needs.
This raises an important question for the Audit − what is it that Australians want from their infrastructure? The question is just as relevant at the broad, strategic level being addressed in the Audit as it is at a project level.
Recent commentary and reviews of the infrastructure sector have questioned the quality of project selection processes.8 Infrastructure Australia shares these concerns. As part of its own project assessment processes, the organisation encourages project proponents to clearly articulate what a project is aiming to achieve, and to consider what other options may exist to address that aim.
The Audit has examined the strategies, plans, goals and objectives of governments, industry and non government bodies with the aim of shedding light on what various parties believe to be important or are aiming to achieve.
8. See for example Productivity Commission (2014a)
Australian Infrastructure Audit Report 17
In the main, the statements made by these parties represent ‘higher order’ aims concerning the future of the nation or a state/territory. The statements are not specific views about infrastructure in general, much less about specific projects. Rather, they are statements of the ‘purpose’ to which public policy, not just infrastructure decision making, is directed. Analysis of the statements is set out in an associated report: National Aspirations, Goals and Objectives: Australian Infrastructure Audit Background Paper.9
What stands out from the analysis is that, although the precise formulation of words may vary, all governments and most organisations are aiming to maintain and, if possible, improve Australians’ ‘quality of life’. In summary, they are looking to pursue the following broad aspirations:
■ growth of the Australian economy;
■ promotion of social equity and inclusion; and
■ acting in a manner that is environmentally sustainable.10
It follows that infrastructure policy and decision making at all levels should be aimed at supporting these shared aspirations. Although pressures may emerge that challenge Australians’ quality of life, the task across the four infrastructure sectors is to ensure that decisions taken now and in the foreseeable future maximise the prospects for maintaining and enhancing the high quality of life enjoyed by most Australians today.
Auditfindings1. Australians expect their infrastructure
networks to support a high quality, first world standard of living. They expect infrastructure to improve their quality of life in the future, notwithstanding significant population growth and major economic, social and environmental change.
2. There are grounds for concern that Australia’s infrastructure networks and the systems under which they are managed are not meeting these expectations.
3. Infrastructure exists to provide services. The focus of governments and the private sector must be on the quality of infrastructure services, and their cost to users and the community at large.
4. Inadequate attention is being given to the level of service Australians need and expect from their infrastructure, how much different service levels cost, and how they will be paid for. In some sectors, there is insufficient public data and information to support informed public discussion about these questions.
29. Infrastructure Australia (2015a) 10. A number of jurisdictional strategies and plans also recognised that, in order to achieve those aspirations, standards of governance will need to be improved.
18 Australian Infrastructure Audit Report
2.2 MajordriversandinfluencesThe demand for infrastructure, and how we use it in our pursuit of our aspirations, will be significantly influenced by a range of global and national factors.
In preparing the Australian Infrastructure Plan, we need to consider these factors, and how they will shape our society and drive future domestic and global economic activity.
We will have little or no control over some of the changes resulting from these factors, but by identifying and understanding them we will be in a better position to develop a Plan that:
■ responds to future opportunities;
■ anticipates future challenges; and
■ helps achieve our national aspirations.
In addition, some potentially transformational changes may occur over the next 15 years and beyond. These include ongoing technological evolution, and the increasing significance of retirees in the Australian economy.
2.2.1 Global economyThe global economy has grown significantly over the past decade, with output more than doubling from US$30 trillion to US$74 trillion between 2000 and 2013.
Growth in Australia’s GDP has been consistently above three per cent per annum since 1993, except during the Global Financial Crisis, when it dipped to 1.5 per cent.11 Major world economies, excluding China, have been projected to return around 2.8 per cent average GDP growth rate by 2014–15.
Beyond 2019, global economic growth is expected to taper off to around three per cent per year through to 2031.12 China’s GDP growth is expected to stabilise in the near term to around eight per cent per year, before slowly declining to around six per cent per year by 2031.
These changes are the result of profound shifts in global economies, according to a recent study prepared for the Business Council of Australia (BCA).13 The factors driving these changes include:
■ technological change and digitisation;
■ changing demographics;
■ rapid economic growth and more competition from emerging economies; and
■ reconfiguration of value chains and the global market.
The BCA study reports that technology will penetrate into every aspect of business, including those of our overseas competitors. This will require domestic businesses, even those that do not trade globally, to compete with businesses in other countries. An example of this trend is online retail sales, which now represent 6.9 per cent of retail sales and grew by nine per cent in 2014.14
A common trend in many developed countries is the increasing proportion of the population over 65, and the peaking of the employment participation rate for people over 15 years of age. This will place greater demand on social services while diminishing the proportion of the working population. As a result, government expenditures will need to increase while income tax revenues decline.
Global growth is broadly projected to continue at two distinct speeds, with emerging economies growing at twice the pace of advanced economies. Many high-growth emerging economies will increasingly become direct competitors to developed economies, including Australia. More rapid and concentrated urbanisation in these emerging economies will further enhance their competitive advantages.
The BCA study predicts that the reconfiguration of ‘value chains’ and the global labour market will have profound implications for economies across the world. Competitiveness at national and enterprise levels will be defined by local skills and capabilities, as technology and improved transport allow specialised products and services to be produced and exported at every level in the value chain.
Increasingly, Australian firms will be able to compete internationally at all stages of the production cycle. Firms will need to become competitive at a global level to retain domestic market share. As a result of both international competition and global opportunities, our export-related infrastructure, such as freight transport, will need to become more efficient.
2.2.2 Domestic economyDomestic growth has been driven by numerous large-scale resource projects, particularly those supplying raw materials and energy to China.
Investment in physical capital grew from $155 billion to $295 billion between 2003 and 2013, due mainly to investments in large engineering-driven projects.15
Australia’s growth to 2031 is expected to be less influenced by China’s energy and resource
11. ACIL Allen Consulting (2014a) 12. ACIL Allen Consulting (2014a) 13. Business Council of Australia (2014) 14. National Australia Bank (2015) 15. ACIL Allen Consulting (2014a), p. 37
Australian Infrastructure Audit Report 19
needs, and relatively more affected by wider global economic trends. For our economy to be more resilient, we will need to increase our competitiveness in factors over which we have some control, such as our productivity.
The Australian economy is projected to grow at around three per cent per year over this period.16 If we are to achieve or exceed this rate of growth, Australia will need to become more productive, exploit its natural advantages and continue to transition away from sectors where we no longer hold a competitive advantage.17
These trends will require future infrastructure investment arising from the Plan to be focused at the intersection of our natural advantages and future global growth industries.
Industry sectors offering Australia the most promise in the future include: gas, tourism, agriculture, health, international education, and wealth management.
While the list above is not exhaustive, it provides an indication of the economic sectors that should be taken into account in developing the Plan.
2.2.3 Land use and settlement patternsAcross Australia, metropolitan strategies are advocating for more sustainable growth of our cities to avoid uncontrolled and inefficient urban sprawl.
Greenfield development in ‘peri urban’ or fringe areas has assisted in improving the supply of housing, but at the expense of increased commuting times for workers. State and local governments have limited capacity to continue to provide new transport and other infrastructure to service these areas. The alternatives of increasing residential density close to employment centres, and improving public transport, provide potential solutions to these problems, but will require ongoing changes in public policy and community attitudes to urban development. In all of Australia’s major cities, it is clear that the focus of government plans is shifting more towards urban renewal to accommodate growth. Cities are revitalising entire precincts for a new generation of citizens who favour apartment living close to work, with good transport connections and a high level of urban amenity.
The efficiency benefits of integrating land use and transport can be realised in these urban renewal precincts. Higher density development focused around new public transport infrastructure can optimise public transport patronage, encourage active transport and reduce road congestion as a consequence.
The higher densities and greater housing supply achieved through urban renewal could help to address the undersupply of housing in some Australian cities. Supporting redevelopment with modern infrastructure will be a critical factor in the development of our cities.
Equally, growth in outer urban areas and regional centres will need to be underpinned by investment in infrastructure. Some of these areas face ‘catch up’ issues, as they struggle with infrastructure backlogs from the past.
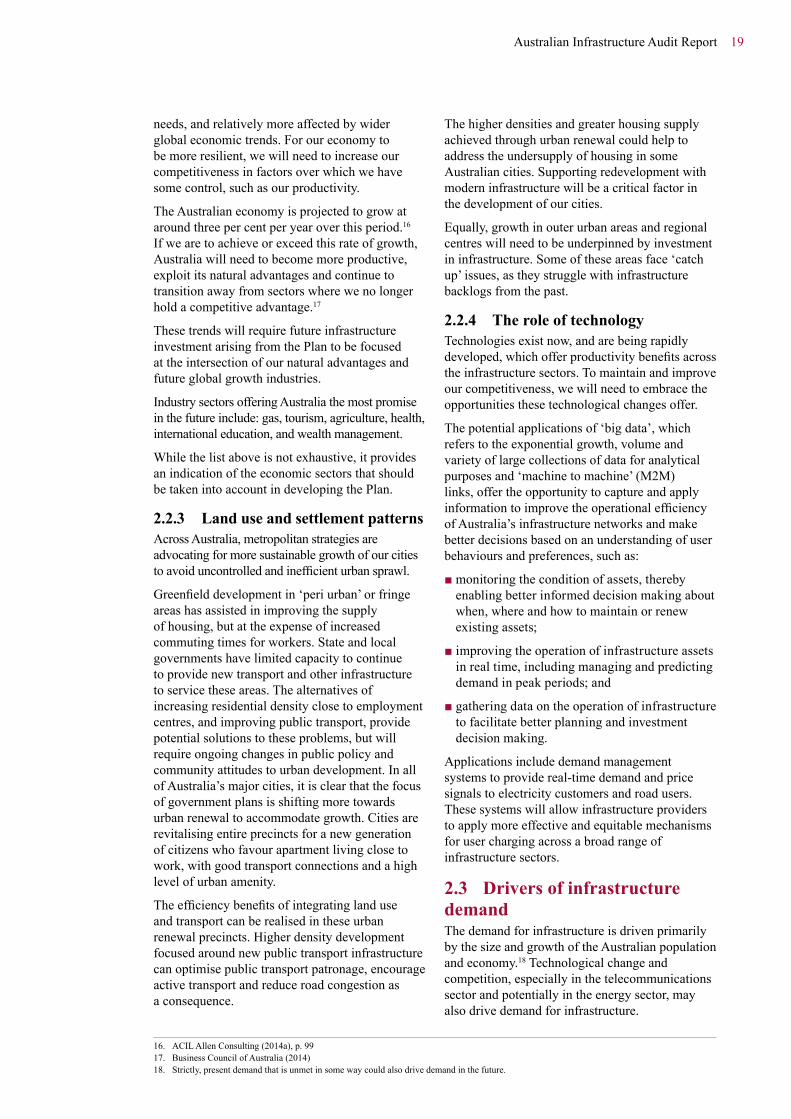
2.2.4 The role of technologyTechnologies exist now, and are being rapidly developed, which offer productivity benefits across the infrastructure sectors. To maintain and improve our competitiveness, we will need to embrace the opportunities these technological changes offer.
The potential applications of ‘big data’, which refers to the exponential growth, volume and variety of large collections of data for analytical purposes and ‘machine to machine’ (M2M) links, offer the opportunity to capture and apply information to improve the operational efficiency of Australia’s infrastructure networks and make better decisions based on an understanding of user behaviours and preferences, such as:
■ monitoring the condition of assets, thereby enabling better informed decision making about when, where and how to maintain or renew existing assets;
■ improving the operation of infrastructure assets in real time, including managing and predicting demand in peak periods; and
■ gathering data on the operation of infrastructure to facilitate better planning and investment decision making.
Applications include demand management systems to provide real-time demand and price signals to electricity customers and road users. These systems will allow infrastructure providers to apply more effective and equitable mechanisms for user charging across a broad range of infrastructure sectors.
2.3 Drivers of infrastructure demand The demand for infrastructure is driven primarily by the size and growth of the Australian population and economy.18 Technological change and competition, especially in the telecommunications sector and potentially in the energy sector, may also drive demand for infrastructure.
16. ACIL Allen Consulting (2014a), p. 99 17. Business Council of Australia (2014) 18. Strictly, present demand that is unmet in some way could also drive demand in the future.

20 Australian Infrastructure Audit Report
Other factors such as changes in the per capita use of infrastructure also affect the levels of demand for infrastructure services. For example, per capita rates of water consumption have fallen over the last decade. In Australia and in other developed countries, there is growing evidence that per capita usage of motor vehicles is stable or falling. Changes in specific sectors, e.g. the comparative cost of different energy technologies, also play a role.
Nevertheless, the dominant drivers of demand are population and economic activity. The following sections address these matters.
2.3.1 PopulationgrowthAustralia’s population in June 2011 was estimated at 22.3 million. In the three years to June 2014, the population grew by more than a million to an estimated 23.5 million.19
Australia’s population is projected to grow significantly over coming decades. As shown in Figure 2, on medium level projections prepared by the Australian Bureau of Statistics (ABS), Australia’s population is expected to continue to grow from 22.3 million in 2011 to 30.5 million in 2031, an increase of 8.2 million, or 36.5 per cent.20 Most state and territory governments take the ABS
projections as the starting point for preparing their own projections, which then inform jurisdictions’ strategies and plans.
The population projections used in the Audit and in the 2015 Intergenerational Report are similar. In the 2015 Intergenerational Report, Australia’s population is projected to grow to 32.0 million in 2034–35. This is only 0.1 million (0.3 per cent) more than the equivalent ABS medium level projection – the basis for the Audit’s projections – for the same year.21
In line with projections for other countries,22 the proportion of Australia’s population living in the nation’s capital cities is expected to grow.
The capital cities are projected to increase their share of the nation’s population from around 66.0 per cent in 2011 to 69.3 per cent in 2031. In total, the population of the capital cities is projected to grow over this period by 6.4 million, from 14.7 million in 2011 to 21.1 million in 2031.
Most of this growth (91.8 per cent) is projected to occur in the four largest capitals – Sydney, Melbourne, Brisbane and Perth.23 In total, the four cities are expected to grow by 5.9 million people or 46 per cent.
Figure 2: National population projections – 2011 to 2061 (million)
45
40
35
30
25
20
15
10
5
0
Eight Capital Cities – Total Australia – Total
15.7 million people
73.4% of Australian Total
69.3% of Australian Total
66.0% of Australian Total
2011 2017 2023 2029 2035 2041 2047 2053 2059
6.4 million people
mill
ion
Source: Infrastructure Australia (2015b), p. 21
19. Australian Bureau of Statistics (2014a). The population of Australian had grown to an estimated 23.6 million by the end of September 2014. 20. Australian Bureau of Statistics (2013c) 21. Australian Government (2015b), p. 99. The 2015 Intergenerational Report does not provide a population projection for 2031. Instead, it provides a projection for 2034–35. However, as the ABS provides annual projections of Australia’s population to 2101 (at June 30 each year), it is possible to calculate an equivalent ABS projection for 2034–35. The ABS projections for June 2034 and June 2035 have been averaged to arrive at a 2034–35 projection (31.9 million). 22. United Nations Department of Economic and Social Affairs, Population Division (2014), p.1. The report observes, ‘Globally, more people live in urban areas than in rural areas, with 54 per cent of the world’s population residing in urban areas in 2014. In 1950, 30 per cent of the world’s population was urban, and by 2050, 66 per cent of the world’s population is projected to be urban.’ 23. Although it is yet to update its official projections, the Western Australian Government has suggested that the ABS projections for Perth are higher than it considers likely.

Australian Infrastructure Audit Report 21
Figure 3: Projected population of Australian capital cities – 2011 to 2061 (million)
10
9
8
7
6
5
4
3
2
20612011 2031Sy
dney
Mel
bour
ne
Bri
sban
e
Ade
laid
e
Pert
h
Hob
art
Can
berr
a
Dar
win
1
0
mill
ion
Source: Infrastructure Australia analysis of Australian Bureau of Statistics (2013c) data24
This does not include population growth in urban areas immediately outside these cities such as the Hunter and Illawarra regions in NSW, the Gold Coast and Sunshine Coast in Queensland, and Geelong in Victoria. The population of these cities is projected to grow from two million in 2011 to 2.5 million in 2031. When combined, the population of these four greater metropolitan areas is projected to be 21 million in 2031, over two thirds of Australia’s total population.25
This growth in population is likely to bring economic benefits. Research suggests that larger cities tend to have higher average per capita incomes than smaller cities.26 This is a result of agglomeration benefits, i.e. the tendency for firms in an industry to cluster in particular locations, which facilitates relatively easier exchange of innovative ideas, supplies and labour.
The larger capital cities have accommodated periods of strong population growth in the past, when per capita incomes were lower than they are now. This provides some cause for confidence that future growth can also be managed. That said, the anticipated scale of growth will test each city’s infrastructure networks.
The other capital cities – Adelaide, Canberra, Hobart and Darwin − are projected to grow in total by slightly more than 0.5 million people or about 26.7 per cent. In percentage terms, Hobart and Adelaide are projected to grow the slowest of the capital cities. Darwin and Canberra are expected to grow more quickly, although off a somewhat smaller base population in 2011 compared to the larger capitals.
On the whole, the challenge of meeting the infrastructure needs of those cities is likely to be less significant than for the four larger cities. Indeed, it is worth considering what steps could be taken to foster growth in those cities and in regional centres so as to ease the pressure on our larger cities.
The population of Australia’s regional areas is also projected to grow, from around 5.6 million in 2011 to 6.8 million in 2031, an increase of around 22 per cent.
Figure 3 illustrates the ABS medium level projection of population growth in Australia’s capital cities. It needs to be emphasised that this is a projection − decisions by governments and others may lead to a different outcome. For example, recent interest in fostering development in Australia’s north could see Darwin’s population grow faster than current projections suggest.
24. The projections presented in the figure use the ABS’s Series B (medium level) growth assumptions for the relevant Greater Capital City Statistical Area. 25. ACIL Allen Consulting (2014a). Projections prepared by the three state governments suggest that the population of these areas would increase to 2.7 million persons by 2031. The growth projections prepared by the state governments are: Lower Hunter (108,000 persons); Illawarra (65,000 persons); Geelong (95,000 persons); Gold Coast (308,000 persons); and Sunshine Coast (167,000 persons). 26. Glaeser, E. (2011)
22 Australian Infrastructure Audit Report
Alternatively, increasing the population of Australia’s regional areas could assist in moderating population growth in the largest capital cities.
Infrastructure decisions made over the next 15 years will also be influenced by evolving projections of population growth beyond 2031. The ABS medium level projections suggest that, over the period to 2061, Australia’s population could grow to 41.5 million, with the combined capital cities’ population growing to 30.5 million. The projected growth in the
population of the capital cities between 2011 and 2061 (15.7 million) is larger than the combined population of all the capital cities in 2011.27
On these population projections, the larger cities will each need to provide for the development of around 500,000 to 700,000 dwellings over the next 15 to 20 years, and potentially over 1.5 million dwellings each over the next 40 to 50 years. Where and how that development will occur will be profoundly affected by the cities’ existing infrastructure and the infrastructure decisions taken over the next five to 15 years.
Auditfindings5. Future demand for infrastructure will be directly affected by growth in population, broader
developments in the local and global economy, technological change, the need for environmental sustainability and consumer preferences.
6. Population growth will drive a significant rise in the demand for infrastructure services. On medium level projections, Australia’s population is projected to grow from 22.3 million in 2011 to 30.5 million in 2031 − an increase of 8.2 million or 36.5 per cent.
7. Almost three-quarters of this growth (72.0 per cent) is projected to be in the four largest capitals – Sydney, Melbourne, Brisbane and Perth. In total, these four cities are projected to grow by 5.9 million people, or 46 per cent, to 18.6 million in 2031. This growth will impose additional demands on urban infrastructure already subject to high levels of demand.
8. The other capital cities – Adelaide, Canberra, Hobart and Darwin − are projected to grow in total by slightly more than 0.5 million people or 26.7 per cent. Given this, it is worth considering what steps could be taken to foster greater long-term growth in those cities, which may moderate the consequential infrastructure challenges in the larger cities.
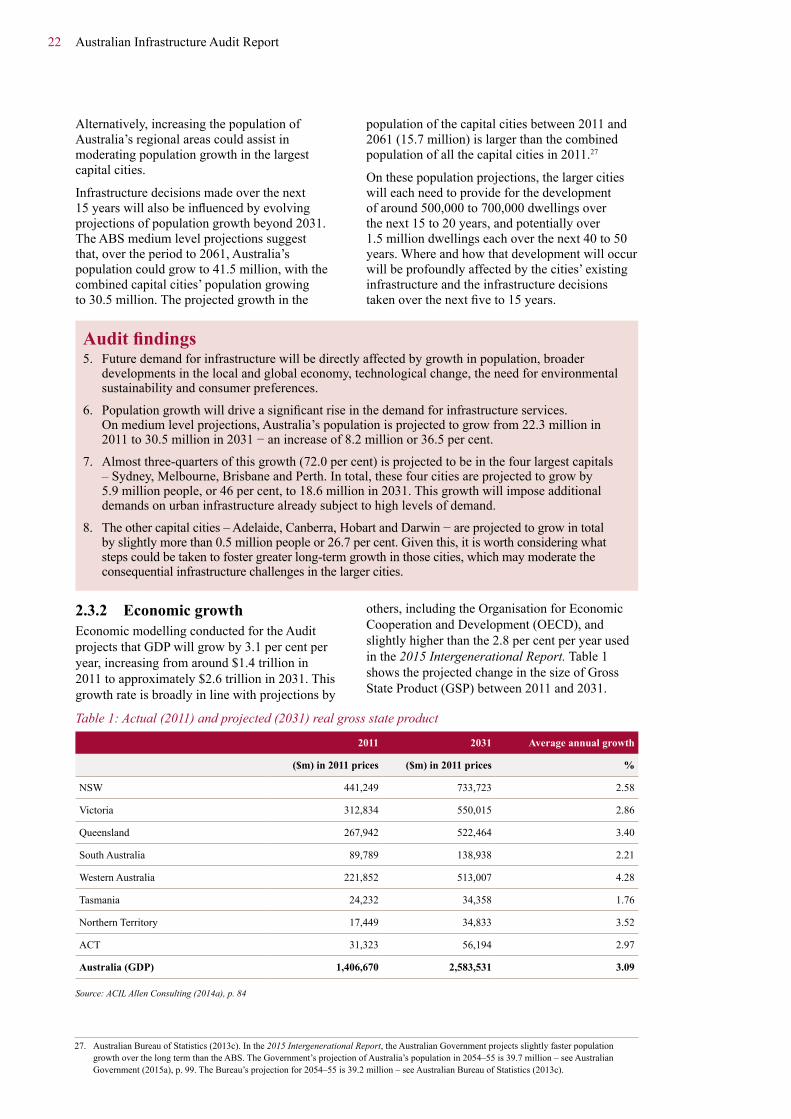
2.3.2 EconomicgrowthEconomic modelling conducted for the Audit projects that GDP will grow by 3.1 per cent per year, increasing from around $1.4 trillion in 2011 to approximately $2.6 trillion in 2031. This growth rate is broadly in line with projections by
others, including the Organisation for Economic Cooperation and Development (OECD), and slightly higher than the 2.8 per cent per year used in the 2015 Intergenerational Report. Table 1 shows the projected change in the size of Gross State Product (GSP) between 2011 and 2031.
Table 1: Actual (2011) and projected (2031) real gross state product
2011 2031 Averageannualgrowth
($m) in 2011 prices ($m) in 2011 prices %
NSW 441,249 733,723 2.58
Victoria 312,834 550,015 2.86
Queensland 267,942 522,464 3.40
South Australia 89,789 138,938 2.21
Western Australia 221,852 513,007 4.28
Tasmania 24,232 34,358 1.76
Northern Territory 17,449 34,833 3.52
ACT 31,323 56,194 2.97
Australia (GDP) 1,406,670 2,583,531 3.09
Source: ACIL Allen Consulting (2014a), p. 84
27. Australian Bureau of Statistics (2013c). In the 2015 Intergenerational Report, the Australian Government projects slightly faster population growth over the long term than the ABS. The Government’s projection of Australia’s population in 2054–55 is 39.7 million – see Australian Government (2015a), p. 99. The Bureau’s projection for 2054–55 is 39.2 million – see Australian Bureau of Statistics (2013c).
Australian Infrastructure Audit Report 23
The value-add (economy-wide spending) attributable to infrastructure services is projected to grow roughly proportionate with economic growth to 2031, from $187 billion in 2011 to $377 billion in 2031. Note that this is an estimate of the annual value-add from infrastructure services in those years.
Economic analysis commissioned for the Audit suggests there will be differences in the rate at which the infrastructure sectors grow. Telecommunications, airports, ports, urban transport and gas pipelines are expected to grow faster than GDP. The water, petroleum, electricity and non-urban road and rail sectors will still grow appreciably, but at a rate slower than growth in GDP.28
The nation’s economic growth will be affected by both the total size and efficient allocation of investment in economic infrastructure.
Governments and other organisations have identified the benefits of encouraging industries in which Australia has a competitive advantage. For example, the Compete to Prosper: Improving Australia’s global competitiveness report commissioned by the Business Council of Australia argues Australia has a comparative advantage in mining, agriculture, education, tourism, food manufacturing, pockets of advanced manufacturing and selected niches in global supply chains.29 Infrastructure decisions can support industries where such a competitive advantage has been identified.
Auditfindings9. The value-add (economy-wide spending)
attributable to infrastructure services was estimated to be 13.3 per cent of GDP in 2011. Over 70 per cent of this was attributable to transport. The value-add attributable to infrastructure services is projected to grow roughly proportionate with the economy to 2031.
10. The infrastructure sectors projected to grow faster than GDP are transport, ports, telecommunications, gas pipelines and airports. The sectors projected to grow slower than GDP are water, petroleum, electricity, non-urban roads and non-urban rail.
2.3.3 ProductivityInfrastructure can support growth in the economy through:
■ the formation of new capital (growth is maximised if the projects are themselves efficient); and
■ improving productivity in the economy.
Infrastructure can increase the overall productivity of an economy if it enables individuals, firms and industries to operate more efficiently. Similarly, improvements in the efficiency of infrastructure services can lead to productivity gains for those businesses and individuals who utilise the services. This occurs because of lower costs for the infrastructure they use as an input to production, or because the improvements in infrastructure allow businesses to produce their output more efficiently.
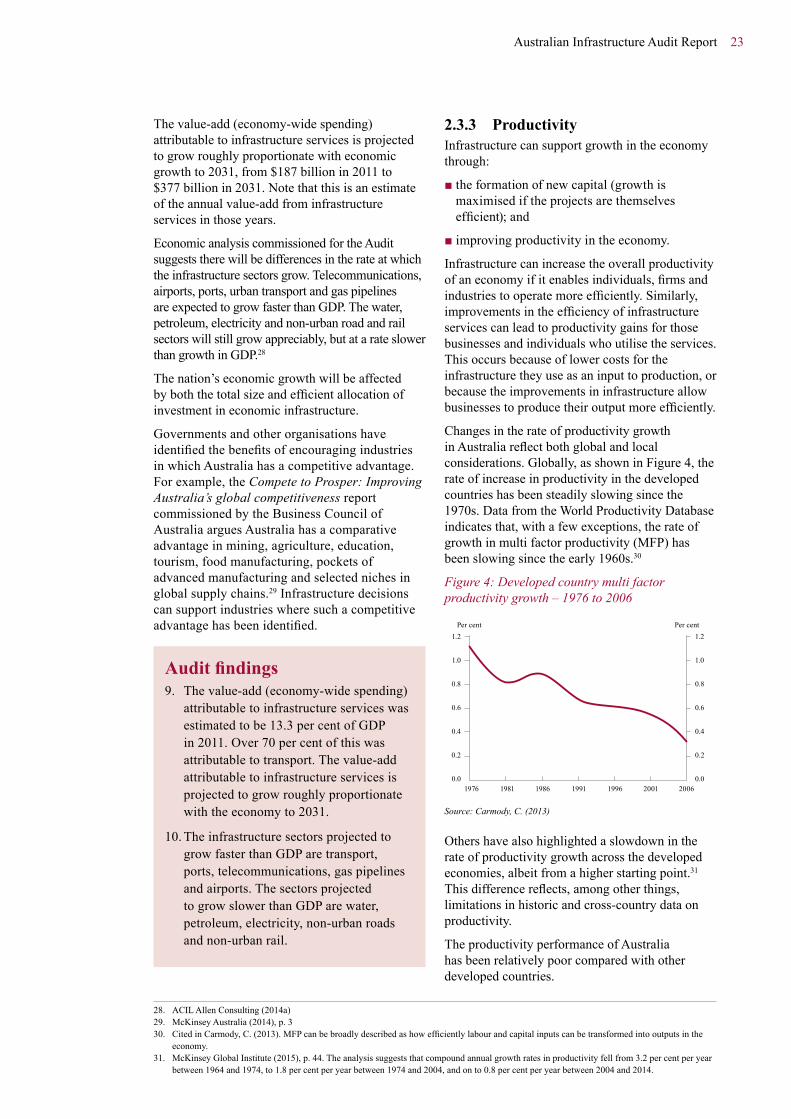
Changes in the rate of productivity growth in Australia reflect both global and local considerations. Globally, as shown in Figure 4, the rate of increase in productivity in the developed countries has been steadily slowing since the 1970s. Data from the World Productivity Database indicates that, with a few exceptions, the rate of growth in multi factor productivity (MFP) has been slowing since the early 1960s.30
Figure 4: Developed country multi factor productivity growth – 1976 to 2006
1.2
1.0
0.8
0.6
0.4
0.2
0.0
1.2
1.0
0.8
0.6
0.4
0.2
0.0
Per cent Per cent
1976 1981 1986 1991 1996 2001 2006
Source: Carmody, C. (2013)
Others have also highlighted a slowdown in the rate of productivity growth across the developed economies, albeit from a higher starting point.31 This difference reflects, among other things, limitations in historic and cross-country data on productivity.
The productivity performance of Australia has been relatively poor compared with other developed countries.
28. ACIL Allen Consulting (2014a) 29. McKinsey Australia (2014), p. 3 30. Cited in Carmody, C. (2013). MFP can be broadly described as how efficiently labour and capital inputs can be transformed into outputs in the economy. 31. McKinsey Global Institute (2015), p. 44. The analysis suggests that compound annual growth rates in productivity fell from 3.2 per cent per year between 1964 and 1974, to 1.8 per cent per year between 1974 and 2004, and on to 0.8 per cent per year between 2004 and 2014.
24 Australian Infrastructure Audit Report
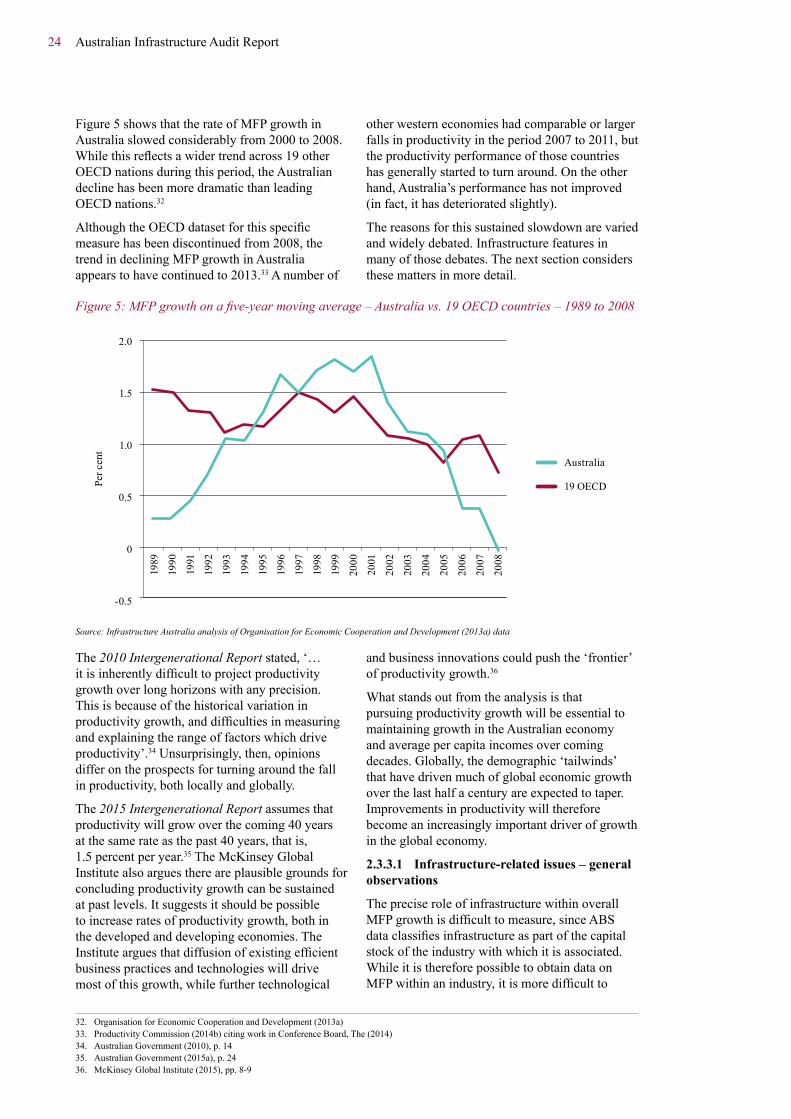
Figure 5 shows that the rate of MFP growth in Australia slowed considerably from 2000 to 2008. While this reflects a wider trend across 19 other OECD nations during this period, the Australian decline has been more dramatic than leading OECD nations.32
Although the OECD dataset for this specific measure has been discontinued from 2008, the trend in declining MFP growth in Australia appears to have continued to 2013.33 A number of
other western economies had comparable or larger falls in productivity in the period 2007 to 2011, but the productivity performance of those countries has generally started to turn around. On the other hand, Australia’s performance has not improved (in fact, it has deteriorated slightly).
The reasons for this sustained slowdown are varied and widely debated. Infrastructure features in many of those debates. The next section considers these matters in more detail.
Figure 5: MFP growth on a five-year moving average – Australia vs. 19 OECD countries – 1989 to 2008
1989
1990
1991
1992
1993
1994
1995
1996
1997
1998
1999
2000
2001
2002
2003
2004
2005
2006
2007
2008
2.0
1.5
1.0
0.5
0
-0.5
Per c
ent
Australia
19 OECD
Source: Infrastructure Australia analysis of Organisation for Economic Cooperation and Development (2013a) data
The 2010 Intergenerational Report stated, ‘… it is inherently difficult to project productivity growth over long horizons with any precision. This is because of the historical variation in productivity growth, and difficulties in measuring and explaining the range of factors which drive productivity’.34 Unsurprisingly, then, opinions differ on the prospects for turning around the fall in productivity, both locally and globally.
The 2015 Intergenerational Report assumes that productivity will grow over the coming 40 years at the same rate as the past 40 years, that is, 1.5 percent per year.35 The McKinsey Global Institute also argues there are plausible grounds for concluding productivity growth can be sustained at past levels. It suggests it should be possible to increase rates of productivity growth, both in the developed and developing economies. The Institute argues that diffusion of existing efficient business practices and technologies will drive most of this growth, while further technological
and business innovations could push the ‘frontier’ of productivity growth.36
What stands out from the analysis is that pursuing productivity growth will be essential to maintaining growth in the Australian economy and average per capita incomes over coming decades. Globally, the demographic ‘tailwinds’ that have driven much of global economic growth over the last half a century are expected to taper. Improvements in productivity will therefore become an increasingly important driver of growth in the global economy.
2.3.3.1 Infrastructure-related issues – general observations
The precise role of infrastructure within overall MFP growth is difficult to measure, since ABS data classifies infrastructure as part of the capital stock of the industry with which it is associated. While it is therefore possible to obtain data on MFP within an industry, it is more difficult to
32. Organisation for Economic Cooperation and Development (2013a) 33. Productivity Commission (2014b) citing work in Conference Board, The (2014) 34. Australian Government (2010), p. 14 35. Australian Government (2015a), p. 24 36. McKinsey Global Institute (2015), pp. 8-9

Australian Infrastructure Audit Report 25
obtain an indication of the broader economy-wide productivity implications of changes in the infrastructure sectors.37
Figure 6 uses national accounts data from the ABS to show the infrastructure sectors’ share of the national economy since 1985–86.38 This figure shows that the sectors’ overall share of GDP
has held fairly steady over that period, between 9.9 and 11.0 per cent.
The transport-related industries’ share of GDP has been relatively steady over the period. Slight growth in the share of the information, media and telecommunications industries has been offset by the declining share of the utilities industry.
Figure 6: Australian infrastructure industry gross value-add as a percentage of GDP – 1994–95 to 2013–14
12
10
8
6
4
2
0
Total of all sectors
Electricity
Water and wastewater servicesGas
Transport, postaland warehousing
Information, media and telecommunications
1986
1987
1988
1989
1990
1991
1992
1993
1994
1995
1996
1997
1998
1999
2000
2001
2002
2003
2004
2005
2006
2007
2008
2009
2010
2011
2012
2013
2014
Per c
ent o
f GD
P
Source: Infrastructure Australia analysis of Australian Bureau of Statistics (2014d) data
These trends reflect:
■ changes in the quantity and quality of infrastructure services consumed by households and businesses, e.g. they are spending more on telecommunications as new and better services are provided, and using more energy efficient products; and
■ changes in productivity within the infrastructure sectors, e.g. sectors such as transport which, overall, have not been able to improve their productivity over the period, and sectors where declining productivity has offset savings from lower overall consumption of the underlying service − electricity is an example (see the discussion further below).
The available data does not readily allow the relative contribution of these two factors to be isolated. Nevertheless, it would be surprising if there was not scope for increasing efficiencies in the infrastructure sectors to drive MFP growth across the broader economy, through:
■ the reallocation of scarce resources to the most productive sectors and businesses (allocative efficiency);
■ better use of existing assets, and improvements in the use of the factors of production that reduce the cost of providing infrastructure services (productive efficiency); and
■ in some cases, enabling firms to innovate (so-called dynamic efficiency).39
Decreasing the share of infrastructure services as a proportion of GDP, e.g. through improved freight transport and reduced capital expenditure and maintenance costs in electricity and water assets, will reduce the cost inputs of infrastructure services to other industries.
Figure 7 compares the MFP performance of Australian infrastructure-related industries with that of the Australian market-based industries as a whole (including the three infrastructure-related industries). Closer analysis of these trends is provided below, however, the following broad trends are apparent:
■ productivity has fallen appreciably in the broad ‘utilities industry’. As noted below, this is partly due to the ‘lumpy’ nature of both generation and network investments in the energy sector, and responses to the ‘millennium drought’ in the water sector;
37. Australian Bureau of Statistics (2014d) 38. The national accounts data refers to ‘industries’. The gross value add measure does not take account of certain factors included in the Direct Economic Contribution measure used elsewhere in the Audit. Nevertheless, it provides useful base data relevant to the Audit. 39. Carmody, C. (2013)
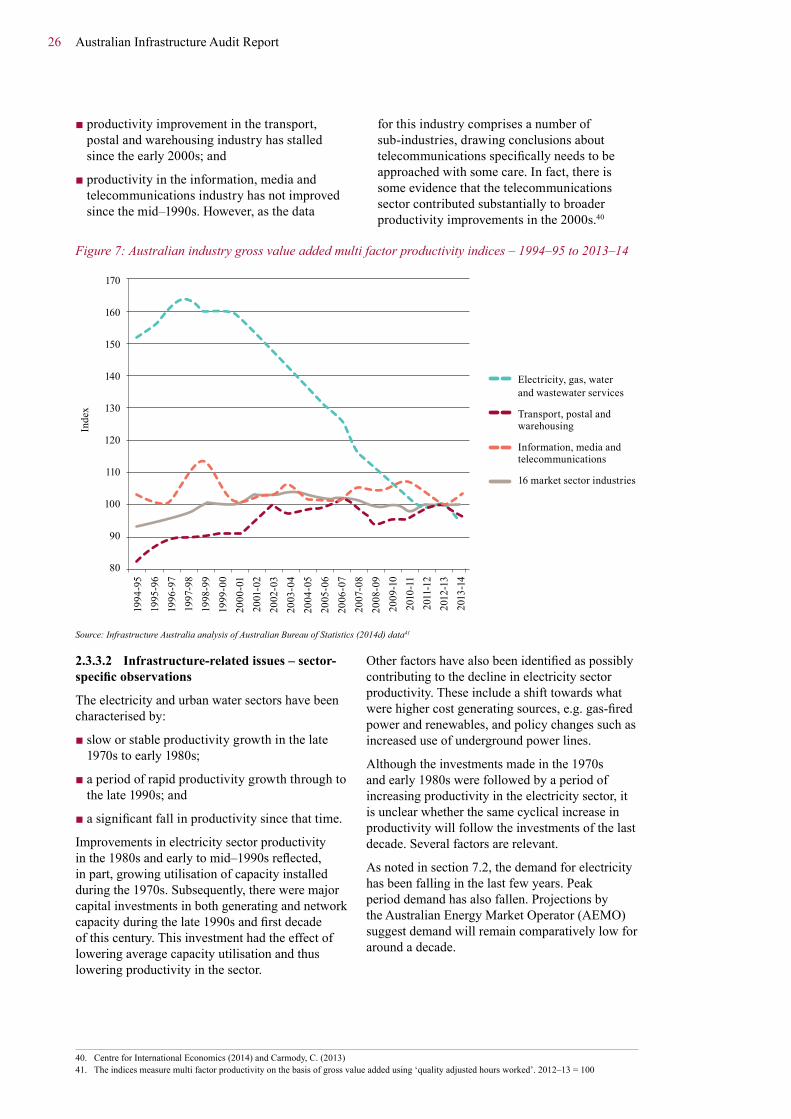
26 Australian Infrastructure Audit Report
■ productivity improvement in the transport, postal and warehousing industry has stalled since the early 2000s; and
■ productivity in the information, media and telecommunications industry has not improved since the mid–1990s. However, as the data
for this industry comprises a number of sub-industries, drawing conclusions about telecommunications specifically needs to be approached with some care. In fact, there is some evidence that the telecommunications sector contributed substantially to broader productivity improvements in the 2000s.40
Figure 7: Australian industry gross value added multi factor productivity indices – 1994–95 to 2013–14
170
160
150
140
130
120
110
100
90
80
1994
-95
1995
-96
1996
-97
1997
-98
1998
-99
1999
-00
2000
-01
2001
-02
2002
-03
2003
-04
2004
-05
2005
-06
2006
-07
2007
-08
2008
-09
2009
-10
2010
-11
2011
-12
2012
-13
2013
-14
Electricity, gas, waterand wastewater services
Transport, postal and warehousing
Information, media and telecommunications
16 market sector industries
Inde
x
Source: Infrastructure Australia analysis of Australian Bureau of Statistics (2014d) data41
2.3.3.2 Infrastructure-related issues – sector-specificobservations
The electricity and urban water sectors have been characterised by:
■ slow or stable productivity growth in the late 1970s to early 1980s;
■ a period of rapid productivity growth through to the late 1990s; and
■ a significant fall in productivity since that time.
Improvements in electricity sector productivity in the 1980s and early to mid–1990s reflected, in part, growing utilisation of capacity installed during the 1970s. Subsequently, there were major capital investments in both generating and network capacity during the late 1990s and first decade of this century. This investment had the effect of lowering average capacity utilisation and thus lowering productivity in the sector.
Other factors have also been identified as possibly contributing to the decline in electricity sector productivity. These include a shift towards what were higher cost generating sources, e.g. gas-fired power and renewables, and policy changes such as increased use of underground power lines.
Although the investments made in the 1970s and early 1980s were followed by a period of increasing productivity in the electricity sector, it is unclear whether the same cyclical increase in productivity will follow the investments of the last decade. Several factors are relevant.
As noted in section 7.2, the demand for electricity has been falling in the last few years. Peak period demand has also fallen. Projections by the Australian Energy Market Operator (AEMO) suggest demand will remain comparatively low for around a decade.
40. Centre for International Economics (2014) and Carmody, C. (2013) 41. The indices measure multi factor productivity on the basis of gross value added using ‘quality adjusted hours worked’. 2012–13 = 100

Australian Infrastructure Audit Report 27
Moreover, there is broad recognition that regulatory arrangements encouraged over-investment in network infrastructure over the last decade. Changes have been made in the regulatory environment to address the causes of over-investment, however two observations are worth making:
■ past investment still needs to be paid for, and will therefore continue to have impacts on sector productivity; and
■ it is too early to state confidently whether the recent regulatory changes will have the desired effect of encouraging more focused investment decisions in network infrastructure.42
Consistent and reliable data in the gas sector is more limited than in the electricity sector. The available data suggests that productivity in the gas distribution and retail sector has improved fairly consistently since the mid–1970s, although this conclusion should be treated with some caution. As in the electricity sector, a more recent fall in sector productivity probably reflects the level of capital investment over recent years.43
Two broad factors relevant to productivity in the urban water sector stand out. Firstly, per capita water consumption has fallen following the millennium drought of the early 2000s, with demand management measures a contributing factor. As a result, measured output is lower for a given level of capital and labour inputs.
The second factor, investment in major supply augmentation in response to the drought, has longer term implications for the sector’s productivity. Overall, sector input costs will not need to rise for some time. While this would ordinarily improve productivity in the sector, to the extent that the consumption of water remains low compared to historic levels, the measurement of productivity in the sector will be affected. However, as noted earlier, Australia’s cities are expected to grow rapidly. The growth in demand associated with that population growth will raise sector productivity.
Analysis by the Bureau of Infrastructure, Transport and Regional Economics (BITRE) found that productivity in the road freight sector increased significantly between 1971 and 2007, primarily as a result of the introduction of six-axle articulated trucks and later B-doubles. BITRE attributed the growth in productivity to the fact that loads on six-axle articulated trucks loads were typically 30 per cent higher than on the five-axle articulated trucks
they replaced and that, in turn, average loads on B doubles were around 50 per cent higher again.
BITRE expects that subsequent increases in vehicle payloads using larger vehicles such as B-triples and AB-triples are expected to be more modest than those achieved following the introduction of six axle articulated trucks and B-doubles. BITRE concludes:
… in the absence of further productivity enhancing reforms future heavy vehicle productivity growth is likely to be relatively low. Even with increased uptake of high productivity vehicles under PBS [Performance Based Standards] and the Intelligent Access Program (IAP), future heavy vehicle productivity growth is likely to be much lower than recent experience.44
Views on the productivity of the telecommunications sector, and the broader economic benefits of telecommunications are positive. In general, the sector is viewed as being highly productive, with the volume of data and other telecommunications services growing dramatically, and unit rates of supply having dropped appreciably.
However, there are other views. In line with the concept of diminishing returns, comparatively recent data suggests that information and communications technology (ICT) is not providing an ongoing contribution to developed country productivity growth. The data indicates that in most OECD countries, the contribution of ICT capital to GDP growth rose between 1985−1994 and 1995−2001 but fell subsequently. Australia appears to be an outlier in this regard: the contribution of ICT capital services to Australian GDP growth increased during the 2000s.45
2.3.3.3 Whattodo?Efficientmanagementofcapacityandinvestmentinnewprojects
As this Audit has discussed, Australia needs to:
■ obtain greater value from the infrastructure we already have, i.e. we need to utilise our existing infrastructure to the best effect; and
■ secure more from our spending on infrastructure, i.e. decisions on new projects and maintenance of existing assets need to be carefully considered. Spending scarce funds on projects that cost more than expected, are ‘gold-plated’, or otherwise fail to meet our needs, imposes a high economic cost.
42. The Australian Energy Regulator’s draft decision in November 2014 on the revenues of NSW and ACT energy businesses was the first under the new National Energy Rules and National Gas Rule. 43. Topp, V. and Kulys, T. (2012), p. 121 44. Bureau of Infrastructure, Transport and Regional Economics (2011), p. xix 45. Carmody, C. (2013). The author argues that the experience of other countries suggests any continuation of this growth over the last decade in Australia cannot be assured.
28 Australian Infrastructure Audit Report
The objective is to raise productivity in the infrastructure sectors (and related sectors such as construction), to achieve the allocative and productive efficiencies referred to earlier. This will then increase infrastructure’s total contribution to improving the nation’s productivity.
Australia’s economic opportunities and productivity challenges were well assessed by the OECD in February 2015, which found that:
Over the past decade, [Australia’s] per capita income surpassed the average of the most advanced OECD countries, helped by high terms of trade and employment rates. However, productivity gains have been weak and the economy faces a period of adjustment in the wake of the mining boom…Shortfalls in transport infrastructure are being addressed by ambitious investment plans; however, ensuring cost-efficiency will require efficient design and monitoring. … Better productivity performance could be achieved by further improving the operating environment for the private sector, most importantly in infrastructure, taxation, labour skills and innovation.46
The boxed text below sets out the OECD’s infrastructure-related recommendations in its most recent Going for Growth report on Australia.
OECD Recommended Infrastructure-Related Priorities for Australia (2015)
Enhance capacity and regulation in infrastructure. Addressing infrastructure service shortfalls will help productivity performance and sustainable growth.
Actions taken: Road construction is being expedited as part of wider government plans to improve infrastructure, including federal-government incentives for states to sell assets and use the proceeds for new infrastructure (the Asset Recycling Initiative).
Recommendations: Ensure infrastructure spending delivers value-for-money especially in designing and overseeing construction works and public-private partnerships. Ensure new infrastructure systems integrate environmental concerns through user and congestion charges.
Source: Organisation for Economic Cooperation and Development (2015a)
International evidence highlights the value of making the right project and policy choices.
In 2014, the International Monetary Fund reported analysis which found investment in well-conceived projects increases economic activity, both in the short-term and long-term. However, the critical point is that the investment must be in productive projects, and that the projects themselves must then be executed efficiently.47
A research paper published by the OECD in 2009 reached similar conclusions.48 The paper concludes that the key elements of a framework to encourage growth supporting infrastructure are:
■ a robust decision-making process and improved selection process for investment projects;
■ the introduction of competitive pressures through the reduction of barriers to entry and vertical separation when this is appropriate; and
■ promoting a combination of regulator independence and the application of incentive regulation.
These views were expanded on in the Productivity Commission’s 2014 report on public infrastructure, which observed:
Selecting the right projects is the most important aspect of achieving good outcomes for the community from public infrastructure…
Direct user charges (prices) should be the default option [to pay for infrastructure] because they can provide an incentive for efficient provision and use of infrastructure.49
Auditfindings11. Infrastructure decision making must
place a high priority on productivity growth. This can only be achieved through efficient management of existing infrastructure, rigorous and disciplined evaluation of investment initiatives, and efficient delivery of new projects.
12. International and local reviews show that rigorous project selection is key to boosting economic activity and supporting productivity growth. However, investment in poorly conceived projects can undermine a country’s economic prospects.
46. Organisation for Economic Cooperation and Development (2015a) 47. International Monetary Fund (2014), pp. 76-77 48. Sutherland, D., Araújo, S., Égert, B. and Kozluk, T. (2009), p. 2 49. Productivity Commission (2014a), p. 75 and p. 141

Australian Infrastructure Audit Report 29

30 Australian Infrastructure Audit Report
Current and prospective infrastructure gapsCommentators on Australia’s infrastructure have observed periodically that the nation faces an infrastructure ‘gap’ or ‘shortfall’. Whether there is an infrastructure gap is a central consideration for the Audit. Key questions include:
■ how might an infrastructure gap be assessed or measured?
■ are there gaps in Australia’s infrastructure at present?
■ are current gaps (if any) likely to get worse in future and/or are new gaps likely to emerge, unless action is taken?
■ do we have the institutional settings to deal with current and prospective gaps?
Australia is not alone in considering these questions. In a report published in 2013, the McKinsey Global Institute estimated that:
$57 trillion in infrastructure investment will be required between now and 2030—simply to keep up with projected global GDP growth. This figure includes the infrastructure investment required for transport (road, rail, ports, and airports), power, water, and telecommunications. It is, admittedly, a rough estimate, but its scale is significant—nearly 60 percent more than the $36 trillion spent globally on infrastructure over the past 18 years. The $57 trillion required investment is more than the estimated value of today’s worldwide infrastructure.50
In broad terms, the Audit’s findings are:
■ in several sectors and in different areas around the country, there is already a gap between the level of service required from our infrastructure and what is delivered;
■ in the absence of an increase in infrastructure spending (on new projects and the maintenance of existing assets) and improvements in the way the nation manages its infrastructure, the gap will widen, and will pose significant challenges to Australians’ quality of life;
■ there is too little informed public debate about these matters. In the absence of such a debate, we risk allowing the standard of the nation’s infrastructure to ‘drift’ to a lower quality. If we fail to discuss openly what we realistically expect from the nation’s infrastructure, and how this will be funded and achieved, then our quality of life is likely to be lower; and
■ Australian governments need to develop a means of assessing the existence of infrastructure gaps, which will also allow us to measure such gaps, and assess service level/price trade-offs so that we can engage in informed debate about the arguments for and against closing such gaps.
Infrastructure Australia will be addressing these matters further in the Australian Infrastructure Plan.
50. McKinsey Global Institute (2013), p. 1. The figures quoted above are in 2010 prices.

Australian Infrastructure Audit Report 31
3.1 Measuring the infrastructure gapJudgments about the existence and scale of any infrastructure shortfall or gap involve striking a balance between two considerations:
■ the level of service being provided by the infrastructure; and
■ how much is being spent on infrastructure, or is required to be spent in the future.
The two approaches are linked. Ultimately, we get the infrastructure (and therefore the level of service) that we are prepared to pay for, either through taxes and/or user charges.
However, as infrastructure is required to sustain our way of life, any discussion about infrastructure gaps involves reaching some broad agreement about the quality of service provided by or expected from our infrastructure. Subsequently, such a discussion should aim to reach broad agreement as to how much the public at large (through taxation) and/or users of infrastructure (through user charges) are prepared to pay for the services provided by infrastructure.
3.2 Is there a current infrastructure gap?Although currently available data and information do not permit a detailed answer to this question, there is sufficient evidence to point to a number of reasonable conclusions. This section assesses that evidence, drawn both from local studies of infrastructure in Australia and from comparisons with infrastructure in other countries.
3.2.1 Local studiesEngineers Australia compiles a comprehensive ‘report card’ on Australia’s infrastructure every five years. The last analysis was published in 2010.51 A further review is scheduled for release in 2015. The results are necessarily qualitative. The last report card made the following key observations:
■ the overall national rating for Australia’s infrastructure was described as ‘adequate’, although it should be noted that this term was defined to mean that ‘Major changes [are] required to enable infrastructure to be fit for its current and anticipated future purposes’;
■ the overall rating had not changed since the 2005 assessment, although there were some minor changes at the sectoral level (e.g. the ratings for local roads and rail declined slightly);
■ there were material differences in the ratings between sectors; and
■ in some cases, there were material differences in the ratings between states and territories.
Other Australian studies and reports also point to existing gaps in Australia’s infrastructure. The studies are usually sector-specific, or deal with infrastructure in a particular location. Viewed as a whole, the conclusions paint a picture of infrastructure that is not consistently meeting community and industry needs and expectations or, in some cases, is failing to meet established standards.
351. Engineers Australia (2010)

32 Australian Infrastructure Audit Report
Congestion in our cities is perhaps the area with the greatest gap between what we expect from our infrastructure and what is delivered. The then Bureau of Transport and Regional Economics estimated that the cost of traffic congestion in Australian capital cities in 2005 was $9.4 billion, and projected that it would rise to $20.4 billion by 2020.52
The Audit has estimated that the cost of delays on urban roads was $13.7 billion in 2011. Based on projected population growth and distribution, and in the absence of any new transport network capacity, the cost of congestion on urban roads is projected to grow to $53.3 billion in 2031.53
This work is discussed more fully in section 7.1.1 of the report.
The ACIL Allen methodology does not account for new investments in infrastructure between 2015 and 2031, apart from infrastructure which is already under construction, or for which a firm funding commitment has been made. As noted at the beginning section 7.1.1, this methodology is designed to clearly show the locations in each city’s network where congestion will impose the greatest cost, to inform decision making about future infrastructure investment. As such, it is a useful indicator of what the cost of future congestion will be if we do nothing.
Table 2: Cost of road congestion – 2011 and projected 2031 ($ million, 2011 prices)
Sydney-Newcastle-
Wollongong
Melbourne-Geelong
Brisbane-Gold Coast-Sunshine
CoastGreater Perth Greater
AdelaideGreater
Canberra
2011 5,555 2,837 1,914 1,784 1,442 208
2031 14,790 9,006 9,206 15,865 3,747 703
Source: Infrastructure Australia analysis of data from ACIL Allen Consulting (2014b) and Veitch Lister Consulting (2014a)
Recent analysis by the Department of Communications has shown that broadband quality across Australia is highly variable and that, for most premises, the quality of service needs to be improved. On a scale of A (highest) to E (lowest), around 60 per cent of premises were assessed as receiving service levels D or E.54
3.2.2 International comparisonsInternational comparisons provide insights on the relative quality of Australia’s infrastructure, although making such comparisons can present a range of difficulties, including:
■ obtaining comparable data across countries;
■ many of the comparisons involve qualitative assessments; and
■ national level assessments can mask differences at a regional or local level.
Notwithstanding these limitations, international comparisons provide some useful context when reaching a conclusion on infrastructure gaps.
In its Global Competitiveness Report 2014–15, the World Economic Forum ranked Australia’s infrastructure 20th out of 144 countries.55 On a seven point scale ranging from 1 (extremely underdeveloped – among the worst in the world) to 7 (extensive and efficient – among the best in the world), Australia’s infrastructure scored 5.6.
Hong Kong’s score of 6.7 was the highest. Other large economies, or countries with which Australia is sometimes compared, had ranks and scores as follows: Netherlands (4th and 6.3); Germany (7th and 6.1); France (8th and 6.0); United Kingdom (10th and 6.0); United States (12th and 5.8); Canada (15th and 5.7); Italy (26th and 5.4); New Zealand (29th and 5.3) and China (46th and 4.7). Figure 8 provides a comparison of Australia’s ranking with other countries. The Forum’s more detailed rankings and scores for Australia’s infrastructure are shown in Table 3. Australia’s ranking of 35th for overall transport infrastructure quality is a cause for concern.
52. Bureau of Transport and Regional Economics (2007), p. xv 53. ACIL Allen Consulting (2014b), p. 381 54. Department of Communications (2013) 55. World Economic Forum (2014)

Australian Infrastructure Audit Report 33
Figure 8: World Economic Forum overall rankings of infrastructure − 201456
7.0
6.6
6.2
5.8
5.4
5.0
Hon
g K
ong
SAR
(1)
Sing
apor
e (2
)
Uni
ted
Ara
b Em
irate
s (3)
Net
herla
nds (
4)
Switz
erla
nd (5
)
Japa
n (6
)
Ger
man
y (7
)
Fran
ce (8
)
Spai
n (9
)
Uni
ted
Kin
gdom
(10)
Taiw
an, C
hina
(11)
Uni
ted
Stat
es (1
2)
Aus
tria
(13)
Kor
ea, R
ep. (
14)
Can
ada
(15)
Luxe
mbo
urg
(16)
Portu
gal (
17)
Bel
gium
(18)
Finl
and
(19)
Aus
tralia
(20)
WEF
scor
e
Source: Infrastructure Australia analysis of data in World Economic Forum (2014)
Table 3: World Economic Forum ranking of Australian infrastructure (out of 144 countries) – 2014
Criteria Score Rank
Overall ranking of infrastructure 5.6 20
Quality of overall transport infrastructure 5.1 35
Quality of roads 4.8 43
Quality of railroad infrastructure 4.0 32
Quality of port infrastructure 5.0 38
Quality of air transport infrastructure 5.5 29
Available airline seat km/week, millions 4,467.2 7
Quality of electricity supply 6.2 27
Mobile telephone subscriptions/100 pop. 106.8 81
Fixed telephone lines/100 pop. 44.3 16
Source: World Economic Forum (2014)
As shown in Figure 9, the World Bank’s Logistics Performance Index 2014 scored Australia’s trade and transport infrastructure at 3.81 (out of a possible 5), placing the country 16th in the world.57
These patterns emphasise the fact that maintaining Australia’s international competitiveness requires ongoing attention.
56. The World Economic Forum’s maximum possible score is 7.0. 57. World Bank (2014)

34 Australian Infrastructure Audit Report
Figure 9: World Bank rankings – Logistics performance indices − 201458
4.2
4.1
4.0
3.9
3.8
3.7
3.6
Wor
ld B
ank
Scor
e
Ger
man
y (1
)
Net
herla
nds (
2)
Bel
gium
(3)
Uni
ted
Kin
gdom
(4)
Sing
apor
e (5
)
Swed
en (6
)
Nor
way
(7)
Luxe
mbo
urg
(8)
Uni
ted
Stat
es (9
)
Japa
n (1
0)
Irel
and
(11)
Can
ada
(12)
Fran
ce (1
3)
Switz
erla
nd (1
4)
Hon
g K
ong,
Chi
na (1
5)
Aus
tral
ia (1
6)
Den
mar
k (1
7)
Spai
n (1
8)
Taiw
an (1
9)
Italy
(20)
Source: World Bank (2014)
On these assessments, Australia’s infrastructure cannot be considered world leading. There are factors which go some way towards explaining these rankings, such as Australia’s geographic size relative to its population. Still, the results highlight real room for improvement. Other countries also with a large area relative to their population, such as Canada, rank higher than Australia.
Australian cities have often featured in international rankings of their competitiveness and ‘liveability’. However, these rankings over recent years have identified weaknesses in Australian cities’ infrastructure, notably their transport networks.
Statistical comparisons between countries on telecommunications services are subject to a number of variable factors but a range of recent reports and surveys indicate that by international standards in terms of coverage and speed, Australia has a high ranking mobile (wireless) broadband service and a middle ranking fixed line broadband service.
Wireless broadband subscriptions in Australia tripled between 2009 and 2014.59 This resulted in Australia having the highest wireless broadband penetration in the (Organisation for Economic Cooperation and Development) OECD. As shown in Figure 10, Australia has over 113 subscriptions
per 100 inhabitants, indicating that many wireless broadband subscribers have more than one subscription. Australia has 25.6 fixed line broadband subscriptions per 100 inhabitants, which is below the OECD average of 27.6.60
In terms of average fixed line connection speeds, the Akamai State of the Internet report from the final quarter 201461 indicates that Australia has fallen three places to 44th place in terms of average download speed for fixed line broadband out of 120 countries. The average speed identified was 6.9 Megabits per second (Mbps). As a comparison, South Korea’s average was 25.5 Mbps, Japan 15.0 Mbps, US 11.5 Mbps (but significantly higher in some states), Canada 10.3 Mbps and the UK 10.7 Mbps.
In terms of average mobile connection speeds, Akamai does not provide a ranking but states that Australia is achieving 3.9 Mbps. This compares with South Korea at 18.2 Mbps, Japan at 6.7 Mbps, the US at 5.8 Mbps, Canada at 7.9 Mbps and the UK at 8.1 Mbps. Australia is likely to significantly improve its average connection speed with the commencement of the 4G 700 MHz networks in 2015.
58. The World Bank’s maximum possible score is 5.0. 59. Australian Bureau of Statistics (2014e) 60. Castalia Strategic Advisors (2014) 61. Akamai Technologies (2015)

Australian Infrastructure Audit Report 35
Figure 10: Number of broadband subscriptions per 100 inhabitants
120
100
80
60
40
20
0
Aus
tral
ia
Aus
tria
Bel
gium
Can
ada
Chi
le
Cze
ch R
epub
lic
Den
mar
k
Esto
nia
Finl
and
Fran
ce
Ger
man
y
Gre
ece
Hun
gary
Icel
and
Irel
and
Isra
el
Italy
Japa
n
Kor
ea
Luxe
mbo
urg
Mex
ico
Net
herla
nds
New
Zea
land
Nor
way
Pola
nd
Port
ugal
Slov
ak R
epub
lic
Slov
enia
Spai
n
Swed
en
Switz
erla
nd
Turk
ey
Uni
ted
Kin
gdom
Uni
ted
Stat
es
Total Fixed
Total Wireless
OECD Average for Fixed
OECD Average for Wireless
No.
of s
ubsc
riptio
ns
Source: Organisation for Economic Cooperation and Development (2015b)
The International Telecommunications Union also conducts an annual survey, Information and Communications Technology Development Index, which ranks 166 countries. The survey focuses on fixed and mobile access as well as the use of information and communications technology (ICT) and associated skills. Australia has retained its previous ranking of 12th in the survey. Australia was ranked fourth in the Asia Pacific region after South Korea, Hong Kong and Japan.62
Another interesting indicator of where Australia fits in terms of its telecommunications infrastructure is the International Markets report, compiled by the UK telecommunications regulator Ofcom.63 The 2013 report examines 18 countries – these include UK, France, Germany, Italy, the USA, Japan, Singapore, Japan, South Korea, Canada, Spain, China and Australia. The report has some penetration figures that are broadly consistent with the OECD data, but also contains information on the monthly telecoms revenue per capita. In the survey Australians were identified as spending the highest amount on telecommunications out of all 18 countries. One of the reasons may be that Australia recorded the highest mobile penetration rate behind South Korea (in this survey) and that we have a capable mobile data network. In any event this measure indicates that Australian mobile subscribers will
continue to make expenditures that will drive growth and upgrades of the networks.
OECD analysis has found that Australia has amongst the lowest percentage of fibre connections for broadband services in the developed world.64 The development of the National Broadband Network (NBN) is expected to raise this percentage progressively. Nevertheless, the analysis shows how far Australia has to catch up to other nations.
3.3 Informed public debate is essential Public discussion on infrastructure is largely dominated by debates about specific projects, rather than about policy or strategy. Advocates of particular projects seek to promote their views, while opponents of those same projects do likewise.
Discussion about infrastructure strategy (i.e. what we are trying to achieve, what problems we seek to solve, and how we might solve them) needs to be encouraged. Such discussions are fundamental if debate about particular projects is to have any context.
Informed discussion about prospective infrastructure funding challenges facing the nation occurs far too rarely. There must be more public
62. International Telecommunications Union (2014) 63. Ofcom (2013) 64. Organisation for Economic Cooperation and Development (2013b)

36 Australian Infrastructure Audit Report
debate (involving local communities, government and industry) about the reforms that will be needed if Australia is to maintain its living standards during a period of large population growth and economic uncertainty. Nowhere is this more obvious than in the transport sector.
Unless these debates are brought into the open, there is a real risk that Australians will fail to grasp some of the key choices that need to be made if their quality-of-life is to be assured. Instead of a strategically focused and informed discourse about where the country wants to head, and the role that infrastructure can play in supporting those aspirations, infrastructure debate will continue to be project-focused.
The result is likely to be a slow ‘drift’ in decision making, leading to future disappointment and a realisation that Australia had the opportunity to chart a different course and failed to do so.
Infrastructure Australia will focus on raising debate on these critical matters over the coming years.
Auditfindings13. Across various sectors, gaps in service
quality already exist and will grow. These gaps are particularly evident in urban transport. Gaps in the quality and reliability of water services in some rural towns are also evident.
14. There is also a gap between expectations about infrastructure quality, and the willingness or ability to pay. There is a need for serious public discussion about infrastructure service levels and funding.
15. In several areas, Australia’s infrastructure performance compares poorly with a number of other countries (including those that have similar population densities and harsh weather conditions). These international rankings indicate that Australia can perform better in infrastructure effectiveness and quality.

Australian Infrastructure Audit Report 37

38 Australian Infrastructure Audit Report
Governance and policy reform
Key Points ■ Sound governance and regulation are vital if the infrastructure sectors are to play an effective role in meeting Australians’ needs and aspirations over the next 15 years.
■ Governance can be improved, especially in the area of integrated strategic planning and project decision making.
■ Regulatory arrangements are broadly working well, though there are areas where improvements need to be made and where the effectiveness of recent changes needs to be monitored.
■ Policy reform, especially in relation to infrastructure funding, is vital. Reform in the transport sector, including implementation of a system of road pricing, needs to be pursued.
■ Recent experience suggests that making improvements in the governance, regulatory and policy settings for Australia’s infrastructure sectors will remain a difficult exercise, requiring greater public understanding of likely trade-offs between outcomes as well as political goodwill to share the responsibility for reform.
This chapter identifies a range of governance, regulatory and policy issues bearing on the infrastructure sectors.
Various Australian governments and other organisations have expressed their aim of raising standards of public policy decision making.65 This needs to include action in the areas of infrastructure governance, regulation and policy development.
Governance structures have a profound effect on the quality of infrastructure decision making. Regulation is ‘one of the key levers by which governments act to promote economic prosperity, enhance welfare and pursue the public interest’.66 Finally, policy reform in the infrastructure sectors, especially in relation to funding, will be a vital, yet challenging, issue for governments and the community.
These considerations − governance, regulation and policy − intersect to some extent. For example, good governance arrangements apply to the making of regulations. And broader policy setting reflects on governance and regulatory arrangements. Ultimately, all three considerations bear on the ability of the infrastructure sectors to support Australians in meeting their aspirations.
Recognising the diverse requirements of Australia’s infrastructure sectors, the following broad principles should apply to the development and reform of Australia’s infrastructure:
■ encouraging open markets to facilitate the cost effective provision of infrastructure services;
65. Infrastructure Australia (2015a) provides further information. 66. Organisation for Economic Cooperation and Development (2012), p. 3

Australian Infrastructure Audit Report 39
■ effective regulation of natural monopolies where competitive market arrangements are not possible;
■ strong leadership through better long-term planning and rigorous decision making across governments, especially in those circumstances where market arrangements cannot support competition and government funding is required to support service delivery;
■ promoting efficiency, accountability and transparency in planning for and operating Australia’s infrastructure, with a focus on ensuring that regulation of infrastructure is proportionate to the risks involved; and
■ ongoing assessment of Australia’s infrastructure policy settings across all governments and regulators to ensure they are optimised to achieve the nation’s changing needs.
4.1 Governance in the infrastructure sectorsGood governance is about applying sound practices in making decisions. The Australian National Audit Office observes that good governance reflects a number of characteristics:
■ strong leadership and continuous improvement;
■ maintaining governance systems and processes that are fit for purpose;
■ planning, engaging with risk, innovation, and performance monitoring, evaluation and review; and
■ promoting openness, transparency and integrity.67
Good governance processes improve confidence in government decision making. Conversely, poor governance arrangements will erode confidence in decision making and the quality of decisions.
Given the inter-connected nature of many areas of public policy, improving performance and meeting public expectations requires increasing sophistication in governance arrangements. A strong focus on stakeholder engagement and collaboration, and ‘whole of government’ perspectives will be needed. This can also require analysis of emerging issues that may bear on the future ability to deliver results.68
As noted in the subsections below, there is scope for improvement in governance standards in the infrastructure sectors in the following areas:
■ infrastructure planning and project selection;
■ corridor protection;
■ intergovernmental relations; and
■ post-completion reviews.
4.1.1 Infrastructure planning and project selectionInfrastructure Australia and others have previously commented on the need to improve infrastructure planning and project selection processes across all tiers of government.
467. Australian National Audit Office (2014), p. 10 68. Australian National Audit Office (2014), pp. 16-17

40 Australian Infrastructure Audit Report
Australia needs integrated infrastructure planning. Better long-term planning and clearer accountability will improve effectiveness, reduce costs and attract broader investment. There needs to be a greater focus on integrating transport strategies with land use plans, particularly when considering the future of transport networks, corridors and land allocation.
Planning the provision of infrastructure has never been more challenging. Although planning necessarily involves dealing with uncertainty, the current confluence of issues where major shifts are possible is striking. The uncertainties include:
■ the implications of demographic change for Australian society, both generally and government finances in particular, e.g.
─ the impact on government finances; and
─ whether older persons might have different patterns of infrastructure use;
■ shifts in decades-long patterns of demand, e.g.
─ shifts in housing demand, both in terms of location (infill versus greenfield) and household size (reversal of the pattern of falling household sizes); and
─ shifts in the demand for transport (moderating rates of car usage), energy (falling household demand for electricity) and water (uncertainty whether household usage has bottomed out);
■ the scope of technological change, e.g.
─ it is unclear how quickly various intelligent transport systems might mature and how extensively they could be applied;
─ changes in photovoltaic and battery technologies especially and their implications for energy networks; and
─ changes in telecommunications and business/cultural responses, e.g. uptake of telecommuting;
■ changes in the global and local economy, e.g.
─ uncertainty as to how many nations deal with existing debt obligations;
─ the scope for building on areas of competitive advantage; and
─ the scope for expanding other services exports, which will be important for
generating employment and wealth in urban areas;
■ the future of work, e.g. where people work, incomes, and part-time work, e.g.
─ whether service industries will continue to agglomerate in major centres within the cities;
─ whether greater adoption of part-time work changes commuting patterns; and
─ whether telecommuting can support the development of more flexible labour markets; and
■ the response to climate change and uncertainty as how the international community will respond, e.g.
─ whether governments reach a global agreement on emissions reduction targets and follow through on commitments will have a major impact on decisions in the energy and transport sectors.
In the face of issues such as these, wider use of scenario testing and other approaches to dealing with uncertainty, e.g. the application of real options analysis,69 is likely to improve planning and project development in the future. Scenario planning is not part of the main stream of infrastructure planning practice in Australia. Real options analysis has been applied in some circumstances, e.g. means of meeting Sydney’s water needs, and could be applied in other cases.
Improvements in infrastructure planning are being made. For example, as noted in Infrastructure Australia’s 2012 report to the Council of Australian Governments (COAG), some jurisdictions are adopting longer term horizons for their infrastructure planning. Jurisdictions are also committing resources to long-term strategic planning. Nevertheless, the report went on to observe that:
Prioritisation of proposed projects within a portfolio of potential investments requires further attention. This approach will improve government and public understanding of the opportunity costs and benefits of investing in some projects and not in others. Making progress on this front will enable decision-makers and the public to debate more openly the ability of projects to make a balanced contribution to meeting … national objectives.70
69. Real options analysis is a technique that can be used to assess the costs and benefits of various options associated with capital investment decisions, both for a portfolio of projects or individual projects. The ‘options’ or decisions relate to: initiating or deferring a project; the size of a project; staging of a project, abandoning a project. Using the technique can assist decision-makers in assessing the costs (essentially any non recoverable capital spending) of decisions to maintain some flexibility to deal with uncertainty. The technique is not relevant for all cases, e.g. the effort associated with applying real options analysis may not be warranted with smaller projects. However, for larger projects or portfolio decisions, application of the technique is worth considering. 70. Infrastructure Australia (2012c), p. 19

Australian Infrastructure Audit Report 41
Governments have increasingly acknowledged the need for close integration of their land use and infrastructure planning efforts.71 This covers not only integration of land use and transport infrastructure, but also includes integration with other infrastructure, e.g. sequencing of the provision of water and energy infrastructure to support greenfield urban development.
The scale of projected population growth in Australia’s cities and regional centres emphasises the criticality of effectively integrating all forms of land use and infrastructure planning. Progress is being made. Densities are slowly being raised around major transport nodes, and efforts to coordinate and sequence the provision of infrastructure are improving.
But more will need to be done.
In particular, integration efforts will need to focus on:
■ integration of land use and transport planning. This will require intergovernmental action, especially between state/territory governments and local governments; and
■ developing improved mechanisms for sequencing redevelopment and infrastructure in our cities. At present, mechanisms for coordinating the sequencing of housing and infrastructure appear to be focused primarily on greenfield development.
Particular weaknesses remain in project development and selection. In its 2014 report on public infrastructure, the Productivity Commission observed, ‘there is an urgent need to comprehensively overhaul processes for assessing and developing public infrastructure projects. … It is essential to reform governance and institutional arrangements for public infrastructure to promote better decision making in project selection, funding, financing and the delivery of services from new and existing infrastructure’.72
Governance frameworks for project appraisal and selection are therefore critical to the identification and development of Australia’s infrastructure. One successful mechanism for transparent oversight of major projects is the conduct of ‘gateway reviews’ at key points across a project’s implementation lifecycle.73 These reviews help to ensure that project implementation processes are accountable and provide valuable feedback for decision-makers and stakeholders to make changes that will improve the delivery of the project. However, such
reviews are not always conducted by Australian governments.74
Guidance material on best practice appraisal, such as the National Guidelines for Transport System Management,75 is available for governments to use. Application of the guidelines to planning and project development has been inconsistent. For example, while cost-benefit analysis is a well-established tool for determining the feasibility of projects and ranking options, the quality of the data underpinning such analyses needs to be improved and the assumptions more rigorously tested.
The quality of infrastructure planning and project decision making can only be as good as the information underpinning those efforts allows. Evidence-based decision making requires data, and analytical capability to assess the data. In this regard, good work is being done by bodies such as the Australian Urban Research Infrastructure Network and others.
Nevertheless, there are continuing weaknesses in the depth and breadth of data available to governments and industry to make better informed plans and project decisions. In the transport sector, for example, data and information on the demand for transport and performance of our networks needs to be much richer. Experience on the costs of projects is not captured in a systemic manner. Asset management information also tends to be held by individual governments or agencies.
Data needs to be rigorous, integrated, consistent and publicly available. If it is not, there will be less effective decision making at many levels and inadequate public understanding of (and involvement in) decision-making processes.
Transparency is also a vital element of best practice planning, project selection and regulation practices. However, decision making in the infrastructure sectors often remains relatively opaque. Limited transparency in planning and project selection processes has caused concern in recent years, particularly when major infrastructure projects proceed without a cost-benefit analysis, or without the results of such analysis being disclosed.
In summary, front end effort is fundamental to successful planning, project selection and scoping. It takes time and resources. However, the benefits of that upfront investment are significant. The decisions are more rigorously made and therefore involve better understood risks.
71. For example, the nine criteria for strategic planning of capital cities adopted by the Council of Australian Governments in December 2009 emphasised the need for integration across function and agencies. See Council of Australian Governments (2009). 72. Productivity Commission (2014a), p. 2 73. Victorian Department of Treasury and Finance (2013) 74. Department of Infrastructure and Transport (2012) 75. Australian Transport Council (2006). The guidelines provide relatively limited information on some issues, e.g. discount rates, that are important in cost benefit analysis. Updated guidelines are expected later in 2015.

42 Australian Infrastructure Audit Report
Auditfindings16. Australia needs integrated infrastructure
and land-use planning, across all levels of government. Progress has been slow in securing the efficiency and service delivery benefits of strategic decision making.
17. Sound infrastructure planning requires an ongoing commitment to engage communities throughout the decision-making process. This improves the likelihood of meeting community needs and expectations, and reduces objections to development.
18. Improvements in long-term infrastructure planning, project appraisal and project selection (including the consistent use and transparent reporting of cost-benefit analyses) are necessary if Australians’ expectations are to be realised.
19. Long-term planning necessarily involves dealing with uncertainty, with current issues including:
a. the implications of demographic change for Australian society generally and government finances in particular;
b. the scope and direction of technological change;
c. changes in the global economy; d. the future of work, e.g. where people
work, incomes, and part-time work; and e. the prospect of climate change, and
uncertainty as to how the international community will respond.
20. There is a need for more detailed information on infrastructure performance to be assembled consistently, at a national level, and for this information to be reported publicly to assist the forecasting of benefits and costs when planning infrastructure.
Experience in the private sector is instructive. Well-run companies invest significant effort in understanding the portfolio of their potential investments and the specifics of individual investment decisions. Failure to do so carries material commercial risks.
Investment in better planning and project development practices also provides the public with an opportunity to better understand the rationale for particular decisions, including the
rationale for making particular trade-offs, either between projects and/or within a project.
Community engagement is a crucial part of sound infrastructure planning. Communities should be involved throughout the various stages of the decision-making process, including being informed of the issues and understanding the available options. An ongoing commitment to involve the public can increase the likelihood that services will meet needs and expectations. It can also reduce opposition to new projects, saving on time and cost.
4.1.2 Corridor protectionA key benefit of long-term strategic infrastructure planning is the opportunity to identify and protect land corridors to accommodate future projects like rail lines, motorways and freight routes. Protecting sites for key nodes in the infrastructure networks, such as intermodal freight terminals, is equally important.
As highlighted by Infrastructure Partnerships Australia76 in its report on corridor protection in 2010 , and the Australian Government’s High Speed Rail Study77 in 2013, the implications of inaction in this area are not benign. As our cities grow, the absence of protected routes for transport and other linear infrastructure will reduce constructability, increase capital costs and could render otherwise beneficial projects uneconomic.
Without effective corridor protection, there is a significant risk that major new projects will have to be constructed in tunnels. This would add materially to their cost (often by five to 10 times the cost of a surface option). The requirement for tunnels would also be likely to increase whole-of-life costs.
Work commissioned by Infrastructure Australia also highlights the fact that with rising urban land prices, material cost savings can be achieved by acquiring corridors early and, where necessary, providing for an interim land use that also generates a rental stream.78
Between the 1950s and 1980s, a number of state governments had well-developed and successful corridor protection practices in place. Many of the projects successfully developed over the last 10-20 years have been built on corridors protected in the mid-twentieth century (for example, the Westlink M7 in NSW and East Link in Victoria).
For various reasons, those practices have often not been applied over the last 20 years. Governments are now beginning to take steps to redress this gap in the nation’s infrastructure planning, but the
76. Infrastructure Partnerships Australia (2010) 77. AECOM et al (2013). See also Productivity Commission (2014a), pp. 362-365 78. Urbis Valuations (2013)

Australian Infrastructure Audit Report 43
corridor protection regimes from the past have not yet been fully reinstated.
The most critical element in those past regimes, i.e. a stable funding source for acquisition of properties as required, requires further attention by most governments.79 When corridor protection is only offered through annual budget appropriations, there is a risk that the necessary funds will not receive the priority they deserve. Funding for projects that bear results in the near term is more likely to be given priority.
Effective coordination between Australian and state/territory governments is essential in this area. This ideally will see:
■ governments agreeing which corridors require protection;
■ agreements on appropriate steps (e.g. through statutory land use controls) to protect these corridors;
■ agreement on secure funding arrangements to ensure that the corridors are protected in an effective manner; and
■ strong commitments to good governance processes so that key corridors are not sacrificed to short-term considerations.
Infrastructure Australia will focus on the public policy and funding reforms which would assist in protecting corridors for nationally-significant infrastructure in the Australian Infrastructure Plan.
Auditfinding21. An improved framework is required to
protect corridors for transport and other linear infrastructure. The failure to protect corridors can lead to significantly higher construction costs, making otherwise beneficial projects uneconomic.
4.1.3 Intergovernmental relationsThe responsibility for providing infrastructure spans across all levels of government, as well as the private sector, and increasingly involves national or cross-border considerations. This reflects the fact that various infrastructure networks traverse state/territory boundaries, or are of such scale or impact that many levels of government are involved.
Assessing the effectiveness of governance arrangements in infrastructure sectors therefore
requires attention not just to individual organisations but to the interplay of multiple governments and organisations. The issues play out:
■ at a bi-lateral level between specific governments (for example, in relation to project priorities); and
■ multi-laterally between governments (for example in relation to broader regulatory and policy matters).
Sustaining long-term common interests between governments is an ongoing issue in Australia. Debates arise periodically about project priorities and funding responsibilities. Governments will understandably reach their own views about such matters, reflecting their strategic intentions and electoral commitments.
Nevertheless, there is a need to consider mechanisms that might support stable, considered efforts across the infrastructure sectors. Clear and regularly updated long-term plans, supported by detailed evidence, are an essential element amongst such mechanisms.
Broader regulatory and policy efforts often require some form of intergovernmental agreement. In this regard, members of COAG have periodically considered the effectiveness of the COAG arrangements, notably those relating to ministerial councils. Concerns have been expressed by some first ministers that efforts at reform agreed amongst first ministers were not progressing effectively through ministerial councils.80 At its meeting in December 2013, COAG rationalised the ministerial council system, establishing eight councils, including one dealing with transport and infrastructure.81
The Australian Government is currently undertaking a series of reform processes, which have identified potential policy and regulatory reforms that would impact on intergovernmental relations, with ongoing implications for the infrastructure sector.
It has committed to producing a White Paper on Reform of the Federation, which will consider the responsibilities of the federal and state governments. Issues papers released as part of the White Paper process suggest that social infrastructure will likely be the focus for reform.82 COAG agreed in October 2014 that the main focus of the White Paper process “will be on health, early childhood learning, schools, vocational education and training, housing and homelessness.”83
79. The Metropolitan Region Improvement Tax in Perth is an exception, although it does not apply to the Peel region into which Perth is expanding. 80. Lundie, R. (2011) 81. Council of Australian Governments (2013) 82. Department of the Prime Minister and Cabinet (2014b) 83. Council of Australian Governments (2014)
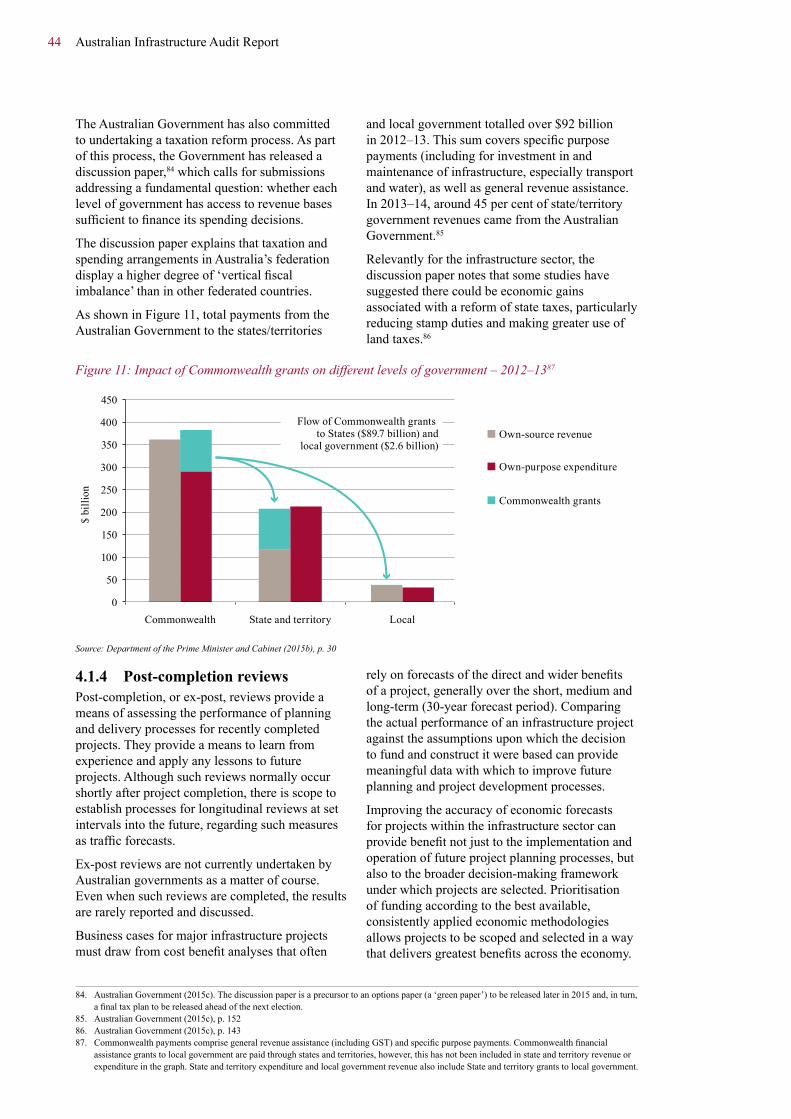
44 Australian Infrastructure Audit Report
The Australian Government has also committed to undertaking a taxation reform process. As part of this process, the Government has released a discussion paper,84 which calls for submissions addressing a fundamental question: whether each level of government has access to revenue bases sufficient to finance its spending decisions.
The discussion paper explains that taxation and spending arrangements in Australia’s federation display a higher degree of ‘vertical fiscal imbalance’ than in other federated countries.
As shown in Figure 11, total payments from the Australian Government to the states/territories
and local government totalled over $92 billion in 2012–13. This sum covers specific purpose payments (including for investment in and maintenance of infrastructure, especially transport and water), as well as general revenue assistance. In 2013–14, around 45 per cent of state/territory government revenues came from the Australian Government.85
Relevantly for the infrastructure sector, the discussion paper notes that some studies have suggested there could be economic gains associated with a reform of state taxes, particularly reducing stamp duties and making greater use of land taxes.86
Figure 11: Impact of Commonwealth grants on different levels of government – 2012–1387
$ bi
llion
450
400
350
300
250
200
150
100
50
0Commonwealth State and territory Local
Commonwealth grants
Own-purpose expenditure
Own-source revenueFlow of Commonwealth grants
to States ($89.7 billion) andlocal government ($2.6 billion)
Source: Department of the Prime Minister and Cabinet (2015b), p. 30
4.1.4 Post-completionreviewsPost-completion, or ex-post, reviews provide a means of assessing the performance of planning and delivery processes for recently completed projects. They provide a means to learn from experience and apply any lessons to future projects. Although such reviews normally occur shortly after project completion, there is scope to establish processes for longitudinal reviews at set intervals into the future, regarding such measures as traffic forecasts.
Ex-post reviews are not currently undertaken by Australian governments as a matter of course. Even when such reviews are completed, the results are rarely reported and discussed.
Business cases for major infrastructure projects must draw from cost benefit analyses that often
rely on forecasts of the direct and wider benefits of a project, generally over the short, medium and long-term (30-year forecast period). Comparing the actual performance of an infrastructure project against the assumptions upon which the decision to fund and construct it were based can provide meaningful data with which to improve future planning and project development processes.
Improving the accuracy of economic forecasts for projects within the infrastructure sector can provide benefit not just to the implementation and operation of future project planning processes, but also to the broader decision-making framework under which projects are selected. Prioritisation of funding according to the best available, consistently applied economic methodologies allows projects to be scoped and selected in a way that delivers greatest benefits across the economy.
84. Australian Government (2015c). The discussion paper is a precursor to an options paper (a ‘green paper’) to be released later in 2015 and, in turn, a final tax plan to be released ahead of the next election. 85. Australian Government (2015c), p. 152 86. Australian Government (2015c), p. 143 87. Commonwealth payments comprise general revenue assistance (including GST) and specific purpose payments. Commonwealth financial assistance grants to local government are paid through states and territories, however, this has not been included in state and territory revenue or expenditure in the graph. State and territory expenditure and local government revenue also include State and territory grants to local government.

Australian Infrastructure Audit Report 45
Critically examining the successes and failures of infrastructure projects through ex-post reviews can provide governments with a simple means of improving future planning and delivery of publicly funded infrastructure projects. This information should be made available to all governments, investors and stakeholders through a single national source in order for the benefits of the critical reviews of infrastructure projects to be fully realised.
Auditfinding22. Post-completion reviews are not
regularly undertaken for infrastructure projects, limiting the opportunities for governments and others to learn from mistakes and successes. This is to the detriment of current and future decision-making processes.
4.2 Regulation of infrastructure in AustraliaRegulation, as noted in guidance material issued by COAG, refers to:
the broad range of legally enforceable instruments which impose mandatory requirements upon business and the community, as well as to those government voluntary codes and advisory instruments for which there is a reasonable expectation of widespread compliance.88
Historically, services in the infrastructure sector have been subject to economic regulation due to their public good89 characteristics and natural monopoly90 market structure. Services in this category include some parts of the transport and utilities sectors (for example, electricity and water). The economic regulation of those services seeks to ensure an adequate supply of − or access to − services, and fair and efficient pricing of those services.
As a broad observation, governments are aiming to minimise the extent of regulation, consistent with the need to achieve broader public policy objectives.
COAG has issued a guide on best practice regulation to be applied to the operation of ministerial councils and national standard-setting bodies. The Australian Government has also published a guide to regulation to be used by members of the Australian Public
Service involved in policy making.91 Internationally, there is also agreement on what constitutes sound regulatory practice. In 2012, the Organisation for Economic Cooperation and Development (OECD) adopted a set of international guidelines and principles to be implemented by member countries on regulatory quality and performance.92
There is significant commonality across these documents concerning the circumstances in which regulation is worthy of consideration and the principles underpinning best practice regulation.
Best practice sees economic regulation where there may be some form of ‘market failure’, such as where there:
■ is an inefficient allocation of resources;
■ may be broader equity issues, e.g. levels of service to be delivered in rural or remote areas;
■ is a natural monopoly or abuse of market power;
■ is a need to correct for ‘information asymmetry’ between parties involved in a transaction;
■ are externalities (positive or negative); and
■ is a market place that is unable to deliver a much needed public good, particularly in relation to non-rivalrous goods and services and non-excludable public goods.93
At a high level, the principles underpinning best practice regulatory impact assessment processes:
■ require a clear articulation and understanding of the problem that is being attempted to be solved through regulation, e.g. the magnitude of the problem and the case for action;
■ assess options (including the option of not regulating) against a variety of considerations such as compliance costs, competition effects, distributional implications, risks and implementation arrangements;
■ assess the net benefit of each option, including the application of cost benefit analysis;
■ provide for stakeholder/public involvement in the process of assessing and making regulations;
■ promote transparency, e.g. publication of the information on which decisions to make regulations are taken; and
■ provide for periodic review of regulatory arrangements.
88. Council of Australian Governments (2007), p. 3 89. In economics, a public good is defined by two characteristics, the fact it is both non-excludable and non rivalrous meaning that individuals cannot be effectively excluded from use and where use by one individual does not reduce availability to others. 90. In economics, a natural monopoly refers to an industry in which the most efficient method (involving the lowest long-run average cost) for production is to be permanently concentrated in a single firm rather than contested competitively. Typically, this occurs in industries that have high initial sunk costs. 91. Department of the Prime Minister and Cabinet (2014a) 92. Organisation for Economic Cooperation and Development (2012) 93. The lists of circumstances and principles above are adapted from Department of the Prime Minister and Cabinet (2014a), pp. 22-24 and Council of Australian Governments (2007), p. 10.

46 Australian Infrastructure Audit Report
4.2.1 Sector-specificconsiderationsAlmost all of the sectors under consideration in the Audit are subject to sector-specific legislation and regulations. Within each sector, the structure of governance and regulation is not consistent between the sub-sectors or jurisdictions.
In the transport sector, where most sub-sectors are subject to both federal and state legislation, the governance and regulatory framework is often unwieldy and complex. There has been a recognition in recent years that Australia’s economic efficiency would benefit if some of the governance and regulation of transport and its sub-sectors were to be standardised and made ‘national’ in application. Of note, the National Transport Commission (NTC) was originally established in 2003 ‘with ongoing responsibility to develop, monitor, maintain uniform or nationally consistent regulatory and operational reforms relating to road, rail and intermodal transport’.94
The regulatory framework is also complex for the water sector, which is subject to health, environmental and economic regulators at state and regional level, as well as the national legislation of the Water Resources Act 2007 (Cth).
In the energy sector there are three national market bodies – the Australian Energy Market Operator (AEMO), Australian Energy Regulator (AER) and Australian Energy Market Commission (AEMC) – while services are largely delivered by a mix of state-owned and private businesses.
Sector specific legislation and regulation across the infrastructure sector has been the focus of several recently concluded or ongoing inquiries by the Australian Government and relevant agencies.
The Productivity Commission’s inquiry report into electricity network regulation,95 released in 2013, found that the current regulatory regime encourages businesses to build more infrastructure – or to a higher standard – than is necessary. The report also found that state-owned network businesses have conflicting objectives, frustrating the effectiveness of incentives regulation and recommended that they should be privatised.
The final report of the Competition Policy Review Panel (the Harper Review), released in March 2015, notes that reforms aimed at encouraging competition have been made to varying degrees across the infrastructure sectors. The Panel proposes that further benefits could be harnessed in all sectors by extending these pricing,
governance and regulatory reforms. For example, the Panel identifies that consumers are benefiting from price-monitoring and regulatory reforms in aviation through cheaper air travel, but notes that other reforms, such as the introduction of access regulation for airports, may result in further market benefits.96
The Panel recommends removing government impediments to competitive infrastructure markets, through privatisation of assets where appropriate, and introducing cost-reflective pricing to markets where monopoly characteristics have impeded pricing reforms. These findings broadly align with those of the Audit, as increased competition will allow the supply of infrastructure services to more efficiently meet customer demands.
The Panel also notes that market reforms in the water sector have been slower to be implemented than in the electricity and gas sectors. In the water sector, the Panel recommends implementation of the principles of the National Water Initiative, while strengthening economic regulation and pricing reforms in the urban water sector. In the electricity and gas sectors, the Panel proposes finalisation of the energy reform agenda, including deregulation of both electricity and gas retail prices.97
The Australian Government released its Energy White Paper in early April 2015.98 The paper focused on three key themes of: increasing competition to keep prices down, increasing energy productivity to promote growth, and investing in Australia’s energy future. Key priorities underlying these themes include:
■ implementing market reforms agreed by the COAG Energy Council;99
■ rolling out cost reflective tariffs;
■ further developing market frameworks to encourage innovation and improve consumer choice;
■ privatising state-owned electricity assets;
■ better regulation and facilitation of responsible development of unconventional gas resources; and
■ developing a National Energy Productivity Plan and increasing energy productivity by up to 40 per cent by 2030.
The emphasis on market-led reform and effective regulation is broadly in line with the findings of the Audit. The reforms agreed by the Energy Council build on existing regulatory arrangements
94. Department of Infrastructure and Regional Development (2014a) 95. Productivity Commission (2013) 96. Competition Policy Review Panel (2015), p. 206 97. Competition Policy Review Panel (2015), pp. 202-205 98. Department of Industry and Science (2015) 99. Council of Australian Governments Energy Council (2014)

Australian Infrastructure Audit Report 47
and reforms as a means to improve efficiency in the energy sector.
The White Paper also sets out the Australian Government’s priorities for the Energy Council for 2015. These priorities also align with Audit’s support for using markets to drive efficiency and consumer choice. The priorities include:
■ rolling out network tariff reform by the end of 2015;
■ reducing investor uncertainty, particularly in electricity generation, including specifying that the government will not pay for exit of surplus generation capacity;
■ accelerating the development of a more liquid wholesale gas market;
■ better use of non-proprietary data, reducing duplicative survey and collection, reducing costs; and
■ improving community engagement and understanding with the resources sector, including sharing leading practice approaches.
COAG is currently undertaking a review of the energy sector, with a report due by September 2015. Specifically, the review will examine the market structure and legislative framework of the sector and whether this system achieves sustainable outcomes that will benefit the long-term interests of consumers.
Auditfinding23. Ineffective and inconsistent regulation
has had adverse outcomes for infrastructure users and the Australian community. These include high costs in parts of the electricity sector, poor pricing decisions leading to potential problems in the future in the water sector, and poor levels of cost-recovery in the transport sector. Greater independence of regulatory oversight would improve the quality of decision making.
4.2.2 Environmental assessments Major infrastructure projects affect – and will be affected by – their surrounding environment. Environmental considerations should form a fundamental aspect of infrastructure project selection and planning processes. Collaboration across a diverse set of stakeholders is integral to ensuring that Australian infrastructure is sustainable and delivers wide benefits to society.
The challenge for environmental regulators across governments is to find a model of oversight that facilitates efficient project implementation while ensuring that current standards – in line with local needs and Australia’s international obligations – do not decline.
Federal, state and local governments hold environmental management legislation, leading to some duplication of administration in regulatory and approval processes for projects. Clear efforts have been made to align these approval processes. By December 2014, all states and territories had executed assessment bilateral agreements with the Australian Government.100
A cohesive, transparent structure for managing environmental issues transforms environmental assessments from a regulatory impost to a valuable forum for discussion of the environmental impacts of projects as part of the planning and scoping process.
The challenge for environmental regulators across governments is to find a model of oversight that supports efficient project implementation while ensuring that current standards – in line with local needs and Australia’s international obligations – do not decline.
Auditfindings24. Environmental considerations
should form a fundamental aspect of infrastructure project selection and planning processes.
25. More rigorous and transparent strategic planning offers the potential to minimise project level disputes about the environmental merits and impacts of specific projects.
4.3 FundingWhilst annual spending on Australia’s infrastructure has been higher in the last five years than in the preceding 20 years, the rate of expenditure appears insufficient to maintain current levels of service into the future. Analysis of future fiscal pressures suggests that governments will struggle to maintain current levels of infrastructure expenditure in the medium to longer term. This is particularly relevant for the transport sector and, to a lesser extent, the water sector.
As shown in Figure 12, infrastructure outlays by Australian governments have increased substantially since the middle of the last decade, particularly for transport.
100. Hunt, MP (2014a) and Hunt, MP (2014b)

48 Australian Infrastructure Audit Report
Private investment in infrastructure has also grown, partly as the private sector has become a larger owner and developer of infrastructure, and partly as infrastructure has been developed to support new resources and energy developments.
As shown in Figure 13, overall investment in economic infrastructure has generally varied between four and five per cent of GDP for the last 30 years.
Auditfinding26. Over recent years, rates of public and private investment in infrastructure have been higher than
the long-term average.
Figure 12: Engineering construction work for the public sector – 1987 to 2014 (year ending 30 June)
2.5
2.0
1.5
1.0
0.5
0.0
Per c
ent o
f GD
P
1987
1988
1989
1990
1991
1992
1993
1994
1995
1996
1997
1998
1999
2000
2001
2002
2003
2004
2005
2006
2007
2008
2009
2010
2011
2012
2013
2014
Roads, subdivs, bridges Railways Electricity Water Drains Other
Source: Infrastructure Australia analysis of Australian Bureau of Statistics (2015) data
Figure 13: Public and private investment in transport, electricity, gas, water, waste and telecommunica-tions infrastructure – 1981 to 2014 (year ending 30 June)
7
6
5
4
3
2
1
0
1981
1982
1983
1984
1985
1986
1987
1988
1989
1990
1991
1992
1993
1994
1995
1996
1997
1998
1999
2000
2001
2002
2003
2004
2005
2006
2007
2008
2009
2010
2011
2012
2013
2014
General govt (Cwlth)
Private Public corporations (State and local) Public corporations (Cwlth) General govt (State and local)
Per c
ent o
f GD
P
Source: Infrastructure Australia analysis of Australian Bureau of Statistics (2015) data
As noted in separate analysis commissioned for the Audit,101 there is evidence of underspending on infrastructure maintenance. In addition, in some cases, infrastructure providers’ maintenance of existing infrastructure is underpinned by
government subsidies. For example, various governments subsidise the cost of electricity supply in regional locations.102 The fiscal challenges facing governments suggest that this could become increasingly difficult to
101. GHD (2014) 102. AECOM (2014)

Australian Infrastructure Audit Report 49
sustain. Equally, though, moving to more cost-reflective pricing for services in smaller regional communities is likely to raise difficult issues for those communities.
As shown in Figure 14, there is also some evidence Australia has been spending more than
many other countries. However, as noted above, this approach does not address country-specific cost pressures or advantages that might justify a departure from an international average level of expenditure. Nor does it address differences in service levels.
Figure 14: Transport, storage and telecommunications outlays – OECD countries – 1970 to 20066
5
4
3
2
1
0
Aus
tral
ia
Aus
tria
Bel
gium
Can
ada
Spai
n
Finl
and
Fran
ce
Gre
at B
rita
in
Irel
and
Isra
el
Italy
Kor
ea
Net
herla
nds
Nor
way
New
Zea
land
Swed
en
Uni
ted
Stat
es
Ave
rage
1970–79 1980–89 1990–99 2000–06
Per c
ent o
f GD
P
Source: Organisation for Economic Cooperation and Development (2009)
Auditfinding27. The current level of public sector expenditure – especially in the transport sector, which
remains largely funded by government rather than user charges – may be unsustainable in the face of increasing budget pressures to fund welfare and health services.
Various projections of government finances highlight the significant challenges facing all governments in meeting community expectations, including expectations of our infrastructure. For example, analysis undertaken by the NSW Government concludes that, even assuming a fall in transport outlays as a percentage of Gross State Product (GSP) compared to recent expenditure:
… a fiscal gap of 2.8 per cent of GSP is projected to open up by 2050–51. To put that in context, the gap will be $11.5 billion (or around 20 per cent of budget expenses) based on 2009 10 GSP. If measures are not taken to close this gap, net debt will rise from 2.3 per cent of GSP in 2009–10 to an unsustainable 119 per cent by 2050–51.103
Infrastructure Australia stated in its 2012 report to the COAG that:
The projections of fiscal gaps suggest that, if the current approach to funding is maintained, the projects that are developed in our cities over the next 20 years may be amongst the last that can be funded through conventional government means.104
A more recent study published by the Grattan Institute bears out this analysis. Figure 15 shows that, in their 2013 budgets, state and territory governments planned to reduce capital expenditure materially. The figures are for the ‘general government sector’, i.e. they exclude expenditure by government trading enterprises but include most transport expenditure.
103. New South Wales Government (2011a), p. i 104. Infrastructure Australia (2012c), p. 46

50 Australian Infrastructure Audit Report
Figure 15: State and territory capital expenditure − general government net acquisition of non-financial assets ($ billion, 2013 prices) – 2003 to 2017
25
30
20
15
10
5
0
2002
–03
2003
–04
2004
–05
2005
–06
2006
–07
2007
–08
2008
–09
2009
–10
2010
–11
2011
–12
2012
–13
2013
–14
Bud
get
2014
–15
FE
2015
–16
FE
2016
–17
FE
Commonwealth stimulus package Capital expenditure
Notes: 2012–13 are estimated actuals. 2013–14 and forward estimates (FE) are budgeted figures.Source: ABS (2012) cat 5512, Treasury (2008), Part 2, Table 2.1, State and territory budget papers 2013–14.
$ bi
llion
Forecast
Source: Daley and McGannon (2014), p. 38
Measures introduced by the Australian Government in its 2014–15 budget to encourage infrastructure spending, such as the asset recycling initiative, have helped to maintain capital expenditure at a higher level than other governments were budgeting in 2013. Nevertheless, the jurisdictional budgets from 2013 provide a clear indication as to their intentions about the likely direction of infrastructure outlays.
Current arrangements for the funding of land transport are deeply flawed and represent the most significant opportunity for public policy reform in Australia’s infrastructure sectors.
Users already contribute to the cost of transport infrastructure:
■ motorists contribute to the cost of the road network through state charges such as registration and licence costs, and through the Australian Government’s fuel excise;
■ train, bus and ferry users make a contribution to the cost of operating public transport systems through the purchase of tickets; and
■ in the freight rail sector, access charges are aimed at meeting most, if not all, of the cost of maintaining the rail infrastructure.
However, with some limited exceptions (e.g. tollways and some mining related railways), the development and maintenance of Australia’s land transport networks is funded primarily through government outlays.
There is relatively little transparency in these arrangements. It is unclear how flows of funds from the revenue sources are then linked to
transport outlays and the performance of the networks.
A number of factors strongly point to the conclusion that the existing arrangements for funding the development of Australia’s transport networks are unsustainable and need to be changed.
First, in the road transport sector, the amount raised from fuel excise is likely to decline over time. More fuel-efficient vehicles and the wider use of hybrid and electric vehicles will reduce the use of fuel and therefore the amount raised from fuel excise. Moreover, as noted elsewhere in this report, per capita vehicle usage (measured in vehicle kilometres travelled) is flattening out. The net effect is that less excise revenue is collected and less is therefore available to fund transparent needs.
Australia is not alone in facing this challenge, other countries are dealing with the same trends. In the United States, in particular, there have been regular debates about the durability of its existing transport funding arrangements in the face of these trends.
Secondly, current arrangements do not encourage the most efficient use of the existing transport networks. As shown in the sections of this report dealing with urban transport, peak hour demand on many urban transport networks significantly exceeds the capacity of those networks. The result is congestion on the nation’s roads and overcrowding on parts of the public transport network. Yet, at other times of the day, these same networks have spare capacity.
Thirdly, without funding reform, there will be insufficient funds available to provide the infrastructure required to sustain Australians

Australian Infrastructure Audit Report 51
quality of life. The cost of new projects (both those already planned and those yet to be defined) and the cost of maintaining existing assets will almost certainly exceed the funds that governments will plausibly have available to spend on transport. Evidence of this can already be seen in the periodic debates between governments about their respective funding shares for new projects.
Governments therefore need to investigate alternative funding mechanisms to meet infrastructure needs. The Productivity Commission recently acknowledged the need to consider greater use of direct charges on users and other beneficiaries. It saw this shift to greater use of direct charges being justified on efficiency and equity grounds.105 The Commission reviewed and found merit in governments considering:
■ user charges, including road user charges and public transport charges; and
■ value capture, including betterment levies, tax increment financing and property development.
In response to the Commission’s recommendations in this area,106 the Australian Government has responded broadly as follows:
■ Recommendation 4.1 – In relation to pilot studies on how vehicle telematics could be used for distance and location charging of cars and other light vehicles, and a future shift to direct road user charging for cars and light vehicles – the Australian Government supported the recommendation in principle as a long-term reform option. However, the Government noted a range of complex issues (equity, technology, privacy and the availability of alternatives) that would need to be worked through, including with other governments, industry and the community;
■ Recommendations 8.1 and 8.2 – In relation to the establishment of Road Funds by state and territory governments and local government groupings (and covering road funding, investment and maintenance, amongst other things) – the Australian Government indicated: (a) it has begun working with state, territory and local governments to investigate options for a road fund, including focusing on commercial freight routes; and (b) that it is considering the broader, long-term issues around wider application of road pricing.107
The Government’s recent tax discussion paper has also noted arguments in favour of user charging, and pointed to the Australian Government’s response to the Productivity Commission’s recommendations (see above).
Funding the infrastructure needed to support productivity growth in Australia is likely to require greater revenues than are presently available to governments. Successive editions of the Intergenerational Report (and equivalent analysis prepared by some state governments)108 have shown that Australian governments continue to face significant fiscal pressures. Any decrease in existing indirect charges and taxes on road users would mean that fewer funds would be available for infrastructure investments, and more funds would need to be found from other revenue sources. Avoiding the anticipated budget deficits109 is likely to require significant limits on future government outlays. It would be surprising if spending by governments on infrastructure alone was exempt from these limits.
None of these issues are new. The Henry review of taxation110 comprehensively outlined the need for reform in this area. Economic regulators in the states have addressed these issues on a number of occasions. COAG considered transport funding and pricing as part of its work on urban congestion as far back as 2006. Industry bodies have highlighted the need for change.111 More recently, the Competition Policy Review Panel discussed the introduction of cost-reflective pricing and linking the revenue raised to road provision. It recommended reducing indirect charges and taxes on road users to offset increases to road user charges, in order to prevent higher overall charges for consumers.112
Yet, beyond a few references in some transport plans to transport pricing as a long-term possibility, and faltering and slow progress on heavy vehicle charging, no substantive action has been taken by governments. Some jurisdictions oppose even the application of project-specific road tolling as a matter of state policy.
The private sector will only invest in a project if it is able to earn a return on its investment. That return can only come from user charges or from governments in the form of availability charges (however, availability charges themselves represent a call on future government funds).
105. Productivity Commission (2014a), p. 142 106. Productivity Commission (2014a). See, in particular, recommendation 4.1, 8.1 and 8.2 at pp. 42-43. 107. Australian Government (2014d), pp. 11-12 108. See, in particular, the analysis in New South Wales Government (2011a). 109. Australian Government (2015a), pp. 46-48 110. Australian Government (2010b) 111. Infrastructure Partnerships Australia (2014) 112. Competition Policy Review Panel (2015), p. 217

52 Australian Infrastructure Audit Report
This unsatisfactory state of affairs needs to end. The debates on these matters will be difficult and sometimes fraught. Governments and oppositions, along with industry and other stakeholders, will need to display leadership and integrity in initiating and participating in these debates.
Australia needs to consider a broader system of transport pricing, both for road and public transport. This is not to say that governments will not need to continue to invest in the country’s transport networks. There will be situations where broader public policy objectives, including those associated with social and sustainability outcomes, can only be achieved with some level of government investment. However, these payments should be provided transparently, following exhaustive planning and demonstration of the contribution towards achieving those public policy outcomes.
Although the issues are most pressing in the transport sector, to varying degrees, similar issues arise across the water, energy and telecommunications sectors.
Auditfindings28. Current arrangements for the funding
of land transport represent the most significant opportunity for public policy reform in Australia’s infrastructure sectors.
29. Government funding alone is unlikely to be sufficient to provide the infrastructure that Australia requires. Maintaining or strengthening conditions to facilitate private sector investment in and operation of Australia’s infrastructure networks is fundamentally important.
30. The country needs to consider a broader system of transport pricing, both for road and public transport.
Local councils own and manage a large part of Australia’s infrastructure networks, notably in the transport and water sectors.
Around 670,000 kilometres of roads are under the control of local councils (approximately 74 per cent of the total road length across the country). The roads were valued at approximately $165 billion in 2011. The condition of the assets and quality of service is variable. A 2014 survey conducted on behalf of the Australian Local Government Association found that around 10 per cent of local roads and bridges controlled by the respondent councils were in a poor or very poor condition.113
Local water services, especially in smaller rural communities, do not consistently deliver water that meets relevant water quality standards. As noted elsewhere in this report, maintenance of local water services is often underfunded.
Some councils are likely to find their local rate base come under pressure, e.g. if the local economy shrinks and/or younger residents move out of the area, leaving a smaller (probably older) population with limited or fixed incomes.
In rural areas especially, these dual challenges of high costs/service backlogs on the one hand and limited revenue on the other, are likely to persist. However, it will not be easy for the Australian Government and/or state/territory governments to respond with materially greater financial support for local communities as their budgets are under pressure too.
In these circumstances, reform of local government will be necessary. As systems of local government are a state/territory responsibility, reform will need to be driven largely by those governments and local government itself. Economies of scale will have to be secured, either through council amalgamations and/or the development of shared systems for asset management and resource sharing. In this regard, local government is increasingly exploring resource sharing initiatives.
Auditfinding31. Amalgamation of local government in
some areas, and other reforms such as shared services arrangements, will be necessary if local councils are to have the scale and financial capacity to meet their local infrastructure responsibilities.
4.4 Other policy considerationsAttention to a number of areas of policy will facilitate the more efficient planning and delivery of infrastructure in the future. The following areas deserve attention by governments:
■ skills; ■ procurement; and ■ management of construction.
113. Jeff Roorda and Associates for the Australian Local Government Association (2014), p. 5. Approximately 70 per cent of councils across Australia responded to the survey.

Australian Infrastructure Audit Report 53
4.4.1 SkillsWorkforce capacity and access to skills can have a material impact on major projects, increasing costs and delaying delivery. Labour accounts for approximately 20 per cent of project costs,114 and more for smaller projects.
As demand from the resources sector subsides, more skilled labour is becoming available. This is helping to relieve some long-running skills constraints in other sectors. However, the exchange of personnel from the resource sector may not provide sufficiently or suitably qualified and experienced staff to address all established infrastructure skill constraints. Skills gaps may still emerge in certain specialised occupations and in particular localities. If not addressed, these run the risk of driving up costs and delaying projects.
In conjunction with the slowdown in resource sector opportunities, uncertainty arising from the absence of a clear pipeline of infrastructure projects risks the loss of skills and experience overseas.
In addition, the infrastructure sectors face the loss of important skills and experience as individuals retire. The average age of those working in some infrastructure-related occupations is greater than the average of the workforce at large.
A stable, medium to long-term pipeline of projects would considerably assist in addressing these prospective skills constraints. It would minimise uncertainty:
■ for employers making decisions about retaining and training staff, especially in specialised, technologically-focused occupations such as rail signalling, vehicle telematics and renewable energy; and
■ for employees looking for local opportunities to ensure they are gainfully employed and to ensure that their skills remain current.
There is an opportunity to use the current infrastructure investment phase to build depth in the skills of the infrastructure workforce. The current abatement of skills constraints should be used to take clear and considered steps to foster the availability of the right skills needed to build the nation’s future.
A medium-term pipeline of committed projects could be used as a catalyst for skills development and recruitment in the infrastructure sector in Australia.
Auditfinding32. Skills shortages contribute to cost
increases for infrastructure construction. Development of an infrastructure pipeline presents an opportunity to develop a better skilled workforce and to minimise skills shortages in the future.
4.4.2 Procurement and the project pipeline The methods used to procure infrastructure projects will directly affect the final construction and operating cost of each major piece of infrastructure.
It is widely accepted that the presence of an observable long-term pipeline of up-coming projects is a sure way of providing keen industry and professional interest in assessing the next project on the pipeline, and ensuring competitive bidding for the work involved.
The general absence of such a reliable pipeline of infrastructure works in the last decade has meant that the ability to plan efficiently for future work has been materially reduced. The optimal allocation of both human and financial resources for each project is unlikely in an environment where project planning and procurement is sporadic. Poorly sequenced projects can also lead to sub-optimal outcomes on a national level.
Current processes for the procurement of new infrastructure are seen as challenging by many industry players. The cost of tendering remains high in Australia, primarily driven by design costs, which can account for roughly 50 per cent of total ‘bid’ costs.115 These costs are driven by certain government procurers requiring significantly more project development work by bidders than is required elsewhere in the developed world.
Action needs to be taken by governments to make major project procurement more efficient. This includes implementation of best practice in procurement, for example:
■ designing procurement to align with market capability, capacity and appetite;
■ undertaking comprehensive procurement planning in consultation with the market, and communication of accurate and sufficient project and procurement details;
■ minimising requirements for non-material documentation; and
■ establishing appropriate time metrics for procurement processes.116
114. Productivity Commission (2014a) 115. Productivity Commission (2014a), pp. 452-453 116. Infrastructure Australia (2012d), p. 31

54 Australian Infrastructure Audit Report
Other issues with current procurement processes have included: overlapping and relatively time-consuming environmental assessment processes at the national and jurisdictional levels that add to costs; and uncertainty and, in some cases, unreasonable conditions of approval adding to costs of providing infrastructure.
Barriers to competition and efficiency also exist in the procurement of Public Private Partnership (PPP) projects in Australia.117 The following barriers to competition in PPP procurement have been identified:
■ a limited pipeline of projects that is uneven in nature;
■ a perceived lack of consistent commitment to PPPs across all Australian jurisdictions;
■ the magnitude of bid costs; and
■ a lack of coordination of the timing of projects coming to market across states and territories.
The Productivity Commission has made the following recommendations to lower these barriers:
■ announcement of potential future PPP projects as early as possible;
■ more consistent and rigorous application of the National PPP Guidelines on the criteria for determining whether PPP procurement is appropriate for a project;
■ continued commitment and leadership from politicians and senior officials;
■ continued focus on improving national coordination of the release of projects to the market;
■ eliminating the requirement for information that is neither required to evaluate bids nor required for certainty at contractual close;
■ recruitment, development and retention of experienced, high quality, government project team members;
■ ensuring governance structures empower the project team to deliver the project while enabling effective and efficient decision making; and
■ using more than one bid stage only when absolutely necessary, such as when market conditions have changed or when no bidder has made an acceptable proposal.118
Infrastructure Australia will make recommendations on the delivery of a more comprehensive future pipeline of nationally significant projects as part of the up-coming Australian Infrastructure Plan.
Auditfinding33. Australia would benefit from a strong
and consistent pipeline of future infrastructure projects. Without this, there is uncertainty and less likelihood of a well-resourced environment for project procurement. The effectiveness and cost of current procurement processes in some jurisdictions are also an ongoing concern.
4.4.3 Management of construction Beyond measures related to the development of a skilled labour force and streamlining of procurement and environmental assessment processes, other opportunities to reduce the cost of construction will need to be explored.
Constant attention should be given to building practices and workplace arrangements that allow infrastructure to be developed in a more efficient manner. Comparison of building costs between different jurisdictions or sectors may offer assistance here.
Infrastructure Australia has also previously suggested that there is merit in encouraging public debate about the trade-offs of allowing projects to be constructed for longer periods during the day and in a manner where contractors could gain extended access to worksites. This is especially when projects involve retrofitting of infrastructure in existing corridors or locations. The productivity benefits, both in terms of cost reductions and early delivery of projects, could be substantial.
Additional local impacts during construction could be managed in a manner that minimises potential disruption from longer construction hours. These could be designed to enable the local communities that bear some of the additional disruption from extended construction hours to share in some of the benefits arising from the more efficient construction methods.119
Auditfinding34. Governments, industry and the
community should ensure there is a continuous focus on reducing construction costs, and promoting modern building practices.
117. KPMG (2010), p. 24 118. Productivity Commission (2014a). The National PPP Guidelines are available at http://www.infrastructureaustralia.gov.au/public_private/ 119. Infrastructure Australia (2012d), pp. 23-24
Australian Infrastructure Audit Report 55

56 Australian Infrastructure Audit Report
Social and sustainability considerations
Key Points ■ Infrastructure is fundamental to improving the social and environmental outcomes of Australians. Providing access to services will become increasingly important as the average age of the population increases and the housing supply in urban centres becomes increasingly dispersed due to population growth.
■ Regional areas and remote Indigenous communities often lack essential infrastructure, with service provision generally of a poorer standard than in urban centres. This disparity can reinforce social and economic inequalities, and presents a significant challenge for governments to overcome.
■ Climate change is likely to have considerable impacts on infrastructure assets as the frequency of extreme weather events increases. It is important that infrastructure in Australia is resilient in order to minimise the economic and social impacts of climate change.
■ Infrastructure-related emissions accounted for approximately half of Australia’s total greenhouse gas inventory in the year to September 2014. Reducing the environmental impact of infrastructure will require coordinated long-term planning between governments and service providers.
Australians aim to maintain and enhance their quality of life on a number of fronts. This involves more than just economic considerations. Improving social and environmental outcomes are also a part of our aspirations.
Infrastructure decisions need to support those aspirations, as well as economic ones.
This chapter addresses a number of social and environmental issues, and their implications for infrastructure decision making.
5.1 Social considerationsInfrastructure is essential for providing people with access to economic and social opportunities. The level of service provided varies across the country, both within cities and between cities and
regions. Arrangements also vary across the sectors. For example, there are explicitly different service standards in telecommunications, and not in other sectors.
Infrastructure availability, affordability and accessibility are likely to be key issues as the non-working proportion of the population increases.
5.1.1 Ageing of the populationAs the average age of Australians increases, we will need to address a range of related issues, including infrastructure provision.
The number of people aged 65 or older is projected to increase by 77 per cent between 2012 and 2031, from 3.2 million to 5.7 million. The population as a whole is set to grow by 34 per cent over the same period. Consequently,

Australian Infrastructure Audit Report 57
the ratio of those aged 18 to 64 (i.e. working age) to those aged 65 and older is projected to drop from 4.5 in 2012 to 3.2 in 2031.120
The Australian Government’s 2015 Intergenerational Report forecasts that the average
age of the population will increase over the next 40 years. Figure 16 illustrates how the ageing of the population will cause a dramatic increase in the number of Australians over the age of 65 by 2054–55.121
Figure 16: Proportion of the Australian population by age group as a share of total population – 2014–15 and 2054–55
5
6
7
8
4
3
2
1
0
0–4
5–9
10–1
4
15–1
9
20–2
4
25–2
9
30–3
4
35–3
9
40–4
4
45–4
9
50–5
4
55–5
9
60–6
4
65–6
9
70–7
4
75–7
9
80–8
4
85–8
9
90–9
4
95–9
9
100+
2014–15 2054–55
Per cent
Source: Australian Government (2015a)
5120. Australian Bureau of Statistics (2013c) 121. Australian Government (2015a)

58 Australian Infrastructure Audit Report
The ageing of our population will influence infrastructure planning. It is likely to result in more households in retirement and on fixed incomes, which has implications for capacity to pay at a time of slowing growth in the revenue base for government services. It may also lead to an increasing demand for public transport, if older Australians give up their driving licences.
We will need to consider how to ensure access to public transport, particularly for those who do not live near major transport hubs and face limited mobility. There is also a challenge in helping older people understand and use information available via modern communications, including transport information that will help people move around.
5.1.2 Access to servicesInfrastructure is important for providing Australians with the means to go about their lives and participate in society. Differences in the level of service provided by our infrastructure networks therefore have an impact on the opportunities available to individuals.
These service differences reflect important, yet difficult, questions around what society considers an appropriate level of universal service provision, and how this should be funded. This is a particularly challenging debate in relation to the servicing of more remote areas, where the costs of providing a service are typically higher than providing the same service level in towns and cities, and where the number of potential users is likely to be small.
Funding the provision of infrastructure to meet a prescribed level of service is a similarly challenging question, and one where there is unlikely to be universal agreement. Across the country, these issues have their most notable expression in outer suburban areas and in remote communities.
Outer metropolitan areas often have limited public transport systems and comparatively few local jobs. As a result, those living in outer suburban areas commonly face longer journeys to work, and higher transport costs. Families on lower incomes often have few, if any, practical options other than to use their cars for transport.
Auditfinding35. Access to transport remains a critical
social equity consideration, particularly for the outer suburbs of Australia’s cities and most parts of regional Australia. These areas generally have an undersupply of transport services (especially public transport) and of local employment options.
The difference in level of service delivered by various infrastructure providers is an important area of public policy consideration, one which will be assisted by efforts to agree upon and publish the desired (and actual) service levels within each sector.
Minimum service levels have recently been set in the telecommunications sector. The Statement of Expectations issued to the NBN Co in April 2014122 sets a service level requirement of a download speed of at least 25 megabits per second to all premises, and at least 50 megabits per second to 90 per cent of fixed line premises, as soon as possible.
There are similar issues around the acceptable cost, standard and reliability of services for water and electricity provision. Advances in technology are changing how these questions are addressed. For example, the option of communities going ‘off the grid’ for electricity generation is becoming more viable, and may be the most efficient way to provide this service for some remote communities.
These changing factors are part of a debate around the trade-off between equity of access to infrastructure and how to pay for it.
Auditfindings36. Telecommunications have become a
highly important part of people’s lives, for social as well as economic reasons. The National Broadband Network (NBN) is expected to materially improve service levels and the ability of households in rural and remote regions to connect with their wider social networks.
37. Following completion of the NBN roll-out, governments will still need to consider what steps are required to provide appropriate and equitable services in rural and urban telecommunications services.
122. NBN Co (2014)

Australian Infrastructure Audit Report 59
5.1.3 Infrastructure for remote Indigenous communitiesApproximately 91,600 Aboriginal and Torres Strait Islander people (or 13.7 per cent of the Indigenous population) live in areas classified by the Australian Bureau of Statistics (ABS) as ‘very remote’. A further 51,300 Indigenous people (6.7 per cent of the Indigenous population) live in areas classified as ‘remote’.123
Most of these people live in the NT (40,100 people in very remote areas and 14,800 people in remote areas), Queensland (22,700 and 13,200 people respectively) and WA (20,500 and 15,000 people respectively). NSW (3,400 and 6,100 people respectively) and SA (4,800 and 1,600 respectively) also have a sizeable number of Indigenous people living in very remote and remote areas.
There are around 1,200 remote communities in Australia.124 Many lack even basic infrastructure such as reasonable road access, clean water supplies and wastewater services. In November 2014, the WA Government announced its intention to close between 100 and 150 of the 274 remote communities in WA, largely due to the high costs of service provision to people in these areas.
Providing remote Indigenous communities with infrastructure services at a level consistent with other communities of a similar size and location is essential to the broader aims of the Council of Australian Governments’ (COAG) 2008 Closing the Gap in Indigenous Disadvantage initiative. Progress in improving social outcomes such as health, education and employment relies on the ability of Indigenous communities to access services and economic opportunities and to build stronger links with the rest of Australia.
Infrastructure Australia has previously argued that Indigenous communities should have similar access to infrastructure as non-Indigenous communities of comparable size and location.125
The Australian Government’s Closing the Gap: Prime Minister’s Report 2015 revealed that many of the key health, education and employment indicators of Indigenous disadvantage have failed to meet the benchmarks set by COAG.126 Providing essential infrastructure services to remote Indigenous communities will be fundamental to moving closer to achieving these Closing the Gap aspirations.
Disparity between cities and remote Indigenous communities in the provision of services is driven by several geographic, economic and social factors, including:
■ low population densities in remote communities, resulting in high per capita construction and maintenance costs for infrastructure relative to urban and regional markets;
■ isolated locations and poor road conditions, which cause difficulties in accessing infrastructure for maintenance and upgrades;
■ high demand for contractors and tradespeople over highly dispersed areas, which leads to shortages in available construction and maintenance services; and
■ the need for highly resilient infrastructure components to withstand often extreme temperatures and weather events in remote locations increases costs.
A large number of Indigenous-specific and mainstream funding and support programs serve the Indigenous community.127 Poor governance structures in the delivery of essential infrastructure services often result in a duplication of services and a lack of coordination across agencies. Funding processes for services must be streamlined and targeted to deliver the greatest benefits to communities.
Where feasible, individual communities should play a central role in determining their infrastructure priorities. Local Indigenous people should be engaged to deliver those services, in order to bring about sustainable developments in infrastructure provision for Indigenous people in remote areas.
Improving infrastructure services in remote Indigenous communities requires clarity of leadership by governments, with recognition of not only the importance of addressing the issue, but also the scale of resources required to achieve meaningful and sustainable changes.
123. Australian Bureau of Statistics (2013a) 124. Australian National University Centre for Aboriginal Economic Policy Research (2007) 125. Infrastructure Australia (2012c), p. 70 126. Australian Government (2015b) 127. Department of Finance and Deregulation (2010) found there were 235 programs at the time.

60 Australian Infrastructure Audit Report
5.1.4 Housing Housing supply and affordability are likely to remain material public policy issues for many years. Both issues have been examined by parliamentary enquiries over recent years, including enquiries by the Senate Economic References Committee and the NSW Legislative Council.128
Although the decades-long decline in average household sizes has turned around slightly since 2001,129 there is continuing concern that the supply of housing has not been growing in line with demand.130
These pressures are likely to continue for some time. As noted elsewhere in this report, Australia’s population, especially in its larger cities, is expected to grow appreciably over the next several decades. This will drive demand for housing.
Recent work undertaken for the Australian Treasury suggests that, depending on the population projection, somewhere between 4.4 and 5.9 million additional dwellings will be required nationally between 2011 and 2041.131 On the medium population projections used in the analysis for Treasury (which are close to the projections subsequently issued by the ABS and being used in this Audit), Australia will require approximately 5.4 million additional dwellings to 2041.
Most of these new dwellings will be required in the cities. The current plans of the state and territory governments focus on meeting much of this dwelling demand through infill development in the established parts of their cities.
Urban consolidation can offer lower costs and lower environmental impacts than urban fringe development. A 2010 study by the Centre for International Economics132 found that the resource costs of providing infrastructure associated with urban infill development are seven to 12 per cent lower than on the urban fringes.
Subsequent work has found that different patterns of infill development in Sydney (focusing on centres versus dispersed infill development) could yield different economic costs and benefits. Concentrating development around key centres was found to offer higher net benefits than other patterns of infill development.133
Infrastructure will play a crucial role in meeting the demand for affordable and denser development. A study of transport and housing issues in Sydney and Melbourne commissioned by the former National Housing Supply Council found that:
■ investment in transport infrastructure can galvanise apartment activity in a location, but the infrastructure in question needs to be of sufficient scale and scope to substantially boost an area’s linkages to major employment nodes. More minor transport upgrades which improve localised circulation are less likely to substantially lift apartment activity;
■ correctly targeted ‘city shaping’ transport infrastructure can effectively boost the supply of housing land within existing urban footprints, by raising the intensity of its use. Such expansion in effective land supply for housing can place downward pressure on housing prices; and
■ optimising the housing benefits from major transport investments requires a suite of supportive policies including development assessment reforms, active involvement of public sector development corporations, various forms of land value capture and mechanisms to ensure that areas undergoing intensification maintain a reasonable supply of affordable housing.134
Ongoing opposition to redevelopment around key nodes in urban areas is likely to continue to constrain housing supply in areas close to jobs and public transport. The reasons for local opposition are likely to be varied and cover a range of issues, including concerns about perceived amenity impacts, concerns about the adequacy of local infrastructure to cope with additional demand, and broader social issues.
Governments will need to work with local communities and the development sector to address these issues. Without focused attention, there are likely to be:
■ significant implications for housing supply and affordability; and
■ risks that the economic and social returns from investment in new projects will be undermined, e.g. if the housing projections on which the business case for a project is based are not realised.
128. For details see Senate Economics Reference Committee (2015) and NSW Legislative Council (2014). 129. National Housing Supply Council (2014). Although published on the Australian Treasury website, Treasury has pointed out that the report reflects the views of the National Housing Supply Council only. 130. Australian Associated Press (2014) 131. McDonald, P. and Temple, J. (2013) 132. Centre for International Economics (2010) 133. Centre for International Economics (2012) 134. SGS Economics and Planning (2013)

Australian Infrastructure Audit Report 61
5.1.5 Social implications of infrastructure chargesConcerns about the cost of living remain an important area of social policy. They feature in public debate about how services provided by governments and others are paid for.
In recent years, infrastructure charges and funding arrangements have often generated public and media discussion as to the affordability and fairness of such charges. Examples include:
■ extensive public and government discussion about the impact of electricity price rises;
■ decisions by some governments to place a cap on water charges as a means of dealing with cost of living pressures;
■ concerns that opening up east coast gas fields for export will drive up domestic gas prices, and associated calls for a domestic reservations policy;
■ some jurisdictions opposing the use of road tolls, partly on the grounds that tolls have an adverse impact on some households; and
■ nervousness among many governments about raising the possibility of some broader form of road user charging.
For some households, infrastructure-related charges represent a significant proportion of household spending. As a greater proportion of the Australian working population moves into retirement, it is likely that more Australians will move to lower fixed incomes. This could lead to increased financial pressures on households on fixed incomes, and in turn raise questions about the efficacy of user charging as a mechanism for funding infrastructure.
To examine the impact of increased infrastructure expenditure on households, the Audit considered three scenarios:
■ low growth – user charges increase in line with long-term historic trends (0.6 per cent per year real increase in charges);
■ medium growth – user charges increase at a moderate rate (1.8 per cent per year real increase); and
■ high growth – user charges grow at a high rate (3.5 per cent per year real increase).
Average weekly household expenditure on infrastructure-related charges is currently around $214 including fuel costs and costs for ‘other motor vehicle services’, or $122 per week excluding those costs. This is projected to increase to $240 by 2030 (in real terms) under the low growth scenario. Under the medium growth scenario, average weekly household infrastructure expenditure rises to $294 per week, and under the high growth scenario, it rises to $381 per week.
Under the medium and high growth scenarios the increase is expected to be driven primarily by higher user charges for energy and motor vehicle expenditure (in absolute terms) and water (in relative terms). These increases are expected to be higher in Sydney, Melbourne and Adelaide, due to relatively higher projected increases in water and energy user charges in those cities.
Increases in user charges will have flow-on impacts on public finance through state governments’ concession arrangements. Concession payments could increase from $11 billion in 2015 to between $17 billion and $31 billion in 2031. In effect, a portion of the additional revenue derived from increased user charges would need to flow back into increased concession payments.
Most jurisdictions have an ombudsman or similar agency that assists households and users in managing service-related issues, including assisting people experiencing problems in paying charges. Typically, such agencies in the energy and water sectors handle billing and payment issues.
Table 4: Average weekly household infrastructure expenditure (2009-10 prices) – low growth scenario
2014 2031
Motor vehicle $92 43% $107 44%
Public transport $9 4% $10 4%
Energy $52 24% $71 30%
Telecommunications $49 23% $33 14%
Water $12 5% $19 8%
Total $214 100% $240 100%
Source: Ernest and Young (2014)
62 Australian Infrastructure Audit Report
Annual and other reports released by the ombudsmen indicate that:
■ the great majority of complaints and payment problems are associated with the electricity and gas sectors. The proportion of complaints and payment problems in the water sector is relatively small; and
■ across the jurisdictions, some are seeing a rise in credit cases while others are experiencing a fall in case numbers.135
The issue is seen by various stakeholders as being of national importance. In 2013, the Australian Energy Ombudsmen, Energy Retailers Association of Australia and the Australian Council of Social Service sponsored a ‘Roundtable’ of interested organisations. The purpose of the Roundtable was to:
… discuss practical energy affordability solutions for Australian consumers, in particular: how we respond to the increasing need for assistance for customers in the context of the recent energy price rises; how we deal with the reality of customers on low incomes who cannot afford the energy they need; and how we keep customers on low incomes connected to essential services.136
The Roundtable presented a range of recommendations to the then Standing Council on Energy and Resources,137 the inter-governmental forum for energy and resources ministers. The recommendations covered areas of government assistance and concessions, billing arrangements, means of promoting energy efficiency, and consumer education. The NSW Energy and Water Ombudsman’s annual report for 2013–14 indicates that energy affordability continues to be seen as a nation-wide issue, and that recommendations from the Roundtable are still being pursued.138
The affordability of infrastructure charges requires ongoing consideration by governments, both for equity and efficiency reasons.
On the one hand, governments face a significant funding challenge and need the private sector to invest in infrastructure. Private sector investment and well-regulated user charging assists in bringing service improvements and efficiencies to the delivery of infrastructure. However, the private sector will only invest if it can apply user charges that cover the full costs of operation (including the risks and a return on investment). This may cause some infrastructure charges to rise.
Independent of any shift in infrastructure funding arrangements from government funding to user
charging, user charges may rise for other reasons. These include dealing with maintenance backlogs, and/or raising existing charges to the point where they more closely reflect the full cost of providing the service.
On the other hand, a proportion of the population is likely to struggle to pay higher charges. A large number of people will be moving into retirement. Many of these people will be on fixed and/or modest incomes.
The country needs a mechanism to deal with this conundrum (i.e. how to encourage a wider application of user charging for funding and efficiency reasons) while addressing the impacts on particular parts of the community. If this is not addressed, the case for pricing reform − and consequently the opportunity for the private sector to invest in and provide the infrastructure Australia requires − will be strongly contested.
Auditfinding38. Dealing equitably with the affordability
of infrastructure services is an important consideration, as a matter of social policy. Unless affordability concerns are addressed, the necessary shift to greater application of user charging will struggle to gain community and political support.
What stands out from the analysis outlined above is the need for governments to consider carefully how to deal with the distributional implications of rising infrastructure charges, particularly for those on low household incomes.
Where the burden on lower income households is considered unreasonable, governments should recognise that the tax and welfare systems are likely to be significantly more efficient in fairly catering for such burdens than adjustments at the individual infrastructure asset or utility level.
Auditfinding39. Households with incomes in the lowest
20 per cent are the most exposed to the monetary costs of inefficient economic infrastructure. Public policy settings need to assist Australians on low incomes to access the infrastructure services they need, in an equitable manner.
135. See for example Energy and Water Ombudsman Victoria (2015); Energy and Water Ombudsman Western Australia; and Energy and Water Ombudsman Queensland (2014). On the other hand, media reports suggest an increase in the number of customers having their energy services disconnected in Victoria. The Essential Services Commission has been asked by the Victorian Government to investigate arrangements where services are to be disconnected. 136. Australian Energy Ombudsmen, Energy Retailers Association of Australia and Australian Council of Social Service (2013) 137. Now known as the Council of Australian Governments Energy Council 138. Energy and Water Ombudsman NSW (2014)

Australian Infrastructure Audit Report 63
5.2 Sustainability considerationsThe way in which infrastructure is planned, developed, managed and operated can have a significant impact on the environment.
Australia’s infrastructure networks both affect, and are affected by, the environment. The impacts range from global to local level concerns. Global concerns include the need both to mitigate and adapt to climate change, and the need to protect threatened species covered by international agreements. Local level concerns include the impact of infrastructure projects on local water supplies, noise levels and air quality.
5.2.1 Planning for climate changeAdapting to climate change and pursuing sustainable environmental outcomes is a core responsibility of infrastructure planners, owners and operators. Meteorological and other evidence shows that the world’s climate is changing due to man-made emissions of greenhouse gases, so transitioning to a lower emissions economy will be a priority task.
Organisation for Economic Cooperation and Development (OECD) modelling indicates that climate change may have a detrimental impact on future GDP growth. Figure 17 shows that annual GDP losses of between 0.7 and 2.5 per cent globally could be expected by 2060, with the greatest detrimental impact from decreased agricultural productivity and rising sea levels.
Figure 17: Climate change impact on global GDP based on temperature rise of 1.5°C to 4.5°C – 2010 to 2060
0.0
-0.5
-1.0
-1.5
-2.0
-2.5
-3.0
Perc
enta
ge c
hang
e in
GD
P
Central projection
High projection (4.5ºC)
Low projection (1.5ºC)
Likely uncertainty rangeequilibrium sensitivity
2010
2012
2014
2016
2018
2020
2022
2024
2026
2028
2030
2032
2034
2036
2038
2040
2042
2044
2046
2048
2050
2052
2054
2056
2058
2060
Source: Organisation for Economic Cooperation and Development (2015d)
The State of the Climate 2014 report by the CSIRO and the Bureau of Meteorology found that, compared to the period between 1980 and 1999, Australian temperatures are projected to increase by:
■ between 0.6 and 1.5°C by 2030;
■ 1.0 to 2.5°C by 2070 (for a low emission scenario); and
■ 2.0 to 5.0°C by 2070 (for a high emission scenario).139
The report finds that average rainfall in southern Australia is projected to decrease, and droughts in southern Australia are projected to become
more severe. Annual average rainfall projections in northern Australia are less certain. Although less rainfall is expected overall, the number and intensity of extreme rainfall events is projected to increase over most parts of Australia.
Auditfinding40. Adapting to climate change and pursuing
sustainable environmental outcomes is a core responsibility of infrastructure planners, owners and operators.
139. CSIRO and Bureau of Meteorology (2014)

64 Australian Infrastructure Audit Report
As illustrated by Figure 18, rainfall during the southern wet season – measured from April to November each year – was the lowest on record for parts of the southwest of WA and Southeast Australia over the period from 1996 to 2014. Much of Northern Australia experienced record
high rainfalls. Figure 19 shows the recorded rainfall during the Northern wet season – measured from October to April – from 1995–96 to 2013–14. Figure 20 provides details of the likely outcomes of climate change, as projected by the Bureau of Meteorology and CSIRO.
Figure 18: Rainfall during the Southern wet season – 1996 to 2014
Source: CSIRO and Bureau of Meteorology (2014)
Figure 19: Rainfall during Northern wet season – 1995–96 to 2013–14
Source: CSIRO and Bureau of Meteorology (2014)
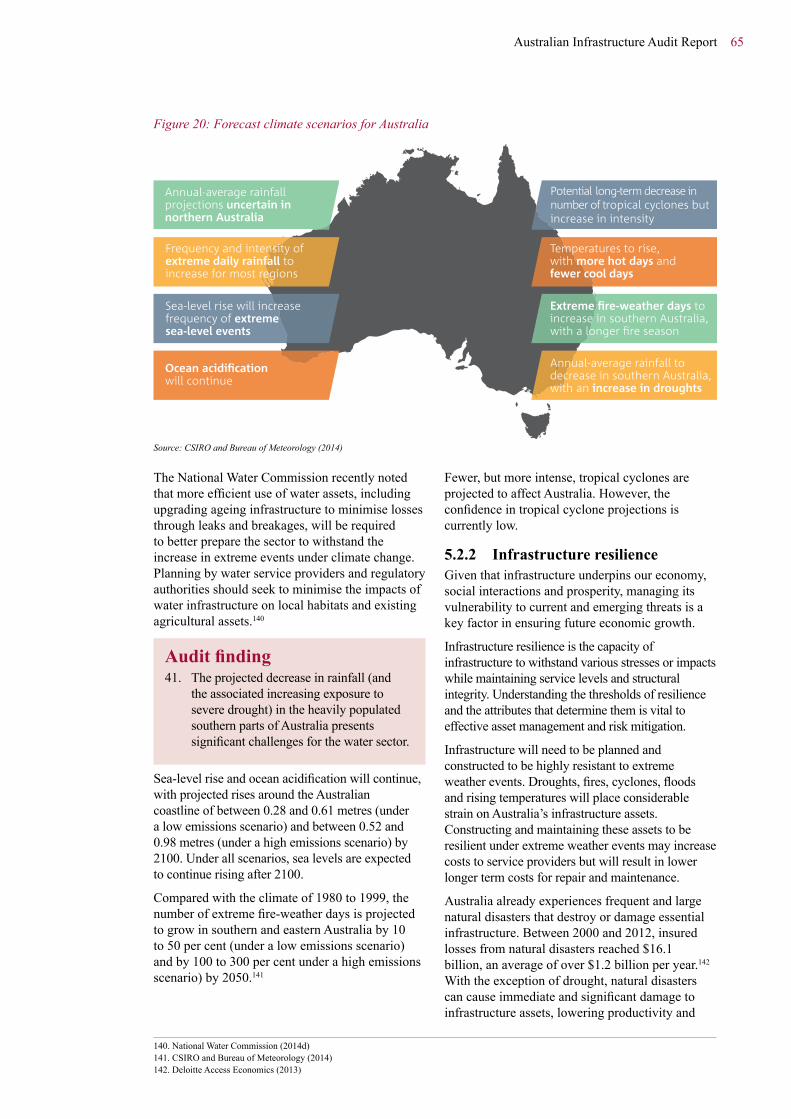
Australian Infrastructure Audit Report 65
Figure 20: Forecast climate scenarios for Australia
Source: CSIRO and Bureau of Meteorology (2014)
The National Water Commission recently noted that more efficient use of water assets, including upgrading ageing infrastructure to minimise losses through leaks and breakages, will be required to better prepare the sector to withstand the increase in extreme events under climate change. Planning by water service providers and regulatory authorities should seek to minimise the impacts of water infrastructure on local habitats and existing agricultural assets.140
Auditfinding41. The projected decrease in rainfall (and
the associated increasing exposure to severe drought) in the heavily populated southern parts of Australia presents significant challenges for the water sector.
Sea-level rise and ocean acidification will continue, with projected rises around the Australian coastline of between 0.28 and 0.61 metres (under a low emissions scenario) and between 0.52 and 0.98 metres (under a high emissions scenario) by 2100. Under all scenarios, sea levels are expected to continue rising after 2100.
Compared with the climate of 1980 to 1999, the number of extreme fire-weather days is projected to grow in southern and eastern Australia by 10 to 50 per cent (under a low emissions scenario) and by 100 to 300 per cent under a high emissions scenario) by 2050.141
Fewer, but more intense, tropical cyclones are projected to affect Australia. However, the confidence in tropical cyclone projections is currently low.
5.2.2 Infrastructure resilienceGiven that infrastructure underpins our economy, social interactions and prosperity, managing its vulnerability to current and emerging threats is a key factor in ensuring future economic growth.
Infrastructure resilience is the capacity of infrastructure to withstand various stresses or impacts while maintaining service levels and structural integrity. Understanding the thresholds of resilience and the attributes that determine them is vital to effective asset management and risk mitigation.
Infrastructure will need to be planned and constructed to be highly resistant to extreme weather events. Droughts, fires, cyclones, floods and rising temperatures will place considerable strain on Australia’s infrastructure assets. Constructing and maintaining these assets to be resilient under extreme weather events may increase costs to service providers but will result in lower longer term costs for repair and maintenance.
Australia already experiences frequent and large natural disasters that destroy or damage essential infrastructure. Between 2000 and 2012, insured losses from natural disasters reached $16.1 billion, an average of over $1.2 billion per year.142 With the exception of drought, natural disasters can cause immediate and significant damage to infrastructure assets, lowering productivity and
140. National Water Commission (2014d) 141. CSIRO and Bureau of Meteorology (2014) 142. Deloitte Access Economics (2013)

66 Australian Infrastructure Audit Report
output. The estimated damage from the 2011 Queensland floods to public infrastructure was $5-6 billion.143 Among other impacts, damage to mines cost $2 billion in lost coal production and $9 billion in real output. This translated to an estimated half a percentage point loss of real GDP in 2011.144 Agricultural prices also increased, adding half a percentage point to inflation over the March and June quarters of 2011.
In a report for the Australian Business Roundtable for Disaster Resilience and Safer Communities, Deloitte Access Economics estimates that the annual cost of natural disasters in real terms will reach $23 billion by 2050, and advises that if funding were prioritised for pre-disaster mitigation (increasing resilience) the effect would likely reduce the future costs of post-disaster relief and recovery by 50 per cent by 2050.
Auditfinding42. The number and intensity of extreme
weather events is increasingly likely to threaten certain infrastructure assets. Repairing these assets, and enhancing their resilience, will require an increase in maintenance expenditure.
The resilience of infrastructure assets will be crucial to supporting recovery efforts from extreme weather events. Transport access, power and water are essential to emergency services in responding to the effects of extreme weather events and repairing damage to communities. Communities rely on essential services to restore activity in disaster-affected areas, so resilient infrastructure can minimise the economic impacts of extreme weather events.
Most infrastructure is intended to last for decades and is designed to withstand the weather events expected for its location. These weather expectations are based on historic climate conditions. However, increasingly intense extreme weather events are likely to exceed infrastructure design standards, reducing resilience thresholds.145
The global response to climate change is likely to see an increasing number of countries commit to reduction targets for greenhouse gas emissions, following recent commitments by the EU, US and China. Targeted and sustained emissions reduction policies, including market-based and complementary measures, are likely to be implemented.
Infrastructure construction and operation accounts for a significant amount of Australia’s total greenhouse gas inventory (mainly from the energy and transport sectors). Decisions that affect Australia’s infrastructure, including decisions about urban development and land use, will have an impact on Australia’s ability to reduce its emissions and contribute to global greenhouse gas reduction efforts. The potential of projects to reduce greenhouse gas impacts may become an important consideration in planning and designing future infrastructure.
Auditfinding43. Infrastructure operations can be
disrupted by a range of hazards, including natural disasters. Ensuring infrastructure is able to continue operating through minor disruptions, and recover quickly from major disruptions, will be critical.
5.2.3 Reducing the impact of infrastructureInfrastructure-related emissions accounted for half of Australia’s total greenhouse gas inventory in the year to September 2014, mainly from the electricity sector (33 per cent) and transport sector (17 per cent).146 Transport emissions have grown by 51 per cent since 1989–90, faster than any other sector. The 2012 NSW Long Term Transport Master Plan found that emissions from vehicles in Sydney will increase by almost 50 per cent over the period 2011 to 2031 under a ‘do nothing’ scenario.147
Auditfinding44. Infrastructure-related emissions
accounted for approximately half of Australia’s total greenhouse gas inventory in the year to September 2014, mainly from the electricity sector (33 per cent) and transport sector (17 per cent).
Findings such as these highlight how important it is for infrastructure policy-making and decisions to incorporate environmental considerations, including Australia’s need to reduce its greenhouse gas emissions.
143. PricewaterhouseCoopers (2011) 144. Australian Government (2011) 145. Intergovernmental Panel on Climate Change (2013) 146. Department of the Environment (2015) 147. Transport for New South Wales (2012), p.105

Australian Infrastructure Audit Report 67
Targeted and sustained emissions reduction policies, including market-based and complementary measures, are likely to be implemented internationally. Future emissions reduction targets are to be debated at a meeting of the parties to the United Nations Framework Convention on Climate Change in Paris at the end of 2015. Following recent commitments by the European Union, US and China, there is some suggestion that prospects are increasing for a new binding round of emissions targets to be reached at that meeting.
Commitments to emissions reduction targets will impact emissions-intensive industries such as energy production and freight transport. Policies to support the ongoing competitiveness of these industries may be required as Australia seeks to reduce its emissions over the long-term.
Using existing infrastructure more efficiently is a critical consideration when planning for the increased capacity of infrastructure required to support economic and population growth. Initiatives that enhance the productivity of existing assets with minimal additional construction will reduce the marginal costs to the environment of providing an infrastructure service.
Long-term infrastructure planning can, for instance, allow governments to protect corridors for future surface transport projects, which can minimise the need for tunnelling and allow for more efficient route selection. Resources and costs can be minimised for the construction, maintenance and operation of these assets.
The Western Australian Planning Commission’s Infrastructure Coordinating Committee148 found that effective corridor selection can minimise the impact of infrastructure on surrounding habitats, reduce noise impacts on local communities and prevent the need for locating exhaust stacks near residential areas. Greater coordination of infrastructure, environmental and planning
agencies is required to ensure corridors are identified and protected as part of a long-term strategy that balances economic and environmental considerations.
Growth in telecommuting is another example of where environmental benefits can potentially be gained through a reduction in demand for infrastructure services. Deloitte Access Economics notes that by expanding rates of teleworking substantial benefits can accrue to individuals, businesses and wider society. Reducing demand for transport infrastructure by commuters can reduce the overall carbon footprint and allow governments to delay or avoid expenditure on infrastructure construction and maintenance costs.149
Decisions within the infrastructure sector will have an impact on Australia’s ability to reduce its emissions and contribute to global greenhouse gas reduction efforts. Potential carbon reduction impacts are likely to become an increasingly important consideration in planning, design and operational forecasting when factoring the cost/risk of infrastructure projects.
Auditfinding45. Transitioning to a lower emissions
economy will require full consideration of reducing greenhouse gas emissions when infrastructure plans, construction methods and operational frameworks are being determined.
148. Western Australian Planning Commission Infrastructure Coordinating Committee (2014) 149. Deloitte Access Economics (2011a)

68 Australian Infrastructure Audit Report
Infrastructure maintenanceMost of the economic and social contribution that will be required of Australia’s infrastructure between now and 2031 will have to come from existing infrastructure. Put another way, most of the infrastructure that Australians will use in 2031 has already been built.
At a minimum, our current infrastructure networks will need to support current levels of service. In many cases, they will need to deliver higher levels of service, and meet greater demand. This will only be possible if our infrastructure is properly maintained.
The Audit has assessed, at a high level, the maintenance regimes for each of the infrastructure sectors. This assessment shows that several sectors have appropriate systems in place to ensure infrastructure is properly maintained. However, in other sectors − particularly those more heavily dependent on government funding rather than user charging − maintenance regimes either are, or could become, inadequate.
It is clear that public policy settings need to ensure funding of infrastructure is focused on sustaining and protecting existing assets, just as much as it focuses on building new ones.
Underfunding of maintenance compromises the capacity of the infrastructure to deliver current and improved levels of service in the future. Moreover, underfunding of maintenance in the short to medium-term is likely to create larger and more difficult problems in the longer term.
The assessment also shows that maintaining infrastructure in rural and remote locations is generally more challenging than in the capital cities and larger regional centres.
A brief summary of the Audit’s analysis of maintenance issues in each sector is set out below. More detail is available in a separate Audit research report on infrastructure maintenance.150
6.1 Transport6.1.1 RoadsThe most economically significant roads are the national highways and major state arterial roads. These roads have high traffic volumes, and handle large numbers of trucks and other commercial vehicles. There is evidence of a maintenance deficit across many of these roads in all jurisdictions.
In October 2014 the Australian Government and the state and territory governments entered into National Partnership Agreements151 that:
■ recognise that, although certain national highways are owned by the states and territories, their maintenance ‘is a joint responsibility and that road maintenance funding is required from both the Commonwealth and the states’;
■ provide for Australian Government funding to the jurisdictions to be distributed on a formula basis that has regard to road lane length,
150. GHD (2014) 151. Department of Infrastructure and Regional Development (2014c). The highways covered by the National Partnership Agreements are a subset of the highways considered in the Audit.

Australian Infrastructure Audit Report 69
total traffic volumes and heavy vehicle traffic volumes for non-tolled roads. Funding levels for 2014–15 to 2018–19 are shown in Table 5; and
■ preserve the existing state/territory responsibility for maintaining the relevant highways so that their condition is at least what it was in July 2013.152
Individual states and territories have periodically suggested that additional funding is required to maintain the roads in question to the required standard. This is an area that requires ongoing attention, both to avoid cost-shifting between
different levels of government, and to minimise the possibility that maintenance funding for other roads is being reduced in order to fund contributions to maintenance of the agreed national highway network.
Most states and territories have ageing road and bridge assets that require rehabilitation and renewal in the near future to avoid:
■ significantly increased maintenance costs in the longer term; and/or
■ the imposition of service limits, e.g. weight and speed restrictions.
Table 5: Australian Government funding (2014–15 to 2018–19) for maintenance of highways on the defined National Land Transport Network ($ million)153
NSW VIC QLD SA WA TAS NT ACT Total
529.5 278.9 446.8 139.5 232.2 36.5 83.8 2.8 1,750.0
Source: Infrastructure Australia analysis of Department of Infrastructure and Regional Development (2014c) data
Some jurisdictions, notably the New South Wales Government (NSW), have established programs to address bridge maintenance. The Australian Government is also contributing funds to bridge repairs. However, the scale of the task is substantial, and will require ongoing investment.
All jurisdictions need to direct attention towards improving whole-of-life asset management processes, and to ensuring adequate long-term funding strategies are in place for the road sector.
Rural roads owned and operated by local councils are important for local economic activity, and are an important part of the nation’s transport network, providing the ‘first and/or last mile’ of many land-based supply chains. There is evidence of a maintenance deficit across many of these roads. This is a particular issue for local governments in rural areas with large road networks and declining income bases.154
6152. Department of Infrastructure and Regional Development (2014c) 153. Figures may not add up to the total due to rounding. 154. Allen Consulting Group (2009)
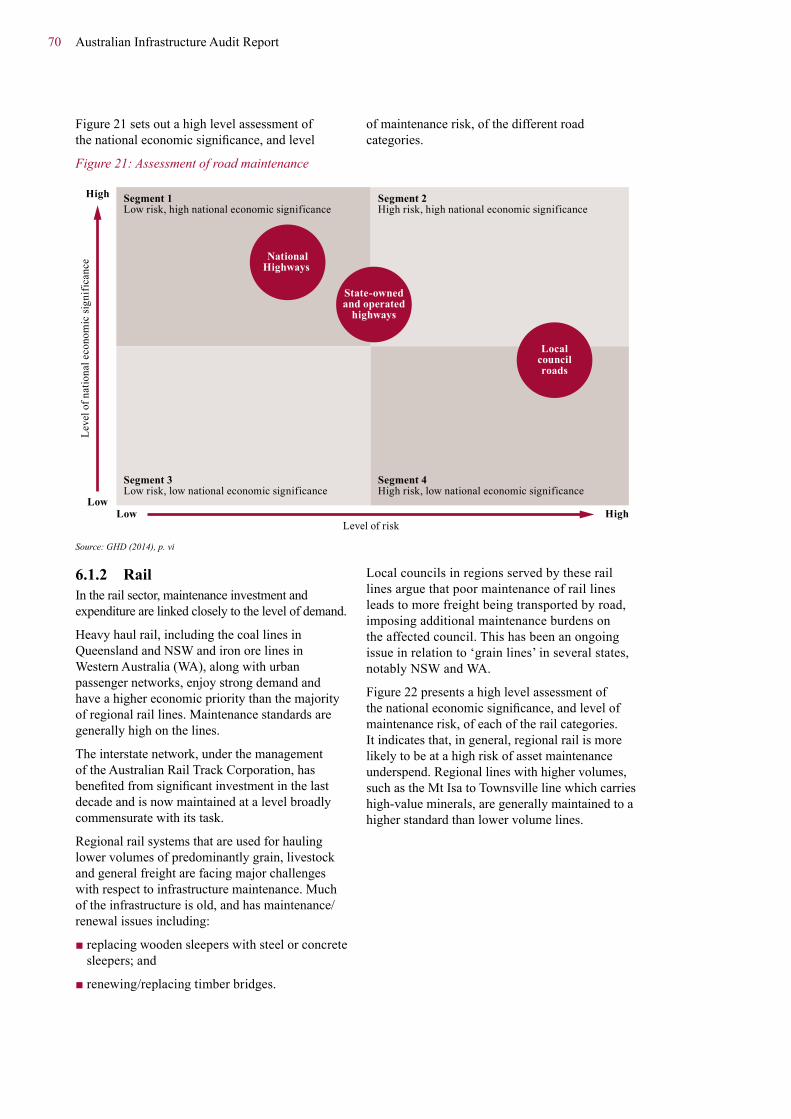
70 Australian Infrastructure Audit Report
Figure 21 sets out a high level assessment of the national economic significance, and level
of maintenance risk, of the different road categories.
Figure 21: Assessment of road maintenance
Segment 1Low risk, high national economic significance
Segment 2High risk, high national economic significance
Segment 3Low risk, low national economic significance
Segment 4High risk, low national economic significance
Low HighLevel of risk
NationalHighways
Localcouncilroads
Low
High
Leve
l of n
atio
nal e
cono
mic
sign
ific
ance
State-ownedand operated
highways
Source: GHD (2014), p. vi
6.1.2 RailIn the rail sector, maintenance investment and expenditure are linked closely to the level of demand.
Heavy haul rail, including the coal lines in Queensland and NSW and iron ore lines in Western Australia (WA), along with urban passenger networks, enjoy strong demand and have a higher economic priority than the majority of regional rail lines. Maintenance standards are generally high on the lines.
The interstate network, under the management of the Australian Rail Track Corporation, has benefited from significant investment in the last decade and is now maintained at a level broadly commensurate with its task.
Regional rail systems that are used for hauling lower volumes of predominantly grain, livestock and general freight are facing major challenges with respect to infrastructure maintenance. Much of the infrastructure is old, and has maintenance/renewal issues including:
■ replacing wooden sleepers with steel or concrete sleepers; and
■ renewing/replacing timber bridges.
Local councils in regions served by these rail lines argue that poor maintenance of rail lines leads to more freight being transported by road, imposing additional maintenance burdens on the affected council. This has been an ongoing issue in relation to ‘grain lines’ in several states, notably NSW and WA.
Figure 22 presents a high level assessment of the national economic significance, and level of maintenance risk, of each of the rail categories. It indicates that, in general, regional rail is more likely to be at a high risk of asset maintenance underspend. Regional lines with higher volumes, such as the Mt Isa to Townsville line which carries high-value minerals, are generally maintained to a higher standard than lower volume lines.

Australian Infrastructure Audit Report 71
Figure 22: Assessment of rail maintenance
Segment 1Low risk, high national economic significance
Segment 2High risk, high national economic significance
Segment 3Low risk, low national economic significance
Segment 4High risk, low national economic significance
Low HighLevel of risk
Heavy haulrail
Regionalrail
Low
HighLe
vel o
f nat
iona
l eco
nom
ic si
gnif
ican
ce
Urban rail
Interstaterail
Source: GHD (2014), p. vii
6.2 EnergyChanges in the cost and performance of renewable energy and battery technologies have the potential to drive a strategic shift in energy systems. This will raise material questions for regulation, operation and maintenance of these systems.
Climate change has the potential to affect both energy demand and use, and asset performance and reliability. Work is being undertaken by the Energy Networks Association to quantify the cost implications of climate change on the energy sector.
In remote areas of the Northern Territory (NT) and WA, there is evidence of a maintenance gap in the energy sector, and an increase in maintenance expenditure is likely to be required over coming years.
6.2.1 ElectricityThe National Electricity Market (NEM), which accounts for 90 per cent of the network and supplies 90 per cent of Australian customers, generally provides a high level of service, and there is little evidence of systemic asset maintenance underspend.
However, reduced electricity consumption and other factors have led to a surplus of generating capacity and a fall in wholesale electricity prices. In these circumstances, there is some debate as to whether coal-fired generators (in particular) may reduce their maintenance outlays as a means of
cutting operational expenses, thereby presenting some reliability risks to customers.155
Changing technologies in the energy sector have potentially far-reaching implications, including for the maintenance of electricity networks. At present, the focus of stakeholders in the sector appears to be on ensuring fair pricing structures that also allow uptake of these technologies. For example, the Council of Australian Governments (COAG) Energy Council has confirmed it is:
… ‘scenario testing’ the current regulatory provisions to ensure these are flexible and robust in light of emerging opportunities, new technologies, potentially changing customer expectations and declining demand. … The Council supports consumers’ right to take up new technologies, but recognises that this should not be on the basis of cross-subsidies from other end users. The Council therefore sees the importance of having the right balance between uptake of technology and efficient outcomes for consumers across the system as a whole.156
Some electricity consumers are choosing to go ‘off the grid’. The number of consumers in question appears to be quite small at present, but there is some commentary suggesting that the necessary technological changes may occur sooner than previously thought.157
155. Department of Industry and Science (2014a), p.35 156. Council of Australian Governments Energy Council (2014) 157. See for example Register, C. (2015) and Hannam, P. (2014)
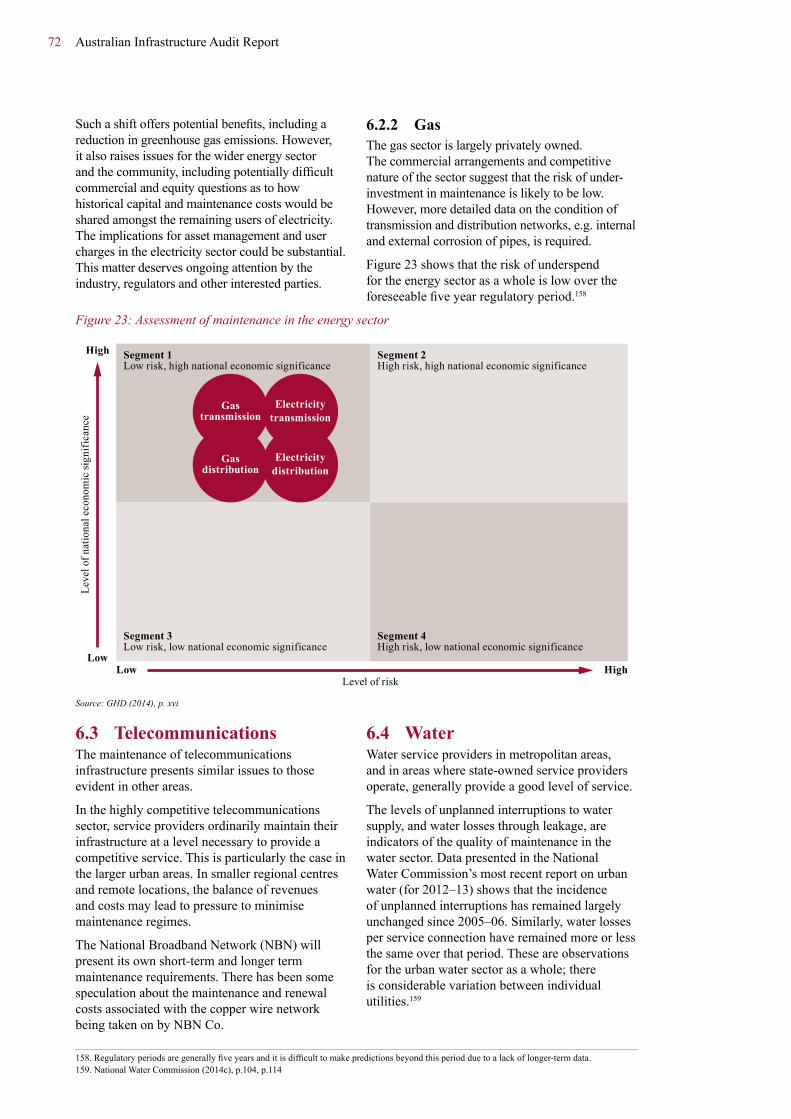
72 Australian Infrastructure Audit Report
Such a shift offers potential benefits, including a reduction in greenhouse gas emissions. However, it also raises issues for the wider energy sector and the community, including potentially difficult commercial and equity questions as to how historical capital and maintenance costs would be shared amongst the remaining users of electricity. The implications for asset management and user charges in the electricity sector could be substantial. This matter deserves ongoing attention by the industry, regulators and other interested parties.
6.2.2 GasThe gas sector is largely privately owned. The commercial arrangements and competitive nature of the sector suggest that the risk of under-investment in maintenance is likely to be low. However, more detailed data on the condition of transmission and distribution networks, e.g. internal and external corrosion of pipes, is required.
Figure 23 shows that the risk of underspend for the energy sector as a whole is low over the foreseeable five year regulatory period.158
Figure 23: Assessment of maintenance in the energy sector
Segment 1Low risk, high national economic significance
Segment 2High risk, high national economic significance
Segment 3Low risk, low national economic significance
Segment 4High risk, low national economic significance
Gastransmission
LowLow
High
HighLevel of risk
Leve
l of n
atio
nal e
cono
mic
sign
ific
ance
Electricitytransmission
Electricitydistribution
Gasdistribution
Source: GHD (2014), p. xvi
6.3 TelecommunicationsThe maintenance of telecommunications infrastructure presents similar issues to those evident in other areas.
In the highly competitive telecommunications sector, service providers ordinarily maintain their infrastructure at a level necessary to provide a competitive service. This is particularly the case in the larger urban areas. In smaller regional centres and remote locations, the balance of revenues and costs may lead to pressure to minimise maintenance regimes.
The National Broadband Network (NBN) will present its own short-term and longer term maintenance requirements. There has been some speculation about the maintenance and renewal costs associated with the copper wire network being taken on by NBN Co.
6.4 WaterWater service providers in metropolitan areas, and in areas where state-owned service providers operate, generally provide a good level of service.
The levels of unplanned interruptions to water supply, and water losses through leakage, are indicators of the quality of maintenance in the water sector. Data presented in the National Water Commission’s most recent report on urban water (for 2012–13) shows that the incidence of unplanned interruptions has remained largely unchanged since 2005–06. Similarly, water losses per service connection have remained more or less the same over that period. These are observations for the urban water sector as a whole; there is considerable variation between individual utilities.159
158. Regulatory periods are generally five years and it is difficult to make predictions beyond this period due to a lack of longer-term data. 159. National Water Commission (2014c), p.104, p.114

Australian Infrastructure Audit Report 73
The Audit did not find any evidence of a systemic maintenance underspend in metropolitan areas, where water service providers tend to have large customer bases and good opportunities to recover their costs.
There is a risk of maintenance underspending in regional areas, where town water services are provided by local councils. In particular, there is evidence of a significant maintenance backlog for water, sewerage and drainage assets in NSW and Queensland. Research by the Productivity Commission in 2011 and the Regional Australia Institute in 2012 also point to skills shortages and underdeveloped asset management systems.160 Smaller rural areas, particularly those where the population is projected to remain static or fall, face particular water infrastructure maintenance (and associated water quality) challenges.
Maintaining water supplies and sewerage services to rural towns and remote communities presents a particular challenge. The cost of providing water and sewerage to remote communities is often comparatively higher than in other parts of the country, because of longer distances, smaller populations, and/or more extreme physical environments.
Bulk rural water service providers tend to be state-owned and subject to some form of independent economic regulation. The Audit did not find any evidence of an infrastructure maintenance gap in the bulk rural water sector.
Where costs are not fully recovered from users, state governments sometimes provide additional payments to the bulk rural water service provider to cover the revenue shortfall so that assets can be adequately maintained. Given the fiscal pressures facing state and territory governments, there is a risk they will face an increasingly difficult task in continuing these payments while balancing other priorities. This raises questions about the durability of maintenance arrangements for these networks in the medium and longer term.
Some rural water service providers in NSW, South Australia (SA) and WA are owned by growers. In these cases, there is evidence of maintenance being deferred during drought as a means of reducing costs at a time when revenue from water sales is low.
Maintenance needs in the water sector are likely to increase as a result of:
■ population growth;
■ a large capital investment across the country in the 2000s to deal with supply shortages imposed by drought. This investment boom targeted non-rainfall dependent sources such as desalination and recycled water infrastructure, which are more expensive to run and maintain than traditional rainfall-dependent sources such as dams;
■ existing infrastructure, e.g. sewer mains, reaching the end of its design life;
■ greenfield urban development, which will see the need for new water and sewerage assets;
■ a trend towards a more integrated and distributed water supply network in urban areas as water service providers tap new supply sources such as stormwater runoff and sewage;
■ demands for improved levels of service, particularly in regional and remote areas, where existing standards often fall below the national average and there is further to go to reach expected standards;
■ improvements to environmental and other regulations, which impose unavoidable costs on water service providers; and
■ climate variability and climate change, which will continue to be a key driver of asset renewals and maintenance expenditure in the water sector.
Figure 24 shows that there is little evidence of a systemic maintenance issue for metropolitan water and sewerage assets, nor for bulk and retail rural water assets. There is, however, evidence of underspending on maintenance where water and sewerage services are provided by local government.
There are isolated examples of maintenance expenditure being deferred by privately owned irrigation corporations to reduce costs during times of drought.
160. GHD (2014), p.45
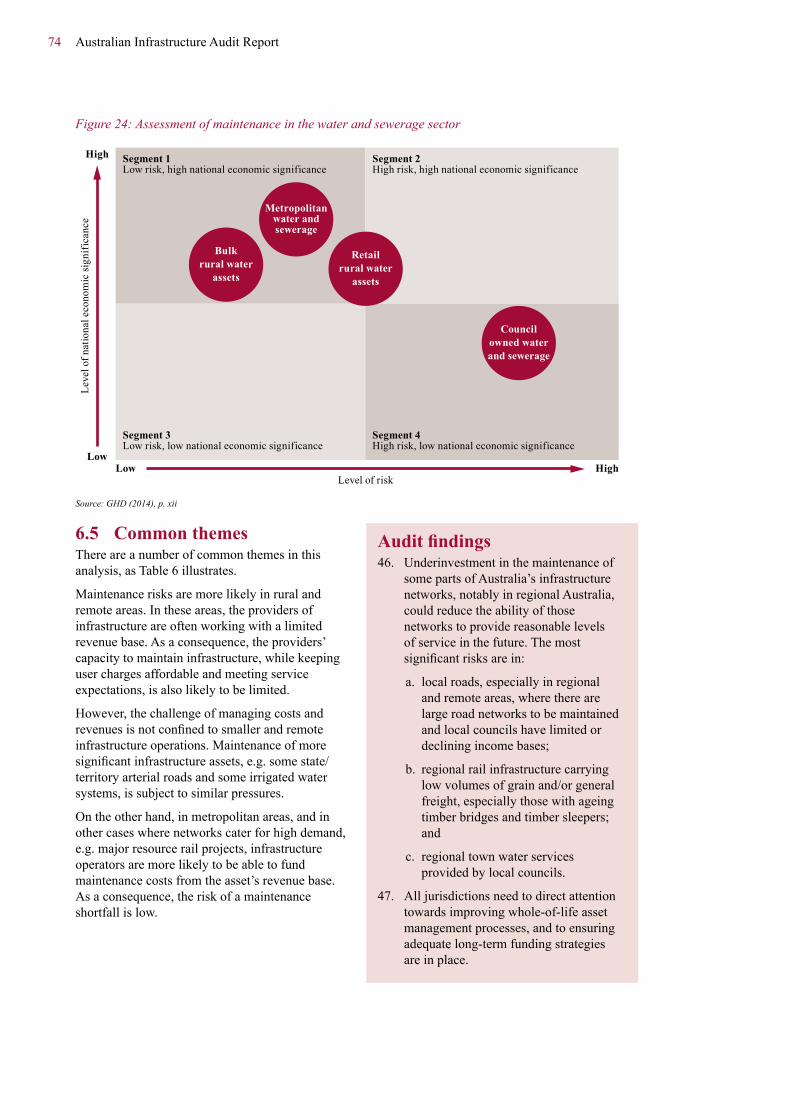
74 Australian Infrastructure Audit Report
Figure 24: Assessment of maintenance in the water and sewerage sector
Segment 1Low risk, high national economic significance
Segment 2High risk, high national economic significance
Segment 3Low risk, low national economic significance
Segment 4High risk, low national economic significance
Metropolitanwater andsewerage
LowLow
High
HighLevel of risk
Leve
l of n
atio
nal e
cono
mic
sign
ific
ance
Retailrural water
assets
Councilowned waterand sewerage
Bulkrural water
assets
Source: GHD (2014), p. xii
6.5 Common themesThere are a number of common themes in this analysis, as Table 6 illustrates.
Maintenance risks are more likely in rural and remote areas. In these areas, the providers of infrastructure are often working with a limited revenue base. As a consequence, the providers’ capacity to maintain infrastructure, while keeping user charges affordable and meeting service expectations, is also likely to be limited.
However, the challenge of managing costs and revenues is not confined to smaller and remote infrastructure operations. Maintenance of more significant infrastructure assets, e.g. some state/territory arterial roads and some irrigated water systems, is subject to similar pressures.
On the other hand, in metropolitan areas, and in other cases where networks cater for high demand, e.g. major resource rail projects, infrastructure operators are more likely to be able to fund maintenance costs from the asset’s revenue base. As a consequence, the risk of a maintenance shortfall is low.
Auditfindings46. Underinvestment in the maintenance of
some parts of Australia’s infrastructure networks, notably in regional Australia, could reduce the ability of those networks to provide reasonable levels of service in the future. The most significant risks are in:
a. local roads, especially in regional and remote areas, where there are large road networks to be maintained and local councils have limited or declining income bases;
b. regional rail infrastructure carrying low volumes of grain and/or general freight, especially those with ageing timber bridges and timber sleepers; and
c. regional town water services provided by local councils.
47. All jurisdictions need to direct attention towards improving whole-of-life asset management processes, and to ensuring adequate long-term funding strategies are in place.

Australian Infrastructure Audit Report 75
Table 6: Common themes to identify where maintenance issues are more likely
SectorStrong demand/high customer base Access to adequate funding
Subject to independent economic regulation
Likelihood of maintenance gap
Local roads Demand limited for the most part – customer base limited to ratepayers as no user-pays charging.
Main funding mechanism is through council rates which are sometimes capped (due to rate pegging) or declining (due to demographic changes), which affects the rate base. Other revenue comes in the form of Federal or state funding programs.
N/A High
National/state highways/ arterial roads
Strong demand There is evidence of a maintenance deficit on some state roads and national highways including major freight routes.
N/A Medium/High
Heavy haul rail Strong demand Yes, through charges levied by service providers to customers.
Yes* Low
Regional rail Declining – demand for regional rail falling due to a range of factors including a shift to road transport.
Ability to charge is limited on non-mining routes due to competition with road transport. Government subsidies declining as the commercial, heavy haul networks become privatised and inter-sectoral cross subsidies are removed.
Yes* High
Interstate rail Low demand Yes – through access revenue, government grants and bond issues
Yes* Low
Urban rail High demand Yes – through charges and government funding
Yes* Low
Metropolitan water and sewerage
Yes – customer base allows costs to be recovered from a large pool of users.
Yes – water charges generally cover the costs of service provision in most cities. Where this does not occur, service providers often receive a Community Service Obligation.
For the most part yes – allows maintenance planning and processes to be independently reviewed and often allows maintenance expenditure not forecast to be recovered through the next price determination or review.
Low
Regional (urban) water and sewerage
No No No High
Rural (bulk) water
Strong demand – variable customer base.
Yes – water charges cover costs in some schemes. Where a shortfall exists, state governments generally provide a Community Service Obligation.
For the most part yes Low
National electricity network
Demand under that which has been forecast but a high customer base.
Yes – charges and Community Service Obligations generally cover costs.
Yes Low
National gas network
High demand Yes – through charges recovered from customers.
Yes (transmission and distribution sector)
Low
Source: GHD (2014), p. xviii
* There is variation across the different categories of rail and across jurisdictions in terms of economic regulation. However, for the most part, the rail network is contestable and there are legislative mechanisms in place for third party access to the rail network.

76 Australian Infrastructure Audit Report
National Audit findingsbysectorThis chapter sets out the Audit’s findings for each of the four infrastructure sectors, on a sector-by-sector basis.
Table 7 provides a broad overview of the capacity, utilisation and Direct Economic Contribution (DEC) for each sector and sub-sector at the national level for 2011 (the census base year used in this report).
The Audit uses the Direct Economic Contribution (DEC) methodology to quantify both the value-add attributable to infrastructure in 2011, and the projected change in overall demand for infrastructure from 2011 to 2031. Value-add reflects the cost paid for the use of infrastructure less the cost of supplying that infrastructure. DEC is reported in 2011 prices. DEC is described further in Appendix 1.
Table 7: Overview of national infrastructure by sector in 2011
Subsector Capacity Utilisation DEC
Transport
Urban roads Vehicle kilometres per day: 2,227.0 million
Vehicle kilometres per day: 420.0 million Congestion (Car delay costs): $13,740 million
$70,268 m
Urban passenger rail Passenger kilometres per day: 178.7 million
Passenger kilometres per day: 46.3 million $4,216 m
Bus Passenger kilometres per day: 59.5 million
Passenger kilometres per day: 16.8 million $3,411 m
Ferry Passenger kilometres per day: 2.8 million
Passenger kilometres per day: 299,535 $18 m
Light rail/tram Passenger kilometres per day: 21.8 million
Passenger kilometres per day: 4.1 million $335 m
Total – Urban transport networks of six largest capital cities $78,250 mDarwin and Hobart – Total urban transport $1,435 mTotal – Urban transport networks of eight capital cities $79,685 m
National highways 34,656 km of national highways
1,871,211 vehicles per day $9,499 m
Freight rail n/a 261.4 tonne kilometres* $5,426 m
Ports 1,417 Mt/a 12 million TEUs
1,051 Mt/a 7 million TEUs $20,655 m
Airports 276 airports 132 million RPT passenger movements $20,677 m
Total − Other transport (i.e. excluding urban transport networks) $56,257 mTotal – Transport $135,942 m

Australian Infrastructure Audit Report 77
Subsector Capacity Utilisation DEC
Energy
Electricity
Generation installed: 54 GW Transmission peak demand: 41 GW Distribution peak demand: 37 GW
Generation: 228,195 GWH Transmission: 216,050 GWh Distribution: 183,992 GWH
$16,064 m
Gas
Gas transmission: 1,334 PJ/a Gas distribution: 344,121 TJ/a
Gas Transmission: 1,334 PJ/a Gas Distribution: 344,121 TJ/a
$2,345 m
Petroleum 79,199 ML 79,199 ML $1,077 m
Total – Energy $19,486 m
Communications Communications
Broadband availability 4.15 out of 5 Broadband quality: 1.54 out of 5 Households with 3G coverage: 81% Households with 4G coverage: 59%
Business use of internet: 51.1% Volume of data downloaded: 274,202 No. of households using internet: 6,177,000
$21,050 m
Water Water and sewerage
Dam capacity: 84,111 GL Dam water in storage: 58,488 GL Desalination capacity: 539 GL Length of water mains: 213,518 km Length of sewer mains: 133,508 km
Water supplied: 7,641 GL Number of properties served (water): 8.5 million Sewage collected: 1,931 GL No. of properties served (sewage): 7.8 million
$10,610 m
Total national infrastructure $187,088 m
Source: ACIL Allen Consulting (2014a) and Bureau of Infrastructure, Transport and Regional Economies (2013a) * Data is from Bureau of Infrastructure, Transport and Regional Economics (2014b)
7Table 7: (continued)

78 Australian Infrastructure Audit Report
Table 8 lists the 20 regions across Australia with the largest DEC from infrastructure in 2011 and 2031. The top 20 regions accounted for 88.8 per
cent of total DEC in 2011, and are projected to account for 90.6 per cent of the total in 2031.
Table 8: Australia’s top 20 regions – Infrastructure Direct Economic Contribution ($ million, 2011 prices) – 2031 rankings
Rank Region State/Territory Infrastructure
DEC in 2011 % of national
total
Projected infrastructure
DEC in 2031% of
national total
1 Greater Sydney NSW 42,756 22.9 79,834 21.2
2 Greater Melbourne VIC 36,373 19.4 71,221 18.9
3 Greater Perth WA 17,490 9.3 53,874 14.3
4 Greater Brisbane QLD 20,823 11.1 44,837 11.9
5 Greater Adelaide SA 12,068 6.5 21,090 5.6
6 Pilbara WA 5,240 2.8 15,035 4.0
7 Newcastle and Lake Macquarie NSW 4,725 2.5 7,741 2.1
8 Gold Coast QLD 3,934 2.1 7,707 2.0
9 Australian Capital Territory ACT 3,456 1.8 6,760 1.8
10 Hunter Valley exc Newcastle NSW 3,607 1.9 6,134 1.6
11 Illawarra NSW 3,088 1.7 4,790 1.3
12 Sunshine Coast QLD 1,997 1.1 3,994 1.1
13 Gladstone – Biloela QLD 971 0.5 3,753 1.0
16 Geelong VIC 1,670 0.9 2,191 0.8
14 Hobart TAS 1,809 1.0 2,882 0.8
15 Latrobe – Gippsland VIC 1,809 1.0 2,708 0.7
17 Darwin NT 1,224 0.7 2,650 0.7
18 Cairns QLD 987 0.5 1,897 0.5
19 Bunbury WA 887 0.5 1,805 0.5
20 Central West NSW 1,167 0.6 1,792 0.5
Total – Australia 187,088 376,641
Source: Infrastructure Australia analysis of ACIL Allen Consulting (2014a) data

Australian Infrastructure Audit Report 79
7.1 Transport This section provides analysis of Australia’s transport infrastructure at a national level. It is organised by transport mode to allow for separate analysis of each mode. The modes analysed are:
■ urban transport (including urban roads, urban passenger rail, bus, ferry and light rail);
■ national highways;
■ freight rail;
■ ports; and
■ airports.
Analysis of each mode considers:
■ capacity and utilisation in 2011;
■ projected demand for 2031; and
■ implications for the Australian Infrastructure Plan.
7.1.1 Urban transportUrban transport infrastructure plays a key role in the Australian economy. It facilitates the transport of people and goods, directly impacting the daily lives of the three-quarters of Australia’s population who live in our largest cities. Meeting the connectivity challenges that our nation faces will require governments to ensure optimum service delivery outcomes in the urban transport sector.
For the urban transport component of the Audit, the national-level top-down economic analysis used for the other sectors, which is based on national accounts and industry data, was complemented by bottom-up analysis based on detailed transport modelling for the six largest capital cities.
This modelling, undertaken by Veitch Lister Consulting,161 provides a rich source of information about transport journeys across all modes and purposes for the six metropolitan regions. This includes data on the number and mode of journeys by origin and destination, and by key corridors.
For the road component of these corridors, the modelling includes capacity measures such as traffic volume compared to capacity (V/C) and delay time.
Passengers on Australia’s public transport networks experience congestion in two forms: delays to services, and overcrowding. Delays to bus and tram services are captured in the modelling of urban roads. Delays on the rail networks, e.g. as a result of unreliable services or being unable to board an overcrowded train,
were not modelled. Accordingly, estimates of the cost of road delay may be understated, e.g. where unreliable or delayed train services cause some travellers to shift from using trains to driving a car.
However, the modelling does identify passenger loads on public transport, and therefore potential overcrowding (especially the potential for so-called ‘crush loads’). Details are available in the reports by Veitch Lister Consulting, and summarised in the relevant state/territory chapters of this report.
This provides a detailed view of where urban transport activity is located in each city, by mode, and by time of day. When combined with projected population growth, spatial distribution of that growth, and spatial distribution of employment and other trip generators, the model can project a similarly detailed view of the location of urban transport activity, by mode and by time of day, at a future point in time.
For the Audit, Veitch Lister modelled urban transport activity in 2031, based on the Audit’s population projections (Australian Bureau of Statistics (ABS) Series B), with spatial distributions that take account of current state/territory strategic plans.
The modelling assumes projected demand is addressed only by the existing (2014–15) network, as well as projects currently under construction or for which a budget commitment has been made. By including only those projects with firm budget commitments, the Audit aims to clearly show where demand is projected to grow in excess of supply. Including other potential projects which are not currently funded would be misleading as it would show future demand being addressed by future capacity which may not end up being provided. This acknowledges the likelihood that, in the absence of a shift in taxation and/or expenditure priorities (or some shift to user charging), governments will struggle to fund the development of a large portfolio of new projects. Choices will have to be made.
The traffic data generated by Veitch Lister has then been modelled by ACIL Allen Consulting to estimate the value-add and delay cost for each corridor, based on the number and mode of journeys. This approach takes account of the different value attributable to different modes. For example, congestion on a particular road might impose the same time delay on a large truck and a small car, but the cost of that delay is different for each vehicle when factors such as capital, operating and opportunity costs are taken into account.
161. Veitch Lister Consulting (2014a)

80 Australian Infrastructure Audit Report
The modelling provides one method of measuring and projecting demand for transport infrastructure. State governments may have utilised other data, and different methods of analysis, to inform identification of infrastructure priorities. For further information on the assumptions, included projects and methodology applied in the model, refer to the supporting documentation by Veitch Lister Consulting.
This analysis facilitates identification of the corridors with the highest levels of economic activity, and the corridors in which capacity constraints and/or delays impose the highest economic cost. Given the absence of rail delay cost from the model, the projected delay cost for a corridor is at best an approximation. However, rail delay cost is unlikely to represent more than a small proportion of total delay cost for most corridors. As such, road delay cost is a reasonable indicator of overall delay cost for most corridors.
This approach allows comparison of key corridors across different cities on a consistent basis. It details the cost of congestion in the Audit base year, showing pressure points in the system at that time. It then makes a projection of the cost of capacity constraints in 2031 if our cities grow as projected, without any additional urban transport capacity. This indicates where interventions may have the greatest effect. However, it does not indicate what type of intervention would be most effective – this will require further detailed analysis of individual corridors taking into account, for example, whether current or increased rail capacity in a particular corridor might be able to absorb part of a projected increase in passenger demand.
7.1.1.1 Urbantransportnationaloverview
Australia’s urban transport networks include urban roads, and urban public transport systems including urban passenger rail, buses, light rail and ferries.
The Audit analysed urban transport networks in the conurbations162 around the six largest capital cities: Sydney-Newcastle-Wollongong, Melbourne-Geelong, Brisbane-Gold Coast-Sunshine Coast, greater Perth (which extends to Mandurah in the south), greater Adelaide and greater Canberra. A conurbation is an extended metropolitan area which may include several cities or towns within the economic region of a major city.
The detailed transport modelling used for the six largest capital cities was not available for Hobart and Darwin. Top-down estimates have been used for those two cities.
In 2011, urban roads carried 420 million vehicle kilometres per day across the six conurbations, while the public transport networks moved significant numbers of passengers:
■ urban rail carried 46.3 million passenger kilometres (km) per day;
■ urban buses carried 16.8 million passenger km per day;
■ light rail/trams carried 4.1 million passenger km per day; and
■ ferries carried 0.3 million passenger km per day.163
Table 9 shows the utilisation of each mode of urban transport across the conurbations analysed as part of the Audit.
Table 9: Daily kilometres travelled in six conurbations by origin-destination across urban transport modes in 2011 (million km)
Conurbation Road Rail Bus Ferry Light rail
VKT per day Passenger km per day
Passenger km per day
Passenger km per day
Passenger km per day
Sydney-Newcastle-Wollongong 132.2 20.8 8.1 0.2 0.03
Melbourne-Geelong 116.1 17.6 2.3 n/a 4.1
Brisbane-Gold Coast- Sunshine Coast 83.7 4.3 3.2 0.08 n/a
Greater Perth 49.8 3.0 1.4 <0.01 n/a
Greater Adelaide 28.2 0.6 1.1 n/a 0.02
Greater Canberra 9.9 n/a 0.7 n/a n/a
Source: ACIL Allen Consulting (2014b)
162. The conurbations in the urban transport section of the Audit cover a larger area than the Greater Capital City Statistical Areas (GCCSA) used by the Australian Bureau of Statistics (ABS).
163. ACIL Allen Consulting (2014b)

Australian Infrastructure Audit Report 81
Table 10: Urban transport DEC by mode and conurbation, 2011 ($ million, 2011 prices)
Conurbation Car LCV164 HCV165 Rail Bus Ferry Light rail
Total urban
transport
All figures expressed in ($m)
Sydney-Newcastle-Wollongong 20,530 854 2,825 1,950 1,329 4 12 27,504
Melbourne-Geelong 15,537 641 779 1,744 985 n/a 322 20,007
Brisbane-Gold Coast- Sunshine Coast 11,429 528 516 190 398 14 n/a 13,075
Greater Perth 7,647 400 448 290 350 <1 n/a 9,134
Greater Adelaide 5,830 194 383 42 254 n/a 1 6,705
Greater Canberra 1,502 51 175 n/a 95 n/a n/a 1,824
Total 62,475 2,667 5,126 4,216 3,411 18 335 78,250
Source: ACIL Allen Consulting (2014b)
Table 10 details the DEC in 2011 of each urban transport mode for the six conurbations modelled in the Audit.
In 2011, the total DEC of urban transport infrastructure across the six conurbations was $78 billion. This represents 58 per cent of the overall transport sector DEC for the entire country and 42 per cent of infrastructure’s total DEC.166
Using the Audit’s top-down approach, the DEC of urban transport infrastructure for Hobart and Darwin was estimated to be $835 million and $600 million respectively in 2011. Combining these estimates with the six modelled conurbations, the DEC of urban transport for all eight capital cities was estimated to be $79.7 billion in 2011.167
The cost of delay on Australia’s urban transport network was estimated at $13.7 billion in 2011.
Population and economic growth in urban centres will continue to be the key drivers of demand for urban transport infrastructure in Australia. The Audit projects that, for 2031:
■ demand for mobility in every conurbation studied will grow quite rapidly, exceeding the rate of national population and economic growth;
■ in the absence of additional capacity, the DEC for urban transport for the six conurbations
is projected to grow to $175.1 billion in 2031, while the cost of delay is projected to grow to $53.3 billion in 2031;
■ public transport usage (expressed as passenger kilometres travelled) is projected to grow by 89 per cent between 2011 and 2031; and
■ in the absence of additional capacity, demand for urban public transport networks will exceed capacity more often, more seriously and in more locations.
Origins/destinations of trips across the six conurbations
Figure 25 shows trips across the six conurbations by origin/destination (O/D), across road and public transport modes, in terms of DEC for 2011 and projected DEC for 2031. The O/D regions used here are SA3 regions as defined by the ABS. While these regions have different characteristics and are not strictly comparable, this analysis shows a number of consistent patterns. For example, it shows that demand for travel to and from the key inner city employment zones is projected to grow strongly to 2031, while demand for travel to and from emerging non-CBD employment zones, particularly in Western Australia (WA), Victoria and New South Wales (NSW), is also projected to grow strongly.
164. LCV: light commercial vehicle
165. HCV: heavy commercial vehicle
166. ACIL Allen Consulting (2014b)
167. ACIL Allen Consulting (2014b)

82 Australian Infrastructure Audit Report
Figure 25: Trips in six conurbations by origin/destination for roads and public transport in 2011 and projected for 2031, measured by DEC ($ million, 2011 prices)
7,000
6,000
5,000
4,000
3,000
2,000
1,000
0
Sydn
ey C
ity (N
SW)
Mel
bour
ne C
ity (V
ic)
Pert
h C
ity (W
A)
Mon
ash
(Vic
)
Tulla
mar
ine
– B
road
mea
dow
s (V
ic)
Stir
ling
(WA
)
Dan
deno
ng (V
ic)
Parr
amat
ta (N
SW)
Bor
oond
ara
(Vic
)
Ryd
e –
Hun
ters
Hill
(NSW
)
Ban
ksto
wn
(NSW
)
Kno
x (V
ic)
Bri
sban
e In
ner (
Qld
)
Stra
thfi
eld
– B
urw
ood
– A
shfi
eld
(NSW
)
Fair
fiel
d (N
SW)
Mer
ryla
nds –
Gui
ldfo
rd (N
SW)
Can
ning
(WA
)
Bau
lkha
m H
ills (
NSW
)
Whi
ttles
ea –
Wal
lan
(Vic
)
Bot
any
(NSW
)
Bri
mba
nk (V
ic)
Ade
laid
e C
ity (S
A)
2011 2031
$ m
illio
n
Source: Infrastructure Australia analysis of modelling data from Veitch Lister Consulting (2014a) and ACIL Allen Consulting (2014b)
Table 11: Journey to work and all-day mode share estimates for urban public transport, 2011168
Task Sydney Melbourne Brisbane Adelaide Perth Hobart Darwin Canberra 8 capitals
Mass transit commute share (% of all motorised JTW169 trips)
24.9 17.5 15.8 10.4 13.6 7.1 5.6 8.4 17.9
Mass transit all day share (% of all motorised pkm170)
13.6 11.0 8.6 6.1 7.1 3.6 6.0 4.3 10.3
Source: Bureau of Infrastructure, Transport and Regional Economics (2014a)
Modeshareinurbantransportnetworks
Table 11 shows public transport’s share of motorised trips to work, and of all motorised trips, in the eight capital cities in 2011. This shows that public transport has a significantly higher share of trips in Sydney than the other cities, especially for trips to work.
Figure 26 shows the public transport seat kilometres per person available in 2011 for each of the six conurbations analysed in the Audit. This shows a significantly higher level of public
transport seat kilometres available in Sydney, and to a lesser extent Melbourne, compared to the other cities. In particular, the rail networks in Sydney and Melbourne provide significantly more seat kilometres per person than those in the other cities, reflecting their more extensive legacy rail networks, and higher utilisation of public transport generally. The public transport networks in the other cities are more dependent on buses.
168. Public transport share includes specific allowances for all bus travel km (on both route and private buses).
169. JTW: journey to work
170. pkt: passenger kilometres travelled

Australian Infrastructure Audit Report 83
Figure 26: Public transport seat km per person across six conurbations in 2011
pass
enge
r km
cap
acity
/per
son
25
20
15
10
5
0Sydney –
Newcastle – Woollongong
Brisbane – Gold Coast –
Sunshine Coast
Greater Perth Greater Adelaide Greater CanberraMelbourne – Geelong
Rail
Bus
Ferry
Light Rail
Source: Veitch Lister Consulting (2014a)
Estimates of congestion costs
ACIL Allen’s work for the Audit has estimated that the cost of delays on urban roads was $13.7 billion in 2011. Based on projected population growth and distribution, and in the absence of any new network capacity and/or demand management, the Audit projects the costs of congestion on urban roads will grow to $53.3 billion in 2031.
The ACIL Allen methodology does not account for new investments in infrastructure between 2015 and 2031, apart from infrastructure which is already under construction, or for which a firm funding commitment has been made. Details of these projects are set out in the Veitch Lister Consulting reports for each of the six cities studied.
Table 12 shows this projected congestion cost across the six largest capital cities.
The projected growth in congestion cost for Perth reflects the projected increase in greater Perth’s population – from 1.9 million in 2011 to 3.3 million in 2031, or 77 per cent – overlaid on the current Perth transport network. Perth’s transport network is heavily focused on the major north-south corridors, especially the Kwinana and Mitchell freeways. This reflects Perth’s urban form, which stretches over 100km north and south along the WA coast. These key freeways are already operating at capacity in peak periods, especially on the approaches to Perth’s CBD and the Swan River crossings. In this context, the addition of 77 per cent to Perth’s population, without a commensurate increase in Perth’s transport network capacity, leads to the spreading of peak period loadings throughout the day, and significant growth in the cost of congestion.
Table 12: Cost of road congestion 2011 and projected 2031 ($ billion, 2011 prices)
Sydney-Newcastle-
Wollongong
Melbourne-Geelong
Brisbane-Gold Coast-Sunshine
CoastGreater Perth Greater
AdelaideGreater
Canberra
2011 5,555 2,837 1,914 1,784 1,442 208
2031 14,790 9,006 9,206 15,865 3,747 703
Source: Infrastructure Australia analysis of data from ACIL Allen Consulting (2014b) and Veitch Lister Consulting (2014a)

84 Australian Infrastructure Audit Report
7.1.1.2 Analysis by sector
Roads
The Audit dataset provides a broad range of data about corridors, and there are many ways of analysing this data. Given the focus of the Audit on economic indicators, the analysis in Table 13 and Table 14 focuses on delay cost. This applies a dollar cost to time delays, based on lost productivity, and taking account of the different costs applicable to different vehicle types.
Some users of the Audit dataset may prefer to use more traditional indicators of congestion such as traffic V/C. This measure is included in Table 13 and Table 14, as is the DEC measure, which gives insight into the underlying value of activity on the corridor, and the proportion of DEC attributable to delay cost.
These measures are expressed per lane kilometre of road. This normalises the results to facilitate comparison across a wide range of different corridor types − some very long, some consisting of multiple roads (and roads with single or multiple lanes), and some relatively short single roads. This provides, for the first time in Australia, a tool which allows comparison of urban transport corridors across different cities, by key attributes such as delay cost and value-add.
Table 13 shows corridors ranked by delay cost per lane kilometre in 2011, with the equivalent projections for 2031 in Table 12. Taken together, these tables give an indication of which corridors warrant further study, and where interventions are likely to have the greatest economic return.
Table 13: Road corridors across six conurbations in 2011 by delay cost – top 30 corridors
Rank Road Corridor State
Delay cost by lane km
2011 ($m)
DEC per lane km
2011 ($m)
Volume Capacity Ratio 2011 AM Peak
(7 to 9 AM)
1 Pennant Hills Rd – Parramatta to Hornsby NSW 3.53 6.81 94%
2 King Georges Rd Corridor Princes Hwy – M4 NSW 2.28 6.36 83%
3 Chatswood to Narraweena via Warringah Rd NSW 2.18 5.54 77%
4 Mitchell Fwy Corridor WA 1.96 5.52 70%
5 Homebush Bay to Mona Vale Corridor (A3) NSW 1.92 4.66 76%
6 Sutherland – Ryde/Parramatta Corridor (A6) NSW 1.77 4.55 77%
7 Victoria Rd (A40) Corridor NSW 1.73 5.08 73%
8 Parramatta Rd (M4) Corridor Ashfield – Strathfield NSW 1.64 4.47 84%
9 Goodwood Rd Corridor SA 1.63 4.05 78%
10 City Link-Eastern Fwy connection north of CBD VIC 1.56 5.49 70%
11 Lower North East Rd/Payneham Rd Corridor SA 1.55 3.60 78%
12 Anzac Hwy Corridor SA 1.53 4.63 66%
13 Fullarton Rd Corridor SA 1.51 3.30 85%
14 Indooroopilly – City QLD 1.45 3.62 86%
15 Western Mwy (M4) Corridor Strathfield – Parramatta NSW 1.37 4.17 79%
16 Port Road Corridor SA 1.36 4.27 65%
17 Portrush Road Corridor SA 1.33 3.64 81%
18 Eastern Fwy Corridor to Ringwood VIC 1.29 5.77 76%
19 North East Road Corridor SA 1.25 3.86 63%
20 Parramatta Rd (A31) City West Link Corridor Sydney – Ashfield NSW 1.23 4.09 75%
21 Nth Sydney – Northern Beaches Corridor NSW 1.22 3.47 63%
22 Leach Hwy Corridor WA 1.21 3.97 61%
23 Canning Hwy/Great Eastern Hwy (west) Corridor WA 1.20 3.41 62%
24 Graham Farmer Fwy/Orrong Rd/Welshpool Rd East Corridor WA 1.20 3.49 62%
25 M5 / A34 Corridor NSW 1.19 4.37 73%
26 Gore Hill/Warringah Fwys/SHB/Eastern Dist NSW 1.15 5.37 72%
27 Ipswich Mwy QLD 1.14 4.26 66%
28 Western/Metropolitan Ring Road VIC 1.13 5.52 76%
29 Hume Hwy Corridor (A22) Lansdowne – Haberfield NSW 1.12 4.09 74%
30 Cumberland Hwy (Hume Hwy-M4) NSW 1.06 3.21 76%
Source: Infrastructure Australia analysis of modelling data from Veitch Lister Consulting (2014a) and ACIL Allen Consulting (2014b)
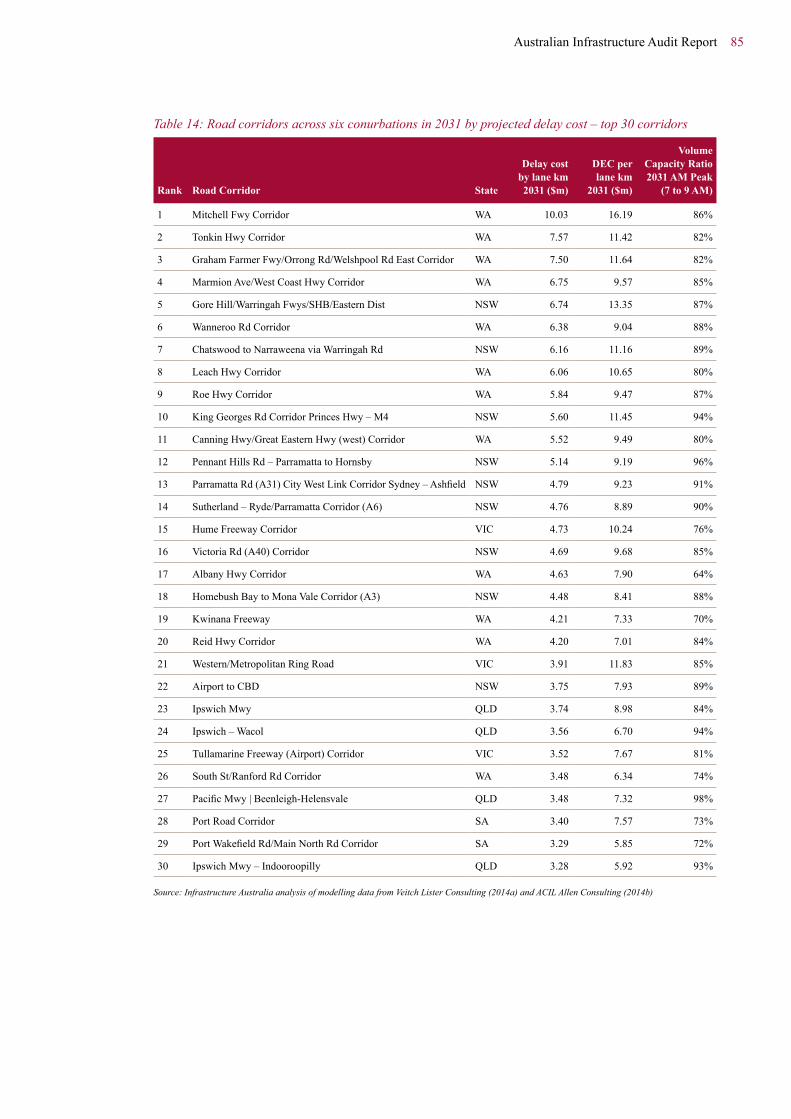
Australian Infrastructure Audit Report 85
Table 14: Road corridors across six conurbations in 2031 by projected delay cost – top 30 corridors
Rank Road Corridor State
Delay cost by lane km 2031 ($m)
DEC per lane km
2031 ($m)
Volume Capacity Ratio 2031 AM Peak
(7 to 9 AM)
1 Mitchell Fwy Corridor WA 10.03 16.19 86%
2 Tonkin Hwy Corridor WA 7.57 11.42 82%
3 Graham Farmer Fwy/Orrong Rd/Welshpool Rd East Corridor WA 7.50 11.64 82%
4 Marmion Ave/West Coast Hwy Corridor WA 6.75 9.57 85%
5 Gore Hill/Warringah Fwys/SHB/Eastern Dist NSW 6.74 13.35 87%
6 Wanneroo Rd Corridor WA 6.38 9.04 88%
7 Chatswood to Narraweena via Warringah Rd NSW 6.16 11.16 89%
8 Leach Hwy Corridor WA 6.06 10.65 80%
9 Roe Hwy Corridor WA 5.84 9.47 87%
10 King Georges Rd Corridor Princes Hwy – M4 NSW 5.60 11.45 94%
11 Canning Hwy/Great Eastern Hwy (west) Corridor WA 5.52 9.49 80%
12 Pennant Hills Rd – Parramatta to Hornsby NSW 5.14 9.19 96%
13 Parramatta Rd (A31) City West Link Corridor Sydney – Ashfield NSW 4.79 9.23 91%
14 Sutherland – Ryde/Parramatta Corridor (A6) NSW 4.76 8.89 90%
15 Hume Freeway Corridor VIC 4.73 10.24 76%
16 Victoria Rd (A40) Corridor NSW 4.69 9.68 85%
17 Albany Hwy Corridor WA 4.63 7.90 64%
18 Homebush Bay to Mona Vale Corridor (A3) NSW 4.48 8.41 88%
19 Kwinana Freeway WA 4.21 7.33 70%
20 Reid Hwy Corridor WA 4.20 7.01 84%
21 Western/Metropolitan Ring Road VIC 3.91 11.83 85%
22 Airport to CBD NSW 3.75 7.93 89%
23 Ipswich Mwy QLD 3.74 8.98 84%
24 Ipswich – Wacol QLD 3.56 6.70 94%
25 Tullamarine Freeway (Airport) Corridor VIC 3.52 7.67 81%
26 South St/Ranford Rd Corridor WA 3.48 6.34 74%
27 Pacific Mwy | Beenleigh-Helensvale QLD 3.48 7.32 98%
28 Port Road Corridor SA 3.40 7.57 73%
29 Port Wakefield Rd/Main North Rd Corridor SA 3.29 5.85 72%
30 Ipswich Mwy – Indooroopilly QLD 3.28 5.92 93%
Source: Infrastructure Australia analysis of modelling data from Veitch Lister Consulting (2014a) and ACIL Allen Consulting (2014b)
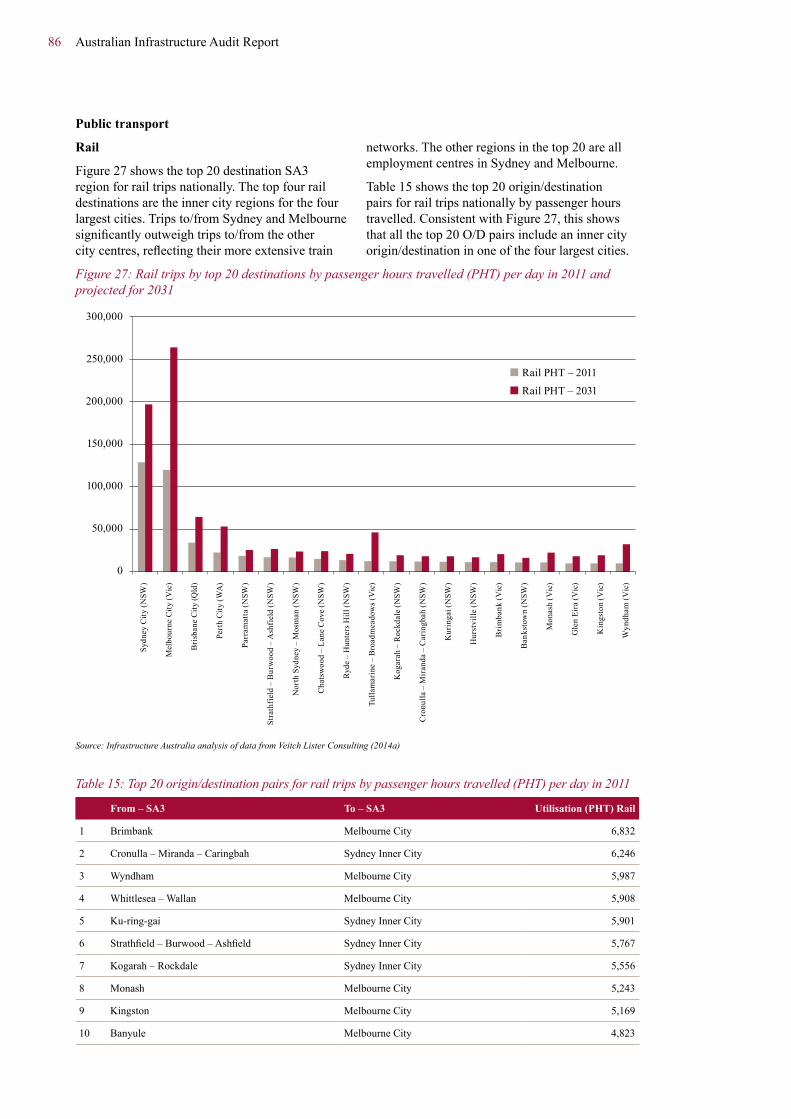
86 Australian Infrastructure Audit Report
Public transport
Rail
Figure 27 shows the top 20 destination SA3 region for rail trips nationally. The top four rail destinations are the inner city regions for the four largest cities. Trips to/from Sydney and Melbourne significantly outweigh trips to/from the other city centres, reflecting their more extensive train
networks. The other regions in the top 20 are all employment centres in Sydney and Melbourne.
Table 15 shows the top 20 origin/destination pairs for rail trips nationally by passenger hours travelled. Consistent with Figure 27, this shows that all the top 20 O/D pairs include an inner city origin/destination in one of the four largest cities.
Figure 27: Rail trips by top 20 destinations by passenger hours travelled (PHT) per day in 2011 and projected for 2031
300,000
250,000
200,000
150,000
100,000
50,000
0
Rail PHT – 2011
Rail PHT – 2031
Sydn
ey C
ity (N
SW)
Mel
bour
ne C
ity (V
ic)
Bri
sban
e C
ity (Q
ld)
Pert
h C
ity (W
A)
Parr
amat
ta (N
SW)
Stra
thfi
eld
– B
urw
ood
– A
shfi
eld
(NSW
)
Nor
th S
ydne
y –
Mos
man
(NSW
)
Cha
tsw
ood
– La
ne C
ove
(NSW
)
Ryd
e –
Hun
ters
Hill
(NSW
)
Tulla
mar
ine
– B
road
mea
dow
s (V
ic)
Kog
arah
– R
ockd
ale
(NSW
)
Cro
nulla
– M
iran
da –
Car
ingb
ah (N
SW)
Kur
inga
i (N
SW)
Hur
stvi
lle (N
SW)
Bri
mba
nk (V
ic)
Ban
ksto
wn
(NSW
)
Mon
ash
(Vic
)
Gle
n Ei
ra (V
ic)
Kin
gsto
n (V
ic)
Wyn
dham
(Vic
)
Source: Infrastructure Australia analysis of data from Veitch Lister Consulting (2014a)
Table 15: Top 20 origin/destination pairs for rail trips by passenger hours travelled (PHT) per day in 2011
From – SA3 To – SA3 Utilisation (PHT) Rail
1 Brimbank Melbourne City 6,832
2 Cronulla – Miranda – Caringbah Sydney Inner City 6,246
3 Wyndham Melbourne City 5,987
4 Whittlesea – Wallan Melbourne City 5,908
5 Ku-ring-gai Sydney Inner City 5,901
6 Strathfield – Burwood – Ashfield Sydney Inner City 5,767
7 Kogarah – Rockdale Sydney Inner City 5,556
8 Monash Melbourne City 5,243
9 Kingston Melbourne City 5,169
10 Banyule Melbourne City 4,823
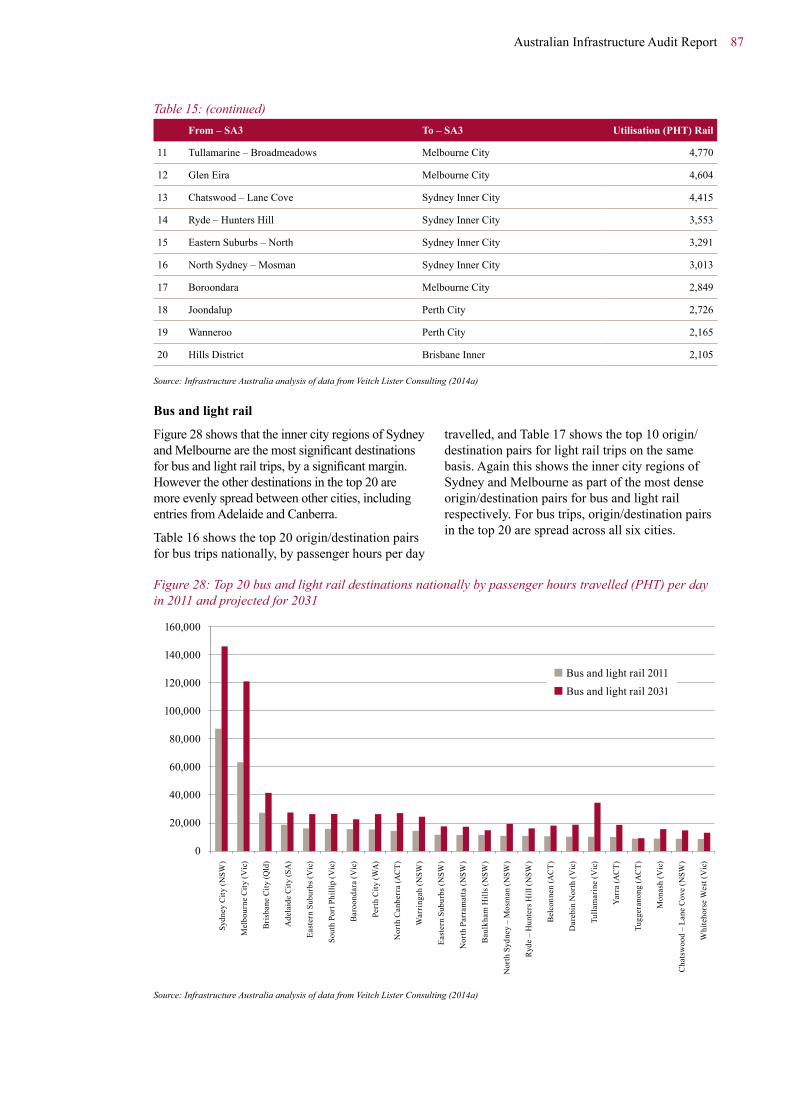
Australian Infrastructure Audit Report 87
From – SA3 To – SA3 Utilisation (PHT) Rail
11 Tullamarine – Broadmeadows Melbourne City 4,770
12 Glen Eira Melbourne City 4,604
13 Chatswood – Lane Cove Sydney Inner City 4,415
14 Ryde – Hunters Hill Sydney Inner City 3,553
15 Eastern Suburbs – North Sydney Inner City 3,291
16 North Sydney – Mosman Sydney Inner City 3,013
17 Boroondara Melbourne City 2,849
18 Joondalup Perth City 2,726
19 Wanneroo Perth City 2,165
20 Hills District Brisbane Inner 2,105
Source: Infrastructure Australia analysis of data from Veitch Lister Consulting (2014a)
Bus and light rail
Figure 28 shows that the inner city regions of Sydney and Melbourne are the most significant destinations for bus and light rail trips, by a significant margin. However the other destinations in the top 20 are more evenly spread between other cities, including entries from Adelaide and Canberra.
Table 16 shows the top 20 origin/destination pairs for bus trips nationally, by passenger hours per day
travelled, and Table 17 shows the top 10 origin/destination pairs for light rail trips on the same basis. Again this shows the inner city regions of Sydney and Melbourne as part of the most dense origin/destination pairs for bus and light rail respectively. For bus trips, origin/destination pairs in the top 20 are spread across all six cities.
Figure 28: Top 20 bus and light rail destinations nationally by passenger hours travelled (PHT) per day in 2011 and projected for 2031
160,000
140,000
120,000
100,000
80,000
60,000
40,000
20,000
0
Sydn
ey C
ity (N
SW)
Mel
bour
ne C
ity (V
ic)
Bri
sban
e C
ity (Q
ld)
Ade
laid
e C
ity (S
A)
East
ern
Subu
rbs (
Vic
)
Sout
h Po
rt P
hilli
p (V
ic)
Bar
oond
ara
(Vic
)
Pert
h C
ity (W
A)
Nor
th C
anbe
rra
(AC
T)
War
ring
ah (N
SW)
East
ern
Subu
rbs (
NSW
)
Nor
th P
arra
mat
ta (N
SW)
Bau
lkha
m H
ills (
NSW
)
Nor
th S
ydne
y –
Mos
man
(NSW
)
Ryd
e –
Hun
ters
Hill
(NSW
)
Bel
conn
en (A
CT)
Dar
ebin
Nor
th (V
ic)
Tulla
mar
ine
(Vic
)
Yarr
a (A
CT)
Tugg
eran
ong
(AC
T)
Mon
ash
(Vic
)
Cha
tsw
ood
– La
ne C
ove
(NSW
)
Whi
teho
rse
Wes
t (V
ic)
Bus and light rail 2011
Bus and light rail 2031
Source: Infrastructure Australia analysis of data from Veitch Lister Consulting (2014a)
Table 15: (continued)

88 Australian Infrastructure Audit Report
Table 16: Top 20 origin/destination pairs for bus trips by passenger hours travelled (PHT) per day in 2011
From – SA3 To – SA3Passenger-hours/day
Utilisation (PHT) Bus
Eastern Suburbs – South Sydney Inner City 10,126
Eastern Suburbs – North Sydney Inner City 8,122
Warringah Sydney Inner City 7,816
Ryde – Hunters Hill Sydney Inner City 3,900
North Sydney – Mosman Sydney Inner City 3,307
Chatswood – Lane Cove Sydney Inner City 2,983
Belconnen North Canberra 2,933
Manningham – West Melbourne City 2,920
Stirling Perth City 2,772
Mt Gravatt Brisbane Inner 2,200
Tuggeranong North Canberra 2,113
Strathfield – Burwood – Ashfield Sydney Inner City 2,093
Kenmore – Brookfield – Moggill Brisbane Inner 1,855
Carindale Brisbane Inner 1,850
Holland Park – Yeronga Brisbane Inner 1,819
Tea Tree Gully Adelaide City 1,712
Gungahlin North Canberra 1,683
Rocklea – Acacia Ridge Brisbane Inner 1,663
Adelaide Hills Adelaide City 1,629
Onkaparinga Adelaide City 1,553
Source: Infrastructure Australia analysis of modelling data from Veitch Lister Consulting (2014a) and ACIL Allen Consulting (2014b)
Table 17: Top 10 origin/destination pairs for light rail/tram trips by passenger hours travelled per day in 2011
From – SA3 To – SA3
Passenger-hours/day Utilisation (PHT)
Light Rail
Boroondara Melbourne City 6,315
Glen Eira Melbourne City 2,685
Whittlesea – Wallan Melbourne City 1,218
Banyule Melbourne City 892
Tullamarine – Broadmeadows Melbourne City 350
Monash Melbourne City 303
Brimbank Melbourne City 193
Manningham – West Melbourne City 188
Kingston Melbourne City 187
Marion Adelaide City 144
Source: Infrastructure Australia analysis of data from Veitch Lister Consulting (2014a)

Australian Infrastructure Audit Report 89
Growthareasandurbanplanning
The Audit’s projections of future urban transport activity show which SA3 regions are projected to experience the highest levels of growth. Table 18
shows these regions by absolute growth of trips, as measured by DEC, between 2011 and 2031.
Table 18: SA3 regions with >$1 billion projected growth in value of trips (roads and public transport by origin/destination) between 2011 and 2031, measured in DEC ($ million, 2011 prices)
SA3 State
Total roads and PT 2011 OD
($m DEC)
Roads and PT 2031 OD
($m DEC)
Increase from 2011 to 2031
(%)
Increase from 2011 to 2031
($m DEC)
Perth City WA 1,628 5,193 219% 3,566
Wanneroo WA 789 4,196 432% 3,407
Sydney Inner City NSW 2,912 6,050 108% 3,138
Swan WA 883 3,811 332% 2,928
Melbourne City VIC 2,722 5,226 92% 2,505
Stirling WA 1,229 3,733 204% 2,504
Belmont – Victoria Park WA 934 3,346 258% 2,412
Whittlesea – Wallan VIC 1,010 3,301 227% 2,292
Tullamarine – Broadmeadows VIC 1,244 3,503 182% 2,259
Canning WA 1,028 3,193 211% 2,165
Joondalup WA 852 3,017 254% 2,165
Gosnells WA 646 2,452 279% 1,805
Cockburn WA 615 2,306 275% 1,690
Ipswich Inner QLD 439 1,950 345% 1,511
Botany NSW 974 2,459 152% 1,485
Wyndham VIC 772 2,242 190% 1,470
Rockingham WA 385 1,811 371% 1,427
Parramatta NSW 1,198 2,542 112% 1,344
Springfield – Redbank QLD 383 1,701 345% 1,319
Armadale WA 370 1,658 348% 1,288
Melton – Bacchus Marsh VIC 563 1,783 217% 1,220
Bayswater – Bassendean WA 603 1,723 186% 1,120
Melville WA 738 1,857 152% 1,119
Brisbane Inner QLD 1,102 2,211 101% 1,110
Baulkham Hills NSW 1,025 2,121 107% 1,096
Casey – South VIC 588 1,675 185% 1,087
Strathfield – Burwood – Ashfield NSW 1,089 2,165 99% 1,076
Merrylands – Guildford NSW 1,029 2,091 103% 1,063
Bankstown NSW 1,125 2,156 92% 1,031
Brimbank VIC 974 2,001 105% 1,027
Jimboomba QLD 240 1,251 422% 1,011
Fairfield NSW 1,055 2,057 95% 1,002
Source: Infrastructure Australia analysis of modelling data from Veitch Lister Consulting (2014a) and ACIL Allen Consulting (2014b)
90 Australian Infrastructure Audit Report
7.1.1.3 Sectoroutlookandfindings
The Audit analysis above shows the impact on Australia’s urban transport systems of projected population growth in the major capital cities.
Demand for key road corridors is projected to exceed supply, particularly in the cities with less well-developed rail networks. Managing this demand will require integrated solutions likely to include additional capacity in both road and rail networks, and other demand management measures to support the efficient movement of vehicles that are most important for supporting economic development – trucks, commercial vehicles and road-based public transport. These demand management measures could include CBD parking levies, increased use of lanes for High Occupancy Vehicles and buses and, ultimately, road pricing.
Efforts to increase the density of our cities in response to demand for housing, especially around major transport nodes, have been modest to date. Notwithstanding significant challenges in this area, a greater emphasis on integrated transport and land use planning will be required to meet changing community expectations and to make the most of our existing and future transport networks.
Projected growth in trips to and from the major central business districts will require capacity increases, particularly in the public transport networks which already service the majority of trips to these regions. While the use of public transport has been increasing since 2004, currently only one in six Australians travel to work by mass transit.171 The Audit projects that demand for public transport (measured in passenger kilometres travelled) will increase by 89 per cent by 2031, indicating that governments will need to focus on expanding the capacity of existing services, as well as providing new infrastructure to communities in growth areas, often on the outskirts of urban areas.172
As public transport networks are expanded in urban centres, the issue of cost recovery will become increasingly important. At present, the average fare recovery in Australian cities is around 25 to 30 per cent of overall costs, with services to outer urban areas recovering less than 10 per cent of costs.173 In order to ensure the sustainability of services across urban mass transit networks, governments and service providers will need to improve efficiencies in terms of delivery and administration.
Public transport will also be an emerging issue outside of capital cities. Regional centres will require increased provision of public transport options in order to maximise economic opportunities for local communities and to improve access to health, education and other services.
Auditfindings48. Demand for urban transport
infrastructure is projected to increase significantly. The cost of congestion in our capital cities, estimated at $13.7 billion in 2011, is expected to increase to around $53.3 billion in 2031, or around 290 per cent, in the absence of additional capacity and/or demand management.
49. Demand for many key urban road and rail corridors is projected to significantly exceed current capacity by 2031.
50. Urban transport decisions need to complement land use decisions (especially about the supply and affordability of housing). Although some improvements have been made in this area, there remains a risk that community resistance to land use change and higher densities will undermine the economic, social and environmental benefits of investment in urban transport.
7.1.2 NationalhighwaysAs measured in the Audit, national highways include:
■ interstate routes connecting key urban centres across Australia, as defined by the National Land Transport Network174; and
■ key freight routes, broadly those identified by the Transport and Infrastructure Council. The text below provides further detail regarding the criteria for selection of key freight routes as covered in the Audit.
To avoid double counting, this does not include national highways that fall within the capital cities, as they were captured as part of the Audit’s urban transport analysis.
Transport and Infrastructure ministers from the Australian and state/territory governments agreed at the November 2014 meeting of the Transport and Infrastructure Council to release maps of an agreed set of key freight routes (both road and rail) across the country. Guiding principles for the selection of the routes were that they:
■ connect existing and potential nationally significant places for freight such as:
─ intermodal freight terminals;
171. Australian Bureau of Statistics (2014c)
172. Veich Lister Consulting (2014a)
173. Bureau of Infrastructure, Transport and Regional Economics (2014a)
174. The National Land Transport Network is defined in the National Land Transport Network Determination 2014. The current version is Variation 1, dated 19 March 2015. See ComLaw (2015).
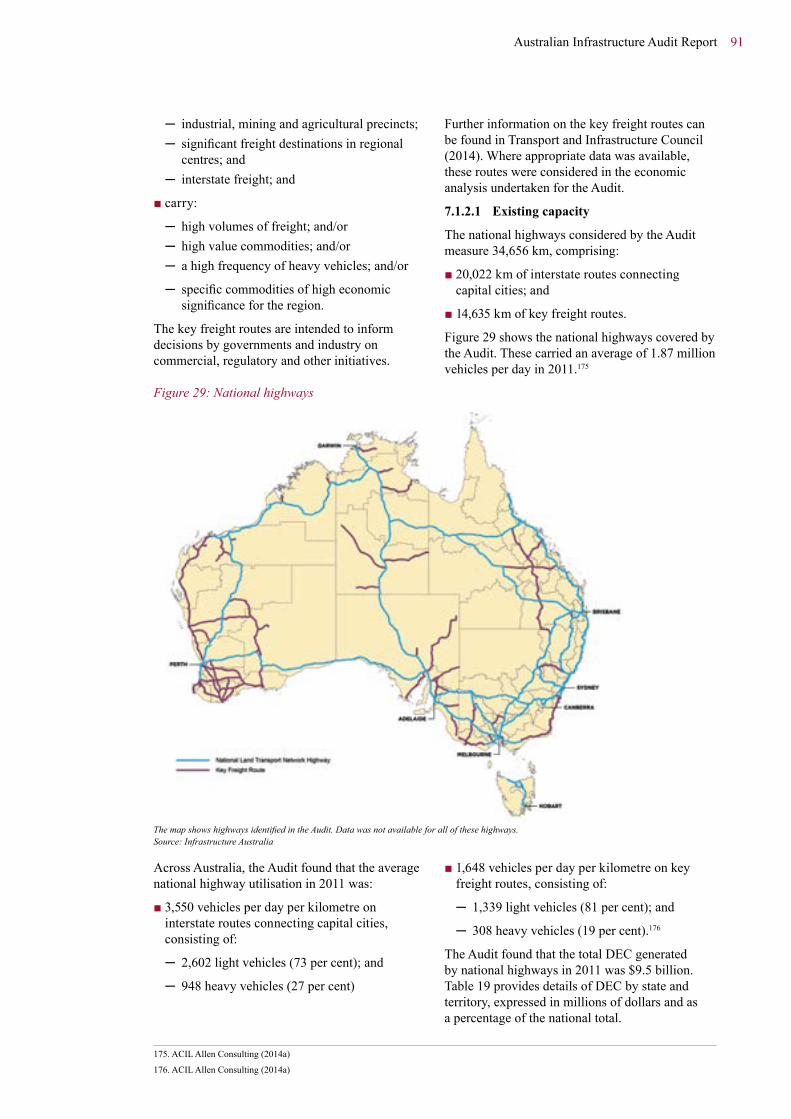
Australian Infrastructure Audit Report 91
─ industrial, mining and agricultural precincts; ─ significant freight destinations in regional centres; and
─ interstate freight; and
■ carry:
─ high volumes of freight; and/or ─ high value commodities; and/or ─ a high frequency of heavy vehicles; and/or
─ specific commodities of high economic significance for the region.
The key freight routes are intended to inform decisions by governments and industry on commercial, regulatory and other initiatives.
Further information on the key freight routes can be found in Transport and Infrastructure Council (2014). Where appropriate data was available, these routes were considered in the economic analysis undertaken for the Audit.
7.1.2.1 Existing capacity
The national highways considered by the Audit measure 34,656 km, comprising:
■ 20,022 km of interstate routes connecting capital cities; and
■ 14,635 km of key freight routes.
Figure 29 shows the national highways covered by the Audit. These carried an average of 1.87 million vehicles per day in 2011.175
Figure 29: National highways
The map shows highways identified in the Audit. Data was not available for all of these highways. Source: Infrastructure Australia
Across Australia, the Audit found that the average national highway utilisation in 2011 was:
■ 3,550 vehicles per day per kilometre on interstate routes connecting capital cities, consisting of:
─ 2,602 light vehicles (73 per cent); and
─ 948 heavy vehicles (27 per cent)
■ 1,648 vehicles per day per kilometre on key freight routes, consisting of:
─ 1,339 light vehicles (81 per cent); and
─ 308 heavy vehicles (19 per cent).176
The Audit found that the total DEC generated by national highways in 2011 was $9.5 billion. Table 19 provides details of DEC by state and territory, expressed in millions of dollars and as a percentage of the national total.
175. ACIL Allen Consulting (2014a)
176. ACIL Allen Consulting (2014a)

92 Australian Infrastructure Audit Report
Table 19: DEC for national highways by state and territory in 2011 ($ million, 2011 prices)
State DEC Share of national total
($m) %
NSW 3,598 37.9%
Victoria 1,493 15.7%
Queensland 2,393 25.2%
SA 512 5.4%
WA 726 7.6%
Tasmania 279 2.9%
NT 502 5.3%
ACT 0 0.0%
Source: ACIL Allen Consulting (2014a)
NSW had the highest DEC for national highways in 2011, with a total value of $3.6 billion, or 37.9 per cent of the national total. The ACT did not have any national highways outside the urban transport area measured by the Audit.
7.1.2.2 Demand projections
Demand for national highways will continue to be driven by two primary groups of users:
■ heavy vehicles, facilitating industrial production through freight transportation; and
■ light vehicles, enabling small business, household and community activities.
The overall trend in vehicle kilometres travelled (VKT) has been consistent growth over the past century. This has been supported by strong growth in per capita car ownership and relatively low domestic fuel prices compared to global markets over much of this period.177 However, there has been a decline in VKT per person since 2009. This can be largely attributed to the light vehicle market approaching saturation, increasing competition from domestic air travel, domestic petrol prices catching up to world oil prices, and generational changes in travel demand.
In terms of heavy vehicle demand for national highways, the then Standing Council on Transport and Infrastructure estimated that the national land freight task is expected to nearly double over the period from 2010 to 2030 – with a large component of this task expected to be handled by road freight vehicles.178 This growth projection is broadly supported by the Bureau of Infrastructure, Transport and Regional Economics (BITRE), which expects growth of 80 per cent from 2011 to 2031,179 as does modelling by the New South Wales (NSW) Government.180
The Audit forecasts the DEC of national highways across Australia to be $15.6 billion in 2031. Figure 30 shows the projected DEC for national highways by state and territory.
Figure 30: DEC for national highways by state and territory in 2011 and projected 2031 ($ million, 2011 prices)
NSW VIC QLD SA WA TAS NT ACT0
1,000
2,000
3,000
4,000
5,000
6,000
$ m
illio
n
2010–11
2030–31
Source: ACIL Allen Consulting (2014a)
177. Bureau of Infrastructure, Transport and Regional Economics (2012a)
178. Standing Council on Transport and Infrastructure (2012)
179. Bureau of Infrastructure, Transport and Regional Economics (2014b)
180. New South Wales Government (2013)

Australian Infrastructure Audit Report 93
While NSW is projected to continue to have the highest DEC for national highways in 2031, with 34 per cent of the national total, high levels of growth are expected in Queensland and Western Australia (WA). This is expected to be driven by strong population growth and investments in the mining and resources sector.
The Northern Territory (NT) is forecast to experience the highest growth of DEC for national highways, with 101 per cent growth from 2011 to 2031. However, the NT will remain a relatively small element of the national network, with only 6.5 per cent of the total Australian DEC for national highways.181
The overall growth in DEC for Australian national highways of $6.1 billion represents a total growth of 63.9 per cent over the period from 2011. This constitutes an average annual growth rate of 2.5 per cent.
This projected growth is slightly lower than the projected growth in GDP, reflecting the expectation that the declining growth in the productivity of heavy vehicles relative to the overall freight task may lead to a lower modal share for road freight. The economic contribution of the national highways is also projected to grow at a slower rate than other transport infrastructure services, such as ports and rail, which are expected to experience greater growth from factors such as export demand for minerals.
7.1.2.3 Sectoroutlookandfindings
Demand for national highways is expected to grow considerably to 2031 with strong population growth across the country. This will place increasing pressure on the current cost recovery model operated by governments.
At present, demand for national highways is moderated by the following charges:
■ registration fees ($7.5 billion);
■ tolls ($1.5 billion);
■ excise on fuel purchases ($9 billion); and
■ the National Heavy Vehicle Charges Determination (which is calculated using registration and road user charges).182
Of these measures, only the excise and road user charges vary according to use of roads, and are applied across the national network. Providing more transparent links between road user charges and expenditure on road planning, investment and maintenance may provide governments with greater means of implementing a more effective road user charging model than at present.
Developing funding methods that reflect the users’ willingness to pay and encourage private funding for projects are likely to emerge as key strategies to address growing demand for national highways.183
Demand for national highways for road freight has increased consistently over recent decades. BITRE estimates that the total road freight task for Australia (excluding road freight transported within the eight capital cities) increased from 19.2 billion tonne kilometres in 1971–72 to 157.8 billion tonne kilometres in 2012–13.184 It projects that across all Australian roads, the road freight task is projected to increase from 197 billion tonne kilometres in 2011 to 355 billion tonne kilometres in 2031, constituting growth of 80 per cent over this period.185
Figure 31 shows the growth of the national interstate and intrastate road task from 1971–72 to 2012–13. This road freight task has increased at an average annual rate of 5.1 per cent over the period, with noticeable dips in growth during the recession of the early 1990s and the financial crisis of 2007–08.
181. ACIL Allen Consulting (2014a)
182. Bureau of Infrastructure, Transport and Regional Economics (2014c)
183. ACIL Allen Consulting (2014a)
184. Bureau of Infrastructure, Transport and Regional Economics (2014d)
185. Bureau of Infrastructure, Transport and Regional Economics (2014b)

94 Australian Infrastructure Audit Report
Figure 31: Annual interstate and intrastate road freight – 1971–72 to 2012–1319
71-7
219
73-7
419
75-7
619
77-7
819
79-8
019
81-8
219
83-8
419
85-8
619
87-8
819
89-9
019
91-9
219
93-9
419
95-9
619
97-9
819
99-0
020
01-0
220
03-0
420
05-0
620
07-0
820
09-1
020
11-1
2
180
160
140
120
100
80
60
40
20
0
Interstate
Intrastate
Total (excl intracity)
billi
on tk
m
Source: Bureau of Infrastructure, Transport and Regional Economics (2014d)
Road freight experienced considerable productivity growth over this period, with the introduction of an expanded network for larger trucks (particularly B-double articulated trucks), as well as progressive increases in regulated heavy vehicle mass and dimension limits.186
Despite the strong growth in the overall road freight task over recent decades, the rate of growth has slowed over time. As illustrated by Figure 32, the growth in interstate and intrastate road freight (expressed as a 10 year moving average) has slowed considerably since 1982–83.
Figure 32: Annual growth in interstate and intrastate road freight – 10-year moving average – 1981–82 to 2012–13
10%
9%
8%
7%
6%
5%
4%
3%
2%
1%
0%
1981
-82
1982
-83
1983
-84
1984
-85
1985
-86
1986
-87
1987
-88
1988
-89
1989
-90
1990
-91
1991
-92
1992
-93
1993
-94
1994
-95
1995
-96
1996
-97
1997
-98
1998
-99
1999
-00
2000
-01
2001
-02
2002
-03
2003
-04
2004
-05
2005
-06
2006
-07
2007
-08
2008
-09
2009
-10
2010
-11
2011
-12
2012
-13
Source: Infrastructure Australia analysis of Bureau of Infrastructure, Transport and Regional Economics (2014d)
186. Bureau of Infrastructure, Transport and Regional Economics (2014e)

Australian Infrastructure Audit Report 95
BITRE notes that the recent slowing of growth of the road freight task has been mirrored by a slowing of growth in the productivity of the sector. This trend is expected to continue. The productivity impact of anticipated transitions to higher heavy vehicle load limits and higher productivity vehicles such as B-triples and AB-triples is expected to be minimal.187
The forecast almost doubling of the national land freight task from 2010 to 2030,188 will drive heavy vehicle demand on the national highways. Given that fleet-wide average loads are expected to grow by less than 10 per cent over this period – an average annual rate of growth of 0.3 per cent – the increase in demand for national highways could be considerable.189
High levels of forecast growth in the overall road freight task with low levels of growth in vehicle capacity would result in a dramatic increase in the number of vehicles and drivers operating on the national highways. This trend could have significant implications for the national highways with regard to capacity, safety and maintenance costs.
The Australian Infrastructure Plan is likely to investigate policies and reforms that address this potential trend, including pursuing heavy vehicle road charging. Governments will need to commit sufficient funds to ensure the national highways are maintained at a level to support forecast levels of service, with transparent reporting of costs to road users and the public so that charges can be clearly linked to the services provided.
Performance improvements to the national highways will be required to support the increased use of high-productivity vehicles and to achieve improvements in safety ratings of these roads.
Integrated long-term planning in the freight sector is essential to ensuring that Australia meets the forecast growth in the overall freight task as efficiently as possible. Critical assessment of policies that deliver the most appropriate modal share in each capital city and freight corridor will allow infrastructure investments to deliver the greatest benefits across the network.
Auditfindings51. The national land freight task is expected to grow by 80 per cent between 2011 and 2031, with
a large component of this task expected to be handled by road freight vehicles.
52. Accommodating this growth will require a focus on policy reform to enable the wider use of higher productivity heavy vehicles (such as B-triples), and selected investment (such as increasing bridge load limits and targeted safety improvements, aimed at improving the performance of national highway infrastructure).
187. Bureau of Infrastructure, Transport and Regional Economics (2011)
188. Standing Council on Transport and Infrastructure (2012)
189. Bureau of Infrastructure, Transport and Regional Economics (2011)

96 Australian Infrastructure Audit Report
7.1.3 Freight railFreight rail infrastructure is a key part of supply chains for bulk goods supporting mining and agriculture. Rail offers an alternative to road transport and societal benefits in terms of lower emissions, reduced road congestion and increased safety per tonne kilometre, particularly over longer distances or when carrying heavy goods.190
The Audit considers the value-add of ‘below-rail’191 infrastructure used for freight rail services. Passenger rail services in the cities and major suburbs are
estimated separately and included in the urban transport analysis. Passenger services on the interstate freight network, such as the Ghan, the Indian Pacific and country network passenger services are included in the Audit, but do not materially affect the results. The Audit should be viewed as largely reflecting freight infrastructure services.
The rail network reported in the Audit is shown in Figure 33. The shading depicts the value-add of rail services across Australia in 2011 by Audit region.
Figure 33: Freight rail network included in the Audit
Source: ACIL Allen Consulting (2014a)
190. ACIL Allen Consulting (2014a)
191. Below-rail services are the services provided to rail transport operators, including the provision of rail tracks and associated infrastructure such as signalling.
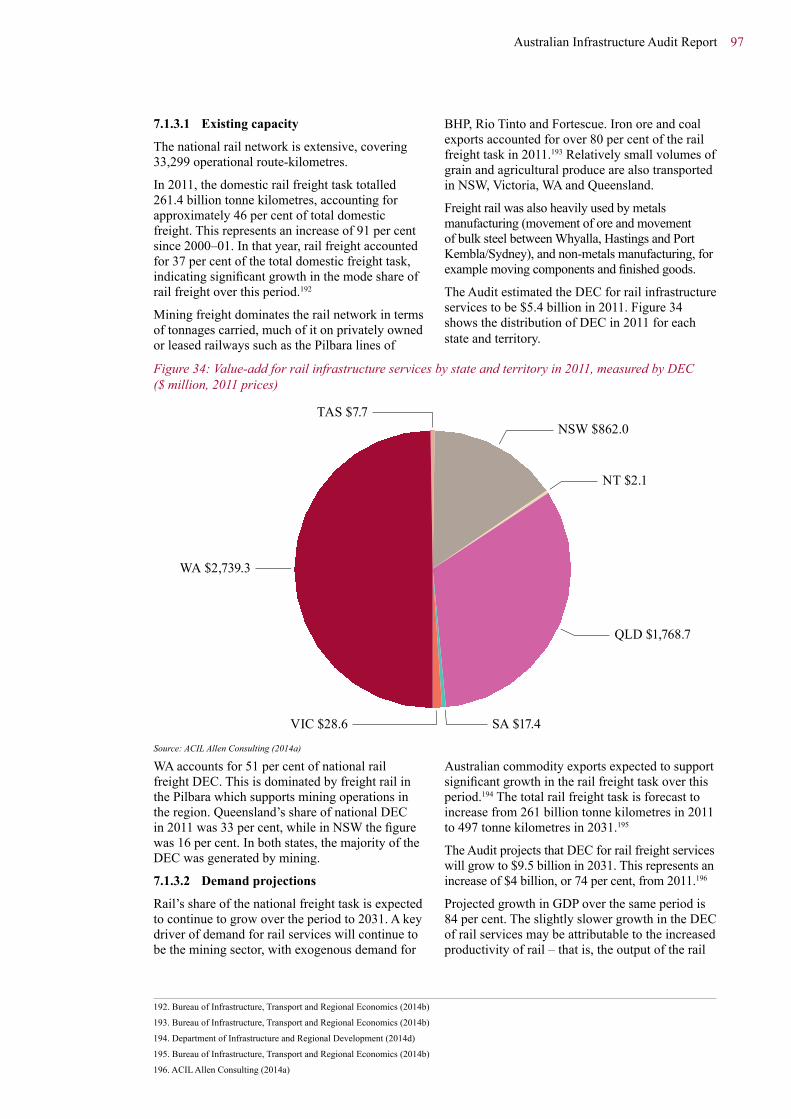
Australian Infrastructure Audit Report 97
7.1.3.1 Existing capacity
The national rail network is extensive, covering 33,299 operational route-kilometres.
In 2011, the domestic rail freight task totalled 261.4 billion tonne kilometres, accounting for approximately 46 per cent of total domestic freight. This represents an increase of 91 per cent since 2000–01. In that year, rail freight accounted for 37 per cent of the total domestic freight task, indicating significant growth in the mode share of rail freight over this period.192
Mining freight dominates the rail network in terms of tonnages carried, much of it on privately owned or leased railways such as the Pilbara lines of
BHP, Rio Tinto and Fortescue. Iron ore and coal exports accounted for over 80 per cent of the rail freight task in 2011.193 Relatively small volumes of grain and agricultural produce are also transported in NSW, Victoria, WA and Queensland.
Freight rail was also heavily used by metals manufacturing (movement of ore and movement of bulk steel between Whyalla, Hastings and Port Kembla/Sydney), and non-metals manufacturing, for example moving components and finished goods.
The Audit estimated the DEC for rail infrastructure services to be $5.4 billion in 2011. Figure 34 shows the distribution of DEC in 2011 for each state and territory.
Figure 34: Value-add for rail infrastructure services by state and territory in 2011, measured by DEC ($ million, 2011 prices)
NSW $862.0
NT $2.1
QLD $1,768.7
SA $17.4VIC $28.6
WA $2,739.3
TAS $7.7
Source: ACIL Allen Consulting (2014a)
WA accounts for 51 per cent of national rail freight DEC. This is dominated by freight rail in the Pilbara which supports mining operations in the region. Queensland’s share of national DEC in 2011 was 33 per cent, while in NSW the figure was 16 per cent. In both states, the majority of the DEC was generated by mining.
7.1.3.2 Demand projections
Rail’s share of the national freight task is expected to continue to grow over the period to 2031. A key driver of demand for rail services will continue to be the mining sector, with exogenous demand for
Australian commodity exports expected to support significant growth in the rail freight task over this period.194 The total rail freight task is forecast to increase from 261 billion tonne kilometres in 2011 to 497 tonne kilometres in 2031.195
The Audit projects that DEC for rail freight services will grow to $9.5 billion in 2031. This represents an increase of $4 billion, or 74 per cent, from 2011.196
Projected growth in GDP over the same period is 84 per cent. The slightly slower growth in the DEC of rail services may be attributable to the increased productivity of rail – that is, the output of the rail
192. Bureau of Infrastructure, Transport and Regional Economics (2014b)
193. Bureau of Infrastructure, Transport and Regional Economics (2014b)
194. Department of Infrastructure and Regional Development (2014d)
195. Bureau of Infrastructure, Transport and Regional Economics (2014b)
196. ACIL Allen Consulting (2014a)
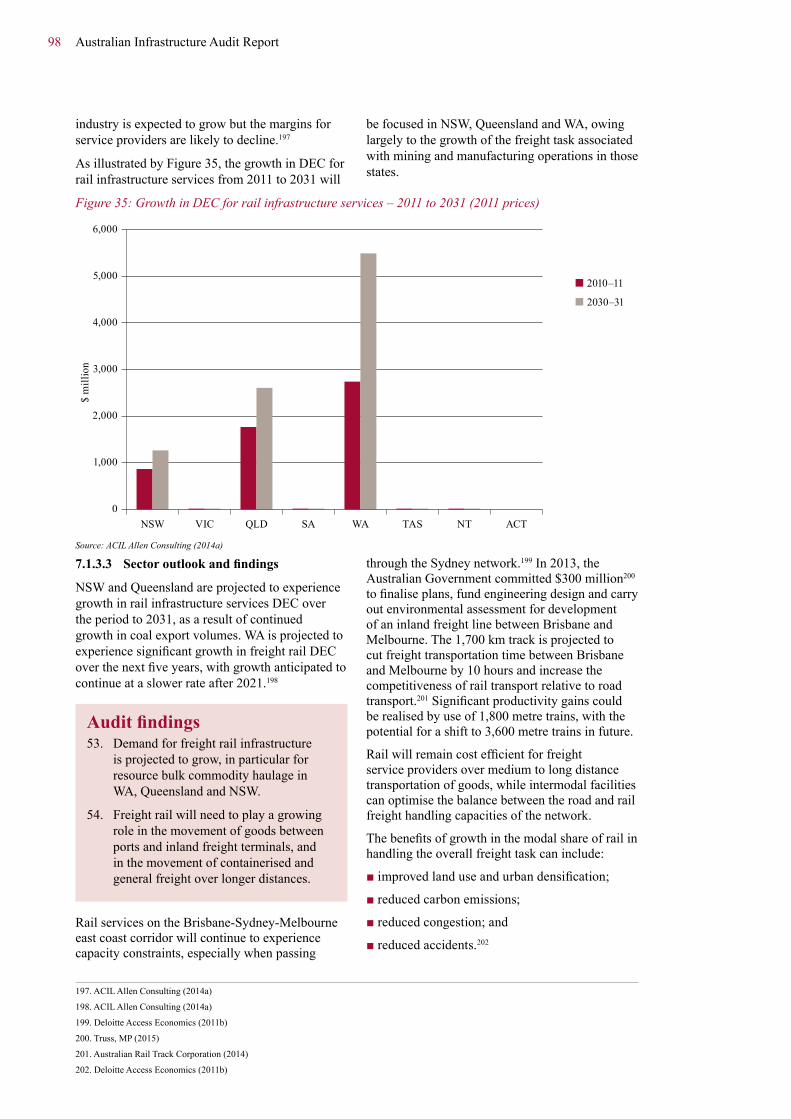
98 Australian Infrastructure Audit Report
industry is expected to grow but the margins for service providers are likely to decline.197
As illustrated by Figure 35, the growth in DEC for rail infrastructure services from 2011 to 2031 will
be focused in NSW, Queensland and WA, owing largely to the growth of the freight task associated with mining and manufacturing operations in those states.
Figure 35: Growth in DEC for rail infrastructure services – 2011 to 2031 (2011 prices)
NSW VIC QLD SA WA TAS NT ACT0
1,000
2,000
3,000
4,000
5,000
6,000
$ m
illio
n
2010–11
2030–31
Source: ACIL Allen Consulting (2014a)
7.1.3.3 Sectoroutlookandfindings
NSW and Queensland are projected to experience growth in rail infrastructure services DEC over the period to 2031, as a result of continued growth in coal export volumes. WA is projected to experience significant growth in freight rail DEC over the next five years, with growth anticipated to continue at a slower rate after 2021.198
Auditfindings53. Demand for freight rail infrastructure
is projected to grow, in particular for resource bulk commodity haulage in WA, Queensland and NSW.
54. Freight rail will need to play a growing role in the movement of goods between ports and inland freight terminals, and in the movement of containerised and general freight over longer distances.
Rail services on the Brisbane-Sydney-Melbourne east coast corridor will continue to experience capacity constraints, especially when passing
through the Sydney network.199 In 2013, the Australian Government committed $300 million200 to finalise plans, fund engineering design and carry out environmental assessment for development of an inland freight line between Brisbane and Melbourne. The 1,700 km track is projected to cut freight transportation time between Brisbane and Melbourne by 10 hours and increase the competitiveness of rail transport relative to road transport.201 Significant productivity gains could be realised by use of 1,800 metre trains, with the potential for a shift to 3,600 metre trains in future.
Rail will remain cost efficient for freight service providers over medium to long distance transportation of goods, while intermodal facilities can optimise the balance between the road and rail freight handling capacities of the network.
The benefits of growth in the modal share of rail in handling the overall freight task can include:
■ improved land use and urban densification;
■ reduced carbon emissions;
■ reduced congestion; and
■ reduced accidents.202
197. ACIL Allen Consulting (2014a)
198. ACIL Allen Consulting (2014a)
199. Deloitte Access Economics (2011b)
200. Truss, MP (2015)
201. Australian Rail Track Corporation (2014)
202. Deloitte Access Economics (2011b)

Australian Infrastructure Audit Report 99
Governments should seek to support projects and implement reforms that will support continued productivity growth in the rail services sector, and look to capitalise on the benefits of rail within an integrated cross-modal network plan.
7.1.4 PortsPorts play a central role in the Australian economy as they are an important part of supply chains, linking land and sea transport networks, as well as playing an integral role in serving domestic demand.
The Audit focuses on the value-add to the Australian economy attributable to the services provided by port infrastructure, not the value of the goods flowing through the ports (nor the costs of constructing the ports).
Australia’s ports serve many industries, from the export of bulk ores, minerals, liquefied natural gas and agricultural products, to containerised imports and exports, as well as passenger services. Australia’s port services can be broadly categorised as bulk or non-bulk, although many ports have the capacity for mixed use.
The Audit has defined bulk goods as being unpacked cargo which is superficially homogeneous. Such goods include dry bulk
such as coal, iron ore and grain as well as wet bulk liquid commodities (such as oil and other petroleum-based products). Bulk gas-based commodities including Liquefied Petroleum Gas, and Liquefied Natural Gas (LNG) are shipped in liquid form.203
Non-bulk ports for the purpose of the Audit primarily handle containers and general cargo, but also heavy machinery, steel and timber. Most are mixed-use ports which handle some goods which have bulk characteristics such as cement, grain or fuel. Non-bulk ports generally serve as a gateway for domestic and international goods to a local catchment, rather than acting as a link in a supply chain for a specific resource.
Many of Australia’s ports also play significant roles in national defence and border control. The ports of Townsville and Darwin provide critical infrastructure to Australia’s defence interests, and the ports in state capitals as well as Cairns and Gladstone provide ship repair, maintenance, supply and other logistics services to the Royal Australian Navy and allied forces.
For the purposes of the Audit, port services provided in 65 locations across Australia have been included. These ports are listed in Table 20.
Table 20: Ports included in the Audit by state and territory
NSW Eden Newcastle Port Botany Port Kembla Yamba
VIC Geelong Hastings Melbourne Portland Welshpool
QLD Abbot Point Brisbane Bundaberg Burketown Cairns (Nth & Sth) Cape Flattery
Gladstone Karumba Lucinda (Townsville) Mackay Maryborough Mourilyan
Port Alma Quintell Beach Rockhampton Thursday Island Townsville Weipa
WA Airlie Island Albany Broome Bunbury Dampier Derby Wharf
Esperance Fremantle Geraldton Kwinana Onslow Port Hedland
Port Walcott Thevenard Island Varanus Island Wyndham Yampi Sound
SA Adelaide Klein Point Port Bonython Port Giles Port Lincoln Port Pirie
Thevenard Wallaroo
TAS Burnie Bell Bay Devonport Hobart Port Latta Spring Bay
Stanley
NT Bing Bong Darwin Gove Milner Bay
Source: ACIL Allen Consulting (2014a)
203. ACIL Allen Consulting (2014a)

100 Australian Infrastructure Audit Report
7.1.4.1 Existing capacity
The Audit estimated that the national container handling capacity of Australia’s ports was 12 million twenty-foot equivalent units (TEU) in 2011. This was well in excess of the utilisation of ports across Australia, with 6.8 million TEU handled in 2011.204
This capacity limit includes a planning cap on Port Botany, which has subsequently been relaxed, providing scope for an additional four to five million TEU of handling capacity. The Port of Melbourne is currently making significant investments in its container handling capacity.
Australia’s bulk ports in the Pilbara were estimated to have the capacity to export 483 million tonnes of iron ore in 2011. Since then there has been substantial investment to nearly double this capacity. Exports from Port Walcott, Port Dampier and Port Hedland were estimated at around 420 million tonnes in 2011, 87 per cent of estimated capacity at that time.
Coal ports in Queensland and NSW also contribute significantly to Australia’s export volumes. In 2011, Newcastle, Gladstone, Hay Point and Dalrymple Bay, Brisbane, Abbot Point and Port Kembla exported a total of 286.2 million tonnes of coal.
In terms of total throughput, Australia’s ports handled 973 million mass tonnes of cargo in 2011, with more than 90 per cent of this being exports. The Audit estimates that Australia’s ports provide an aggregate capacity of 1,417 million tonnes.205
The DEC for Australia’s port services in 2011 was estimated at $20.7 billion. This equates to approximately 1.6 per cent of GDP in 2011.
Figure 36 shows the share of value-add of port services in each of the states and territories in 2011, measured by DEC. This highlights the significant contribution of each of the four largest states, with NSW, WA, Victoria and Queensland accounting for 92.5 per cent of the share of national DEC between them.
Figure 36: Share of value-add for port infrastructure services by state and territory in 2011, measured by DEC
NSW 25.4%
VIC 22.8%
SA 5.3%
WA 23.5%
QLD 20.8%
TAS 1.6% NT 0.5%
Source: ACIL Allen Consulting (2014a)
Despite the importance of ports as a supply chain link for commodity exports, non-bulk port services in each of the major cities accounted for the majority of national DEC for ports services. Port Botany in Sydney (22.5 per cent of national ports
DEC), Port of Melbourne (21.6 per cent), Port of Brisbane (14.5 per cent) and Fremantle Ports (12.8 per cent) each accounted for considerable shares of their respective state’s DEC.
204. ACIL Allen Consulting (2014a)
205. ACIL Allen Consulting (2014a)

Australian Infrastructure Audit Report 101
7.1.4.2 Future demand
Growth in demand for port services in Australia over the period to 2031 is expected to be driven by the growth in demand for Australia’s exports, particularly in the mining and resources sector. Forecast strong population and economic growth in China and throughout South-East Asia will ensure that Australia’s ports remain an integral part of the national economy.
Population and economic growth within Australia will also support growth in demand for port services, as the demand for largely containerised imports will increase.
The DEC for each port reflects the tonnage moved through it and the relevant share of the gross value added in the region. However, bulk ports form a link in the wider supply chain, and maximum
throughput requires efficient and matched railway networks and shipping channels.
The DEC for port infrastructure services in Australia is expected to grow to $41.9 billion by 2031, meaning that this figure will more than double from 2011, when it was $20.7 billion. This represents an annualised growth rate of 3.6 per cent over the period from 2011 to 2031.206
As illustrated by Figure 37, WA is forecast to experience the strongest growth in DEC over the period, with an increase of 216 per cent. This is expected to be largely driven by the growth of port services in the Pilbara region, to support dramatic growth in the commodity export supply chain. The DEC for ports in the Pilbara region is forecast to grow from $1.8 billion in 2011 to $8.3 billion in 2031.
Figure 37: Growth in DEC for port infrastructure services – 2011 to 2031 (2011 prices)
NSW VIC QLD SA WA TAS NT ACT0
2,000
4,000
6,000
8,000
16,000
14,000
12,000
10,000
18,000
$ m
illio
n
2010–11
2030–31
Source: ACIL Allen Consulting (2014a)
7.1.4.3 Sectoroutlookandfindings
The Audit projected that growth in the demand for Australia’s port services will vary across the nation. Ensuring that investments in ports and the supporting landside infrastructure are delivered in accordance with specific regional demand trends will require planning by governments and service providers.
While containerised trade is likely to grow in accordance with broader population and economic growth, demand for Australia’s bulk commodities is likely to exceed domestic GDP growth.
The Bureau of Infrastructure, Transport and Regional Economics recently released forecasts of trade through Australia’s ports to 2032–33.207 At a national level, the Bureau forecasts an annual average growth rate of 5.1 per cent between 2011–12 and 2032–33 in the number of containers moved through Australia’s ports (measured in TEUs). Non-containerised trade is projected to grow at an annual average growth rate of 3.9 per cent over the same period. Table 21 summarises the results over the audit period from 2011 to 2031.
206. ACIL Allen Consulting (2014a)
207. The Bureau of Infrastructure and Transport’s projections assume a slightly lower rate of growth in GDP over the period covered by the audit. The assumed rate of growth is 2.7 per cent per year, compared to 3.1 per cent per year in the Audit.
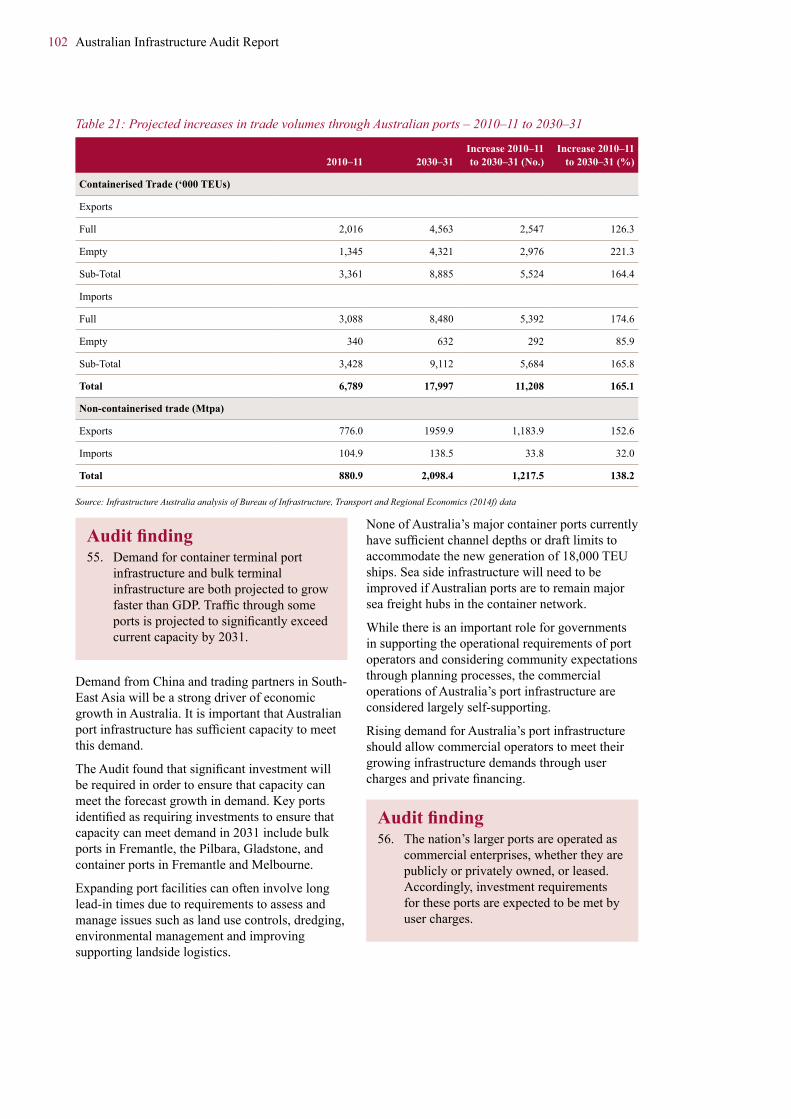
102 Australian Infrastructure Audit Report
Table 21: Projected increases in trade volumes through Australian ports – 2010–11 to 2030–31
2010–11 2030–31Increase 2010–11 to 2030–31 (No.)
Increase 2010–11 to 2030–31 (%)
Containerised Trade (‘000 TEUs)
Exports
Full 2,016 4,563 2,547 126.3
Empty 1,345 4,321 2,976 221.3
Sub-Total 3,361 8,885 5,524 164.4
Imports
Full 3,088 8,480 5,392 174.6
Empty 340 632 292 85.9
Sub-Total 3,428 9,112 5,684 165.8
Total 6,789 17,997 11,208 165.1
Non-containerised trade (Mtpa)
Exports 776.0 1959.9 1,183.9 152.6
Imports 104.9 138.5 33.8 32.0
Total 880.9 2,098.4 1,217.5 138.2
Source: Infrastructure Australia analysis of Bureau of Infrastructure, Transport and Regional Economics (2014f) data
Auditfinding55. Demand for container terminal port
infrastructure and bulk terminal infrastructure are both projected to grow faster than GDP. Traffic through some ports is projected to significantly exceed current capacity by 2031.
Demand from China and trading partners in South-East Asia will be a strong driver of economic growth in Australia. It is important that Australian port infrastructure has sufficient capacity to meet this demand.
The Audit found that significant investment will be required in order to ensure that capacity can meet the forecast growth in demand. Key ports identified as requiring investments to ensure that capacity can meet demand in 2031 include bulk ports in Fremantle, the Pilbara, Gladstone, and container ports in Fremantle and Melbourne.
Expanding port facilities can often involve long lead-in times due to requirements to assess and manage issues such as land use controls, dredging, environmental management and improving supporting landside logistics.
None of Australia’s major container ports currently have sufficient channel depths or draft limits to accommodate the new generation of 18,000 TEU ships. Sea side infrastructure will need to be improved if Australian ports are to remain major sea freight hubs in the container network.
While there is an important role for governments in supporting the operational requirements of port operators and considering community expectations through planning processes, the commercial operations of Australia’s port infrastructure are considered largely self-supporting.
Rising demand for Australia’s port infrastructure should allow commercial operators to meet their growing infrastructure demands through user charges and private financing.
Auditfinding56. The nation’s larger ports are operated as
commercial enterprises, whether they are publicly or privately owned, or leased. Accordingly, investment requirements for these ports are expected to be met by user charges.
Australian Infrastructure Audit Report 103
While the majority of Australia’s ports are operated as private entities, there is an important role for governments from a regulatory perspective. Ensuring that growth occurs efficiently and sustainably is in the national interest.
The sea channels supporting the operation of our ports are also nationally important assets, especially environmental assets such as the Great Barrier Reef and other local ecosystems. This is a key consideration in the planning and operational processes of port and sea freight service providers.
While the Audit projects significant growth in demand for Australia’s port services, it is important to consider the implications of this growth for the landside connections required to support the overall cargo supply chains.
Governments will continue to have a key role in supporting the development of intermodal facilities and landside road and rail infrastructure, while facilitating productivity improvements through pricing and regulatory reform and competition policy oversight. Supporting regulatory changes such as introducing curfew-free operations where the effects on local communities are limited can deliver significant productivity improvements.
A bottleneck in landside infrastructure can lead to underperformance of the whole supply chain. For this reason, Australia’s best-performing logistics chains in the Pilbara are operated by mining companies that own mines, rail and port facilities. Where ownership of rail and ports is not practical, supply chain coordination is required to ensure that all links in the chain complement each other – a good example of this is the Hunter Valley Coal Chain.
Auditfinding57. Given wider funding constraints,
governments face challenges in ensuring adequate landside rail and road access to ports.
7.1.5 AirportsAirports are an integral part of Australia’s economic infrastructure. Most airport activity is concentrated in the large airports, with the top 10 busiest Australian airports (in each of the eight capital city airports plus Gold Coast Airport and Cairns Airport) contributing to more than 80
per cent of total passenger traffic in Australia in 2011.208
7.1.5.1 Existing capacity
In total, Australia’s airports facilitated 146.5 million passenger movements in 2013–14. Total passenger movements, encompassing those on scheduled domestic, regional and international flights, was highest at Sydney Airport (38.6 million), followed by Melbourne Airport (30.9 million) and Brisbane Airport (21.8 million).209
Airport capacity can be characterised as the maximum throughput of passengers per unit of time. This measure depends on:
■ aircraft type;
■ number, length and material of runway;
■ terminal size and design;
■ air traffic control facilities; and
■ external constraints, such as aircraft movement caps, curfews and noise abatement procedures.
However, there is no single straightforward measure of the practical capacity of an airport.210 Demand for airport infrastructure services can vary significantly across peak and non-peak periods, while other factors including weather conditions and environmental constraints have an impact. For some airports, the airside infrastructure may be able to handle a far greater capacity than the terminal infrastructure or supporting transport links, resulting in bottlenecks for passenger and cargo flows.
Australia’s biggest airports, such as Sydney (Kingsford Smith), Melbourne (Tullamarine) and Brisbane, are currently at or near capacity during peak periods. An increase in air services to support the resources sector has placed some regional airports under significant pressure to meet growing demand.211
The DEC for Australia’s airport services in 2011 was estimated to be $20.7 billion. This equated approximately 1.6 per cent of GDP.
Figure 38 shows the share of value-add of airport services in each of the state and territories in 2011, measured by DEC.
208. ACIL Allen Consulting (2014a)
209. Bureau of Infrastructure, Transport and Regional Economics (2014i)
210. Australian Government and New South Wales Government (2012)
211. Bureau of Infrastructure, Transport and Regional Economics (2012b)

104 Australian Infrastructure Audit Report
Figure 38: Share of value-add for airport infrastructure services by state and territory in 2011, measured by DEC
NSW 27.4%
VIC 19.6%
SA 8.2%
WA 9.1%
QLD 26.3%
TAS 2.5%
NT 2.5% ACT 4.4%
Source: ACIL Allen Consulting (2014a)
7.1.5.2 Projected demand
Demand for Australia’s airport services is expected to grow considerably over the period to 2031. This will be driven by leisure tourism activities and the regional expansion of strategic resource and agriculture activities.
The trend towards a more globalised and intra-national business supply chains will continue. As businesses become more strongly linked to
suppliers and customer markets beyond their immediate vicinity, they are increasingly reliant on air-based services to move workers and freight.
The DEC for airport infrastructure services in Australia is projected to grow to $40.9 billion by 2031, an increase of 97.9 per cent from 2011 and an annualised growth rate of 3.5 per cent over the period.

Australian Infrastructure Audit Report 105
Figure 39: Growth in DEC for airport infrastructure services – 2011 to 2031 (2011 prices)
NSW VIC QLD SA WA TAS NT ACT0
2,000
4,000
6,000
8,000
10,000
12,000$
mill
ion
2010–11
2030–31
Source: ACIL Allen Consulting (2014a)
Queensland is expected to overtake NSW in terms of the DEC of airport infrastructure by 2031.
This will be largely driven by high levels of population growth in Queensland, as well as air services supporting growth in the resources sector.
The Audit projects strong growth in the DEC for airport services in WA, with a forecast growth rate of 5.1 per cent per year from 2011 to 2031. The DEC for the regions of Perth and the Pilbara is expected to more than double over this period,212 largely due to the expected growth in air services to support the resources sector, as well as an increase in Perth’s role as a hub for travel to South-East Asia and Middle Eastern destinations.
7.1.5.3 Sectoroutlookandfindings
The Audit found that the DEC for airport infrastructure in Australia is expected to grow faster than GDP over the period to 2031. Airports will play an increasingly vital role in supporting the business and leisure activities of Australians, as well as supporting the tourism sector as the gateway for growing numbers of international visitors.
Growth in demand for airport services is expected to be marginally lower than the growth in demand for ports infrastructure (3.6 per cent per year) but still higher than forecast GDP growth (3.1 per cent).213 While the two sectors cater to vastly
different domestic and global economic markets, both will be critical to supporting Australia’s economic growth over the period to 2031.
Auditfinding58. Demand for airport infrastructure is
projected to approximately double between 2011 and 2031.
The forecast growth in demand for airports in Australia’s major cities is likely to lead to capacity shortfalls in the short to medium-term.
Joint work by the Australian and NSW Governments in 2011 and 2012 forecast that passenger numbers at Sydney Airport would grow to 76 million by 2035.214 Projections prepared by the airport operator, suggesting a passenger throughput of 74.3 million in 2033, are consistent with these projections.215 The proposed Western Sydney Airport will be developed and operated by the private sector, with the operator of Kingsford Smith Airport having the first right of refusal to undertake this development. The Australian Government has committed $3 billion to developing the road network servicing the proposed site. The NSW Government has committed a further $600 million for the roads and has proposed reserving a rail corridor to the site.
212. ACIL Allen Consulting (2014a)
213. ACIL Allen Consulting (2014a)
214. Australian Government and New South Wales Government (2012), p. 6. On these figures, the airport will be handling more passengers than London’s Heathrow Airport handled in 2013 (72.4 million).
215. Sydney Airport Corporation Limited (2014), p. 49

106 Australian Infrastructure Audit Report
Melbourne Airport’s runways are projected to reach capacity at peak periods in the medium-term. The operator is preparing to develop a parallel East−West runway, which will provide capacity to cater for several decades of growth. This development will be funded by the operator.
Brisbane Airport’s main runway is projected to reach capacity at peak periods in the medium-term. The operator has commenced development of a parallel runway, which it expects will be completed by 2020 and will provide capacity to cater for several decades of growth. This development is being funded by the operator, in part from additional landing fees paid by current users.
Both the runways and terminals at Perth Airport are approaching capacity at peak periods. The operator is currently developing additional terminal capacity, and preparing to develop a parallel runway. These developments are being funded by the operator.
If airports do not (or cannot) expand to cope with the expected growth in demand, airlines will raise fares and freight charges as flights reach capacity and new airlines (e.g. low cost carriers) will be unable to obtain landing slots, particularly during peak periods. This would reduce consumer welfare and the competitiveness of businesses across the country, and there would be a knock-on effect for the wider economy. The adverse consequences of congestion in the aviation network were set out in the Joint Study on Aviation Capacity in the Sydney Region.216
Auditfinding59. Australia’s 10 busiest airports handle
more than 80 per cent of total passenger traffic. Over the next 15 years, additional capacity will be required in Sydney, Brisbane, Perth and Melbourne. The regulatory framework for airports, which obliges private airport operators to provide required airport capacity, appears to be working appropriately.
The major airports in Australia generally operate at sustainable commercial returns on the capital invested, and are subject to a light handed price regulation regime that replaced price cap regulation.
The Productivity Commission found that, while some capital city airports hold considerable market power, the current regulatory framework facilitates delivery of a reasonably competitive domestic air services market, with relatively good service quality outcomes.217
The Australian Competition and Consumer Commission monitors information relating to prices, costs, profits and service quality of aeronautical services and facilities at Australia’s four largest airports, publishing its findings at regular intervals. The Productivity Commission found this mechanism to be adequate in the current market.218
As the major airports have been privatised, their owners have assumed the primary role in developing facilities to meet customer and economic needs.
Given the strength of demand for air services across Australia’s major cities, airport service providers have the capacity to finance their operations and necessary infrastructure improvements to support demand through user charges and private financing.
Auditfinding60. The larger airports are all privately
operated commercial enterprises, and investment requirements for these airports should be able to be met by user charges. However, given wider funding constraints, governments and airport operators face challenges in ensuring adequate landside access to airports.
Governments (Australian, state and territory) need to play a role in developing or supporting road and public transport links. Land transport links to airports will need to be improved as demand for air services increases. This will involve developing an integrated transport plan to manage the passenger task to and from terminals through a mix of road, bus and rail options according to local requirements.
In some cities, the airport precincts already act as a bottleneck within the local network, requiring considerable investment to resolve current issues and adequately manage projected demand. Governments should work with airport service providers to establish arrangements for ensuring
216. Australian Government and New South Wales Government (2012)
217. Productivity Commission (2012)
218. Productivity Commission (2012)

Australian Infrastructure Audit Report 107
that landside transport links function effectively and to the benefit of all stakeholders.
Airport services provide critical links for supporting economic and social outcomes in many regional centres. Although airport service providers in Australia’s major cities will be able to offset infrastructure investments through user charges and private financing, this may not be the case for smaller regional airports.
Where appropriate, governments should undertake assessments of the economic and social benefits of smaller airports in order to support regional communities.
Auditfinding61. A number of smaller airports are
unlikely to have the throughput to cover their maintenance and potential capital costs. Governments will need to prioritise their outlays in support of these airports.
Auditfinding62. As well as being the largest
infrastructure sector, transport is also the most challenging, with relatively high projected growth in demand, a low proportion of user-based funding and market-based pricing mechanisms, challenges with project selection processes, and emerging maintenance issues in some segments.
7.2 Energy This section provides Audit data, analysis, projections and findings for energy infrastructure at a national level. It identifies key issues that will need to be considered in development of future energy sector initiatives and infrastructure.
This section is set out as follows:
■ existing capacity;
■ projected demand; and
■ sector outlook.
7.2.1 Existing capacity7.2.1.1 Electricity
In the Audit, the electricity sector covers generation, transmission and distribution facilities.
Growth in electricity consumption has slowed across Australia in the recent few years, and declined in the eastern states. This marks a break in the historic relationship between rising electricity use and economic and population growth. Peak demand has held relatively stable.219 The decline in electricity demand was unexpected and driven by a range of factors, including loss of large industrial loads, rising energy efficiency standards, increased penetration of small-scale photovoltaic (PV) systems, a wide range of national and jurisdictional energy efficiency initiatives, such as the National Framework for Energy Efficiency,220 and consumer response to increases in retail prices. A delayed reaction to the fall in demand has arguably led to overinvestment in network capacity.221
The electricity sector is currently dealing with two major areas of ongoing policy reform, in renewable energy policy, and in the regulation of networks and retail electricity prices.
Despite recent stagnant demand, there are likely to be significant developments and investment in parts of the electricity supply sector in the future, in response to policy, technology and consumption changes, and associated with the replacement of existing equipment.
The National Energy Market (NEM), which services the eastern states and SA, and the South West Interconnected System (SWIS), which services south-west WA, are the two main electricity grids in Australia. Together they serve more than 20 million residents. The NT is primarily served by the Darwin-Katherine electricity network, and the Pilbara region is served by the North-West Interconnected System (NWIS). As show in Figure 40, there are areas without access to the major grids. These include remote communities and resource operations,222 which generally face higher costs to generate and distribute electricity.
Electricity supply is now determined on commercial terms throughout Australia. Electricity infrastructure is generally provided where the cost of supply can be brought into balance with prices that users and consumers are able to pay.
219. Australian Energy Market Operator (2014a) and Independent Market Operator (2014)
220. Council of Australian Governments (2008)
221. Department of Industry and Science (2014c), p. viii
222. Bureau of Resources and Energy Economics (2013)
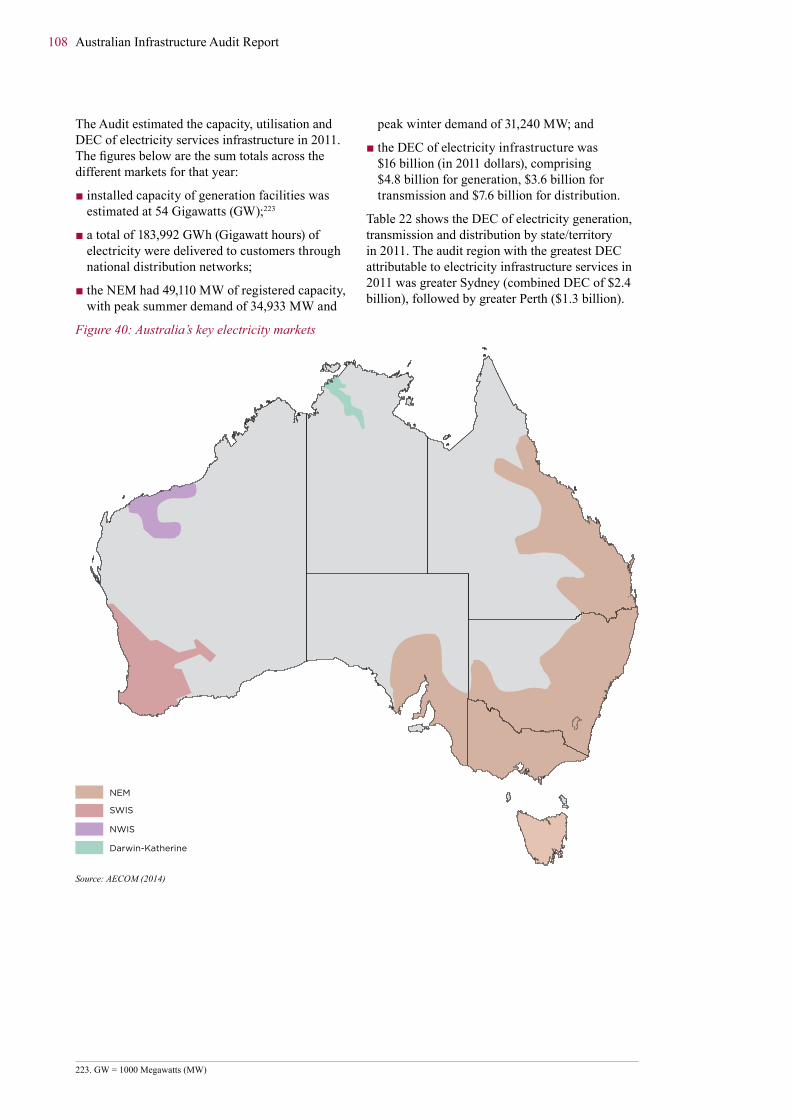
108 Australian Infrastructure Audit Report
The Audit estimated the capacity, utilisation and DEC of electricity services infrastructure in 2011. The figures below are the sum totals across the different markets for that year:
■ installed capacity of generation facilities was estimated at 54 Gigawatts (GW);223
■ a total of 183,992 GWh (Gigawatt hours) of electricity were delivered to customers through national distribution networks;
■ the NEM had 49,110 MW of registered capacity, with peak summer demand of 34,933 MW and
peak winter demand of 31,240 MW; and
■ the DEC of electricity infrastructure was $16 billion (in 2011 dollars), comprising $4.8 billion for generation, $3.6 billion for transmission and $7.6 billion for distribution.
Table 22 shows the DEC of electricity generation, transmission and distribution by state/territory in 2011. The audit region with the greatest DEC attributable to electricity infrastructure services in 2011 was greater Sydney (combined DEC of $2.4 billion), followed by greater Perth ($1.3 billion).
Figure 40: Australia’s key electricity markets
NEM
SWIS
NWIS
Darwin-Katherine
Source: AECOM (2014)
223. GW = 1000 Megawatts (MW)

Australian Infrastructure Audit Report 109
Table 22: Electricity generation, transmission and distribution DEC by state/territory – 2011 (2011 prices)
State Generation DEC Transmission DEC Distribution DEC
($m) ($m) ($m)
NSW 1,254 835 3,190
VIC 1,240 434 1,400
QLD 560 684 2,026
SA 194 246 550
WA 1,163 1,178 -
TAS 393 204 227
NT 34 - 85
ACT - 28 140
Australia 4,838 3,609 7,618
Source: ACIL Allen Consulting (2014a)
Historically, growth in electricity demand has outpaced that of the population and GDP. However, recent electricity demand growth has been below historic averages for both major grids.
An outright decline in demand has been a persistent trend in the eastern states. In 2009, the electricity networks sent out 195 TWh224 of operational energy across the NEM. This had fallen to 181.2 TWh by 2014 − a decline of seven per cent.225
The SWIS has seen a softening in demand growth in recent years. Average annual growth from 2011 to 2014 was around 1.4 per cent, significantly below historic rates.226
7.2.1.2 Gas
The Audit has addressed gas transmission pipelines and distribution networks. Gas is an important fuel in both domestic and industrial applications. It makes up around 21 per cent of Australia’s energy supply. Total gas production in 2011–12 was around 48.2 billion cubic metres.227
Gas consumption accounted for around 23 per cent of total primary energy consumption in Australia in 2012–13.228 The manufacturing sector was Australia’s largest consumer of gas, followed by the electricity generation, mining, residential and commercial sectors.229
The domestic gas market can be divided into three customer segments:
■ gas-powered electricity generation;
■ the mass market, which includes residential and business customers; and
■ large industrial customers.
Like electricity, there are three distinct and separate geographic gas markets in operation230 in Australia:
■ the Eastern gas region (covering NSW, Victoria, Queensland, SA, Tasmania and the ACT);
■ the Western gas region (WA); and
■ the Northern gas region (NT).
Gas supply and demand are brought into balance by prices set on a commercial basis.
The Eastern gas market is undergoing profound change with the start of LNG exports. There are concerns that exposure to international prices may result in gas shortfalls in some regions and states, and/or rapid price adjustments in the near to medium-term.231
The Audit estimated the existing capacity, utilisation and DEC of gas services infrastructure in 2011 and found that:
■ total capacity of Australian natural gas transmission pipelines was 1,918 petajoules (PJ) per year;
■ total capacity in gas distribution networks was 344 PJ. This is lower than the total throughput of gas transmission pipelines because it represents gas supplied to residential, commercial and small industrial customers;
224. 1 TWh = 1000 GWh
225. Australian Energy Market Operator (2014a)
226. Independent Market Operator (2014)
227. Central Intelligence Agency (2014)
228. Department of Industry and Science (2014a)
229. Energy Supplier Association of Australia (2014)
230. Australian Energy Market Commission (2015)
231. Department of Industry and Science (2014c), p. 39

110 Australian Infrastructure Audit Report
■ total throughput of Australian natural gas transmission pipelines was 1,334 PJ;
■ total DEC of gas transmission services was $1.1 billion; and
■ the DEC of gas distribution services was $1.2 billion.
The contract structure in the gas market is an important determinant of pipeline investment.
High pressure gas pipelines typically connect gas production with a demand centre, such as a gas distribution system in a city, large industrial users, gas fired power generation or other gas pipelines. Pipelines are capital intensive (costing up to $5 billion to construct), require ongoing maintenance and have long asset lives of over 40 years. All major recent investments were underpinned by bilateral long-term take-or-pay transportation contracts between pipeline owners/operators and gas shippers (the customers buying the gas). These contracts provide certainty for pipeline owners to commit to significant upfront investment.
All pipelines built recently have been constructed by the private sector. They have been developed rapidly to connect supply of gas to areas of demand. Two factors impact on the efficient development of these pipelines.
First, there is currently no incentive for pipeline owners to factor in uncontracted capacity when considering construction of a new pipeline. This can, and has, resulted in inefficiencies where completed pipelines are subsequently expanded through compression or looping (adding another pipeline in the same easement) to meet additional demand.
Second, the certainty of the financial returns from the long-term contracts, and the ability to recontract a pipeline, is critical to securing approval for any significant upfront investment. The majority of existing Australian gas pipelines were constructed, and operate, under a long-term contract carriage system – where a bilateral contract exist between owners and shippers covering daily gas quantity, term and pricing. A pipeline may have multiple overlapping contracts at any one point. Other regulatory models exist, such as where shippers enter into a contract to move their gas on a daily basis if capacity is available. Some in the industry are concerned that wider application of this model could undermine the willingness of the private sector to build new pipelines.
7.2.1.3 Petroleum
Petroleum product distribution infrastructure includes refineries, pipelines and fuel terminals. The Australian petroleum industry is entirely owned and operated by the private sector and functions as part of the global market. Australia currently has six operating refineries and terminals at 28 locations around the country.232
Declining domestic oil crude production and refining capacity in Australia, coupled with growth in domestic demand for petroleum products, has resulted in a significant rise in imports to meet the country’s needs.233
The Audit estimated the existing capacity, utilisation and DEC of petroleum product terminal infrastructure in 2011:
■ Australian refineries produced around 37,400 megalitres (ML) of petroleum products;
■ the utilisation of petroleum product terminals in Australia was 79,199 ML;
■ of this total, 34,104 ML of throughput is attributable to terminals at refineries, some of which is conveyed by pipeline to other terminals;
■ the throughput of non-refinery terminals is the difference between these figures (45,095 ML);
■ total net consumption of petroleum was 52,095 ML; and
■ the DEC attributable to petroleum product terminals across Australia was $1.1 billion.
Table 23 presents the DEC of petroleum product terminal services by state and territory.
Table 23: DEC of petroleum product terminal services by state/territory, 2011 ($ million, 2011 prices)
State/Territory 2011 DEC ($m)
NSW 239
Vic 282
Qld 288
SA 40
WA 195
Tas 14
NT 19
Total 1,077
Source: ACIL Allen Consulting (2014a)
232. Australian Institute of Petroleum (2013b), p. 5
233. Bureau of Resources and Energy Economics (2014a), p. 16, p. 18
Australian Infrastructure Audit Report 111
Domestic demand for petroleum products has grown at an average annual rate of just over one per cent since 2000, and is expected to continue along this trajectory, largely driven by growth in population and economic activity.234 The transport sector uses more than 60 per cent of all petroleum consumed in Australia and has been the primary driver of demand growth.235 In addition, the expansion of the mining sector has contributed significantly to increased demand for diesel.
In the decade after 2003, the following demand trends emerged:
■ diesel use increased by 56 per cent, largely due to growth in the mining sector and increased uptake of cars fitted with new generation diesel technology engines;
■ jet fuel use increased by 80 per cent, due to growth in air travel;
■ petrol use declined, as vehicle fuel efficiency continued to improve along with hybrid technologies; and
■ there was a shift away from regular unleaded petrol (32 per cent decline) to higher octane petrol and ethanol blended petrol products.236
7.2.2 Demand projections 7.2.2.1 Electricity
The Australian Energy Market Operator (AEMO) expects little demand growth in the NEM, with average annual electricity demand forecast to grow by just 0.3 per cent per year for 20 years to 2033–34 in its medium scenario.237 Relatively slow growth in demand is also forecast to continue in the SWIS over the next 10 years, with the Independent Market Operator (IMO) expecting an average growth rate of 1.8 per cent over the period.238
The Audit projects the following capacity, demand and DEC for electricity services infrastructure in 2031:
■ national installed generation capacity is projected to reach 79 GW;
■ 333 TWh of electricity is projected to be generated (a 46 per cent rise from 2011);
■ 321 TWh of electricity is projected to be transmitted (a 48 per cent rise);
■ 262 TWh of electricity is projected to be distributed (a 43 per cent rise);
■ the highest growth in generation installed capacity between 2011 and 2031 is projected to occur in Queensland (56 per cent). Queensland is also projected to have the highest growth in transmission peak demand (59 per cent), while NSW (48 per cent) is projected to have the highest growth in distribution peak demand;
■ similar to capacity, the greatest proportional increases in utilisation for generation and transmission are projected to occur in Queensland (52 per cent and 67 per cent respectively);
■ DEC is set to rise to $26 billion for the electricity infrastructure services sector, an increase of 63 per cent from $16 billion in 2011; and
■ NSW has the highest projected increase in DEC ($8.2 billion) between 2011 and 2031.
Table 24 shows the projected proportional change in DEC by state/territory between 2011 and 2031.
It is worth noting the different views about future demand for electricity. AEMO forecasts239 minimal electricity consumption growth in the NEM.240 In contrast, consultants for the Audit project that the DEC of electricity infrastructure will continue to increase in those jurisdictions. There are several reasons for this variation. The Audit research assumes an energy efficiency improvement rate of 1.5 per cent per year (compared to an historic rate of 0.5–1.0 per cent), whereas AEMO assumes much faster rates, exceeding 20 per cent in some years. Consequently, electricity use forecasts underlying the Audit’s DEC measure are considerably higher than AEMO’s forecasts. Additionally, AEMO reports and forecasts unit electricity consumption in GWh, whereas DEC is a measure of the value-add provided by electricity infrastructure, expressed in dollar terms. The two are not necessarily perfectly correlated.
The top five audit regions in terms of growth in DEC between 2011 and 2031 are found in WA and Queensland. It is likely that this growth is mainly associated with spending on large industrial and mining projects.
234. Bureau of Resources and Energy Economics (2014b), p. 37
235. Department of Industry and Science (2014b)
236. Australian Institute of Petroleum (2013b), p. 5
237. Australian Energy Market Operator (2014a)
238. Independent Market Operator (2014)
239. Australian Energy Market Operator (2014a)
240. It is not possible to forecast aggregate peak demand across the NEM on the same basis as total consumption. Peak demand is determined by a range of factors, including weather, timing and the range of an area affected by a weather event. These will not necessarily (and rarely do) coincide across the various jurisdictions.

112 Australian Infrastructure Audit Report
Table 24: Projected proportional change in DEC by state/territory – 2011 to 2031
State DEC Generation DEC Transmission DEC Distribution DEC Total
NSW 55% 56% 55% 55%
VIC 55% 51% 52% 53%
QLD 50% 81% 52% 57%
SA 61% 59% 58% 59%
WA 108% 133% n/a 121%
TAS 15% 13% 14% 14%
NT 41% n/a 45% 44%
ACT n/a 47% 47% 47%
Australia 64% 83% 52% 63%
Source: ACIL Allen Consulting (2014a)
7.2.2.2 Gas
Overall, domestic demand for gas is expected to decline, with AEMO forecasting an annual average decline of 0.9 per cent for the next 20 years based on its medium scenario.241
There are two key drivers of this fall. Demand from gas-powered generation is forecast to decline by 2.3 per cent per year over the next 20 years, as a result of the expected high gas prices. A decline in demand from large industrial customers of 1.3 per cent per year over the next 20 years is forecast due to the prospective closure of oil refineries and higher gas prices.
Offsetting the decline in domestic demand is a large increase in consumption associated with LNG plants on the east coast. AEMO forecast this to increase rapidly over the next five years, from 13.3 PJ in 2014 to 1432 PJ by 2019. Demand from LNG production is expected to plateau after this period. This increase results in overall annual average growth in gas consumption by the combined domestic and export markets of 5.4 per cent per year over the next 20 years.242
The Audit consultant has projected demand and DEC for gas services in 2031 as follows:
■ gas transmission throughput in Australia is projected to grow from 1,334 PJ in 2011 to 3,178 PJ;
■ gas distribution throughput in Australia is projected to grow from 344 PJ in 2011 to 429 PJ; and
■ the DEC for gas transmission and distribution services across Australia is projected to increase from $2.3 billion in 2011 to $4.7 billion, an increase of around 100 per cent.
As with electricity, there is a degree of inconsistency between the AEMO’s forecast of falling domestic demand for gas in the east coast domestic market and the expected rise in DEC in the Audit. Significantly, the DEC analysis was finalised before the latest AEMO gas market forecasts were published.243 Those forecasts were the first to show a break in what had previously been a direct link between economic growth and rising energy consumption. In addition, AEMO reports and forecasts gas consumption in PJ, whereas DEC is a measure of the value-add provided by gas infrastructure, in dollars. The two are not necessarily perfectly correlated.
Table 25 shows the absolute increase in DEC for gas services by state/territory between 2011 and 2031. The largest increase in DEC occurs in Queensland. This is attributable to the investment in pipelines to service LNG projects in Gladstone.
At the audit region level, the largest projected increase in DEC for gas transmission and distribution between 2011 and 2031 is in the Gladstone-Biloela region, with an increase of over $1.6 billion.
241. Australian Energy Market Operator (2014b)
242. Australian Energy Market Operator (2014b)
243. Australian Energy Market Operator (2014b)
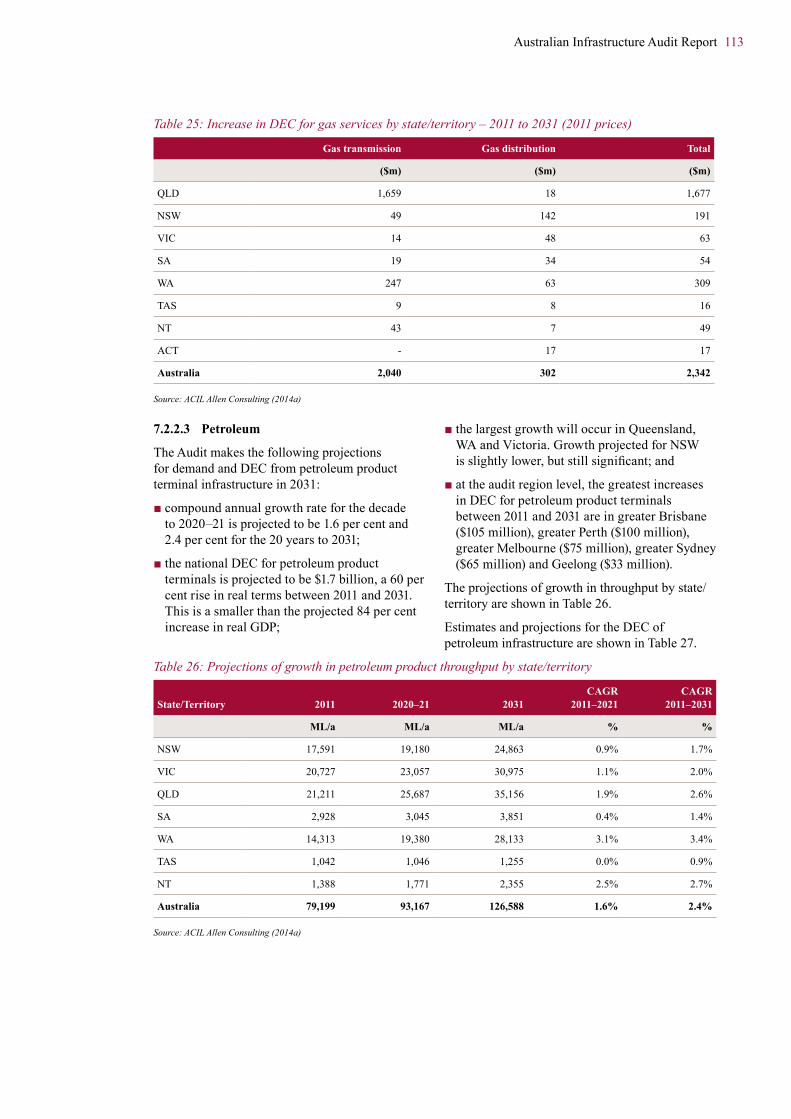
Australian Infrastructure Audit Report 113
Table 25: Increase in DEC for gas services by state/territory – 2011 to 2031 (2011 prices)
Gas transmission Gas distribution Total
($m) ($m) ($m)
QLD 1,659 18 1,677
NSW 49 142 191
VIC 14 48 63
SA 19 34 54
WA 247 63 309
TAS 9 8 16
NT 43 7 49
ACT - 17 17
Australia 2,040 302 2,342
Source: ACIL Allen Consulting (2014a)
7.2.2.3 Petroleum
The Audit makes the following projections for demand and DEC from petroleum product terminal infrastructure in 2031:
■ compound annual growth rate for the decade to 2020–21 is projected to be 1.6 per cent and 2.4 per cent for the 20 years to 2031;
■ the national DEC for petroleum product terminals is projected to be $1.7 billion, a 60 per cent rise in real terms between 2011 and 2031. This is a smaller than the projected 84 per cent increase in real GDP;
■ the largest growth will occur in Queensland, WA and Victoria. Growth projected for NSW is slightly lower, but still significant; and
■ at the audit region level, the greatest increases in DEC for petroleum product terminals between 2011 and 2031 are in greater Brisbane ($105 million), greater Perth ($100 million), greater Melbourne ($75 million), greater Sydney ($65 million) and Geelong ($33 million).
The projections of growth in throughput by state/territory are shown in Table 26.
Estimates and projections for the DEC of petroleum infrastructure are shown in Table 27.
Table 26: Projections of growth in petroleum product throughput by state/territory
State/Territory 2011 2020–21 2031CAGR
2011–2021 CAGR
2011–2031
ML/a ML/a ML/a % %
NSW 17,591 19,180 24,863 0.9% 1.7%
VIC 20,727 23,057 30,975 1.1% 2.0%
QLD 21,211 25,687 35,156 1.9% 2.6%
SA 2,928 3,045 3,851 0.4% 1.4%
WA 14,313 19,380 28,133 3.1% 3.4%
TAS 1,042 1,046 1,255 0.0% 0.9%
NT 1,388 1,771 2,355 2.5% 2.7%
Australia 79,199 93,167 126,588 1.6% 2.4%
Source: ACIL Allen Consulting (2014a)

114 Australian Infrastructure Audit Report
Table 27: Forecasts of petroleum product DEC (2011 prices)
State/Territory DEC 2011 DEC 2020–21 DEC 2031
($m) ($m) ($m)
NSW 239 261 338
VIC 282 314 421
QLD 288 349 478
SA 40 41 52
WA 195 264 383
TAS 14 14 17
NT 19 24 32
Australia 1,077 1,267 1,722
Source: ACIL Allen Consulting (2014a)
7.2.3 Sectoroutlookandfindings7.2.3.1 Whole of sector
Key emerging issues in the energy sector include:
■ securing and maintaining affordable mobility while reducing greenhouse emissions;
■ improving fuel security;
■ minimising the costs of transition to new/changing fuel sources; and
■ supporting a shift to renewables for both the stationary (e.g. generation) and transport sectors, including creating certainty to support renewables investment.
The energy sector currently accounts for a substantial proportion of Australia’s greenhouse gas emissions, with electricity accounting for one third.244 Pressures to transition to a lower emission environment while maintaining economic growth, whether from domestic policies or international obligations, will need careful management.
Achieving material emission reductions will require action by infrastructure owners, developers and managers and can best be achieved by using markets to promote more efficient use of existing infrastructure.
Uncertainty around climate policy, either globally or locally, increases risk in the Australian energy sector. Uncertainty leads to project delays, reduced investor confidence and postponed asset retirements. The Council of Australian Governments (COAG) Energy Council meeting communiqué on 11 December 2014 stressed the importance of bipartisan emissions and RET policies.245
Auditfinding63. Lack of certainty on national and
international approaches to dealing with climate change directly affects investment in the energy sector.
The Audit has identified a changing demand structure across the electricity and gas markets. There are several regulatory issues that will need to be further considered:
■ further retail energy pricing deregulation;
■ support for retail competition and the removal of price controls where sufficient levels of competition are met; and
■ streamlining the assessment process for major infrastructure projects.
These issues will align with Infrastructure Australia’s broad principles for open markets and effective regulatory oversight (where it is necessary).
7.2.3.2 Electricity
The Audit projects that demand for electricity infrastructure will grow more slowly than GDP over the 20 years to 2031, and Infrastructure Australia expects there will be sufficient generating capacity for at least the next five to 10 years. Consistent with this, recent draft determinations from the Australian Energy Regulator (AER) for electricity network companies will limit capital expenditure outlays for the next regulatory period (typically four or five years) to significantly lower levels than seen in recent years.246
244. Department of the Environment (2015)
245. Council of Australian Governments Energy Council (2014)
246. Australian Energy Regulator (2015)

Australian Infrastructure Audit Report 115
Auditfindings64. Demand for electricity infrastructure is
projected to grow significantly slower than GDP.
65. There is expected to be sufficient electricity generating capacity for at least the next five to 10 years.
Overall, the NEM is working well, providing a competitive market which provides for the long-term needs of consumers in an efficient and properly regulated manner. However, future issues to be considered include:
■ ownership arrangements for energy utilites and infrastructure in NSW, Queensland, WA and Tasmania, where reforms (like those successfully introduced in Victoria and South Australia in the 1990s) would assist the market to become fully competitive and more sustainable;
■ how the recent rule changes might best facilitate tariff reform − the current regulatory arrangements provide little incentive for customers to manage peak consumption and its impact on the price of electricity (as the need to cater for peak demand adds to costs). Recent changes will support a transition to more cost reflective network tariffs by 2017;
■ incentives for efficient network investment and renewal at a time of falling demand, which the AER’s draft determinations consider; and
■ network reliability investment based on assessment of benefits and costs. There is currently little assessment of the trade-off that consumers might voluntarily make between cost and reliability. However, work is underway from COAG and the Australian Energy Market Commission (AEMC) on this, with jurisdictions due to respond by mid–2015.247
Auditfindings66. The National Electricity Market is
functioning well. However, several regulatory issues will require attention, including tariff reform to reduce peak period demand.
67. There is a need for continued government assistance to support electricity supply in remote communities where generation is not able to be provided on a commercial basis.
7.2.3.3 Gas
The dominant change in the gas sector identified both in the Audit and by sector analysts is the development of the LNG export industry on the east coast. The first LNG export shipment from Gladstone departed on 6 January 2015.248 Opening the east coast market to global markets is expected to lead to an increase in domestic gas prices. Additional transmission infrastructure to support the export industry is nearing completion. Gas has been exported from WA and NT for some years.
The main impact of this change on infrastructure will be felt in Queensland, where LNG pipelines will deliver more DEC in 2031 than was delivered by the entire Australian gas transmission pipeline sector in 2011. Rising prices for gas, driven both by demand from LNG projects and costs of production as more marginal fields are developed, is expected to reduce gas demand from domestic markets. This will not reduce demand for new investment in transmission and distribution pipelines, as the sources of supply change over time. Development of LNG projects in Queensland will continue to require significant investment in pipeline capacity if projects are further developed and expanded. However, global energy prices will be a key driver here, and recent price falls may reduce the need for additional capacity.
247. Department of Industry and Science (2014c), p. 27
248. Australian Petroleum Production and Exploration Association (2015)

116 Australian Infrastructure Audit Report
Further issues to be considered include:
■ whether the supply of gas to the east coast market may need augmentation;
■ reservation policies, whereby gas supply is reserved for the domestic market, have previously been implemented by governments to protect domestic gas customers from international prices. Pressure for such a policy may increase as the east coast market opens up to export, and domestic prices consequently rise to international levels; and
■ with reference to coal seam gas (CSG), there are community concerns about the efficacy of the assessment of environmental risk and the scale of potential damage from unforeseen events. The COAG Energy Council249 recognised the need to improve the availability of information to ensure communities are engaged and trust the regulatory approach to gas exploration.
7.2.3.4 Petroleum
The Audit identified new demand in the larger mining states as the most critical area for petroleum infrastructure.
Investment in new import infrastructure to ensure continued availability and reliability of supply will be driven by the private sector. The Audit identified an increasing reliance on imported crude oil and petroleum. The number of petroleum refineries has been falling over recent years, with the remaining refineries potentially closing in the near future.
This trend may negatively impact the certainty of supply and raises energy security issues that merit a wider national debate.
Issues for consideration include:
■ the decline in domestic production of crude oil (suitable for Australian refineries) which will increase the requirement for importing crude oil in the future;
■ the closure of three Australian refineries, which necessitates further investment in petroleum product import terminals to meet growth in demand; and
■ as a participant in the IEA 1974 International Energy Program, Australia is obliged to hold stock levels equivalent to at least 90 days of net imports. Australia does not enforce this obligation on oil companies.
Auditfinding68. Australia’s dependence on imported fuel
has increased. The current arrangements for managing petroleum reserves and ensuring energy security deserve wider public policy consideration.
7.3 Telecommunications This section provides Audit data, analysis, projections and findings for telecommunications infrastructure at a national level. It identifies key issues that will need to be considered in the development of future telecommunications initiatives and provides observations on the part that telecommunication assets and services play in delivering the connectivity role of Australia’s Infrastructure.
This section is set out as follows:
■ existing capacity and services;
■ projected demand; and
■ sector outlook.
The telecommunications sector encompasses voice and data services provided over fixed and mobile networks. It includes infrastructure for fixed and mobile customer access networks, backhaul and transmission networks. Service providers in the sector include carriers, carriage service providers, content service providers and application developers.
Telecommunications services are a key enabler for all parts of the economy. If Australia is to remain an internationally competitive nation, telecommunications infrastructure providers need to increase capacity and continue to update technology.
7.3.1 Existing capacity and servicesThe Universal Service Obligation requires Telstra to provide all Australians, wherever they live or conduct business, with access to a voice service on reasonable request.
For mobile services:
■ over 99 per cent of the Australian population has access to voice services mobile networks;
■ 81 per cent of premises have access to 3G mobile broadband services; and
■ 59 per cent of premises have access to 4G services.250
249. Council of Australian Governments Energy Council (2014)
250. Department of Communications (2013)
Australian Infrastructure Audit Report 117
Broadly, service levels are good in the competitive urban mobiles market, reasonable in the fixed line urban market and services progressively deteriorate for both mobiles and fixed line services as one moves to rural and more remote areas. The mobile market has the lowest level of regulation, while fixed line is more regulated with fewer competitive infrastructure providers. Services in rural and remote areas are generally subsidised, either through direct subsidy from governments, or through industry cross-subsidies. International comparisons indicate that Australia’s mobile services are closer to world’s best practice than our fixed line services.251
The Australian mobile network is more competitive as there is no incumbent operating a legacy network. It is therefore easier for new entrants to compete than in the fixed line network.
For fixed line internet services:
■ 91 per cent of premises have some access to ADSL technology. However, broadband services may be limited in some cases, such as where premises are too far from and exchange or areas with no additional capacity;
■ 28 per cent of premises have access to a high speed internet platform (fibre or hybrid fibre); and
■ 6 per cent of premises do not have access to fixed broadband services.
The availability and quality of fixed broadband services is generally much higher in the major cities than in other parts of Australia. Across all areas outside the cities, around 80 per cent of premises receive the lowest quality fixed broadband rating. However, there are exceptions to this. A share of Australia’s regional population lives in small towns which may have access to superior fixed lines services than some suburban areas. Additionally, there are pockets of poorly served premises within urban areas, despite close proximity to areas with high quality service.
In 2009, the Australian Government announced the establishment of NBN Co Limited (NBN Co) to deliver wholesale high-speed broadband across Australia. NBN Co is a wholly owned Commonwealth company, or Government Business Enterprise, which operates on a commercial basis supported by public funding.
In April 2014, NBN Co was issued a new Statement of Expectations. This included a requirement to use an ‘optimised multi-technology mix’ on an area by area basis, to achieve download data rates of at least 25 megabits per second (Mbps) to all premises, and at least 50 Mbps to 90 per cent of fixed line premises, as soon
as possible. This service level requirement, in combination with the requirement to prioritise areas identified by the Broadband Availability and Quality Report as poorly served, is expected to reduce service disparities between urban and rural areas over the next five years. These requirements are to be achieved within the constraints of a public equity capital limit of $29.5 billion.252
Under current arrangements, fixed line services will be delivered at a uniform cost across the country, using the returns gained from operations in commercially viable areas to support the cost of rolling out broadband services to regional and remote areas. NBN Co is using a combination of fibre to the premises, fibre to the node and fixed wireless networks and satellite services in regional and remote areas. The Bureau of Communications Research, within the Department of Communications, is undertaking an assessment of the costs of NBN Co’s fixed wire and satellite services in regional and remote areas. In the second half of 2015 the Bureau of Communications Research will provide options to Government for replacing the current National Broadband Network (NBN) cross-subsidy embedded in its wholesale access prices with more transparent funding arrangements.253
The fixed wireless services use cellular (TD-LTE or 4G) technology to deliver wireless internet access from a base station, or tower, to antenna installed on individual homes. The network has been designed to deliver download speeds of up to 25 Mbps, with a set number of premises served by each facility.
Satellite services will be delivered using two NBN Co-owned satellites that are able to cover the entire Australian mainland and islands. The satellites will use 101 spot beams, with each beam having its own bandwidth capacity split across end users in the beam. Prior to the launch of the long-term satellites in 2015, services are being provided by leased satellite capacity.
By mid-February 2015, NBN Co reported that more than 818,000 premises had been passed by fixed line or covered by wireless technology, with activation of the NBN completed to more than 346,000 premises.
For mobile services, the private sector can be expected to progressively introduce higher capacity services in response to market forces and technological change. Telstra and Optus purchased access to the radio-telecommunications spectrum in the 700 MHz band for almost $2 billion in 2013. This new spectrum will provide a significant boost to 4G mobile capacity and coverage for some time, but may eventually be fully utilised. In that case more spectrum will be required.
251. Organisation for Economic Cooperation and Development (2013b)
252. NBN Co (2014)
253. Australian Government (2014c)

118 Australian Infrastructure Audit Report
Auditfinding69. The quality of telecommunications
service across Australia is mixed, with generally good services in cities and with lower quality services in rural areas and some outer urban areas. The NBN is expected to reduce service disparities within the next five years.
The DEC of telecommunications services across Australia was $21 billion in 2011. The share of this total across the states and territories is shown in Figure 41, with each state and territory’s share of the national population included for context.
The data indicates that a relatively high proportion of telecommunications infrastructure value-add is located in NSW and Victoria, which is likely to reflect the concentration of commercial activity in Sydney and Melbourne.
Figure 41: Share of total telecommunications DEC and national population by state/territory – 2011
NSWSource ACL Allan Consulting 2014
VIC QLD SA WA TAS NT ACT0
10%
20%
30%
40%
50%Share of national telecommunications DEC
Share of national population
Source: ACIL Allen Consulting (2014a)
In 2011–12, the Australian telecommunications market generated total revenue of $40.8 billion and capital expenditure of $47.1 billion. Capital stock was estimated to be $124 billion.254
Across a range of services, the Australian telecommunications market is dominated by Telstra. In 2012–13, Telstra held 63 per cent of the retail fixed voice market, 43 per cent of the mobile telecommunications market, and 42 per cent of the retail broadband market. It is also the present provider of infrastructure such as the copper access network used by other businesses to provide services to customers, although NBN Co has recently purchased this copper network. Other major providers include Optus, Vodafone Hutchison Australia, iiNet and TPG.
Mobile broadband has led to major productivity improvements for Australian businesses, and is estimated to have increased Australian GDP growth rate by an annual average of 0.28 per
cent from 2007 to 2013. It is estimated that the Australian economy would have been $7.3 billion smaller between 2006 and 2013 without the additional productivity benefits of mobile broadband services.255
7.3.2 Projected demandDemand for telecommunications services will continue to grow at a rapid rate over coming years, driven by increasing connectivity, the growth of new services and the cultural changes associated with increased use of social media. A broad range of services and processes are now being delivered online, and are dependent on telecommunications infrastructure.
254. ACIL Allen Consulting (2014a)
255. The Centre for International Economics and Analysys Mason (2014)
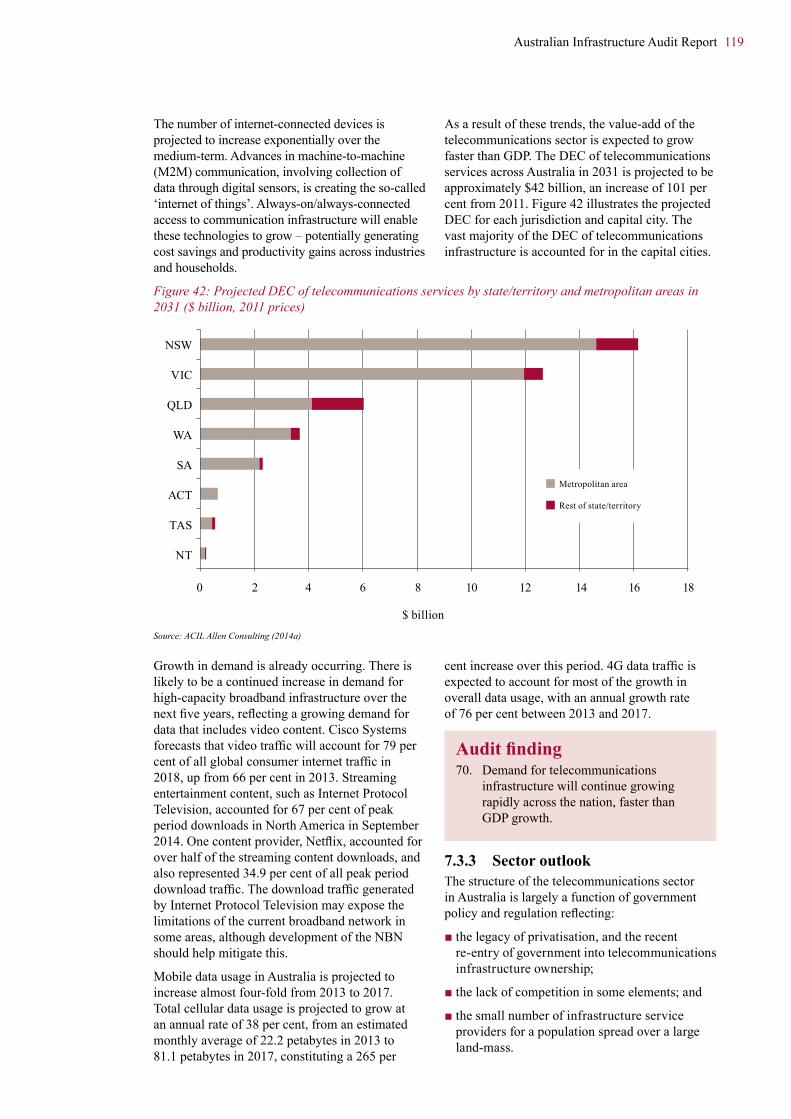
Australian Infrastructure Audit Report 119
The number of internet-connected devices is projected to increase exponentially over the medium-term. Advances in machine-to-machine (M2M) communication, involving collection of data through digital sensors, is creating the so-called ‘internet of things’. Always-on/always-connected access to communication infrastructure will enable these technologies to grow – potentially generating cost savings and productivity gains across industries and households.
As a result of these trends, the value-add of the telecommunications sector is expected to grow faster than GDP. The DEC of telecommunications services across Australia in 2031 is projected to be approximately $42 billion, an increase of 101 per cent from 2011. Figure 42 illustrates the projected DEC for each jurisdiction and capital city. The vast majority of the DEC of telecommunications infrastructure is accounted for in the capital cities.
Figure 42: Projected DEC of telecommunications services by state/territory and metropolitan areas in 2031 ($ billion, 2011 prices)
NSW
VIC
QLD
WA
SA
ACT
TAS
NT
0 2 4 6 8 10 12 14 16 18
Metropolitan area
Rest of state/territory
$ billion
Source: ACIL Allen Consulting (2014a)
Growth in demand is already occurring. There is likely to be a continued increase in demand for high-capacity broadband infrastructure over the next five years, reflecting a growing demand for data that includes video content. Cisco Systems forecasts that video traffic will account for 79 per cent of all global consumer internet traffic in 2018, up from 66 per cent in 2013. Streaming entertainment content, such as Internet Protocol Television, accounted for 67 per cent of peak period downloads in North America in September 2014. One content provider, Netflix, accounted for over half of the streaming content downloads, and also represented 34.9 per cent of all peak period download traffic. The download traffic generated by Internet Protocol Television may expose the limitations of the current broadband network in some areas, although development of the NBN should help mitigate this.
Mobile data usage in Australia is projected to increase almost four-fold from 2013 to 2017. Total cellular data usage is projected to grow at an annual rate of 38 per cent, from an estimated monthly average of 22.2 petabytes in 2013 to 81.1 petabytes in 2017, constituting a 265 per
cent increase over this period. 4G data traffic is expected to account for most of the growth in overall data usage, with an annual growth rate of 76 per cent between 2013 and 2017.
Auditfinding70. Demand for telecommunications
infrastructure will continue growing rapidly across the nation, faster than GDP growth.
7.3.3 Sector outlookThe structure of the telecommunications sector in Australia is largely a function of government policy and regulation reflecting:
■ the legacy of privatisation, and the recent re-entry of government into telecommunications infrastructure ownership;
■ the lack of competition in some elements; and
■ the small number of infrastructure service providers for a population spread over a large land-mass.

120 Australian Infrastructure Audit Report
Rolling out an open access, wholesale-only fixed line broadband network in a cost-effective manner is a key telecommunications infrastructure challenge facing government and private sector providers over the next five years. High capacity fixed line services are vital to deliver high bandwidth services in themselves, but they are also essential to the operation of mobile services. Australia needs to improve the current speeds of fixed line broadband access to maintain international competitiveness, and this is one of the objectives of the NBN.
Auditfinding71. A key challenge will be the efficient
rolling-out of an open access, wholesale only fixed-line broadband network.
The NBN offers the potential for major economic and social benefits across the country. This is reflected in the multi-billion-dollar investment in the NBN by the Australian Government over the next 5 to10 years.
Efforts are being made to realise the potential social benefits from this investment, such as developments in tele-medicine and online delivery of education.
Considerable attention should be directed towards maximising the benefits of the NBN. An example lies in the area of telecommuting. Australia’s take-up of telecommuting appears to be relatively low compared to other countries, although there is recent evidence suggesting the rate of telecommuting may be growing.256 This may be as much a function of workplace and cultural issues as of any shortcomings in the telecommunications services themselves.
As noted elsewhere in this report, the economic cost of transport network congestion is already a serious problem and projected to get significantly worse. It is a serious drain on the nation’s productivity. By enabling some people to avoid having to physically travel, telecommuting has the potential to:
■ raise productivity; and
■ moderate the demand for infrastructure, thereby deferring the need to fund new infrastructure.
Auditfinding72. Governments and the private sector
will need to focus on making the best use of the NBN, thereby delivering the expected economic and social benefits to the country.
The Australian Government’s December 2014 statement on regulatory and structural reform in the telecommunications sector adopts the following overarching regulatory policy principles:
■ regulation should allow competition at both the retail and wholesale/infrastructure levels;
■ to the greatest extent possible industry players should be treated consistently under the regulatory framework; and
■ new high-speed broadband access networks (which control ‘last mile’ connections to consumers) should be vertically separated.257
Competition in the telecommunications sector has driven productivity improvements and raised service standards for the majority of consumers. Ongoing competition in the sector, including in the delivery of broadband services, is to be encouraged.
Auditfinding73. The telecommunications sector’s
economic contribution will be best served by continuing support for effective competition.
Market forces and the private sector will continue to respond to demand in urban areas where a commercial rate of return can be achieved. However, parts of rural and remote Australia will require continued government assistance to access services similar to those available in the rest of the country. In the absence of a significant technological breakthrough, this is unlikely to change during the 15-year horizon of the Australian Infrastructure Plan.
256. Deloitte Access Economics (2011a) and Australian Bureau of Statistics (2013b)
257. Australian Government (2014c)

Australian Infrastructure Audit Report 121
7.4 Water This section provides Audit data, analysis, projections and findings for water and sewerage infrastructure at a national level. It identifies key issues that will need to be considered in development of future water sector initiatives and infrastructure.
This section is set out as follows:
■ existing capacity;
■ projected demand; and
■ sector outlook.
7.4.1 Existing capacityWater and sewerage infrastructure and water resources are critical to the ongoing prosperity of Australia’s mining, agriculture, manufacturing and industrial sectors. In our cities and towns, water supply infrastructure is critical to the wellbeing and prosperity of households and businesses.
At the broadest level, the water sector in Australia can be split into urban and rural sectors:
■ the urban water and sewerage sector typically provides treated water, wastewater and drainage services to households, industry and businesses. Untreated water, recycled water and stormwater are also supplied to industry and for recreational facilities such as parks, sporting fields and golf courses; and
■ the rural water sector supplies bulk, untreated water to regional towns and to support irrigation activities such as pastoral, agricultural and horticultural enterprises. Rural water infrastructure also supplies bulk, untreated water to support mining, power generation and other industrial activities in regional and remote areas.
By their nature, water and sewerage services are provided via integrated networks, rather than from discrete pieces of infrastructure. While water and sewerage services have several elements in their supply chains, the services are largely supplied
by integrated utilities undertaking all activities in the chain. This means that it is only possible to identify revenue and output, the volume of service supplied and the economic contribution of the service, at an overall level rather than in terms of individual constituent parts.
7.4.1.1 Scale of infrastructure and services
The Audit reports on the infrastructure currently used in the provision of water and sewerage services to customers, including its capacity and utilisation, and the DEC of the services provided. This includes the infrastructure used for water storage, treatment and distribution, and for sewage collection and treatment.
Specifically, the Audit covers the following infrastructure:
■ dams (excluding those built exclusively to manage natural resources, such as on-farm dams and those regulating river flows);
■ transmission pipelines for water transfer between dams (excluding forms of irrigation infrastructure such as channel transmission);
■ water treatment facilities, including water, sewerage (including water recycling) and desalination;
■ pumping stations and pumping equipment; and
■ pipe distribution systems for water and sewage collection and drainage.
The Audit covers both urban and rural infrastructure. However, the National Water Commission (NWC) dataset underpinning the Audit does not cover water utilities serving less than 10,000 properties. This means that total utilisation and some capacity information is not complete for rural and some regional urban areas.
Table 28 illustrates the total national utilisation of water and sewerage services in 2011, including the total volume of water supplied, volume of sewage collected and the number of properties served by water and sewerage services.

122 Australian Infrastructure Audit Report
Table 28: National utilisation of existing water and sewerage infrastructure – 2011
Parameters Volumes
Water supplied 7,641 GL
Number of properties served – water 8.5 million
Sewage collected 1,931 GL
Number of properties served – sewerage 7.8 million
Source: ACIL Allen Consulting (2014a)
Table 29 presents some key figures regarding the capacity of existing water and sewerage infrastructure. It shows the total storage capacity, the volumes held in 2013 (data for 2011 was
not available), the desalination capacity and the length of water and sewer mains for each state and territory.
Table 29: Capacity of existing water and sewerage infrastructure
Dam capacity, 2013Damwaterinstorage, 2013
Desalination capacity, 2013
Lengthwatermains, 2011
Lengthsewermains, 2011
GL per year GL per year GL per year km km
NSW 22,929 13,630 90 63,529 42,254
VIC 14,441 9,703 150 75,269 35,623
QLD 10,429 9,726 49 36,090 26,055
SA 2,257 2,002 100 10,357 7,700
WA 11,470 8,861 150 17,248 13,253
TAS 22,141 14,283 0 6,186 4,535
NT 285 228 0 1,706 954
ACT 158 56 0 3,134 3,134
Australia 84,111 58,488 539 213,518 133,508
Source: ACIL Allen Consulting (2014a)
The regions with the largest DEC from water and sewerage infrastructure services were the large urban areas: greater Sydney ($1.8 billion), greater Melbourne ($1.4 billion), greater Perth ($1.2 billion), greater Brisbane ($1.2 billion) and greater Adelaide ($700 million).
Figure 43 shows that 65.7 per cent of water consumed in Australia is used in the agriculture, forestry and fishing sector, with agriculture accounting for the vast majority of this figure (64.7 per cent of total water consumption).
The water and sewerage industry itself consumes 12.2 per cent, largely due to losses as well as water consumed by water supply, sewerage and drainage services.
Figure 44 shows that, despite consuming only 9.4 per cent of water in Australia, households account for 57.4 per cent of expenditure on water. Conversely, the agriculture, forestry and fishing sectors account for only 4.2 per cent of the national total.

Australian Infrastructure Audit Report 123
Figure 43: Australian consumption of water by industry and household – 2012–13
Agriculture, forestry and fishing 65.7%
Mining 3.1%
Manufacturing 2.7%
Electricity, gas, water and waste 13.9%
Other industries 5.3%
Household 9.4%
Source: Australian Bureau of Statistics (2014f)
Figure 44: Australian expenditure on water by industry and household – 2012–13
Agriculture, forestry and fishing 4.2%
Mining 1.3%
Manufacturing 5.0%
Electricity, gas, water and waste 11.2%
Other industries 20.9%
Household 57.4%
Source: Australian Bureau of Statistics (2014f)
The difference between consumption and expenditure in part reflects differences in the nature of the infrastructure required to deliver services to different sectors, with supplies of potable water to densely populated regions requiring more infrastructure for treatment and distribution. However, it also reflects the lower prices charged for rural water supply, largely as a result of past government policy settings.
7.4.1.2 Economic value of the sector
BITRE estimated the total value of Australia’s water infrastructure assets at 30 June 2011 to be
almost $140 billion.258 The Audit estimates the DEC of water and sewerage infrastructure services in 2011 was $10.6 billion (in 2011 dollars). This figure comprises the following components:
■ $5.8 billion for water infrastructure services; and
■ $4.8 billion for sewerage infrastructure services.259
Figure 45 provides the DEC for the water and sewerage services across each state and territory.
258. Bureau of Infrastructure, Transport and Regional Economics (2013a), p. 10
259. ACIL Allen Consulting (2014a)

124 Australian Infrastructure Audit Report
Figure 45: DEC for water and sewerage services in 2011 ($ million, 2011 prices)
$ m
illio
n
3,500
3,000
2,500
2,000
1,500
1,000
500
0
NSW VIC QLD SA WA TAS NT ACT
Source: ACIL Allen Consulting (2014a)
In 2011, total DEC was greatest in NSW, followed by Queensland and then Victoria. This follows from the number of properties serviced in each state and territory, as well as total length of water and sewer mains.
7.4.2 Projected demandDemand for water and sewerage infrastructure is closely related to the growth or decline of the sectors it services. For example, increased industrial activity will generally result in increased water usage, while decreased industrial activity will generally have the opposite effect. Growth in the number of properties served will likewise generally grow in line with regional population growth, though other trends such as a recent rise in single-person dwellings in urban centres may have an impact.
Several key factors influencing demand and supply in the water and sewerage sector, in particular climate variability and rainfall, fall outside the control of suppliers.
Table 30 illustrates the total projected national utilisation in 2020–21 and 2031, including the total volume of water supplied, volume of sewage collected and the number of properties served by water and sewerage services in Australia.
The total volume of water supplied is expected to grow by 100 per cent between 2011 and 2031. This is much greater than the growth expected in sewage collection, or the number of properties served. This result flows from Audit projections that water supply will grow rapidly as drought conditions ease across much of Australia, resulting in the restoration of water allocations to irrigators.
Table 31 illustrates the DEC of water and sewerage services in 2011 and projections for 2031, as well as the projected growth in each state and territory. The national DEC for water and sewerage infrastructure services in 2031 is projected to be $15.9 billion (in 2011 dollars). This represents growth of 50 per cent from 2011.
Table 30: National projection of water utilisation measures
2011 2021 2031
Growthbetween2011and 2031 (%)
Volumes of water supplied (GL) 7,641 14,070 15,285 100
Volumes of sewage collected (GL) 1,931 2,063 2,405 25
Number of properties served – water (million) 8.5 10.0 11.6 36
Number of properties served – sewerage (million) 7.8 9.2 10.6 37
Source: ACIL Allen Consulting (2014a)

Australian Infrastructure Audit Report 125
Table 31: Projected DEC of water and sewerage infrastructure in 2011 and 2031 by state/territory (2011 prices)
Jurisdiction 2011 2031 Growth
($m) ($m) (%) ($m)
NSW 2,971 3,403 15% 432
VIC 2,150 3,252 51% 1,102
QLD 2,439 4,062 67% 1,623
WA 1,605 3,143 96% 1,538
SA 947 1,364 44% 417
TAS 239 282 18% 43
ACT 209 316 51% 107
NT 50 115 132% 65
Australia 10,610 15,939 50% 5,329
Source: ACIL Allen Consulting (2014a)
The largest absolute growth in DEC for water and sewerage infrastructure is projected to occur in the states with the fastest projected rate of growth – namely WA and Queensland. The water and sewerage sector in the NT is expected to grow by 132 per cent from 2011 to 2031, although it will remain relatively small compared to other states.
A key issue in the calculation of DEC for water and sewerage is that these infrastructure services have traditionally been under-priced (i.e. the infrastructure does not earn a sustainable return on capital). In the past, governments have funded significant investment in water infrastructure without requiring a full economic return on that investment.
This under-pricing of water is likely to have resulted in an understatement of DEC, and an understatement of water’s share of GDP.
The projected growth in DEC of water and sewerage infrastructure (50 per cent) from 2011 to 2031 is somewhat lower than the projected growth in GDP (84 per cent) over the same period, suggesting that spending on water and sewerage infrastructure services will decline as a share of GDP.
Auditfinding74. Demand for water infrastructure is
projected to grow significantly slower than GDP.
7.4.3 Sectoroutlookandfindings7.4.3.1 Governance
The NWC was established by the Australian Government in 2004 to drive national water reform under the National Water Initiative (NWI). The NWI set an ambitious reform agenda, aimed at achieving efficient water use and investment
and improved environmental outcomes. There has been substantial progress in implementing the NWI, including:
■ developing statutory water plans across critical catchments;
■ establishing statutory water rights and securing rights to water for the environment;
■ separation of policy, regulatory and service delivery functions to improve accountability and the establishment of clear objectives;
■ independent economic regulation in most states and territories;
■ corporatisation of water businesses to drive operating efficiency and innovation; and
■ driving efficiencies in urban and rural water use.
The Australian Government announced its intention to abolish the NWC in the 2014–15 Budget and transfer its functions for monitoring the implementation of the NWI to the Productivity Commission.
Each state and territory has its own set of institutional arrangements for the governance, reporting and environmental management of its water sector. There is an ongoing need for national leadership and coordination in the water sector, in order to provide a clear role for governments in managing a complex regulatory environment. A clear definition and separation of roles and responsibilities between government agencies and water service providers would benefit consumers and investors.
At present, regulation of the sector is fragmented and may not effectively protect the long-term interests of consumers. National leadership is required in the sector to ensure that the NWI objectives are pursued in a direct and transparent manner, while providing a platform for long-term planning decisions and private sector investments to be well-allocated and effective.

126 Australian Infrastructure Audit Report
Auditfinding75. Economic regulation of the sector is
fragmented and may not effectively protect the long-term interests of consumers: objectives are often not clearly specified; links between economic, health and environmental regulation are not well identified; and existing economic regulation does not provide the consistency, certainty and transparency necessary to support further private involvement in the sector.
7.4.3.2 Pricing reform
Funding for the water and sewerage sector is predominantly based on a user pays system. However, charges do not always recover the full costs of services delivered to the community. Water utilities are primarily state-owned corporations, and water and wastewater transmission infrastructure exhibits strong natural monopoly characteristics, although recent legislative changes in some jurisdictions have enabled entry by private sector providers into contestable sections of the network.
Economic regulation of the water sector is carried out by state regulators (e.g. Independent Pricing and Regulatory Tribunal in NSW and the Queensland Competition Authority). At a Federal level, the ACCC maintains a role in enforcing certain water market rules and providing advice on the Murray-Darling Basin.
The Audit has identified that pricing of water supply and wastewater services across regions and sectors is not consistent or equitable. Water pricing is influenced by historical policies and subsidies that led to under-pricing and inefficient pricing structures. There is a need for more transparent and competitive pricing of water and sewerage services.
This issue was recognised in 1994 by the COAG through the Water Reform Framework. Through this agreement, governments committed to best practice in water pricing to:
■ promote efficient and sustainable use of resources and assets;
■ ensure sufficient revenue streams to allow efficient delivery of services; and
■ achieve user pays and pricing transparency in irrigation systems.260
This was reinforced through the NWI in 2004, which sought to set in place consumption based pricing and full cost recovery for water services.261
A key principle of the COAG reforms was to establish a system of independent pricing regulation. Independent economic regulators generally have some role in regulating charges for water storage and delivery and wastewater provision, although the nature and geographic coverage of the regulator’s role varies across jurisdictions.
In urban areas, governments agreed to move from ‘lower bound’ pricing towards ‘upper bound’ pricing. Upper bound pricing involves setting prices that recover the full costs of operating, maintenance and administration, depreciation, and a return on capital.
The 2010 NWI Pricing Principles made clear that this commitment to upper bound pricing applied only to assets constructed through new capital expenditure.262 For existing assets, the NWI Pricing Principles allow under-valuation but require a renewals annuity on future replacement expenditures as a minimum. As a consequence, the movement towards upper bound pricing for all assets occurs only as assets are replaced.
Despite these measures, the ongoing pricing issues in the water and wastewater services sectors are in need of reform. The Plan will need to investigate measures to improve cost recovery, implement national standards for economic regulation and introduce more flexible pricing models.
Auditfinding76. There is a need for more transparent
and competitive pricing of water supply and wastewater treatment services, across urban and regional areas. In encouraging greater competition, careful consideration of the appropriate market structure(s) is required.
7.4.3.3 Rural and regional markets
The NWI and Murray-Darling Basin Plan have been the catalyst for considerable regional water market reforms in recent years, particularly in NSW and Victoria. However, further reforms are required to ensure scarce water resources
260. Council of Australian Governments (1994)
261. Council of Australian Governments (2004)
262. National Water Initiative Committee Steering Group on Water Charges (2010)

Australian Infrastructure Audit Report 127
are allocated in an efficient manner that optimises benefits across economic, social and environmental purposes.
Auditfinding77. There is a need for additional market
reform in the rural water sector, including market-based allocation of defined catchment resources, and transparent pricing of irrigation water.
The Audit found that water quality varies greatly across Australia. While water quality in urban areas is good, in parts of regional Australia it does not meet relevant drinking water standards. At present, water businesses are subject to a range of regulatory requirements concerning drinking water quality and the quality of wastewater discharges, with regulatory responsibility lying with the Department of Health and the respective state/territory based Environment Protection Agencies. National leadership is required to implement initiatives that will raise drinking water quality to at least the minimum standard across Australia.
Auditfinding78. Water quality in urban areas is good, but
in parts of regional Australia it does not meet relevant drinking water standards.
Catchment water planning and environmental considerations have been a strong focus of reforms to date, particularly for the rural water sector. Future reform initiatives will need to consider the full range of shareholders in rural and regional areas to ensure that agreed objectives achieve a balance between economic development, sustainability and resilience to periods of drought.
The increases in demand for water and sewerage services projected in the Audit are likely to be a driver for real price increases over a prolonged period. This could raise serious affordability issues, especially in rural regions of Australia. However, in the absence of price increases, water businesses will begin to struggle to finance the required expansion of capacity without an increased level of government funding.
Water issues in rural and regional areas are under consideration by the Australian Government through the Agricultural Competitiveness White Paper, due for release in 2015.263 The Green Paper, released in 2014, represents views put forward by stakeholders and includes discussion
of various issues concerning drought and water management, including:
■ allocating $22 million to existing state government emergency water infrastructure schemes;
■ contributing up to $12 million in 2014–15 to support state government water-related infrastructure rebate programs;
■ implementing the Murray Darling Basin Plan, prioritising water recovery through on- and off-farm infrastructure investments and increasing market certainty by publishing a Water Recovery Strategy; and
■ completing implementation of the $10 billion Sustainable Rural Water Use and Infrastructure Program, aimed at investing in rural water use, management and efficiency.264
7.4.3.4 Climate variability
Australia has one of the most variable climates in the world. Droughts and floods are a noted part of Australia’s climate and have an impact on the water sector’s ability to balance supply and demand.
Demand for water is influenced primarily by climate and rainfall, population growth and the efficiency of water appliances in the urban sector. Soil type, crop type, commodity prices and irrigation technology are key determinants of demand for water in the rural sector.
During periods of drought, residential water demand is routinely managed through an escalating scale of water restrictions. In the irrigation sector, when water availability falls, allocations against entitlements are reduced to reflect the smaller overall ‘stock’ available to be shared in that year.
In the past, where water has been supplied predominantly from rainfall dependent water sources, water demand has been managed in response to water availability, and consumption therefore does not represent the true level of demand driven on customer preference.
During periods of drought, real water demand would have been higher than the volume able to be supplied, because the largest component of household demand is outdoor use, which increases with temperature and reduced rainfall in drier seasons. Cooler, wetter conditions will generally lead to a reduced demand in residential and rural areas. During periods of high rainfall, the requirement to irrigate crops, gardens and parks decreases.
263. Australian Government (2014a)
264. Australian Government (2014b)

128 Australian Infrastructure Audit Report
Climate change will have an impact on almost every facet of the hydrological cycle and significantly affect Australia’s water supply for urban, rural and industrial uses. This is because surface water stored in reservoirs and groundwater is the major source of water across Australia, and is dependent on rainfall and affected by evapotranspiration − the part of the water cycle that removes water from soil and vegetation and into the atmosphere through both evaporation and transpiration.265
The CSIRO reports that there may be less rainfall in southern and eastern areas over the medium to long-term, with droughts becoming more frequent.266 Climate changes would affect water supply and demand in both urban and rural areas, with dry weather periods increasing the strain on existing water infrastructure across Australia.
The millennium drought put enormous pressure on water delivery networks across the country. The length and severity of the drought precipitated an unprecedented water infrastructure investment program, with major metropolitan areas seeking to drought proof their cities through the construction of non-rainfall dependent sources, such as desalination plants in Sydney, Melbourne, South East Queensland, Adelaide and Perth, and recycled water schemes.
Construction of non-rainfall dependent sources of water supply means that restriction policies may not be as severe in the future. This is likely to mean that future consumption in metropolitan areas will not decrease as much as it did between 2005–06 and 2007–08 under drought conditions.
However, desalination facilities can provide only part of the solution to improving Australia’s water security. The Audit found that the national capacity of desalination facilities was 539 GL in 2013. This represents only seven per cent of the total water supplied through water infrastructure included in the Audit in 2011–12 (7,641 GL), and 0.6 per cent of total dam storage capacity in 2013 (84,111 GL).267
Auditfinding79. Future climate variability could lead to
a need for further water infrastructure to augment supplies.
7.4.3.5 Investment
Figure 46 illustrates a dramatic increase in water and sewerage infrastructure spending across Australia since 2006–07. A large part of this is attributable to investments by several state governments in constructing desalination plants and recycled water schemes to drought proof their cities and towns in the face of the millennium drought. This increase also represents upgrades to ageing water infrastructure across Australia, as well as significant investment in on- and off-farm irrigation infrastructure to improve the efficiency of irrigation, particularly in the Murray-Darling Basin, but also in Tasmania and in other parts of Queensland outside the Basin.
Overall, urban water demand in Australia will continue to increase with population growth. However, this increase will be moderated by the following factors:
■ Utilities and planning regulations can influence demand through management measures and education campaigns that target household water efficiency, and mandatory standards for water efficient appliances.
■ Demographic changes, such as the ageing population and urban planning. Strategies to increase density of urban development will lead to reduced housing block and garden sizes, which in turn will reduce individual household demand.
In the irrigation sector, demand will continue to be influenced by water availability and macroeconomic factors such as commodity prices, market access and exchange rates. Other factors that will have an impact on future demand include more efficient irrigation technology and practices, and the extent to which greenfield irrigation areas are established.
In the Murray Darling Basin, water availability for consumption is capped under the Murray Darling Basin Plan. Consequently, future demand will need to be met through irrigation efficiency savings and operation of the water market.
Outside the Basin − most notably in northern Australia, where water resources are not fully committed − future growth in demand will depend on the viability of new irrigation enterprises, taking into account the costs of new dams and groundwater development schemes.
265. Bureau of Meteorology (2010)
266. CSIRO (2014)
267. ACIL Allen Consulting (2014a)

Australian Infrastructure Audit Report 129
Figure 46: Value of water infrastructure engineering work – 1986–87 to 2011–12 (2011 prices)
7,000
6,000
5,000
4,000
3,000
2,000
1,000
01986-87 1991-92 1996-97 2001-02 2006-07 2011-12
Water storage and supply Wastewater and sewerage
$ m
illio
n
Source: Bureau of Infrastructure, Transport and Regional Economics (2013a)
In addition to centralised supply models, education campaigns and incentives programs have been used to encourage decentralised supply options such as rainwater tanks, grey water systems and stormwater harvesting at the municipal or local scale. In Perth and Melbourne, schemes were introduced to fund irrigation efficiency programs, with rural water savings used to augment urban supplies. In Melbourne, these schemes were decommissioned following a change of government.
Expanding the coverage of technological solutions, such as automation, remote telemetry and electronic sensing, can provide significant savings in operational costs and improved asset condition monitoring. These solutions can extend the life of existing assets and improve service delivery, leading to reduced costs of supply and water savings across the network.
Despite recent investments in water infrastructure, the Audit has identified significant areas of concern for the sector. Underinvestment in maintenance of some water assets, and ageing infrastructure, will require an increased focus on maintenance and renewal, while the borrowings of urban water utilities should be monitored to ensure that commercial operations and future investment capacities are not compromised.
Auditfindings80. A number of urban water utilities
have increased their borrowings over recent years, for various reasons, with consequential impacts on their commercial performance and their ability to take on additional debt.
81. Underinvestment in maintenance of some water assets, and ageing infrastructure, will require an increased focus on maintenance and renewal.
130 Australian Infrastructure Audit Report
Lists of Figures and Tables in Volume 1
List of Figures
Figure 1 Sectoral distribution of infrastructure’s value-add by DEC in 2011 ($ million, 2011 prices) 13
Figure 2 National population projections – 2011 to 2061 (million) 20
Figure 3 Projected population of Australian capital cities – 2011 to 2061 (million) 21
Figure 4 Developed country multi factor productivity growth – 1976 to 2006 23
Figure 5 MFP growth on a five-year moving average – Australia vs. 19 OECD countries – 1989 to 2008 24
Figure 6 Australian infrastructure industry gross value-add as a percentage of GDP – 1994–95 to 2013–14 25
Figure 7 Australian industry gross value added multi factor productivity indices – 1994–95 to 2013–14 26
Figure 8 World Economic Forum overall rankings of infrastructure − 2014 33
Figure 9 World Bank rankings – Logistics performance indices − 2014 34
Figure 10 Number of broadband subscriptions per 100 inhabitants 35
Figure 11 Impact of Commonwealth grants on different levels of government – 2012–13 44
Figure 12 Engineering construction work for the public sector – 1987 to 2014 (year ending 30 June) 48
Figure 13 Public and private investment in transport, electricity, gas, water, waste and telecommunications infrastructure – 1981 to 2014 (year ending 30 June) 48
Figure 14 Transport, storage and telecommunications outlays – OECD countries – 1970 to 2006 49
Figure 15 State and territory capital expenditure − general government net acquisition of non-financial assets ($ billion, 2013 prices) – 2003 to 2017 50
Figure 16 Proportion of the Australian population by age group as a share of total population – 2014–15 and 2054–55 57
Figure 17 Climate change impact on global GDP based on temperature rise of 1.5°C to 4.5°C – 2010 to 2060 63
Figure 18 Rainfall during the Southern wet season – 1996 to 2014 64
Figure 19 Rainfall during Northern wet season – 1995–96 to 2013–14 64
Figure 20 Forecast climate scenarios for Australia 65
Figure 21 Assessment of road maintenance 70
Figure 22 Assessment of rail maintenance 71
Figure 23 Assessment of maintenance in the energy sector 72
Figure 24 Assessment of maintenance in the water and sewerage sector 74
Figure 25 Trips in six conurbations by origin/destination for roads and public transport in 2011 and projected for 2031, measured by DEC ($ million, 2011 prices) 82
Figure 26 Public transport seat km per person across six conurbations in 2011 83
Figure 27 Rail trips by top 20 destinations by passenger hours travelled (PHT) per day in 2011 and projected for 2031 86
Figure 28 Top 20 bus and light rail destinations nationally by passenger hours travelled (PHT) per day in 2011 and projected for 2031 87

Australian Infrastructure Audit Report 131
Figure 29 National highways 91
Figure 30 DEC for national highways by state and territory in 2011 and projected 2031 ($ million, 2011 prices) 92
Figure 31 Annual interstate and intrastate road freight – 1971–72 to 2012–13 94
Figure 32 Annual growth in interstate and intrastate road freight – 10-year moving average – 1981–82 to 2012–13 94
Figure 33 Freight rail network included in the Audit 96
Figure 34 Value-add for rail infrastructure services by state and territory in 2011, measured by DEC ($ million, 2011 prices) 97
Figure 35 Growth in DEC for rail infrastructure services – 2011 to 2031 (2011 prices) 98
Figure 36 Share of value-add for port infrastructure services by state and territory in 2011, measured by DEC 100
Figure 37 Growth in DEC for port infrastructure services – 2011 to 2031 (2011 prices) 101
Figure 38 Share of value-add for airport infrastructure services by state and territory in 2011, measured by DEC 104
Figure 39 Growth in DEC for airport infrastructure services – 2011 to 2031 (2011 prices) 105
Figure 40 Australia’s key electricity markets 108
Figure 41 Share of total telecommunications DEC and national population by state/territory – 2011 118
Figure 42 Projected DEC of telecommunications services by state/territory and metropolitan areas in 2031 ($ billion, 2011 prices) 119
Figure 43 Australian consumption of water by industry and household – 2012–13 123
Figure 44 Australian expenditure on water by industry and household – 2012–13 123
Figure 45 DEC for water and sewerage services in 2011 ($ million, 2011 prices) 124
Figure 46 Value of water infrastructure engineering work – 1986–87 to 2011–12 (2011 prices) 129
List of Tables
Table 1 Actual (2011) and projected (2031) real gross state product 22
Table 2 Cost of road congestion – 2011 and projected 2031 ($ million, 2011 prices) 32
Table 3 World Economic Forum ranking of Australian infrastructure (out of 144 countries) – 2014 33
Table 4 Average weekly household infrastructure expenditure (2009-10 prices) – low growth scenario 61
Table 5 Australian Government funding (2014–15 to 2018–19) for maintenance of highways on the defined National Land Transport Network ($ million) 69
Table 6 Common themes to identify where maintenance issues are more likely 75
Table 7 Overview of national infrastructure by sector in 2011 76
Table 8 Australia’s top 20 regions – Infrastructure Direct Economic Contribution ($ million, 2011 prices) – 2031 rankings 78
Table 9 Daily kilometres travelled in six conurbations by origin-destination across urban transport modes in 2011 (million km) 80
Table 10 Urban transport DEC by mode and conurbation, 2011 ($ million, 2011 prices) 81
Table 11 Journey to work and all-day mode share estimates for urban public transport, 2011 82
Table 12 Cost of road congestion 2011 and projected 2031 ($ billion, 2011 prices) 83
Table 13 Road corridors across six conurbations in 2011 by delay cost – top 30 corridors 84

132 Australian Infrastructure Audit Report
Table 14 Road corridors across six conurbations in 2031 by projected delay cost – top 30 corridors 85
Table 15 Top 20 origin/destination pairs for rail trips by passenger hours travelled (PHT) per day in 2011 86
Table 16 Top 20 origin/destination pairs for bus trips by passenger hours travelled (PHT) per day in 2011 88
Table 17 Top 10 origin/destination pairs for light rail/tram trips by passenger hours travelled per day in 2011 88
Table 18 SA3 regions with >$1 billion projected growth in value of trips (roads and public transport by origin/destination) between 2011 and 2031, measured in DEC ($ million, 2011 prices) 89
Table 19 DEC for national highways by state and territory in 2011 ($ million, 2011 prices) 92
Table 20 Ports included in the Audit by state and territory 99
Table 21 Projected increases in trade volumes through Australian ports – 2010–11 to 2030–31 102
Table 22 Electricity generation, transmission and distribution DEC by state/territory – 2011 (2011 prices) 109
Table 23 DEC of petroleum product terminal services by state/territory, 2011 ($ million, 2011 prices) 110
Table 24 Projected proportional change in DEC by state/territory – 2011 to 2031 112
Table 25 Increase in DEC for gas services by state/territory – 2011 to 2031 (2011 prices) 113
Table 26 Projections of growth in petroleum product throughput by state/territory 113
Table 27 Forecasts of petroleum product DEC (2011 prices) 114
Table 28 National utilisation of existing water and sewerage infrastructure – 2011 122
Table 29 Capacity of existing water and sewerage infrastructure 122
Table 30 National projection of water utilisation measures 124
Table 31 Projected DEC of water and sewerage infrastructure in 2011 and 2031 by state/territory (2011 prices) 125

April 2015
Australian Infrastructure Audit
Our Infrastructure Challenges Report – Volume 1
Infrastructure AustraliaGPO Box 5417 Sydney NSW 2001 AustraliaT +61 2 8114 1900 F +61 2 8114 1932E [email protected] infrastructureaustralia.gov.au