australian eel aquaculture industry development strategy
TRANSCRIPT
Australian Eel Aquaculture IndustryDevelopment Strategy and Business Analysis
Gooley, G.J. and McKinnon, L.J.
Project No. 2000/264


Australian Eel Aquaculture IndustryDevelopment Strategy and BusinessAnalysis
Gooley, G.J. and McKinnon, L.J.
February 2004
Project Number 2000/264

FRDC Report 2000/264
Eel Industry Strategy and Business Analysis
ii
Australian Eel Aquaculture Industry Development Strategy and Business Analysis
Gooley, G.J. and McKinnon, L.J.
Published by Primary Industries Research Victoria, Marine and Freshwater Systems, Department of PrimaryIndustries, Queenscliff, Victoria, 3225.
© Fisheries Research and Development Corporation and Primary Industries Research Victoria.
2004
This work is copyright. Except as permitted under the Copyright Act 1968 (Cth), no part of this publicationmay be reproduced by any process, electronic or otherwise, without the specific written permission of thecopyright owners. Neither may information be stored electronically in any form whatsoever without suchpermission.
DISCLAIMER
The authors do not warrant that the information in this book is free from errors or omissions. The authorsdo not accept any form of liability, be it contractual, tortious or otherwise, for the contents of this book or forany consequences arising from its use or any reliance placed upon it. The information, opinions and advicecontained in this book may not relate to, or be relevant to, a reader's particular circumstances. Opinionsexpressed by the authors are the individual opinions of those persons and are not necessarily those of thepublisher or research provider.
ISBN 1 74146 065 4
Formatted/designed by Primary Industries Research Victoria Queenscliff
Printed by PIRVic Queenscliff, Victoria

FRDC Report 2000/264
Eel Industry Strategy and Business Analysis
iii
Table of ContentsAUSTRALIAN EEL AQUACULTURE INDUSTRY DEVELOPMENT STRATEGY AND BUSINESSANALYSIS ........................................................................................................................................................................I
TABLE OF CONTENTS ............................................................................................................................................. III
NON-TECHNICAL SUMMARY ................................................................................................................................. 1
OBJECTIVES:.................................................................................................................................................................... 1NON TECHNICAL SUMMARY: ........................................................................................................................................ 1
ACKNOWLEDGEMENTS............................................................................................................................................ 3
INTRODUCTION .......................................................................................................................................................... 5
BACKGROUND ................................................................................................................................................................ 5RECENT FRDC FUNDED GLASS EEL R&D.................................................................................................................... 5DRAFT NATIONAL EEL R&D STRATEGY....................................................................................................................... 5THE PRESENT STUDY...................................................................................................................................................... 6
INSTITUTIONAL FRAMEWORK AND ORGANISATIONAL ARRANGEMENTS FOR STATE-BASEDGLASS EEL FISHING AND EEL AQUACULTURE SECTORS............................................................................ 7
INTRODUCTION .............................................................................................................................................................. 7QUEENSLAND................................................................................................................................................................. 8NEW SOUTH WALES ...................................................................................................................................................... 8VICTORIA........................................................................................................................................................................ 9TASMANIA.................................................................................................................................................................... 10
STATUS OF THE AUSTRALIAN EEL AQUACULTURE INDUSTRY AND GLASS EEL FISHERY.......... 11
INTRODUCTION ............................................................................................................................................................ 11MARKET DYNAMICS .................................................................................................................................................... 11WILD AND STOCK-ENHANCED CAPTURE FISHERY PRODUCTION................................................................................ 14INTENSIVE/SEMI-INTENSIVE AQUACULTURE PRODUCTION....................................................................................... 16RECENT EEL AQUACULTURE AND GLASS EEL FISHERY R&D.................................................................................... 17
AUSTRALIAN EEL AQUACULTURE INDUSTRY - SCOPE FOR INCREASED PRODUCTIVITY. ......... 18
BACKGROUND .............................................................................................................................................................. 18FINANCIAL ANALYSIS OF SPECIFIC CULTURE SYSTEMS .............................................................................................. 19RESULTS OF FINANCIAL ANALYSES............................................................................................................................. 25EVALUATION OF INDUSTRY-WIDE DEVELOPMENT POTENTIAL................................................................................. 30
AUSTRALIAN EEL AQUACULTURE AND GLASS EEL FISHERY STRATEGIC DEVELOPMENT -DIRECTIONS, GUIDELINES, NEEDS AND VISION ......................................................................................... 36
BACKGROUND .............................................................................................................................................................. 36GLASS EEL FISHERY OPPORTUNITIES........................................................................................................................... 37RESOURCE MANAGEMENT NEEDS AND DIRECTIONS ................................................................................................. 38INDUSTRY STRUCTURE AND DEVELOPMENT CONSTRAINTS....................................................................................... 40TECHNICAL DEVELOPMENTS ....................................................................................................................................... 44MARKET DYNAMICS, NEEDS AND DIRECTIONS.......................................................................................................... 45R&D PRIORITIES - SUMMARY ...................................................................................................................................... 46
REFERENCES................................................................................................................................................................ 48
APPENDIX..................................................................................................................................................................... 49
AUSTRALIA-NEW ZEALAND EEL R&D PLAN 2000/01-2005/6 .................................................................................. 49
ATTACHMENT 1 -ANZERG MEMBERSHIP DETAILS ..................................................................................... 64

FRDC Report 2000/264
Eel Industry Strategy and Business Analysis
iv
ATTACHMENT 2 - AUSTRALIA-NEW ZEALAND EEL R&D WORKSHOP DELEGATES (PRESENTAND INVITED) ............................................................................................................................................................ 66
ATTACHMENT 3 - BACKGROUND/EXPLANATORY NOTES ON THE DRAFT R&D PLAN ................. 67

FRDC Report 2000/264
Eel Industry Strategy and Business Analysis
1
NON-TECHNICAL SUMMARY
2000/264 Title: Australian Eel Aquaculture IndustryDevelopment Strategy and Business Analysis
Principal Investigator: Geoff Gooley
Co-Investigator: L. J. McKinnon
Address: Primary Industries Research Victoria
PO Box 114
Queenscliff, VIC 3225
Ph.: 03 5258 0111 Fax: 03 5258 0270
Objectives:1. To analyse shortfin and longfin eel aquaculture investment potential in Australia, including
development of an appropriate decision support information database for government and industry.
2. To determine strategic guidelines for development of the Australian eel aquaculture industry, includingevaluation of national R&D priorities.
Non Technical Summary:
OUTCOMES ACHIEVED TO DATE
• Recognition by ANZERG, the primary national government coordinating and advisory body on eelresource management, of the potential for further sustainable development of the Australian eelaquaculture industry by increased utilisation and national trading of wild-caught glass eel resources,and the opportunity to facilitate development through providing requisite resource management policyand associated Best Practice industry guidelines for glass eel fishing and aquaculture.
• Key aspects of the report’s findings are presently being realised on a commercial basis to varyingdegrees in all four states by leading, individual industry proponents (if not widespread throughout theindustry). Such activities include increased effort in the harvest of longfin glass eels for aquaculture, thenational trading of juvenile/sub-adult eel seedstock, the vertical and horizontal integration of differentoperational levels of the wild eel fishery between and within individual business enterprises, and anincreased emphasis on intensification of production of larger (≥ 1 kg) eels for export markets.
The Australian eel aquaculture industry is relatively small in scale, geographically disparate in location, andpresently lacks any meaningful organisational structure and strategic direction at a national level. It is alsopart of a global eel aquaculture sector which is orders of magnitude greater in terms of scale and maturity,thereby imposing significant market pressure on the economic viability of local operations. Indeed marketfailure is presently evident in a number of areas, to the point where industry development is being impeded.It is against this background that the present study was initiated by the Fisheries Research and DevelopmentCorporation (FRDC), as a means of elucidating these constraints and providing some more strategicdirection to the Australian eel aquaculture industry, including investors, resource managers and researchers.

FRDC Report 2000/264
Eel Industry Strategy and Business Analysis
2
Moreover, the FRDC has identified the specific need to describe an appropriate industry developmentstrategy, together with an analysis of the investment potential for eel aquaculture in Australia.
This report takes the form of five key sections. The first section describes the background, objectives andmethodological approach to the study. The second section describes the current institutional andorganisational arrangements surrounding the Australian wild eel fishery and aquaculture industries. Thethird section describes the status and operational circumstances of the Australian eel aquaculture industry,with some reference to the wild eel fishery. The fourth section summarises a series of system specificfinancial analyses and industry-wide production simulations to provide the underlying rationale for a long-term industry development strategy. Section five describes the strategic direction in which the Australianeel aquaculture industry might go over the next 10-20 years, with reference to the requisite managementguidelines and R&D priorities designed to facilitate such development.
In order to progress the establishment of an industry vision designed to facilitate appropriate levels ofinvestment, expansion, and long term sustainability, an interactive industry development model is proposedto enable some predictive capability in the absence of real time operations and actual data. In the presentstudy, a simulative model has been constructed which has two main components around which a series ofassumed inputs and projected outputs can be determined. These assumptions and projected outputs arethen used as the basis for proposing various investment, production and development scenarios at both farmspecific and aquaculture (sub) sectoral level. The model and its main components are designed toincorporate a suite of Best Practice scenarios which are progressively implemented over time (from presentto 20 years hence) under a ‘continuous improvement’ regime inherent in a proposed industry-wide strategicdevelopment plan.
Based on industry experience, there is clearly a need for a critical mass of glass eels for any purpose builtculture system to operate efficiently. The model has determined this on the basis that an operator needs toensure a reasonable return on investment of purpose built capital plant and equipment, of which a minimumoutlay is required for any quantity of glass eels. Summary model outputs indicate:
• More intensive production of larger 1kg eels provides disproportionate financial advantage to theoperator compared with production of smaller 300g fish as a final market size.
• Intensive and semi-intensive production of larger eels, with a minimum 50kg glass eel intake perannum, should be profitable with a projected IRR of 20-40%; based on defined Best Practice scenariosand subject to price sensitivity for market value, feed and seedstock costs.
• Intensive production of 10g stockers should be profitable for limited and specialised operations cateringfor broad domestic market demand, with a projected IRR of > 40%; based on defined Best Practicescenarios, and subject to a minimum glass eel intake of 500kg per annum and price sensitivity for marketvalue and seedstock costs.
• Extensive production of large eels should remain profitable for larger eels with estimated IRR of 15-45%subject to availability of sufficient quantities of 10g seedstock, suitable water to stock and pricesensitivity for seedstock and market value.
According to the model, the Australian eel aquaculture industry could potentially produce over 1500 tonnesof marketable eels worth in excess of $30 million in Australia under the assumed Best Practice, seedstockallocation and market pricing regimes. Furthermore, the model estimates that under improved Best Practiceconditions, increasing the initial industry-wide glass eel intake to 500-750 kg per annum could potentiallyincrease the relative efficiency of industry utilisation of the wild glass eel seedstock resource by about 9-15%.It is at this level of glass eel supply upon which the potential for optimal production from all culture systemscould be fully realised.
Such quantities of shortfin and longfin glass eels are considered potentially available on an annual basisfrom the wild fishery within 10-20 years from a number of locations across the species’ range. For suchproduction to be achieved from the industry, the Australian glass eel resource must be managed at anational level, and industry must coordinate and integrate on a national scale to ensure management withinan ESD framework. Institutional and legislative impediments are however, presently limiting industrydevelopment, with existing state policies in relation to eel aquaculture development being inherently
FRDC Report 2000/264
Eel Industry Strategy and Business Analysis
3
parochial. This attitude is doing little to facilitate optimal use of what is otherwise a common pool naturalresource being shared by multiple stakeholders (including commercial and recreational fishers, fish farmers,and ethnic and indigenous groups) across multiple state and national boundaries. A more flexible approachis warranted to free up and encourage national trade in glass eels and intensively reared restock eels toensure that the longer term production capacity of the Australian eel aquaculture industry can be optimisedin the face of ongoing export market demand.
The Australian eel aquaculture industry needs to establish a long term strategic vision to encourageappropriate levels of investment and compliance with acceptable ESD performance criteria. This visionshould have a 10-20 year time frame and address at a national level various issues including relevant aspectsof culture technology, R&D, training and education, resource management, organisational structuring,financial management and marketing. Australia presently lacks an effective national focus for developmentof the eel industry, with a resultant lack of strategic industry development and coordination being apparent.The need in fact is for the eel industry to work across multiple state boundaries, not be constrained by them.
The Australian eel aquaculture industry is not presently limited by technology or informational gapsrequiring further R&D investment in the short term. Rather, more resources should be invested in removinginstitutional and legislative impediments (particularly to national glass eel trading), achieving betterintegration of key industry sectors, and technical training and extension (designed to enhance recent R&Doutcomes). In the longer term, various R&D needs have been identified as part of the draft national eel R&Dstrategy, and these should be reviewed periodically to determine the level of priority.
Keywords: Anguillid eels, aquaculture, glass eels, seedstock, financial analysis, strategic development,industry vision
AcknowledgementsThe authors wish to gratefully acknowledge key contributions to this report from the following researchcolleagues and industry representatives:
• Mr Will Dalton, formerly School of Business Studies, La Trobe University, Melbourne, forpreparation of MS Excel programming forming the basis of the financial analysis of the specificculture systems component of the simulative industry development model used in this report.
• Dr Brett Ingram, Primary Industries Research Victoria, for preparation of MS Excel programmingforming the basis of the industry-wide development potential component of the simulative industrydevelopment model used in this report.
• Ron and Sharon Elton, East Coast Eels P/L, Stratford Victoria, John Ranicar and Ben Brookman, EelsAustralis, and members of the Victorian Eel Fishers Association for provision of relevant eel fisheryand aquaculture industry information including commercial production specifications, costs andassociated market advice.
• Various state fisheries agency representatives including Anthony Forster, Fisheries Victoria, PhilBoxall, Tasmanian Inland Fisheries Service, Ian Lyall and Steve Boyd, NSW Fisheries, and RobSwindlehurst, Queensland Department of Primary Industries) contributed detailed information onaspects of the eel fishery and aquaculture sectors in their respective states.
• NSW eel industry representatives including Paul Kirk, Heinz Gress, Phonse Lane, Graeme Baileyand Mick Bennett for information on commercial eel fisheries and aquaculture activities in NSW.
Dr Sena De Silva, School of Ecology and Environment, Deakin University, Dr Brett Ingram, PrimaryIndustries Research Victoria, and Dr Peter Appleford, Fisheries Victoria provided constructive comment onthis report and their assistance is much appreciated by the authors.
Finally, the authors also wish to acknowledge the funding support of the Fisheries Research andDevelopment Corporation for this project.

FRDC Report 2000/264
Eel Industry Strategy and Business Analysis
4
FRDC Report 2000/264
Eel Industry Strategy and Business Analysis
5
IntroductionBackgroundThe Australian eel aquaculture industry is relatively small in scale, geographically disparate in location, andpresently lacks any meaningful organisational structure and strategic direction at a national level. It is alsopart of a global eel aquaculture sector which is orders of magnitude greater in terms of scale and maturity,thereby imposing significant market pressure on the economic viability of local operations. Not surprisinglytherefore the future of the Australian industry is somewhat unclear, with one consequence at the presenttime being a reduction in new financial investment and ‘stalled’ commercial eel aquaculture development.
Despite this uncertainty, existing operators within Australia remain committed to establishing viable eelaquaculture businesses in at least four states. Many such operators have a background with and/or ongoinglinkages to the Australian wild eel (capture) fishery, and see aquaculture as a logical adjunct to the wildfishery, if not a complete, longer-term alternative. Indeed the transition from a wild fishery base to acombined wild fishery/aquaculture base for the Australian eel industry over the last several years has beenquite profound in many respects, to the point where Australia can now legitimately claim to have a ‘newand developing’ eel aquaculture sector.
Arguably, much of the confidence of the existing operators is based around, not only the inherent suitabilityand marketability of Australian anguillid eels as a cultured (and wild) product, but also the recent positiveachievements of both industry and Government in relation to juvenile eel resource management andresearch and development. Indeed, on face value, much of the information needed to further develop andultimately manage the Australian eel aquaculture industry on both a profitable and environmentallysustainable basis is now available. As previously implied however, market failure is presently evident in anumber of areas, to the point where industry development is being impeded. It is against this backgroundthat the present study was initiated by the Fisheries Research and Development Corporation (FRDC), as ameans of elucidating these constraints and providing some more strategic direction to the Australian eelaquaculture industry, including investors, resource managers and researchers.
Recent FRDC Funded Glass Eel R&DThe FRDC of recent years has invested significant funds into the development of the commercial eel fisheryand aquaculture sector within Australia. Specifically in support of the latter, the FRDC has funded twomajor projects which have investigated various aspects of glass eel resource assessment and aquaculture,with an emphasis on the Australian shortfin eel, Anguilla australis, and the longfin eel, A. reinhardtii. Theseprojects, FRDC Project No. 94/067 and FRDC Project No. 97/312 (incorporating supplementary Project No.99/330), have also been financially supported by relevant state fisheries and aquaculture managementagencies in four states (viz. Queensland, New South Wales, Victoria and Tasmania). The projects wereundertaken on a collaborative basis by various research agencies in each of these states, and the final reportshave now been published (Gooley et al., 1999; Gooley and Ingram, 2002)(see also Section 3.5 for furtherdetails).
Draft National Eel R&D StrategyGiven the ongoing level of interest from the eel industry, government resource managers and researchers forfurther eel fishery and aquaculture R&D, the FRDC has more recently endeavoured to adopt a strategicapproach to investing in this sector through the development of a Draft National Eel R&D Strategic Plan (seeAppendix for details). The Plan emphasises national R&D priorities for the eastern Australian eel sector,and has engaged all major stakeholders in the process. It is intended that this Plan be used as a guide tofuture R&D investment in Australia, but also it is recognised that it will be subject to periodic review toensure relevance to market conditions, particularly in terms of ensuring that the limited available R&Dresources are directed at areas of clear market failure and for which the likelihood of achieving ESD-basedoutcomes is relatively high.

FRDC Report 2000/264
Eel Industry Strategy and Business Analysis
6
The Present StudyGiven the previous introductory comments, and prior to implementation of the R&D Plan, the FRDC hasidentified the logical next step in addressing the strategic needs of the Australian eel aquaculture sector.Indeed the FRDC has determined that the R&D Plan in itself is insufficient to determine an appropriate levelof R&D investment in Australian eel aquaculture in the absence of key business and economic information.Such a nexus is consistent with the vagaries of many new and developing aquaculture industry sectors inAustralia, and there are few suitable examples or templates of such databases to support R&D investmentdecisions for new commercial entrants. This is further compounded at the present time by the lack of anagreed, medium to long-term eel industry development vision.
The FRDC has therefore identified the specific need to describe an appropriate industry developmentstrategy, together with an analysis of the investment potential for eel aquaculture in Australia. This strategywould complement the existing draft R&D strategy and effectively provide the commercial rationale forfurther investment in eel R&D and associated industry development in Australia.
Although intended to focus on the new and developing eel aquaculture sector, this analysis also needs toaddress attendant issues relevant to the wild glass eel fishery, recognising the ongoing dependence of eelaquaculture on wild-caught seedstock.
Accordingly, FRDC has funded the present study (Project No. 2000/264), for which this document is the FinalReport. The Project has been managed by the Marine and Freshwater Systems Platform of PrimaryIndustries Research Victoria (formerly Marine and Freshwater Resources Institute, Department of NaturalResources and Environment, Victoria), and has involved contributions from a number of leading Australianeel research, management and industry personnel. The Project commenced in July 2000 for a 12 monthperiod.
Project Objectives1. To analyse shortfin and longfin eel aquaculture investment potential in Australia, including
development of an appropriate decision support information database for government and industry.
2. To determine strategic guidelines for development of the Australian eel aquaculture industry, includingevaluation of national R&D priorities.
Project methods1. Document and summarise past and present eel aquaculture related research undertaken in Australia,
including identification of key outputs and evaluation of effectiveness of addressing existing R&Dpriorities.
2. Develop draft national guidelines for the sustainable utilisation and management of Australian anguillidglass eel resources; to include identification of the dimensions of the Australian glass eel resource andestimates of the scale and sustainability of the potential catch for aquaculture purposes.
3. Describe and document the current industry development in Australia on a state by state basis,including a description of ongoing/future development, and a proposed 20 year development vision forthe industry which highlights key drivers, targets and strategies to support such development.
4. Document the current legislative and associated institutional framework relevant to eel aquaculture on astate by state basis, including identification of key institutional and legislative impediments todevelopment.
5. Undertake an economic analysis of the Australian eel aquaculture business, including assessment ofpotential financial return and critical development factors for different management scenarios andsensitivity analysis of key production parameters.
6. Undertake a strategic planning analysis of R&D needs for Australian eel aquaculture developmentwhich an emphasis on identifying areas of market failure and key industry drivers, factoring in previousR&D outcomes; make recommendations on proposed R&D investment priorities to facilitateimplementation of the existing draft R&D plan where appropriate.

FRDC Report 2000/264
Eel Industry Strategy and Business Analysis
7
This report takes the form of five key sections, presented as discrete chapters. The first section (this chapter)describes the background, objectives and methodological approach to the study. The second sectiondescribes the current institutional and organisational arrangements surrounding the Australian wild eelfishery and aquaculture industries. The third section describes the status and operational circumstances ofthe Australian eel aquaculture industry, with some reference to the wild eel fishery.
The second and third sections combined provide the background information upon which the remainingtwo sections, viz. four and five, are based. The fourth section summarises a series of system specificfinancial analyses and industry-wide production simulations to provide the underlying rationale for a long-term industry development strategy. Section five describes the strategic direction in which the Australianeel aquaculture industry might go over the next 10-20 years, with reference to the requisite managementguidelines and R&D priorities designed to facilitate such development.
Limitations of the StudyWhereas every effort has been made in this report to provide accurate and reliable data, much of the dataused has been sourced anecdotally, due to a lack of existing, more formal databases. Where readers haveaccess to data which may in some way vary from that which is described in the report and which is deemedto be more appropriate for whatever reason, they are encouraged to use such data and to make the necessaryallowances for the relevant projections where indeed this may lead to a different outcome from thatdescribed in this report. Furthermore, as this study has drawn on such information over an extended periodprior to the final publication of this report, it is recognised that some key parameters may well have changedof recent times which in turn may likewise have a bearing on some key findings and recommendations ofthis report. Accordingly readers are again advised to make the necessary allowances for such changes wherenecessary.
Institutional Framework andOrganisational Arrangements for State-Based Glass Eel Fishing and EelAquaculture SectorsIntroductionThis section provides a brief summary of the institutional framework and associated industry organisationalarrangements at a state level for the Australian glass eel fishing and aquaculture sectors. A brief synopsis ofAustralian eel market dynamics is also provided for completeness. It is not intended that this summary beexhaustive, rather indicative of the prevailing circumstances within industry and government at the presenttime1.
It is also intended that this section of the report complement the next section which summarises the presentproduction and operational status of the industry in Australia. These two sections in combination provide auseful and informative background to latter sections of this report which in more detail refer toopportunities for expansion, the need for change and the strategic direction in which the industry should goto address a long term vision of where it wants to be in 20 years time.
1 Whereas the information provided in this Chapter was deemed to be accurate at the time of collation for the periodending 2000/01, it is noted that some variation may have occurred in the ensuing period prior to publication, but thatsuch variation would not substantively change the report’s key findings.
FRDC Report 2000/264
Eel Industry Strategy and Business Analysis
8
QueenslandBased on 2000/01 production returns, there were 26 aquaculture licences in Queensland with endorsementsfor eel culture. The majority of these also had permits for the collection of glass eels and/or elvers asseedstock for aquaculture, however in practice only 3 or 4 of these have actively undertaken such activity ofrecent times. Each permit has a Total Allowable Catch (TAC) for juvenile eels which is directly related to theproduction capacity for eel of the associated aquaculture facility. The export of glass eels from Queensland iscurrently not permitted; the intention being that all juvenile eels harvested in Queensland be retained in thestate for further growout to final market size. Contractors may also be employed as fishers by theaquaculture enterprise to collect eel seedstock on their behalf under the relevant permit.
The majority of the production from Queensland is from a single, semi-intensive, pond-based farmingoperation in south-east Queensland which produces predominantly longfin eels. Much of the seedstock forthis farm is based on wild caught ‘restock’ although trials using glass eel sourced seedstock are underconsideration subject to availability, cost and market demand for product. The industry has 6.8 permanentstaff (10 in 1999/00) and employed 9300 hours of casual labour. This equates to 12 full-time equivalents (nochange over last 12 months) employed in the industry (Lobegeiger, 2002).
New South WalesState government policies exist for eel aquaculture and glass eel fishery development in NSW (seewww.fisheries.nsw.gov.au for details). In 1999/2000 there were 21 licensed fish farms in NSW with permitsfor shortfin eel production, including 17 farms with permits also for longfin eel production (source: NSWFisheries). In this period, two tonnes of cultured longfin eel was produced worth $16,500 (c.f. 2.3 tonnesworth $18,700 from 14 licensed growers in 1998/99), and 400 kg of cultured shortfin eel was produced worth$1000 (c.f. 38 kg worth $500 from 12 licensed farms in 1998/99)(source: unpublished data NSW Fisheries,2002).
In 2000/01 there were nine glass eel collection permits on issue in NSW (of which only four were active),including three which belong to eel farmers who may collect glass eels only for their own use. Permits forthe collection of glass eels in NSW are not transferable. A TAC of 300kg of glass eels (total inclusive for bothspecies) was set for the State in 2000/01 and allocated on a one-off, expression-of-interest basis, withconsideration for further allocations being subject to industry need. Presently, 18 rivers are open to glass eelfishing with a further limit of 30 kg per river being set under the TAC. Three ‘refuge’ catchments (Clarence,Hawkesbury and Port Stephens), in which no commercial fishing can occur, provides for some protection ofstocks. Glass eel fishers also need an agreement with licensed eel farmers to collect a predetermined quantityof glass eels, if in fact the fishers are not permitted to catch glass eels for their own use. In 1999/2000, a totalof 44 kg of glass eels (species not specified) was requested by license holders in NSW, with 15kg (mixedspecies) being caught. In 2000/01, about 100kg was requested, with approximately 10 kg being caught.
Based on recent anecdotal information, the overall view of the eel farmers in NSW is that both import andexport of glass eels should be permitted, however to date there appears to have been little or no commercialtrade of glass eels between NSW and other states. Indeed, under existing management arrangements, glasseels collected in NSW are only for use in NSW farms and, like Queensland, cannot be sold interstate, andglass eels sourced in other states are not permitted to be imported into NSW. There is also a somewhatcontradictory, but otherwise limited and unofficial, industry view that there should be no exploitation at allof glass eels in NSW waters.
Presently, the preferred species for farming in NSW is clearly the longfin eel, which in 2000/01 was bringinga farm-gate price of about $14/kg (headed and gutted). Preferred, marketable product size was >500-600g(whole fish), but supply was very limited. The industry preferred production method in NSW at the presenttime is pond-based growout of wild-caught, ‘sub-adult’ stockers (<300g), although there is increasing interestin the potential use of stockers from intensive, nursery systems using glass eel seedstock, for pond growout.More specifically, commercial operators in NSW deem that the major constraint to eel aquaculture industrydevelopment is the initial supply of glass eels for seedstock production purposes, whatever the preferredfinal stocker size may be.
Recently, only one glass eel collection permit holder has fished exclusively for glass eels, although one otherhas a collection permit for ‘own (eel farming) use’ purposes. Most glass eel permit holders in NSW are

FRDC Report 2000/264
Eel Industry Strategy and Business Analysis
9
primarily commercial estuary fishermen, and therefore do not necessarily collect glass eels at the appropriatetime, rather direct efforts in favour of fishing for other higher priced, seasonally available species. To someextent this problematic arrangement is further compounded by the lack of an effective working relationshipwithin the industry between eel farmers (aquaculture sector) and glass eel suppliers (wild fishing sector).This situation is aggravated further by the fact that both species of eel (longfin and shortfin) are present inthe NSW glass eel fishery, often in equal proportions during the main periods of migration, and there isconsiderable difficulty in distinguishing between species with the naked eye at this early developmentalstage. NSW eel farmers generally see the solution to this in permitting growers to routinely source their ownglass eels. Despite these constraints however, there is an agreed need in NSW (at least within theaquaculture sector) for establishing a workable, cooperative, vertically integrated arrangement between glasseel supplier, intensive nursery stage, and pond growout components.
The majority of eel production from NSW farms is presently from a single, semi-intensive, pond-basedsystem using both glass eel and ‘small’ eel seedstock. Although presently small in scale (< 10 tonne/annumproduction capacity), this system has the potential to expand to > 20 tonne/annum in the future. Anothersemi-intensive, pond-based system of similar capacity (3.6 ha total pond surface area) is under developmentpresently in NSW, as an extension of what was originally a smaller, pilot-scale, tank-based system. Oneother smaller pond-based system (2 ha total surface area) is also under development.
Apart from the perceived institutional and legislative impediments imposed on further eel aquacultureindustry development in NSW by the existing glass eel fishery restrictions/regulations (see previouscomments), some industry representatives believe that further policy constraints include the prevention ofeel stock enhancement of public waters. Other stated concerns in relation to statutory planning andapprovals processes are considered to be consistent with other sectors of the Australian aquaculture industry(both marine and freshwater) in all states and not unique to eel farming development in NSW.
VictoriaThe Victorian commercial eel fishery is an important fishery for the State, comprising both the shortfin andlongfin eel, which combined produce 125-450 tonnes, worth approximately $1.4-4.7M annually. Overall, theshortfin eel makes up approximately 90% of total eel production. The eel fishery has been relatively stable, interms of production over the last 2 decades, however the fishery is strongly affected by seasonal factors, andrecent drought conditions have resulted in relatively lower production. Reduced market demand for smallershortfin eels has also impacted on industry profitability of recent times.
A large component of eel production in Victoria continues to be stock enhancement, whereby elvers andundersized ‘restock’ eels are stocked into selected (approved) waters (lakes, wetlands etc) for extensivegrowout under natural conditions. In most years the commercial catch is roughly comprised of up to 40%stock-enhanced/cultured shortfin eel product, however protracted drought conditions since 1994 haveresulted in a significant decrease in stock-enhanced eel production.
The wild shortfin and longfin eel components of the fishery are comprised largely of migrating adult eels.The reliance of the existing commercial eel fishery in Victoria on this component of the fishery isconsequently very great, particularly during periods of drought when productivity from stock-enhancedwaters is low. In 2000/01 there were 18 Eel Fishery Access Licence (EFAL) holders in Victoria, and theindustry directly employs around 30 full time, and up to 70 part time people across Victoria. Most eels areexported frozen to Europe (mainly shortfin eels) or live to Hong Kong and Korea (mainly longfin eels).There is also a limited domestic market for Victorian produced shortfin eel in Australia at present.
A new Victorian Eel Fishery Management Plan was released in 2002 (McKinnon, 2002) which provides thelegislative framework for the wild fishery. This Plan is intended to provide for the management of Victorianeel resources within an ESD framework, and specifically provides for the sustainable, commercial utilisationof glass eels harvested from Victorian coastal waters for aquaculture purposes.
The commercial fishery is input managed, with limited entry, gear restrictions and fishing and ‘culture’water allocation the main input restrictions. There is no minimum size or TAC set for the eel fishery inVictoria. Fyke nets are the only gear permitted for use by EFAL holders and only holders of an EFAL mayuse or possess fyke nets. A small quantity of eel is also taken commercially in bay and inlet fisheries by haulseine operators. Restrictions on the use of fyke nets include: mesh size of not less than 15mm and not greater

FRDC Report 2000/264
Eel Industry Strategy and Business Analysis
10
than 39mm, and a maximum of 3 wings, each of 46m maximum length, 67cm maximum drop and meshes ofno more than 32mm. Currently, each licence holder may use up to 50 fyke nets and nets must be cleared atleast once every 48 hours. A fyke net when set must not occupy more than half of the width of awatercourse, and may not be within 5m of another net. Some EFAL holders are permitted to use oversizefyke nets specifically for targeting migrating sea-run eels. Access to glass eels is limited to EFAL holdersunder permit only.
At the present time the demand for cultured elver (glass eel-sourced) seedstock for extensive, stockenhanced wild fisheries in Victoria is limited, with existing fishers preferentially purchasing wild caughtTasmanian elvers and Victorian sourced sub-adult restock on the basis of perceived cost effectiveness. Morespecifically, glass eel-sourced seedstock is considered by commercial fishers to be too expensive at any costgreater than the market rate for Tasmanian elvers (typically $180-200/kg). The latter price presently happensto approximate the production cost (based on present techniques and prices) of catching and weaning glasseels ready for sale as seedstock for growout (eg. 10g sized elvers), thus partly limiting any competitiveadvantage for producers taking this option.
Despite these concerns, the Victorian Eel Fishers Association has acquired a permit to harvest glass eels fromthe Snowy River during the 1999/00 and 2000/01 period, primarily for the purposes of providing seedstockfor extensive culture and some limited intensive culture. These permits were issued by the government on alimited basis prior to the release of the new management plan, and include provisions for a subsequent‘conservation stocking’ of at least 10% of the harvested glass eels being returned to the wild (usuallyupstream of the original collection location) as elvers. Permits have also been issued to specific fishers toharvest limited quantities of glass eels from ‘allocated’ waters in which existing eel fishing licence provisionsinfer exclusive commercial eel fishing access to the licence holder.
TasmaniaEel production in Tasmania is based on the wild fishery for shortfin eels. In 2000/01 there were 12 licensedeel fishers operating in the State, with total reported catch being 42.8, 59.2 and 44.6 tonnes/yr respectively forthe three year period 1997/98-1999/00. First grade eels (>900 grams) average about $6/kg to the fisher, withsmaller ‘restock eels’ bringing an average of about $3/kg. Licences are transferable. Fyke nets and traps aretypically used to harvest eels in Tasmania, with lakes, lagoons and farm dams being the main areas that arefished. Input controls on the fishery include:
• Fyke net size opening height not to exceed 670mm; width not to exceed 670mm; a mesh size not lessthan 15mm and not more than 39mm; any wing or leader not to exceed 10 meters in length and not toexceed 1200mm in drop (there is no restriction as to number of nets/traps per fisher).
• Fyke nets are not normally permitted in flowing waters (rivers etc); some use is permitted under aspecial permit.
• Eel trap size does not exceed 500mm in height, does not exceed 500mm in width, and does not exceed 2meters in length with no wings or leaders; has a mesh of at least 39mm.
• There are provisions for a fisher to apply to use larger equipment in their catchment.
• Only fish greater than 300mm TL can be harvested.
• Fishing is not permitted in National Parks, World Heritage Areas, State Reserves, and local Councilwater storages.
In Tasmania, licensed eel fishers are entitled to restock catchments with relocated elvers to assist thesustainability of the fishery and to enhance production. Table 1 details the combined elver catch from theTrevallyn Tailrace (Tamar River) and Meadowbank Dam (Derwent River). The total catch of shortfin elversper year between 1994/95 and 2001/02 ranged between 1.4 and 4.8 tonnes (mean 2.7 tonnes), with up to 1.1tonnes purchased by industry, both within Australia and on the export market (Table 1). The value of thesold portion of the catch varies from year to year, but is commonly in the order of $180-200/kg. The portion

FRDC Report 2000/264
Eel Industry Strategy and Business Analysis
11
of the total catch not sold is used to restock natural waterways within Tasmania. There is no data inTasmania to distinguish production returns specifically from stock-enhanced waters using restock eels ortranslocated elvers.
Table 1 Tasmanian shortfin elver catch and allocation for the period 1994/95-2001/02. (source:unpublished data, Tasmanian Inland Fisheries Service, 2002).
Year Total Catch (kg) Sold (Interstate/International) (kg) Restock (Tasmanian lakes / dams /rivers) (kg)
1994 / 1995 1420 700 7201995 / 1996 4756.5 1110.5 36461996 / 1997 2219.6 1045.5 1174.11997 / 1998 2754.5 741 2013.51998 / 1999 3957.9 775 3182.91999 / 2000 2673 50 26232000 / 2001 2315.8 0 2315.82001/2002 2213 125 2088
Interest in eel aquaculture appears to be growing and, as of 2000/01 one permit had been issued forongrowing eel in a small-scale recirculating system. It is expected that if eel aquaculture developed inTasmania, then elver resources would be allocated to this sector by the Inland Fisheries Service.
Under the Inland Fisheries Act 1995 there is provision for a juvenile eel licence designed to providecommercial access to license holders for harvesting glass eels and elvers. At this point of time a licence hasnot been issued for glass eels although some permits for research and development have been issued.
Status of the Australian Eel AquacultureIndustry and Glass Eel Fishery.IntroductionHistorically, Australian eel production has been dominated by wild and stock enhanced capture fisheryharvest, with more intensive eel aquaculture production only becoming apparent during the late 1990s. Bothwild fishery and aquaculture sectors are based exclusively on longfin and shortfin eels, but the relativeimportance of the two species varies from state to state and sector to sector. Table 2 summarises, on a stateby state basis, the estimated 1999/00 production for both species across both wild fishery and aquaculturesectors (where available, more recent data for relevant states is discussed further in the subsequent text).
Market DynamicsAccording to FAO data (FishStat Plus 1996-2000, Version 2.3) total world eel aquaculture production isreported to be 232,815 tonnes worth approximately US$975 million for 2000. The vast majority of thisproduction comes from the three major eel producing countries viz., China (160,740 tonnes), Taiwan (30,470tonnes) and Japan (24,118 tonnes). Since 1995 annual production has progressively increased substantially inChina from about 120,000 tonnes, with smaller increases recorded for Taiwan (about 5000 tonnes in 2000, butvarying markedly on an annual basis, including reductions of several thousand tonnes per annum onoccasions). Annual production in Japan has fallen over this period by about 4500 tonnes.
Chinese production is for combined Japanese and European eels, whereas only Japanese eels are producedin Taiwan and Japan. Other key producers of European eels (only) in 2000 include The Netherlands (3700tonnes/annum, up from 1585 tonnes in 1995), Denmark (2676 tonnes/annum, up from 950 tonnes in 1996),and Italy (2450 tonnes/annum and steady since 1996).

FRDC Report 2000/264
Eel Industry Strategy and Business Analysis
12
Table 2 Australian longfin and shortfin eel production (wild fishery and cultured) on a state by statebasis for 1999/00-2000/01, updated from Gooley et al. (2002) (based on industry estimates for 1999/2000and/or most recent available ‘production return’ data for this period; where available, actual referencesfor published data listed as footnote to table); LF, longfin eel; SF, shortfin eel; na, not available.
Wild capture CulturedAnnual tonnage Value ($,000’s) Annual tonnage Value ($,000’s)
QLD LF* 42.3 na 21.5 235NSW LF av. 150 (range 100-400) na 2 16.5
SF - - 0.4 1VIC LF 37 444 - -
SF** 94 943 44 484TAS SF 44.6 178 - -* likely to be predominantly longfin eel, although may include some shortfin; source Lobegeiger (2001).** cultured shortfin eel in Victoria predominantly from stock enhanced waters; source Anon. (2001).
Preferred culture system methods for these countries vary, with China, Taiwan and Japan predominantlyusing greenhouse covered, intensive/semi-intensive concrete pond-based systems, The Netherlands andDenmark using predominantly intensive tank-based recirculating aquaculture systems (RAS), and Italyusing semi-intensive, pond-based systems.
It is apparent that eel production in China has increased dramatically of recent years to the point ofoversupplying the market and with a consequent negative impact on price to producers. The vast majorityof this oversupply is for smaller eels in the 150-300g size range. Impacts on price for cultured eels have beennoted during the same period in all major eel producing countries in both Asia and Europe. Also, there issome question over the quality of cultured eel products in some countries. Recently, Korean markets areknown to have preferentially sourced cultured eels from Australia at a premium price over Chinese culturedproducts on the basis of the perceived higher quality.
The massive increase in Chinese cultured eel production has been largely underpinned by the now readyacceptance of the European eel, A. anguilla, by Chinese producers and in the Asian marketplace, as well asthe ready availability of large quantities of relatively cheap European glass eels for importation into China(reported to be around 100 tonnes from France in 2000 c.f. around 10-15 tonnes per annum on average for A.japonica glass eels sourced locally). By contrast, the demand for wild-caught eels, cultured eels that have theappearance of wild-caught product, and larger eels (≥ 1kg) remains steady throughout Asia and in sometraditional European markets (eg. Germany). Australian longfin eels particularly satisfy many of the criteriafor Asian markets presently, with some industry sources suggesting that they have a similar physicalappearance to the endemic Asian species, the spotted eel A. marmorata, which is the basis of a small butlucrative Asian wild fishery. All wild eel fisheries in Asia and many in Europe are presently thought to be invarying stages of decline. European wild eel fisheries at least are increasingly being subject to regulatorycontrols for sustainability purposes (EIFAC/ICES, 2002).
Although the Australian domestic eel market is considered to be relatively small, already locally producedproducts (including value added portions) are being subjected to competition from low priced imports ofcultured eels from China and wild eels from New Zealand (total of up to 40 tonnes imported annually intoAustralia; source BRS statistics 2001).
Export of some relatively low valued sub-adult wild seedstock (mixed species around 300mm total lengthand 200g weight) has occurred from Australia to China for subsequent intensive grow-out and value-addingin China. This export is considered by some industry sources to be competing in demand with the need forseedstock and/or ‘restock’ for Australian extensive, stock-enhanced eel production.
A summary of anecdotal eel market information from informed industry sources (for the period 2000/01) isas follows (all prices quoted in AUD$):

FRDC Report 2000/264
Eel Industry Strategy and Business Analysis
13
Shortfin eels
• Price:
Domestic $6-7/kg farm gate, down from ~$10-12/kg over last 12 months, for wild caught product atlarger size (≥ 1kg).
Export $6-7/kg farm gate (~$10-12/kg landed overseas), down from $11-15/kg farm gate over the last10-12 months; European demand is however still strong in some traditional European markets (eg.Germany) with higher prices available for larger sizes (eg. $18/kg landed for ≥ 1kg size eels).
• At present occasional shipments of 200-300kgs sold with shipments of longfin eels; these eels are notunlike the cultured Japanese eel A. japonica in appearance.
• Potential for up to 200 tonne per annum for larger operators exporting to niche European markets.
• Domestic sales in Victoria of 200-300kg/week of smoked eel from stock enhanced culture waters beingachieved (export annual demand in order of 10 tonne).
• Ongoing drought conditions severely impacting production from stock enhanced waters due to lack ofsuitable water.
• Intensively cultured shortfin eels acceptable to the market but for whole fish must be larger (≥ 1kg);smaller fish suitable for smoking.
Longfin eels
• Price:
Export (only) $18-20/kg farm gate with steady demand for wild caught product at larger size (≥ 1kg).
No obvious domestic market demand.
• Shipments of 200-300kg of wild caught product are occurring at a time for some operators with a total ofabout 50 tonne annual sales; potential for larger operators to sell up to 200 tonne per annum of culturedproduct into Asian markets.
• Key markets are China/Hong Kong, Taiwan, and to a lesser extent Korea.
• Intensively cultured longfin eels (≥ 1kg) acceptable although small/limited quantities only to date.
• To meet this market demand there is a need for longfin eel restock for private stock enhanced culturewaters which are being overfished.
• Availability of glass eel seedstock/advanced sized restock is limited and reasonable market price isunclear; steady supply is required for all culture systems.
General
• The prevailing drought conditions in Victoria of recent years have impacted severely on production ofwild shortfin eel, but demand has remained high in international markets. Prices have howeverdeteriorated for shortfin eels, due largely to oversupply of farmed product from other producers. Themarket has also shifted in preference to larger longfin eels, although the feeling is that the size andquality of the eel is perhaps more important than the species (appearance) in some cases.
• Shipping costs for live eels are generally considered to add about $4/kg (i.e. approximately $3.50/kgfreight and $0.50/kg packaging) to the farm gate price for Asian markets.
FRDC Report 2000/264
Eel Industry Strategy and Business Analysis
14
Wild and stock-enhanced capture fishery productionCommercial fishing for Anguillid eels occurs in all Australian States where eels are naturally abundant. Theshortfin eel and longfin eel are targeted throughout their range, with shortfins dominating commercialcatches in Victoria and Tasmania, and longfins dominating catches in Queensland and NSW. Althoughshortfin eels occur in south-eastern South Australia, no commercial fishery for eel exists there.
Much of the longfin eel catch in NSW is based around the multi-species estuarine fishery, for whichestimates of the specific eel catch are only approximate. Longfin eels in Queensland are typically taken fromboth estuaries and coastal impoundments. There are currently 30 eel capture licences in Queensland (steadydecrease from 61 licences in 1996) which produced 42.3 tonnes in 2000. The commercial fishery is restrictedto impounded waters and licences are being progressively withdrawn to reduce pressure in weirs andbarrages. The value of the NSW and Queensland sectors has not been reported, but at an assumed minimumwholesale price of $10/kg, total value would be in the order of (minimum) $423,000 for Queensland and $1-4million for NSW. The longfin catch in Victoria is predominantly from the Gippsland Lakes. The shortfinwild capture fishery in Australia is concentrated in Victoria and Tasmania, with much of the catch beingtaken from coastal waters (rivers and associated wetlands).
Victorian eel production is also supplemented by stock enhanced capture fisheries based in selected lakesand wetlands in western Victoria. The seedstock for this practice has historically been sourced from theVictorian wild fishery (typically mixed age/size juveniles and/or sub adults, also referred to as ‘restock’), andfrom mixed age/size juveniles (mostly brown elvers) commercially harvested from the tail-race of theTrevallyn Power Station, at Launceston in northern Tasmania, and from Meadowbank Dam on the DerwentRiver.
Eels subsequently harvested from stock enhanced waters are often referred to as ‘cultured’ for the purposeof licensing and reporting in production returns to the Government. Consequently, such data is oftenincorporated into published aquaculture production status reports for Victoria/Australia, although thispractice involves little or no active management intervention, other than completing the initial stockingitself. Although referred to as ‘cultured’ in Table 2, a significant proportion (up to 40%) of the shortfin eelproduction in Victoria is from stock enhancement, and therefore considered an extension of the wild capturefishery as much as an aquaculture activity per se.
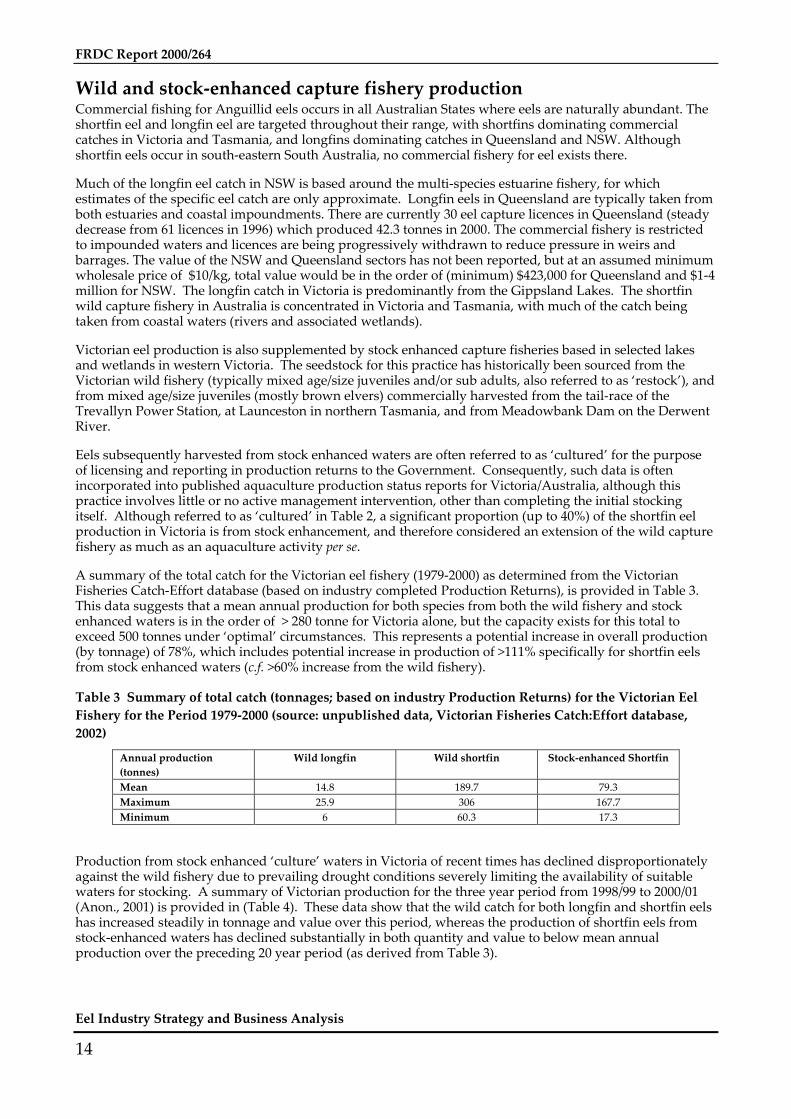
A summary of the total catch for the Victorian eel fishery (1979-2000) as determined from the VictorianFisheries Catch-Effort database (based on industry completed Production Returns), is provided in Table 3.This data suggests that a mean annual production for both species from both the wild fishery and stockenhanced waters is in the order of > 280 tonne for Victoria alone, but the capacity exists for this total toexceed 500 tonnes under ‘optimal’ circumstances. This represents a potential increase in overall production(by tonnage) of 78%, which includes potential increase in production of >111% specifically for shortfin eelsfrom stock enhanced waters (c.f. >60% increase from the wild fishery).
Table 3 Summary of total catch (tonnages; based on industry Production Returns) for the Victorian EelFishery for the Period 1979-2000 (source: unpublished data, Victorian Fisheries Catch:Effort database,2002)
Annual production(tonnes)
Wild longfin Wild shortfin Stock-enhanced Shortfin
Mean 14.8 189.7 79.3Maximum 25.9 306 167.7Minimum 6 60.3 17.3
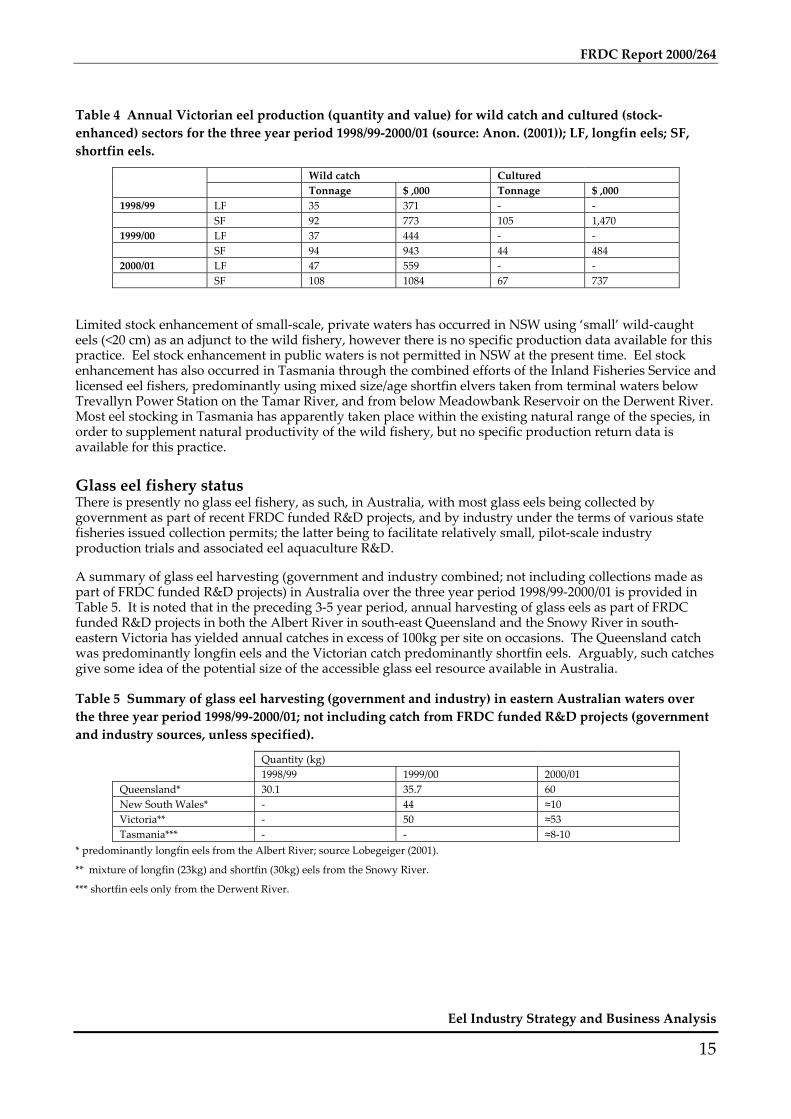
Production from stock enhanced ‘culture’ waters in Victoria of recent times has declined disproportionatelyagainst the wild fishery due to prevailing drought conditions severely limiting the availability of suitablewaters for stocking. A summary of Victorian production for the three year period from 1998/99 to 2000/01(Anon., 2001) is provided in (Table 4). These data show that the wild catch for both longfin and shortfin eelshas increased steadily in tonnage and value over this period, whereas the production of shortfin eels fromstock-enhanced waters has declined substantially in both quantity and value to below mean annualproduction over the preceding 20 year period (as derived from Table 3).
FRDC Report 2000/264
Eel Industry Strategy and Business Analysis
15
Table 4 Annual Victorian eel production (quantity and value) for wild catch and cultured (stock-enhanced) sectors for the three year period 1998/99-2000/01 (source: Anon. (2001)); LF, longfin eels; SF,shortfin eels.
Wild catch CulturedTonnage $ ,000 Tonnage $ ,000
1998/99 LF 35 371 - -SF 92 773 105 1,470
1999/00 LF 37 444 - -SF 94 943 44 484
2000/01 LF 47 559 - -SF 108 1084 67 737
Limited stock enhancement of small-scale, private waters has occurred in NSW using ‘small’ wild-caughteels (<20 cm) as an adjunct to the wild fishery, however there is no specific production data available for thispractice. Eel stock enhancement in public waters is not permitted in NSW at the present time. Eel stockenhancement has also occurred in Tasmania through the combined efforts of the Inland Fisheries Service andlicensed eel fishers, predominantly using mixed size/age shortfin elvers taken from terminal waters belowTrevallyn Power Station on the Tamar River, and from below Meadowbank Reservoir on the Derwent River.Most eel stocking in Tasmania has apparently taken place within the existing natural range of the species, inorder to supplement natural productivity of the wild fishery, but no specific production return data isavailable for this practice.
Glass eel fishery statusThere is presently no glass eel fishery, as such, in Australia, with most glass eels being collected bygovernment as part of recent FRDC funded R&D projects, and by industry under the terms of various statefisheries issued collection permits; the latter being to facilitate relatively small, pilot-scale industryproduction trials and associated eel aquaculture R&D.
A summary of glass eel harvesting (government and industry combined; not including collections made aspart of FRDC funded R&D projects) in Australia over the three year period 1998/99-2000/01 is provided inTable 5. It is noted that in the preceding 3-5 year period, annual harvesting of glass eels as part of FRDCfunded R&D projects in both the Albert River in south-east Queensland and the Snowy River in south-eastern Victoria has yielded annual catches in excess of 100kg per site on occasions. The Queensland catchwas predominantly longfin eels and the Victorian catch predominantly shortfin eels. Arguably, such catchesgive some idea of the potential size of the accessible glass eel resource available in Australia.
Table 5 Summary of glass eel harvesting (government and industry) in eastern Australian waters overthe three year period 1998/99-2000/01; not including catch from FRDC funded R&D projects (governmentand industry sources, unless specified).
Quantity (kg)1998/99 1999/00 2000/01
Queensland* 30.1 35.7 60New South Wales* - 44 ≈10Victoria** - 50 ≈53Tasmania*** - - ≈8-10
* predominantly longfin eels from the Albert River; source Lobegeiger (2001).
** mixture of longfin (23kg) and shortfin (30kg) eels from the Snowy River.
*** shortfin eels only from the Derwent River.

FRDC Report 2000/264
Eel Industry Strategy and Business Analysis
16
Intensive/Semi-Intensive Aquaculture ProductionProduction from more intensive eel aquaculture systems in Australia is still relatively minor in comparisonto the wild sector. A summary of published eel aquaculture production data for the three year period1997/98-1999/00 is provided in Table 6 (after O'Sullivan and Dobson (2001)). It should be noted that thesedata also include an estimate of shortfin production from stock enhanced waters in Victoria, as well asproduction from more intensive pond and tank-based farming systems for both species in Victoria and otherstates.
The reason for the apparent discrepancy between estimates for total Victorian eel production during 1999/00,as summarised in Table 4 and Table 6, is unclear. It is however suggested that the figure quoted byO'Sullivan and Dobson (2001) significantly overestimates the shortfin eel production for the 1999/00 period.More specifically this estimate does not adequately reflect the actual loss of production resulting from thelong-running drought which has prevailed throughout much of western Victoria (where the majority of theshortfin fishery is centred) of recent times (last 3-5 years). Put simply, many of the Victorian WesternDistrict ‘culture’ waters have dried up, and coastal streams subjected to low ambient flows which are notconducive to eel fishing. Projected estimates of shortfin eel production from Victoria have therefore not beenrealised, with the total annual harvest declining from > 200 tonne pa to <100 tonne pa over this period. Withimproved rainfall conditions during 2000/01, eel production from stock enhanced ‘culture’ waters in Victoriareportedly increased to 67 tonnes worth approximately $737,000 for this period (Anon., 2001) but is still wellshort of full production capacity (Table 3).
Table 6 Annual Australian cultured eel production (longfin and shortfin combined) for the period1997/98-1999/00; from O'Sullivan and Dobson (2001).
States Production97/98 98/99 99/00Tonnes $ Tonnes $ Tonnes $,000
Qld - - 3.4 36.8 21.5 235.6NSW 0.6 6 2.3 19.3 2.4 17.5Vic 218 2334 225 2700 180 2250
Total 218.6 2340 230.7 2756.1 203.9 2503.1
If the data for anything other than intensive/semi-intensive aquaculture production is removed from thesummary, the total ‘aquaculture’ output of eels (for both species) across Australia is probably less than 25-30tonnes per annum, worth less than $0.5 million. This component is from a number of purpose- built eelfarms, or fish farms incorporating purpose-built eel farming facilities in NSW, Queensland, Victoria andTasmania, however collectively these amount to a relatively minor component of overall industry capacity ata national level at the present time.
Eel aquaculture production in Queensland totalled approximately 43 tonnes worth more than $460,000 in2000/01. This production was from only four farms totalling 4.9 ha of growout pond surface area and about135 m3 of growout tank capacity (Table 7). This represents an approximate doubling of Queenslandproduction in both tonnage and value from 1999/00, with projected production estimates for 2001/02 being inthe order of 84 tonnes. Farm gate prices for cultured eels in Queensland have consistently ranged between $10-11/kg for mostly live fish (98%), the majority of which is exported (78%), with the balance being sold intoQueensland and other Australian states (Lobegeiger, 2002).

FRDC Report 2000/264
Eel Industry Strategy and Business Analysis
17
Table 7 Eel farm production in Queensland (1997/98-2000/01); from Lobegeiger (2001, 2002); na, notavailable.
1997/98 1998/99 1999/00 2000/01Ponds - Total Area (ha) 0 1.9 2.1 4.9
- Average Area (m2) 0 3 200 2300 1500Tanks - Total Volume (m3) 140.6 26.5 219 133
- Average Volume (litres) 4000 6400 5000 4400Stocking - Elvers (kg) 6.0 3.0 0 0
- Glass eels* (kg) 67.4 28.3 35.7 60Total Production* - (kg) na 3395 21494 43540
- ($) na 36,780 235,628 462,145Average Price ($/kg) na $10.83 $10.96 $10.61
* mixed longfin and shortfin eels, but predominantly longfin.
Prior to 1999/00, a single, intensive, tank-based farming operation in Victoria, which utilised a European-style RAS, was also producing similar quantities of marketable shortfin eels. This operation has nowdiversified to include other finfish species (Murray cod and jade perch). The same company has alsoestablished a new RAS at another location in Gippsland. This system is likely to concentrate on longfin eelsultimately for grow-out to market size, as well as shortfin and longfin eels for on-selling at the post-nurserystage as seedstock for stock enhanced wild fishery purposes (primarily in Victoria) and possibly for othersemi/intensive eel farms in Victoria and other states.
Recent Eel Aquaculture and Glass Eel Fishery R&DAs previously stated, the most significant recent eel aquaculture and glass eel fishery R&D has been fundedby FRDC in partnership with state agencies and industry, the results of which have been reported by(Gooley et al., 1999; Gooley and Ingram, 2002). The key findings of these two projects are effectivelysummarised as follows:
1. Glass eel resources of each species have been identified across their respective ranges in easternAustralia, with sufficient quantities being available in selected waters to support limited commercialharvesting and aquaculture industry trials.
2. Appropriate glass eel fishing techniques have been evaluated and described, glass eel invasion cues andassociated environmental criteria have been elucidated, and glass eel resource management implicationsprescribed to facilitate cost-effectiveness and sustainability of such harvesting.
3. The potential for increased levels of glass eel harvesting will be subject to the provisions of ESD-basedmanagement plans and wild-fishery industry sector investment in identifying additional glass eelresources. The latter in turn will be dependent on market demand and the degree to which the wildfishery (stock enhanced component) and the aquaculture industry sectors respond to the productionopportunities presented by glass eel utilisation.
4. The aquaculture utility of glass eels for both species has been evaluated and appropriate culturetechniques either adapted and/or developed to the point where commercial scale industry productionhas been achieved under both intensive and semi-intensive conditions.
5. Increased productivity and cost-effectiveness in the Australian eel aquaculture sector will be achievedthrough enhanced growth and survival rates of glass eels and later eel development stages, and throughoverall employment of Best Practice culture systems. Specifically, this is likely to be achieved throughimproved feeding efficiencies, general husbandry and production facility design and operation, with anemphasis on producing more marketable, larger eels at a size of ≥ 1kg.

FRDC Report 2000/264
Eel Industry Strategy and Business Analysis
18
These findings have been variously used by fisheries managers within respective state agencies and byindustry at different levels. On the basis that this R&D was originally undertaken for public good as a resultof market failure prevailing at the time, the findings of these two projects have been made freely available toall interested stakeholders by various means including workshops, publications and direct consultation withend users.
It is also noted that due to the dynamic and rapidly developing nature of the industry in Australia, thespecific outcomes of these projects are difficult to evaluate in isolation from applied “R&D” undertakenconcurrently by some individual industry proponents for private benefit (but which is often shared withselected industry colleagues on a ‘quid pro quo’ basis), and also from ongoing, day to day natural resourcemanagement policy and planning by state fisheries agencies (in which technical advice is routinely providedby R&D service providers to managers in real time).
Furthermore, existing R&D priorities for eel aquaculture and glass eel fishery sectors in Australia (seeAppendix) have only been broadly identified to date, without specific performance indicators upon whichprogress can be quantified. Accordingly, this report makes no attempt to specifically evaluate FRDCfunded R&D outcomes to date against these priorities in any quantitative way. The report does howeverrecognise and qualitatively assess the impacts of R&D findings to date by factoring in various technicalassumptions gleaned from recent R&D into the simulative industry development model. Furthermore,much of the recommendations included within the proposed Australian Eel Aquaculture and Glass EelFishery Development – Strategic Direction, Needs and Vision (see Section 5) are predicated on the basis ofkey R&D outcomes from these projects, and specific comments are provided about future priorities for therelevant components of the existing Draft Australian Eel Fishery and Aquaculture R&D Plan.Australian Eel Aquaculture Industry - Scope for Increased Productivity.
Australian Eel Aquaculture Industry -Scope for Increased Productivity.BackgroundIdeally, the development of a long term vision for any one Australian aquaculture industry sector would bebased on the clearly articulated views of all key stakeholders, at both the producer and resourcemanagement level. These views would reflect the opportunity presented by the underpinning, strong andenduring consumer demand for the product. Development of the vision would be facilitated by a robust,fully integrated industry structure, with the support of readily accessible and cost-effective Best Practice,continuously improved technology supported by research and development, extension capacity andassociated databases to ensure effective and efficient implementation. Unfortunately, in the case of the newand developing Australian eel aquaculture sector, various aspects of these requirements are fundamentallylacking at the present time.
Accordingly, in order to progress the establishment of an industry vision designed to facilitate appropriatelevels of investment, expansion, and long term sustainability, an interactive industry development model isproposed to enable some predictive capability in the absence of real time operations and actual data. In thepresent study, a simulative model has been constructed which has two main components around which aseries of assumed inputs and projected outputs can be determined. These assumptions and projectedoutputs are then used as the basis for proposing various investment, production and development scenariosat both farm specific and aquaculture sectoral/sub-sectoral level. Ultimately of course the accuracy andreliability of the simulative models need to be validated ‘on the ground’ for them to be any practical use inthe long term. However in the short to medium term, as the industry establishes itself during the earlyformative stages of development at a national level, such models are likely to be extremely useful inproviding indicative guidelines and performance indicators, benchmarks and/or targets.
The first component of the industry development model is the farm specific financial analysis of differentculture systems, including intensive, semi-intensive and extensive culture systems, all of which are practised
FRDC Report 2000/264
Eel Industry Strategy and Business Analysis
19
already in Australia to varying degrees. This provides the basis upon which the second component of themodel is constructed to simulate industry-wide outputs in a way that realistic scenarios can be generated tospeculate on what the industry’s potential could be in the future under certain pre-determined conditions.
In this study, the model and its main components are designed to incorporate a suite of Best Practicescenarios which are progressively implemented over time under a ‘continuous improvement’ regimeinherent in a proposed industry-wide strategic development plan. The model employs three hypotheticalBest Practice scenarios to be implemented over a twenty year time frame from the present, viz.:
• Best Practice 1 (BP1) – present industry status to five years from now,
• Best Practice 2 (BP2) – industry status five to ten years from now, and
• Best Practice 3 (BP3) – industry status 10-20 years from now.
Financial Analysis of Specific Culture SystemsIntroductionFor the proposed industry vision to be at all realistic it is imperative that the range of potential culturesystems available to Australian industry have some inherent financial viability to ensure reasonableprospects of long term profitability. However, at the present time there are no actual, documented casestudies, and limited data only is available from industry upon which any relevant financial analysis can bebased. Accordingly, for the purposes of this study, cost-benefit analyses for each of a range of hypotheticalintensive, semi-intensive and extensive culture systems have been undertaken in order to elucidate therelative (if not absolute) profitability of various production scenarios.
These analyses have been undertaken also to incorporate the effect of differing Best Practice scenarios forboth intensive and semi-intensive culture systems under an assumed ‘continuous improvement’ regime,again to highlight the benefits at the farm specific level and also ultimately at the industry wide/nationallevel. The latter outcome is thereby intended to provide some additional motive for the industry to proceedover the next 10-20 years, under attendant strategic guidelines, on a more nationally coordinated basis. Suchanalyses also provide relevant production benchmarks and associated performance indicators to be used astentative industry targets under a combined Best Practice/Continuous Improvement-based strategicdevelopment regime.
In this study, no Best Practice scenarios are imposed on the extensive culture system analysis, other than thatimposed by the varying level of seedstock inputs resulting from improved Best Practice standards within theintensive culture systems supplying the seedstock. Extensive culture systems by definition have limitedmanagement controls, thereby inherently limiting the ability of the operator to effect productivity gainsthrough increased efficiency. Much of the extensive culture of eels in Victoria is subject to ambientenvironmental conditions, with major profitability criteria being about natural productivity and availabilityof suitable water, and seedstock and market price. Furthermore, extensive culture is typically undertaken asan adjunct to an existing wild fishery enterprise and the stand-alone costs and profitability are thereforedifficult to separate. Accordingly, no attempt has been made in this study to evaluate profitability of astand-alone extensive eel culture operation, rather the analysis is limited to determining sensitivity ofrelative profitability around the latter two parameters (i.e. seedstock and market price) within a fullyintegrated wild and cultured eel fishery business.
MethodsThe method of financial analysis has been adapted and modified from that which has been previouslydescribed by Gooley et al. (2002). It basically involves a simple MS Excel spreadsheet-based financial modelof hypothetical culture systems, which analyses key financial inputs (including capital and operating), andoutputs (including marketable stock, stock on hand and depreciated capital), and estimates standardfinancial indicators over a ten year timeframe viz. Net Present Value (NPV), Internal Rate of Return (IRR)and Profit Margin (PM) (see Gooley et al. (2002) for definitions). Risk, in the form of periodic andcatastrophic stock loss (or market access loss for whatever reason), is built into the model where appropriateat different levels linked to the Best Practice culture system scenario under consideration.
FRDC Report 2000/264
Eel Industry Strategy and Business Analysis
20
Given that the systems being analysed are largely hypothetical, the analysis relies on a suite of assumptionsfor inputs and outputs, some of which are then varied within defined ranges to determine sensitivity offinancial outcomes. The proposed Best Practice scenarios are treated in this fashion also, with increasingBest Practice assumed to impose increased production efficiencies (eg. through improved food conversion,fish survival and stocking density) and reduced risk (eg. reduced scale/frequency of catastrophic stock lossand/or loss of market access etc). For the purposes of this study, growth rates are fixed and identical for bothspecies, based on a combination of industry and research experience, and designed to achieve specifiedmarketable product size after fixed/pre-determined production periods (as described previously by Gooleyet al. (2002).
Financial model - systems, scenarios and assumptionsThe financial model has been developed around three culture systems, viz. intensive, semi-intensive andextensive; the latter as an adjunct to a wild fishery enterprise. Each model assumes a 50 kg input of glass eelseedstock initially. Where the seedstock input is based on later development stages (eg. 10g juveniles forsemi-intensive and extensive systems), then the actual quantity of seedstock is based on that which can beinitially produced intensively under the relevant Best Practice scenario from 50 kg of glass eels. This enablessome degree of consistency for comparative purposes between scenarios and the related industrydevelopment strategy which itself is based on a simulative model projecting differing levels of industry-wide production simultaneously across all culture systems.
The fixed growth rate stages used in the model for intensive and semi-intensive culture systems are broadlyaligned to production stages to achieve pre-determined market sizes. The model also therefore assumes thatthe relevant culture systems are operating at optimal temperatures to achieve the fixed growth rates forintensive and semi-intensive systems (around 25o C) and average ambient temperatures for extensive culturewithin a temperate climate at southerly Australian latitudes (eg. western Victoria). In summary, the keyproduction stages, including fixed growth rates and total production time (from glass eel stage), forintensive/semi-intensive culture systems are (see also Table 8 and Table 9):
• 0.17g (glass eel) – 1g stocker: 3 months (total production time = 3 months).• 1g stocker – 10g stocker : 3 months (total production time = 6 months).• 1g stocker – 300g saleable eel: 12 months (total production time = 15 months).• 1g stocker – 1 kg saleable eel: 21 months (total production time = 24 months).• 10g stocker – 300g saleable eel: 9 months (total production time = 15 months.• 10g stocker – 1 kg saleable eel: 18 months (total production time = 24 months).
Intensive and semi-intensive systems are assumed to sell all product live into the market place at either 300gafter 15 months (from glass eel stage) or 1kg (after 24 months from glass eel stage). For extensive culturesystems the model assumes that intensively reared (from glass eel stage) 10g stocker eels achieve a finalmean size of 1 kg immediately prior to harvest after a total of five years from initial stocking, after which allharvested eels are sold live into the market place.
A summary of the scenarios, key assumptions and associated criteria/context for intensive and semi-intensive culture systems analysed by the financial model under different Best Practice scenarios is providedin Table 8 and Table 9. These scenarios are based on projected time frames linked to the proposed threetiered Best Practice/Continuous Improvement regime, as previously described.
Each scenario has specified routine operational (stock) loss rates at different production stages, and 5 yearperiodic risk in the form of catastrophic loss; the assumption being that with ‘continuous improvement’, theindustry by and large will progress through the specified Best Practice scenarios over the proposedtimeframe to the point that all industry will be performing at least at Best Practice 3 (maximum reduction ofroutine and catastrophic stock loss/risk) after 10-20 years. The financial model therefore projects theestimated increase in profitability that this improvement will provide on a farm specific level.
The routine losses referred to occur annually and include ‘conservation stockings’ as part of likely glass eelcollection permit conditions, disease and cannibalism related losses, and ‘leakage’ of undersized orotherwise unmarketable eels (runts) due to genetic and/or sex related growth depensation. The ‘risk’ relatedcatastrophic losses are nominally imposed every five years and partly compensated for by insurance

FRDC Report 2000/264
Eel Industry Strategy and Business Analysis
21
coverage (which also incurs an annual operating cost). During ‘risk’ years, all models have relevantoperating costs, including salaries, transport and packaging, feed, water and energy proportionatelyreduced, consistent with the scale of the imposed stock loss, to partly offset production costs.
All losses are considered to be able to be reduced over time with ‘continuous improvement’ of technologyand husbandry, thereby providing the basis for the improved Best Practice scenarios over time. All suchimprovements and the rate at which they are applied in industry are completely nominal at this stage, andintended to be used as an indicative guide only to assist strategic development of the industry.
All Best Practice scenarios for intensive culture systems assume a fixed food conversion ratio (FCR) of 2.5:1for glass eels and 1.5:1 for subsequent growout. These rates are conservative, already relatively efficient, andconsistent with industry standards in Australia and Europe. Therefore these parameters are fixed under allBest Practice scenarios. For semi-intensive systems, given the limited industry development in Australiacompared with similar systems in Asia, FCRs are deemed to be increasing progressively (from 2:1 to 1.5:1)with improved Best Practice under the various semi-intensive system production scenarios (see Table 9).
Likewise, stocking densities (maximum at final stages immediately prior to harvest) for intensive systemproduction are fixed in the model at 7.5kg/m3 for glass eels and 200kg/m3 for 300g and 1kg growout. Thesedensities are deemed to be existing, already efficient performance standards which are unlikely to changesignificantly in the future. On the other hand, stocking density for semi-intensive production is deemed toincrease progressively (from 5 to 15 kg/m3) with improved Best Practice under the various semi-intensiveproduction scenarios during the growout phase (see Table 9).
The cost-benefit model makes a number of assumptions about all relevant capital and operating costs andassociated revenues. For all systems these are based on nominal and/or median values as determined byreasonable market value, industry experience and/or expert opinion. Some key system design, productionand market parameters are varied in the model to determine profitability sensitivity against suchparameters. Only one parameter is varied per analysis, during which the other key parameters are fixed at anominal or median value as specified for Best Practice 1 scenario. Likewise, where Best Practice scenariosare analysed, all costs and revenues are fixed at nominal or median values for these key parameters. Allother remaining production/cost parameters are fixed throughout the analysis for each of the scenarios inquestion. All prices are quoted in AUD$.
Table 8 Best Practice/Risk Scenarios for Intensive Culture System (based on initial 0.17g glass eelseedstock); na, not applicable.
Best PracticeScenario
Time Frame Market size Production stage Production loss/’leakage’as % of standing stock
Risk as % loss ofmarketable stockprior to sale/5 yrs
BP1 0-5 years na 0.17g-1g 25* nana 1g-10g 10 na300g 10g-300g 10 501 kg 300g-1kg 10 75
BP2 5-10 years na 0.17g-1g 20* nana 1g-10g 5 na300g 10g-300g 5 251 kg 300g-1kg 5 50
BP3 10-20 years na 0.17g-1g 15* nana 1g-10g 2.5 Na300g 10g-300g 2.5 101 kg 300g-1kg 2.5 25
* includes 5% ‘conservation’ stocking back to the wild of initial glass eel harvest; in form of elvers.

FRDC Report 2000/264
Eel Industry Strategy and Business Analysis
22
Table 9 Best Practice/Risk Scenarios for Semi-Intensive Culture System (based on initial 10g seedstock).
Best PracticeScenario
Time Frame Market size Production stage Production loss/’leakage’as % of standing stock
Risk as % loss ofmarketable stockprior to sale/5 yrs
BP1 0-5 years 300g 10g-300g 20 50(FCR@2:1) 1 kg 300g-1kg 10 75(SD@5kg/m3)BP2 5-10 years 300g 10g-300g 10 25([email protected]:1) 1 kg 300g-1kg 5 50(SD@10kg/m3)BP3 10-20 years 300g 10g-300g 5 10([email protected]:1) 1 kg 300g-1kg 2.5 25(SD@15kg/m3)
Production Returns/Revenue• Intensive and semi-intensive systems
Both systems assume that in practice glass eels will be available each year and that seasonality restrictions onglass eel numbers will not affect production and therefore projected financial returns; semi-intensive systemalso assumes that intensively reared 10g stockers (from glass eels) are available in the market place.
Annual production is based on a 50kg annual glass eel intake provided directly to the farmer for intensivesystems and as the equivalent quantity of 10g elvers for semi-intensive systems.
All fish harvested and sold live to Asian markets, at a delivered (CIF) price to the farmer (inclusive ofpackaging and freight costs) of $12.5, $15 and $17.5/kg for 300g fish (after 15 months from glass eels; 12months from 10g stocker) and $17.5, $20 and $22.5/kg for 1 kg fish (after 24 months from glass eels; 21months from 10g stocker)
Revenue assumed to be generated within 300g production system within second year of operation and eachyear thereafter (assuming 15 month total production period from glass eel), and within two years for 1 kgproduction system and each year thereafter (assuming 24 months total production period from glass eel).
The quantity of marketable biomass/stock on hand at end of the specified production period for 300g and 1kg fish under each culture system determined by the combination of fixed growth rates, and relevantproduction parameters as specified under each Best Practice scenario, including stock loss rates and risk, andfor semi-intensive systems also FCRs and stocking density (see Table 9); stocking densities fixed for glass eelproduction (to 1g stocker) @ 7.5kg/m3, and for 1g to 300g/1kg growout stage @ 200kg/m3 for intensive systems.
Stock on hand after 10 years priced at minimum market value for 300g fish; insurance refund during riskyears (5th and 10th) based on 25% value of lost stock at specified market price.
• Extensive systems
Annual production is based on the equivalent quantity of 10g intensively reared stockers from a 50kg annualglass eel intake to industry (actual quantity varying with specified Best Practice conditions).
Assumed that intensively reared 10g stockers (from glass eels) are available in the market place (based onminimum 50kg glass eel intake to the industry).
All fish harvested and sold live to Asian markets, at a delivered price to the farmer (inclusive of packagingand freight) of $17.5, $20 and $22.5/kg for 1 kg fish (after 5 years from glass eels), with $20/kg being thenominal median value for all other scenarios.
Revenue assumed to be generated within five years for 1 kg production system and each year thereafter(assuming 5 years total production period from 10g stocker).

FRDC Report 2000/264
Eel Industry Strategy and Business Analysis
23
The quantity of marketable biomass/stock on hand at end of the specified production period determined bythe combination of fixed growth rates and loss rates (75%) over the five year production period.
Capital costs:• Intensive system
Recirculating Aquaculture System (RAS)(not including culture tanks) at nominal $750k for 300g productionsystem and $2.5 million for 1 kg production system; culture tanks @ nominal $1.5k/1.6m3 glass eel weaningtanks and $5k/16m3 growout tanks (actual number of dependent on whether 300g or 1 kg productionscenario and proportional to need).
5ha of industrial land @ nominal $10k/ha.
Miscellaneous infrastructure including building housing culture system, office, stores, maintenance andpost-harvest areas, miscellaneous plant and equipment (not RAS) etc @ nominal $150k for 300g productionsystem and $300k for 1 kg production system.
• Semi-intensive system
Pond costs @ nominal $15k/1000m3 capacity with actual total pond capacity dependent on whether 300g or 1kg production scenario and proportional to need.
10ha of irrigated farm land @ nominal $15k/ha
Miscellaneous infrastructure including office, stores, maintenance and post-harvest areas, miscellaneousplant and equipment etc @ nominal $150k for 300g and 1 kg production systems; miscellaneous plant andequipment, including bird netting and holding tanks, at nominal costs of $15k and $25k respectively for 300gand 1kg production; aerator costs at nominal $750 each and 2 aerators/ha of pond surface area.
• Extensive system
Nominal contribution of 25% to overall cost of commercial eel fishing licence (@ nominal cost of $200k),business head-office/operational base (@ nominal land cost of $50k), and miscellaneous infrastructure, plantand equipment (@ nominal $150k).
Operating Costs• Intensive system
All initial capital set-up costs and first year operating costs are borrowed at a commercial interest rate of 8%per annum (assuming the borrower has sufficient collateral); annual loan repayments are based on principleand interest, with the loan paid off after ten years.
Seedstock is based on annual 50kg glass eel intake directly to the grow-out farm @ varying costs of $100,$200 and $300/kg, with $200/kg being the fixed median price for analysis of all other scenarios.
Labour costs based on 2.5 x ‘full-time equivalent persons’ (FTEs) for 300g production scenario whichincludes a full time manager and 1.5 FTE assistants, and 5 x FTEs for 1kg production scenario, whichincludes 2.5 extra FTE assistants; one FTE value fixed at nominal $45k per annum.
Transport and packaging combined based on nominal $4/kg cost (incl. freight @ $3.5/kg and packaging @$0.5/kg) to the farmer to land live fish in Asian export markets.
Depreciation is treated as an annual fixed cost. It is calculated according to the straight line method whichuses the initial value of the goods being `depreciated (capital assets) (iv), the life of the asset (L) and theresidual value (rv) expressed as a %. Annual depreciation is then equal to (iv-(iv*rv))/L.
Feed costs based on final production (tonnage) estimates @ nominal FCR of 2.5:1 for glass eels (to 1gstockers) and 1.5:1 for growout of 1 g seedstock to market size; price of feed varying between $1.25, $1.50and $1.75/kg for post 1g growout stage, with $1.5/kg being the nominal median feed cost for all otherscenarios.
FRDC Report 2000/264
Eel Industry Strategy and Business Analysis
24
Water based on 10% daily exchange @ $650/ML for domestic supply.
Energy primarily electricity/other for pumps, aerators, heating, oxygen generation etc @ nominal $0.60/kg offinal production biomass.
Other operating based on nominal estimates for administration, maintenance, rates, insurance etc @ $0.70/kgof final production biomass.
• Semi-intensive system
All capital costs and first year operating costs are borrowed at commercial rate of interest @ nominal 8% perannum for capital and 10% for year 1 operating (assume that the borrower has sufficient collateral); annualloan repayments are based on principle and interest, with the loan paid off after ten years.
Seedstock is based on annual 50kg glass eel “allocation”, weaned and grown out to 10g stockers by intensivefarmers at mortality/loss rates as determined under varying Best Practice specifications (see Table 9) and on-sold to the semi-intensive growout farmers @ nominal price varying between $25, $50 and $75/kg; with$25/kg being the fixed price for all other scenarios.
Labour costs based on 2.5 x FTEs for 300g production scenario which includes a full time manager and 1.5FTE assistants, and 5 x FTEs for 1kg production scenario, which includes 2.5 extra FTE assistants; one FTEvalue fixed at nominal $45k per annum.
Transport and packaging combined based on nominal $4/kg cost (incl. freight @ $3.5/kg and packaging @$0.5/kg) to the farmer to land live fish in Asian export markets.
Depreciation is treated as an annual fixed cost. It is calculated according to the straight line method whichuses the initial value of the goods being depreciated (capital assets) (iv), the life of the asset (L) and theresidual value (rv) expressed as a %. Annual depreciation is then equal to (iv-(iv*rv))/L.
Feed costs based on final production (tonnage) estimates @ nominal FCR varying between 1.5:1, 1.75:1 and2:1 under differing Best practice scenarios (see Table 9), with FCR of 2:1 being fixed for all other scenarios;price of feed varying between $1.25, $1.50 and $1.75/kg for post 1g growout stage, with $1.5/kg being thenominal median feed cost for all other scenarios.
Water based on 10% weekly exchange @ $200/ML for commercial irrigation supply.
Energy primarily electricity/other for pumps and aerators @ nominal $0.20/kg of final biomass.
Other operating based on nominal estimates for administration, maintenance, rates, insurance etc @ $0.70/kgof final production.
• Extensive system
All seedstock purchased as intensively reared 10g stockers at nominal cost varying between $25, $50 and$75/kg, with $25/kg being the nominal fixed price of stockers for all other scenarios.
Labour costs fixed at one FTE @ nominal $40k/yr/FTE (in practice two x 0.5 FTEs) to tend to allocatedstockers and associated waters and requisite fishing activity; not costed in until the fifth year of productionafter initial stocking.
Depreciation is treated as an annual fixed cost. It is calculated according to the straight line method whichuses the initial value of the goods being depreciated (capital assets) (iv), the life of the asset (L) and theresidual value (rv) expressed as a %. Annual depreciation is then equal to (iv-(iv*rv))/L.
Transport and packaging combined based on nominal $4/kg cost (incl. freight @ $3.5/kg and packaging @$0.5/kg) to the farmer to land live fish in Asian export markets.
As previously mentioned, the present study assumes that semi-intensive and extensive culture systems relycompletely on intensively reared (from glass eel) 10g stockers as the sole source of seedstock for production.

FRDC Report 2000/264
Eel Industry Strategy and Business Analysis
25
A further model is therefore proposed of a hypothetical production system to estimate likely profitability ofsuch a nursery stage under commercial conditions. Indeed it is conceivable that under a national, verticallyintegrated industry scenario, such an intensive juvenile/seedstock eel nursery operation would be viable as astand-alone enterprise servicing the needs of other growers using intensive, semi-intensive and extensivesystems to produce finished product (i.e. minimum 300g to 1kg final market size).
The model of the proposed intensive ‘nursery’ stage culture system is based on the following assumptionsand specifications:
Intensive ‘nursery’ system (glass eel to 10g stocker)• Returns/Revenue
Production returns revenue based on minimum annual glass eel intake of 100kg, 250kg and 500kg underthree different intensive system Best Practice scenarios specifying routine operational losses and risk (seeTable 8), with 500kg being the nominal intake fixed for all other scenarios.
Revenue based on sale of final biomass after 6 month production stage (allowing for two x 6 monthlyproduction cycles per annum eg. one cycle for shortfin and one cycle for longfin), from glass eel to 10gstockers which are sold to other growers (intensive, semi-intensive and/or extensive) at prices rangingbetween $25/kg, $50/kg and $75/kg, with $25/kg being the sale price for all other scenarios.
• Capital costs
As for intensive systems producing 300g, other than a smaller RAS and culture building required at a cost of$250k and $50k respectively, and miscellaneous infrastructure costs reduced to $50k.
• Operating costs
Purchase price of glass eels ranging between $100/kg, $200/kg and $300/kg, with $100/kg being the nominalpurchase price fixed for all other scenarios.
All other costs as for intensive systems producing 300g fish, but proportionately reduced consistent with thesmaller size and maximum standing crop of the final biomass (of 10g stockers).
Results of Financial AnalysesThe financial model outputs are summarised for each system under the range of tested Best Practicescenarios and associated key production parameters in Table 10-15. A summary of the total productionoutput of marketable biomass for each system and Best Practice scenario is provided in Table 16.
Profitability of Intensive Culture SystemsProfitability across all indicators increases substantially with improved Best Practice for 300g productionsystems, but under Best Practice 1 scenarios, such systems are either not profitable or marginal at best; thelatter being only at the higher market price of $17.50/kg. Indeed reduced feed prices and glass eel pricesover the range tested have little impact on overall profitability compared with improved Best Practice. Morespecifically, the model suggests that intensive production of 300g eels is only profitable under Best Practicescenarios 2 and 3, in which increased survival rates and lower risk of catastrophic loss result in markedlyincreased quantities of marketable biomass per unit of cost. Realistically, it is unlikely that an intensive, 300gproduction enterprise could be commercially viable for sufficient time (possibly up to five years) beforeachieving the type of production efficiencies specified under Best Practice 2 and 3 scenarios.
Conversely, intensive production of 1kg eels appears to be profitable across the full tested range of BestPractice scenarios and various key production parameters, despite the increased levels of up front capitalcosts, and higher risks imposed in the model. This suggests that any investment in production of 1kg eelsunder intensive production systems in Australia at the present time is likely to have a higher probability ofachieving profitability (according to conventional financial standards), assuming that specific productionstandards, efficiencies and associated costs can be appropriately managed and subject to specified marketprices being maintained.

FRDC Report 2000/264
Eel Industry Strategy and Business Analysis
26
The profitability of intensive, 10g stocker production systems is less clear, but the model suggests that aminimum glass eel intake of 500kg per annum would be required for such a system to be financially viable.It is also apparent that increasing the cost of glass eels from $100/kg over the tested range in the modelrenders the operation largely unprofitable at the 500kg annual intake level, and that increasing the sale pricefrom $25/kg at this intake level over the tested range substantially increases profitability of the enterprise.
Having said that, it is suggested from the model that stand-alone intensive production of 10g stockers can beprofitable at a glass eel price of (maximum) $100/kg and if all other specified parameters can be met. Inpractice, it is likely that intensive production of 10g stockers for on-selling to other producers would beundertaken as an adjunct operation to other eel/finfish growout enterprises using RAS, thus making theproduction an even more viable option for producers. Accordingly, the key outcome of this part of theanalysis is that it is reasonable to assume that the commercial availability of 10g stockers at a realistic/cost-effective price to industry is a viable option for investors to consider in the short to medium term shouldmarket demand dictate the need.
Based on industry experience, there is clearly a need for a critical mass of glass eels for a purpose builtculture system to operate efficiently. The model has determined this on the basis that an operator needs toensure a reasonable return on investment of purpose built capital plant and equipment, of which a minimumoutlay is required for any quantity of glass eels. Effectively, the more that are put through, the greater arethe cost savings on the use of this infrastructure on a unit cost of production basis. However, it is alsoknown from experience that acclimating, weaning and rearing glass eels at this early stage (up to 10g size) isfar more effective when large quantities are reared simultaneously due to various density-dependentbehavioural effects which improve biological performance of the eels themselves, and physical performanceof the culture system.
Profitability of Semi-intensive Culture SystemsNot unlike the situation for intensive culture systems, the model suggests that the profitability of semi-intensive, pond-based production of 300g eels is likely to be marginal at best at anything other thanmaximum market prices and/or under substantially improved Best Practice operating conditions.Furthermore, profitability is likely to be deleteriously impacted by seedstock prices (for 10g stockers) atanything greater than $25/kg and from any substantial increase in feed price. The opportunity to increaseprofitability with improved Best Practice is a consequence of increased production efficiencies such as lowerFCRs, higher stocking rates and reduced operational losses and risk. Such improvement arguably can bemore readily obtained for semi-intensive production in Australia, at least initially, due to the relativelylimited stage of industry development presently.
Again, as for the intensive production scenario, semi-intensive production of 1kg eels is likely to beprofitable under all of the tested scenarios and production/cost parameters, with profitability predictablyincreasing dramatically with improved Best Practice, increased market price, and reduced feed price.Furthermore, the profitability of such production appears to be able to adequately absorb production costincreases, due to feed and seedstock price increases and market price falls over the tested ranges, and stillremain profitable. This is despite the greater up front capital cost of infrastructure, plant and equipment,and higher levels of attendant risk of catastrophic stock losses over the longer production term.
SummaryEffectively the production of the larger 1kg eels provides disproportionate financial advantage to theoperator by providing market access to a premium priced product (i.e. 1kg fish compared with 300g fish),together with a larger quantity of marketable biomass for the same glass eel input costs. Accordingly, thestudy suggests that growing larger quantities of bigger fish (at least up to 1kg) by either method can beprofitable if certain realistic standards of production efficiency can be achieved. Furthermore, profitability islikely to be far greater than for producing smaller fish up to 300g in size.
To this end it is also suggested that the specified production and cost parameters utilised in the intensiveand semi-intensive culture system models in this study should provide a useful, indicative guide tooperators and investors to achieving profitability in actual culture systems on the ground. Critical to thisdevelopment however is the need to secure a reliable and cost-effective supply of juvenile seedstock (inaddition to glass eels), which the present study suggests could take the form of intensively-produced 10g

FRDC Report 2000/264
Eel Industry Strategy and Business Analysis
27
stockers. This could be profitably achieved as a stand-alone operation under certain conditions and/or morepossibly as an adjunct to an existing growout business producing larger fish for retail consumers. It is alsoessential that eel farmers, using whatever system, continue to refine and develop Best Practice standardsover time to achieve operational efficiencies in production and associated increased profitability.
The profitability of extensive production is more difficult to elucidate using the methodology in this study,due to the usual linkage to the related wild fishery business. Accordingly no attempt is made in this studyto determine the profitability of stand-alone extensive culture. Nonetheless, it is apparent from the modelthat in most cases extensive culture will provide a profitable adjunct to the wild fishery business throughproduction of larger (and therefore more marketable) 1kg fish, with relatively minimal capital andoperational cost inputs. Risks have not been included in this analysis due to the likely error associated withmaking assumptions about key production parameters. Little accurate information is available on theproductivity of extensive culture systems in Australia, other than that provided by Skehan and De Silva(1998). Indeed this work determined quite variable production estimates for stock enhanced waters inVictoria in absolute terms.
Predictably, the analysis in the present study does show that profitability is likely to be affected by changingseedstock prices (for 10g stockers) and market prices, but that under most conditions, where all otherproduction parameters meet reasonable standards of operation, the extensive culture of eels under ambientconditions is likely to make a profitable contribution to an established wild eel fishery-based enterprise.
Table 10 Summary of financial model key inputs and profitability indicators for intensive production of300g eels under all tested Best Practice scenarios (NPV, Net Present Value; IRR, Internal Rate of Return;PM, Profit Margin).
Best PracticeScenario
Market price($/kg)
Glass eelprice ($/kg)
Feed price($/kg)
NPV ($) IRR (%) PM (%)
BP1 15.00 200 1.50 -96,077 8 0.2BP2 15.00 200 1.50 238,317 13 7.6BP3 15.00 200 1.50 455,066 16 11.6
BP1 12.50 200 1.50 -552,591 1 -19.8BP1 15.00 200 1.50 -96,077 8 0.2BP1 17.50 200 1.50 360,437 15 14.4
BP1 15.00 100 1.50 -72,946 9 0.9BP1 15.00 200 1.50 -96,077 8 0.2BP1 15.00 300 1.50 -119,209 8 -0.6
BP1 15.00 200 1.25 -17,242 10 2.8BP1 15.00 200 1.50 -96,077 8 0.2BP1 15.00 200 1.75 -174,912 7 -2.5

FRDC Report 2000/264
Eel Industry Strategy and Business Analysis
28
Table 11 Summary of financial model key inputs and profitability indicators for intensive production of1kg eels under all tested Best Practice scenarios (NPV, Net Present Value; IRR, Internal Rate of Return;PM, Profit Margin).
Best PracticeScenario
Market price($/kg)
Glass eelprice ($/kg)
Feed price($/kg)
NPV ($) IRR (%) PM (%)
BP1 20.00 200 1.50 2,330,828 21.5 19.7BP2 20.00 200 1.50 4,383,125 29 24.5BP3 20.00 200 1.50 6,062,928 33.9 26.7
BP1 17.50 200 1.50 1,051,051 15.5 12.3BP1 20.00 200 1.50 2,330,828 21.5 19.7BP1 22.50 200 1.50 3,610,605 27 25.4
BP1 20.00 100 1.50 2,353,959 21.6 19.8BP1 20.00 200 1.50 2,330,828 21.5 19.7BP1 20.00 300 1.50 2,307,697 21.4 19.5
BP1 20.00 200 1.25 2,541,668 22.5 21.0BP1 20.00 200 1.50 2,330,828 21.5 19.7BP1 20.00 200 1.75 2,119,988 20.5 18.3
Table 12 Summary of financial model key inputs and profitability indicators for semi-intensiveproduction of 300g eels under all tested Best Practice scenarios (NPV, Net Present Value; IRR, InternalRate of Return; PM, Profit Margin).
Best PracticeScenario
Market price($/kg)
Stocker eelprice ($/kg)
Feed price($/kg)
NPV ($) IRR (%) PM (%)
BP1 15.00 25 1.50 -38,681 8 -13.2BP2 15.00 25 1.50 367,855 26 1.7BP3 15.00 25 1.50 659,965 40 9.9
BP1 12.50 25 1.50 -384,599 -6 -35.9BP1 15.00 25 1.50 -38,681 8 -13.2BP1 17.50 25 1.50 307,237 23 2.9
BP1 15.00 25 1.50 -38,681 8 -13.2BP1 15.00 50 1.50 -192,246 2 -21.2BP1 15.00 75 1.50 -345,811 -5 -29.2
BP1 15.00 25 1.25 29,066 11 -9.6BP1 15.00 25 1.50 -38,681 8 -13.2BP1 15.00 25 1.75 -106,428 5 -16.9

FRDC Report 2000/264
Eel Industry Strategy and Business Analysis
29
Table 13 Summary of financial model key inputs and profitability indicators for semi-intensiveproduction of 1kg eels under all tested Best Practice scenarios (NPV, Net Present Value; IRR, InternalRate of Return; PM, Profit Margin).
Best PracticeScenario
Market price($/kg)
Stocker eelprice ($/kg)
Feed price($/kg)
NPV ($) IRR (%) PM (%)
BP1 20.00 25 1.50 1,928,466 33 23.7BP2 20.00 25 1.50 2,934,120 48 28.9BP3 20.00 25 1.50 3,814,528 59 31.9
BP1 17.50 25 1.50 1,073,821 23 16.9BP1 20.00 25 1.50 1,928,466 33 23.7BP1 22.50 25 1.50 2,783,110 41 28.9
BP1 20.00 25 1.50 1,928,466 33 23.7BP1 20.00 50 1.50 1,744,966 30 22.3BP1 20.00 75 1.50 1,561,466 28 20.8
BP1 20.00 25 1.25 2,139,614 35 25.7BP1 20.00 25 1.50 1,928,466 33 23.7BP1 20.00 25 1.75 1,717,318 30 21.8
Table 14 Summary of financial model key inputs and profitability indicators for intensive production of10g stocker eels under all tested Best Practice scenarios (NPV, Net Present Value; IRR, Internal Rate ofReturn; PM, Profit Margin).
Best PracticeScenario
Glass eelintake (kg)
Glass eelprice ($/kg)
Market price($/kg)
NPV ($) IRR (%) PM (%)
BP1 500 100 25.00 44,719 11 12.2BP2 500 100 25.00 262,774 16 18.7BP3 500 100 25.00 414,131 19 23.0
BP1 100 100 25 -674,063 - -BP1 250 100 25 -404,520 -4 -31.9BP1 500 100 25 44,719 11 12.2
BP1 500 100 25 44,719 11 12.2BP1 500 200 25 -166,595 5 0.6BP1 500 300 25 -417,909 -1 -11.0
BP1 500 100 25 44,719 11 12.2BP1 500 100 50 1,756,646 46 56.1BP1 500 100 75 3,468,574 71 70.7

FRDC Report 2000/264
Eel Industry Strategy and Business Analysis
30
Table 15 Summary of financial model key inputs and profitability indicators for extensive production of1kg eels (as adjunct to wild fishery) under all tested scenarios (NPV, Net Present Value; IRR, InternalRate of Return; PM, Profit Margin).
Stocker eelprice ($/kg)
Market price($/kg)
NPV ($) IRR (%) PM (%)
25 20.00 1,402,300 41 65.550 20.00 885,104 25 57.575 20.00 367,908 15 49.5
25 17.50 1,094,392 36 60.525 20.00 1,402,300 41 65.525 22.50 1,710,209 45 69.3
Table 16 Summary of financial model production inputs and outputs for intensive and semi-intensiveculture systems under all tested Best Practice scenarios.
Culture system/Best Practice
Product size SeedstockQuantity (kg)
Seedstocktype/size
Final production quantity(tonnes)
IntensiveBP1 10g 500 Glass eels 19.9
300g 50 Glass eels 52.91kg 50 Glass eels 154.4
BP2 10g 500 Glass eels 22.4300g 50 Glass eels 63.51kg 50 Glass eels 200
BP3 10g 500 Glass eels 24.4300g 50 Glass eels 71.31kg 50 Glass eels 231.3
Semi-intensiveBP1 300g 1408 10g stockers 33.8
1kg 1408 10g stockers 98.5
BP2 300g 1579 10g stockers 42.61kg 1579 10g stockers 110.5
BP3 300g 1716 10g stockers 48.91kg 1716 10g stockers 120.1
Evaluation of Industry-Wide Development PotentialIntroductionThis study is predicated on the assumption that sustainable utilisation of glass eels can provide the basis forsubstantial expansion of the Australian eel industry, specifically the aquaculture sector, within acceptableESD performance criteria. In this context, international experience is mixed, with little documentedinformation from the Asian industry to provide any useful direction. The European experience is cautiouslyoptimistic about the longer-term utilisation of glass eels for commercial purposes. The socio-economicbenefits of utilising glass eels are well documented. There are however parallel concerns that environmentalsustainability of eel stocks may be compromised in preference to these benefits, noting the compelling

FRDC Report 2000/264
Eel Industry Strategy and Business Analysis
31
evidence for recent declines in the European eel stocks eg. EIFAC/ICES (2002).
Frost et al. (2001) in a socio-economic cost-benefit analysis of the use of glass eel in the European industryindicate that the input of one tonne of glass eel to the industry can result in more than five times theeconomic benefit to the community if used as seedstock for intensive aquaculture, compared with use asrestock for the commercial fishery. These benefits are however price sensitive for both glass eel costs andfinal market price and do not account for market price dynamics in response to substantially increasedproduction. A case is made for the introduction of policies in the European Union for the increasing use ofglass eels to support industry development.
The study also makes the point that economic viability for local eel farmers and associated communitybenefits in Europe are subject to global market pressures from the rapidly increasing Chinese eel cultureindustry (Frost et al., 2001). Much of the European glass eel harvest presently is sold to China to supplementproduction of locally sourced Japanese glass eels, much of which is then targeted at the traditional Japanese‘kabayaki’ consumer market. Of recent times, glass eel import quotas have been imposed by Chineseregional governments, presumably as a means of restraining over-production and associated market pricereductions, rather than over concerns for glass eel stock conservation.
In an economic evaluation of eel and elver fisheries in England and Wales, (Knights, 2001) suggests thatfollowing rapid increases in production and value of local glass eel fisheries during the 1980s and early1990s, mostly in response to increasing demand from China for aquaculture seedstock, demand and pricehas now stabilised with increasing competition following global oversupply of cultured eels (mostly fromChina).
Simulative Industry ModelIntroductionThe interactive, simulative eel industry model constructed in the present study is designed to determineproduction outputs at an industry-wide scale under various Best Practice and seedstock allocation scenariosacross different culture system-based sectors (intensive, semi-intensive and extensive). The intention is to beable to evaluate the potential scale of the industry, and thereby scope for expansion in terms of quantity andvalue of production, as well as evaluate how such production might vary over time with improved BestPractice standards, and under different juvenile eel seedstock allocation regimes. The combined ESDimperatives of economic development and glass eel resource management can then be jointly addressed toassist in the process of formulating a long term strategic vision for sustainable development of the Australiaeel aquaculture industry.
This approach in the present study is conceptually inspired by the rationale and methodological approachadopted by Borch (1999) in a study focussing on “..the relations between the choice of market strategy andorganisational architecture”, with the latter taking the form of a virtual fish farming enterprise within theNorwegian salmon industry. The starting point for the Borch (1999) study is the “..rivalry of the market andthe resources needed for improvements in competitive positioning strategy”. The underlying rationale isthat globalisation and its various manifestations in the salmon industry has imposed increasing competitivepressures across the industry in many countries, further testing the underlying strategic direction of thesesame sectors. A compelling case is presented for increased networking and greater flexibility inorganisational structure to facilitate integration on an industry-wide basis (Borch, 1999).
Conceptually at least, it is proposed in the present study that the Australia eel aquaculture industry could besimilarly viewed within a ‘virtual’ context in the first instance. This then may provide a means forsimulating various production and management scenarios at an industry-wide scale to theoretically evaluatecombinations of various parameters, ultimately to enhance key industry and resource inputs and outputs.Such an approach is likely to be essential for the Australian industry to be able to fully elucidate andultimately to optimise the cultured eel supply chain from glass eel fishers through to export consumers. Theneed for increased networking and organisational flexibility, along the lines proposed for the salmonindustry by Borch (1999) is also discussed.
MethodsThe range of possible scenarios which factor in all of the previously mentioned parameters is endless,therefore the analysis has focussed on a total of twelve potential scenarios to provide some broad indication

FRDC Report 2000/264
Eel Industry Strategy and Business Analysis
32
of the relevant trends, which in turn should provide the industry with some useful input to the strategicplanning and development process.
As for the farm-specific financial analysis model, the industry-wide simulative model is a simple MS Excel-based spreadsheet which incorporates fixed and identical growth rates for both shortfin and longfin eels, butallows for variable annual loss rates (operational mortalities and ‘leakage’) during each of the key,nominated developmental/production stages. The latter are consistent with those previously described forthe financial analysis, but do not include catastrophic losses associated with ‘risk’ (see Table 9 and 9).
The model allows for variable allocations at each of the key production stages in order to optimise overallindustry production levels (quantity and value) and resource use efficiency (as measured by % of initialseedstock in number sold as marketable eels – not including those sold as seedstock/restock for othergrowers). It also enables varying glass eel intakes (at an industry-wide scale) and determines thesubsequent seedstock input quantity (total weight and numbers) available for each of the later productionstages under each culture system, thereby enabling some evaluation of the feasibility and potential ofachieving realistic levels of vertical integration within the different eel culture industry sectors in future. Insummary, the key production stages which the model simulates are:
Intensive systems
• 0.17g glass eel ⇒1 g stocker• 1g stocker ⇒10g stocker• 10g ⇒300g saleable eel• 300g ⇒1kg saleable eel
Semi-intensive systems
• 10g ⇒300g saleable eel• 300g ⇒1kg saleable eel
Extensive systems
• 10g ⇒1kg saleable eel
For the purposes of this study, the model is run over four potential, industry-wide, annual glass eel intakes(incorporating both species) viz., 100kg, 200kg, 500kg and 750 kg. For each intake the allocation across thedifferent sectors is varied according to hypothetical but otherwise realistic industry seedstock needs andlikely market demand. The model assumes hypothetically that each of the intensive and semi-intensiveculture system sectors will allocate on average 50% of the available 300g production for ongrowing to 1kgeels and the extensive culture sector is assumed to produce only 1 kg eels with all available seedstock. Allother seedstock inputs to each of the different sectors and market sizes analysed by the model are completelynominal, but intended to reflect a combination of likely industry need and production capacity.
Results and DiscussionA summary of hypothetical industry-wide production and efficiency outcomes under varying industrydevelopment scenarios (Best Practice, glass eel intake and seedstock allocation) is provided in Table 17.Based on an industry-wide glass eel allocation of 100-200kg alone, the model estimates that the Australianeel culture industry could achieve approximately 150-300 tonnes of production per annum worth around$2.9-5.8 million under existing Best Practice industry standards and assuming a 25/25/50% allocation ofseedstock across sectors ie. 25% for intensive, 25% for semi-intensive and 50% for extensive. This level ofoutput potentially could increase substantially over time with improved Best Practice, increased glass eelintake, and increased allocation to intensive and semi-intensive culture sectors once the total seedstockrequirement for the extensive culture sector was satisfied (and assuming little or no major expansion of thissector in the foreseeable future).
According to the model, the industry could potentially produce over 1500 tonnes of marketable eels worth inexcess of $30 million in Australia (based on present values) under the assumed Best Practice, seedstockallocation and market pricing regimes. Furthermore, the model estimates that under improved Best Practice

FRDC Report 2000/264
Eel Industry Strategy and Business Analysis
33
conditions, increasing the initial industry-wide glass eel intake to 500-750 kg per annum could potentiallyincrease the relative efficiency of industry utilisation of the wild glass eel seedstock resource by about 9-15%(as measured by the % of initial glass eel seedstock being finally harvested as marketable eels for the retailconsumer).
Table 17 Summary of hypothetical industry-wide production and efficiency outcomes under varyingindustry development scenarios (Int., intensive; Semi., semi-intensive; Ext., extensive).
Best Practice/Scenario
Glass eelintake (kg)
SystemInt/Semi/Ext (%)
Production % initial stockat harvest
Biomass(tonnes)
Value ($,000)
1.1 100 25/25/50 152.7 2925.6 362.1 186.5 3574.1 443.1 211.3 4049.9 50
1.2 200 25/25/50 305.3 5851.2 362.2 373 7148.2 443.2 422.6 8099.9 50
1.3 500 42.5/32.5/25 901.2 17055.0 462.3 1122.7 21277.0 573.3 1283.4 24338.7 65
1.4 750 43.3/23.4/33.3 1295.9 24611.4 432.4 1597.5 30370.9 533.4 1817.4 34570.2 60
Intensive/Semi-Intensive aquaculture
A summary of the existing and potential intensive/semi-intensive Australian eel aquaculture productioncapacity is provided in Table 18. For this summary, the existing data are based on information extractedfrom published sources where available (eg. annual production returns for Victorian and Queenslandindustry), and anecdotal information from reliable industry and government sources where published datais unavailable.
These data are intended to correlate with actual industry scale for the present period to five years hence.Estimates of the potential scale of the Australian eel aquaculture industry over a five-ten year time frame arebased entirely on expert opinion from relevant industry and government sources, and at best are intended tobe ‘indicative’ only for the specified period. No attempt is made in the present study to estimate by expertopinion industry production capacity beyond the specified 10 year timeframe, other than to allude to theestimated scale determined by the industry simulation model. To what extent the model’s projections forthe period > 10 years are pragmatic remains to be seen, however the simulated outcomes appear to correlatereasonably well with the anecdotal, but otherwise informed and expert, opinion of key eel aquaculturepersonnel in Australia.
More specifically, the simulation model suggests that Australian production could reach up to 1100-1600tonnes per annum from intensive and/or semi-intensive culture systems under Best Practice scenario 2 (5-10year time frame) and with an annual glass eel allocation to industry of 500-750 kg per annum. This dataapproximately complements the potential industry production capacity of (maximum) 1400 tonnes perannum estimated by anecdotal opinion to be achieved within the same 5-10 year time frame.
This latter production estimate is based on the likelihood that at least one or two large-scale RAS-typeintensive eel culture systems could be established in each of Victoria and Tasmania, and at least one or twolarge-scale pond-based semi-intensive and/or RAS-type intensive culture systems could be established inNew South Wales and Queensland. RAS –based eel culture is more likely in Victoria and Tasmania underthe cooler prevailing climatic conditions, and pond-based culture systems are more feasible under the

FRDC Report 2000/264
Eel Industry Strategy and Business Analysis
34
warmer ambient conditions at the more northerly latitudes in NSW and Queensland. Additionally, it ispossible that several existing pond-based barramundi farms in Queensland could diversify into eel cultureas an adjunct enterprise, adding a further production capacity to the industry. Such diversification isalready apparent in Queensland, although production is still at a relatively low level (Table 7).
Tasmania has the added advantage that the annual harvest of elvers from below the Trevallyn Power Stationin the Tamar River and from Meadowbank Dam on the Derwent River could provide an additional source ofjuvenile eel seedstock for one or two relatively large-scale, intensive, RAS-based eel culture systems. Giventhat the local access to glass eels is still limited (McKinnon et al., 2002), elvers from the Tamar and theDerwent may provide a viable short to medium term alternative to glass eel seedstock, although actualintensive production outputs from elvers is unknown at this stage.
Table 18 Estimated Intensive/Semi-Intensive Australian Eel Aquaculture (Grow-out) ProductionCapacity – Present (2000/01) and Potential (within 5-10 years) (source: various industry and governmentdata); (na, not applicable).
No. existinglicensedfarmers
No existingfarms
Existingproductioncapacity tonnes/yr
No. potentialfarms(5-10 yrtimeframe)
Potentialproductioncapacity tonnes/yr
Queensland 26 4 50-75 5-10 150-500NSW* 21 3 15 3-5 75-300Victoria** 5 2 10 3-5 75-300Tasmania 1 1 na# 3-5 75-300
Total 53 10 75-100+## 14-25 375-1400* assuming average semi-intensive stocking densities (estimated after Gooley and Ingram, 2002).** not including licensed eel fishers with endorsement for culture waters (stock enhancement).# experimental/pilot operation.## some farms have the capacity to scale up production subject to market demand.
As previously mentioned, the simulation model assumes that 50% of all 300g eels produced by bothintensive and semi-intensive systems would be ongrown to 1kg eels before sale into the market place forhuman consumption. The financial analysis clearly shows that the latter option is potentially far moreprofitable. It is therefore more likely that a greater percentage of 300g eels is likely to be ongrown to a largersize in future, and the simulation model estimates of potential scale of industry-wide production may wellbe conservative.
As a means of reality checking the simulation model estimates, it is instructive to note that the simulationmodel dictates that, according to the specified scenarios under an initial 500kg glass eel intake, the totalindustry-wide input needs of 10g stocker eels is in the order of 15-18.5 tonnes per annum for intensive andsemi-intensive culture systems alone. The financial analysis of a single, hypothetical, purpose built intensiveRAS-based nursery system producing 10g stockers eels suggests that such a system would be profitable witha 500kg glass eel intake and producing from 19.9 to 24.4 tonnes of saleable product per annum; more thanadequate for the projected industry’s needs over the next 10-20 years.
Extensive culture
The only realistic opportunity for significant expansion of extensive eel culture practices in Australia existsin Victoria, in which such operations are both well established and historically quite productive. Bydefinition, extensive culture provides for the ability to impose some management intervention on the targetspecies to increase productivity, but with few inputs (if any), other than seedstock. As previously indicated,the Victorian eel fishery consists of two distinct components, viz. the traditional capture fishery basedaround coastal rivers and associated wetlands, and the stock-enhanced capture fishery based around variousother private and public lakes, wetlands and water storages, predominantly in western Victoria. Given thatthis has been an established practice in Victoria for many years (Hall et al., 1990), it does not logically follow

FRDC Report 2000/264
Eel Industry Strategy and Business Analysis
35
that such an approach could be followed in other states, at least in public waters, where resource-use conflictwith other stakeholders is likely to be a key constraint.
Having said this, translocation of juvenile/sub-adult eel stocks within their natural range has occurred inTasmania as a result of elver harvests from below Meadowbank Dam on the Derwent River and theTrevallyn power station on the Tamar River. However this practice is more to supplement the existing wildeel fishery rather than to pursue ‘extensive culture’ per se, and no specific data is available to determine yieldfrom such practice. Some industry proponents have also expressed interest in undertaking extensive culturein private waters in NSW using wild-caught restock, but the likely scale of such a development appears to berelatively small and geographically localised within a national context.
Based on industry sources, the total surface area of water bodies that are likely to be both suitable andavailable for stock enhancement in Victoria is in the order of 16,000 ha (source: Victorian Eel Fishers’Association). These waters have been ear-marked by industry on the basis that they are either existing,endorsed ‘culture’ waters (nominated licensed fishers permitted to stock and commercially harvest eels), orare existing allocated waters for commercial eel fishing only, but which are considered sufficientlyproductive and in need of stocking to increase yield.
Skehan and De Silva (1998) determined a series of significant positive correlations between fish yield (kg.ha-
1.yr-1) and stocking rate (kg.ha-1.yr-1) for both ‘restock’ eels (around 200-300 mm total length size range) andelvers (around 1-2 g in weight and <100mm in length) for shortfin eels in stock-enhanced, western Victorianwaters. More specifically, this study suggests that yield typically ranges from about 5 to 20 kg.ha-1.yr-1 atstocking densities ranging from 2 to 6 kg.ha-1.yr-1 for ‘restock’ eels, and from about 0.01 to 0.03 kg.ha-1.yr-1 forelvers after about 3-11 years respectively. The same data indicates a potential average yield of about 10-15kg.ha-1.yr-1 for every 250-500 ha of surface area for the same stocked waters. The loss (mortality) ratio for allstudied waters ranged from 0.24 for 500g weight class (size at harvest), to 0.62 for 1 kg weight class, with anaverage loss ratio of 0.47 for all weight classes (Skehan and De Silva (1998).
For the purposes of this study it is conservatively estimated that average annual yield for western Victorianwaters stocked with intensively reared (from glass eel stage) 10g juvenile restock eels would beapproximately (min.) 15 kg.ha-1.yr-1 of 1 kg eels after about 5 years at a stocking rate of (min.) 0.75 kg.ha-1.yr-1
(based on nominal/median values from Skehan and De Silva (1998). To instantaneously stock all availablewaters to an optimal level would therefore require approximately 12 tonnes of juvenile restock eels. Inpractice such a stocking could initially be undertaken over a five year cycle such that only 20% of waterswould be stocked per annum requiring a total of about 2400kg of 10g restock. After the fifth year, effectivelyall waters would continue to be stocked and harvested on a 5 year cyclical basis (assuming water is notlimiting), yielding approximately 48 tonne per annum. As more restock becomes available, stocking ratesand frequency could conceivably be increased to the point where all waters were stocked to the maximumand harvested each year potentially yielding in excess of 240 tonne per annum.
Under Best Practice 1 scenario, The simulated industry production model in the present study predictsapproximately 50 tonnes annual production of 1 kg eels with a market value of approximately $1 millionfrom extensively stocked waters. This is based on an input of approximately 2200 kg of intensively reared10g elvers from the initial ‘industry allocation’ of 100kg of glass eels.
Hypothetically, with increasing availability of glass eels, and subsequently 10g restock, the model predictsunder Best Practice 3 scenario (and 750 kg annual glass eel industry allocation), that the output of 1 kg eelsfrom extensively stocked waters in Victoria could increase to more than 300 tonnes per annum from anannual input of over 12 tonnes of restock. These data are broadly consistent with the yield predictions fromSkehan and De Silva (1998) and the related yield predictions for the present study (as previouslymentioned). Accordingly, the model is considered sufficiently relevant to provide a general guide toproductivity gains for stock enhanced extensive culture under a series of ‘continuous improvement’ BestPractice scenarios.
To fully capitalise on the potential for optimal production out of all culture systems, the simulation modelestimates that more than 35 tonnes of 10g stocker eels would be required per annum. The financial analysisin the present study estimates that intensive RAS-based production of 10g eels could profitably produce 24.4tonnes from a 500kg glass eel intake under Best Practice 3 conditions. It is likely therefore that with a glasseel intake of up to 750 kg per annum, a combination of one purpose-built farm, and two or three additional

FRDC Report 2000/264
Eel Industry Strategy and Business Analysis
36
RAS-based farms producing larger (300g/1kg) ongrown eels and 10g stockers as an adjunct enterprise, couldeasily produce sufficient 10g stockers in total to meet the entire industry’s future annual seedstock needs.
Australian Eel Aquaculture and Glass EelFishery Strategic Development -Directions, Guidelines, Needs and VisionBackgroundRecent R&D and industry trials in all states have clearly identified a commercially valuable glass eelresource in Australia, based on the longfin and shortfin eel. Products from both species are subject toongoing, predominantly export, market demand to varying degrees. Both are suitable for commercialproduction under intensive aquaculture conditions within pond and tank-based culture systems, and at leastshortfin eels have proved to be suitable for extensive production under stock enhanced wild fisheryconditions.
The primary requirement of the Australian industry is to optimise commercial glass eel resource utilisationwithin acceptable sustainability criteria and to facilitate long term eel aquaculture industry development. Insummary, the purpose of this section of the report is therefore :
To prescribe broad guidelines which facilitate a degree of uniformity/consistency in management of glass eelstocks across state/regional boundaries and according to Best Practice industry standards and principles ofESD,
To facilitate eel aquaculture industry development and to identify the need for change in order to optimisethe value of the Australian eel industry, and to create new opportunities specifically through Best Practice,sustainable glass eel utilisation and intensive production methods, and
Collectively to articulate strategic direction and a long term vision for the Australian eel aquacultureindustry.
For added emphasis key issues are sometimes repeated under different headings due to overlapping context,and key findings and recommendations are summarised and highlighted in borders following the relevanttext in this section of the report.
Eel Fishery SustainabilityCommercial techniques are now well established in Australia for catching shortfin and longfin glass eels,although suitable sites for collecting commercial quantities of both species are still somewhat limited innumber. Accordingly, the actual sustainable yield of glass eels in Australia is yet to be determined, howeverexisting market forces are effectively limiting the level of exploitation to a manageable, arguably veryconservative, level at the present time. In practical terms, the broad distribution of shortfin and longfin eelsin eastern Australia far exceeds the relatively limited number of suitable fishing sites at the present time,thus ensuring overwhelming spatial options for both migrating glass eel recruits (to estuaries) and theescapement of migrating silver/spawner eels (to the sea).
Recruitment variability is a key life history feature of all anguillid eel species, with many local and oceanic-scale physical and environmental factors impacting on recruitment levels to any one river system. This hasbeen shown to be the case in Australian species following recent investigations, with consistent commercialscale catch-effort data being limited to only two locations viz. the Snowy River in eastern Victoria and theAlbert River in south-eastern Queensland. It is also clear that despite the substantial level of investment inglass eel resource identification to date in Australia across four states, very little of the total range of bothspecies has in fact been investigated.
FRDC Report 2000/264
Eel Industry Strategy and Business Analysis
37
Glass Eel Fishery OpportunitiesThe results from the most recent FRDC funded glass eel project in Australia suggest that, subject to industryneeds, commercial harvesting of glass eels should proceed on a conservative, risk-managed basis, with totalharvest in the first instance being in the order of 100-200kg (mixed species) from each of Queensland andVictorian waters (Gooley and Ingram, 2002). This quantity could reasonably be expected to increase to atleast 500kg of shortfin glass eels alone (mostly from Victoria) in the longer term (next 5-10 years), withadditional quantities of 200-250 kg of longfin glass eels from both Queensland and NSW once additionalcollections sites are identified. Additional quantities of both shortfin glass eels, perhaps from the Tamar orDerwent in Tasmania, and longfin glass eels from the Snowy River in Victoria could also be sourced subjectto resolving various regulatory issues regarding access to the resource.
Ultimately, a total harvest of at least 500-750 kg of glass eels per annum of mixed species could be availableto industry in Australia on a regular basis over a 10-20 year timeframe. This quantity could theoreticallysupport a total cultured eel production of 1500-2000 tonnes per annum worth > $30 million, includingsatisfying all of the potential demand for extensive culture system restock from Victoria. Glass eelharvesting of this scale is unlikely to have any significant impact on eel stock conservation status withinAustralia due to the expected high inherent levels of natural mortality at the freshwater invasion life-historystage (McKinnon et al., 2002).
By and large it is known where and how to catch shortfin and longfin glass eels in Australia to enableimmediate industry expansion. Longer term expansion can be achieved as further glass eel resources areidentified and accessed under appropriate ESD-based management regimes.
Australian glass eel harvest potentially (subject to demand) can proceed immediately to a level in the orderof 100-200 kg/annum (both species), increasing up to 500kg within 5-10 years and to 750kg within 10-20years. This could be achieved within an ESD framework and theoretically result in total production of 1500-2000 tonnes of cultured eels per annum worth > $30 million (based on present values).
Although the ready access to glass eel resources is often claimed by industry to be limiting eel aquacultureindustry investment and development in Australia, it is likely that global market forces and the fundamentallack of any industry coordination at a national level are at least as relevant in this respect. Institutional andlegislative impediments are presently limiting industry development, with existing state policies in relationto eel aquaculture development being inherently parochial. This attitude is doing little to facilitate optimaluse of what is otherwise a common pool natural resource being shared by multiple stakeholders (includingcommercial and recreational fishers, fish farmers, and ethnic and indigenous groups) across multiple stateand national boundaries. A more flexible approach is warranted to free up and encourage national trade inglass eels and intensively reared restock eels to ensure that the longer term production capacity of theAustralian eel aquaculture industry can be optimised in the face of ongoing export market demand. Thecompetitive advantage of marketing high quality ‘clean and green’ eel products within the massive Asianmarketplace is not likely to be sufficient in itself to ensure financial viability for Australian producers.Industry structuring to achieve high levels of vertical (between producers) and horizontal (across sectors)integration, is imperative to achieve adequate scales of production efficiency and critical mass in the marketplace.
In the absence of any higher level coordination, glass eel fishing policies at the state level to date haveeffectively imposed ‘barriers’ to interstate trade in glass eel. Coupled with the general lack of economicinformation and appropriate risk management-based policy to facilitate allocation and utilisation of glasseels in Australia, there is evidence of market failure. Australian glass eels are a common pool naturalresource which needs to be managed where appropriate within a national context, albeit with administrationat the respective state agency levels.
A national market for longfin and shortfin glass eels would need to be consistent with national and statetranslocation policies and meet fish health standards as prescribed by future federal government guidelines.It is expected that appropriate disease-free certification at the point of sale of glass eels would be a minimumrequirement. For translocation purposes appropriate spatial management units could include diseases bycatchment and exotics by river basin. Unless proved otherwise, both eel species are assumed to be of

FRDC Report 2000/264
Eel Industry Strategy and Business Analysis
38
genetically homogeneous stock, with genetic integrity not generally a translocation issue for eels inAustralia.
There needs to be a national market for interstate glass eel trading in Australia, supported by ESD basedresource management policy framed within a national context and administered at a state level.
To achieve national management of glass eels within an ESD framework, it will be necessary to maintainlong term nationally coordinated databases for resource management purposes, and that to a large extent,state-based resource management plans will need to be complementary at a national scale. Equally, at leastwith shortfin glass eels, some coordination of resource management initiatives should also be addressed atan international level between Australia and New Zealand, given that both countries are thought to share acommon genetic stock of this species.
To this end, the Australia New Zealand Eel Reference Group (ANZERG) is likely to play a key role in eelaquaculture (and glass eel fishing) resource management and associated industry development. PresentlyANZERG meets irregularly, without any strategic direction and with little input from industry. IndeedANZERG was originally established largely to help coordinate and facilitate eel fisheries and aquacultureR&D at a national level, and to act as a forum for government resource managers and researchers. It issuggested that the Terms of Reference for ANZERG now be revised to accommodate a more active industrydevelopment portfolio, or at least ANZERG should formally seek appropriate collaborative linkages withother peak/representative industry bodies for this purpose. ANZERG also needs to assume responsibilityfor ensuring the ongoing maintenance of a national glass eel database to be used as a key, long-termmanagement tool, and also the preparation of comprehensive extension resources for industry.
The Terms of Reference for ANZERG should be revised to reflect changing industry development andresource management needs, particularly in the utilisation and management of the Australian glass eelresource.
Resource Management Needs and DirectionsIt is instructive to note that the proposed level of harvesting in Australia is only a fraction of the annual glasseel harvest for the European eel A. anguilla, which is in the order of several hundred tonnes. Despite thislevel of exploitation, declines in the European eel stocks are being addressed principally through managingadequate escapement of mature migratory eels (also referred to as ‘silvers’). The main problem here is thebroad geo-political scale in which the eels are distributed and exploited. Multiple management jurisdictionscomplicate the management process to the point where a uniform suite of effective regulations is almostimpossible to achieve.
Conversely, in Asian countries there is little effort to manage endemic glass eel resources with input controlssuch as fishing time, number and types of nets and boats etc, or output controls (no protection of spawners),and compliance is therefore inherently low. Interestingly, production from the annual glass eel harvestappears to have more to do with prevailing climatic conditions than the level of fishing effort. Poor harvestsare typically followed by abundant harvests on a cyclical basis following above average seasonal flooding incoastal rivers; arguably a testament to the resilience of the endemic eel stocks in the face of myriad otherdeleterious stock conservation impacts in the region.
The Australian situation is quite different again to both the European and Asian situation. In Australia,scope exists for coordinated effort and uniform management measures to protect eel resources.Furthermore, the proposed scale of exploitation is relatively small by comparison, the scope for escapementvery high, existing management of input/output controls is comprehensive (if not consistent) andcompliance is high. A conservative, risk management approach to glass eel fishing in Australia wouldinclude much of what already occurs by default. The emphasis on input controls (licence holders, effort,gear type & no., water access dependent on season etc) should continue, and limited entry imposed wherenot already existing.
In future it may be necessary to establish quantifiable, catchment-specific trade-offs between glass eels,elvers, standing crop and spawners i.e. gaining access to one by retiring proportional effort in another.Closed catchments and nursery waters may be considered, although in practical terms, if total effort in the

FRDC Report 2000/264
Eel Industry Strategy and Business Analysis
39
Australian industry does not increase over present levels, sufficient ‘reserves’ already exist by default. Theactual physical amount of water fished at any one time in Australia is considered extremely small presentlycompared with the total amount of water available to the eels. To avoid ‘hot spots’ at certain times of theyear, some site specific controls (eg. “no go” fishing reserves) may be required in the future, at least on arotating basis within a certain region. Finally, the practice of imposing conservation-based stockenhancement in the wild for sustainability purposes (eg. a proportion of catch returned as elver upstream ofcapture site) is an additional means by which the eel resource can be conservatively risk managed, but stillprovide for expansion through glass eel utilisation.
The primary focus for managing the Australian eel resource should be on optimising protection andescapement of spawners (silvers) over nationally relevant units of time and space. A conservative ‘riskmanaged’ approach should be adopted at a national level for the sustainable production of Australian eels.
Given that glass eels typically migrate into estuaries in Australia over a broad spatial and temporal scale andin large numbers to compensate for inherent recruitment variability and other associated complex lifehistory characteristics (eg. long-lived, oceanic spawning, extended oceanic migratory larval phase etc), it isalso reasonable to assume that natural mortality at the glass eel stage is inherently high. For this reason,glass eel fishing per se is thought to have minimal impact on standing crop, compared to potential impactsfrom exploiting later life history stages including elvers, yellow eels and silver eels.
In short, the shortfin and longfin glass eel resource in Australia is likely to be a robust and resilient resourcewithin reasonable limits yet to be realised, even in the absence of completely reliable stock assessment data.It is however incumbent on relevant agencies to manage the resource conservatively within a nationalcontext and to reduce risk of over exploitation at a catchment specific level through adoption of aconservative, risk managed, ESD-based approach where appropriate. Indeed Commonwealth Governmentrequirements for ESD compliance for export fisheries in Australia already dictate the legislative need in thenear future for an appropriate ESD-based management and reporting framework for the Australian eelindustry, including aquaculture due to its ongoing reliance on wild glass eel seedstock.
The Australian glass eel resource can be managed sustainably, despite limited existing stock assessmentinformation, on the basis of this being an inherently resilient and robust resource. Management shouldadopt a ‘conservative’, risk managed approach within an ESD framework
Consistent with European trends, and the recently released Victorian Eel Fishery Management Plan(McKinnon, 2002), it is also suggested that escapement of silver eels should be the primary managementcriteria for eel resource sustainability purposes in Australia, and that glass eel utilisation should be themeans by which production can be substantively increased across both wild fishery and aquaculture sectors.There is little evidence from within Australia or from overseas studies presently to suggest that glass eelharvesting at the recommended levels could in any way impact on standing stock of eels within their naturaldistribution in Australia, or on the conservation status of the target species. Neither species is presentlyclassified under any threatened status.
Within reasonable spatial limitations, it's assumed that escapement of spawners and subsequent recruitmentof glass eels are highly dependent and relatively homogeneous throughout the range of the species. Further,within any one waterbody, excessively high mortality of spawners is highly unlikely to affect long termstanding crop within that water body, so long as sufficient escapement occurs within neighbouringcatchments. Having said that, such mortality will cause significant short term impacts on the fishery as wellas deleterious impacts on biodiversity, social, recreational and cultural values. This is therefore notconsidered an appropriate approach under any circumstance, rather the means to make a point about therelevance of spawner escapement as a management tool.
Escapement of mature, migratory stock (silvers) should be the principal management criteria for eel resourcemanagement in Australia, with glass eel harvest levels being set at a national level but with site/catchmentspecific catch limits.
In relation to monitoring and assessment of eel resources, limitations are recognised with all traditionalfisheries assessment methods when applied to eels due to the highly variable life history, broad geographicrange and long life span. However minimum monitoring and assessment requirements (eg. glass eels and

FRDC Report 2000/264
Eel Industry Strategy and Business Analysis
40
spawners) applied over a minimum time-frame of >10 years will provide some useful indices ofrecruitment/production for resource management and industry development purposes. The existingnational glass eel CPUE database (Gooley and Ingram, 2002) has limited application for site specificpurposes due to the inherent spatial and temporal variability of the data, but is likely to be relevant at anational scale when viewed over long periods. This database is also useful for resource identification forindustry development purposes in terms of quantifying scale of reliable/available glass eel stocks and as ameasure of industry production capacity.
Ongoing, long-term (10-20 year) monitoring of glass eel harvesting levels as a key recruitment index andsilver eel harvesting levels as a spawning index are required at a national level.
Although compliance of eel fishery regulations is not generally considered to be an issue in Australia,examples are known to exist within the industry which can impact on market access, if not resourcesustainability. Significant illegal fishing and trading in wild caught eel is claimed by some industry sourcesto occur in Victoria, where at certain times Western District lakes are targeted by organised poachers. It isclaimed that 1-2 operators can take 100-200kg eels/night by multiple rod and line sets. These eels are thensold illegally into the domestic market and thereby depressing demand for legal eel trade. Complianceefforts however are resource limited, clearly subject to varying state agency-based priorities, and outside theterms of reference for this study.
Industry Structure and Development ConstraintsThe Australian eel aquaculture industry needs to establish a long term strategic vision to encourageappropriate levels of investment and compliance with acceptable ESD performance criteria. This visionshould have a 10-20 year time frame and address at a national level various issues including relevant aspectsof technology, R&D, training and education, resource management, organisational structuring, financialmanagement and marketing. Australia presently lacks an effective national focus for development of the eelindustry, with a resultant lack of strategic industry development and coordination being apparent. The needin fact is for the eel industry to work across multiple state boundaries, not be constrained by them.
There is presently a lack of coordination between industry sectors (wild fishery and aquaculture) and acrossstate boundaries (partly compounded by state-based resource management policy), meaning that the smalland geographically disparate producers have little chance to achieve critical mass within the export marketplace. Furthermore, there is a general lack of broad-scale market intelligence regarding domestic and exportconsumer demand for wild and cultured eel, particularly in relation to value-adding, import replacementand associated niche marketing. All such information is typically held within individual businesses, wherein fact it exists at all.
There is a consequent lack of understanding within the industry, particularly for new entrants, of the supplychain requirements for large-scale production and marketing of Australian cultured eels. In turn this hasresulted in depressed levels of new investment of recent times, despite latent interest from many candidates.Vertical integration of the supply chain is presently limited within a small number of individual businessesin both scope and scale. By and large, integration at an industry scale is limited again to within statearrangements, and even then is only occurring on an ad hoc basis.
Where appropriate, the existing wild eel fishery needs to diversify into glass eel fishing and to on-sell glasseels to specialised nursery operations for intensive aquaculture production of seedstock for intensive/semi-intensive grow-out and stock enhancement of extensive culture waters. These linkages could be a fullyintegrated chain of production within one business, or more likely integrated across two or more businessesanywhere in Australia.
By and large, the skills required for glass eel fishing reside with commercial fishers, albeit after sometraining and education in Best Practice techniques regarding the specific requirements for glass eelscompared with larger/later stage eels. In practice it is suggested that commercial fishers, where available,should be encouraged to harvest and sell glass eels to the aquaculture industry as required. At the presenttime however, linkages between the two sectors to realise on mutual opportunities vary between the statesand overall are limited in scope.

FRDC Report 2000/264
Eel Industry Strategy and Business Analysis
41
There is little to be gained by providing additional access to the glass eel fishery beyond the existingcommercial fishers. Having said that, it is incumbent on existing fishers to reasonably supply theaquaculture industry to agreed levels, appropriate prices and market demand, that seedstock which isrequired for growout at an appropriate quality standard. A ‘whole-of-supply-chain’ approach to producingand marketing Australian eels within a fully integrated (vertically and horizontally) industry structure is apre-requisite, as are organisational flexibility and communication between the different sectors, to ensurethis view is pragmatic. Moreover the Australian eel aquaculture industry, in partnership with the wild eelfishery sector, needs to promote the long term environmental sustainability merits of the industry,highlighting the Best Practice approach to development and the social and economic benefits to regionalareas. The industry should be supported in this endeavour through improved extension services, provisionof reliable and comprehensive eel business development and investment analysis data, and ongoing R&Dtargeted at nationally prioritised information gaps.
For the eel aquaculture industry to expand in Australia there needs to be an increased emphasis onutilisation of the glass eel resource for both shortfin and longfin eels to increase both productivity andprofitability. More specifically, there is a need to establish adequate scale and capacity within the industry,underpinned by reliable access to and sustainable management of Australian glass eel resources toencourage further investment in Best Practice aquaculture production. The Australian eel industry is verysmall and organisationally fragmented over four eastern states, viz. Queensland, NSW, Victoria andTasmania. It is also effectively spread across two sectors (wild fishing and aquaculture) with operationallinkages in the extensive culture practices in Victoria, but with otherwise ad hoc and tenuous linkages in allother respects. Some eel fishers are diversifying into glass eel harvesting for their own restock needs, otherfishers are harvesting glass eels purely for on-selling to culturists (intensive through to extensive systems),and yet others are doing both.
This lack of coordination is further compounded by the lack of a defined organisational structure within theeel aquaculture sector to facilitate any meaningful horizontal integration between sectors. Also, each of thestate fisheries management agencies has adopted largely parochial management and policy positionsregarding cross border trading in locally harvested glass eels. Through limiting cross border trading,ostensibly to facilitate local value-adding and associated eel industry development, current glass eelmanagement practices appear to be unnecessarily constraining industry development. Indeed, without highlevel coordination at a national level, arguably the eel aquaculture industry in Australia will not realise itsfull potential. Moreover, national trading in glass eels is critical to the medium-long term viability of the eelaquaculture industry in Australia.
At the present time, the availability of glass eels in Australia is not limiting industry development per se,despite comments to the contrary by some industry proponents. Commercial and government supportedefforts to harvest glass eels have been initiated in all four eastern states, with relatively substantial quantitiesbeing harvested in at least Queensland and Victoria to date. More effort should be expended in facilitatingoptimal harvest by industry of known stocks (eg. shortfin glass eels in the Snowy River in Victoria) andongoing pilot-scale fishing for new stocks (eg. shortfin glass eels in the Derwent and Tamar Rivers inTasmania, and longfin glass eels in the Snowy River and various Queensland/NSW rivers).
On the other hand, demand for glass eel seedstock has eased in the last 2-3 years, partly due to depressedexport prices due, in turn, to over-production in China, but also partly due to a lack of any strategic visionfor the industry in Australia. For the former reason, some producers have diversified into other species, andsome potential new investors have not proceeded to an operational stage. Nonetheless, those eel ‘fishers-cum-farmers’ who are targeting export Asian markets for larger (around 1 kg) eels from stock enhancedwaters are still highly profitable. Subject to favourable climatic conditions (with sufficient rainfall to fillextensive culture waters), and availability of sufficient quantities of restock at the right price, profitableproduction can be achieved. Likewise, the demand for high-priced (>$20/kg), larger longfin eels from thewild capture fishery has stimulated the prospects of culturing large longfin eels from the glass eel stage.Market intelligence suggests that quality standards and product specification are the keys to export marketaccess in Asia, rather than whether the product is cultured or wild fished. There appears to be ampledemand for both within the global eel marketplace.
With national glass eel trading, an effective industry structure could be achieved, in a way that all keyproduction stages, including glass eel fishing, nursery and grow-out, could become vertically integrated to

FRDC Report 2000/264
Eel Industry Strategy and Business Analysis
42
provide the basis for a robust cultured eel supply chain in Australia. This supply chain could in turn bedirected to complement the existing export demand for ‘clean and green’ high quality eels of a larger size toa quality accredited standard. At the present time it is apparent that Australia eel culture producers are notable to satisfy there general seedstock/restock needs (in addition to glass eels) in terms of quantities, size andcost. The lack of a stand-alone glass eel nursery sector, based on intensive acclimation and rearing, is clearlya limitation to the expansion of other producers for all growout systems in this respect.
A schematic summary of a conceptual eel aquaculture industry structure fully integrated with the existingwild eel fishery supplying glass eels is provided in .
It should be noted in this context that at the present time there has been no record of any ‘notifiable’ diseasesin Australian cultured or wild eels, and the most common fish pathogens are typical of most culturedfreshwater fishes and are able to be readily managed using conventional, well established fish healthmanagement measures. Accordingly, with the introduction of effective and efficient quarantine andassociated fish health management procedures, national trading in glass eels and larger restock sizes is likelyto be able to proceed within acceptable levels of management risk.
In contrast to the proposed domestic opportunity, little can be gained by Australian industry in harvestingAustralian glass eels for export given the relatively small quantities on offer by global standards. Invariably,the few shipments that have gone overseas in the past for ‘R&D’ trials have resulted in little follow up fromthe Asian importers once the full implications of Australia’s ESD-based resource management imperativesbecome apparent.
There is evidence of market failure in the Australian eel aquaculture sector as a result of the presentemphasis on state-based eel industry development initiatives utilising glass eels, and with the lack of anationally coordinated focus on resource management, R&D, industry structure and representation.
The Australian eel aquaculture industry needs to be better structured to take advantage of greater levels ofintegration to achieve critical mass and associated supply chain efficiencies and to fully realise the potentialbenefits of increased glass eel utilisation and national trading.

FRD
C R
eport 2000/264
Eel Industry Strategy and Business Analysis
43
Figure 1 Schematic summary of conceptual fully integrated Australian eel aquaculture industry and glass eel fishery
Glass eelNational M arket
Longfin
Shortfin
Intensive Aqu acu lture - Nu rsery phase
Conservation Stockings
S tock-Enhanced Fish eries -ExtensiveGrowou t
Semi-Intensive Growou t
In tensive Growout
Market #1(3pcs/kg)
Market #2(≥ 1kg)
Wild eel fishery -Australia
wide
Lon gfin and shortfin
Escapement Spawning Recruitment
FRDC Report 2000/264
Eel Industry Strategy and Business Analysis
44
Technical developmentsThe eel aquaculture industry in Australia now has a viable R&D base in relation to glass eel fishing and highdensity production technologies, largely as a result of recent FRDC and state government funded projectsand concurrent industry investment. This base is also complemented by ongoing industry developments infishing and farming technologies and is sufficient to enable consolidation of a small but otherwise motivatedand potentially productive eel sector in the Australian seafood industry.
Commercial fishers in all four states are now conversant with glass eel fishing techniques and to varyingdegrees are being given direct access to known glass eel resources in selected catchments/rivers. Having saidthat, it is also clear that the ability of fishers to deliver a quality assured glass eel product to purchasers, bethey for stock enhancement purposes or as seedstock for higher density culture systems, is of some concern.The role of purpose-built nursery systems operating on the basis of ‘best practice’ technology and servicedby appropriately trained operators is critical to ensuring that survival and condition of acclimated andweaned glass eels is maximised. Conversely, a lack of expertise and/or appropriate systems, technology andinfrastructure at this stage can lead to significant mortalities of harvested glass eels. Guidelines for ‘bestpractice’ fishing and aquaculture of glass eels, published as part of recent FRDC funded glass eel R&Dprojects, are now available for Australian anguillids (McKinnon et al., 2001).
Various indicators of sustainable industry development may be considered to underpin a long term (10-20year) strategic vision. As a starting point it is suggested that the eel culture sector in Australia establish anagreed set of Best Practice technical standards within which the industry can be managed within an ESDframework. Financial viability and environmental sustainability will in part be determined by the efficiencywith which the natural glass eel resource is utilised from the point of harvest to the point of final sale toconsumers. Accordingly, Best Practice standards based around achieving increasing levels of survival andreduced operational risk of loss of eels during all production stages as part of a national ‘continuousimprovement’ industry imperative is likely to be a useful starting point.
The Australian eel aquaculture industry should establish a national Best Practice technical standardsframework which allows for progression over time under a ‘continuous improvement’ regime as part of anagreed strategic vision.
In a broad sense the Australian eel aquaculture industry is not presently limited by technology orinformational gaps requiring further R&D investment in the short term. Rather, more resources should beinvested in removing institutional and legislative impediments (particularly to national glass eel trading),industry structuring (to achieve better integration of key sectors), industry training and extension (based onrecent R&D outcomes). In the longer term, various R&D needs have been identified as part of the draftnational eel R&D strategy (see Appendix), and these should be reviewed periodically to determine the levelof priority.
For practical reasons, minimum commercial quantities of glass eels need to be supplied to "key producers atcritical developmental stages" for initial acclimation and weaning. Consolidation of the glass eel catchwithin appropriate geographic regions of the industry to ensure that the most experienced and efficientoperators using the best facilities become the production focal points at these critical stages should beencouraged wherever possible. These producers would be expected to apply Best Practice culture methodsaccording to industry agreed standards. From here glass eels would be distributed and used for intensivegrowout or for on-sale and/or reallocation for stock enhancement of wild fisheries. Furthermore, glass eelsshould not be used for stock enhancement of extensive culture waters without value-adding throughacclimation, weaning and intensive nursery production to a larger size before release.
Efforts should be made to establish purpose-built glass eel nursery operations employing Best Practicestandards as part of a fully integrated eel industry structure. All glass eel-based seedstock should bedirected through such operations wherever possible to achieve critical mass of glass eel inputs to the culturesystem.
R&D requirements for technical development of the industry may increase in the medium to longer term,depending on the scale and type of industry investment. From a wild fishery perspective, if increased levelsof glass eel harvesting are to occur to facilitate industry growth, further R&D may need to be focussed on the

FRDC Report 2000/264
Eel Industry Strategy and Business Analysis
45
development of bycatch reduction techniques to ensure that biodiversity impacts from commercial fishingare managed within acceptable ESD limits. The existing Best Practice glass eel fishing guidelines (McKinnonet al., 2001) are not presently linked to any specific performance criteria. With some modification theseguidelines could be utilised as part of an ESD accredited reporting framework in the future.
Furthermore, it is apparent that the early maturation of male eels under culture in both species, particularlyfor shortfin eel, is causing some degree of lost production, but this cannot be quantified at the present time.Increased production of larger eels (≥ 1 kg) under intensive culture could potentially exacerbate thisproblem, and some investigation of the impacts and management methods to ameliorate the problem maybe warranted in future.
Medium to longer term R&D priorities for technical development of the Australian eel aquaculture industryshould focus on deficiencies in commercial scale production systems and/or glass eel fishing practices,subject to determining an appropriate balance of public and private benefit and associated R&D investment.
ANZERG has assisted in the national prioritisation and coordination of eel R&D in Australia over recentyears, however this has been in the absence of a comprehensive, industry supported strategic R&D plan.Consequently, R&D is still proceeding at a state level with limited extension across state boundaries. Also,extension of the existing FRDC funded glass eel R&D project outcomes from recent years could be vastlyimproved using a national forum such as ANZERG as a vehicle for information dissemination. At thepresent time, the benefits to industry from this research has been variable from state to state, apparently alsocompounded by the lack of adequate government resources in the face of competition from larger, moreestablished aquaculture sectors in each state.
A national eel R&D plan needs to be adopted and coordinated by ANZERG as a means of providingstrategic direction to prioritised investment in the R&D needs of the Australian eel aquaculture industry.Short term emphasis should be on industry structuring, removal of institutional and legislative impedimentsto national glass eel trading, industry training and extension.
Market Dynamics, Needs and DirectionsBoth Australian species are perfectly adapted to intensive tank and pond production under certaincircumstances and where appropriate; at least for juvenile and sub-adult production stages up to 300g. Thegrow-out to larger sizes (up to 1kg) under these conditions is still to be commercially tested on the ground,although there is presently no obvious technical constraint and the financial analysis in the present studysuggests both intensive and semi-intensive culture systems could be profitable for this purpose. Certainlythe extensive culture of larger eels for export markets continues to be a profitable enterprise, albeit typicallyas an adjunct to a commercial, wild catch fishery business in most cases.
Australia by and large has the production skills and access to suitable culture systems and associatedinfrastructure needs. A couple of small-medium scale farms already exist employing purpose built facilities.Although farmers in Queensland have typically employed semi-intensive pond-based culture systems todate (largely due to the favourable ambient climatic conditions), the potential use of RAS-type intensivesystems is also under consideration by industry. Overseas experience, particularly from European countriessuch as Holland and Denmark, is useful in the development of RAS-type culture systems for eel productionin Australia. Recent experience suggests that RAS and the European industry experience can be readilyadapted to the specific requirements of local eel species. Ensuring that controlled environmental conditionsare matched to the requirements of local species is crucial to achieving high productivity levels.
The industry needs to identify and implement targeted strategies to increase and secure market access forcultured Australian eels. This should include increased branding and other forms of identification ofAustralian cultured and wild eel produce in the market place, and associated promotion of AustralianQA/food safety standards under a ‘clean and green’ theme. Further investment from both government andindustry is required to improve market appraisal (domestic and export) and product promotion anddemand for value-adding at the consumer end of the supply chain.
Viable export markets do exist presently for cultured Australian eel products, albeit many of which are insome state of flux due to global market forces, particularly the scale of (over) production in China. The latter

FRDC Report 2000/264
Eel Industry Strategy and Business Analysis
46
has apparently depressed the production in Taiwan to the point where many farms have now closed downor diversified into other species of recent years. The opportunity exists in Australia to capitalise on theenvironmental sustainability of the eel industry in terms of maintaining, and indeed increasing, its share ofthe export market. In particular, the eel industry is a potential candidate for the use of eco-labelling as a toolfor attracting premium prices, while at the same time meeting stringent ESD criteria. Certification under theMarine Stewardship Council for example, is one means whereby international recognition of theenvironmentally sustainable performance of Australia’s eel industry may enhance the value of eel industryproducts in export markets.
Value-adding to eel industry products is an area which also requires development in Australia. At present asmall number of eel producers in Victoria and Tasmania supply smoked whole eel and/or eel pâté to thedomestic market, with at least one fisher assertively marketing a branded smoked product. The potential forexpansion into the domestic market, by the industry could be realised to a greater degree throughcoordinated training and development in post-harvest handling and value-adding of eel products.Combined with a concerted marketing strategy, this would be expected to increase the competitiveness oflocal eel products with imported product on the domestic market.
Overall there is a specific need for the Australian eel industry to gain a better understanding of supply chainmechanisms, from the point of glass eel harvest, through all production stages and systems (wild fishery andaquaculture) to the market place, both domestically and export. Individual, long established wild fishery eelbusinesses have some understanding of the supply chain, however this cannot generally be said for somemore recent eel aquaculture entrants, and there appears to be little appreciation of the broader, longer termopportunities on offer for the industry through better integration between discrete businesses. Industryeducation and training is required to better inform producers, particularly using templates from otherexisting and successful primary industry sectors and products in Australia. Where possible, recognisedindustry leaders should play a greater role in this respect and in facilitating more effective integrationbetween various eel producers.
The Australian eel industry needs to have a better understanding and appreciation of the ‘whole-of-supply’chain from glass eel to export market. Training and education should be tailored to suit this need withrecognised industry leaders playing a greater role where possible.
R&D Priorities - SummaryGenerally speaking, further R&D of a bio-technical nature should be undertaken by industry undercommercial operating conditions, preferably with the input of state agency and university-based researcherson a collaborative basis. State fisheries and/or regional development agencies should be encouraged to formR&D partnerships for co-investment to underwrite such work, particularly where a compelling benefit canbe attributed to regional development and/or environmental sustainability from R&D outputs andoutcomes. Such benefits clearly justify the role of Government in making R&D investment in the eelaquaculture industry in Australia. The more immediate private benefits from bio-technical-type R&D whichcontribute to industry’s ‘bottom line’ should justify their ready and ongoing investment.
Likewise, further investment in identifying new glass eel resources and associated efficiencies in harvestingshould predominantly be underwritten by industry, with government co-investment where appropriate.This will ensure that future investment in this area is market driven and costs are met by the majorbeneficiaries in a proportional manner, subject to an agreed assessment of public and private benefit fromthe R&D.
In summary, future state and federal government investment in the eel aquaculture industry should focuson structural reform to address market failure issues, securing export market access, establishment ofmanagement guidelines and coordination to achieve ESD compliance, and training and extension foradoption of industry-wide Best Practice standards. Accordingly, based on the existing draft national eelR&D plan, and the information provided in the present study, the following key Australian eel aquacultureand glass eel fishing R&D priorities are proposed for the next five years:
1. Provision of comprehensive and up-to-date extension resources including documented Best Practicestandards, key investment criteria and market intelligence (see Draft R&D Plan re AQ1a &c, 2a, 4b, c&d).

FRDC Report 2000/264
Eel Industry Strategy and Business Analysis
47
2. Development of state-based management guidelines to encourage sustainable ESD-based glass eelutilisation and to facilitate national glass eel trading within the eel aquaculture and fishing industry;emphasis on removal of existing institutional and legislative impediments and EA Schedule 4compliance (see Draft R&D Plan re WF2c & 6c).
3. Development and application of supply chain strategies to facilitate and coordinate export market accessand industry integration and expansion (see Draft R&D Plan re AQ5a & 5b).
4. Provision of technical training support for the adoption of Best Practice standards in glass eel fishing andaquaculture, and in post-harvest, QA/food safety to complement new supply chain strategies (see DraftR&D Plan re WF6c, AQ1a, &c, 2a, 4b, c & d, 5a &b).
5. Market research to determine post-harvest, value-adding and ‘branding’ opportunities as part of newsupply chain strategies designed to secure market access (see Draft R&D Plan re AQ5a & b)
6. Establishment and maintenance of national databases for monitoring of glass eel catch and silver eelescapement and/or other key indices of eel resource sustainability (see Draft R&D Plan re WF2a)
These six priorities are not necessarily in priority order, rather should be seen as a package in addressingindustry’s immediate needs (next five years) to compliment their own strategies for achieving developmenttargets and specific Best Practice standards under a ‘continuous improvement’ regime over the next 20 yeartimeframe. This of course assumes that the industry shares such a vision and that projections of potentialindustry productivity over this (20 year) time frame, as determined in the present study, are at all realistic.R&D priorities beyond the next five years will need to be determined as part of a process of periodic (eg.biennial/triennial) review of progress.
Not all of these priorities are clearly articulated in the existing draft National Eel R&D Plan (see Appendix),but they are all broadly covered in one form or another, remembering of course that the specific emphasis ofthis study is on eel aquaculture and associated glass eel fisheries rather than eel fisheries in general. Toassist in correlating the two sets of priorities, the reference numbers for the relevant R&D priorities in thedraft R&D Plan are included in brackets.
It is worth noting that although the R&D priorities in this study have been determined from a somewhatdifferent perspective (simulative modelling and expert opinion) to the draft R&D Plan (broad consultationand consensus), the two respective sets of recommendations are broadly compatible and are underpinned bysimilar development rationale and strategic vision, albeit more clearly elucidated in this study. It shouldalso be noted that no attempt has been made to consider related issues in the New Zealand industry in thisstudy, and therefore the R&D priorities are consciously Australian-centric.

FRDC Report 2000/264
Eel Industry Strategy and Business Analysis
48
ReferencesAnon. 2001. Fisheries Victoria. Commercial Fish Production. Information Bulletin 2001. Marine & FreshwaterResources Institute, Queenscliff. 28.
Borch, O.J. 1999. New organisational forms within the aquaculture industry: the fish-farming enterprise as a`virtual' organisation. Aquaculture Economics and Management. 3:105-120.
EIFAC/ICES. 2002. Report of the EIFAC/ICES Working Group on Eels. International Council for theExploration of the Sea, Copenhagen. 59pp.
Frost, H., Jensen, C.L., Nielsen, M., Vestergaard, N. and Pedersen, M.I. 2001. A socioeconomic cost-benefitanalysis of the use of glass eel. Danish Institute of Agricultural and Fisheries Economics, Copenhagen. 68pp.
Gooley, G., Dalton, W. and Rawlinson, P. 2002. Preliminary economic analysis of selected Australian eelaquaculture systems. In Assessment of Eastern Australian Glass Eel Stocks and Associated Eel Aquaculture.Final report FRDC Project No. 97/312 and No. 99/330. G.J. Gooley and B.A. Ingram, editors. Dept. NaturalResources & Environment, Alexandra, Victoria.
Gooley, G.J. and Ingram, B.A. 2002. Assessment of Eastern Australian Glass Eel Stocks and Associated EelAquaculture. Final report FRDC Project No. 97/312 and No. 99/330. Dept. Natural Resources andEnvironment, Alexandra, Victoria.
Gooley, G.J., McKinnon, L.J., Ingram, B.A., Larkin, B., Collins, R.O. and De Silva, S.S. 1999. Assessment ofJuvenile Eel Resources in South-Eastern Australia and Associated Development of Intensive eel Farming forLocal Production. Marine and Freshwater Resources Institute, Alexandra. 124pp.
Hall, D.N., Harrington, D.J. and Fairbrother, P.S. 1990. The commercial eel fishery in Victoria. Arthur RylahInstitute for Environmental Research, Dept. of Conservation and Environment, Heidelberg, Victoria. 41pp.
Knights, B. 2001. Economic evaluation of eel and elver fisheries in England and Wales. Environment Agency,Bristol. 44pp.
Lobegeiger, R. 2001. Report to farmers. Queensland aquaculture production survey 1999-2000. Departmentof Primary Industries, Brisbane. 24pp.
Lobegeiger, R. 2002. Report to farmers. Queensland aquaculture production survey 2000-2001. Departmentof Primary Industries, Brisbane. 24pp.
McKinnon, L. 2002. Victorian Eel Fishery Management Plan. Marine and Freshwater Resources Institute,Queenscliff. 48 pp.
McKinnon, L., Gasior, R., Collins, A., Pease, B. and Ruwald, F. 2002. Assessment of eastern AustralianAnguilla australis and A. reinhardtii glass eel stocks. In Assessment of Eastern Australian Glass Eel Stocks andAssociated Eel Aquaculture. Final Report to the Fisheries Research and Development Corporation (ProjectNo. 97/312). G.J. Gooley and B.A. Ingram, editors. Marine and Freshwater Resources Institute, Alexandra.11-72.
McKinnon, L.J., Ingram, B.A., Larkin, B. and Gasior, R.J. 2001. Best Practice Guidelines for Australian GlassEel Fishing and Aquaculture. Marine and Freshwater Resources Institute, Queenscliff. 21pp.
O'Sullivan, D. and Dobson, J. 2001. Status of Australian aquaculture in 1998/99 (sic). In Austasia AquacultureTrade Directory 2001. T. Walker, editor. Turtle Press, Rosny, Tasmania. 3-19.
Skehan, B.W. and De Silva, S.S. 1998. Aspects of the culture-based fishery of the shortfinned eel, {IAnguillaaustralis}, in western Victoria, Australia. Journal of Applied Ichthyology - Zeitschrift Fur Angewandte Ichthyologie.14:23-30.

Draft Australia-New Zealand Eel R&D Strategy
Eel Industry Strategy and Business Analysis
49
AppendixAustralia-New Zealand Eel R&D Plan 2000/01-2005/6Draft date: 26 November, 1999
BackgroundThe Fisheries R&D Corporation of recent years has, in partnership with industry and a number of stateagencies, invested significant funds into the development of the commercial eel fishery and aquaculturesector within Australia. Most notably the FRDC has funded two major R&D projects managed by theMarine and Freshwater Resources Institute in Victoria, Australia, which have investigated aspects of glasseel stock assessment and aquaculture. These projects (one completed and the other in progress) haveinvolved extensive collaboration between MAFRI, Deakin University and the Queensland Department ofPrimary Industries, NSW Fisheries and the Tasmanian Inland Fisheries Commission. The FRDC also ispresently funding R&D projects investigating aspects of the wild eel fishery in Queensland and NSW, bothof which are presently in the first of three year programs.
Given the ongoing level of industry support for R&D in this area at both the state and national level, theFRDC has now identified the need to adopt a more strategic approach to investing in this sector.Accordingly, an appropriate R&D strategic plan is now under development which will emphasise nationalR&D priorities for the eel sector (eastern Australian states) and will engage all relevant stakeholdersincluding industry, government and researchers. It is also intended that this plan will address the broaderregional interests and priorities of New Zealand are also being considered. This in turn recognises the factthat to a large extent the two countries share a common eel stock and eel management issues, and that thereis intrinsic merit for a number of reasons in facilitating wherever practical and possible a collaborativeapproach to eel R&D at a regional level. Indeed significant eel research is also underway in New Zealandthrough NIWA, and broader eel resource management and industry development issues are becomingapparent at the national level.
Consequently, it is proposed that the Australia and New Zealand Eel Reference Group (ANZERG), the peakeel advisory body to Standing Committee on Fisheries and Aquaculture in Australia, will act as a steeringcommittee for the development of the strategy. Furthermore, it is intended that ANZERG will be the vehiclefor implementing and managing the strategy in the longer term. This is on the understanding that, whereappropriate, eel industry stakeholders in both Australia and New Zealand, including FRDC and other R&Dfunding providers, fisheries agencies and resource managers, eel fishers, farmers and associated industrypeak bodies, and eel researchers and associated institutes, will actively engage ANZERG for the purpose ofsupporting the strategy. It is expected that the joint Australia-New Zealand membership of ANZERG willeffectively facilitate the necessary consultation and coordination between states and nations to achieve thisaim. ANZERG membership and contact details are provided in Attachment 1.
The development of the strategy to this point has followed a number of steps, formally commencing duringOctober/November 1999 with circulation of a questionnaire to all stakeholders seeking input from as wide aspectrum of the eel industry as possible. This was followed by a workshop held in Melbourne on 18November, 1999. Workshop delegates, both present and invited, are listed in Attachment 2. The combinedoutcomes of both the questionnaire and the workshop have resulted in this draft R&D Plan.
The Draft R&D PlanThe Plan is essentially based on two key imperatives, being sustainability of the eel resource and profitabilityof the eel industry. Accordingly, two key outcomes are proposed which underpin the future direction ofassociated eel R&D in Australia and New Zealand, viz.:
Outcome 1To manage and utilise the eel resource in an ecologically sustainable manner consistent with broadcommunity expectations.
Draft Australia-New Zealand Eel R&D Strategy
Eel Industry Strategy and Business Analysis
50
Outcome 2To develop and maintain a competitive and profitable, viable, secure and well structured commercial eelindustry.
The specific details of the Plan, including key issues, associated project topics, relevance, feasibility andpresent status are summarised in the following spreadsheet. Explanatory details regarding the definitionand/or interpretation of the specified criteria are provided in Attachment 3. The listed Issues and ResearchTopics included in the Draft Plan are largely those which were identified during a preliminary discussion atthe most recent ANZERG meeting in Melbourne (16/9/99). These issues and topics were further expandedand modified following comments from respondents to the questionnaire, and from feedback at theMelbourne workshop.
In general, the Plan is expected to take a “whole-of-(industry)chain” approach to facilitate relevant R&Dprojects, each with planned outcomes. Accordingly, based on the above outcomes, there needs to be abalance of sustainability and profitability-based projects underpinned by good science, which addressstrategic priorities, are well coordinated, and have significant industry support and, where appropriate,participation.
PrioritiesThe relative priorities assigned at the Melbourne workshop to the various issues identified in the Draft planfor the wild fisheries and aquaculture sectors are summarised according to the relevant outcome describedabove, and in order of decreasing importance:
Outcome 1 - Sustainability Priority (1 = highest)WF1 1WF2 2WF6 3WF7 4WF4 5WF5 6WF3 7Outcome 2 - ProfitabilityAQ1 1AQ2 2AQ5 3AQ3 4AQ6 5AQ4 No priority assigned ** no priority assigned as deemed to be a general category already covered adequately in other areas
It should be noted that the associated project topics as listed for each of the key issues within the wildfisheries and aquaculture sectors of the draft Plan are provided as a guide. Indeed they are thereforeindicative only and are not intended to be exclusive of possible variations and or additions, assuming such“new” projects fundamentally address one or more of the key issues. It should also be noted that thesepriorities may vary between Australia and New Zealand to some extent and, subject to further advice fromkey stakeholders in New Zealand, may need to be further qualified at a regional level.
Another point to note is that the Plan is for a five year period from 2000/01 to 2005/6, and key issues andassociated project topics should be considered prioritised within this timeframe ie. what can should be donewithin the next five years. Some issues may be relevant but not sufficiently urgent that they need to beaddressed during this timeframe.

Eel Industry Strategy and Business Analysis
51
Draft A
ustralia-New
Zealand Eel R&
D Strategy
Wild Fisheries (WF1)
Relevance Feasibility StatusIssues Project topicsstate/region publ./priv./both high/med./low high/med./low No prog./u’way.
Impact assessment of barriers on freshwatereel migration patterns (up and downstream),standing crop, associated populationdynamics, eel habitat, accessibility &suitability; goal is to improve existingmanagement practices.
NZ, Tas. & Qld – specificrelevance
Outcomes generally relevantto all waters in Australia &NZ
Both High High Partly u’way inNZ & Qld
Efficacy of stock enhancement, translocation& fishways to mitigate impacts of barriers onfish passage; including design &development of fishways & integralmonitoring devices for all stages; emphasison measuring performance of impoundmentspecific solutions.
NZ, Tas. & Qld
Outcomes generally relevantto all waters in Australia &NZ
Both High High Partly u’way inNZ, Tas. & Qld
Impact of river mouth closure on glass eeland silver eel migration
Vic. Both High High None
Impacts of impoundments
Impoundments on coastalstreams restrict passage ofjuveniles recruiting tofreshwater and silver eelsreturning to sea to spawn
Impacts of hydro operations includingturbine-induced mortalities & methods tominimise such impacts.;
Tas. Both High High None

Eel Industry Strategy and Business Analysis
52
Draft A
ustralia-New
Zealand Eel R&
D Strategy
Wild Fisheries (WF2)
Relevance Feasibility StatusIssues Project topicsstate/region publ./priv./both high/med./low high/med./low No prog./u’way.
Development of standardised & quantifiablerecruitment &/or other production indices inassociation with national database;including development of standardindicators for monitoring & assessmentpurposes.
All Both High High Partly u’way
Development of reliable estimates/predictivemodels for standing stock &/or fishery yieldfor different developmental stages, incl.glass eels, elvers & adult eels.
All Both Med. Med.-low U’way for adultsin NZ & Qld.
Develop and identify risk managementoptions and associated harvest strategies forenabling sustainable eel resource utilisation;including glass eel, elver & adults; wherepossible need to quantify performance ofexisting & proposed management strategies.
All Both High High Partly u’way
Sustainability Criteria
Resource managers have aneed to develop ESD-basedfisheries management planswith an emphasis on use ofreliable sustainability criteriaand/or indicators for stockconservation purposes;particularly relevant inAustralia as a result of recentinitiatives by EnvironmentAustralia dictating the needfor such information as part ofmanagement plans.
Investigation into sustainability of NZlongfin stocks & associated fisheries,including reasons for apparent declines andoptions for restoration of stocks.
NZ Both High High U’way in NZ
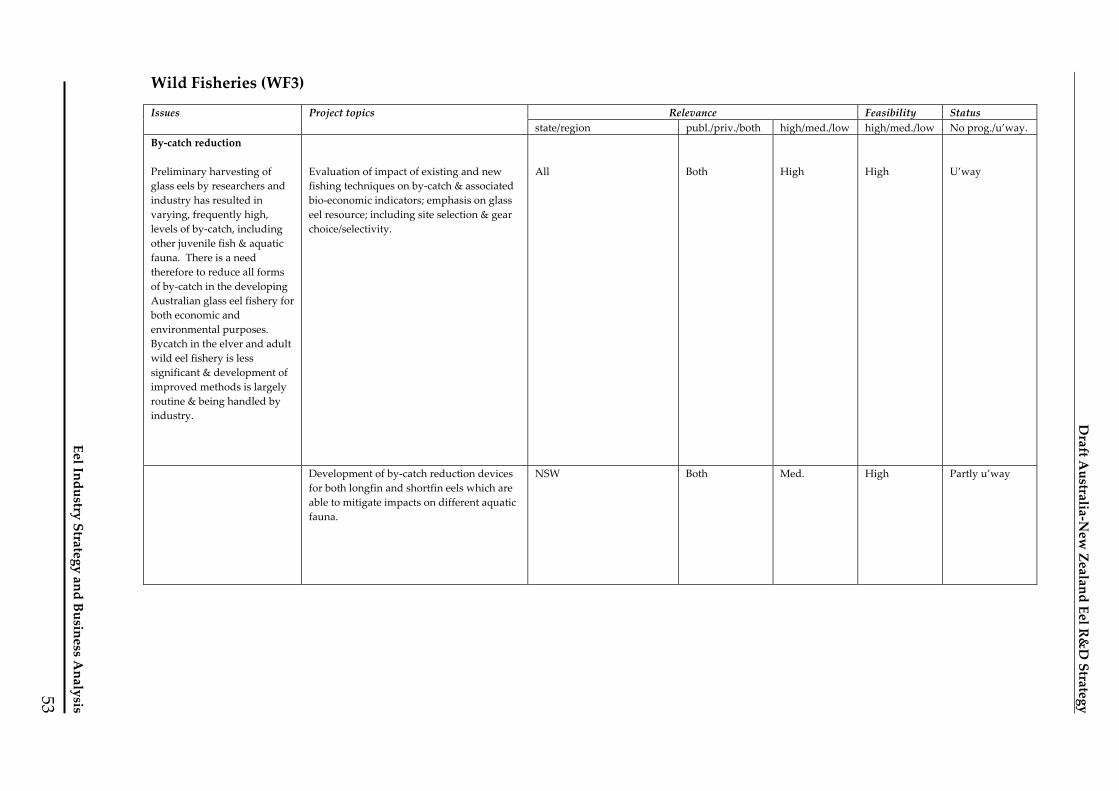
Eel Industry Strategy and Business Analysis
53
Draft A
ustralia-New
Zealand Eel R&
D Strategy
Wild Fisheries (WF3)
Relevance Feasibility StatusIssues Project topicsstate/region publ./priv./both high/med./low high/med./low No prog./u’way.
By-catch reduction
Preliminary harvesting ofglass eels by researchers andindustry has resulted invarying, frequently high,levels of by-catch, includingother juvenile fish & aquaticfauna. There is a needtherefore to reduce all formsof by-catch in the developingAustralian glass eel fishery forboth economic andenvironmental purposes.Bycatch in the elver and adultwild eel fishery is lesssignificant & development ofimproved methods is largelyroutine & being handled byindustry.
Evaluation of impact of existing and newfishing techniques on by-catch & associatedbio-economic indicators; emphasis on glasseel resource; including site selection & gearchoice/selectivity.
All Both High High U’way
Development of by-catch reduction devicesfor both longfin and shortfin eels which areable to mitigate impacts on different aquaticfauna.
NSW Both Med. High Partly u’way

Eel Industry Strategy and Business Analysis
54
Draft A
ustralia-New
Zealand Eel R&
D Strategy
Wild Fisheries (WF4)
Relevance Feasibility StatusIssues Project topicsstate/region publ./priv./both high/med./low high/med./low No prog./u’way.
Habitat Requirements
Protection and restoration ofcritical estuarine &/orfreshwater habitat is essentialto maintenance of standingstock and associatedconservation status. It isnoted that various land-based,catchment management andassociated R&D activitiesimpacting on freshwater eelhabitats are being addressedby other “non-eel” initiatives.It is also noted that muchrelevant R&D on this topic isbeing undertaken by defaultas a key component of othereel project topics.
Identification of critical habitat, includingenvironmental flow requirements, andassociated threatening processes for allestuarine and freshwater developmentalstages.
All Both High Med. Partly u’way
Note muchrelevant R&Ddone in other“non-eel”sectors.
Identify availability of suitable habitat oncatchment by catchment basis (GIS?) &evaluation of options for fishery reserves.
All ? Both ? High ? High ? None
Heavy metal impacts
Historical mining operationson the west coast of Tasmaniahave resulted in concerns overthe impacts of heavy metalaccumulation in resident eelswithin certain catchments.
Evaluation of heavy metal accumulation byeels and associated biological impacts onwest coast of Tas.
Tas. Both High High None (nb. recentVictorian studyby MAFRI)

Eel Industry Strategy and Business Analysis
55
Draft A
ustralia-New
Zealand Eel R&
D Strategy
Wild Fisheries (WF5)
Relevance Feasibility StatusIssues Project topicsstate/region publ./priv./both high/med./low high/med./lo
wNo prog./u’way.
Fisheries Development,Policy & Management
Juvenile eels (glass eels &elvers) from the wild areexclusively the requisiteseedstock for intensive eelaquaculture. However,reliable sources of commercialquantities of such seedstock inAustralia are presentlylimited, and industry demandexceeds supply. Accordinglythere is a need to identify newglass eel and elver resources,consistent with the needs ofnew and developing intensiveindustry investment.
Identify new glass eel collection sites anddevelop and adapt relevant fishingtechniques for routine use; includingpractical methods for identifying/separatingdifferent spp. (primarily for NSW waters).Much of this work is to be done either by orin collaboration with industry whereappropriate.
All Private High High U’way
Evaluation of impacts from exploiting stocksat different life history stages, includingbenefits and associated potential trade-offsbetween catch/effort, eel fishery reserves andescapement requirements for all parts of theexisting fishery; including environmentalrisk assessment & cost/benefit analysis; to beundertaken at broad geographic scale toachieve national/regional approach.
All Both High Medium Partly u’way
Development of stock enhancementstrategies & associated studies to optimisestocking rates, productivity etc
NZ, NSW & Tas. Both High High Partly u’way inNZ and Vic.

Eel Industry Strategy and Business Analysis
56
Draft A
ustralia-New
Zealand Eel R&
D Strategy
Wild Fisheries (WF6)
Relevance Feasibility StatusIssues Project topics
state/region publ./priv./both high/med./low high/med./low
No prog./u’way.
Fisheries Development,Policy & Managementcontinued
Development of national guidelines &operational procedures to facilitate live tradeof juvenile and sized eels between States;emphasis on biodiversity, disease & geneticissues. It is noted that relevant genericnational guidelines regarding fishtranslocation have been developed and willbe used as a benchmark.
Australia Private High High Partly u’way
Development of strategies to determineequitable allocation of/access to eelresources; incl. juv. v adult, aquac. v wildfishery, commercial v recreation., customaryv other etc
All Both High Med. Partly u’way

Eel Industry Strategy and Business Analysis
57
Draft A
ustralia-New
Zealand Eel R&
D Strategy
Wild Fisheries (WF7)
Relevance Feasibility StatusIssues Project topicsstate/nat./reg. publ./priv./both high/med./low high/med./lo
wNo prog./u’way.
Development and validation of reliable,cost-effective ageing techniques for alldevelopmental stages.
All Both High High Partly u’way inall areas
Investigation of reproductive cycle andgeneral population dynamics to determinerates and key stages of development andoverall productivity during the inland lifehistory phase and in relation to commercialutilisation impacts.
All Both High High;althoughintrinsiccomplexityof eel lifehistory &associatedR&D isnoted.
U’way in allareas; note Qld,NSW & NZ.
Development and use of mark-recapture/tracking techniques to estimatepopulation size and to monitor movement,growth & survival.
All Both High High Partly u’way inmost areas
General biology, Ecology &Stock Assessment
There is insufficientknowledge on basic eel lifehistory, population dynamicsand associated researchtechnologies to address otherkey issues and informationgaps in relation to both wildfisheries and aquaculture
Estimation of productivity in differenthabitats & associated variability inpopulation dynamics & ecologicalinteractions
All Both High high Partly u’way

Eel Industry Strategy and Business Analysis
58
Draft A
ustralia-New
Zealand Eel R&
D Strategy
Aquaculture (AQ1)
Relevance Feasibility StatusIssues Project topicsstate/region publ./priv./both high/med./low high/med./lo
wNo prog./u’way.
Technical and economic evaluation of pondculture compared with tank culture for allspp., including a comparison of husbandrypractices relevant to different systems &preparation & dissemination of Best PracticeGuidelines.
All Private High High Partly u’way
Development of species specific diets fordifferent developmental stages ofcommercial production systems.
All Private High High U’way
Optimising of acclimation, weaning &associated husbandry of newly caught glasseels, including establishment of Best PracticeGuidelines
All Private High High U’way
Nursery & GrowoutTechniques
There is a need to furtherdevelop and enhance bothnursery and growouttechniques, with an emphasison system design andhusbandry practices, forextensive, semi-intensive andintensive production. Suchevaluations need to beundertaken jointly betweenresearchers and industry andinclude documentation anddissemination of Best PracticeGuidelines for differentspecies and systems..
Economic & technical assessment of relativesuitability of glass eel and elver asaquaculture seedstock
Tas & Vic. Private High High Partly u’way

Eel Industry Strategy and Business Analysis
59
Draft A
ustralia-New
Zealand Eel R&
D Strategy
Aquaculture (AQ2 & 3)
Relevance Feasibility StatusIssues Project topicsstate/region publ./priv./both high/med./low high/med./lo
wNo prog./u’way.
Development and testing of relevanttherapeutic and prophylactic diseasetreatments consistent with relevant foodsafety standards; incl. monitoring ofAustralia/NZ eel disease status
All Both High High Partly u’way
Fish health
With the increasing trendtowards intensification of eelculture production systemscomes the attendant threat ofdisease, includingectoparasitic bacterial andprotozoan infections. Bestpractice Guidelines arerequired for addressing suchissues
Evaluation of the feasibility of artificialpropagation techniques for freshwater eelsas a means of providing hatchery progenyfor aquaculture seedstock.
All Both Low Low None (althoughmuch workbeing doneo’seas)
Artificial propagation
The ongoing dependence on,and inherent variability of,wild glass eel seedstock is amajor constraint to long termindustry development, inaddition to being a potentialthreat to stock conservation.

Eel Industry Strategy and Business Analysis
60
Draft A
ustralia-New
Zealand Eel R&
D Strategy
Aquaculture (AQ4)
Relevance Feasibility StatusIssues Project topicsstate/region publ./priv./both high/med./low high/med./lo
wNo prog./u’way.
Genetic stock characterisation using DNAtechniques to discriminate relevantmanagement units for key species.
All Both Medium-low High U’way
Risk analysis for disease, genetic andbiodiversity impacts of juvenile eeltranslocation..
All Both Medium Medium Partly u’way
Development of ESD-based guidelines fortranslocation of juvenile eel stocks foraquaculture and stock enhancementpurposes.
All Both High High Partly u’way
Policy & Management
Several Australian states andNew Zealand to a large extentshare in the management andutilisation of common eelstocks, dictating the need for auniform approach to policyand management guidelines.
Development of cost-benefit/economicmodels for prospective investors/farmers;including financial management support tosecure venture capital for eel aquacultureinvestment
Vic. & NSW Private High High Partly u’way

Eel Industry Strategy and Business Analysis
61
Draft A
ustralia-New
Zealand Eel R&
D Strategy
Aquaculture (AQ5)
Relevance Feasibility StatusIssues Project topicsstate/region publ./priv./both high/med./low high/med./lo
wNo prog./u’way.
Development of market strategies andassociated value-adding and post-harvesthandling procedures, including livetransport protocols, designed to facilitateaccess to both domestic and export eelmarket niches.
All Private High High Partly u’way
.Development of appropriate qualityassurance-based, industry Codes of Practiceand associated HACCP-based food safetyprotocols to satisfy legislative and marketrequirements.
All Both High High Partly u’way
Post-harvest handling,Quality Assurance &Marketing
Cultured eels are part of adynamic and highlycompetitive, multi-facetedand high value global market,in which quality assurancerequirements are at apremium.

Draft Australia-New Zealand Eel R&D Strategy
Eel Industry Strategy and Business Analysis
63
Industry structureAs part of this strategic planning process some clearer vision is becoming apparent for the structure of theAustralian and New Zealand eel industry than perhaps is presently the case. Given that much of theindustry is going through some degree of transition for various reasons, including the establishment of newand developing sectors such as the glass eel fishery and intensive eel farming, proposing some form ofindustry structure is considered likely to provide a useful guide for R&D planning purposes. It is notintended however that such a guide be at all binding on industry or government. This is a particularlyinteresting question given the global nature of the industry and current industry trends at this scale.Comments on such matters from respondents to the questionnaire, particularly thoughts on how theindustry may ultimately be structured and integrated at and between the different levels/sectors, aresummarised here (in no particular order) for information:
• Requirement for dedicated glass eel nurseries taking juveniles from anywhere in Australia & on-sellingfor grow-out anywhere in Australia ie. unrestricted trade across State boundaries.
• Emphasis on continuation of Government/industry partnership approach to development of the eelindustry (nb. ANZERG’s role).
• NZ – clear understanding of eel resource allocation & associated stewardship, including equitableallocation between customary and commercial stakeholders via co-management arrangements andassociated management plans.
• Collaborative R&D with active industry participation & effective extension.• Orderly organisation of industry to recognise differing requirements of seedstock for intensive
aquaculture and restock for extensive grow-out.• Sufficient flexibility to allow market forces to dictate industry development trends.• ANZERG to play a key steering role, rather than wholly prescriptive role; management plans to provide
the means.• Increased role of industry in collection of glass eels.• Increased role of researchers in diet development and disease control.• Nurseries to be intensive systems and growout to be either intensive through to extensive (ponds),
subject to ambient conditions.• Need for a cooperative marketing approach to even out supply and regulate prices.• Fishers should fish (for glass eel) and farmers should farm.
R&D evaluation, communication, and marketingAdvice has also been sought on the most appropriate means by which eel R&D may be objectively evaluatedand the results effectively communicated and promoted. Given the need to facilitate effective eel R&Dcollaboration across broad geographic boundaries, it is suggested that ANZERG will provide the mostappropriate forum to coordinate such activities. The establishment of a research sub-committee of ANZERGto take on this responsibility is one option, which could also provide the means by which other internationaleel researchers could engage and/or collaborate with Australian and New Zealand researchers in an effectiveand efficient way. It should be noted that ANZERG is already seeking to make formal contact with theEuropean Inland Fisheries Advisory Commission (EIFAC) Eel Working Group for similar reasons. Asummary of general comments on this matter from respondents to the questionnaire includes:
• ANZERG is a logical forum for R&D management; perhaps through R&D sub-committee; role to includeresearch coordination, evaluation, marketing and review.
• Linkage with international networks is required eg. through NACA, APEC, ICES/EIFAC etc• NZ R&D requirements inherently difficult due to existing industry arrangements• Require bi-annual symposia & other media eg. internet listing (nb. Australian & European)

FRDC Report 2000/264
Eel Industry Strategy and Business Analysis
64
Attachment 1 -ANZERG membership details(current as of 1999 workshop; more recent membership changes need to be confirmed with relevant state andfederal government agencies).
Contact details: Phone Facsimile EmailRobert SwindlehurstAquaculture and IndustryDevelopment, QDPIGPO Box 2454BRISBANE QLD 4001
(07) 32242257 (07)32298146
Geoff Gooley MAFRIManager, Aquculture ProgramPrivate Bag 20ALEXANDRA VIC 3714
(03)5774 2208
(03) 5774 2208
Adrian CollinsBribie Island AqucaultureResearch Centtre QDPIPO Box 2066BRIBIE ISLAND, QLD 4507
(07) 3400 2024
(07) 3408 3535
Anthony Forster, FisheriesVictoria, NRE, 232 Victoria Pde, E.Melbourne, VIC, 3002
(03) 9412 65710
(03) 94125770
Ian LyallLocked Bag 9NSW FisheriesPYRMONT NSW 2009
(02) 9566 7842
(02) 9566 6627
Stan JarzynskiAFFAGPO Box 858CANBERRA ACT 2601
(02) 6272 4413
(02) 6272 4215
Warwick NashInland Fisheries Comm. PO Box288MOONAH TAS 7009
03 6233 3548
03 6233 4141
Frances RuwaldInland Fisheries Comm.PO Box 288MOONAH TAS 7009
03 6233 8756
03 6233 4141
Ian LyallLocked Bag 9NSW FisheriesPYRMONT NSW 2009
(02) 9566 7842
(02) 9566 6627 [email protected]
Phil BoxallInland Fisheries Comm. PO Box288MOONAH TAS 7009
03 6233 8756
03 6233 4141
Don JellymanNIWAPO Box 8602RICCARTON, CHRISTCHURCHNZ
001164 3 348 8987
001564 3 348 5548

FRDC Report 2000/264
Eel Industry Strategy and Business Analysis
65
Sean KerinTE OHU KAI MOANAPO Box 3277WELLINGTON, NZ
0011 64 4 4995199
0015 64 4 499 5190 [email protected]
Dr Peter ToddMinistry of FisheriesPrivate Bag 14NELSON, NZ
0011 64 3 5481069
0011 64 3 546 9327 [email protected]
Dr Bruce PeaseNSW Fisheries202 Nicholson pdeCRONULLA, NSW
02 9527 8411

FRDC Report 2000/264
Eel Industry Strategy and Business Analysis
66
Attachment 2 - Australia-New Zealand Eel R&D Workshop delegates (present andinvited)
Chair
Patrick Hone, FRDCGeoff Gooley, MAFRI
Victoria
Roger Camm, industryRon & Sharon Elton, industryLouis Vorsterman, industryBarry Dance, industryBill Allan, industryAnthony Forster, governmentDavid Molloy, government
NSW
Karl Tesar, industryBruce Pease, governmentNick Lambert (apology)
Tasmania
Frances Ruwald, governmentWarwick Nash, governmentNigel Forteath, industryJohn Ranicar, industry
Queensland
John Olsen, industryJohn Ranicar, industryClive Jones, government

FRDC Report 2000/264
Eel Industry Strategy and Business Analysis
67
Attachment 3 - Background/explanatory notes on the Draft R&D Plan
Relevance
Reference to the geographic areas, sectoral interest and degree of relevance for each issue/project topic:State - Tas., Vic, NSW, Qld, allRegion - Aust., NZ, all
Publ – public/community (interest/good)Priv. – private/commercial (interest)Both – both public and private imperatives
High – highly relevant to aboveMed. – of medium relevance to aboveLow – of low relevance to above
Feasibility
Reference to the relative feasibility of successfully undertaking/completing R&D in the specified issue/topic:High – high scientific/technical/practical/logistic feasibility (elaborate if necessary)Med. – medium scientific/technical/practical/logistic feasibility (elaborate if necessary)Low - low scientific/technical/practical/logistic feasibility (elaborate if necessary)
Status
Reference to how much work already undertaken or in progress in the specified issues/topic:No prog. – no progress; research yet to commence or existing research experience not contemporary(elaborate if necessary)U’way – research underway, either in part and/or incomplete (elaborate if necessary)