australia - oecd.org · z shared responsibilities requiring good co-ordination between ... 3.2...
TRANSCRIPT

AustraliaHIGHLIGHTS
2019
OECD Environmental Performance Reviews

WHAT ARE EPRs?
OECD Environmental Performance Reviews (EPRs)
provide evidence-based analysis and assessment
of countries’ progress towards their environmental
policy objectives.
They promote peer learning, enhance
government accountability and provide targeted
recommendations to help countries improve their
environmental performance. They are supported by
a broad range of economic and environmental data.
Each EPR cycle covers all OECD member countries
and selected partner countries.
All reports, and more information, are available on
the EPR website: http://oe.cd/epr.
THE THIRD EPR OF THE AUSTRALIA
Australia joined the OECD in 1971. The previous
Environmental Performance Reviews of Australia were
published in 1998 and 2007. The report reviews the
Australia’s environmental performance since 2007.
The process involved a constructive and mutually
benefi cial policy dialogue between Australia and the
countries participating in the OECD Working Party
on Environmental Performance (WPEP). The OECD is
grateful to the two examining countries: New Zealand
and Canada.
The EPR provides 50 recommendations, approved
by the Working Party on 6 November 2018. They
aim to help Australia advance towards a greener,
low-carbon economy, better manage its natural
assets, and improve its environmental governance
and management. Particular emphasis is placed
on threatened species and sustainable use of
biodiversity, and chemical management.
http://oe.cd/epr
OECD Environmental Performance Reviews
“Australia has important
responsibility in global
environmental protection efforts.
Outlining a long-term low-carbon
strategy and scaling up efforts
to address biodiversity loss are
necessary to progress towards
sustainable development.”
Angel GurríaOECD Secretary-General

3
HIG
HLIG
HT
S
Overview
Australia is one of the world’s 17 megadiverse countries
and among the ten largest greenhouse gas (GHG) emitters
in the OECD. It thus has considerable responsibility in
global environmental protection efforts. Steady economic
growth has helped improve the living standard of its
growing population. However, the economy remains
among the most energy- and carbon-intensive in the
OECD. Progress towards sustainable development
requires strengthening ambitions on climate change and
biodiversity policies, improving co-ordination between
the federal and subnational levels of government, and
increasing coherence between environment and sector
policies.
OPPORTUNITIES
z Untapped renewable energy potential
z Rich biodiversity providing ecosystem services and supporting the economy
z The National Water Initiative providing strong foundations for reforms
z A highly skilled workforce and traditional Indigenous ecological knowledge.
CHALLENGES
z High population and economic growth putting pressures on the environment
z A highly resource- and carbon-intensive economy vulnerable to climate change
z Shared responsibilities requiring good co-ordination between jurisdictions
z Lack of a national long-term vision on sustainable development.
Aus
tral
ia
AUSTRALIA 2017
Population 24.5 million
GDP/capita(current purchasing power parity)
USD 51 500(OECD average is 43 700)
Total area 7 741 000 km2
Population density3.2 inhabitants/km² (OECD average is 35.1)
CurrencyAustralian dollar (AUD) In 2017, USD 1 = AUD 1.305

4
Australia is the world’s sixth largest country and driest inhabited continent. It is endowed
with a wide variety of natural resources. Over the past decade, it has managed to
decouple the main environmental pressures from economic growth. States and territories
have improved their performance in several environmental areas. However, Australia has
one of the most resource- and carbon-intensive OECD economies. Economic activity
and population growth, especially in coastal areas, continues to put pressure on the
environment. Climate change adaptation is a growing challenge.
OECD ENVIRONMENTAL PERFORMANCE REVIEW OF AUSTRALIA
ENERGY AND CLIMATE CHANGE
z The economy has become less energy intensive as a result of structural changes. However, it remains highly carbon intensive owing to its reliance on coal, despite increasing use of natural gas and renewable energy sources (Figure 1).
z Australia surpassed its Kyoto 2008-12 target and is on track to reach its 2020 target. Under the Paris Agreement, it committed to reducing emissions (including emissions from land use, land use change and forestry [LULUCF]) by between 26% and 28% below 2005 levels by 2030. However, emissions are projected to increase by 2030 (Figure 2).
z Excluding LULUCF, GHG emissions increased over 2005-17, driven by natural gas production and
transport activity. Electricity (34%) and transport (18%) are the largest sources of emissions. Growth in CO2, NOX and particulate emissions from transport justifi es updating standards on fuel quality and vehicle emissions to be on a par with global best practices.
z While there is no national long-term low-emission strategy, several states and territories have committed to reaching net zero GHG emissions by 2050.
z Australia has warmed by 0.9°C over the past 60 years. Changes in rainfall patterns, more frequent hot days and heat waves are already affecting well-being.
Figure 1. Coal dominates the electricity mix but natural gas and renewables are growing
Source: IEA (2018), IEA World Energy Statistics and Balances (database).
Natural gas 24%
2005
2017
Natural gas 20%Coal 62%
Coal 80%
Natural gas
10%Renewables
9%
Oil
2.4%
Renewables 16%
OECD 27%
OECD 25%
Environmental performance | key trends

5
HIG
HLIG
HT
S
z Develop and implement a national, integrated energy and climate policy framework for 2030 based on a low-emission development strategy for 2050. Guide the energy transition through an emission reduction goal for the power sector.
z Update and implement the National Waste Policy as part of a broader strategy on circular economy, with measurable targets.
z Renew governments’ commitment to the National Water Initiative and complete unfi nished business.
z Address diffuse pollution from agriculture and accelerate efforts to reach water quality targets in the Great Barrier Reef.
Next steps | climate change, waste and water management
WASTE, MATERIAL AND WATER MANAGEMENT
z Australia is among the world’s largest exporters of iron ore, uranium, coal, gold and natural gas. It is one of the most resource-intensive OECD countries due to its high level of extraction and use of metal ores and fossil energy materials.
z Waste generation slightly increased over the review period. Higher landfi ll levies and implementation of national product stewardship programmes helped improve recycling rates, which varied by jurisdiction and waste stream. Half of municipal waste still ends up in landfi lls. The People’s Republic of China’s restrictions of waste imports is an opportunity to progress towards a circular economy.
z Water stress at the national level is below the OECD average but it varies widely by region. Progress has been made in implementing the 2004 National Water Initiative, which aims to increase effi ciency and sustainability through continued market reform, regulation and planning. However, some jurisdictions need to modernise their entitlement regimes and better engage Indigenous people in water planning. Continued reform is needed to meet water demand from rapidly increasing population in southern Australia, where precipitation is projected to decline.
z Water quality is poor in most drainage divisions (Figure 3). The Great Barrier Reef catchments suffer from high levels of run-off from sediments, nutrients, pesticides and other pollutants. Forest clearing, mainly for livestock grazing, remains a major concern for water, biodiversity and carbon stocks (see p. 12).
Figure 3. Water quality is poor in most drainage divisions
Note: Projections include land use, land-use change and forestry (LULUCF). Source: DEE(2018), “National Inventory Report 2016”; DEE (2017), “Australia’s emissions projections 2017”; DEE (2018), “Quarterly Update of Australia’s National Greenhouse Gas Inventory: December 2017”.
Source: Argent (2017), Australia state of the environment 2016: inland water.
2017 projections
-26 trajectory
-28 trajectory
GHG emissions excl. LULUCF
GHG emissions incl. LULUCF
2020 targetKyoto target
100
200
300
400
500
600
700
2005 2010 2015 2020 2025 2030
Trend
State GoodVery goodPoor
Very poor
not assessed
not assessed
not assessed
?
?
?
?
?Carpentaria Coast
Water qualityDrainage division
Lake Eyre Basin
Murray-Darling Basin
North East Coast
North Western Plateau
Pilbara-Gascoyne
South Australian Gulf
South East Coast (NSW)
South East Coast (Victoria)
South West Coast
South Western Plateau
Deteriorating StableUnclearImproving
Tasmania
Tanami-Timor Sea Coast
Figure 2. Australia needs to intensify efforts to reach its Paris Agreement goal
million tonnes of CO2 equivalent

OECD ENVIRONMENTAL PERFORMANCE REVIEW OF AUSTRALIA
6
Environmental governance and management
Progress has been made in improving co-ordination on environmental management
between the federal and subnational levels of government. States and territories are
active proponents of good practices, which can be shared across jurisdictions. Despite
improvement in public participation, Indigenous communities would benefit from
strengthened involvement in environmental decision making.
INSTITUTIONAL FRAMEWORK
z Australia has moved from a system of complete decentralisation of environmental policy to one in which the Commonwealth government has constitutional authority on so-called matters of national environmental significance. Environmental responsibilities are thus shared between the Commonwealth (federal) government, six states and two territories, and over 560 municipalities.
z Progress has been made on co-ordination and guidance (for example through a system of bilateral agreements for environmental approvals), but more efforts are needed to streamline vertical co-ordination.
REGULATORY FRAMEWORK
z Australia conducts ex ante regulatory impact assessment, which can be more or less detailed depending on the expected impact of the policy or regulatory measure concerned.
z At the federal level, environmental impact assessment is conducted for matters of national significance, but is not always binding in all states and territories. The Commonwealth can delegate assessment and approval functions to states and territories through a system of bilateral agreements that helps reduce overlaps and increase the efficiency of decision making.
z Strategic environmental assessment at the federal level is undertaken for large-scale plans related to land use, such as housing and infrastructure developments, plans related to resource management and policies concerning the industry sector.
z Australia lacks a fully integrated permitting regime, although some states have introduced consolidated permits.
GOVERNANCE OF THE MURRAY-DARLING BASIN
The Murray-Darling Basin is an example of multilevel governance by the Commonwealth, the Australian Capital Territory, New South Wales, Queensland, South Australia and Victoria. Since the 2012 Basin Plan, there has been a shift in governance from the independent Murray-Darling Basin Authority to basin governments, which have taken a more central role. However, there are major shortcomings in the current institutional arrangements, as it is unclear who is responsible for leading implementation of the plan. Enforcement in the basin could also be strengthened.

z Strengthen co-operation across sectors and between levels of government.
z Consider introducing integrated environmental permits and ensure systematic use of environmental impact assessment in all states and territories.
z Develop comprehensive registers of contaminated sites and clean-up programmes.
z Ensure that all stakeholders have opportunities to participate in environmental decision making throughout the policy cycle; enhance early engagement of NGOs and Indigenous communities.
7
Next steps | governance
ENVIRONMENTAL DEMOCRACY
z Public participation in environmental decision making could be strengthened to provide broader opportunities for stakeholders, in particular Indigenous communities.
z State of the Environment reporting is conducted at both the national and state/territory levels. The latter differ in length and content and are often not harmonised with the national report.
z Ongoing reviews aim to ensure that vocational education programmes related to environmental regulation and policies respond to industry needs.
COMPLIANCE ASSURANCE
z Progress has been made in strengthening enforcement. The federal government uses a risk-based approach to plan compliance monitoring.
z Around 50 000 abandoned mines need rehabilitation. Not all states and territories maintain comprehensive registers of contaminated sites or have remediation standards, and many jurisdictions are struggling with resource constraints.
z There has been progress in expanding voluntary agreements with industry, in which companies commit to specifi c measures and/or performance levels on environmental management. Australian businesses are voluntarily adopting more environmental management systems, partly because four states offer incentives for ISO 14001 certifi cation (Figure 4).
0 1 500500
1 049
4 247
2 500 3 500 4 500
2000
2002
2004
2006
2008
2010
2012
2014
2016
Figure 4. More businesses adopt environmental management systems
Source: ISO (2017), “ISO survey”.
HIG
HLIG
HT
S

Canberra (ACT)
AUSTRALIA
TASMANIA
Sydney
Melbourne
OECD ENVIRONMENTAL PERFORMANCE REVIEW OF AUSTRALIA
8
INNOVATING TO IMPROVE CHEMICAL MANUFACTURING
The Centre for Green Chemistry at Monash University in Melbourne, funded by the federal government, and the Commonwealth Scientific and Industrial Research Organisation, has partnered with industry in recent years to deliver innovative chemical manufacturing processes. Many initiatives on green or sustainable chemistry are conducted through partnerships between federal or state/territory governments and academic institutions.
Recent developments
DEMONSTRATING A ROLE FOR THE PRIVATE SECTOR IN CONSERVATION
A privately owned property is
being used to bring back some
of Australia’s most threatened
species. The 420 ha property,
the Mt Rothwell Biodiversity
Interpretation Centre, is
surrounded by one of the
country’s longest predator-proof fences, keeping out feral foxes and
cats. Species such as the eastern barred bandicoot, brush-tailed rock
wallaby and eastern quoll have been reintroduced there, and breeding and
research initiatives are under way in partnership with the state government,
Zoos Victoria and the University of Melbourne. Landcare volunteers work
to restore the habitat and control invasive species. Researchers are
exploring the importance of genetic diversity in building species resilience.
BECOMING A GLOBAL LEADER IN SOLAR PHOTOVOLTAICS
Australia is a world leader in solar photovoltaic (PV) installed capacity per inhabitant. Two-thirds of new installations in 2017 took place in the residential sector as a response to rising electricity prices and decreasing solar PV costs, but commercial rooftop systems
also increased rapidly. More than 30% of dwellings in South Australia and Queensland had a solar rooftop PV system in 2018. Increasingly, PV installations are combined with energy storage systems as they become cheaper.
SOUTH AUSTRALIA
WESTERN AUSTRALIA
NORTHERN TERRITORY

Canberra (ACT)
AUSTRALIA
TASMANIA
Sydney
Melbourne
9
HIG
HLIG
HT
S
PLANNING TO REDUCE GHG EMISSIONS TO NEAR ZERO
AFTER 2050
Victoria uses coal for more than 80% of its electricity generation. It passed an important milestone providing long-term clarity on mitigation and adaptation with the adoption of its Climate Change Act in 2017. The act includes a
long-term target of net zero emissions by 2050 and creates a framework for developing fi ve-yearly interim targets starting with 2021-25. The Australian Capital Territory is taking the same approach to reach net zero by 2045.
ADDRESSING THE IMPACT OF CLOSING COAL POWER PLANTS
Coal power stations are located close to major coalfi elds, thus concentrating coal activities in specifi c regions with little employment diversifi cation. Since 2012, ten coal power plants have been closed and three announced for decommissioning. The latest to close, on short notice, was Hazelwood. Its closure conveyed to the Australian and Victorian governments the need to mitigate closure’s social impact through measures such as scaling up skills in the region, attracting new investment and providing fi nancial support. An important aspect of a just transition is to identify communities at risk and support economic diversifi cation through long-term transition plans.
BUILDING THE COUNTRY’S FIRST METRO
Funded 50-50 by the Commonwealth and New
South Wales, the Sydney Metro is the country’s biggest
public transport project. Sydney Metro Northwest (2019)
and Sydney Metro City and Southwest (2024) will increase
Sydney’s rail capacity in morning peak time by up to 60%.
VICTORIA
SOUTH AUSTRALIA
QUEENSLAND
NEW SOUTH WALES
NORTHERN TERRITORY
Decomissioned Hazelwood power station

10
Despite progress in decoupling, the economy remains highly reliant on extraction of
natural capital, and environmental concerns are not prominent in major sector strategies.
Australia has strong potential to green its economy but the low-carbon transition
will require stronger price signals. Australia’s 2018 report on implementation of the
Sustainable Development Goals should be built on to outline a plan for implementing the
2030 Agenda.
OECD ENVIRONMENTAL PERFORMANCE REVIEW OF AUSTRALIA
Green growth
z Between 2005 and 2016, revenue from environmentally related taxes declined as a share of GDP, mostly due to the decreasing contribution of energy taxes to tax revenue, except when carbon pricing was in effect in 2012 and 2013.
z Energy taxes do not refl ect the climate costs of fuel use: taxes on transport fuels are low by international comparison; tax refunds mean fuels are largely untaxed outside of transport, and coal is fully untaxed (Figure 5). Australia has the second-highest carbon pricing gap in the OECD at EUR 30 per tonne of CO2, a low-end estimate of the social costs of carbon emissions today.
Figure 5. Fuels are largely untaxed outside the transport sector
Tax
Fuel tax creditor expenditure
GREENING PRICE SIGNALS
z Vehicle taxes have provided increasing revenue with growth of the fl eet but they do not generally take account of CO2 and other emissions. Congestion costs are expected to reach 2% of GDP by 2031. Wider use of road pricing, including distance-based and congestion charges, would better address road transport externalities and secure long-term funding for infrastructure.
z Uneven application of state landfi ll levies has resulted in signifi cant levels of interstate movement of waste to avoid levies, highlighting the need for a nationally consistent framework. Expanding the use of variable charging for municipal waste services would encourage waste minimisation and recovery and fund advanced management services.
OFF-ROADROAD INDUSTRY AGRICULTURE /FISHERIES
RESIDENTIAL/COMMERCIAL
ELECTRICITY
Gasoline
Diesel
Oilproducts
Natural gas Coal, coke,coal gases
Bio
mas
s an
d w
aste
Bio
mas
s an
d w
aste
0
40
80
120
160
200
0 80 200 160 400 240 600 320 800
AU
D/t
onne
of C
O2
EU
R/tonne of C
O2
CO2 emissions from energy use (1 000 t)
Biofuels,natural gas,LPG
0
20
40
60
80
100
120
Note: Off road: only fuels used in domestic air transport are taxed; Residential and commercial: only some oil products used in the residential sector are taxed. Tax rates as of 1 April 2015; CO2 emissions from energy use were calculated based on the IEA data for 2014.Source: OECD (2018), Taxing Energy Use 2018: Companion to the Taxing Energy Use Database.

11
HIG
HLIG
HT
S
z Better refl ect climate costs of fuel use in energy taxes and extend road pricing.
z Improve ex ante cost-benefi t analysis and systematically conduct ex post evaluation of public investment projects, especially in the transport and water sectors.
z Improve co-ordination of renewable support programmes across states and territories. Foster system integration of renewables in the National Electricity Market by developing interconnections among regions.
z Increase investment for rail and public transport; improve transport mode links and integrate transport planning with land use planning.
z Develop a strategy and ensure suffi cient resources to mainstream environment and climate in the aid programme; develop a concrete roadmap for contributing to the USD 100 billion goal and clarify post-2020 contributions.
Next steps | green growth
z A record USD 9 billion in investment in renewable energy resources in 2017 was driven by cost reductions, the setting of a renewable energy target, and a related quota system combined with state incentives and federal support (see Box on CEFC). However, geographically uneven renewable deployment raised integration concerns in the weakly interconnected National Electricity Market.
z In the past ten years, more than three-quarters of transport investment has been directed to road construction. In 2016, road investment accounted for 1.1% of GDP, a higher share than in any other OECD country. Australian cities have less travel by public transport than similar cities elsewhere. Carefully planned and prioritised investment in transport infrastructure is needed to address this challenge.
z Government research and development (R&D) budgets for energy and the environment have declined in recent years. The 2017 Low Emissions Technology Roadmap identifi ed opportunities to develop technology for addressing growing fugitive emissions (e.g. ventilation-air methane abatement, carbon capture and storage) and accelerating use of renewables (e.g. geothermal, wave energy). Driving eco-innovation will require a clear long-term policy framework, strong price signals and secured government support to R&D.
z Despite improved effi ciency in urban water service provision, some jurisdictions have not achieved the pricing requirements of the National Water Initiative. Affordability concerns for urban water users would be better addressed through payments untied to capital expenditure targeting high-cost areas.
z Since 2007, public support to irrigation infrastructure has increased signifi cantly, especially in the Murray-Darling Basin. However, inadequate cost-benefi t analysis has resulted in governments funding several projects with poor fi nancial and environmental performance.
GREEN INVESTMENT AND INNOVATION
A GREEN BANK TO SCALE UP CLEAN ENERGY INVESTMENT
Australia is one of the few OECD countries with a national green investment bank. Since 2012, the Clean Energy Finance Corporation (CEFC), an independent statutory authority, has fi nanceds projects related to renewable energy and energy effi ciency. The government credited the CEFC with AUD 2 billion a year from 2013 to 2017. As of June 2018, the CEFC had committed AUD 5.3 billion to projects with a total value of AUD 19 billion (1% of 2018 GDP).
z At 23% of bilateral allocable aid in 2016, Australia’s aid focusing on environment remained lower than the OECD Development Assistance Committee member average of 33%. Australia has actively supported the Green Climate Fund but should clarify its roadmap on scaling up fi nancial support.
INTERNATIONAL
Wind turbines on a cattle farm in Taralga, New South Wales
12
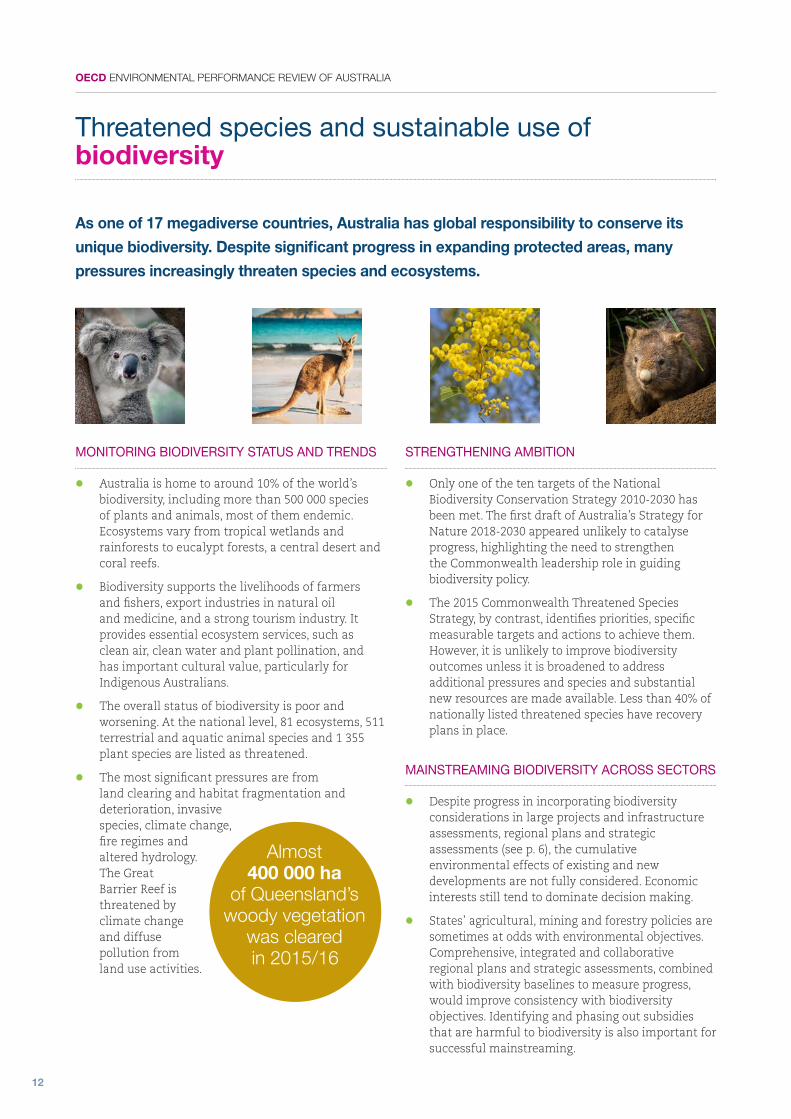
As one of 17 megadiverse countries, Australia has global responsibility to conserve its
unique biodiversity. Despite significant progress in expanding protected areas, many
pressures increasingly threaten species and ecosystems.
OECD ENVIRONMENTAL PERFORMANCE REVIEW OF AUSTRALIA
Threatened species and sustainable use of biodiversity
MONITORING BIODIVERSITY STATUS AND TRENDS
z Australia is home to around 10% of the world’s biodiversity, including more than 500 000 species of plants and animals, most of them endemic. Ecosystems vary from tropical wetlands and rainforests to eucalypt forests, a central desert and coral reefs.
z Biodiversity supports the livelihoods of farmers and fishers, export industries in natural oil and medicine, and a strong tourism industry. It provides essential ecosystem services, such as clean air, clean water and plant pollination, and has important cultural value, particularly for Indigenous Australians.
z The overall status of biodiversity is poor and worsening. At the national level, 81 ecosystems, 511 terrestrial and aquatic animal species and 1 355 plant species are listed as threatened.
z The most significant pressures are from land clearing and habitat fragmentation and deterioration, invasive species, climate change, fire regimes and altered hydrology. The Great Barrier Reef is threatened by climate change and diffuse pollution from land use activities.
STRENGTHENING AMBITION
z Only one of the ten targets of the National Biodiversity Conservation Strategy 2010-2030 has been met. The first draft of Australia’s Strategy for Nature 2018-2030 appeared unlikely to catalyse progress, highlighting the need to strengthen the Commonwealth leadership role in guiding biodiversity policy.
z The 2015 Commonwealth Threatened Species Strategy, by contrast, identifies priorities, specific measurable targets and actions to achieve them. However, it is unlikely to improve biodiversity outcomes unless it is broadened to address additional pressures and species and substantial new resources are made available. Less than 40% of nationally listed threatened species have recovery plans in place.
MAINSTREAMING BIODIVERSITY ACROSS SECTORS
z Despite progress in incorporating biodiversity considerations in large projects and infrastructure assessments, regional plans and strategic assessments (see p. 6), the cumulative environmental effects of existing and new developments are not fully considered. Economic interests still tend to dominate decision making.
z States’ agricultural, mining and forestry policies are sometimes at odds with environmental objectives. Comprehensive, integrated and collaborative regional plans and strategic assessments, combined with biodiversity baselines to measure progress, would improve consistency with biodiversity objectives. Identifying and phasing out subsidies that are harmful to biodiversity is also important for successful mainstreaming.
Almost400 000 ha
of Queensland’s woody vegetation
was clearedin 2015/16

13
z Close data gaps on the status and trends of species and ecosystems, and establish national biodiversity indicators to measure progress over time and identify priorities for action.
z Achieve a fully effective protected area system by 2030, improving protection in underrepresented bioregions, critical habitats for threatened species and coastal areas.
z Improve the consistency and alignment of biodiversity offset, biobanking, and conservation covenant programmes with national conservation strategies and best practices.
z Increase investment in biodiversity conservation and ecological restoration, commensurate with the scale of the challenge.
Next steps | threatened species and sustainable use of biodiversity
HIG
HLIG
HT
S
INSTRUMENTS FOR BIODIVERSITY CONSERVATION AND SUSTAINABLE USE
z Australia surpassed the 2020 Aichi targets with 19% of its territory and 36% of its marine jurisdiction under protection. Indigenous peoples are playing a growing role in protected area management. However, around one-third of terrestrial bioregions continue to have less than 10% protection, and marine protected areas under Commonwealth jurisdiction do not address pressures in state-controlled coastal areas.
z Public biodiversity expenditure has remained between AUD 400 million and AUD 500 million per year since 2010, compared with, for example, AUD 13 billion spent on average for road transport infrastructure, another area of shared jurisdiction.
z With the exception of the recent Reef 2050 Long-Term Sustainability Plan for the Great Barrier Reef, funding is dropping for core biodiversity programmes and research (e.g. the National Landcare Program). The application of conservation covenants with private landholders and of biodiversity offset policies as part of environmental assessment processes has been uneven and lacking in strong linkage to conservation priorities.
INDIGENOUS RANGER PROGRAMME COMBINES TRADITIONAL KNOWLEDGE, CONSERVATION TRAINING
Since 2007, the programme improved environmental outcomes and created meaningful employment, training and career pathways for Indigenous people. In 2018, there were 831 full-time-equivalent Indigenous rangers. Funding for the programme was recently renewed until 2021.
Source: DEE (2016), CAPAD (Collaborative Australian Protected Areas Database) 2016: Terrestrial Protected Area Data; DEE (2018), Australian Marine Parks (database).
Figure 6. Australia has substantial protection, but gaps along coasts and in certain regions

14
Although chemicals represent a relatively small market in Australia, their production and
use puts pressure on health and the environment. The country is revising its chemical
legislative and policy frameworks to better identify, assess and manage the pressures
associated with chemicals’ manufacture, use and disposal.
OECD ENVIRONMENTAL PERFORMANCE REVIEW OF AUSTRALIA
z The chemical and plastic industry (including fertilisers and pesticides) is Australia’s second-largest manufacturing industry, after food product manufacturing. However, as the country has become a net importer of chemicals over the last decade, pressures on health and the environment may intensify.
z The legislation on chemical management, which was put in place in the 1990s, improved the way chemicals were assessed, but the backlog of unassessed chemicals remains signifi cant. Despite progress, about 25 000 industrial chemicals on the market remain unassessed (Figure 6).
z Australia was an early developer of pollutant release and transfer registers in the 1990s. However, the National Pollutant Inventory is now outdated and
there is no overarching monitoring mechanism to address increases in emissions over time at the national level. No diffuse source emission data have been regularly collected at the national level.
z Environmental risk assessment is performed for industrial, agricultural and veterinary chemicals, but not for pharmaceuticals, even though related contamination of surface waters is an issue of emerging concern in OECD countries.
PRESSURES ON HEALTH AND THE ENVIRONMENT
Source: NICNAS (2018), Data on Industrial Chemicals.
Figure 6. A large share of existing industrial chemicals remain unassessed
Total number of chemicals: 40 571
Priority Existing Chemicals0.3%
Not assessed
61.4%
Assessed 38.6%
New chemicals
7.8%
Inventory Multi-Tiered Assessment and Prioritisation30.5%
Chemicals on Australian Inventory of Chemicals Substances
Inventory Multi-Tiered
chemicals7.8%
Assessment and Prioritisation
chemicals
Chemical management
Sales of pesticides
increased by85%
between2005 and 2016

13
HIG
HLIG
HT
S
z Strengthen harmonisation and co-ordination of chemical risk management across states and territories.
z Evaluate the backlog of unassessed industrial chemicals and ensure there is no gap in chemical regulation for chemical constituents of imported articles.
z Develop overarching monitoring and bio-monitoring mechanisms at the national level to address increases in emissions, to identify emerging contaminants and to create a baseline of health and environmental status in order to measure the effectiveness of ongoing reforms.
z Accelerate ratifi cation of current and future amendments to the Stockholm Convention and Minamata Convention.
Next steps | chemical management
15
z The primary policy objective of the chemical management system is to protect human health and the environment. The Commonwealth is responsible for chemical risk assessment, and the states and territories for risk management. Over 19 agencies at the Commonwealth level, 34 at the state/territory level and many local councils are responsible for managing chemicals. Separate regimes regulate chemicals used in therapeutic products, food ingredients, agricultural and veterinary chemicals and industrial chemicals. More co-ordination is needed to ensure consistency throughout the various layers of the chemical management system.
REFORMING THE MANAGEMENT SYSTEM
z The National Standard for Environmental Risk Management of Industrial Chemicals will create a national framework for management of environmental risk from industrial chemicals. Currently no such framework exists, and Commonwealth recommendations on environmental protection are unevenly implemented across states/territories. Under the proposed reform, the Department of the Environment will be the national standard decision maker. The framework provides pre-established management measures on environmental protection for each chemical, covering all stages of the life cycle. The National Standard may accelerate ratifi cation of Stockholm Convention amendments by providing a legislative framework to implement the requirements.
z The main objectives of the ongoing reform of the National Industrial Chemicals Notifi cation and Assessment Scheme (NICNAS) are to improve effi ciency in the regulatory process, allow more risk-based regulation and better protect human health and environment. It will focus government pre-market assessment efforts on higher-risk chemicals. The reform will provide incentives to move to safer chemicals by reducing the fi nancial burden on industry for introduction of lower-risk chemicals and facilitating the use of assessments performed abroad.
A COMPLEX REGULATORY FRAMEWORK
AN EXAMPLE OF SUCCESS UNDER THE STOCKHOLM CONVENTION
The organochlorine pesticide endosulfan, which was widely used in Australia to control some insects and mites in crops, particularly cotton, showed a major decrease in concentration during the 2010-15 Pilot Monitoring Programme on persistent organic pollutants (POPs). This decrease followed de-registration of endosulfan after its nomination to the Stockholm Convention, which facilitated collection of new environmental data.

http://oe.cd/epr
MORE INFORMATION
OECD Environmental Performance Reviews: Australia 2019
The report and all data are available on
http://oe.cd/epr-australia
Environmental Performance Review programme
http://oe.cd/epr
CONTACTS
Head of Division
Nathalie Girouard
Report Co-ordinator
Frédérique Zegel
Communications
Natasha Cline-Thomas
IMAGE CREDITS All photos are from Shutterstock.com and Wikimedia Commons. All icons are from TheNounProject.com. The map is from freevectormaps.com.
This document and any map included herein are without prejudice to the status of or sovereignty over any territory, to the delimitation of international frontiers and boundaries and to the name of any territory, city or area.
v1 - January 2019
OECD Environmental Performance Reviews
Australia 2019